1. Introduction
Buildings contribute to environmental pollution substantially as they are responsible for about 36% of worldwide primary energy consumption and 39% of CO
2 emissions [
1]. The energy demand of residential buildings is up to 40% [
2] on the global level and over 70% in hot climate regions, which is mostly due to active cooling [
3].
The building envelope (roof, walls, foundation, windows, and doors) is controlling the amount of heat exchange with the environment, and consequently the building energy consumption [
4]. It is claimed that the external wall is responsible for 25–30% of thermal energy transmitted to the building [
5]. Thus, the thermal performance of the building envelope is a crucial aspect that needs to be enhanced by designers and building construction firms. This essentially means the thermal bridges (TBs) in which the heat losses bypass the discontinuous insulated layers that may represent 50–80% of an exterior wall (TBs) [
6]. TBs occur when there is a break caused by several situations, such as the junctions between the external wall with floor roof, and column, i.e., walls have thermal bridges at the junctions with the concrete columns, concrete slabs between floors, ground floor, roof, etc. One of the common measures, in enhancing building envelope thermal performance and reducing greenhouse gas emissions, is increasing the insulation thickness [
7].
Many studies assess the benefits of increasing the insulation thickness of walls and roofs on energy reduction such as the work done by Radhi [
8], where the increase of insulation thickness reduces the consumption under different climate conditions by 17.4–23.8%. In another study by the same author, two-building envelopes, made from an autoclaved aerated concrete (AAC) and cement block, were compared and showed a saving of 7% by the AAC residential building over the business-as-usual wall layer (cement block) [
9]. Other studies have investigated the insulation type [
10,
11,
12], thickness [
10,
13,
14,
15], and location [
16]. However, those studies did not consider the effect of thermal bridges on the building envelope performance and energy consumption.
On the other hand, many standards and codes, such as ISO 14683 [
17], have suggested simplified methods to include TB contribution. Several recent studies consider the effect of the thermal bridge on the external wall of residential buildings. For instance, Friess et al. [
18] experimentally assessed residential villas in Dubai and reported that up to 53% of their external walls were uninsulated. The authors [
18] studied the effect of TB on a mid-plane insulation block, which showed less efficiency than the external insulation block by 22.9%. Hua and Fuad [
19] reported a 38–42% increase in the heating demand due to the thermal bridges between floors of high-rise residential buildings for several studied cities. In another study by the authors for a low-rise building in Canada, the effect of thermal bridge using 2D/3D dynamic method is more than that using the simplified method (equivalent U-value) by 8–13% [
20]. Martin et al. [
21] studied the effect of the thermal bridge on high-rise residential buildings of double-wall construction and reported an increase in the heating demand by 10.3% in a cold climate. An analysis of timber frame wall thermal bridges showed a different overall heat transfer coefficient (
U) than the specified value by the timber panel manufacture [
22]. Most of the research was not specifying the value of the thermal bridge resistance, however, it is usually given as a percentage value [
23].
The above literature review indicates that the effect of the thermal bridge depends on the type of wall structure including brick type, wall thickness, and insulation location and thickness. However, the previous studies focus either on the thermal bridges between floors of high-rise buildings or thermal bridge locations for only one wall type structure. There are many types of envelope structures that range from lightweight to heavy-weight walls. The previous work lacks the accurate effect of different external wall structures on the thermal bridges and envelope performance, particularly in hot climates. Thus, it makes it difficult to select the suitable wall type that has the best thermal performance of the building envelope. In addition, a multi-dimensional heat transfer analysis of thermal bridges received less attention from researchers and practitioners on low-rise residential buildings [
24,
25].
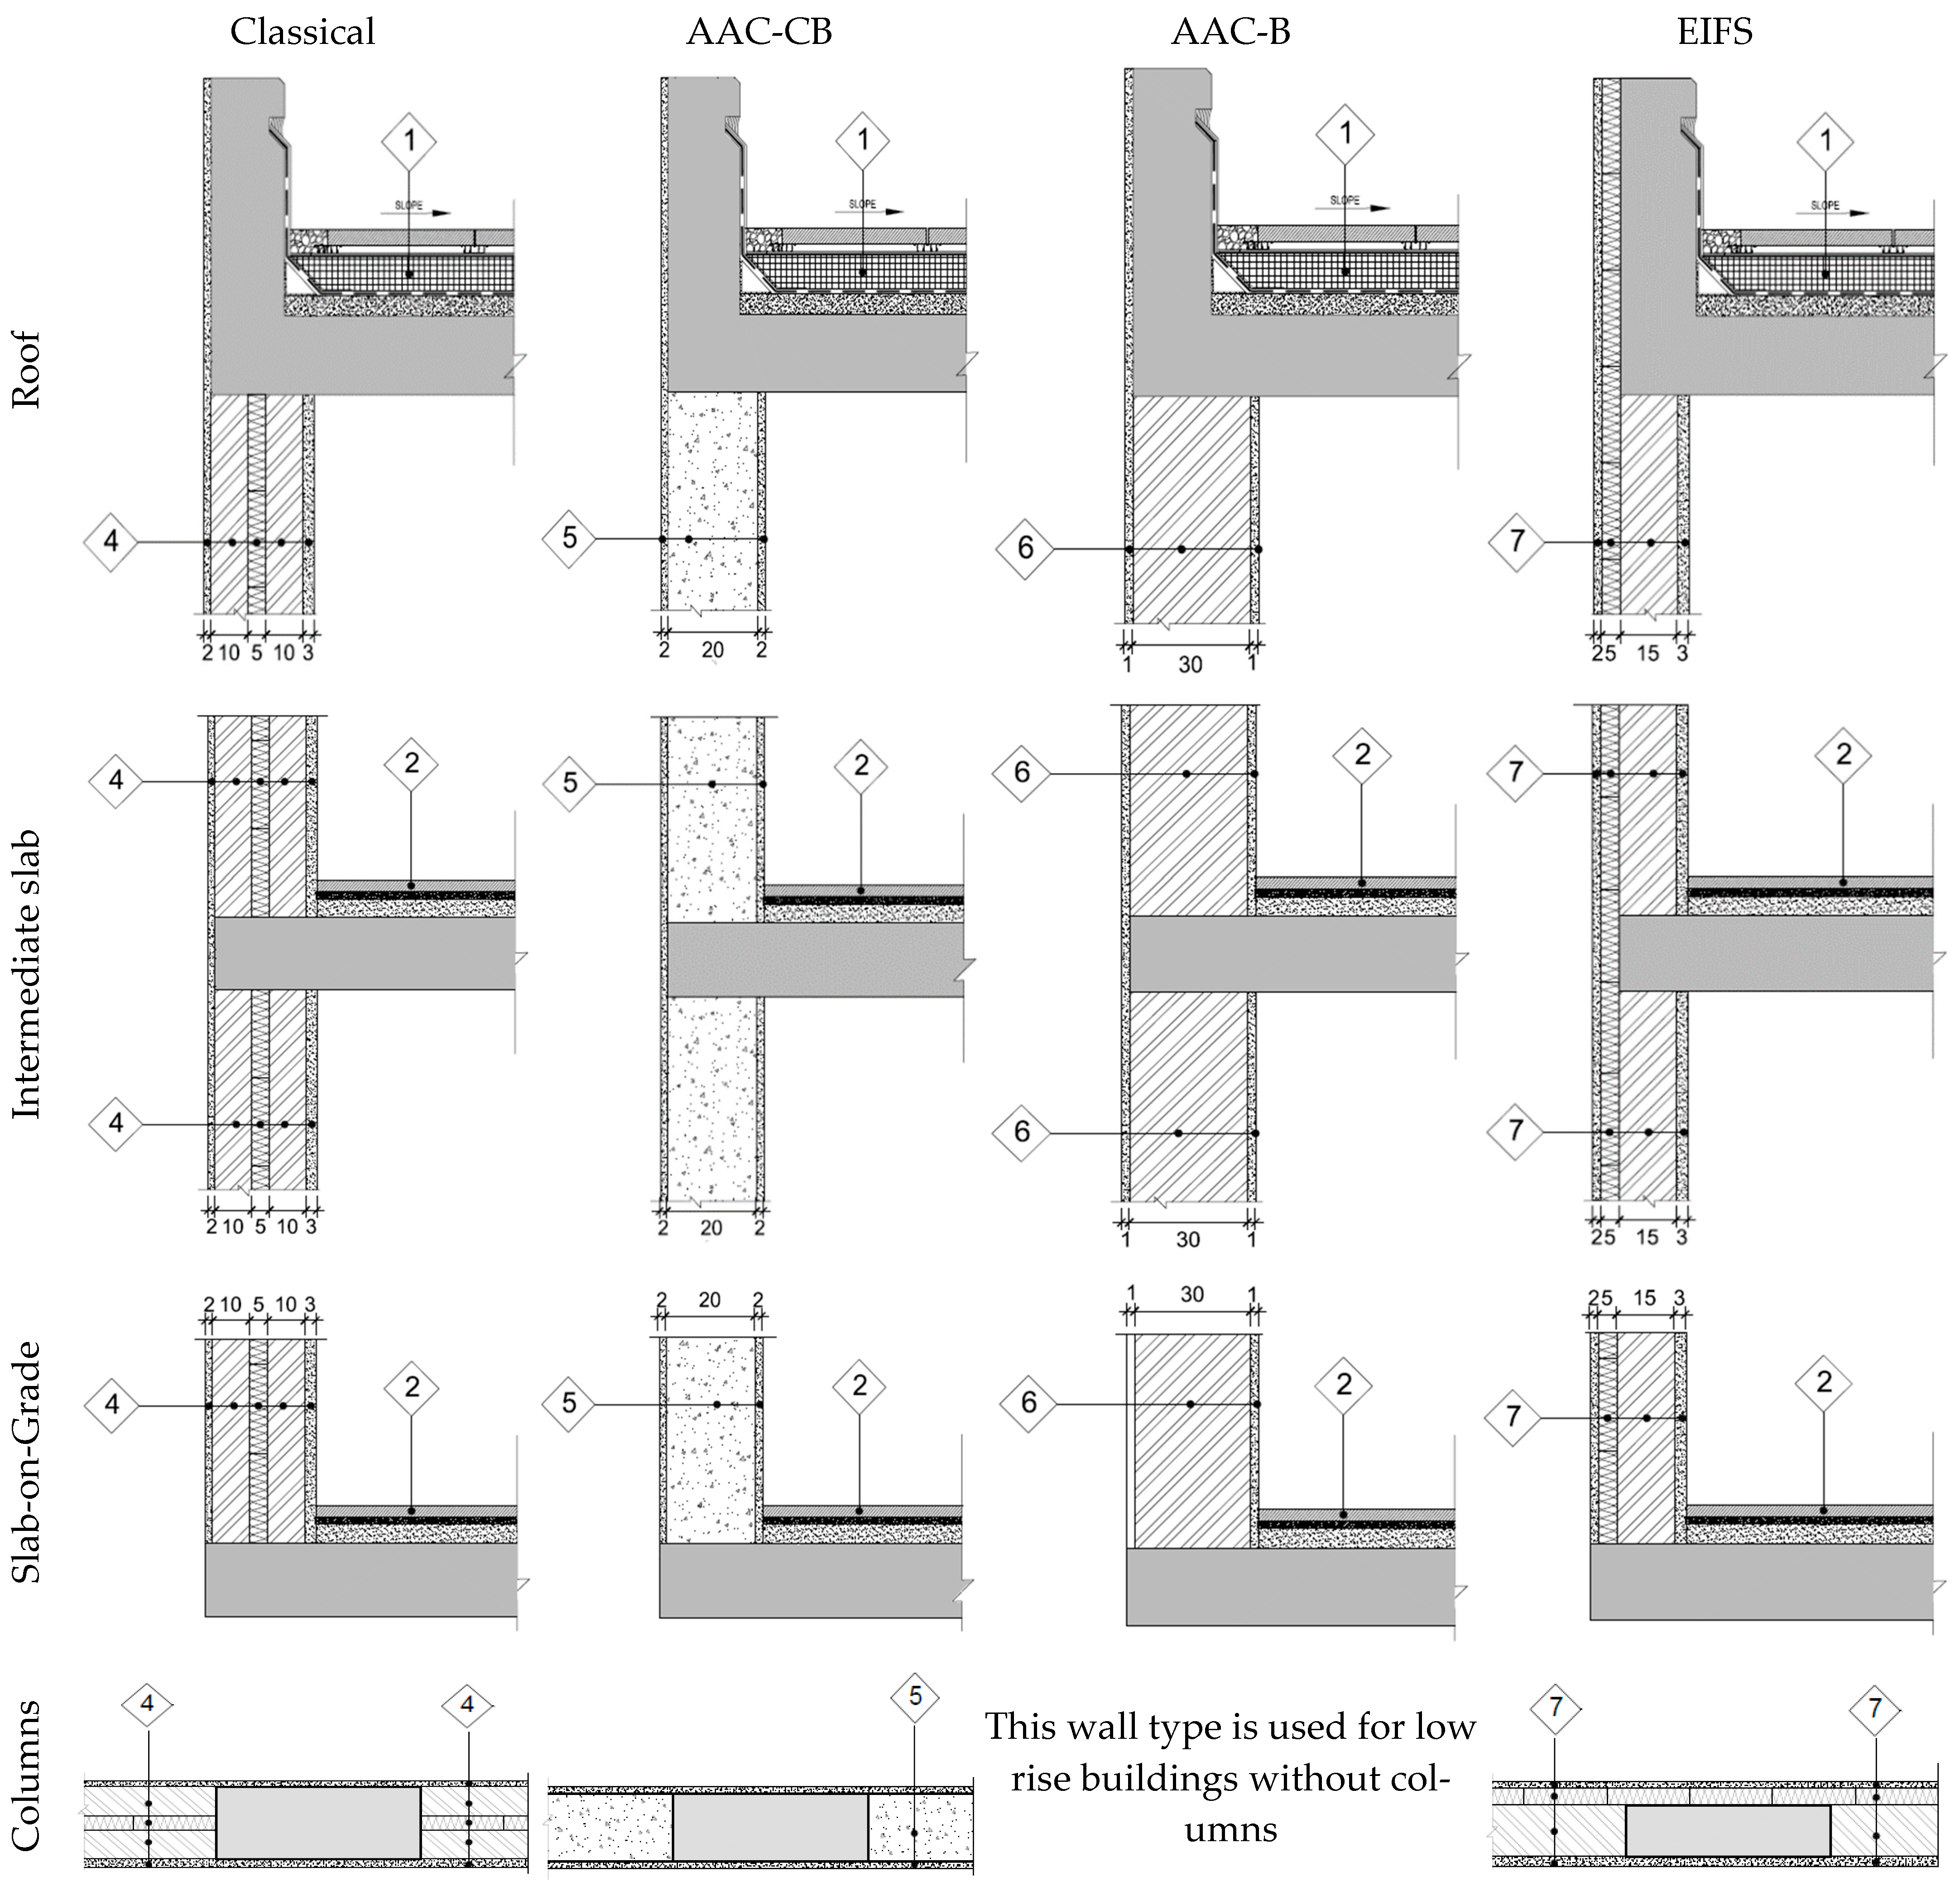
This paper investigates the effects of four different wall structures on the thermal bridges and the building envelope performance, in a hot climate, using two-dimensional mathematical models. The tested wall types are classical (cement blocks with insulation in between), autoclaved aerated concrete bearing (AAC-B), AAC column and beam (AAC-CB), and exterior insulation and finish system (EIFS). These wall types are tested with similar concrete columns and slabs to explicitly explore the effect of each wall type. The novelty of this work is identifying the best wall structure type by the comparison of the four wall construction envelopes regarding the overall thermal performance of the building envelopes including the thermal bridges on the four different locations, using two-dimensional heat transfer models.
3. Results and Discussion
The effects of the four main thermal bridges, in the building envelope, on the four external wall types, are tested. The primary aim is to identify the best-performing wall types among the classical, autoclaved aerated concrete bearing (AAC-B) for low-rise buildings, AAC column and beam (AAC-CB), and exterior insulation and finish system (EIFS) walls.
Table 1 indicates that the classical and AAC-B walls have the largest thermal resistance, followed by the EIFS while the AAC-CB wall has the lowest resistance. Accordingly, if the thermal bridge effect is neglected, the building constructed using AAC-B wall will have the best performance and those with AAC-CB wall have the lowest performance. As the area of the thermal bridge may be as large as 50–80% [
6] of the external walls, it has a substantial effect on the various types of external walls used in hot climates. Thus, the combined effect of the wall and thermal bridge zones are considered.
In the following sections, the effect of the external wall structures on the thermal bridges is discussed under standard (0 for the air inside the building and 1 for the outside ambient air) and real temperature (shown in
Figure 4) conditions. Then, the effect of insulation thickness and location is determined. Finally, the thermal characteristics of the considered four building envelopes are examined to identify the best wall structure.
3.1. Effect of External Wall Structure on the Thermal Bridges
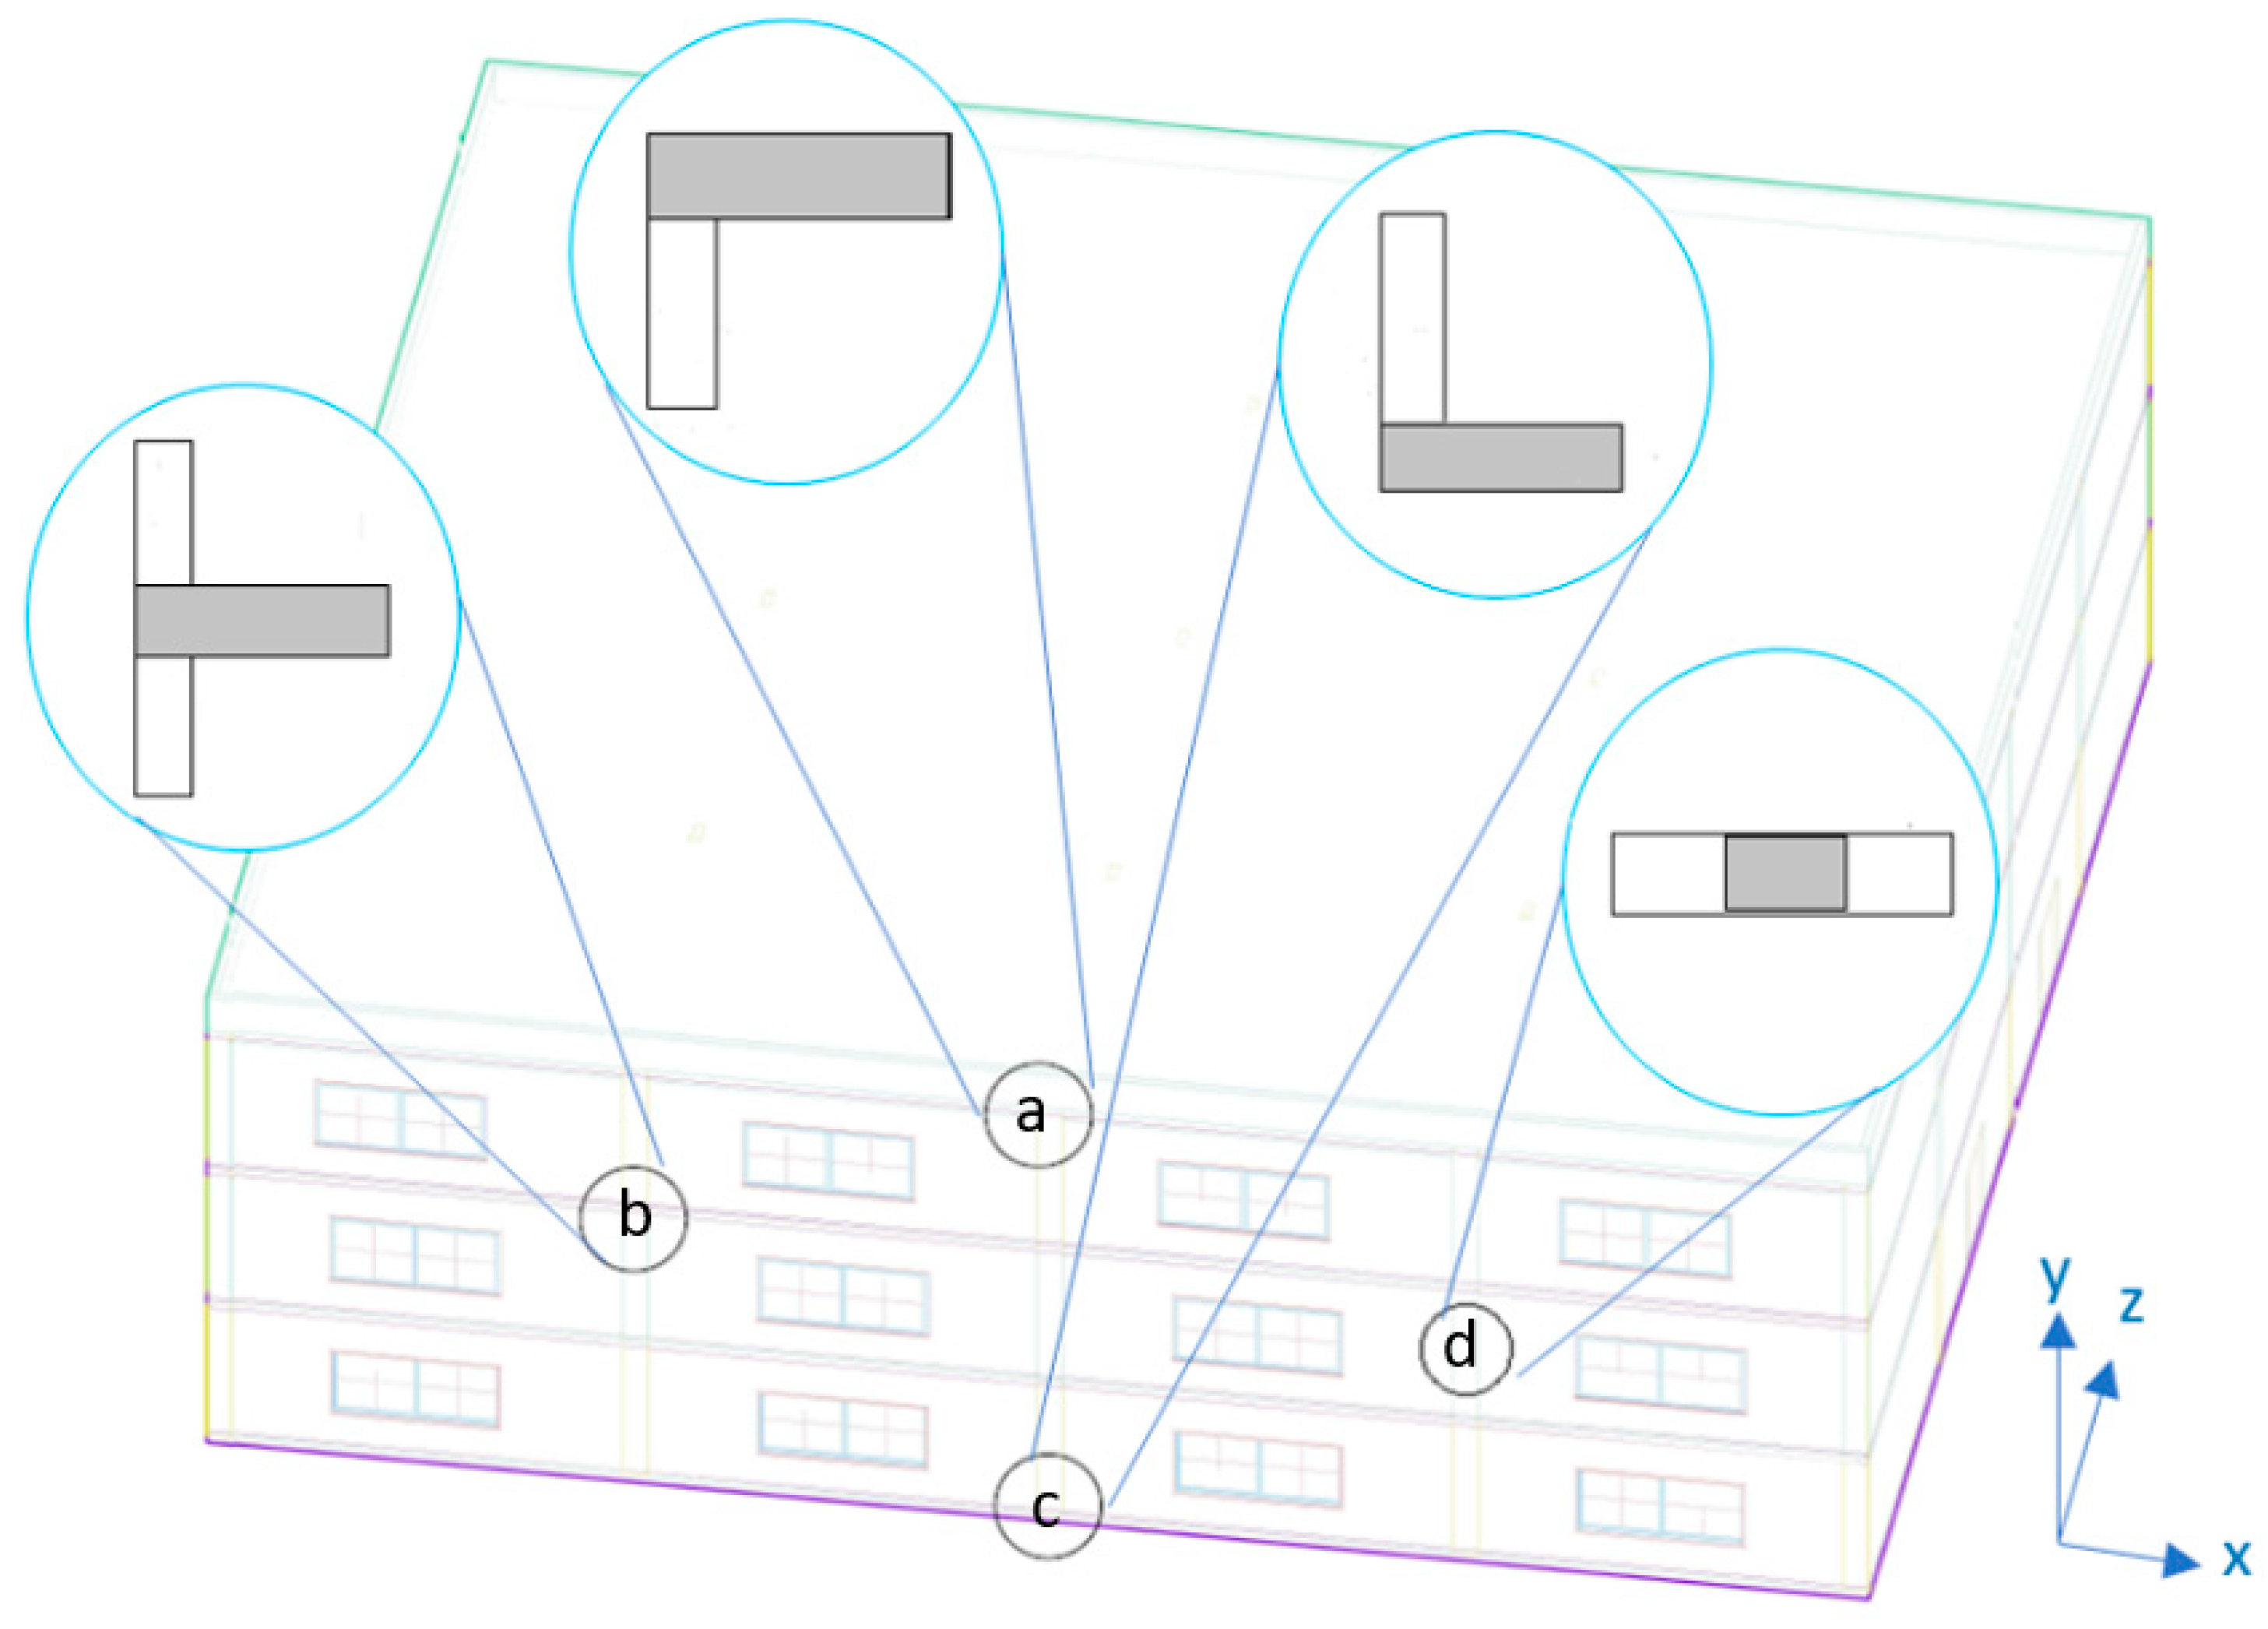
The effect of external wall structure on common thermal bridges in four places such as the junction of the external wall with the concrete slabs between floors, with the roof, and with the ground floor, and the junction between columns and wall is discussed for the four external wall structures. To explore the effect of external wall structure on each of those thermal bridges, the same structure of each concrete slab used in the intermediate floor, roof, ground floor, or columns is used with the various wall types.
In this section, the characteristics of the thermal bridges of the four wall types are obtained and the response of the thermal bridges under hot climate conditions is discussed. Among the thermal bridge characteristics are the temperature amplitude and time lag. The temperature amplitude is the difference between the highest and lowest indoor or outdoor temperatures over a certain period (one day). There are different approaches to obtain time lag; in this study, it is measured as the interval of time between a certain peak or valley of the outdoor temperature and the corresponding peak or valley of the indoor temperature.
3.1.1. Characteristics of the Thermal Bridges
As discussed in
Section 2, the thermal bridge characteristics are determined under the standard temperature conditions (0 for the air inside the building and 1 for the outside ambient air).
Table 4 lists the essential characteristics of the four thermal bridge types for the different wall structures. It is to be noted that the case of column-wall has three wall structures as the AAC-B wall has no columns. Since the inner and external areas of the thermal bridges are different for each wall structure and different from one thermal bridge to another, the order of thermal resistance, thermal diffusivity, time lag, and heat capacity is different for each type of thermal bridge. In general, the orders of inlet temperature, inside heat flux, and the inside heat flux amplitude (
Ai) are in the reverse order of the resistances of the thermal bridges. This indicates the inverse relation between those parameters and the thermal resistance according to Fourier’s law of conduction. However, the order of time lags depends on the thermal diffusivity, heat capacity per unit area, thickness, and geometry of the thermal bridge. The low thermal diffusivity of the thermal bridges means a slow transfer of heat through the thermal bridge and thus a large time lag. On the other hand, a small thermal resistance means large heat transfers to the building and consequently a large cooling load.
For the intermediate thermal bridges between floors,
Table 4 indicated that the AAC-B and AAC-CB walls have relatively low thermal resistance, thermal diffusivity, and heat capacity compared to the EIFS. However, the maximum variations of the thermal resistance, heat capacity, and thermal diffusivity between the various wall structures are about 60%, 32%, and 17%, respectively, which implies the order of their importance. In addition, the large heat capacity and thermal resistance of the EIFS enhances its capability of the temperature attenuation of the thermal bridge as it decreases the inside wall temperature to 0.071 °C compared to 0.162 °C for the classical wall. The steady-state characteristics showed that the inside heat flux of the thermal bridge of the EIFS is lower than those of the other walls by 60.2% for the classical wall, 58.1% for the AAC-CB wall, and 49.0% for the AAC-B wall. On the other hand, the harmonic analysis showed that the heat flux amplitude for the thermal bridges of the EIFS is less than half that of the classical and AAC-CB walls. The time lag of the thermal bridges using the EIFS is lower than that using classical wall by 1 h and AAC-B wall by 2 h and higher than that of AAC-CB by 0.25 h. Again, this is a manifestation of the thermal bridge characteristics (
C,
R,
a;
Table 4) of the different types of structures.
The data of thermal bridges of the roof (
Table 4) revealed that the EIFS has the largest thermal resistance and thermal diffusivity with reasonable heat capacity. The variations in the thermal resistance, heat capacity, and thermal diffusivity between the various wall types are about 47.1%, 15.4%, and 3.7%. Again, the variation of the thermal diffusivity is very limited. Thus, the steady-state analysis indicated that the EIFS offers heat flux and temperature attenuation better than the other wall types by 40.1–47.0%. This is due to its relatively larger thermal resistance compared to the other wall structures. On the other hand, the harmonic analysis revealed that the heat flux amplitude of the EIFS is less than half that of the classical wall and one-third that of the AAC-CB. In addition, the time shift of the EIFS is greater than that of the AAC-CB by over one hour and less than those of the classical and AAC-B walls by 60 and 90 min, respectively. This reflects the effect of the thermal diffusivity, heat capacity, and thermal resistance on the dynamic response of the roof thermal bridges.
The thermal bridges of the ground floor are exceptional to the other cases as the AAC-B wall has the largest thermal resistance and the lowest thermal diffusivity and the classical wall has the largest heat capacity among the walls (
Table 4). Thus, the AAC-B attains the lowest inside wall temperature, heat flux, heat flux amplitude, and largest time constant. In addition, it attains a larger time lag than the other tested wall structures. This is mainly attributed to the thermal resistance characteristics and the conditions of the building foundation.
The effect of reinforced concrete column thermal bridges on the various wall structures is described in the last part of
Table 4. The thermal resistance of the EIFS is almost double the classical wall and triple the AAC-CB wall. Accordingly, the heat flux of the EIFS is about half that of the classical wall and one-third that of the AAC-CB wall. In addition, the EIFS provides the lowest inside wall temperature and heat flux amplitude. The time lag of the EIFS is larger than the AAC-CB and lower than the classical wall by about 45 min.
In conclusion, the EIFS provides the largest resistance and lowest heat flux for the thermal bridges, except for the thermal bridge of the ground floor where the AAC-B yields the largest thermal resistance. On the other hand, the AAC-CB offers the lowest resistance and largest heat flux for thermal bridges of the roof, ground floor, and column-wall, except for the thermal bridge between floors where the classical wall structure yields the lowest thermal resistance and largest heat flux. In addition, the largest time lag takes place using the AAC-B and classical wall structures whereas the EIFS and AAC-CB yield relatively lower time lag. In evaluating the thermal bridges, the large thermal resistance and low heat flux are preferred over the large time lag. Thus, the EIFS and the AAC-B have a distinct advantage over the classical and AAC-CB wall structures.
3.1.2. Response of Thermal Bridges under Hot Climate Conditions
The characteristics of the thermal bridges are obtained under the standard temperatures. Then, the response of thermal bridges is obtained under the actual weather conditions of hot climate countries.
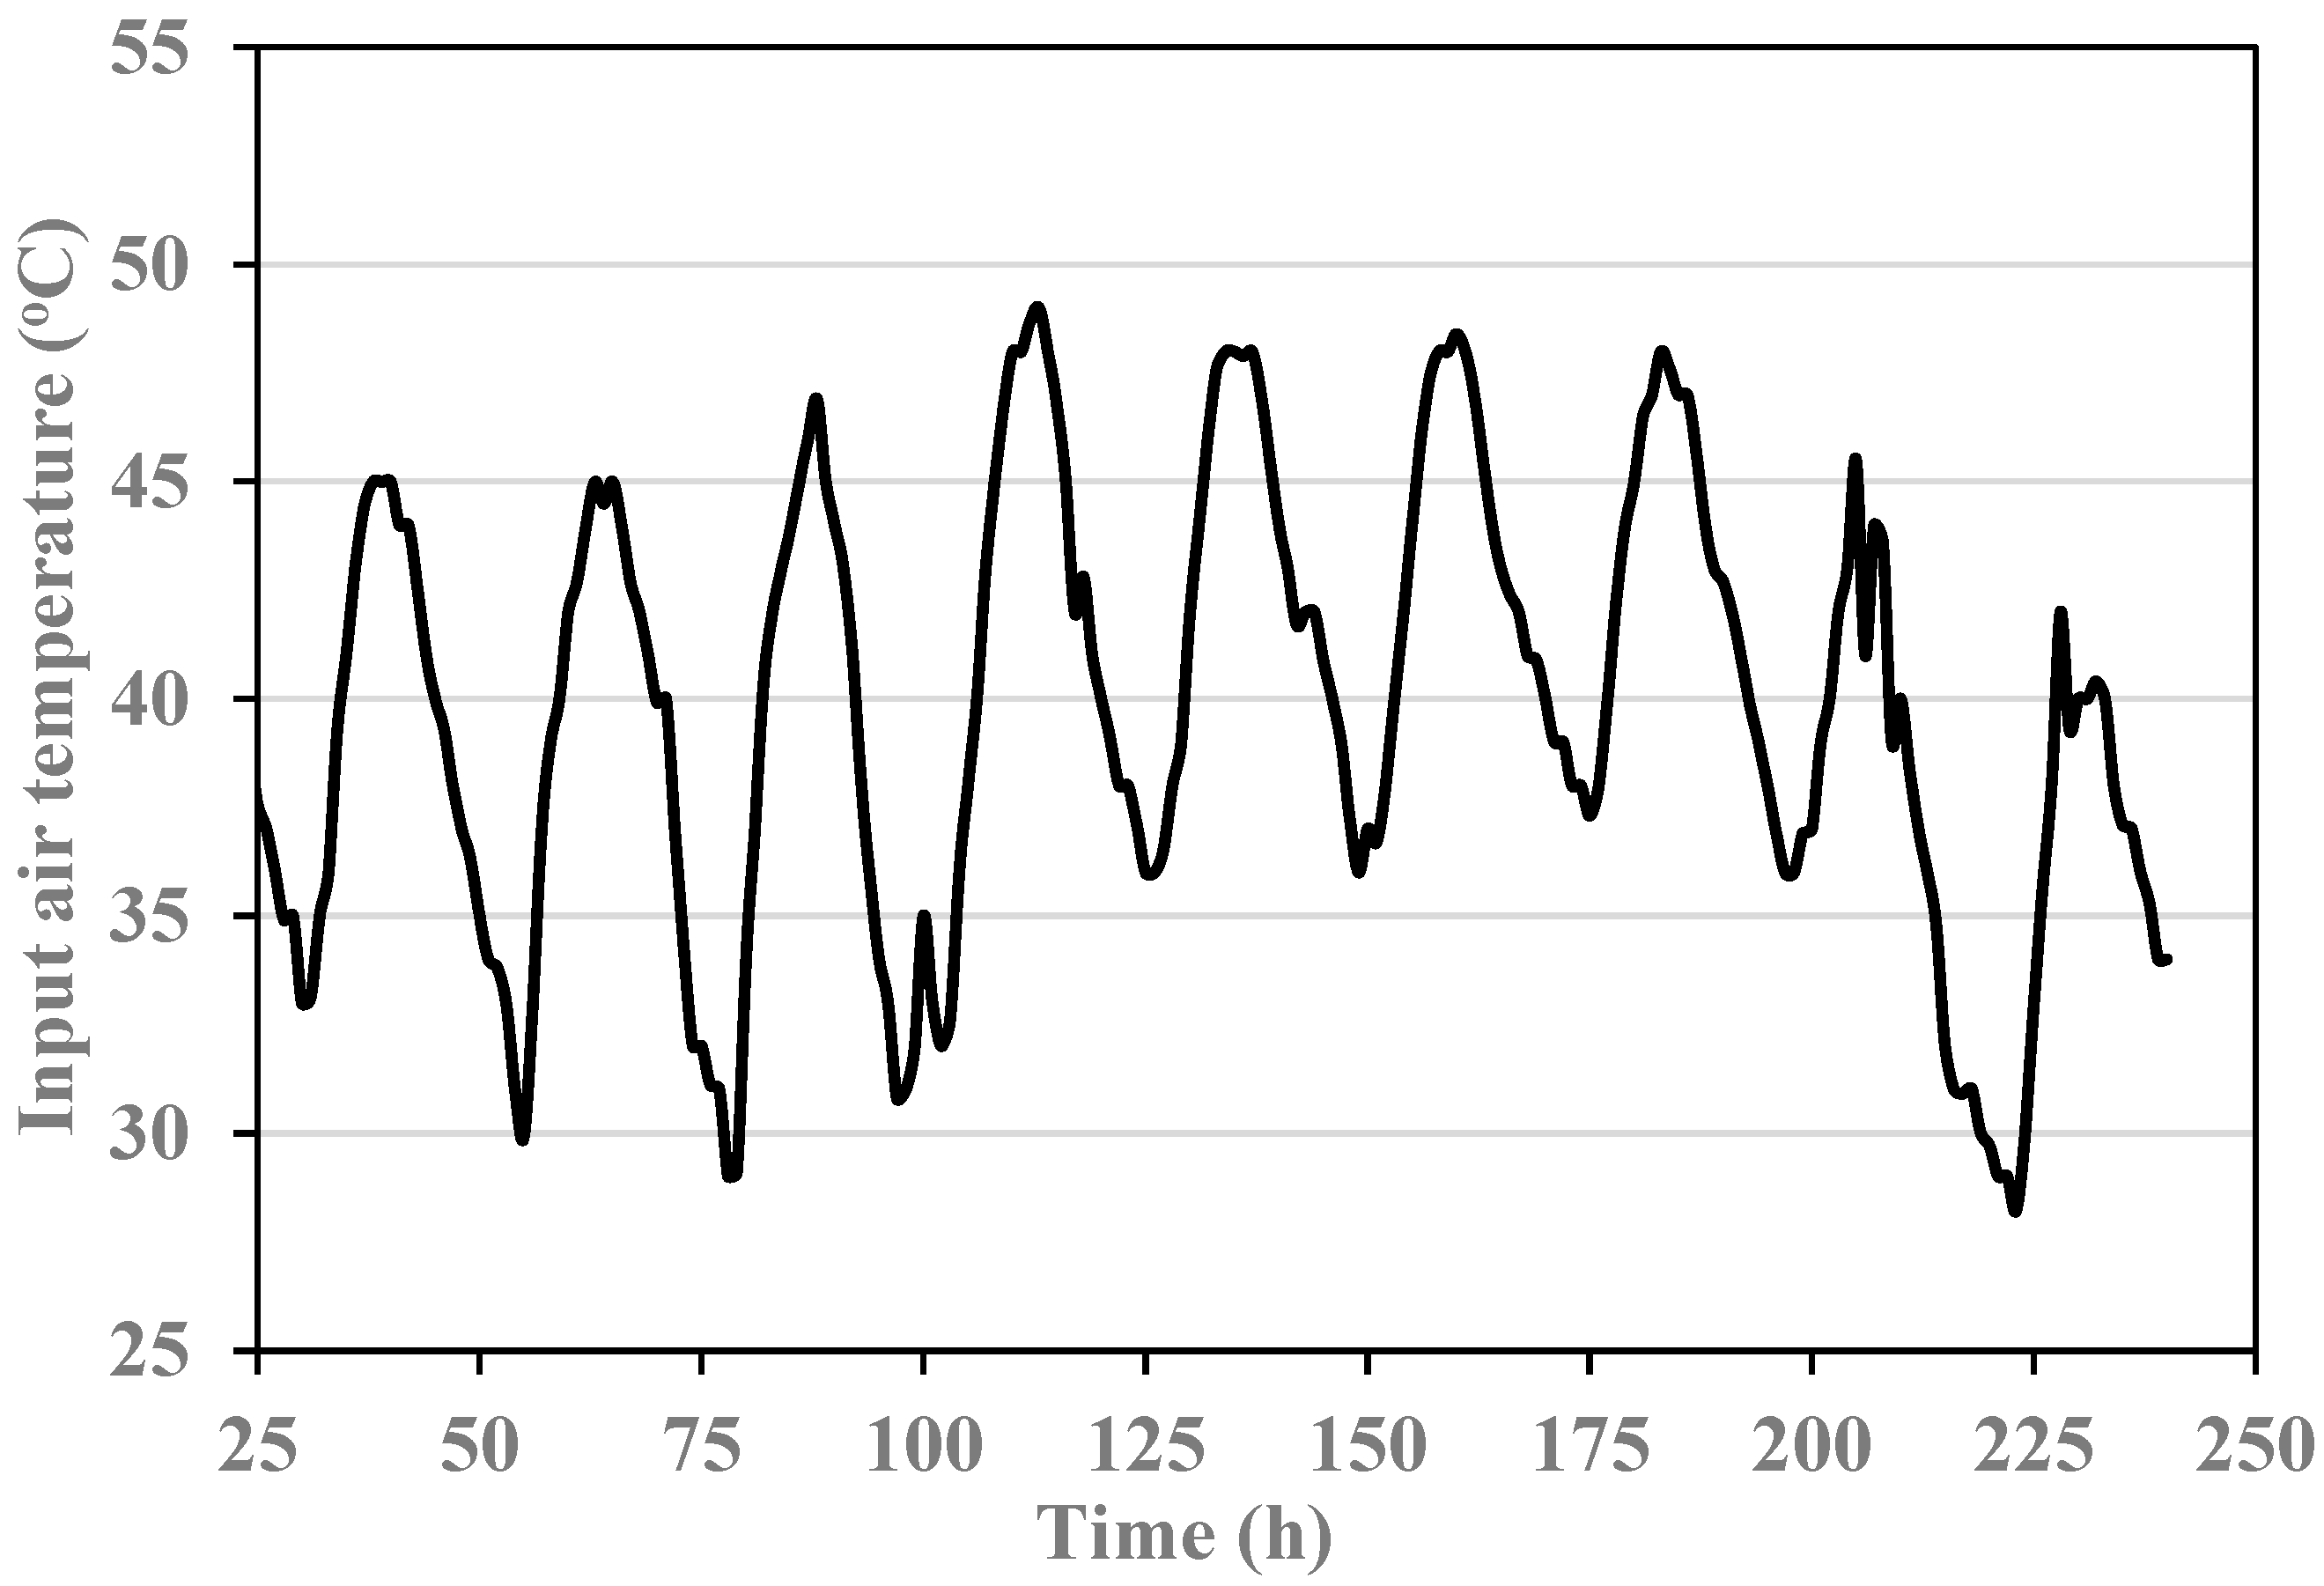
Figure 4 shows the input air temperature used to test the thermal bridges of the various tested walls. The input temperature fluctuates between a maximum value of 48 °C and a minimum value of 28.43 °C with a temperature amplitude of about 19.57 °C. Previous studies [
27,
28] recommended that the simulation program should run a few days before you can attain an accurate response of the thermal bridges that avoid the effect of the initial conditions, of the thermal bridges, on their response. Thus, the thermal bridges are tested for ten days (240 h), and their responses are shown after 24 h from the starting of the run to avoid the effect of initial conditions of the thermal bridges.
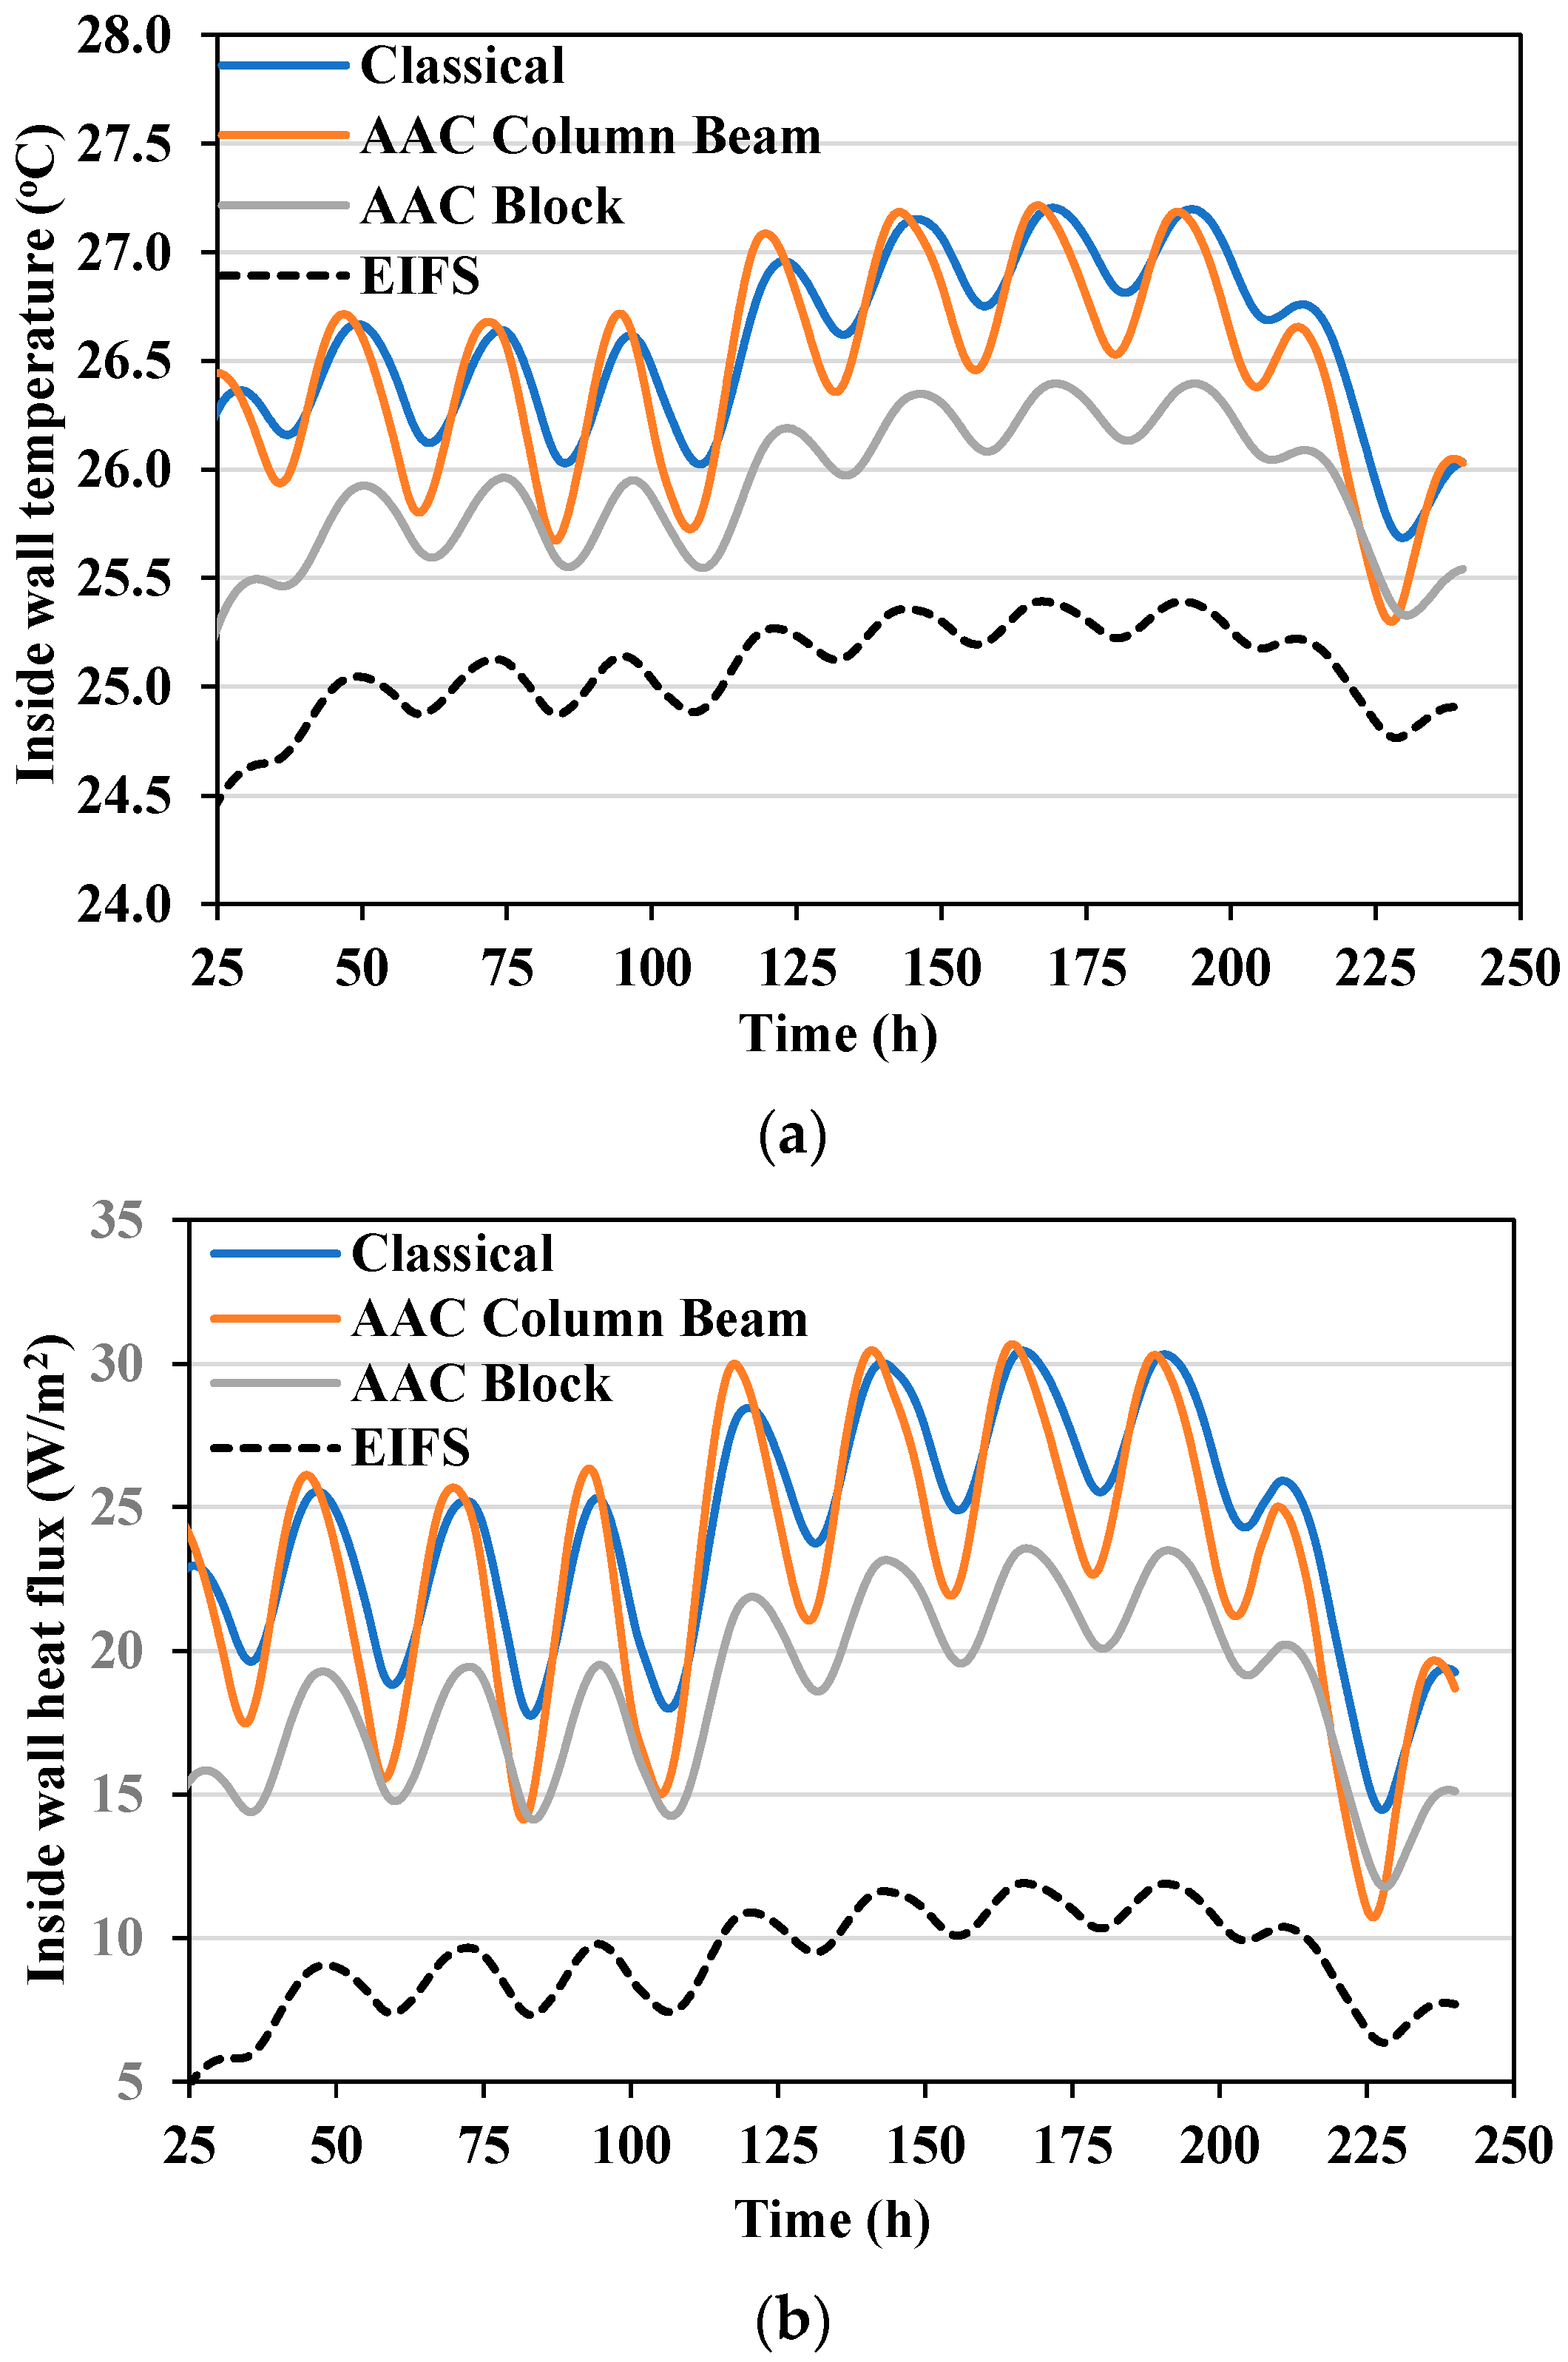
Figure 5a shows the inside wall temperature response of the thermal bridge of intermediate floors using the four tested walls. The AAC-CB and the classical walls yield large and comparable inside wall temperatures whereas the EIFS attains the lowest inside wall temperature. The maximum temperatures are damped from 48 °C to 28.9, 27.2, 26.4, and 25.4 °C for classical, AAC-CB, AAC-B, and EIFS, respectively, i.e., the temperature damping ranges from 19.1 to 22.6 °C. The corresponding average temperatures of the listed walls are 27.9, 26.5, 25.9, and 25.1 °C with temperature amplitudes of 2.46, 1.92, 1.12, and 0.91 °C, respectively. Thus, the temperature amplitude is reduced from 19.57 °C for the outdoor air temperature to 0.91–2.46 °C for the tested thermal bridges. In addition, the time lag is calculated, from the peak of inlet air temperature at time 88 h, to be 10.50, 9.50, 9.00, and 7.50 h for AAC-B, classical, EIFS, and AAC-CB walls. However, the time lag of the same walls, based on the first valley of inlet air temperature at 55 h, is 7.00, 6.00, 5.00, and 4.75 h. Usually, the time lag is reported based on the valley, not the peak [
30].
Figure 5b illustrates the inside wall heat flux fluctuations of the thermal bridge between floors using the four tested walls for the same period (from 25 to 240 h) as in
Figure 5a. The pattern of the inside heat flux follows that of the inside wall temperature of the thermal bridges of all wall types. The average heat flux is 35.2, 22.76, 18.60, and 9.28 W/m
2, with corresponding heat flux amplitude of 12.17, 9.98, 5.89, and 3.52 W/m
2 for the classical, AAC-CB, AAC-B, and EIFS walls, respectively. Clearly, the EIFS achieves the best performance among the tested thermal bridges. The order of the static and dynamic responses of the thermal bridges between floors is mainly attributed to their characteristics (
Table 4) as discussed earlier in
Section 3.1.1.
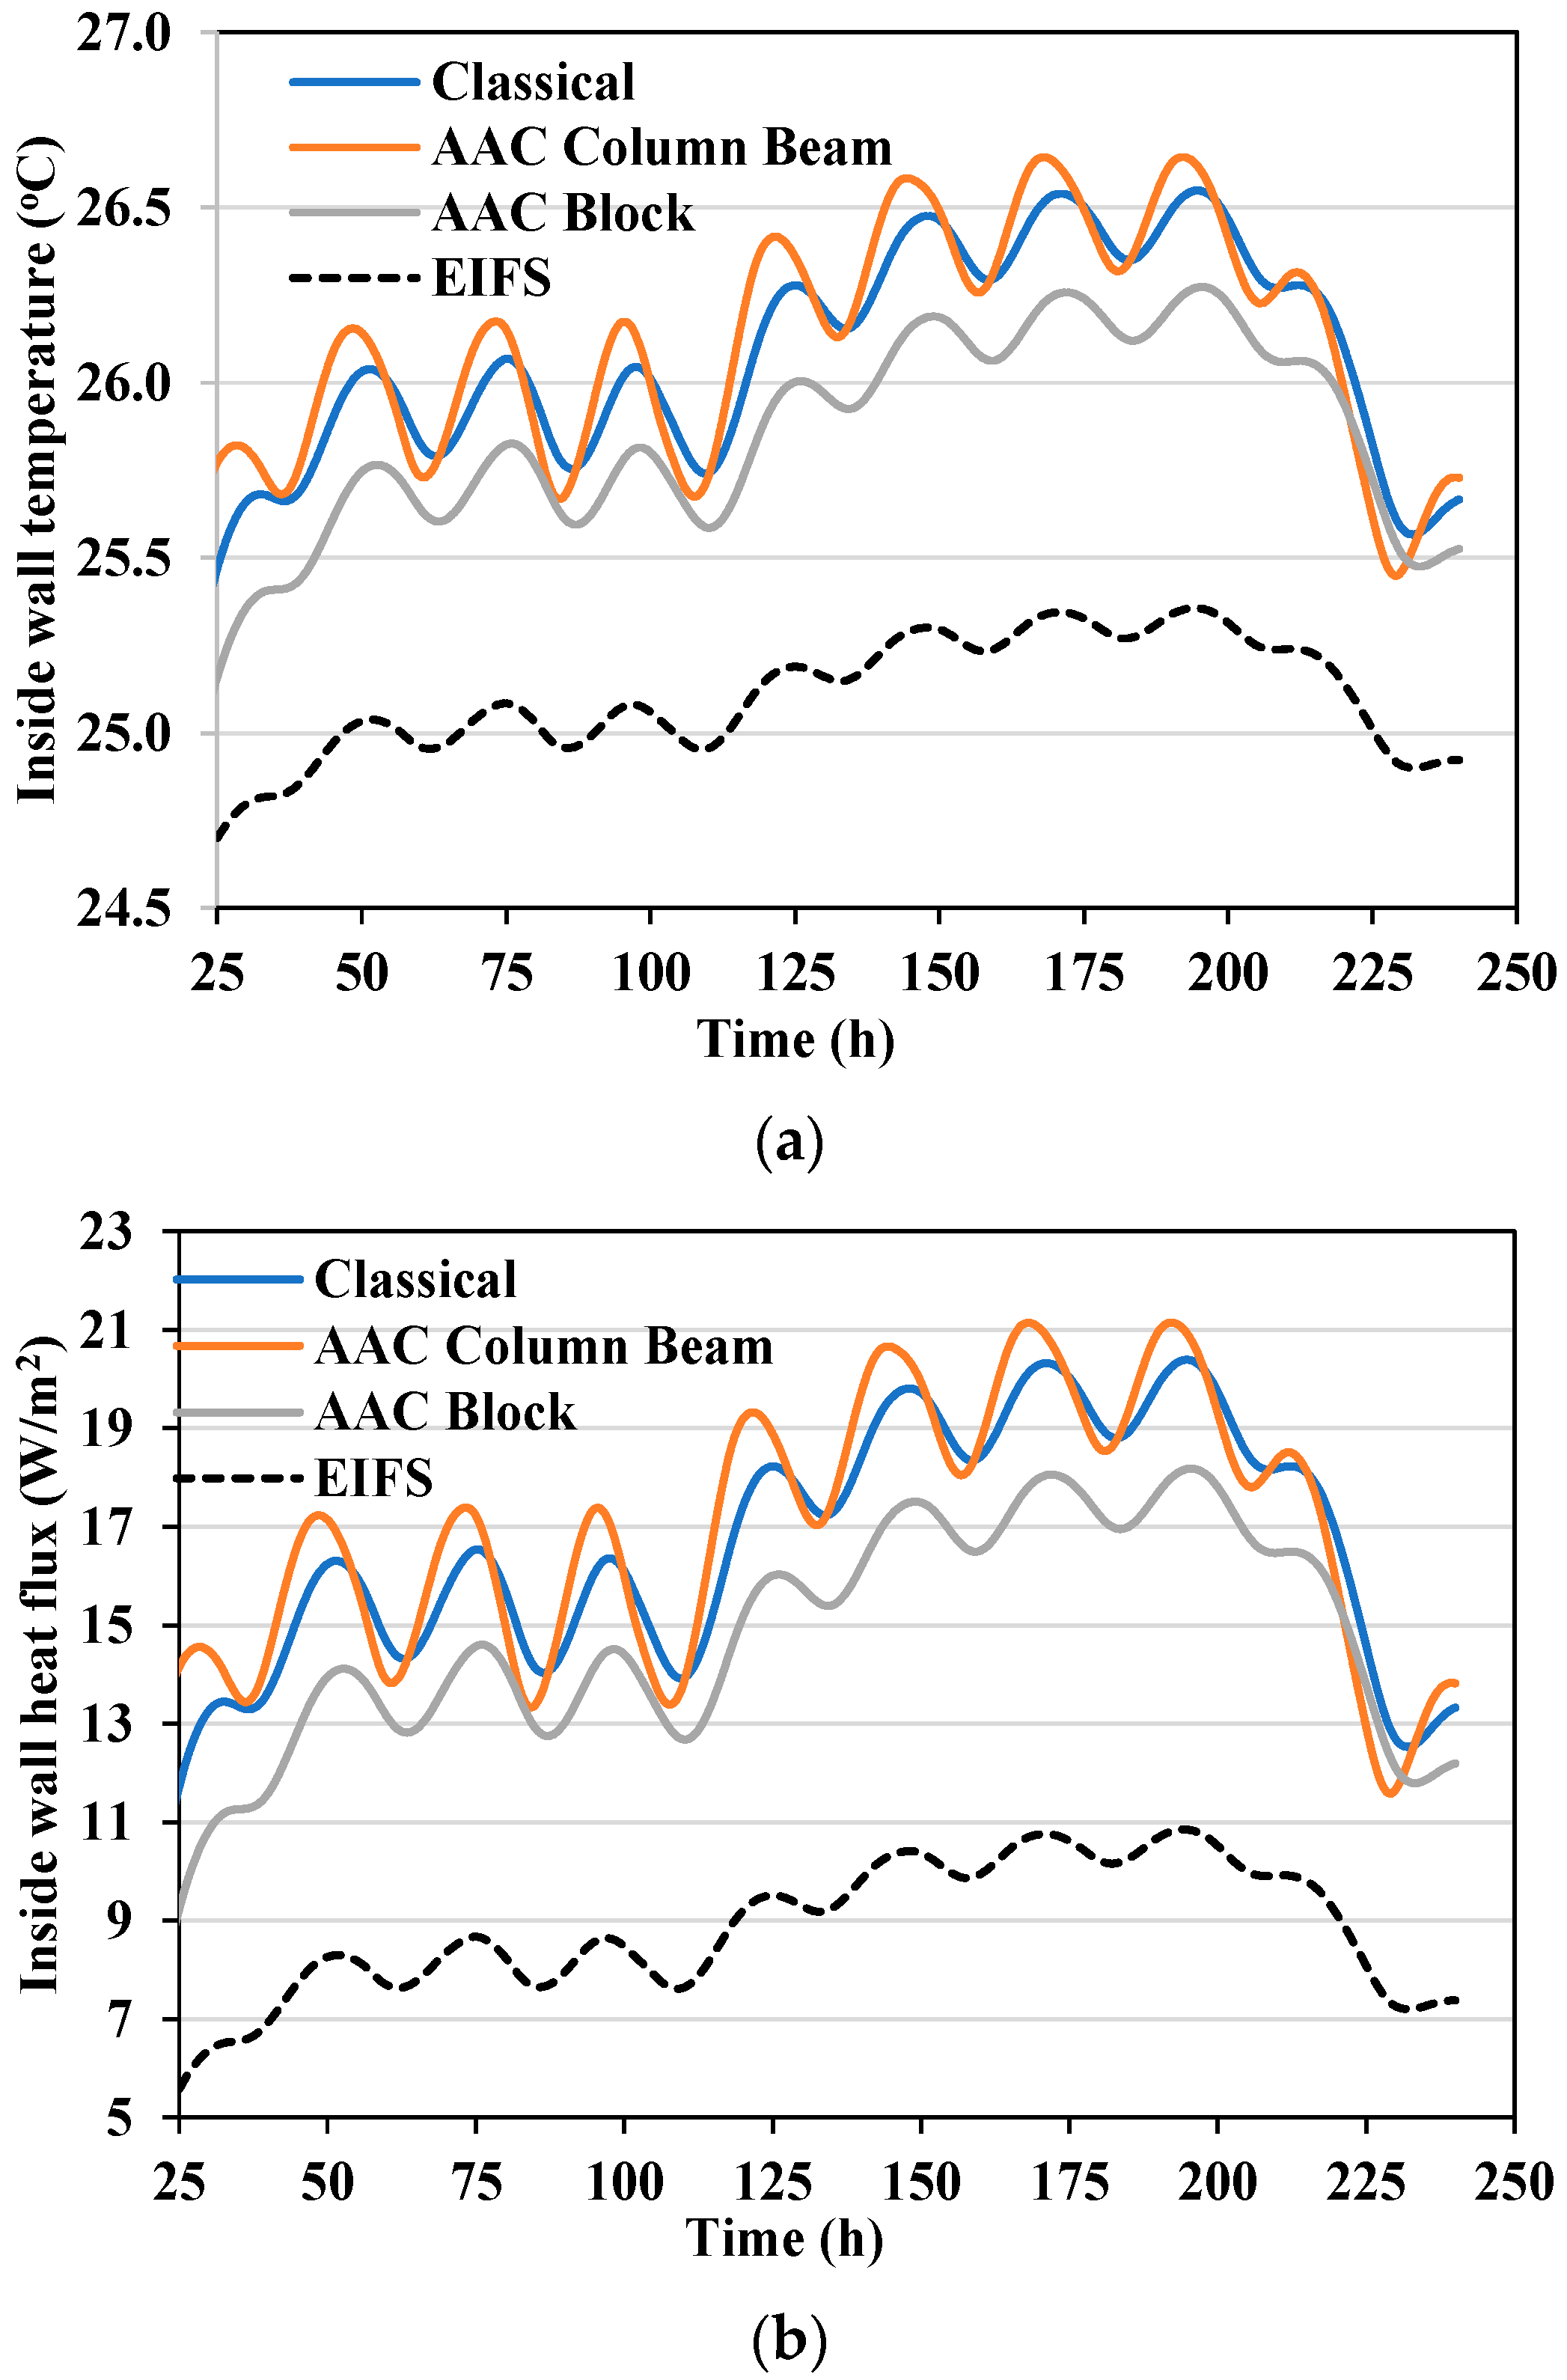
Figure 6a shows the inside wall temperature of the roof thermal bridge of the various wall structures. The average inside wall temperatures of the classical, AAC-CB, ACC-B, and EIFS walls are 26.64, 26.09, 26.27, and 25.36 °C with temperature amplitudes of 1.05, 1.20, 1.09, and 0.64 °C, respectively. The maximum temperatures are damped from 48 °C to 26.6, 26.1, 26.3, and 25.4 °C for classical, AAC-CB, AAC-B, and EIFS, respectively, i.e., the maximum temperature is damped by 21.4–22.6 °C. The corresponding time lags, based on the first temperature valley, of the listed walls, are 8.5, 5.75, 8.5, and 7.0 h. It is observed that the EIFS still provides the best performance, in terms of the average wall temperature and temperature amplitudes, among the tested wall structures. This is due to its large thermal resistance and thermal diffusivity.
On the other hand, the inside wall heat flux of the roof thermal bridges is illustrated in
Figure 6b. The average heat flux of the classical, AAC-CB, AAC-B, and EIFS walls are 16.69, 16.98, 14.88, and 8.88 W/m
2 with heat flux amplitudes of 4.21, 4.78, 4.36, and 2.58 W/m
2, respectively. Again, the relatively large thermal resistance causes the EIFS wall to provide superior temperature damping, with low-temperature amplitude, heat flux, and heat flux amplitude among the tested wall structures.
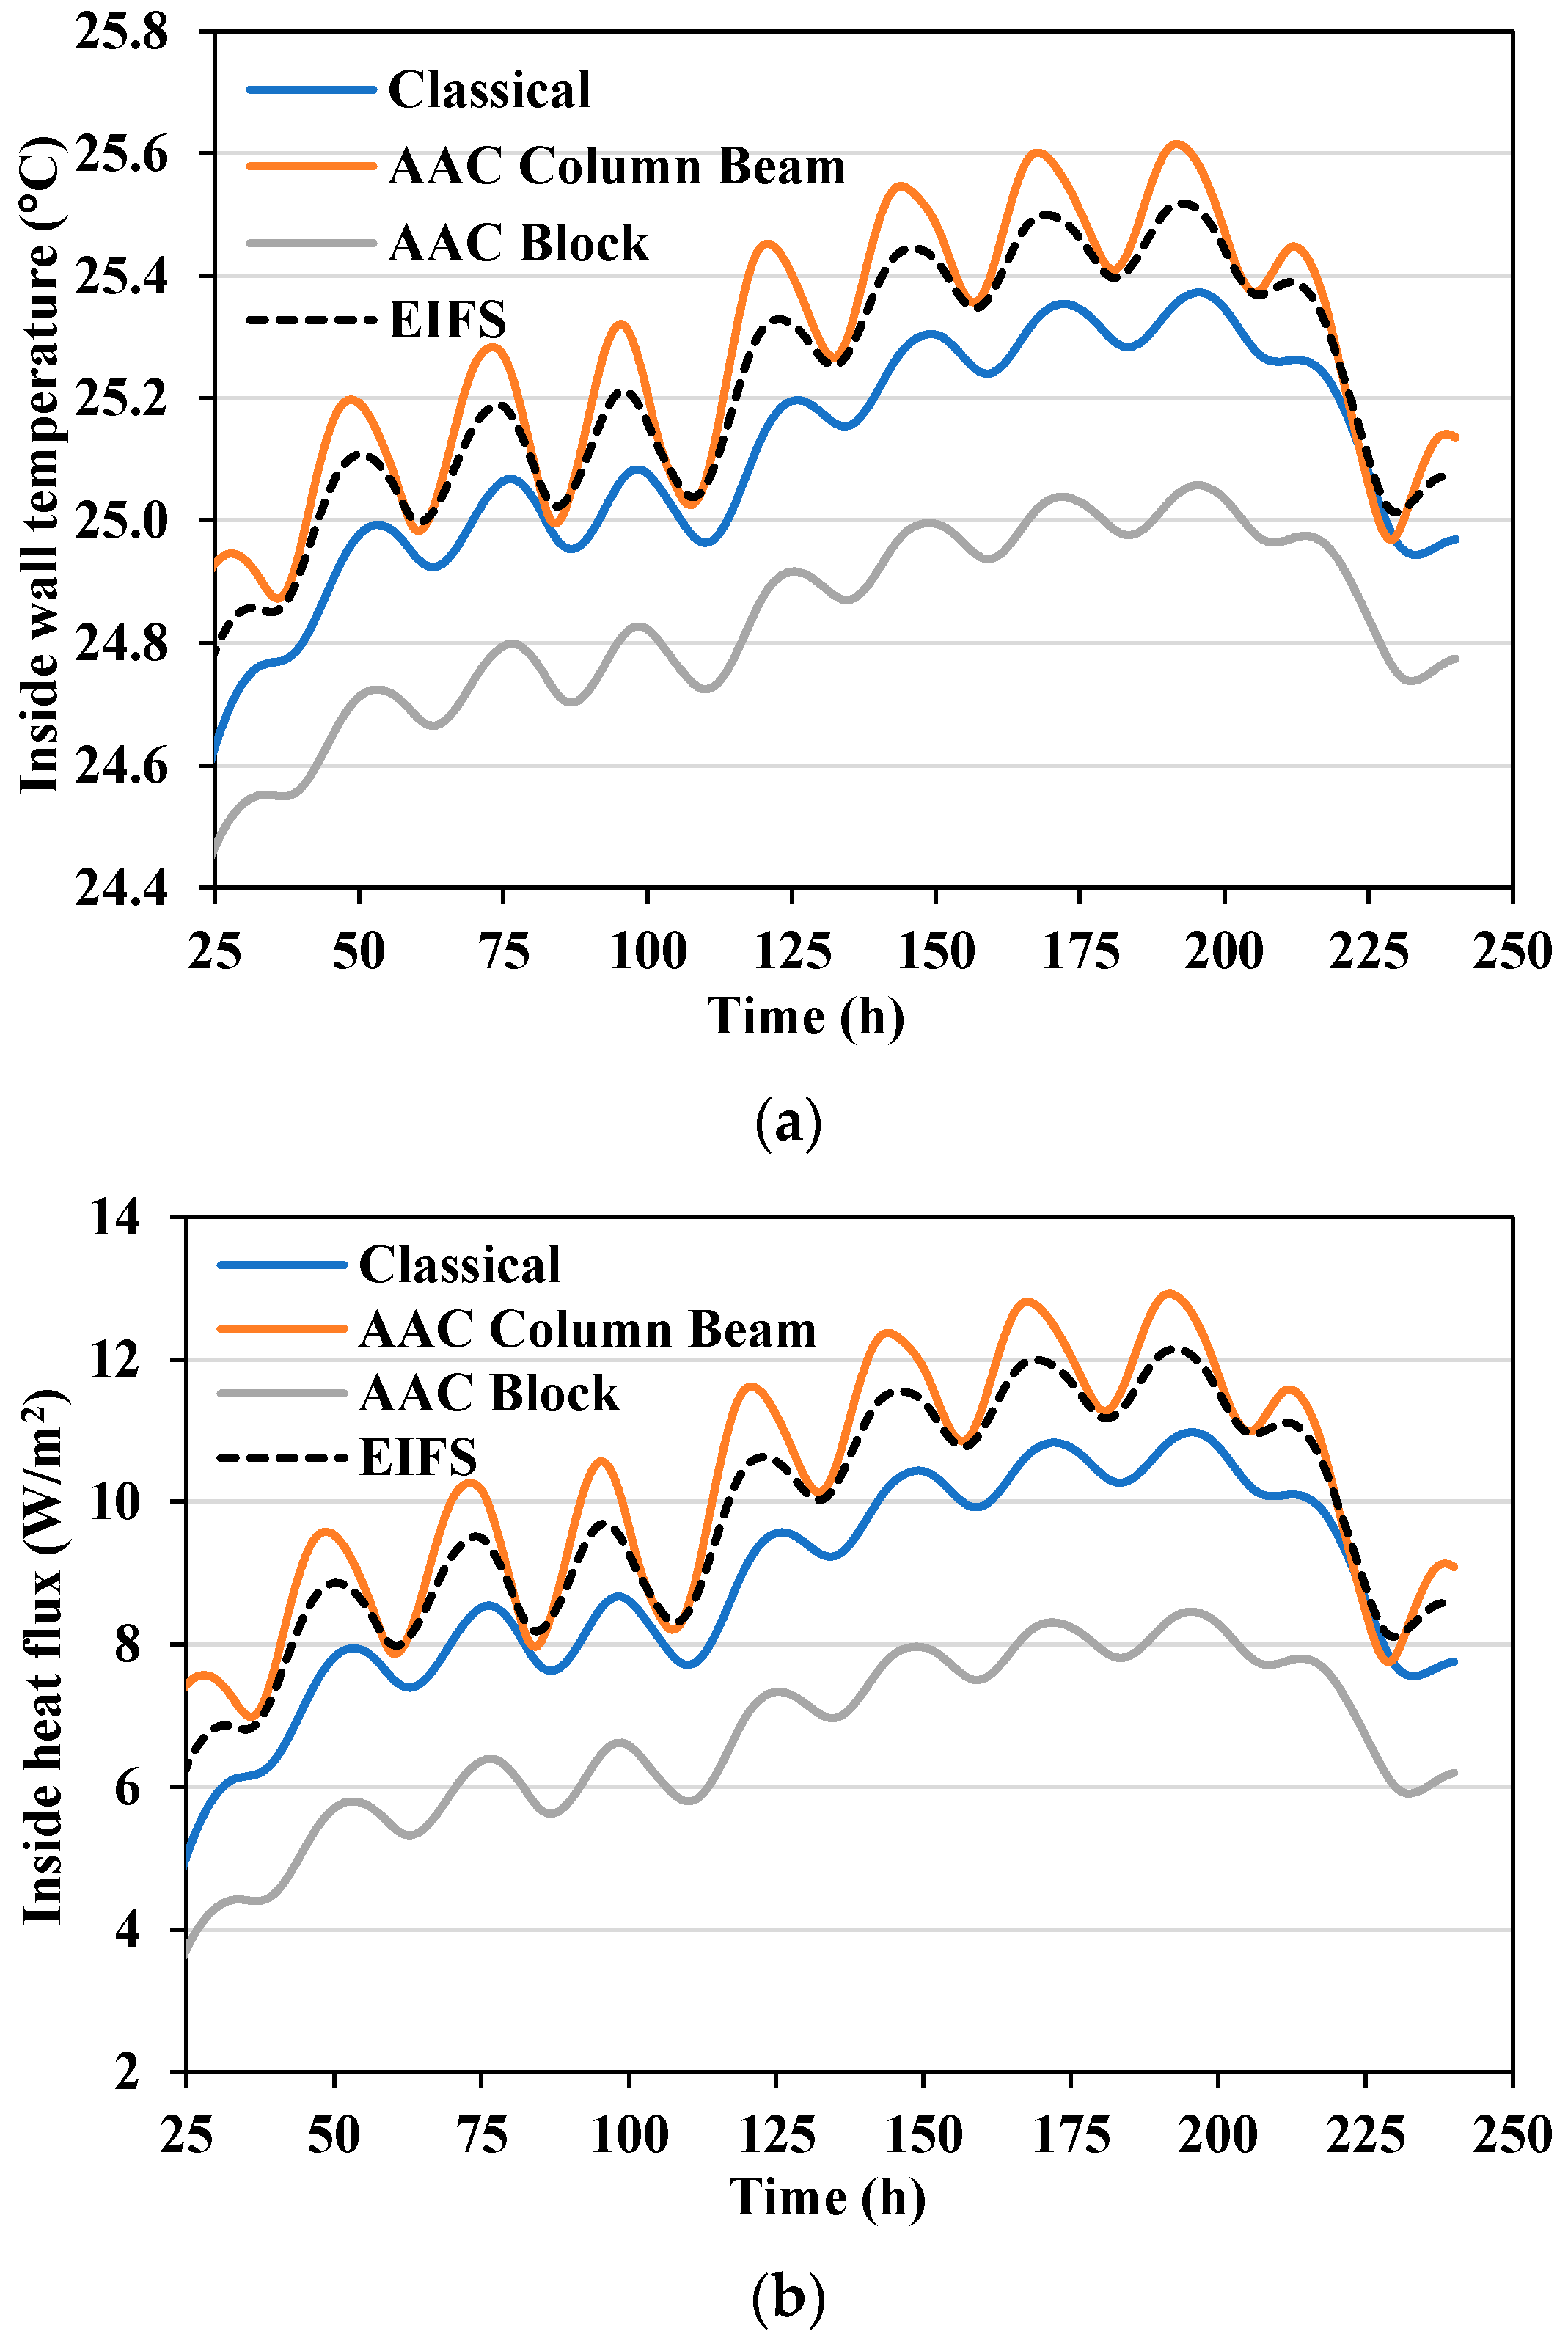
The response of the various wall structures of the ground floor thermal bridges is depicted in
Figure 7a,b. In this case, the AAC-B wall provides the best performance followed by the classical, EIFS, and AAC-CB walls. This is evident in terms of the inside wall temperature (
Figure 7a) and heat flux (
Figure 7b). The average temperature of the classical, AAC-CB, AAC-B, and EIFS walls are 25.1, 25.3, 24.8, and 25.2 °C with temperature amplitudes of 0.73, 0.74, 0.58, and 0.72 °C, respectively. The temperature damped from 48 °C to 25.4, 25.6, 25.1, and 25.5 °C for the classical, AAC-CB, AAC-B, and EIFS walls, respectively. That is, the inlet air temperature is damped by an average value of 22.65 °C (22.4–22.9 °C). The time lags (based on the minimum temperature valley) for the listed walls are 5.50, 7.75, 8.25, and 5.50 h. On the other hand,
Figure 7b shows that the average inside heat flux of the classical, AAC-CB, AAC-B, and EIFS walls are 8.88, 10.19, 6.71, and 9.79 W/m
2 with inside heat flux amplitude of 2.92, 2.97, 2.32, and 2.89 W/m
2, respectively. Again, the response of the ground floor thermal bridges reveals their stationary and dynamic characteristics as discussed earlier.
The presented results under the variable inlet air temperature confirmed the results reported in
Section 3.1.1 under the standard indoor and outdoor air temperatures. The EIFS wall type provides the best characteristics for thermal bridges between floors and on the roof whereas the AAC-B wall offers the best for the thermal bridge on the ground floor. However, it is to be noted that the difference between the EIFS and the AAC-B walls in the ground floor thermal bridge is less than 0.4 °C for the average inside wall temperature and 3.1 W/m
2 for the average inside heat flux. On the other hand, the EIFS is more superior to the AAC-B for the thermal bridges of the roof and intermediate floors. In addition, the EIFS is far suitable for high-rise buildings as they have many intermediate floors, and the AAC-B is better only for the thermal bridge of the ground floor.
3.2. Effect of Insulation Thickness and Location
To analyze the reasons for the excellent performance of the EIFS wall structure, it is subjected to further analysis.
Table 1 indicates that both the classical and EIFS walls have the same thermal insulation and the same thickness of 5 cm thick. The only difference between them is that the first has the insulation between the wall layers while the EIFS board has the insulation layer on the outer side. Thus, the EIFS is investigated for different locations (inside or outside layer) and thicknesses (2.5 and 5.0 cm) of thermal insulation for the case of the thermal bridge of intermediate floors.
Table 5 lists the stationary and dynamic characteristics of the thermal bridge of intermediate floors for different insulation locations and thicknesses under the standard indoor and outdoor air temperatures. Clearly, the thermal insulation on the outside layer of the wall is very effective as it covers both bricks and concrete slab of the floor and roof whereas the inside layer of the insulation is interrupted at many locations. Thus, the effect of thermal bridge on the buildings with inside insulation is more distinct than buildings with outside insulation. As a result, the thermal resistance for the thermal bridges using the outside continuous insulation layer is considerably larger than those using the inside interrupted insulation layer that never covers the concrete slabs. The thermal bridge characteristics (
R,
Ti,
qi, and
Ai) using external insulation of 2.5 cm are comparable to the characteristics using the inside insulation of 5 cm thick. In addition, as the thickness of either outside or inside thermal insulation increases, the characteristics of the thermal bridge between floors are enhanced (
Table 5).
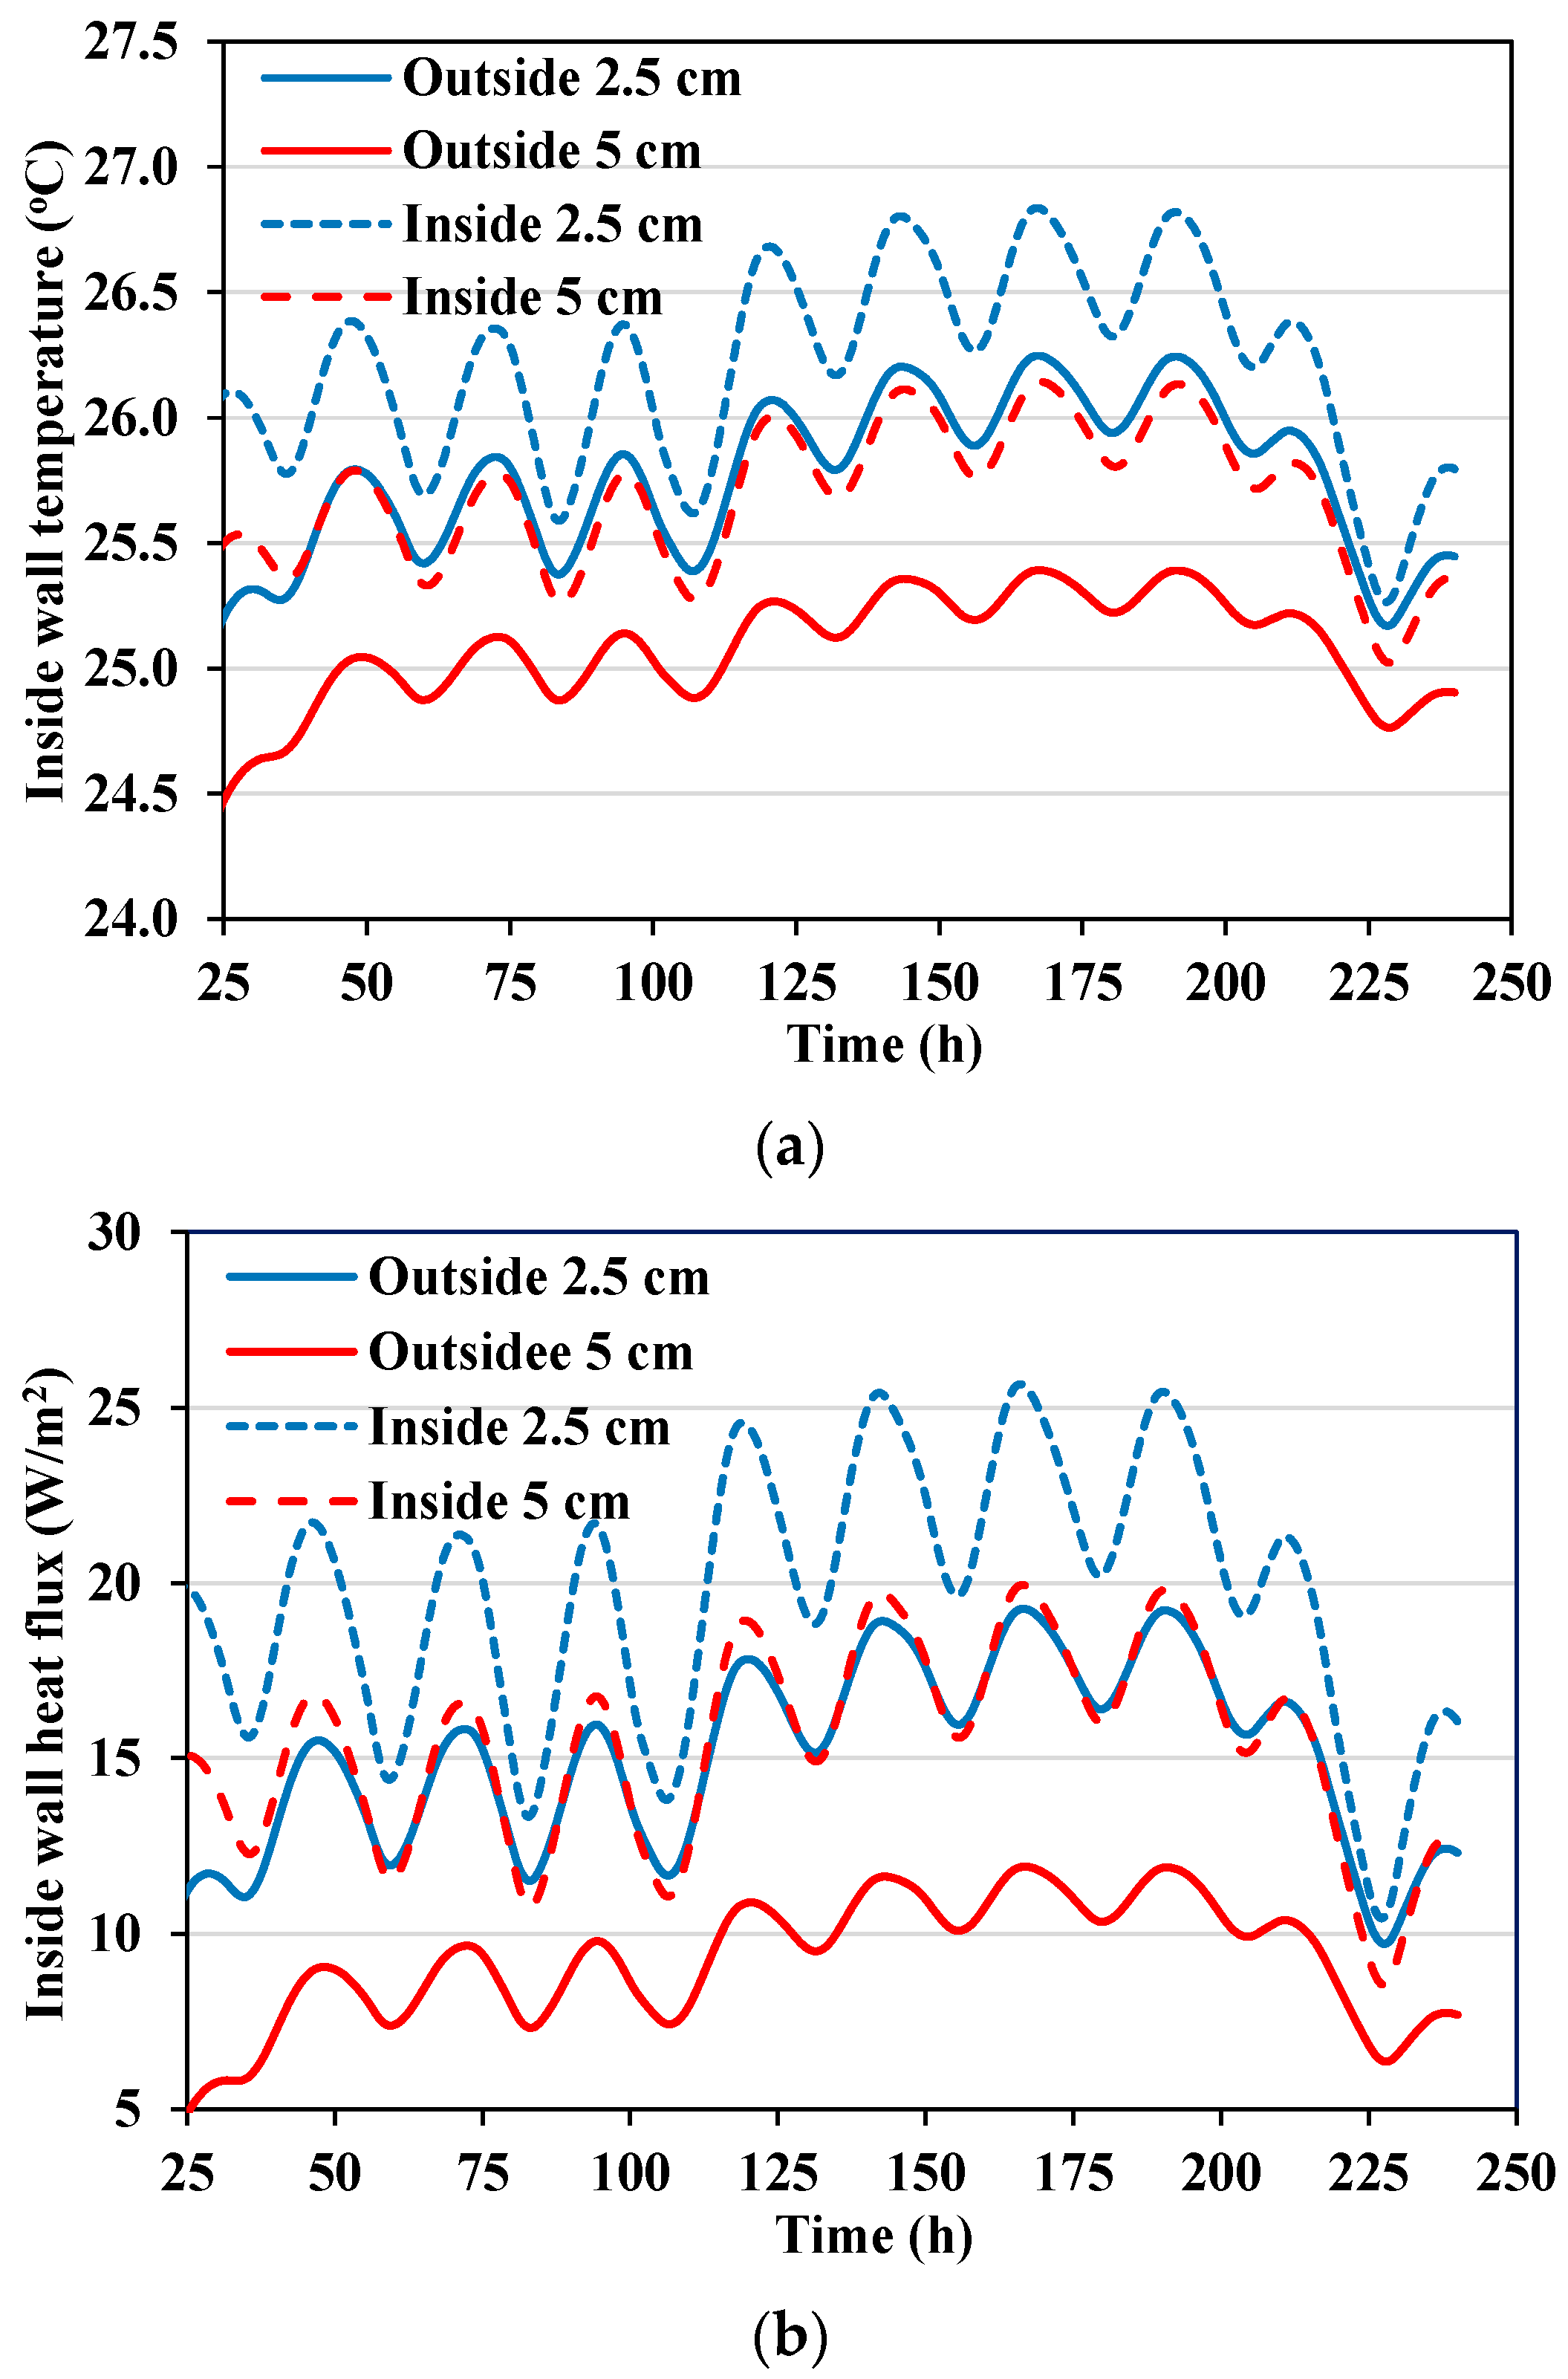
In addition,
Figure 8a,b show the inside wall temperature and heat flux, respectively, for the four considered cases of external and internal insulation, under the hot climate temperature condition. Again, the inside wall temperature and the heat flux of the intermediate floor thermal bridge with the outside insulation of 2.5 cm thick are comparable with those of the thermal bridge with the inside insulation of 5 cm thick. The thermal bridges between floors with the outside insulation of 5 and 2.5 cm and the inside insulation of 5 and 2.5 cm have average inside wall temperature of 25.1, 25.8, 25.7, and 26.2 °C with an inside heat flux of 9.28, 15.12, 15.40, and 19.62 W/m
2, respectively. The corresponding inside heat flux amplitudes, of the listed cases, are 3.52, 4.77, 5.70, and 7.61 W/m
2. In conclusion, the uninterrupted external insulation of 5 cm of the thermal bridge of intermediate floors provides lower inside heat flux by about 66% and heat flux amplitude by about 62% than the same thermal bridge with interrupted internal insulation. This is mainly due to the larger effect of thermal bridges on the interrupted internal insulation as discussed earlier.
3.3. Thermal Characteristics of the Building Envelope
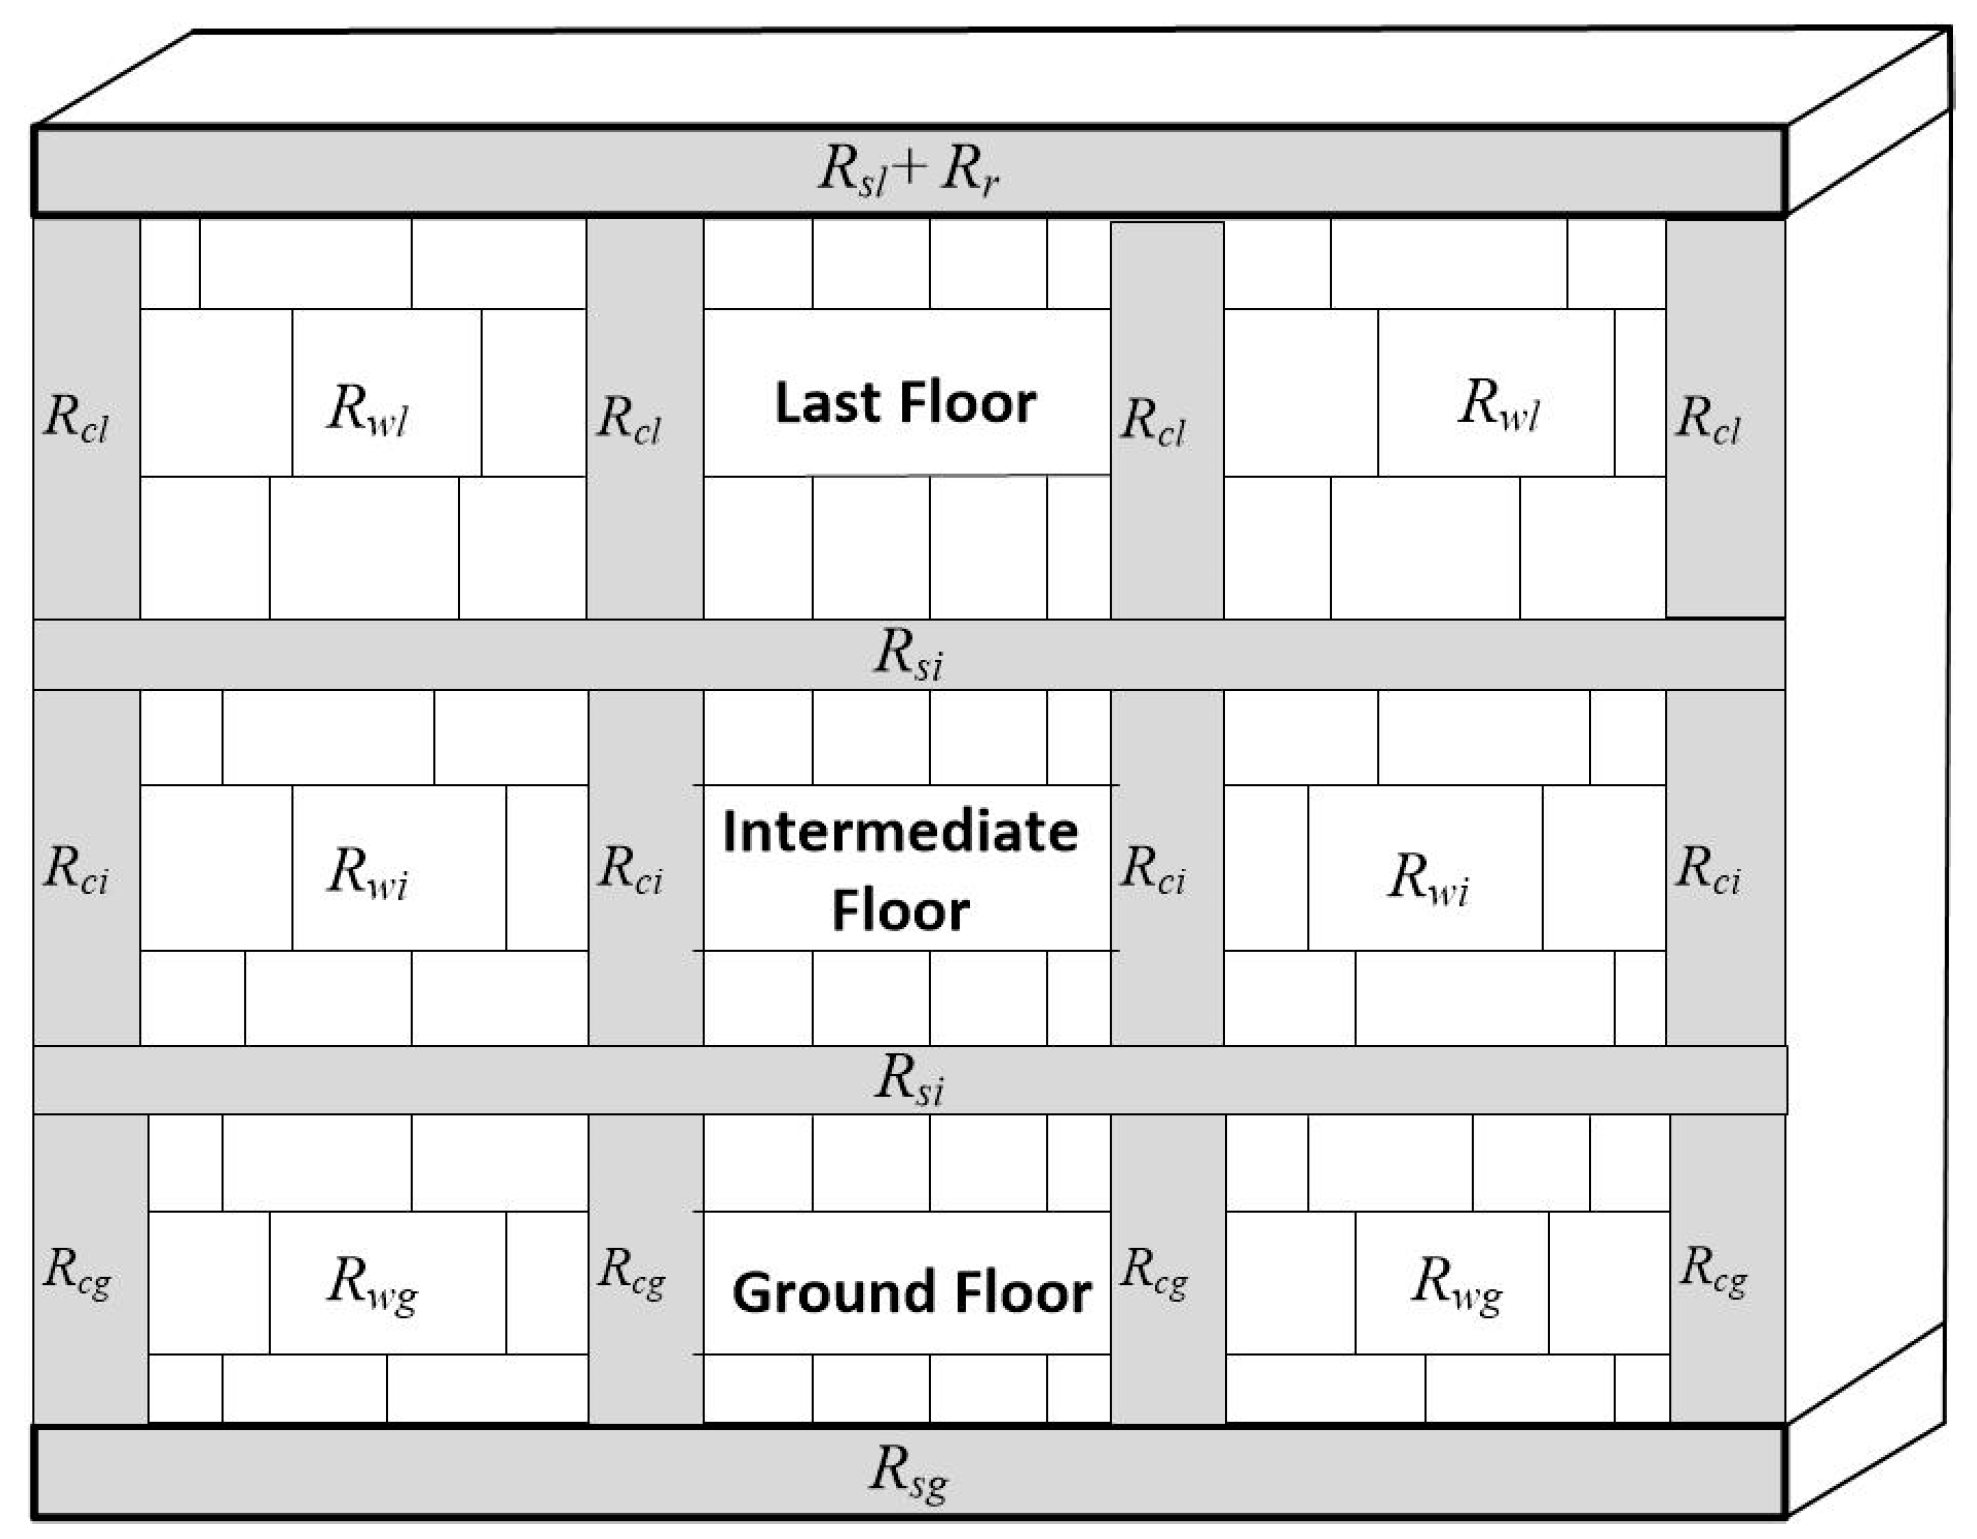
The building envelopes have thermal bridges at the junctions between walls and columns, concrete slabs of intermediate floors, ground floor, roof, etc. In this paper, the envelope characteristics are identified by the assembly thermal resistance concept that is applied to compare the different wall structures considered in this work.
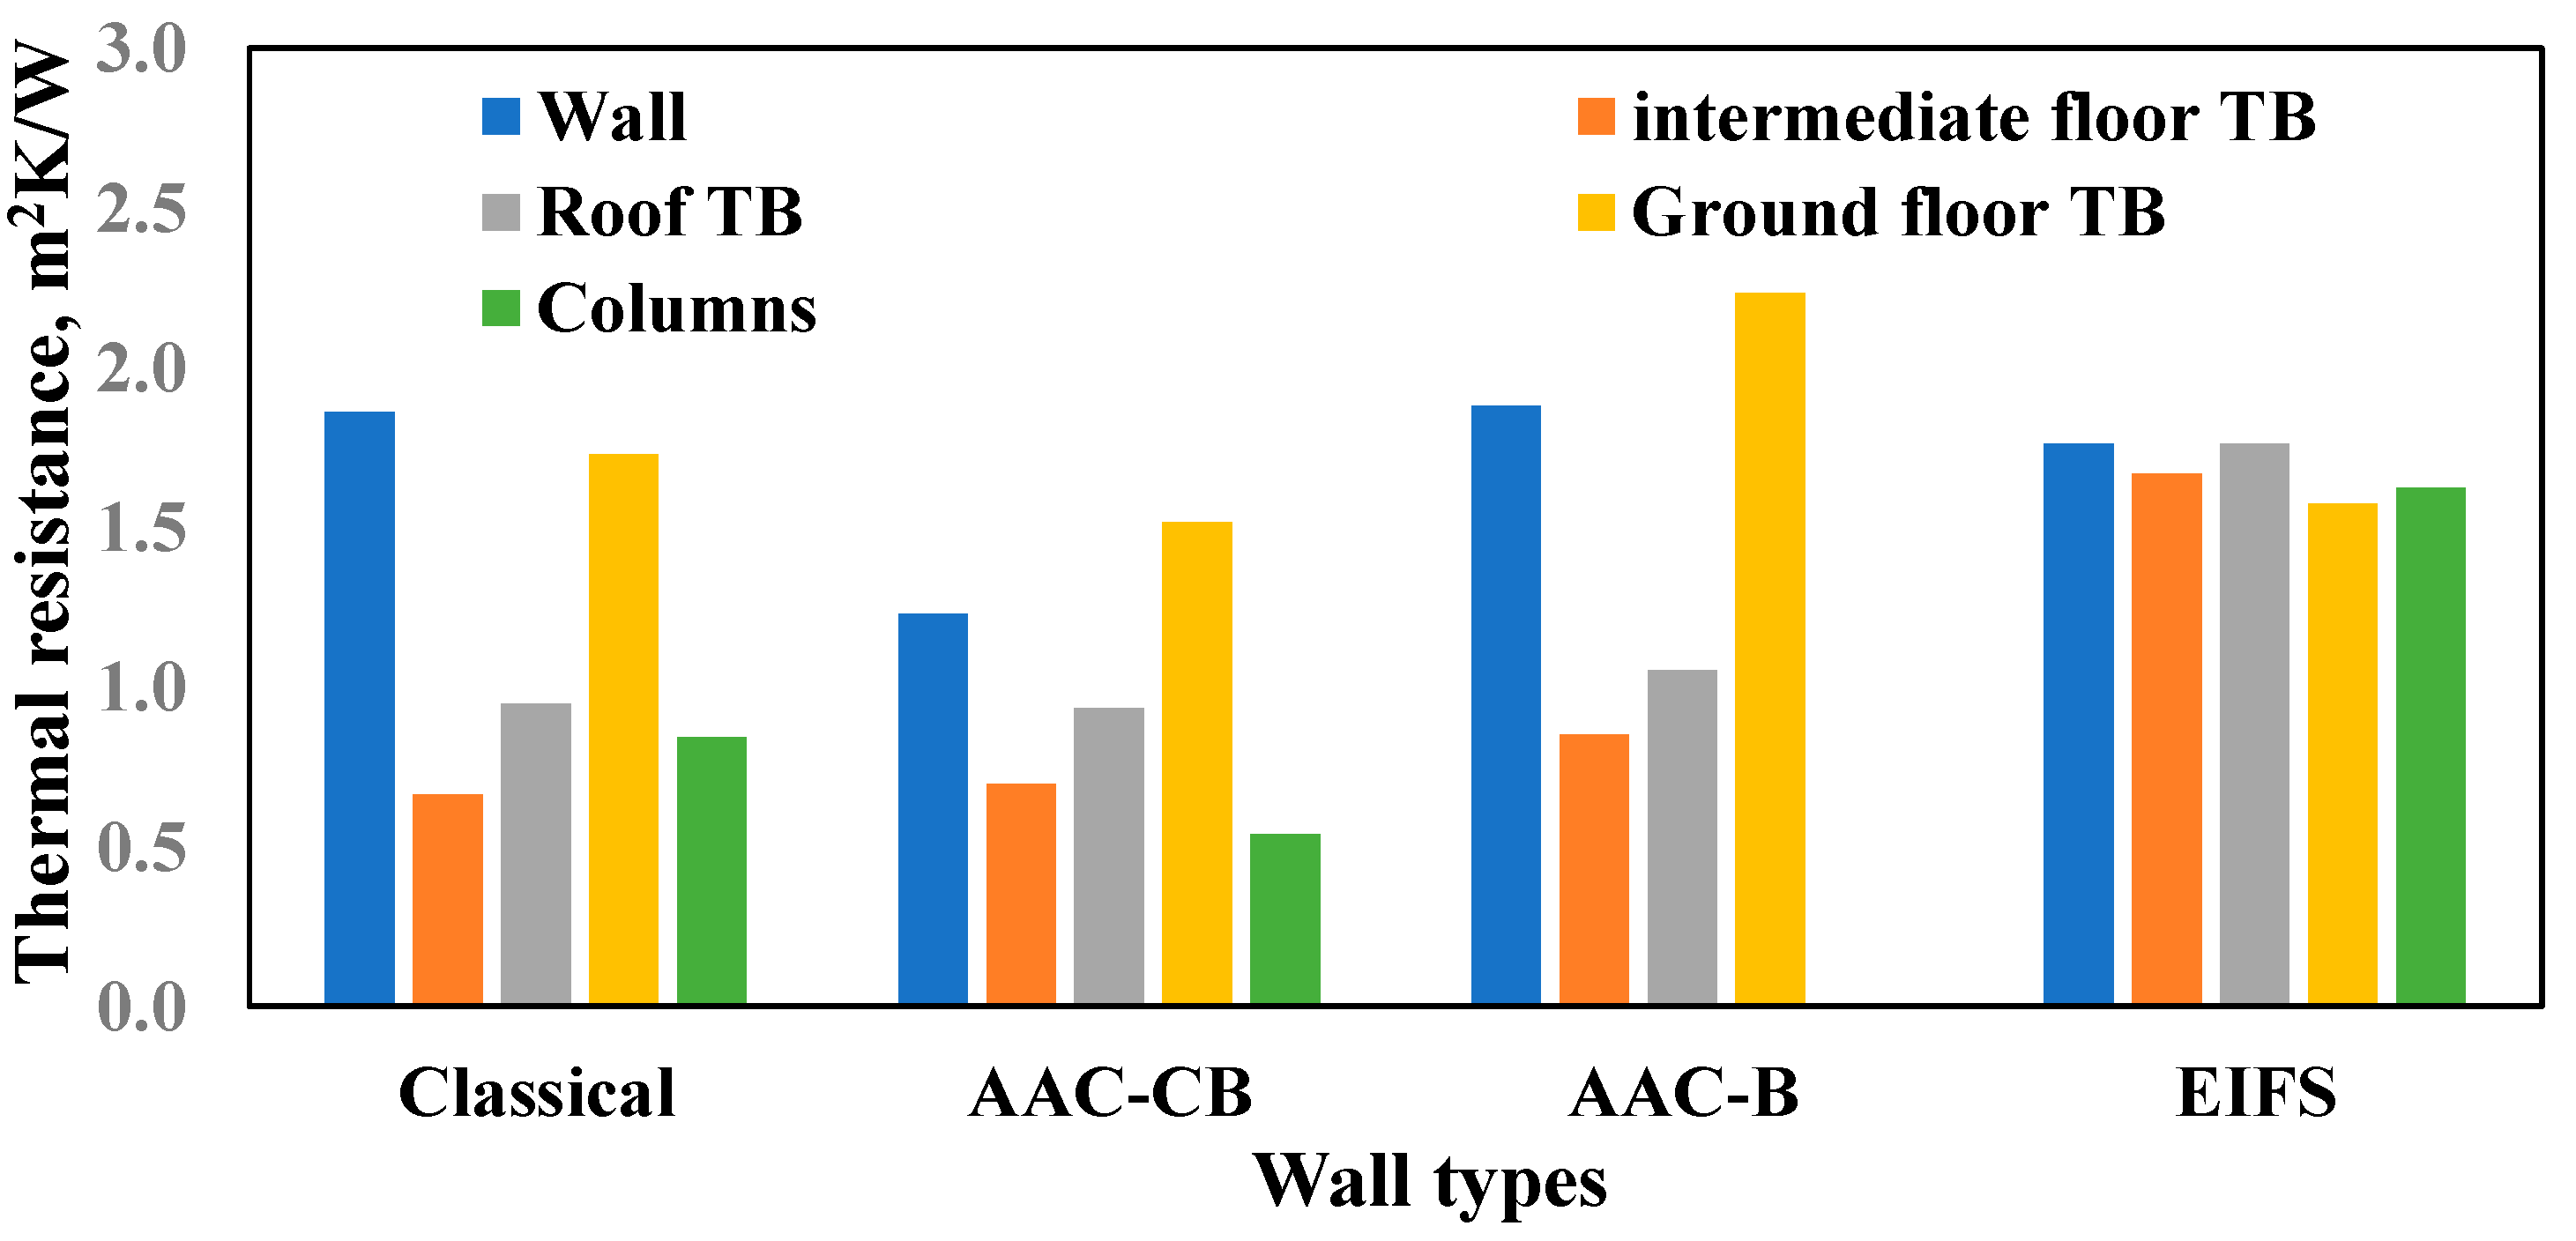
Figure 9 shows the thermal resistances of the tested four wall structures and their thermal bridge resistances. The thermal bridge of the ground floor slab has higher resistance than the AAC-B and AAC-CB walls and lower resistance than the other wall structures. It is observed that the EIFS is the least influenced wall structure by the effect of the various thermal bridges, i.e., the effect of thermal bridges on the EIFS wall is considerably lower than the other tested walls. The presented resistances, in
Figure 9, are implemented in Equations (6)–(11) with their corresponding areas to evaluate the equivalent resistance of the building envelope and the various floors using the tested four wall structures.
Table 6 lists the rate of heat flow per one degree (reciprocal of the total thermal resistance) of the various floors and the building envelope for both tested small room (4 m × 4 m × 4 m) and relatively large building (30 m × 20 m × 4 m). The smaller the value of
Q/Δ
T is the better the characteristics of the building envelope and vice versa. For both the small room and large building, the AAC-B wall structure is the best for the ground floor with a marginal difference from the EIFS wall, whereas the EIFS is the best wall structure for the first and last floors and the whole building. Considerable variations are observed of the resistance between the last floor and the other two floors for all wall structures, particularly for the large building. This is due to the large area of the roof slab relative to the wall area of the last floor of the large building compared to that of the small room. The last line in
Table 6 gives the ratio of
Q/
QEIFS that reveals the superiority of the EIFS wall over the other wall types, particularly the AAC-CB and classical walls. This is confirmed by the fact that the heat transfer through the building envelope made of either AAC-CB, classical, or AAC-B is higher than that made of EIFS by 102, 51, or 14% for the small room and by 73, 36, or 8% for the large building, respectively.
Table 7 provides the resistance per unit area,
Ra (m
2K/W), of the residential building and its three floors for envelopes made of the tested four wall structures. The AAC-CB wall structure provides the lowest performance (smallest resistance) among all the wall types whereas the EIFS achieves the best performance, except for the ground floor where the AAC-B attains slightly better performance. The resistance of the last floor is larger than those of the other floors by 3–48% for the large building and 0–4% for the small one, except for the AAC-B where the resistance of the last floor is lower than those of the other floors in the case of a small building. This is explained by the fact that the roof has the largest resistance among all components and the large building has a larger roof area (600 m
2) than the small building (16 m
2).
The lower section in
Table 7 indicated that the resistances of the classical, AAC-CB, and AAC-B walls are about 0.66, 0.50, and 0.88, respectively, of the resistance of EIFS of the small room. This means that residential houses built using the AAC-CB will have almost double the heat transfer through envelope compared to the buildings of EIFS walls. However, the ratio of the resistance of the large building to that of the small buildings ranges from 1.08 to 1.26, indicating that the size of the building has a quantitative effect on the thermal effectiveness of the building envelope. Nevertheless, the building size has no qualitative effect on the building effectiveness as the order of the wall types is the same for large and small buildings.
In addition,
Table 7 gives the ratio of the building envelope resistance to the wall resistance for the four wall structures. It is clear that the ratio of the envelope resistance to the wall resistance of the EIFS is less than 1% for the small room and 1.07 for the large building. The greater ratio of the resistance of the large building is attributed to the effect of the large roof area, which has the largest thermal resistance.
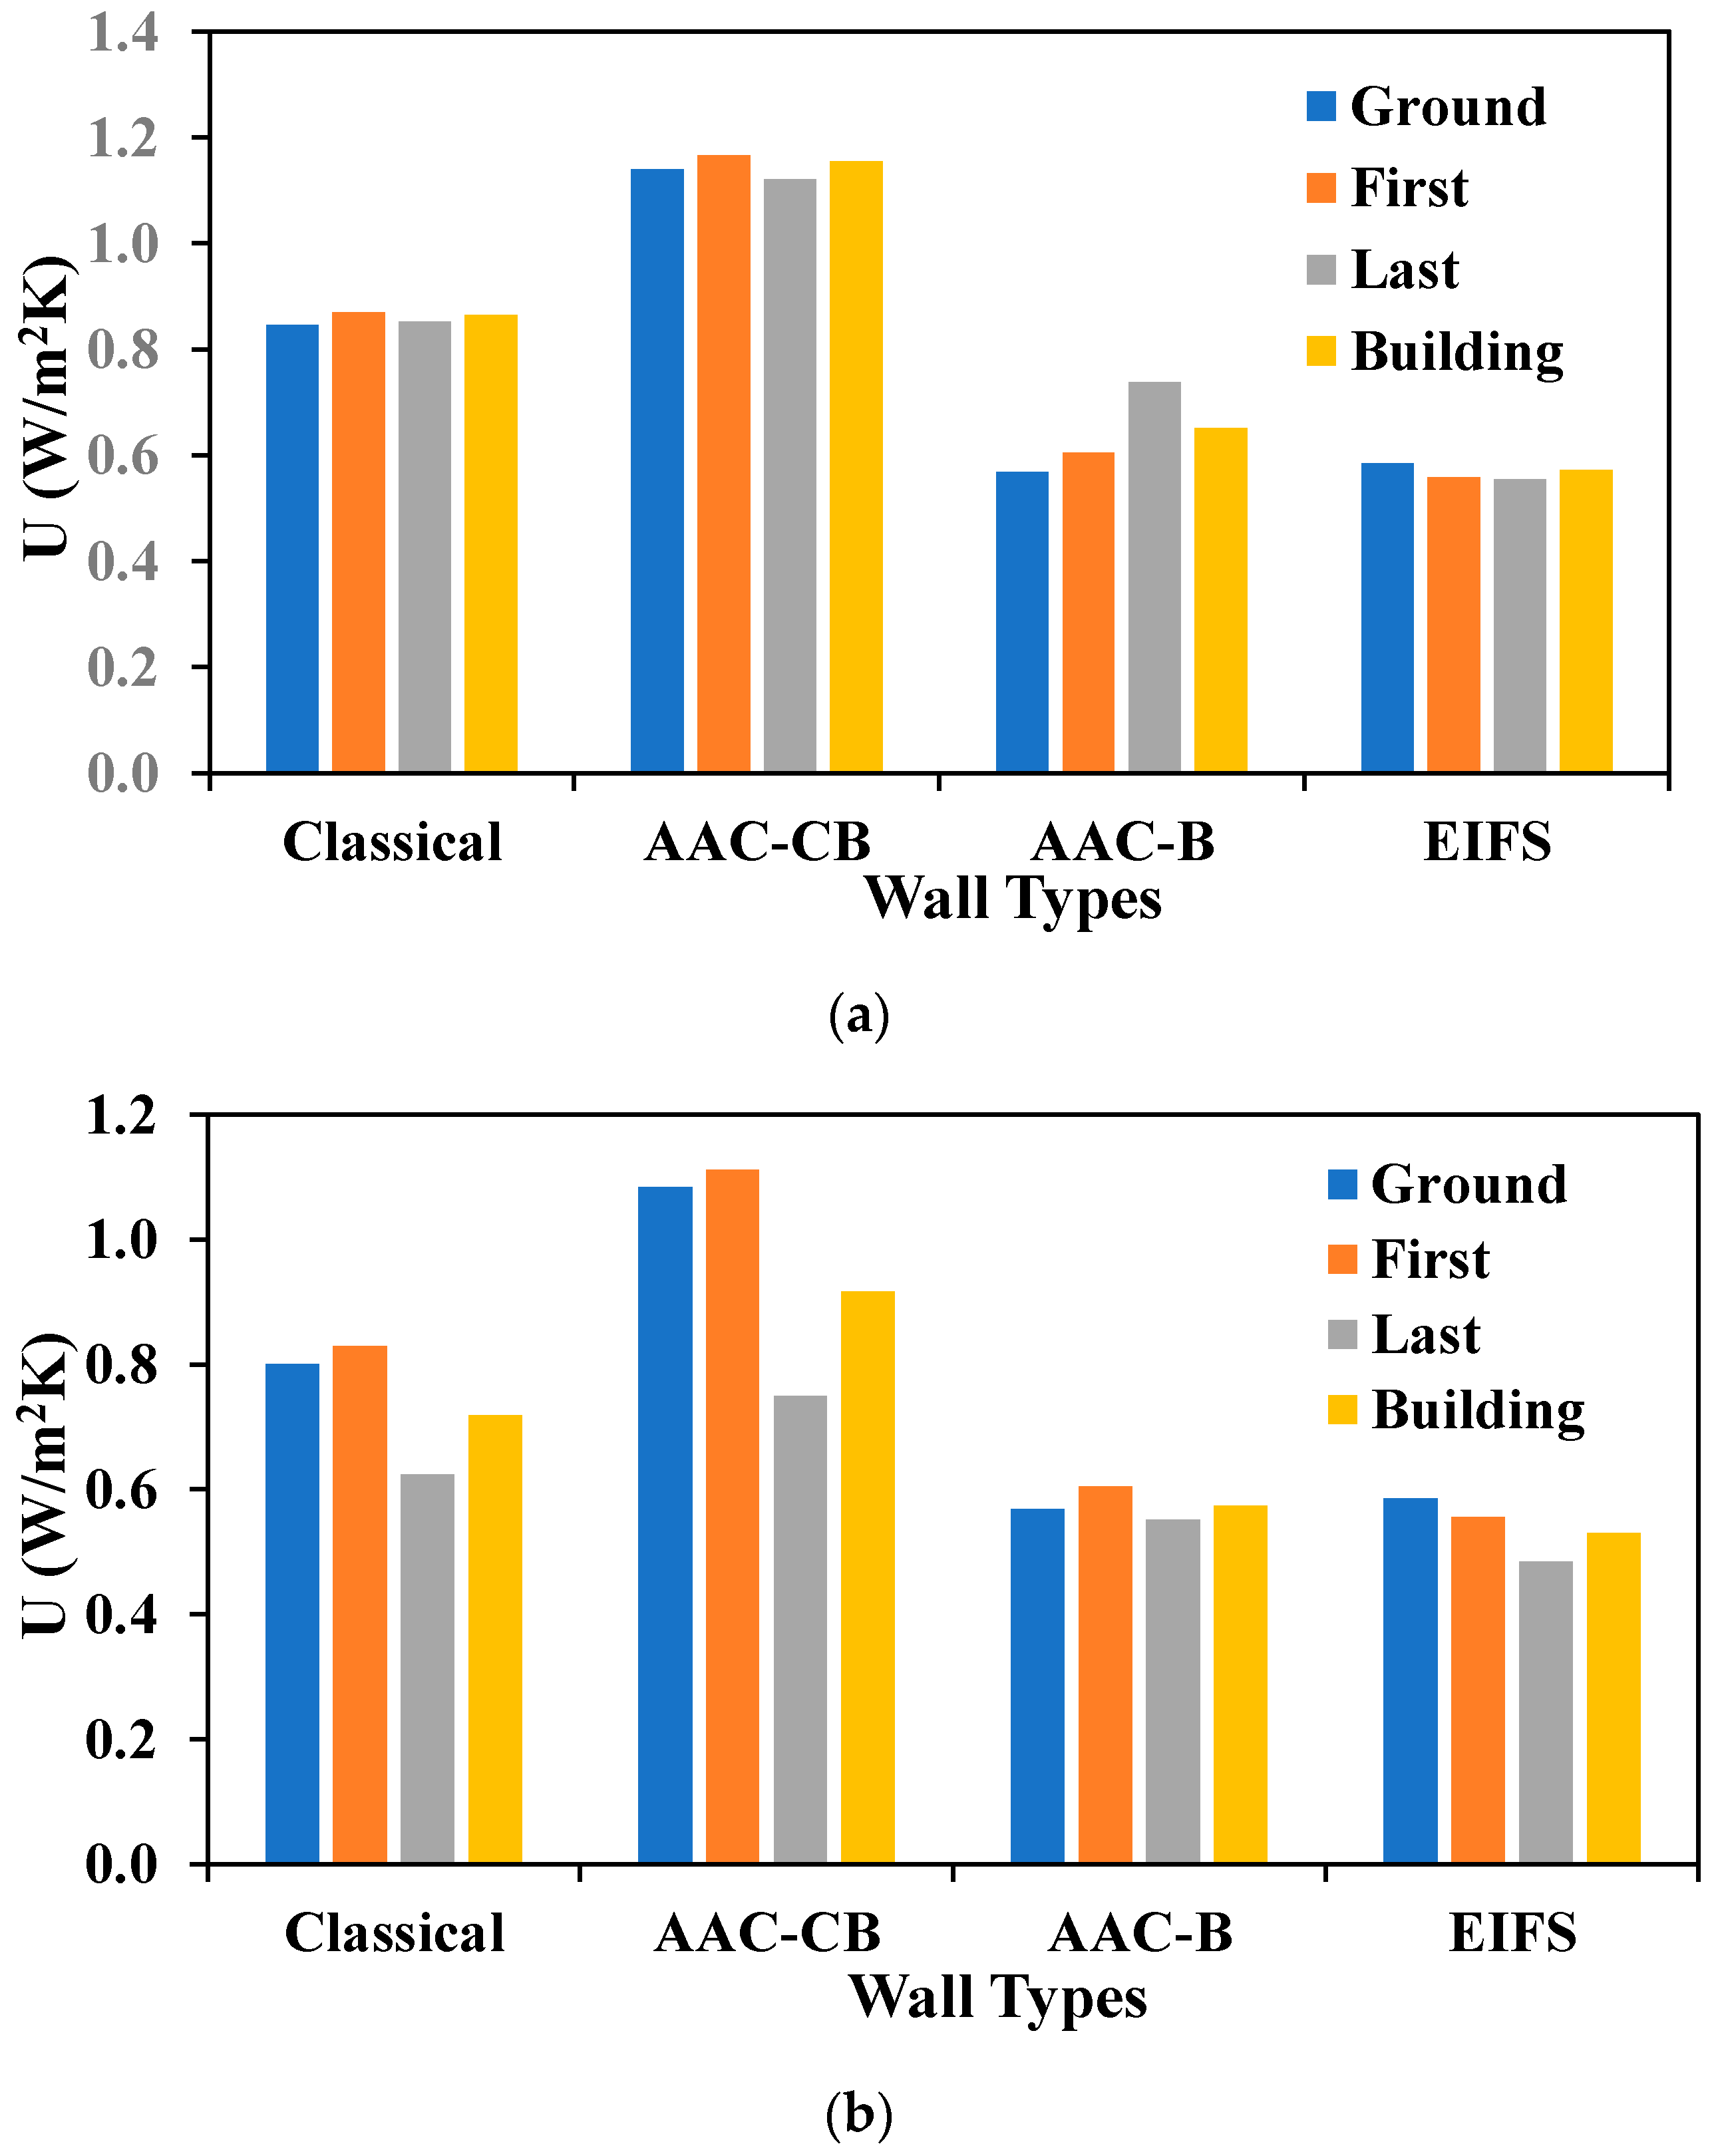
Figure 10a,b show the overall heat transfer coefficient of the various building structures for the small room and large building, respectively. It ranges from 0.53 W/m
2K for the large building to 0.57 W/m
2K for the small room with an average value of 0.55 W/m
2K, for the EIFS residential building envelope. The average overall heat transfer coefficients of AAC-B, classical, and AAC-CB building envelopes are 0.613, 0.792, and 1.036 W/m
2K, respectively, with an average increase of 11.5, 44.0, and 88.4% compared to that of the EIFS envelope. This reflects the heat gain/loss increase to/from the residential buildings made of the three listed wall types relative to that made of the EIFS. Therefore, the EIFS wall is the best type recommended for the effective envelope of residential buildings.
In addition, the effect of wall types is extended to include high-rise buildings by evaluating their overall heat transfer coefficients.
Table 8 lists the overall heat transfer coefficients for buildings with 1, 10, 20, 30, 40, and 50 intermediate floors for the three types of the wall structure. It is to be noted that the AAC-B structure is not suitable for high-rise buildings as it does not contain columns for supporting such buildings. The superiority of the EIFS structure is further confirmed for high-rise buildings as the ratio of
U/
UEIFS increases from 1.36 to 1.48 for classical and from 1.73 to 1.98 for AAC-CB as the number of intermediate floors increases from 1 to 50.
Based on the reported results, the building envelope made using AAC-CB has the lowest performance among the tested wall structures. At the same time, the AAC-CB is a common practice in many countries of hot climates. The present results showed great concern about that wall type and urge hot climate countries to review their common practice wall structure and replace the AAC-CB with the EIFS wall or at least modify it by adding an external insulation layer covered with suitable cladding material. The return of this replacement will be beneficial on the individual and national levels in terms of energy and environment.
4. Conclusions and Future Work
The effect of wall type on the thermal performance of building envelope in a hot climate is investigated considering the walls, foundation, roof, thermal bridges between columns and walls, and at the junctions between walls and slabs of the ground floor, roof, and intermediate floors. Four wall types that are used in hot climates, namely, classical, autoclaved aerated concrete bearing (AAC-B), AAC column and beam (AAC-CB), and exterior insulation and finish system (EIFS) are tested. Based on the reported results, the following conclusions may be drawn:
The inner heat flux of the thermal bridge using EIFS is lower than that using AAC-CB, classical, and AAC-B walls by 60.2, 58.1, and 49.0%, respectively, for the thermal bridge of the intermediate floors, by 40.1–47.0% for the thermal bridge of the roof, and 30–50% for the thermal bridge of the reinforced concrete column.
The maximum temperatures of classical, AAC-CB, AAC-B, and EIFS thermal bridges of the intermediate floors are damped from 48 °C for the outdoor air temperature to 28.9, 27.2, 26.4, and 25.4 °C while the temperature amplitude is reduced from 19.57 °C to 2.46, 1.92, 1.12, and 0.91 °C, respectively. In addition, the maximum temperature is damped by 21.4–22.6 °C for the thermal bridges of the roof.
The building envelope made of EIFS is the least affected building envelope by the thermal bridges as the ratio of the envelope thermal resistance to its wall resistance is 0.748, 0.887, 0.926, and 1.073 for classical, AAC-CB, AAC-B, and EIFS, respectively. Thus, the thermal bridges have a significant effect on the building envelopes made of classical and AAC-CB walls compared to those made of AAC-B and EIFS walls.
Although the AAC-CB is a common external building structure in hot climates, it has the lowest performance among the tested wall structures. Thus, there is great concern about the AAC-CB wall type and hot climate countries are encouraged to replace the AAC-CB with the EIFS wall or modify it by an external insulation layer with a suitable cladding layer. This replacement will be beneficial on the individual and national levels in terms of energy and environment as the heat exchange with the environment will be reduced by about 51%.
The average overall heat transfer coefficients of EIFS, AAC-B, classical, and AAC-CB building envelopes are 0.55, 0.613, 0.792, and 1.036 W/m2K, respectively. Thus, the average increase of the last three building envelopes over the EIFS envelope is 11.5, 44.0, and 88.4%, respectively.
The uninterrupted insulation at the exterior layer of the wall that covers both wall and concrete slabs attains an effective building envelope and prevents a considerable amount of heat loss that bypasses the discontinuous insulation layer elsewhere. The thermal bridge with external insulation of 5cm provides inside heat flux and heat flux amplitude lower than the same thermal bridge with an internal insulation layer of the same thickness by about 66 and 62%, respectively.
The EIFS wall provides an efficient building envelope that reduces the heat exchange with the outdoor environment for residential buildings by 101.8, 51.2, and 13.9% than the AAC-CB, AAC-B, and classical walls, respectively.
The overall heat transfer coefficient for a small building is larger than that for a large building by 8, 13.5, 20.4, and 26% for the EIFS, AAC-B, classical, and AAC-CB walls, respectively.
As the number of intermediate floors increases from 1 to 50, the overall heat transfer coefficient of the building envelope increases by 4.5, 14.1, and 19.5% for the EIFS, classical, and AAC-CB walls, respectively.
The present work focuses on the thermal performance of the building envelopes using four different wall types, considering the total thermal resistance and the overall heat transfer coefficient. However, the effect of the building envelopes on the cooling load and energy consumption needs to be investigated. This can provide a quantitative effect of the wall types on the energy consumption on residential sector and national levels.


