
Development of a BIM and IoT-Based Smart Lighting Maintenance System Prototype for Universities’ FM Sector

 , ,
, ,
Abstract
:1. Introduction
- How can technical and functional requirements and strategies for prototyping be established?
- How can BIM FM requirements be established and IoT devices and tools integrated, generating an effective smart-maintenance system?
- How can intelligence be generated from real-time data supporting maintenance decision-making?
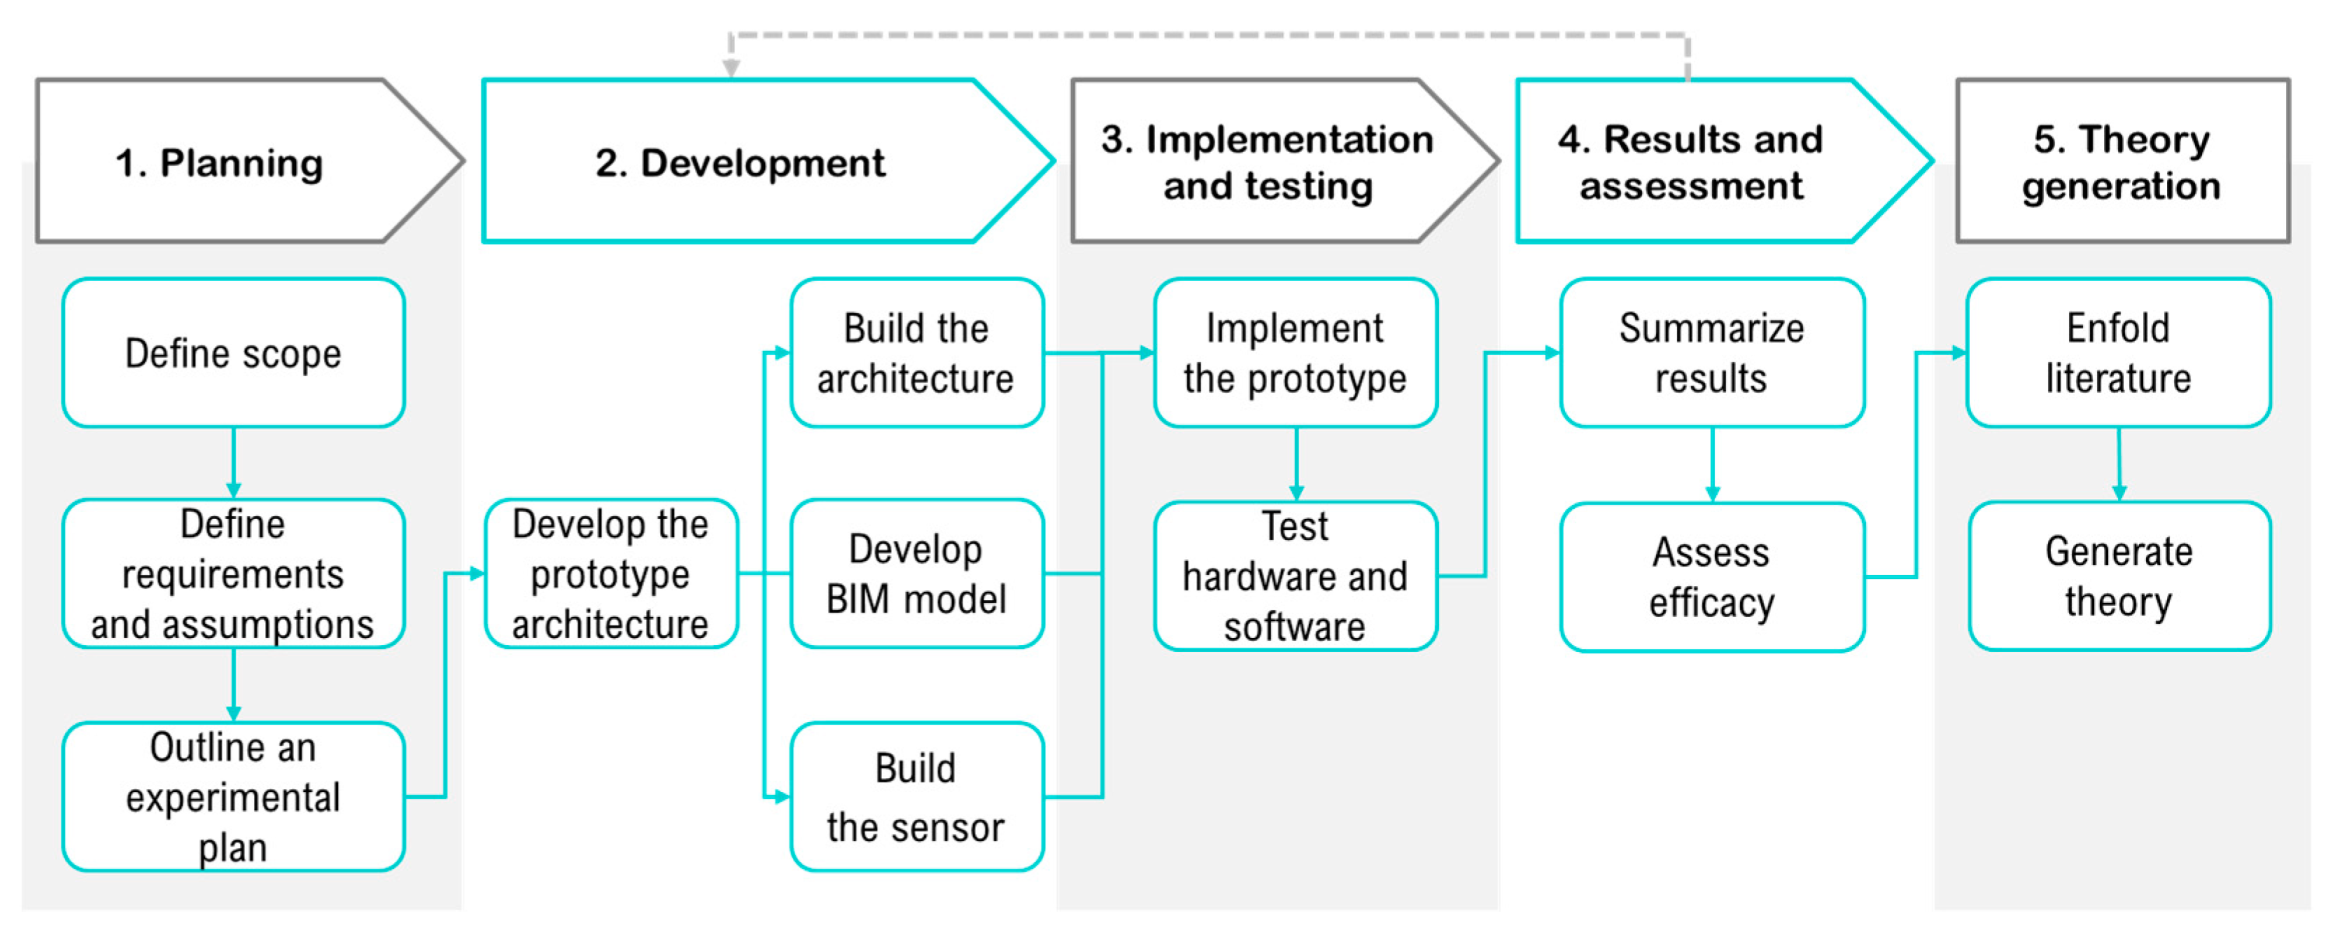
2. Materials and Methods
2.1. Planning
2.1.1. Definition of the Scope
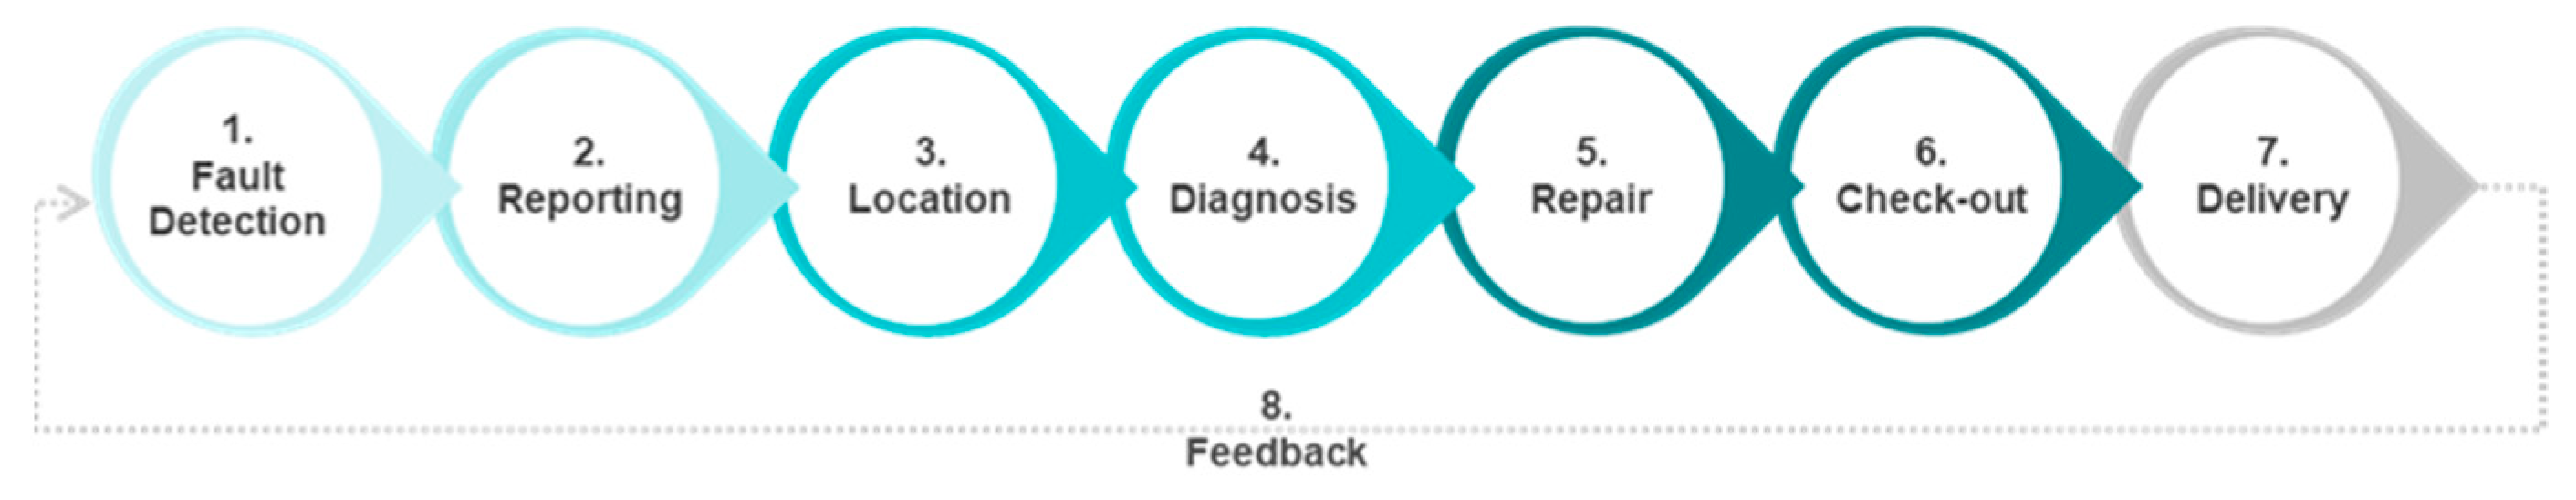
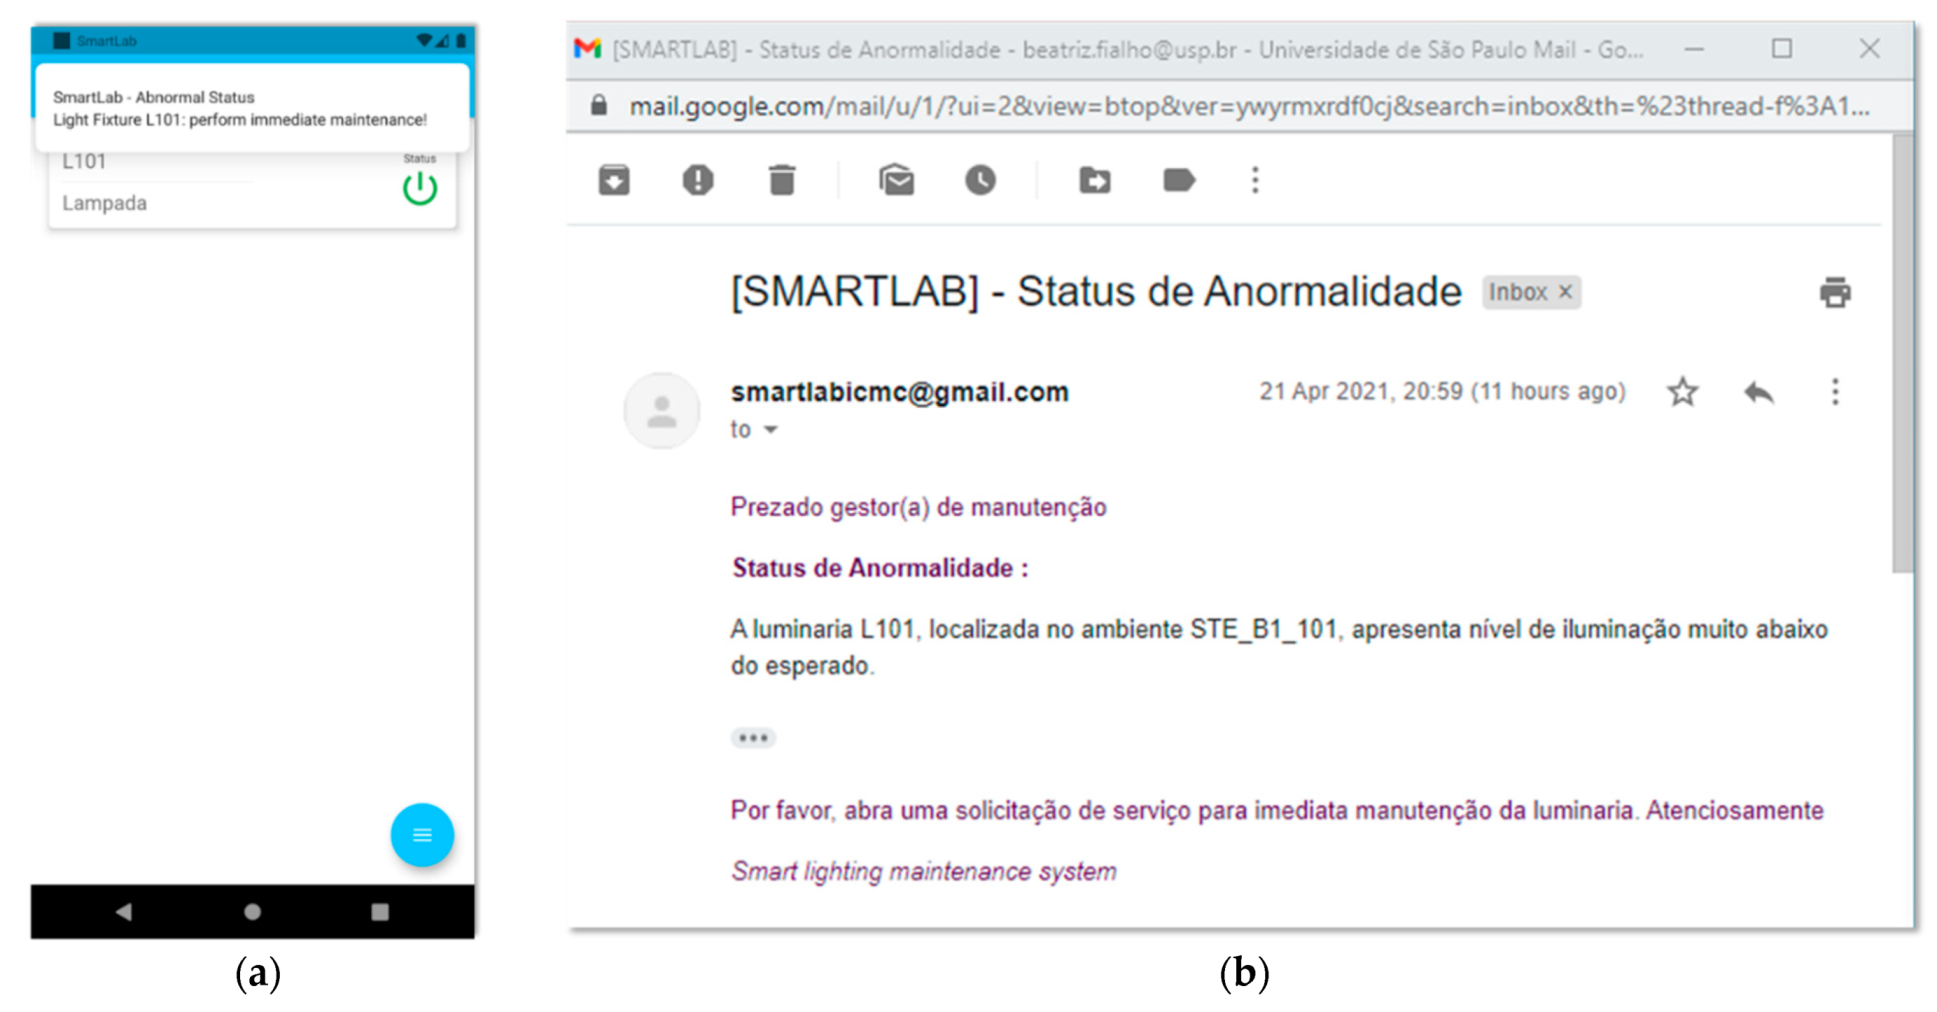
- Automatically detect and report current and developing abnormalities by generating notification messages triggering maintenance service response.
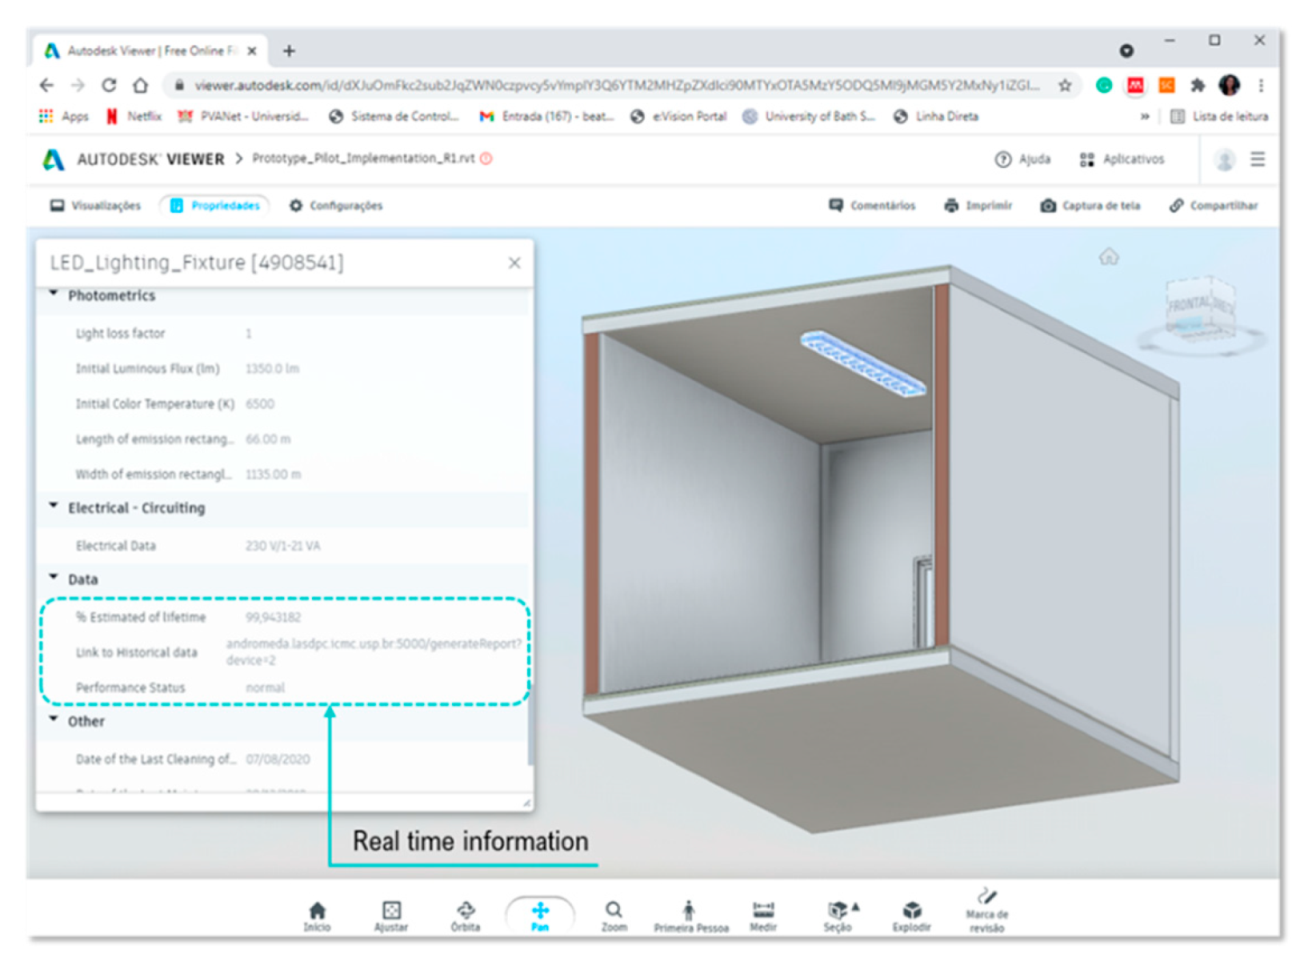
- Automatically populate real-time information from the sensor’s lighting central database into the SmartLab app and the BIM model parameters.
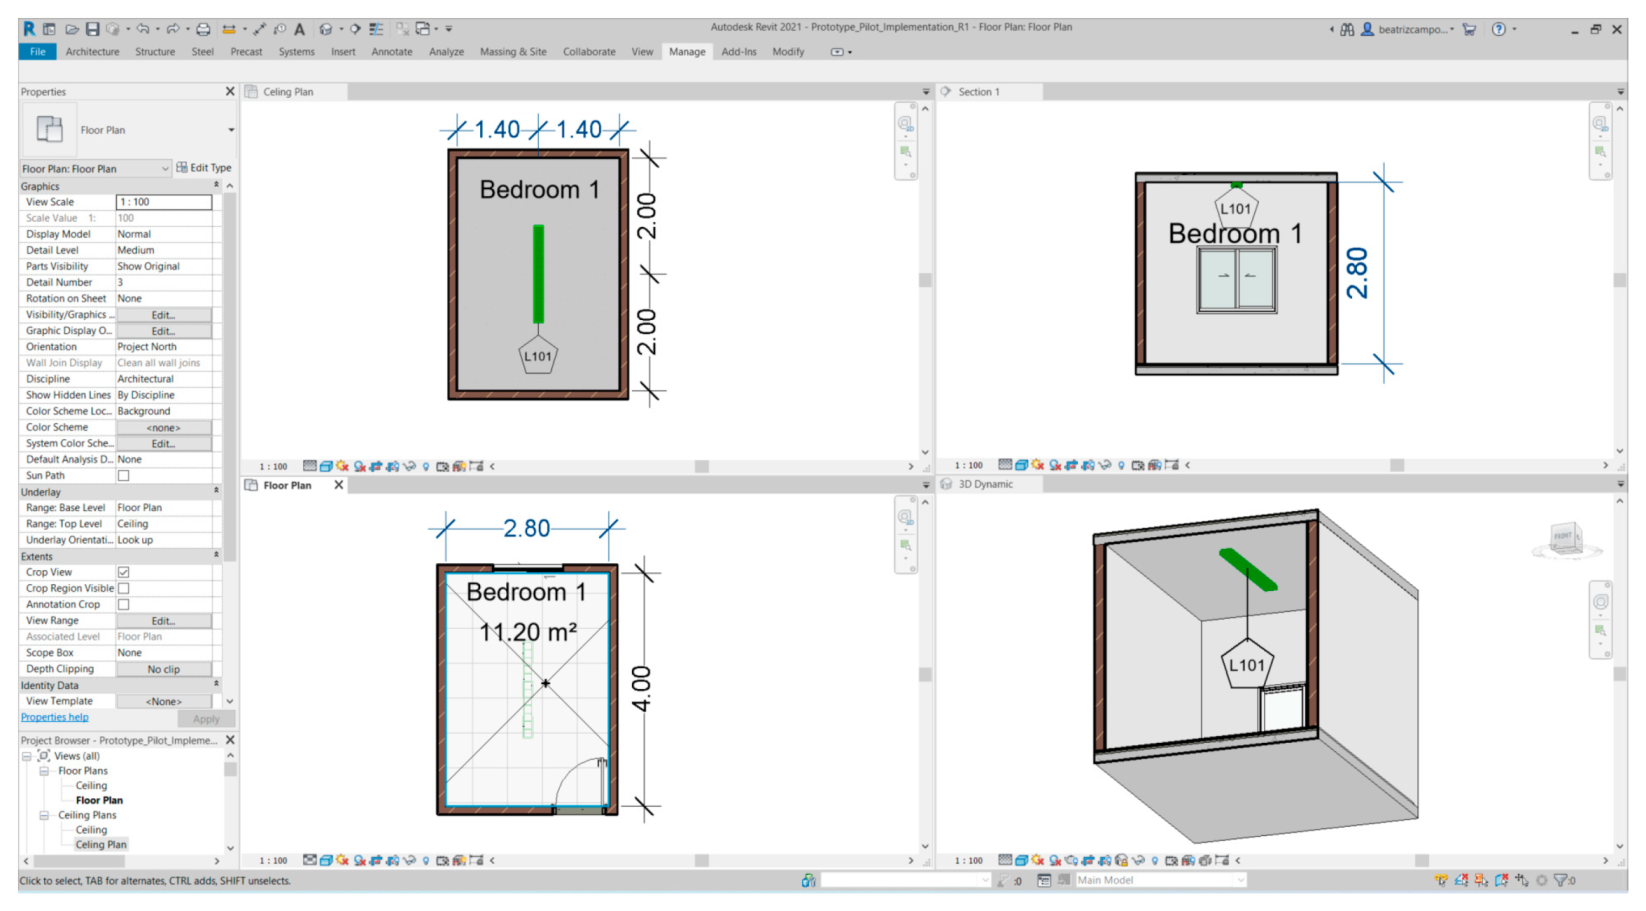
- Visualise updated lighting information on BIM and IoT interfaces.
2.1.2. Establishment of Technical and Functional Requirements and Assumptions for Development
2.1.3. Establishment of FM BIM Data Requirements
2.1.4. Outlining the Experimental Plan
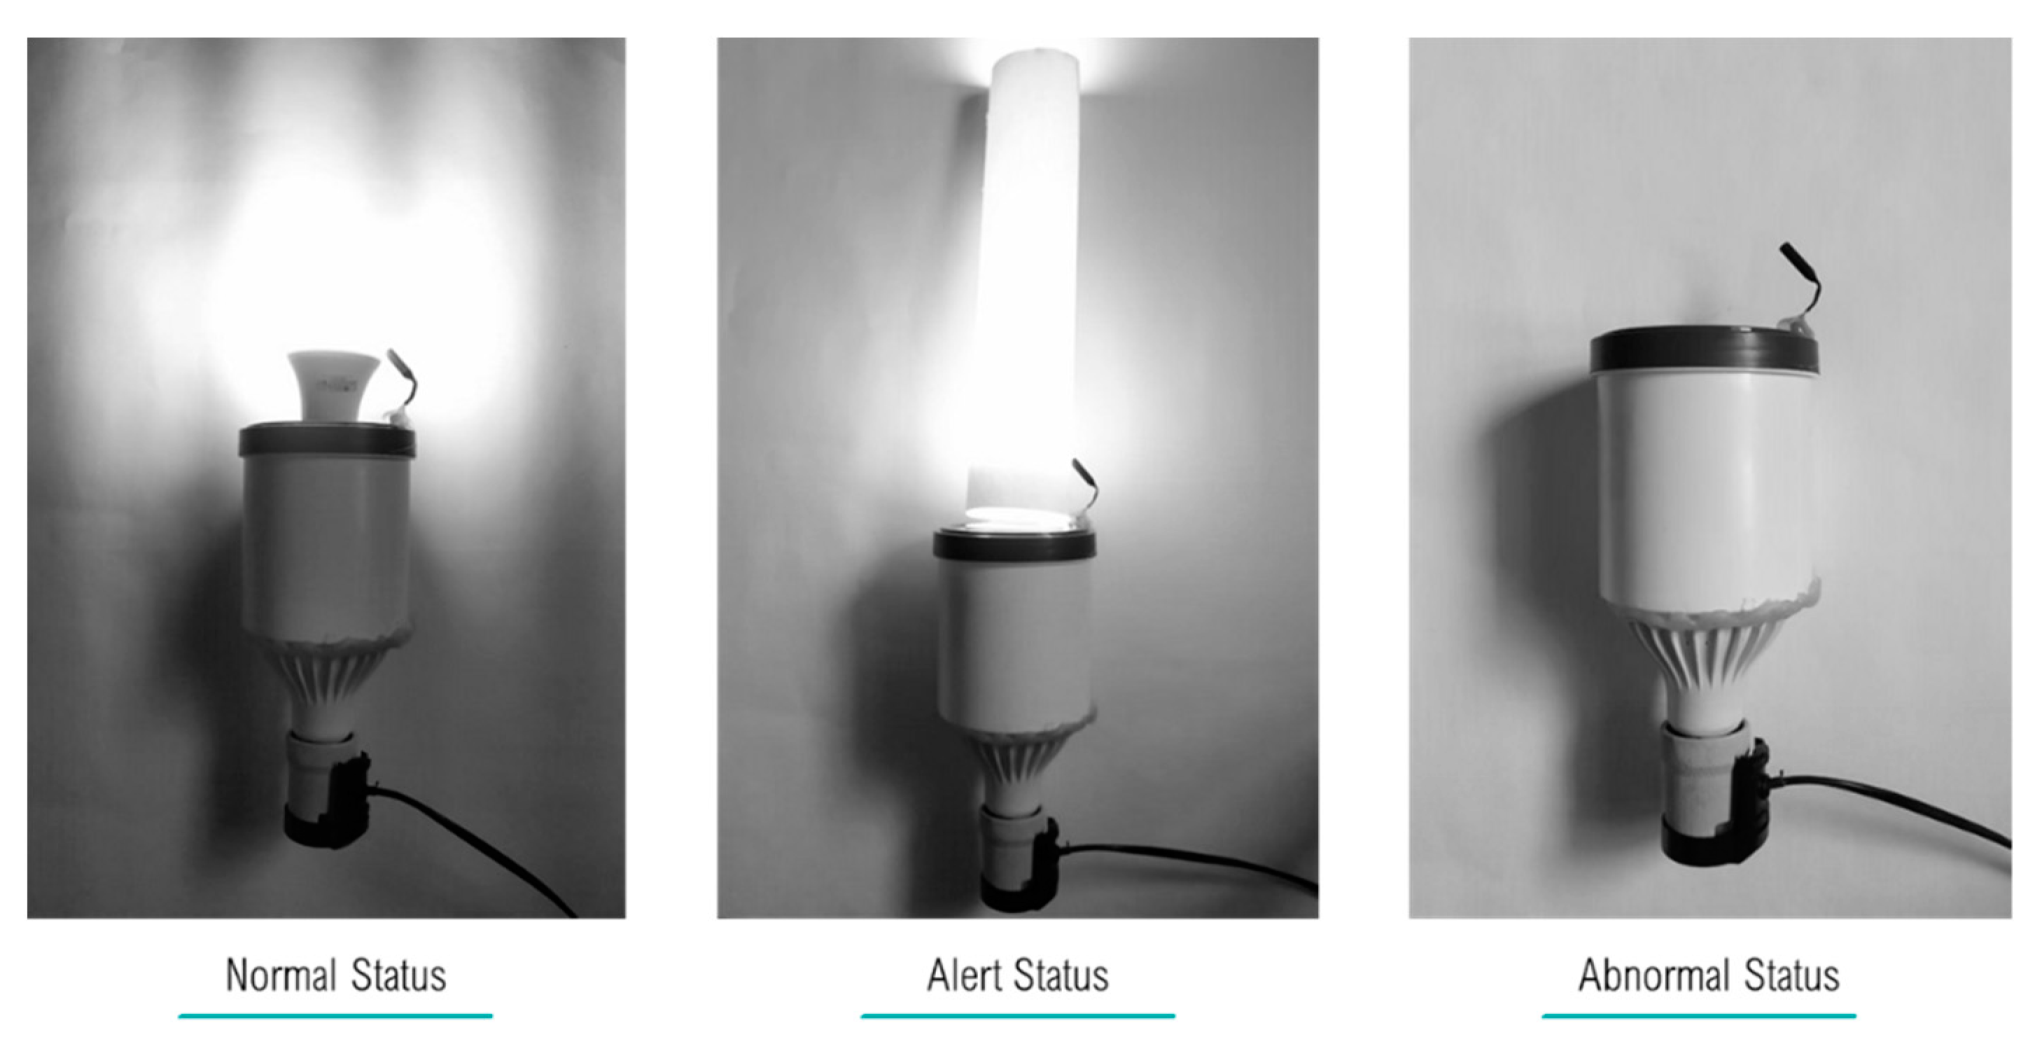
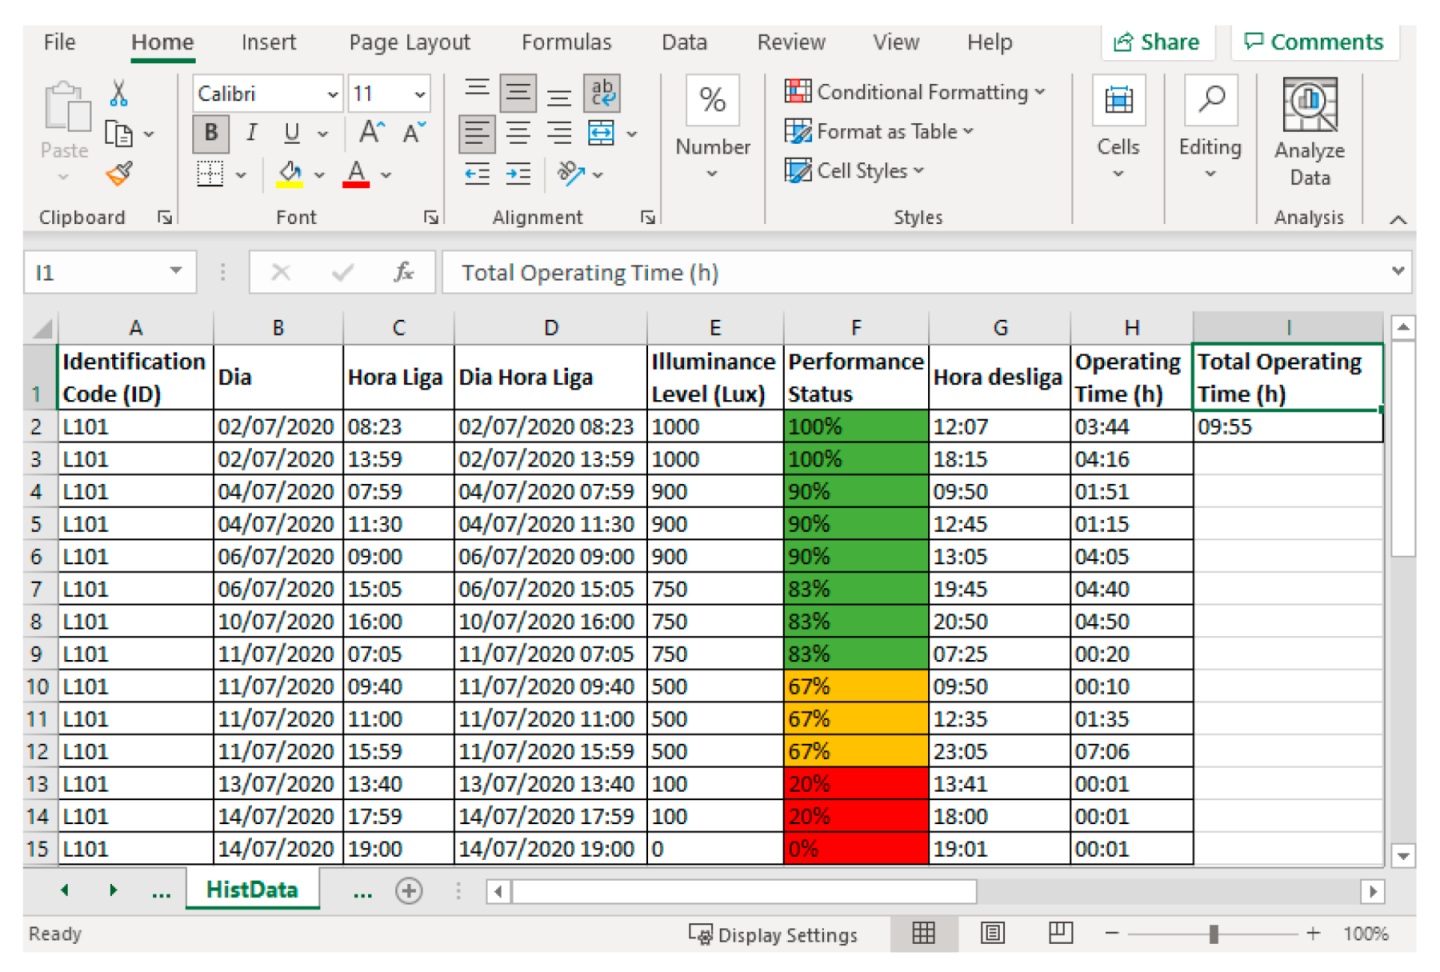
- Normal status: corresponds to lighting levels greater than or equal to 70% of the initial value;
- Alert status: corresponds to lighting levels greater or equal to 50% and less than 70% of the initial value;
- Abnormal status: corresponds to lighting levels less than 50% of the initial value.
2.2. Development
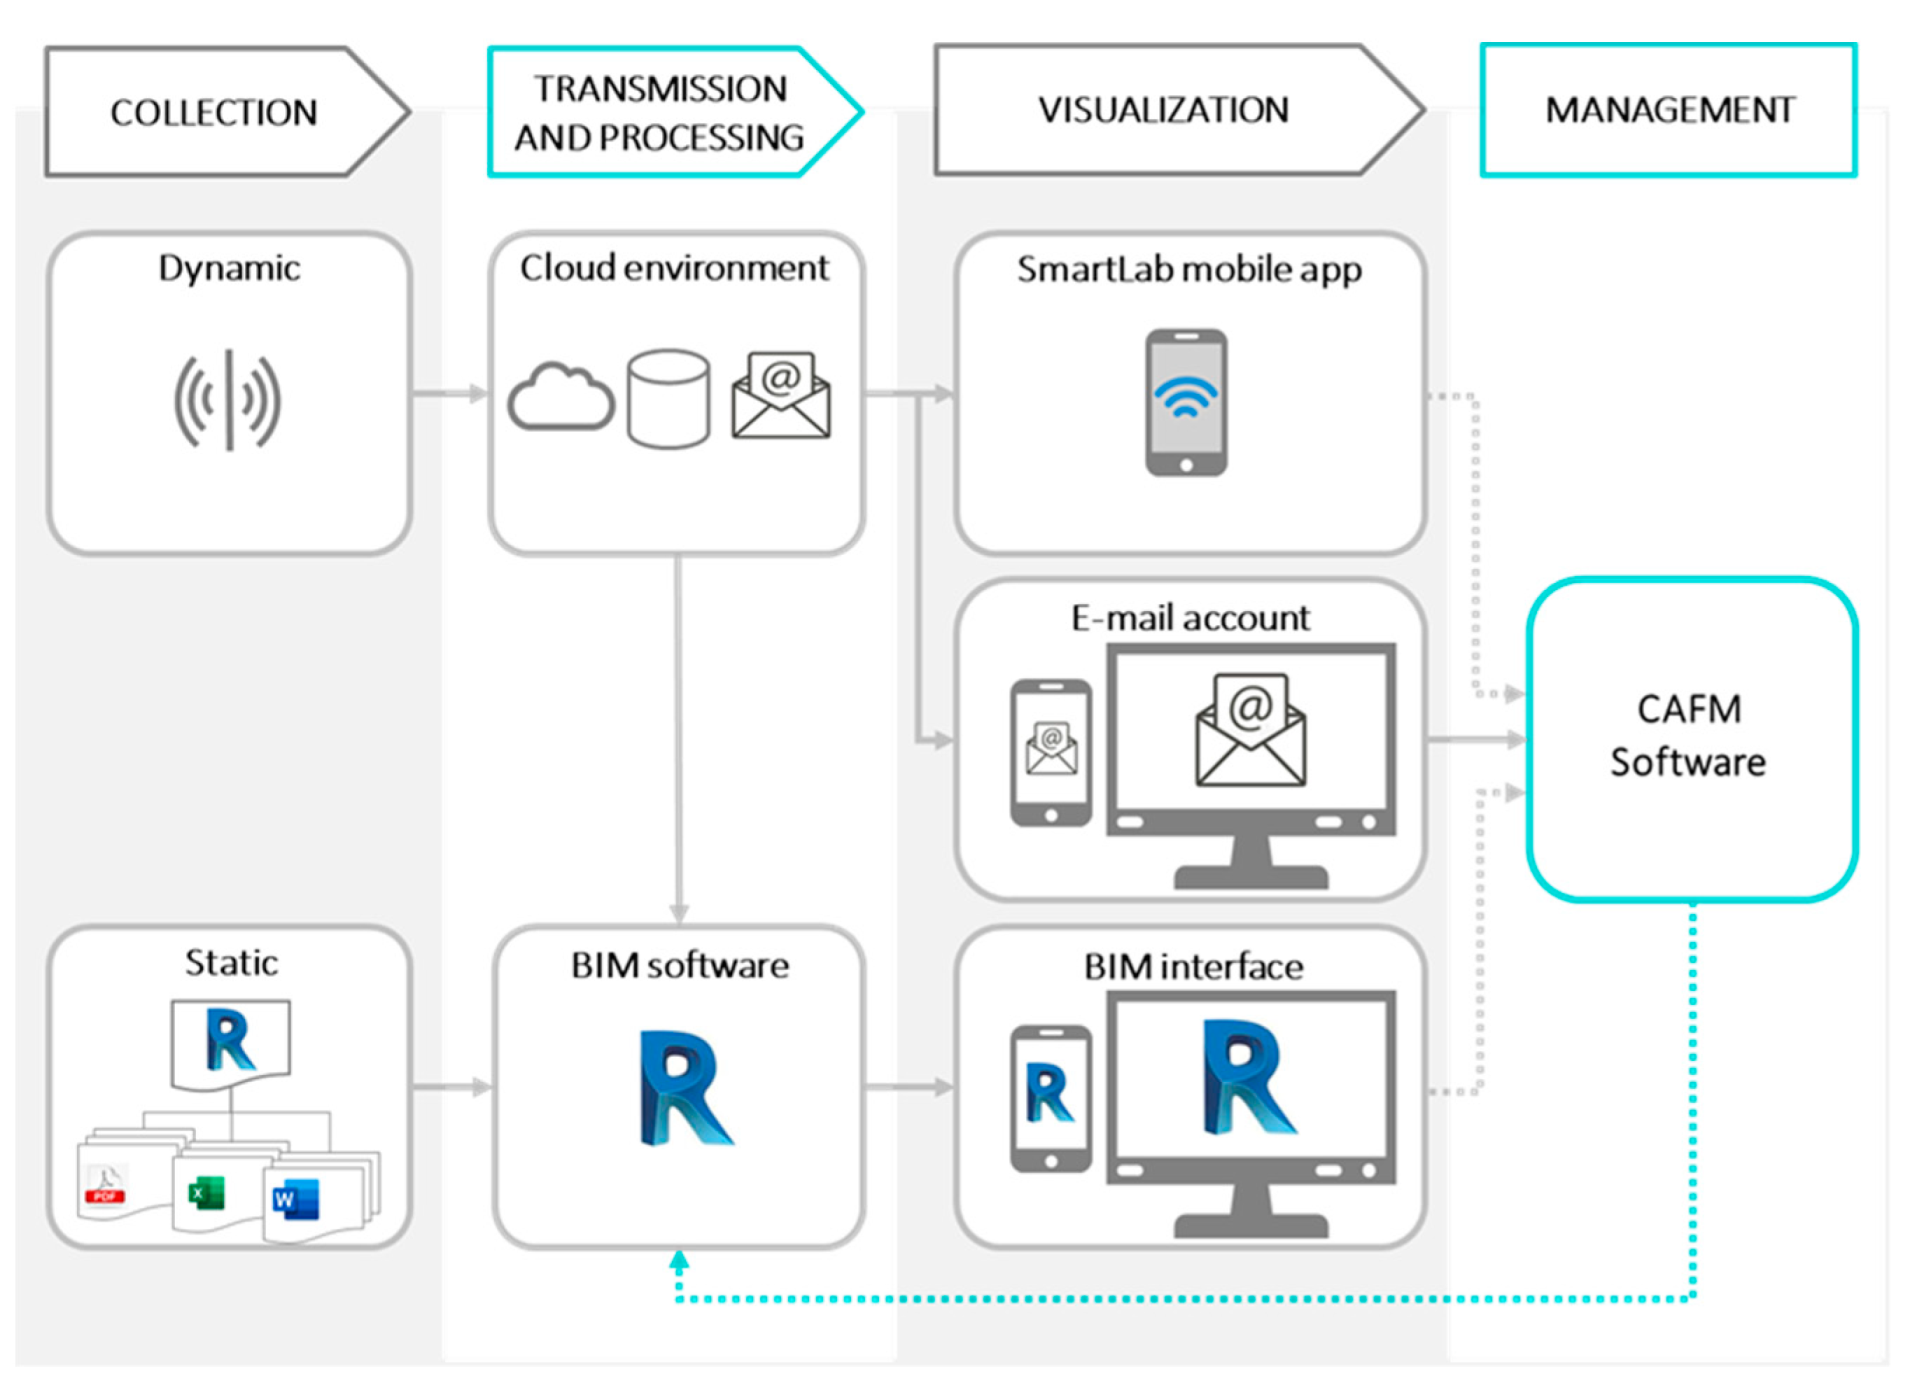
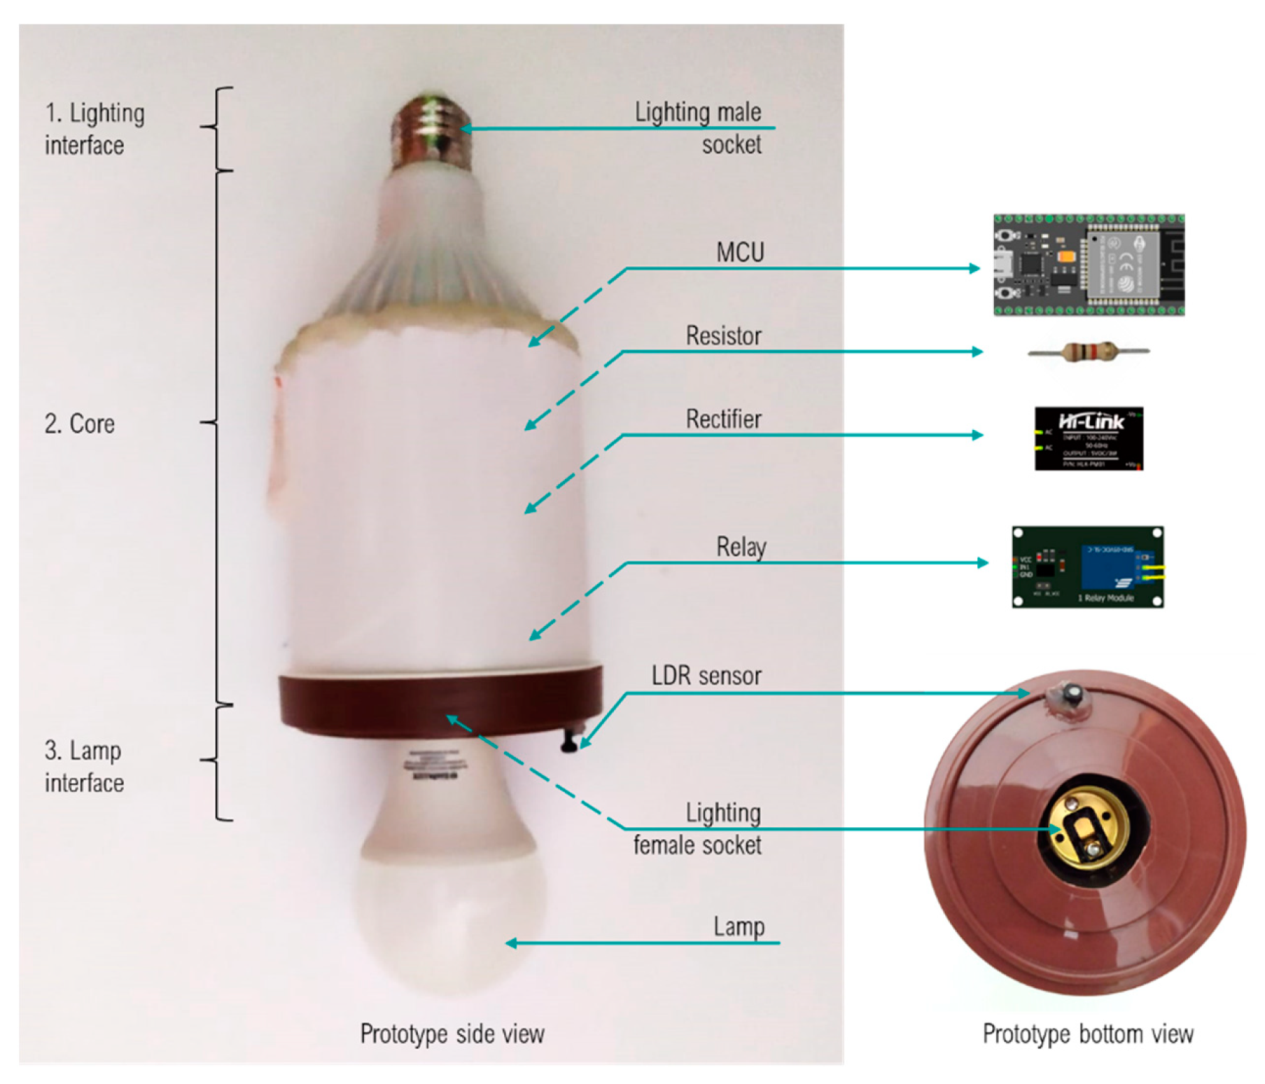
2.2.1. Data Collection
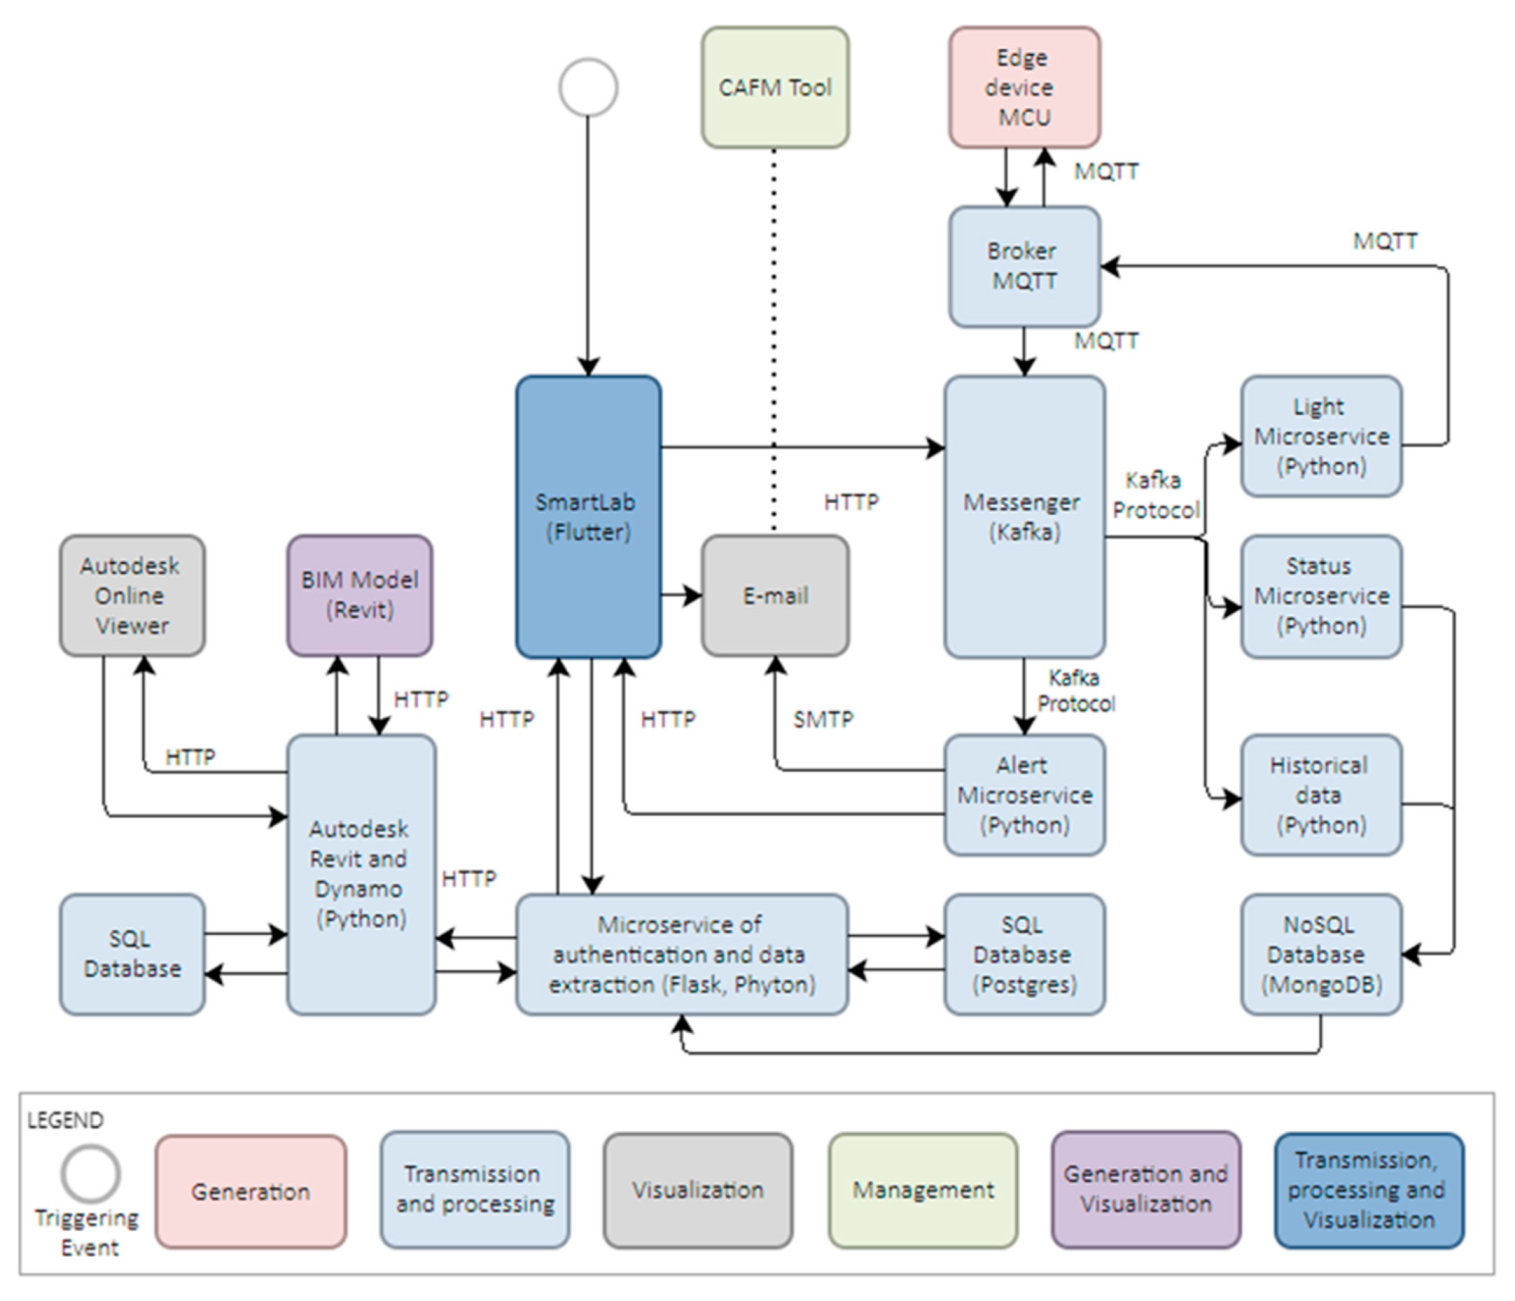
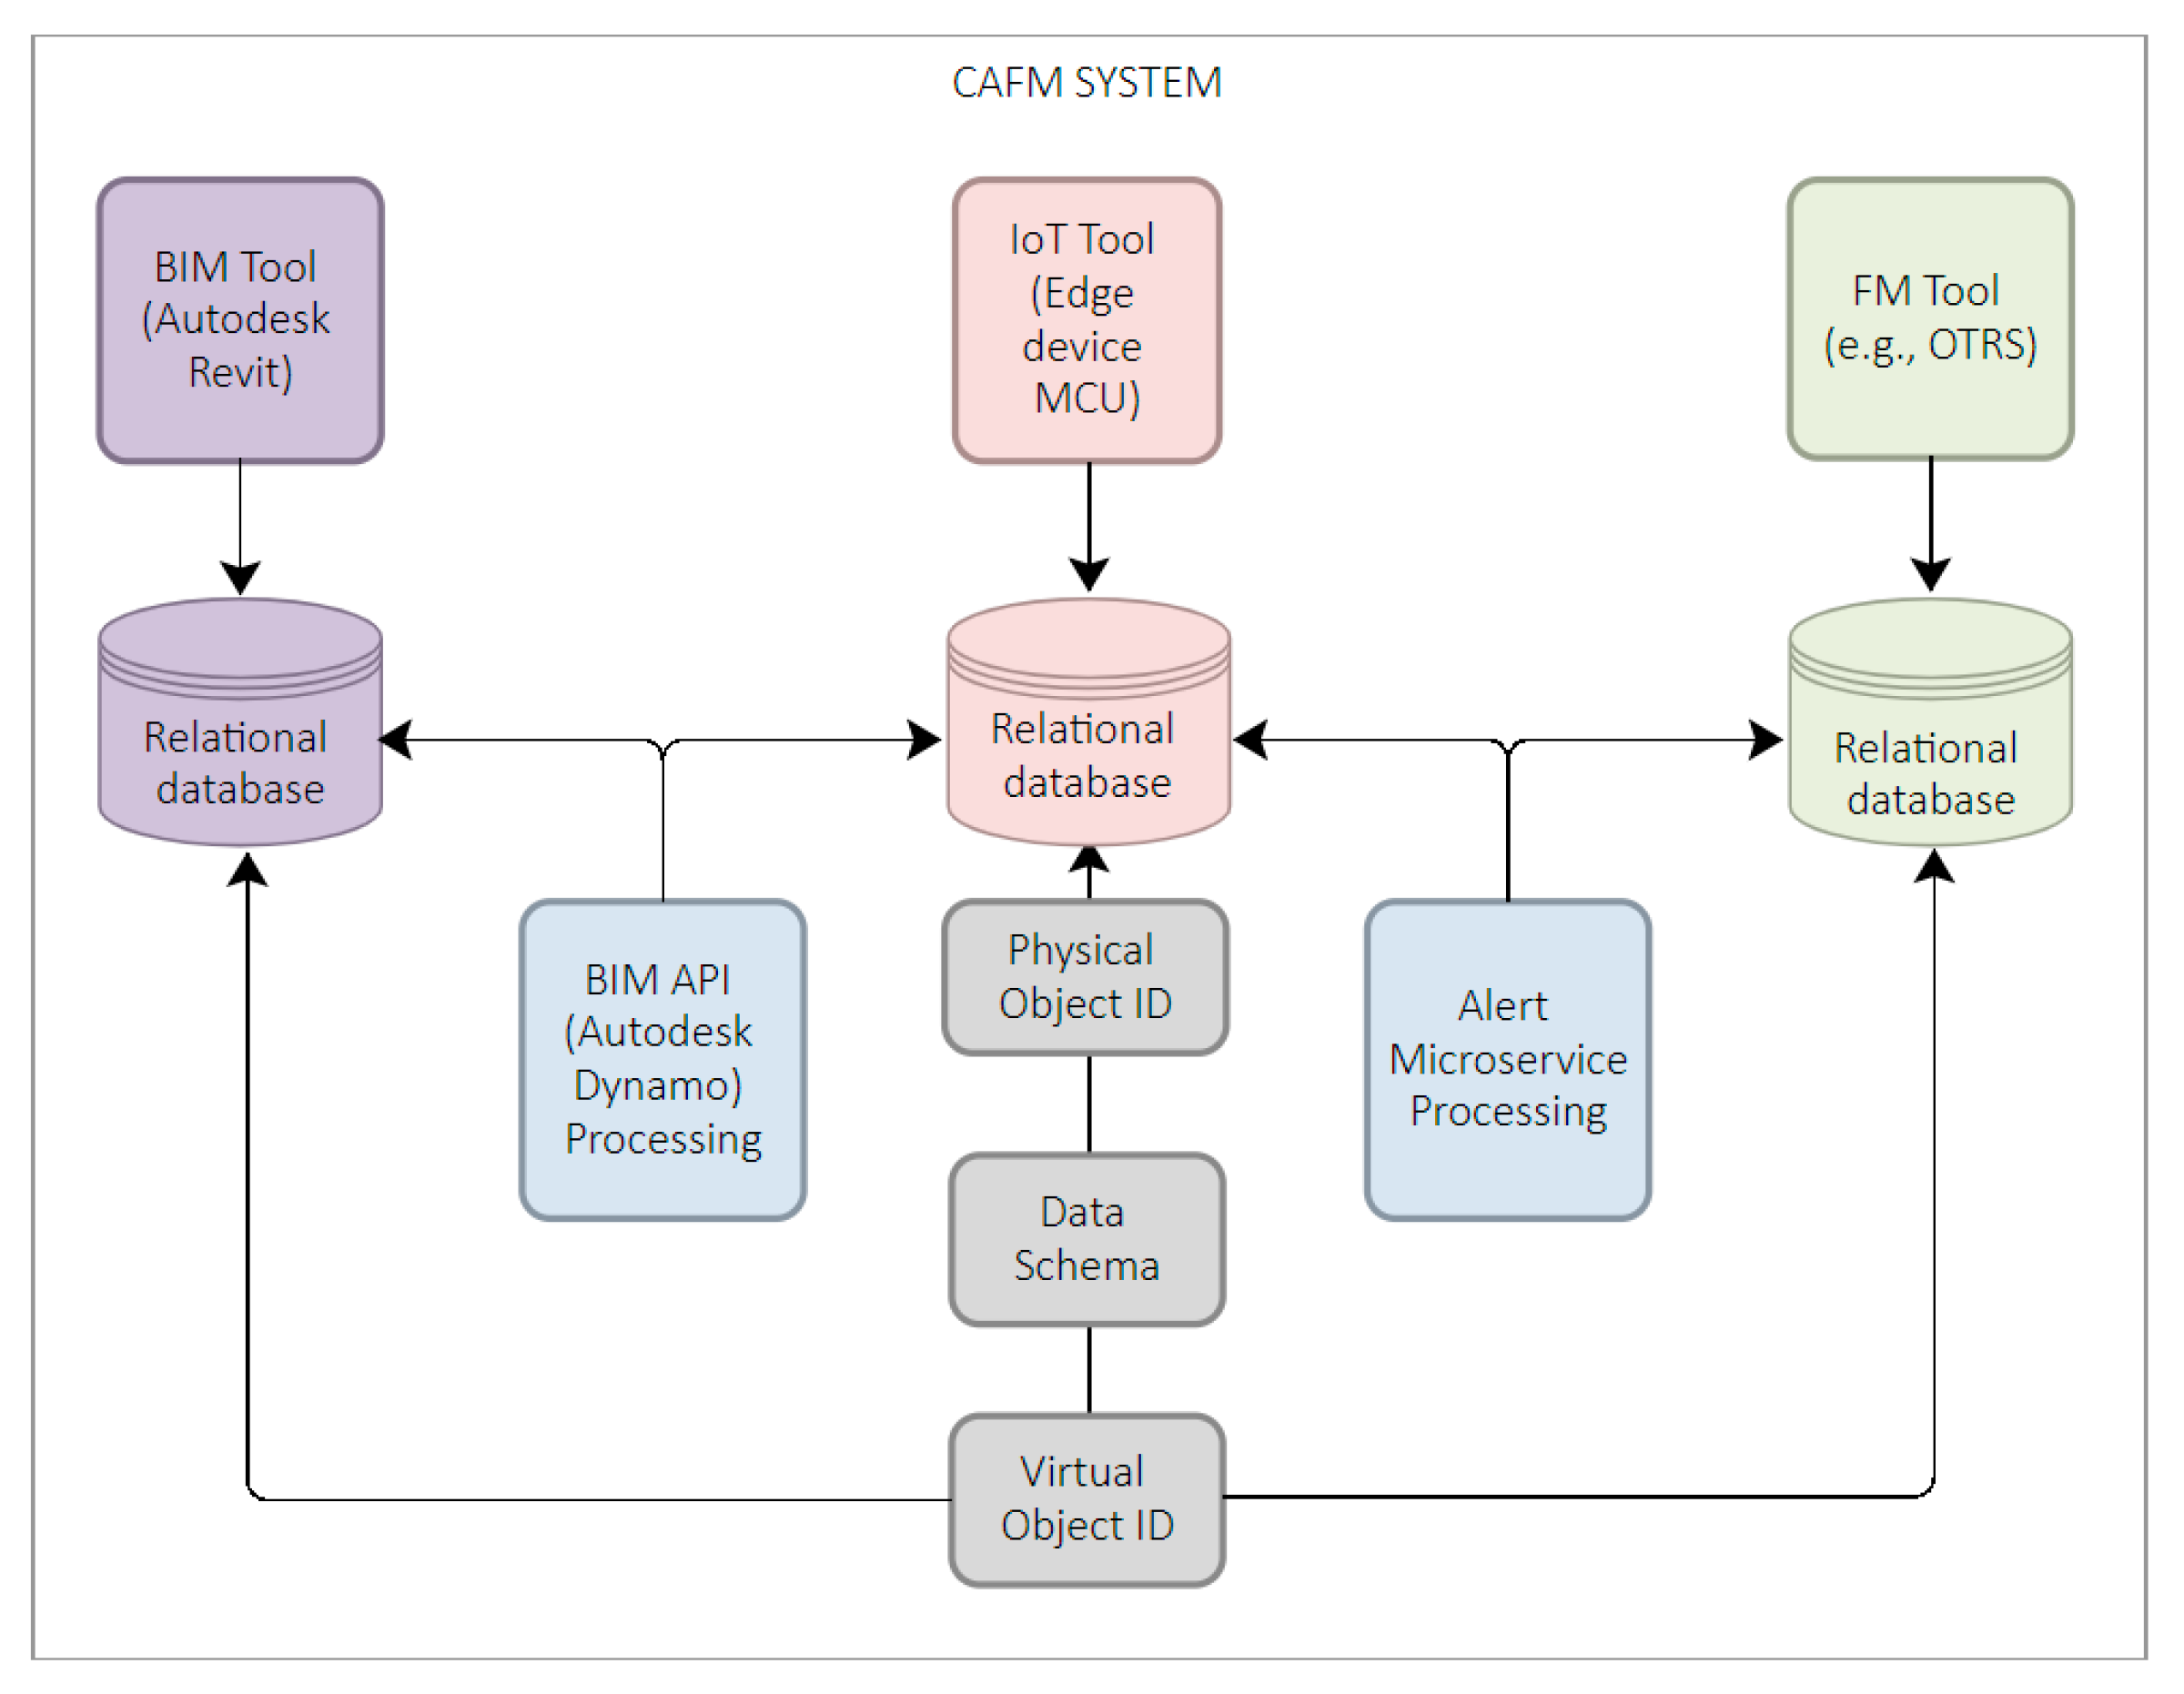
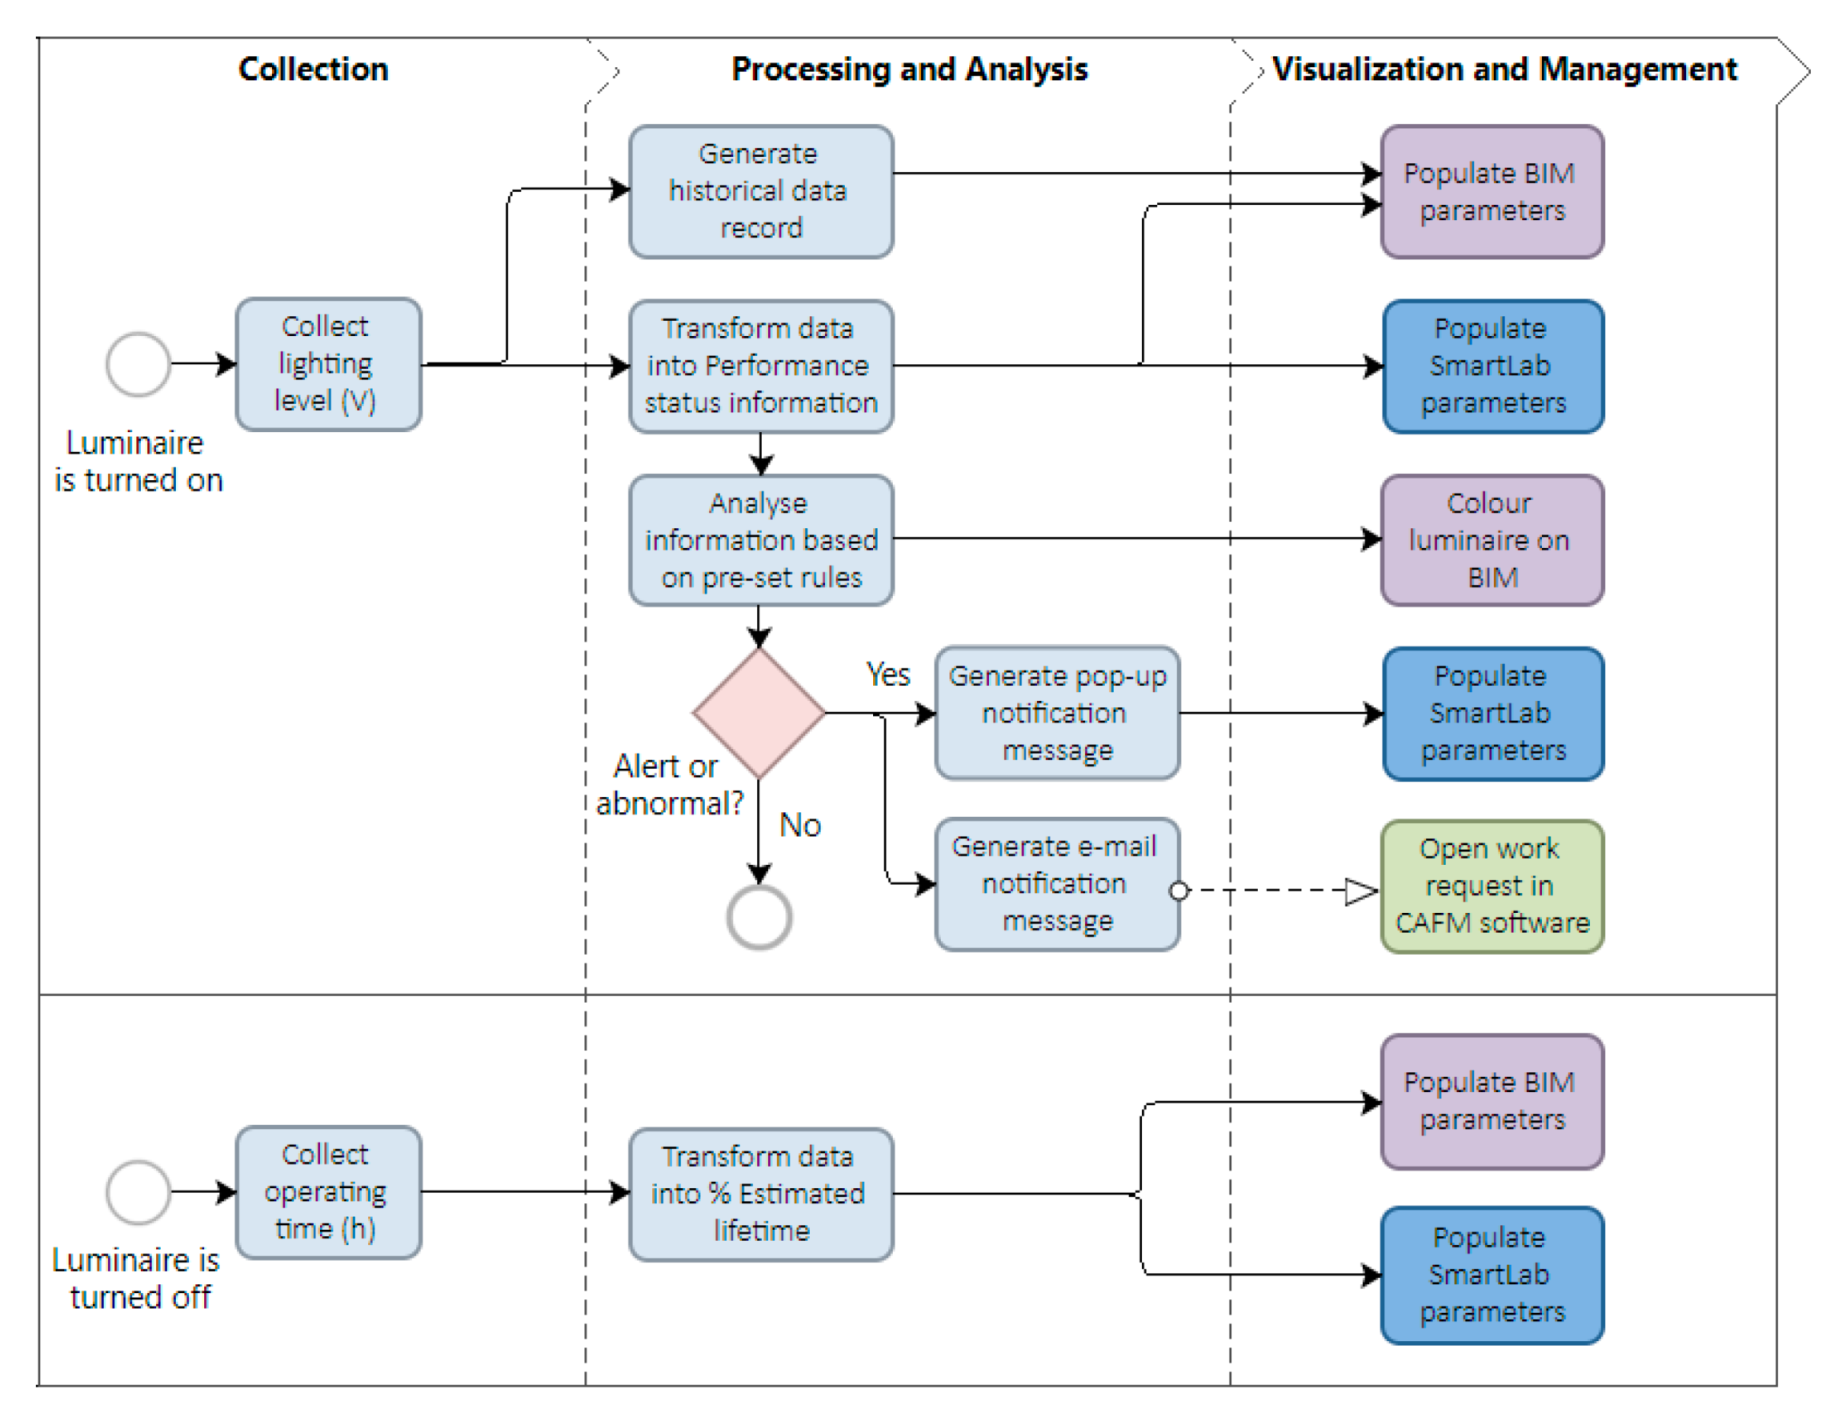
2.2.2. Data Transmission and Processing
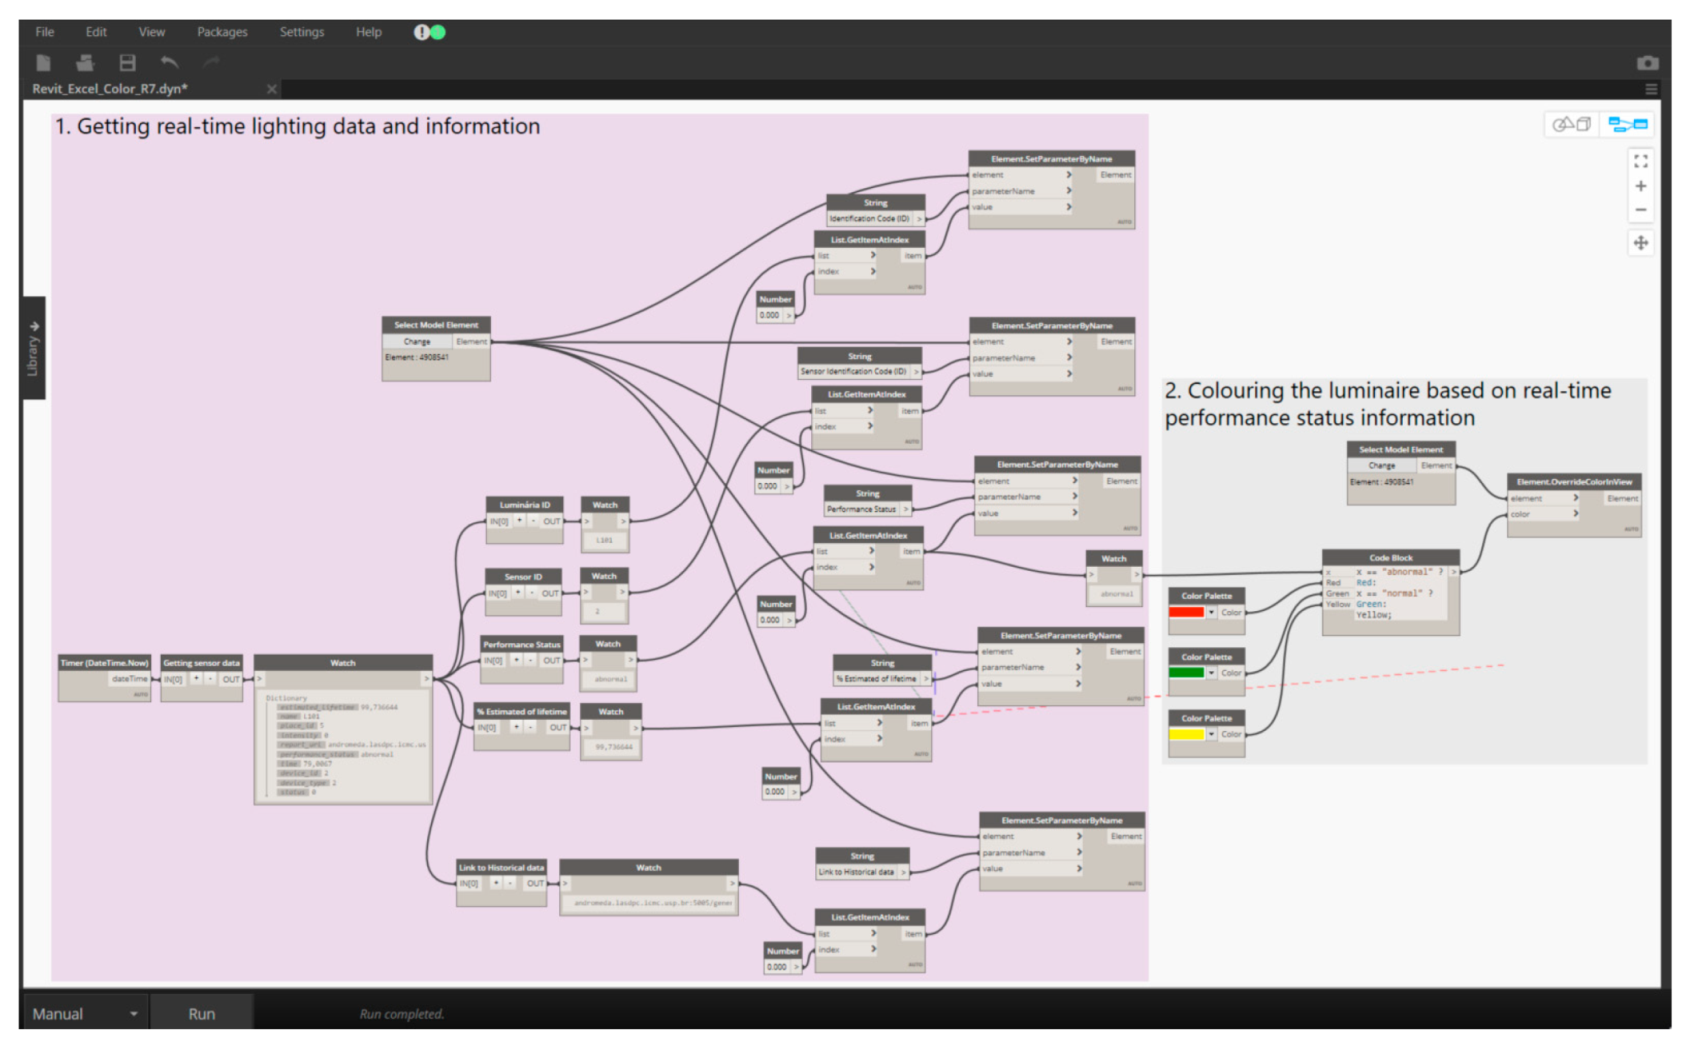
2.2.3. Data Visualisation
2.2.4. Data and Information Management
2.3. Implementation and Testing
3. Results
3.1. Assessment Based on Performance Measurement Criteria
3.2. Assessment Based on Technical and Functional Requirements
4. Discussion
4.1. Establishment of Technical and Functional Requirements and the Experimental Plan for Prototyping
4.2. Establishment of FM BIM Requirements and Integration of BIM, IoT, and FM Components
4.3. Generation of Intelligence from Raw Data
4.4. Accessibility to Relevant Information for Decision-Making
4.5. Impacts of the Smart Lighting Maintenance System Prototype on Service Performance
5. Conclusions
Author Contributions
Funding
Institutional Review Board Statement
Informed Consent Statement
Data Availability Statement
Conflicts of Interest
Appendix A

| Hardware Test Protocol | |||
| Component | Functionality Criterion and Purpose | Activities | Performance Measurement |
| Lighting sensor module | Position: assessment of the efficacy of the sensor position to capture accurate lighting level data | Verify the existence of interferences in the sensor installed on the prototype surface | Sensor data are collected with no interference from other objects |
| Attachment on the prototype: assessment of the efficacy of the adopted solutions to attach the sensor device on the prototype | Verify if hot melt adhesive (HMA) effectively attaches the sensor devices on the prototype surface | Sensor devices are firmly and steadily attached to the prototype surface | |
| Connection with existing electric infrastructure: assessment of the efficacy of the developed solution to connect sensor devices to an external power supply | Verify if the solution developed with electrical sockets effectively provides power to the sensor devices | Sensor devices are correctly charged | |
| Software Test Protocol | |||
| Component | Functionality Criterion and Purpose | Activities | Performance Measurement |
| Sensor data collection | Calibration for data collection considering the interval and time proposed | Verify the efficacy of instantly collecting lighting level data after the lighting has been turned on Verify the efficacy of collecting the time the lighting is turned on and off, generating the operating time data | Calibration enables an accurate data collection |
| Wi-Fi transmission and online storage of sensor data | Assessment of the efficacy of sensor data transmission and storage | Verify if the sensor data have been accurately transmitted and stored across the architecture components | Data are accurately transmitted across the architecture components |
| Sensor data transmission and processing | Accuracy of collected data (i.e., lighting level, operating time (turn on–turn off), and date (day/month/year) under distinct conditions of performance, energy supply, and time of day (i.e., day or night) | Verify data collection accuracy in three distinct performance statuses:
| The sensor is accurately collecting data under distinct conditions |
| Sensor data transmission and processing | Data processing and transmission over the IoT and BIM and platforms: assessment of the efficacy of the system (i.e., microservices, Dynamo) in interpreting data and generating notification messages | Verify if the microservice has correctly interpreted the real-time data and generated performance information and notification messages. Verify if the data is being correctly interpreted by modifying the “if statement” rationale colours set, considering:
| Both data and information are accurately transmitted and interpreted by BIM and IoT platforms, generating performance information and notification messages |
| Information visualisation | Information visualisation on SmartLab mobile application and e-mail account | Open SmartLab mobile application and e-mail account and verify if the notification information is clear and complete. | Information is accurate and easily visualised on SmartLab and e-mail interfaces |
| Information visualisation on BIM platforms (i.e., Autodesk Revit desktop, Autodesk Revit cloud-based viewer) | Open BIM platforms and verify if the lighting information is clear and complete. | Information is accurate and easily visualised on BIM platforms | |
References
- Royal Institution of Chartered Surveyors (RICS). International BIM Implementation Guide RICS Guidance Note, Global, 1st ed.; RICS: London, UK, 2015. [Google Scholar]
- Booty, F. Facilities Management Handbook, 4th ed.; Butterworth-Heinemann: Oxford, UK, 2009. [Google Scholar]
- Fairchild, A. Twenty-First-Century Smart Facilities Management: Ambient Networking in Intelligent Office Buildings. In Guide to Ambient Intelligence in the IoT Environment: Principles, Technologies and Applications; Springer: Berlin/Heidelberg, Germany, 2019. [Google Scholar]
- Bokrantz, J.; Skoogh, A.; Berlin, C.; Wuest, T.; Stahre, J. Smart Maintenance: An Empirically Grounded Conceptualisation. Int. J. Prod. Econ. 2020, 223, 107534. [Google Scholar] [CrossRef]
- Breuker, M.; Rossi, T.; Braun, J. Smart Maintenance for Rooftop Units. ASHRAE J. 2000, 42, 41–47. [Google Scholar]
- Katona, A.; Panfilov, P. Building Predictive Maintenance Framework for Smart Environment Application Systems. In Proceedings of the 29th DAAAM International Symposium on Intelligent Manufacturing and Automation, Zadar, Croatia, 21–28 October 2018; Volume 29, pp. 460–470. [Google Scholar] [CrossRef]
- Coleman, C.; Coleman, C.; Damodaran, S.; Chandramouli, M.; Deuel, E. Making Maintenance Smarter: Predictive Maintenance and the Digital Supply Network; Deloitte University Press: New York, NY, USA, 2017. [Google Scholar]
- Asin, A.; Gascón, D. 50 Sensor Applications for a Smarter World. Reports—Whitepapers. Libelium, 9 September 2020. Available online: http://www.libelium.com/top_50_iot_sensor_applications_ranking (accessed on 2 November 2021).
- Eastman, C.; Teicholz, P.; Sacks, R.; Liston, K. Manual de BIM: Um Guia de Modelagem da Informação da Construção Para Arquitetos, Engenheiros, Gerentes, Construtores e Incorporadores; Bookman: Porto Alegre, Brazil, 2014. [Google Scholar]
- Akcamete, A.; Akinci, B.; Garrett, J.H., Jr. Potential Utilization of Building Information Models for Planning Maintenance Activities. In Proceedings of the International Conference on Computing in Civil and Building Engineering, Nottingham, UK, 30 June–2 July 2010. [Google Scholar]
- Corry, E.; Donnell, J.O.; Curry, E.; Coakley, D.; Pauwels, P.; Keane, M. Using Semantic Web Technologies to Access Soft AEC Data. Adv. Eng. Inform. 2014, 28, 370–380. [Google Scholar] [CrossRef]
- European Federation of Engineering Consultancy Associations (EFCA). BIM and ISO 19650 from a Project Management Perspective; EFCA: Brussels, Belgium, 2019. [Google Scholar]
- Sacks, R.; Eastman, C.; Lee, G.; Teicholz, P. BIM Handbook: A Guide to Building Information Modeling for Owners, Managers, Designers, Engineers and Contractors, 3rd ed.; John Wiley & Sons: Hoboken, NJ, USA, 2018. [Google Scholar]
- Emmitt, S. BIM and the Future of Design Management. In Construction Manager’s BIM Handbook; Eynon, J., Ed.; John Wiley & Sons Ltd.: Chichester, UK, 2016; p. 227. [Google Scholar]
- Ashton, K. That ‘Internet of Things’ Thing. In the Real World Things Matter More than Ideas. RFID Journal, 2010. Available online: http://www.itrco.jp/libraries/RFIDjournal-That%20Internet%20of%20Things%20Thing.pdf (accessed on 7 October 2021).
- Gunduz, M.; Isikdag, U.; Basaraner, M. Integration of BIM, Web Maps and IoT for Supporting Comfort Analysis. ISPRS Ann. Photogramm. Remote Sens. Spat. Inf. Sci. 2017, 4, 221–227. [Google Scholar] [CrossRef] [Green Version]
- Pishdad-Bozorgi, P. Future Smart Facilities: State-of-the-Art BIM-Enabled Facility Management. J. Constr. Eng. Manag. 2017, 143, 02517006. [Google Scholar] [CrossRef]
- Wong, J.K.W.; Ge, J.; He, S.X. Digitisation in Facilities Management: A Literature Review and Future Research Directions. Autom. Constr. 2018, 92, 312–326. [Google Scholar] [CrossRef]
- Al-Fuqaha, A.; Guizani, M.; Mohammadi, M.; Aledhari, M.; Ayyash, M. Internet of Things: A Survey on Enabling Technologies, Protocols, and Applications. IEEE Commun. Surv. Tutor. 2015, 17, 2347–2376. [Google Scholar] [CrossRef]
- Royal Institute of British Architects (RIBA). RIBA Plan of Work 2020 Overview; RIBA: London, UK, 2020; p. 146. [Google Scholar] [CrossRef]
- Fink, D.; Mata, A. Digital Twin: Bringing MEP Models to Life Speakers; Autodesk University: San Francisco, CA, USA, 2020; pp. 1–25. [Google Scholar]
- Grieves, M.; Vickers, J. Digital Twin: Mitigating Unpredictable, Undesirable Emergent Behavior in Complex Systems. In Transdisciplinary Perspectives on Complex Systems: New Findings and Approaches; Springer International Publishing: Berlin/Heidelberg, Germany, 2017; pp. 85–113. [Google Scholar] [CrossRef]
- Codinhoto, R.; Becher, O.; Heron, J.N.; Donato, V. BIM Bin: Waste Management Through BIM and Digital Twin. In Handbook of Research on Developing Smart Cities Based on Digital Twins; Del Giudice, M., Osello, A., Eds.; IGI Global: Hershey, PA, USA, 2021; pp. 265–294. [Google Scholar] [CrossRef]
- Tang, S.; Shelden, D.R.; Eastman, C.M.; Pishdad-Bozorgi, P.; Gao, X. A Review of Building Information Modeling (BIM) and the Internet of Things (IoT) Devices Integration: Present Status and Future Trends. Autom. Constr. 2019, 101, 127–139. [Google Scholar] [CrossRef]
- Fialho, B.C.; Codinhoto, R.; Fabricio, M.M. Trends in BIM and IoT for Reactive Maintenance. In Proceedings of the 36th CIB W78 2019 Conference, Newcastle, UK, 18–20 September 2019; pp. 912–925. [Google Scholar]
- Jia, M.; Komeily, A.; Wang, Y.; Srinivasan, R.S. Adopting Internet of Things for the Development of Smart Buildings: A Review of Enabling Technologies and Applications. Autom. Constr. 2019, 101, 111–126. [Google Scholar] [CrossRef]
- Rashid, K.M.; Louis, J.; Fiawoyife, K.K. Wireless Electric Appliance Control for Smart Buildings Using Indoor Location Tracking and BIM-Based Virtual Environments. Autom. Constr. 2019, 101, 48–58. [Google Scholar] [CrossRef]
- Pärn, E.A.; Edwards, D.J.; Draper, R. A Case Study of Building Information Modelling Enabled ‘Information Totem’ for Operations and Maintenance Integration. In Proceedings of the CIB World Building Congress 2016, Tampere, Finland, 30 May–3 June 2016. [Google Scholar]
- Misic, T.; Gilani, S.; McArthur, J.J. BAS Data Streaming for Smart Building Analytics. In Proceedings of the 37th CIB W78 Information Technology for Construction Conference (CIB W78), São Paulo, Brazil, 18–20 August 2020; pp. 430–439. [Google Scholar] [CrossRef]
- Ibrahim, K.F.; Abanda, F.H.; Vidalakis, C.; Woods, G. BIM for FM: Input versus Output Data. In Proceedings of the 33rd CIB W78 Conference, Brisbane, Australia, 31 October–2 November 2016. [Google Scholar]
- Araszkiewicz, K. Digital Technologies in Facility Management—The State of Practice and Research Challenges. Procedia Eng. 2017, 196, 1034–1042. [Google Scholar] [CrossRef]
- Keller, C. CAFM/IWMS—Balancing Technology, Processes, and Objectives. In Technology for Facility Managers: The Impact of Cutting-Edge Technology on Facility Management; International Facility Management Association (IFMA), Ed.; John Wiley & Sons: Hoboken, NJ, USA, 2012; pp. 3–20. [Google Scholar]
- Kensek, K.; Kahn, W. Integration of Environmental Sensors with BIM Seven Case Studies. In Proceedings of the BESS—SB13 California: Advancing Towards Net Zero, Pomona, CA, USA, 24–25 June 2013; pp. 29–35. [Google Scholar]
- Pärn, E.A.; Edwards, D.J. Conceptualising the FinDD API Plug-in: A Study of BIM-FM Integration. Autom. Constr. 2017, 80, 11–21. [Google Scholar] [CrossRef]
- Chan, H.-Y.; Leung, S.-F.; Yuen, P.-H.; Yim, C.-M. Towards Smart Operation & Maintenance (O&M) by Building Information Modelling (BIM) and Asset Management (AM) Technologies. In Proceedings of the 7th Greater Pearl River Delta Conference on Building Operation and Maintenance, Hung Hom, Hong Kong, 6 December 2016; pp. 106–118. [Google Scholar]
- Altohami, A.B.A.; Haron, N.A.; Ales@Alias, A.H.; Law, T.H. Investigating Approaches of Integrating BIM, IoT, and Facility Management for Renovating Existing Buildings: A Review. Sustainability 2021, 13, 3930. [Google Scholar] [CrossRef]
- Mannino, A.; Dejaco, M.C. Building Information Modelling and Internet of Things Integration for Facility Management—Literature Review and Future Needs. Appl. Sci. 2021, 11, 3062. [Google Scholar] [CrossRef]
- Chung, S.; Kwon, S.; Moon, D.; Ko, T. Smart Facility Management Systems Utilising Open BIM and Augmented/Virtual Reality. In Proceedings of the 35th International Symposium on Automation and Robotics in Construction (ISARC), Berlin, Germany, 20–25 July 2018; p. 8. [Google Scholar] [CrossRef] [Green Version]
- Lin, Y.-C.; Su, Y.-C.; Chen, Y.-P. Developing Mobile BIM/2D Barcode-Based Automated Facility Management System. Sci. World J. 2014, 2014, 16. [Google Scholar] [CrossRef] [PubMed] [Green Version]
- Mirarchi, C.; Pavan, A.; De Marco, F.; Wang, X.; Song, Y. Supporting Facility Management Processes through End-Users’ Integration and Coordinated BIM-GIS Technologies. ISPRS Int. J. Geo-Inf. 2018, 7, 191. [Google Scholar] [CrossRef] [Green Version]
- Lewis, A. The Role of People and Process in Technology. In Technology for Facility Managers: The Impact of Cutting-Edge Technology on Facility Management; International Facility Management Association (IFMA), Ed.; John Wiley & Sons: Hoboken, NJ, USA, 2012; pp. 229–244. [Google Scholar] [CrossRef]
- Valks, B.; Arkesteijn, M.H.; Koutamanis, A.; Alexandra, C. Towards a Smart Campus: Supporting Campus Decisions with Internet of Things Applications. Build. Res. Inf. 2021, 49, 1–20. [Google Scholar] [CrossRef]
- King, J.; Perry, C. Smart Buildings: Using Smart Technology to Save Energy in Existing Buildings; American Council for an Energy-Efficient Economy: Washington, DC, USA, 2017. [Google Scholar]
- Codinhoto, R.; Fialho, B.C.; Pinti, L.; Fabricio, M.M. BIM and IoT for Facilities Management: Understanding Key Maintenance Issues. In Handbook of Research on Driving Transformational Change in the Digital Built Environment; Underwood, J., Shelbourn, M., Eds.; IGI Global: Hershey, PA, USA, 2021; pp. 209–231. [Google Scholar] [CrossRef]
- Berglund, A.; Leifer, L. Why We Prototype! An International Comparison of the Linkage between Embedded Knowledge and Objective Learning. Eng. Educ. 2013, 8, 2–15. [Google Scholar] [CrossRef] [Green Version]
- Christie, E.J.; Jensen, D.D.; Buckley, R.T.; Menefee, D.A.; Ziegler, K.K.; Wood, P.K.L.; Crawford, R.H. Prototyping Strategies: Literature Review and Identification of Critical Variables. In Proceedings of the ASEE Annual Conference & Exposition, San Antonio, TX, USA, 10 June 2012; p. 22. [Google Scholar] [CrossRef]
- Camburn, B.; Viswanathan, V.; Linsey, J.; Anderson, D.; Jensen, D.; Crawford, R.; Otto, K.; Wood, K. Design Prototyping Methods: State of the Art in Strategies, Techniques, and Guidelines. Des. Sci. 2017, 3, e13. [Google Scholar] [CrossRef] [Green Version]
- Wensveen, S.; Matthews, B. Prototypes and Prototyping in Design Research. In The Routledge Companion to Design Research; Rodgers, P.A., Yee, J., Eds.; Routledge: Abingdon, UK, 2014; pp. 262–276. [Google Scholar] [CrossRef]
- Ulrich, K.T.; Eppinger, S.D. Product Design and Development, 5th ed.; McGraw-Hill: New York, NY, USA, 2012; Volume 7. [Google Scholar] [CrossRef]
- Hevner, A.R.; March, S.T.; Park, J.; Ram, S. Design Science in Information Systems Research. MIS Q. Manag. Inf. Syst. 2004, 28, 75–105. [Google Scholar] [CrossRef] [Green Version]
- Bueno, J.M.d.S. Uma Arquitetura de Microserviços Para o Controle de Smart Labs. Bachelor’s Dissertation, Universidade de São Paulo, São Paulo, Brazil, 2020. [Google Scholar]
- Cavka, H.B.; Staub-French, S.; Pottinger, R. Evaluation of Organisational Context and Requirements for Leveraging Building Information Models to Support Handover and Operations & Maintenance. In Proceedings of the 5th International/11th Construction Specialty Conference, Vancouver, BC, Canada, 7–10 June 2015. [Google Scholar]
- Akcamete, A.; Akinci, B.; Garrett, J.H., Jr. An Approach to Capture Facility Maintenance and Repair Information to Store Change History. In Proceedings of the CIB W78-W102 2011: International Conference, Sophia Antipolis, Valbonne, France, 26–28 October 2011. [Google Scholar]
- Becerik-Gerber, B.; Jazizadeh, F.; Li, N.; Calis, G. Application Areas and Data Requirements for BIM-Enabled Facilities Management. J. Constr. Eng. Manag. 2012, 138, 431–442. [Google Scholar] [CrossRef]
- McArthur, J.J. A Building Information Management (BIM) Framework and Supporting Case Study for Existing Building Operations, Maintenance and Sustainability. Procedia Eng. 2015, 118, 1104–1111. [Google Scholar] [CrossRef] [Green Version]
- BS 8210. Guide to Facilities Maintenance Management; The British Standards Institution (BSI): London, UK, 2012. [Google Scholar]
- ABNT NBR 5413. Iluminância de Interiores; Associação Brasileira de Normas Técnicas (ABNT): São Paulo, Brazil, 1992. [Google Scholar]
- Philips. Datasheet: Product Data General Information: PowerBalance Surface-Mounted. 2019. Available online: https://www.assets.lighting.philips.com/is/content/PhilipsLighting/fp910504093403-pss-global (accessed on 7 October 2021).
- Philips. BIM Revit Library Philips Lighting. Available online: https://www.lighting.philips.com/main/support/support/revit-library#page=1&filters=Familyname%2FPowerBalancesurfacemounted%2C (accessed on 9 February 2021).
- ABNT IEC/PAS 62612. Lâmpadas LED Com Dispositivo de Controle Incorporado Para Serviços de Iluminação Geral—Requisitos de Desempenho; Associação Brasileira de Normas Técnicas (ABNT): São Paulo, Brazil, 2013. [Google Scholar]
- Marmo, R.; Nicolella, M.; Polverino, F.; Tibaut, A. A Methodology for a Performance Information Model to Support Facility Management. Sustainability 2019, 11, 7007. [Google Scholar] [CrossRef] [Green Version]
- Chang, K.; Dzeng, R.; Wu, Y.-J. An Automated IoT Visualization BIM Platform for Decision Support in Facilities Management. Appl. Sci. 2018, 8, 1086. [Google Scholar] [CrossRef] [Green Version]
- Thabet, W.; Lucas, J. Using Dynamo for Model-Based Delivery of Facility Asset Data. In Proceedings of the Creative Construction Conference, Budapest, Hungary, 29 June–2 July 2019. [Google Scholar] [CrossRef] [Green Version]
- Pin, C.; Medina, C.; McArthur, J.J. Supporting Post-Occupant Evaluation Through Work Order Evaluation and Visualization in FM-BIM. In Proceedings of the 35th International Symposium on Automation and Robotics in Construction (ISARC), Berlin, Germany, 20–25 July 2018. [Google Scholar] [CrossRef] [Green Version]
- Machado, F.A.; Ruschel, R.C. Implementação de Solução BIM/IoT Para Suporte à Gestão de Energia Da Edificação. In Proceedings of the II Simpósio Brasileiro de Tecnologia de Informação e Comunicação na Construção, Porto Alegre, Brazil, 19–21 August 2019; ANTAC: Porto Alegre, Brasil; Volume 2. [Google Scholar]
- Pärn, E.A.; Edwards, D.J.; Sing, M.C.P. The Building Information Modelling Trajectory in Facilities Management: A Review. Autom. Constr. 2017, 75, 45–55. [Google Scholar] [CrossRef] [Green Version]
- Gha, A.; Zhang, T.; Naismith, N.; Gha, A.; Doan, D.T.; Rehman, A.U.; Nwadigo, O.; Tookey, J. ND BIM-Integrated Knowledge-Based Building Management: Inspecting Post-Construction Energy Efficiency. Autom. Constr. 2019, 97, 13–28. [Google Scholar] [CrossRef]
- Machado, F.A. BIM e Internet das Coisas Para o Monitoramento do Consumo de Energia da Edificação. Master’s Dissertation, Unicamp. ABRAFAC, São Paulo, Brazil, 2018. [Google Scholar]
- Thabet, W.; Lucas, J.D. A 6-Step Systematic Process for Model-Based Facility Data Delivery. J. Inf. Technol. Constr. 2017, 22, 104–131. [Google Scholar]
- ABNT NBR IEC 62722-2-1. Desempenho de Luminárias Parte 2-1: Requisitos Particulares Para Luminárias LED; Associação Brasileira de Normas Técnicas (ABNT): São Paulo, Brazil, 2016. [Google Scholar]
- Kulatunga, U.; Liyanage, C.; Amaratunga, D. Performance Measurement and Management in Facilities Management. Facilities 2010, 28, 63–68. [Google Scholar] [CrossRef]
- Barrett, P.; Finch, E. Facilities Management: The Dynamics of Excellence, 3rd ed.; John Wiley & Sons Ltd.: Chichester, UK, 2014. [Google Scholar]
- Chanter, B.; Swallow, P. Building Maintenance Management, 2nd ed.; Blackwell Publishing: Hoboken, NJ, USA, 2007. [Google Scholar]
- Jaspers, E.; Teicholz, E. Technology and the Workplace. In Technology for Facility Managers: The Impact of Cutting-Edge Technology on Facility Management; IFMA, Ed.; John Wiley & Sons: Hoboken, NJ, USA, 2012; pp. 191–228. [Google Scholar] [CrossRef]
- Márquez, A.C. The Maintenance Management Framework: Models and Methods for Complex Systems Maintenance; Springer: Berlin/Heidelberg, Germany, 2007. [Google Scholar]
- Arslan, M.; Riaz, Z.; Kiani, A.K.; Azhar, S. Real-Time Environmental Monitoring, Visualisation and Notification System for Construction H&S Management. J. Inf. Technol. Constr. 2014, 19, 72–91. [Google Scholar]
- Talamo, C.; Bonanomi, M. Knowledge Management and Information Tools for Building Maintenance and Facility Management; Springer: Berlin/Heidelberg, Germany, 2016. [Google Scholar]
- Newman, S. Building Microservices Designing: Fine-Grained Systems; O’Reilly Media: Sebastopol, CA, USA, 2015. [Google Scholar]
- Teizer, J.; Wolf, M.; Golovina, O.; Perschewski, M.; Propach, M.; Neges, M.; König, M. Internet of Things (IoT) for Integrating Environmental and Localisation Data in Building Information Modeling (BIM). In Proceedings of the 34th International Symposium on Automation and Robotics in Construction (ISARC), Taipei, Taiwan, 28 June–1 July 2017. [Google Scholar] [CrossRef] [Green Version]
- Kassem, M.; Kelly, G.; Dawood, N.; Serginson, M.; Lockley, S. BIM in Facilities Management Applications: A Case Study of a Large University Complex. Built Environ. Proj. Asset. Manag. 2015, 5, 261–277. [Google Scholar] [CrossRef] [Green Version]
- Kensek, K. BIM Guidelines Inform Facilities Management Databases: A Case Study over Time. Buildings 2015, 5, 899–916. [Google Scholar] [CrossRef] [Green Version]
- Clayton, J.B. Condition Assessment in Facility Asset Management. In Technology for Facility Managers: The Impact of Cutting-Edge Technology on Facility Management; Teicholz, E., Ed.; John Wiley & Sons: Hoboken, NJ, USA, 2012; pp. 137–169. [Google Scholar] [CrossRef]
- Ramprasad, B.; McArthur, J.; Fokaefs, M.; Barna, C.; Damm, M.; Litoiu, M. Leveraging Existing Sensor Networks as IoT Devices for Smart Buildings. In Proceedings of the IEEE 4th World Forum on Internet of Things, WF-IoT, Singapore, 5–8 February 2018; IEEE: Singapore, 2018; pp. 452–457. [Google Scholar] [CrossRef]
- International Telecommunication Union. ITU Internet Reports 2005: The Internet of Things; International Telecommunication Union: Geneva, Switzerland, 2005. [Google Scholar]
- Desogus, G.; Quaquero, E.; Sanna, A.; Gatto, G.; Tagliabue, L.C.; Rinaldi, S.; Ciribini, A.L.C.; Di Giuda, G.; Villa, V. Preliminary Performance Monitoring Plan for Energy Retrofit: A Cognitive Building: The “Mandolesi Pavillon” at the University of Cagliari. In Proceedings of the AEIT International Annual Conference: Infrastructures for Energy and ICT: Opportunities for Fostering Innovation, AEIT 2017, Cagliari, Italy, 20–22 September 2017. [Google Scholar] [CrossRef]
- Arslan, M.; Riaz, Z.; Munawar, S. Building Information Modeling (BIM) Enabled Facilities Management Using Hadoop Architecture. In Proceedings of the PICMET 2017—Portland International Conference on Management of Engineering and Technology: Technology Management for the Interconnected World, Proceedings, Portland, OR, USA, 9–13 July 2017; pp. 1–6. [Google Scholar] [CrossRef]
- Wills, N.; Diaz, J. Integration of Real-Time Data in BIM Enables FM Processes. In WIT Transactions on the Built Environment; WIT Press: Southampton, UK, 2017; Volume 169, pp. 127–133. [Google Scholar] [CrossRef] [Green Version]
- Oubodun, O.F. An Empirical Approach to the Evaluation of Factors in Local Authority Housing Maintenance Requirements in the City of Manchester; University of Salford: Salford, UK, 1996. [Google Scholar]
- Gunay, H.B.; Yang, C.; Shi, Z.; Shen, W.; Huchuk, B. A Preliminary Study on Text Mining Operator Logbooks to Develop a Fault-Frequency Model. ASHRAE Trans. 2018, 124, 171–184. [Google Scholar]
- Abdul-Lateef, O.A. Quantitative Analysis of Criteria in University Building Maintenance in Malaysia. Australas. J. Constr. Econ. Build. 2010, 10, 51–61. [Google Scholar] [CrossRef] [Green Version]
- Akcamete, A.; Liu, X.; Akinci, B.; Garrett, J.H., Jr. Integrating and Visualising Maintenance and Repair Work Orders In BIM: Lessons Learned From A Prototype. In Proceedings of the International Conference on Construction Applications of Virtual Reality, Weimar, Germany, 3–4 November 2011; pp. 639–649. [Google Scholar]
- Salleh, N.A.; Yakin, M.K.A.M.; Ismail, K.; Talib, Y. Preliminary Investigation on the Factors That Influencing the Maintenance Cost of Apartment. In Proceedings of the MATEC Web of Conferences, the 4th International Building Control Conference 2016 (IBCC 2016), Kuala Lumpur, Malaysia, 7–8 March 2016; EDP Sciences: Les Ulis, France, 2016; Volume 66. [Google Scholar] [CrossRef] [Green Version]
- Perera, B.A.K.S.; Illankoon, I.M.C.S.; Perera, W.A.N. Determinants of Operational and Maintenance Costs of Condominiums. In Built-Environment Sri Lanka 12(1); Sri Lanka Institute of Architects: Colombo, Sri Lanka, 2016; pp. 24–42. [Google Scholar]
- Royal Institution of Chartered Surveyors (RICS); International Facility Management Association (IFMA). Strategic FM Framework RICS Guidance Note, Global, 1st ed.; International Facility Management Association (IFMA): Houston, TX, USA; Royal Institution of Chartered Surveyors (RICS): London, UK, 2018; pp. 1–44. [Google Scholar]
- Sullivan, G.P.; Pugh, R.; Melendez, A.P.; Hunt, W.D. Operations & Maintenance Best Practices: A Guide to Achieving Operational Efficiency; United States Department of Energy: Washington, DC, USA, 2010. [Google Scholar]
- Di Giuda, G.M.; Villa, V.; Tagliabue, L.C.; Giana, P.E.; Rinaldi, S.; Ciribini, A.L.C. Refurbishment and School Buildings Management in a Smart Building Environment. In AIP Conference Proceedings; AIP Publishing LLC: Melville, NY, USA, 2018; Volume 1968. [Google Scholar] [CrossRef]
- McGlinn, K.; Yuce, B.; Wicaksono, H.; Howell, S.; Rezgui, Y. Usability Evaluation of a Web-Based Tool for Supporting Holistic Building Energy Management. Autom. Constr. J. 2017, 84, 154–165. [Google Scholar] [CrossRef] [Green Version]
- Ofori, I.; Duodu, P.M.; Bonney, S.O. Establishing Factors Influencing Building Maintenance Practices. J. Econ. Sustain. Dev. 2015, 6, 184–193. [Google Scholar]
- Lee, S.; Akin, Ö. Shadowing Tradespeople: Inefficiency in Maintenance Fieldwork. Autom. Constr. 2009, 18, 536–546. [Google Scholar] [CrossRef]
- Johnson, I.; Wyton, P. What Skills Are Required to Utilise a CAFM System: Cases from the NHS Research Background & Objectives. In Proceedings of the 14th EuroFM Research Symposium, Glasgow, UK, 1–3 June 2015; pp. 1–11. [Google Scholar]
- Ali, A.-S.; Kamaruzzaman, S.-N.; Sulaiman, R.; Peng, Y.C. Factors Affecting Housing Maintenance Cost in Malaysia. J. Facil. Manag. 2010, 8, 285–298. [Google Scholar] [CrossRef] [Green Version]


| Set | Parameter | Name | Description |
|---|---|---|---|
| Room | Identity Data | Room ID | STE_B1_101 |
| Room Name | Bedroom 101 | ||
| Dimensions | Room Length (m) | 4.00 | |
| Room Width (m) | 2.80 | ||
| Room Height (m) | 2.80 | ||
| Lighting | Reflexion Factor (Ceiling/Wall/Floor) | 70%/50%/20% * | |
| Maintenance Factor | 0.8 * | ||
| Median Illuminance in the Workplace (E) (lux) | 300 ** | ||
| Environmental Median Illuminance (E) (lux) | 150 ** | ||
| Number of Lighting Fixtures | 1 | ||
| Lighting | Identity Data | Identification Code (ID) | L101 |
| Model | SM461V W17L169 | ||
| Manufacturer | Philips | ||
| URL | http//:www.philips.com.eg *** | ||
| Description | Surface-mounted | ||
| Material (Housing) | Steel | ||
| Installation Type | Mounted | ||
| Cost (R$) | 250.00 * | ||
| Lighting Priority Level (LPL) | LPL1 | ||
| Dimensions | Length (mm) | 1685.00 | |
| Width (mm) | 171.00 | ||
| Height (mm) | 85.00 | ||
| Assembling Height (m) | 2.80 | ||
| Electric Data | Lamp Model | LED40S/840 | |
| Voltage (V) | 220–240 V | ||
| Initial Input Power (W) | 30 | ||
| Nominal Lifetime (h) | 25.000 | ||
| Apparent Load (VA) | 21.00 VA | ||
| Photometrics | Light Loss Factor | 1 | |
| Initial Luminous Flux (lm) | 1350 | ||
| Initial Colour Temperature (K) | 6500 | ||
| Length of Emission Rectangle (mm) | 66 | ||
| Width of Emission Rectangle (mm) | 1135 | ||
| Light Source Colour | White | ||
| Lighting sensor | Dynamic Information | Performance Status | Normal/Alert/Abnormal |
| % Estimated Lifetime | 25% | ||
| Link to Historical Data | http://andromeda.lasdpc.icmc.usp.br:5005/generateReport *** | ||
| Identity Data | Sensor Identification Code (ID) | S101 | |
| Sensor Type | Lighting Dependent Resistor (LDR) | ||
| Sensor Measurement Unit | Volts (V) | ||
| Sensor Location | STE_B1_101 | ||
| Sensor Assembling Height (m) | 2.75 | ||
| Maintenance Service | Date Record | Date of Lamp Installation | 7 February 2020 * |
| Date of Last Maintenance of Lamp | 10 October 2019 * | ||
| Date of the Last Cleaning of the Lamp | 5 April 2020 * |
| Interface | Role | Maintenance Process Application | Supporting Devices |
|---|---|---|---|
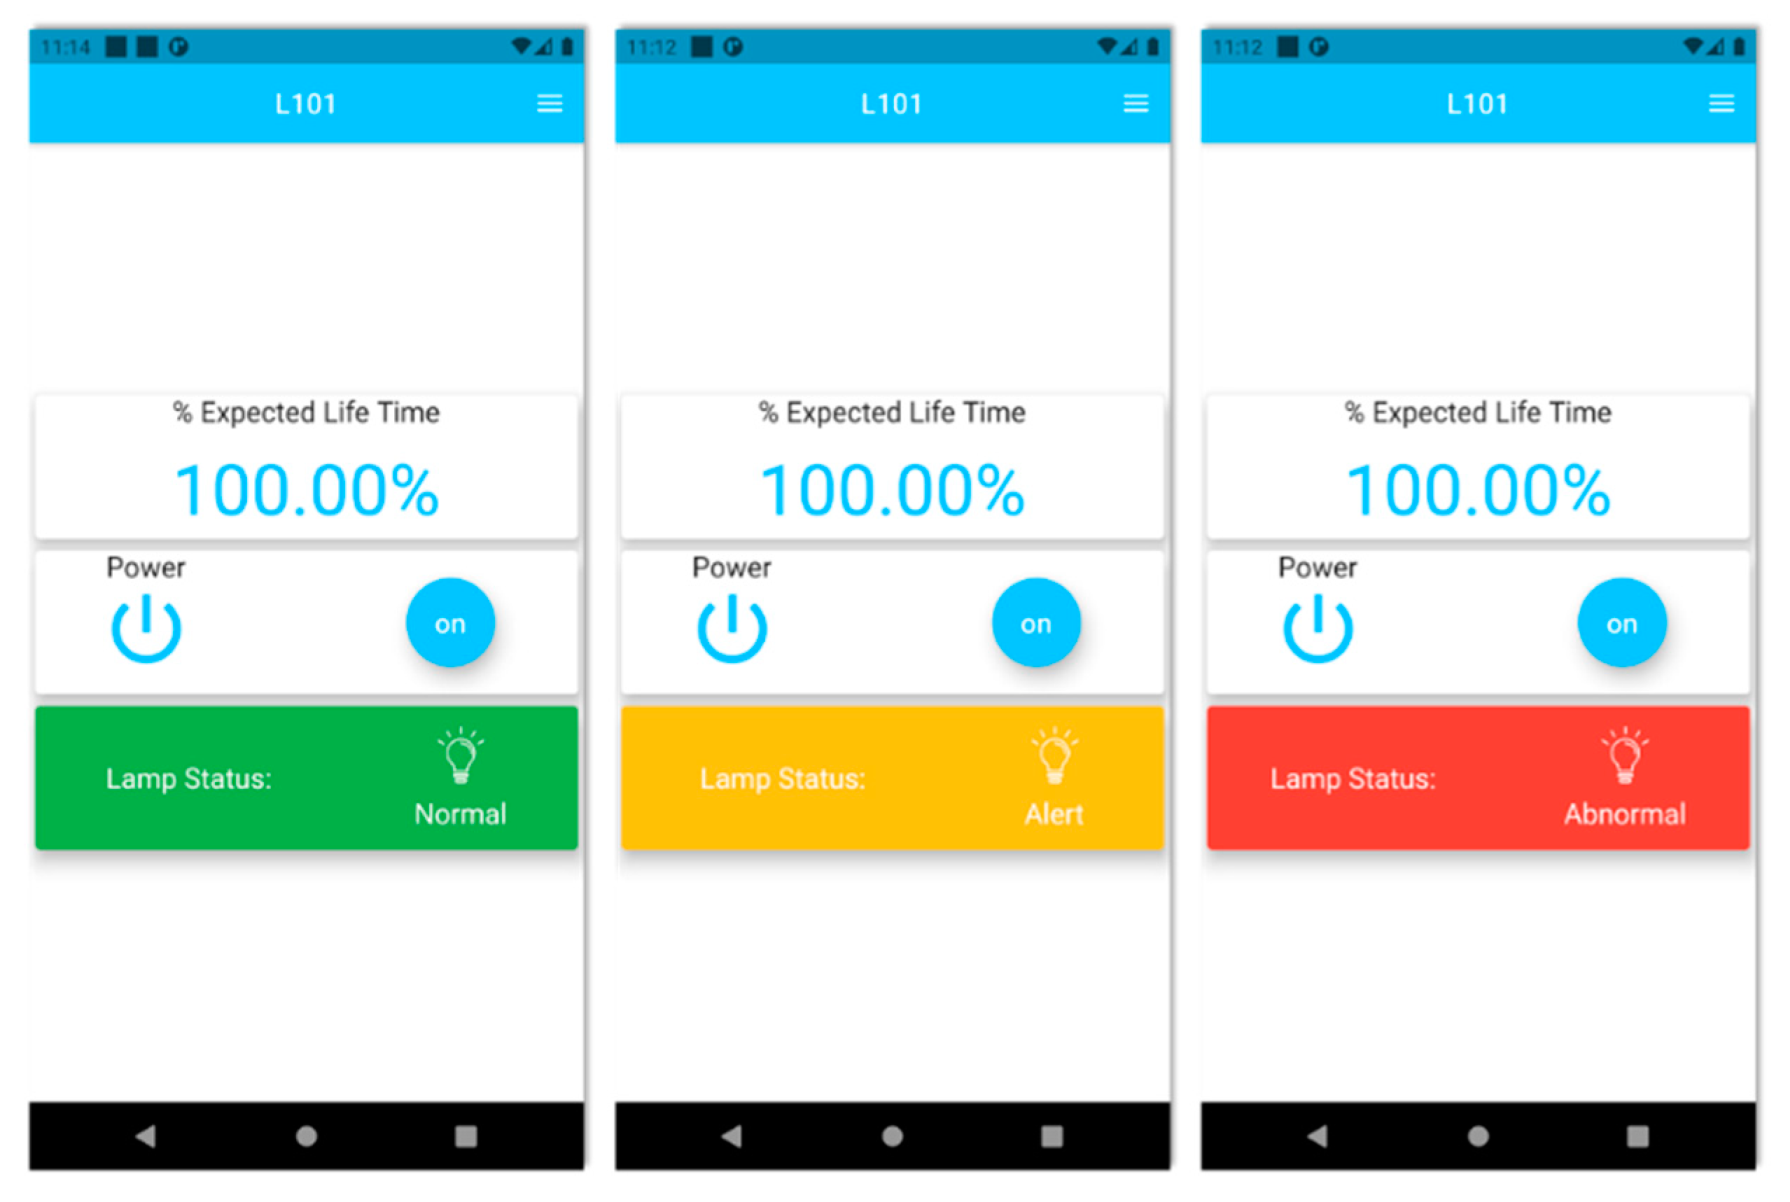
| SmartLab mobile application | Provide lighting performance information and notification messages for maintenance management | Supports the maintenance team in controlling the lighting (i.e., turn on, turn off) and detecting current and potential abnormalities through the visualisation of lighting performance status and notification messages | Smartphone, tablet |
| E-mail account | Provide information on current and potential abnormalities in lighting for maintenance management | Supports the maintenance team in detecting current and potential abnormalities through the visualisation of notification messages and triggering opening work requests | Computer, smartphone, tablet |
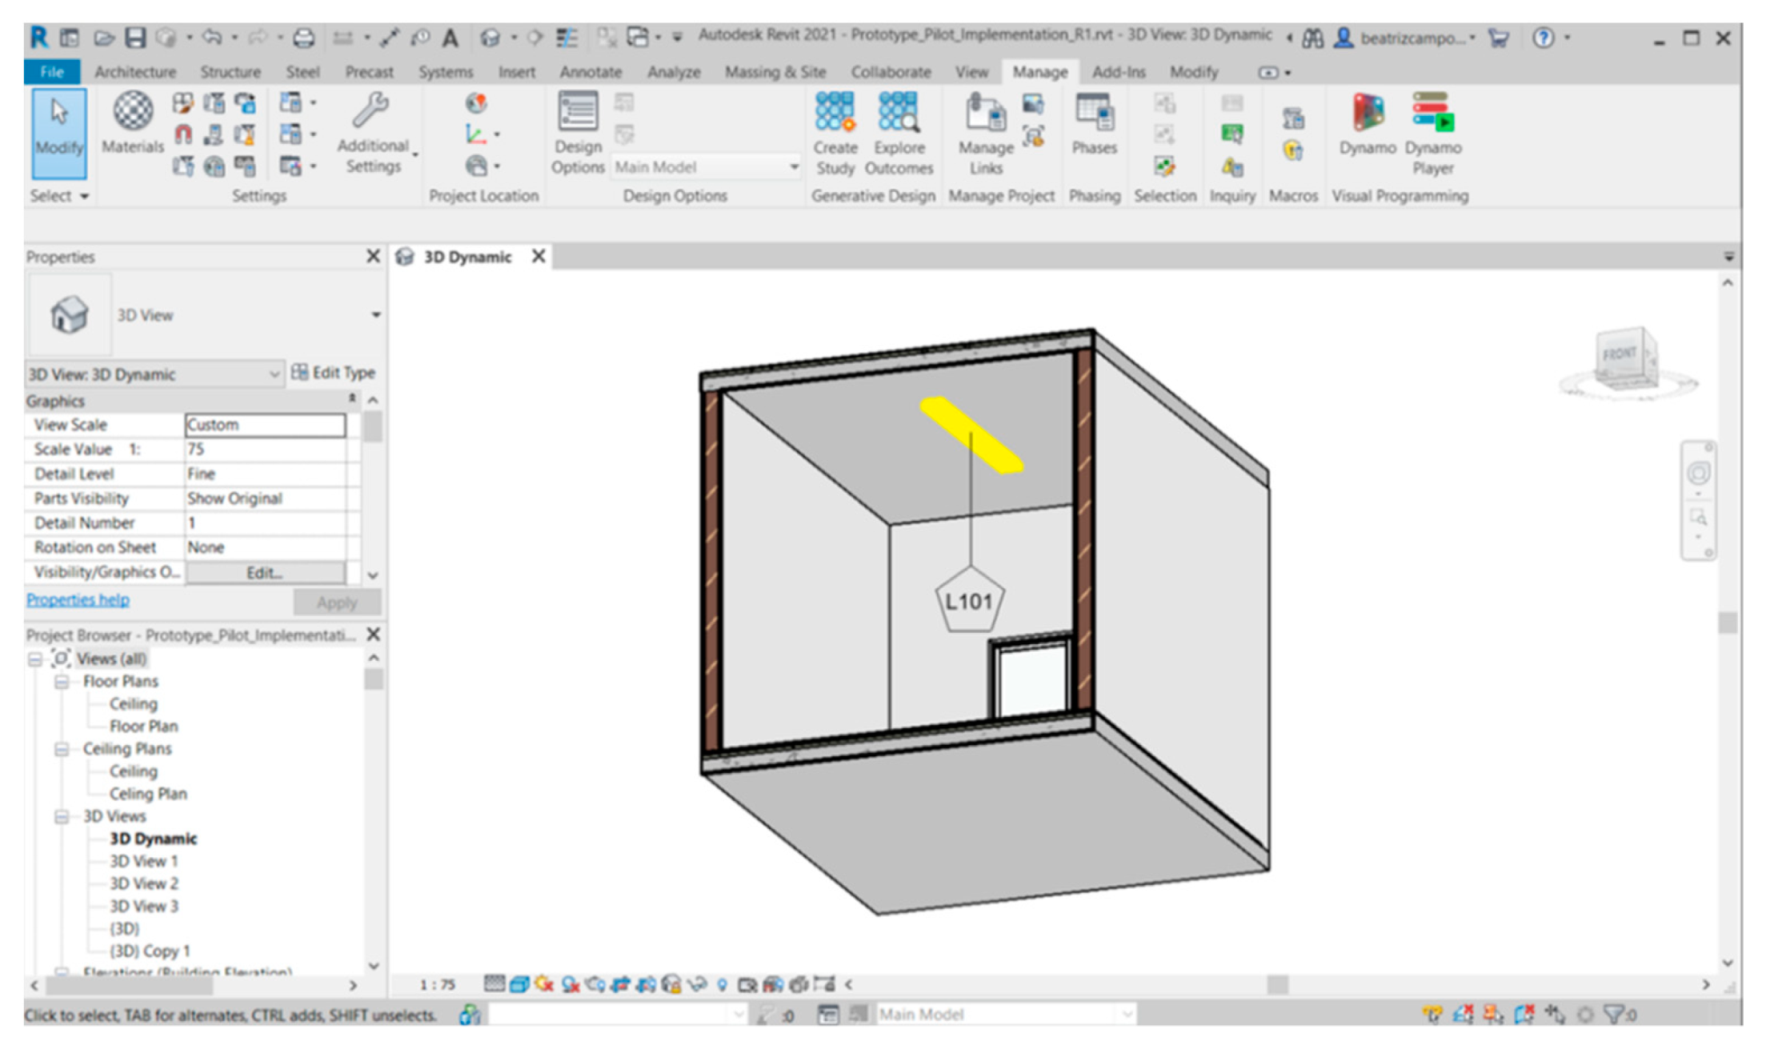
| Autodesk Revit 2021 | Provide a BIM model with detailed lighting static and dynamic information for maintenance management | As a central database, it supports the maintenance team in current and potential abnormalities detection, visualisation, location, diagnosis, and repair | Computer |
| Autodesk online Viewer | Provide a lighter version of the BIM model for maintenance management | Supports interactions of the maintenance team with the BIM model (i.e., navigation, live sections, measurements, annotations, etc.) in a web environment, particularly relevant for field and remote works | Computer, smartphone, tablet |
| Set | Component | Performance Measurement Criterion | Assessment |
|---|---|---|---|
| Hardware | Lighting sensor module | Sensor data is collected with no interference from other objects | Partially |
| Sensor devices are firmly and steadily attached to the lighting housing | Partially | ||
| Sensor devices are continuously charged with no oscillations | Yes | ||
| Software | Sensor data collection | Calibration enables accurate data collection | Yes |
| Wi-Fi transmission and online storage of sensor data | Data is accurately transmitted across the architecture components | Yes | |
| Sensor data transmission and processing | The sensor is accurately collecting data under distinct conditions | Partially | |
| Both data and information are accurately transmitted and interpreted by BIM and IoT platforms, generating performance information and notification messages | Yes | ||
| Information visualisation | Information is accurate and easily visualised on SmartLab and e-mail interfaces | Yes | |
| Information is accurate and easily visualised on BIM platforms | Yes |
| Normal Status | Alert Status | Abnormal Status | ||||||
|---|---|---|---|---|---|---|---|---|
| the lamp is properly installed in the socket | the lamp is properly installed into the socket but covered with four sheets of white bond A4 paper | the lamp is removed from the socket | ||||||
| Measurement | Lighting Level (V) | Lighting performance (%) | Measurement | Lighting Level (V) | Lighting performance (%) | Measurement | Lighting Level (V) | Lighting performance (%) |
| 1 | 4095 | 100 | 1 | 2825 | 68.99 | 1 | 116 | 2.83 |
| 2 | 4095 | 100 | 2 | 2885 | 70.45 | 2 | 115 | 2.81 |
| 3 | 4095 | 100 | 3 | 2111 | 51.55 | 3 | 124 | 3.03 |
| 4 | 4095 | 100 | 4 | 3015 | 73.63 | 4 | 115 | 2.81 |
| 5 | 4095 | 100 | 5 | 2512 | 61.34 | 5 | 119 | 2.91 |
| 6 | 4095 | 100 | 6 | 2523 | 61.61 | 6 | 114 | 2.78 |
| 7 | 4095 | 100 | 7 | 2652 | 64.76 | 7 | 119 | 2.91 |
| 8 | 4095 | 100 | 8 | 2761 | 67.42 | 8 | 112 | 2.74 |
| 9 | 4095 | 100 | 9 | 2285 | 55.80 | 9 | 114 | 2.78 |
| 10 | 4095 | 100 | 10 | 2672 | 65.25 | 10 | 119 | 2.91 |
| 11 | 4095 | 100 | 11 | 2652 | 64.76 | 11 | 112 | 2.74 |
| 12 | 4095 | 100 | 12 | 2853 | 69.67 | 12 | 113 | 2.76 |
| 13 | 4095 | 100 | 13 | 1719 | 41.98 | 13 | 113 | 2.76 |
| 14 | 4095 | 100 | 14 | 2946 | 71.94 | 14 | 112 | 2.74 |
| 15 | 4095 | 100 | 15 | 2597 | 63.42 | 15 | 112 | 2.74 |
| Legend | ||||||||
| Performance Status | Normal | Alert | Abnormal | |||||
| Lighting performance | lp ≥ 70% | 50% ≤ lp < 70% | 50% < lp | |||||
| Category | Requirements | Assessment |
|---|---|---|
| Ability | Automatic detection and report of failures | Yes |
| Differentiation between emergency and non-emergency services | Yes | |
| Supply of information on the equipment to be maintained (e.g., manufacturer, etc.) | Yes | |
| Generation of reports towards supporting predictive maintenance and managerial decisions | Yes | |
| Information on the priority of attendance of each room | Partially | |
| Design | Use of standardised components (e.g., sensors, accessories for installation) and software that can be easily replaced and updated according to advances in technology | Yes |
| Use of device for mass storage | No | |
| Use of a robust system with a high degree of accuracy and low likelihood of failures, ensuring the timely detection of problems | Partially | |
| Assurance of safety data and information | Partially | |
| Integration with the existing systems and facilities with no replacement of existing Lightings | Yes | |
| User-friendliness, considering the distinct backgrounds of the professionals | Yes | |
| Accessibility to all maintenance team members via smartphone | Yes | |
| Supply of direct and automatic tools and interfaces towards supporting de-bureaucratisation of processes and improvements in their efficiency | Yes | |
| Low cost of implementation, maintenance, and operation and use of open BIM platforms to reduce costs | Partially | |
| Possibility to be managed by the university staff | Partially |
Publisher’s Note: MDPI stays neutral with regard to jurisdictional claims in published maps and institutional affiliations. |
© 2022 by the authors. Licensee MDPI, Basel, Switzerland. This article is an open access article distributed under the terms and conditions of the Creative Commons Attribution (CC BY) license (https://creativecommons.org/licenses/by/4.0/).
Share and Cite
Fialho, B.C.; Codinhoto, R.; Fabricio, M.M.; Estrella, J.C.; Ribeiro, C.M.N.; Bueno, J.M.d.S.; Torrezan, J.P.D. Development of a BIM and IoT-Based Smart Lighting Maintenance System Prototype for Universities’ FM Sector. Buildings 2022, 12, 99. https://doi.org/10.3390/buildings12020099
Fialho BC, Codinhoto R, Fabricio MM, Estrella JC, Ribeiro CMN, Bueno JMdS, Torrezan JPD. Development of a BIM and IoT-Based Smart Lighting Maintenance System Prototype for Universities’ FM Sector. Buildings. 2022; 12(2):99. https://doi.org/10.3390/buildings12020099
Chicago/Turabian StyleFialho, Beatriz Campos, Ricardo Codinhoto, Márcio Minto Fabricio, Júlio Cezar Estrella, Cairo Mateus Neves Ribeiro, Julio Mendonça dos Santos Bueno, and João Pedro Doimo Torrezan. 2022. "Development of a BIM and IoT-Based Smart Lighting Maintenance System Prototype for Universities’ FM Sector" Buildings 12, no. 2: 99. https://doi.org/10.3390/buildings12020099