Article

Performance of Modern Passive Stack Ventilation in a Retrofitted Nordic Apartment Building

1
Department of Mechanical Engineering, School of Engineering, Aalto University, 02150 Espoo, Finland
2
Department of HVAC, College of Urban Construction, Nanjing Tech University, Nanjing 211800, China
3
Smart City Center of Excellence, TalTech, 19086 Tallinn, Estonia
*
Author to whom correspondence should be addressed.
Buildings 2022, 12(2), 96; https://doi.org/10.3390/buildings12020096
Submission received: 29 November 2021 / Revised: 11 January 2022 / Accepted: 13 January 2022 / Published: 20 January 2022
(This article belongs to the Topic Ventilation and Indoor Air Quality)

Abstract

:
The paper analyses the performance of a five-storey apartment building equipped with modern passive stack ventilation in Nordic conditions. The passive stack ventilation system was retrofitted in 2019, and novel self-regulating air inlet devices with filters were equipped. The building was simulated with IDA ICE software, where the model of the self-regulating terminal units was developed using manufacturer product data. Several case scenarios were created to analyze the effects of poor maintenance, improved airtightness, and window opening on the system performance. For the analysis, one-room and three-room apartments on the second and fifth floors have been chosen. The CO2 concentration and indoor air temperature were analyzed and compared with EN 16798-1 standard guidelines. The results show a significant effect of poor maintenance and possibility to open windows on the CO2 concentration. The results also show a trend for the one-room apartments to overheat despite having a higher air change rate than the three-room apartments. The three-room apartments tolerate over-heating, although they are much more sensitive to poor maintenance. Furthermore, the apartments on the fifth floor are even more sensitive to poor maintenance, and three-room apartments there showed warning levels of CO2. Improving the envelope airtightness does not benefit the IAQ of the apartments.

1. Introduction

The general function of the building ventilation system is to provide occupants with enough fresh air while maintaining high energy efficiency. According to the WHO, IAQ is one of the most important determinants of human health and well-being, thus playing a significant role in the indoor environment of the building [1]. In the European Union (EU), most countries have their national building codes and normative documentation for the building design, which are binding [2]. The preferable indoor air quality and airflow rates are presented in the EU directives, binding for EU countries and standards. They are presented in such documents as Energy performance of buildings directive with levels of Energy performance Certification, EN 16798-1 standard in general, and EN 15214 in specific for the IAQ (indoor air quality) [3,4,5]. Most recommendations and buildings codes consider the minimum airflow rate, temperature level and CO2 concentration. In Finland, the building stock ventilation construction and design requirements are provided by the Ministry of Environment [3,6,7]. The documents consider new and retrofitted buildings separately as buildings of different ages present the stock [8].
Mainly, in Finland, the residential building stock is presented by 85% of all buildings. Blocks of flats represent only 4% of this number. However, they account for approximately 30% of the total floor area of the residential building stock and around 1.3 million occupants for the buildings with four floors or higher [9]. The buildings constructed before the 1950s are mostly equipped with passive stack ventilation. After the 1960s and until the 2000s, apartment buildings were typically equipped with mechanical exhaust ventilation thanks to the reliable and predictable airflow rates. New apartment buildings are mostly equipped with balanced mechanical ventilation [10].
The new buildings are required to follow strict heat losses standards, calculated with the compensation principle [7]. Although, starting from 2018, the requirements have changed, making it possible to utilize natural ventilation systems in buildings in certain conditions. After renovation and retrofitting, if a ventilation system is changed in an old building, it should have at least 45% heat recovery. However, if only the envelope is retrofitted, the ventilation system could remain the same [10,11]. Additionally, in the case of protected buildings, energy performance requirements are not applied instead of following the standard requirements for major renovation often require separate permission for retrofitting from the Finnish Heritage Agency. In practice, it creates a building stock equipped with natural ventilation presented with a passive stack ventilation system that operates in Nordic conditions.
Overall, natural ventilation utilizes the wind driving forces and thermal buoyancy forces to provide airflow [12]. The basic wind-induced ventilation concept is windows opening ventilation with single or crossflow. This approach is widely used in detached houses and apartment buildings in warm climates [13,14,15]. However, these systems are likely to create draughts and are not applicable in cold climates. Wind towers and windcatchers have been introduced to further the advancement of technology in cold climates. This approach gives a centralized source of airflow, which may be distributed and used to create systems with heat recovery and regulated airflow rate. These systems have limitations applied to the residential apartment buildings though, such as building height, floor number and local weather conditions [13,16].
On the other hand, natural ventilation can also be realized by thermally induced ventilation. The passive stack ventilation systems often present a basic ventilation strategy of this type. This approach is widely used in the cold climate to create underpressure in the apartments, thus enabling ventilation by infiltration through the envelope. However, these systems are strongly dependent on the outdoor conditions and the indoor-outdoor temperature difference [17]. The advancement of this technology includes solar chimneys and double skin facades. The solar chimneys create a centralized air distribution that is also controllable. However, this technology requires a significant amount of solar radiation throughout the year [18,19,20]. The double-skin facades create buoyancy-driven airflow between internal and external envelopes or between external and internal glazing. This airflow may be controlled and utilized for heat recovery. These systems are energy-efficient but sophisticated and mainly utilized in office buildings [21,22,23].
In practice, old buildings are usually equipped with passive stack ventilation systems with windows opening ventilation for the warm period of the year [24]. Some of these buildings are also equipped with self-regulating inlet devices. The inlet devices maintain the designed airflow rate by different means: indoor-outdoor pressure difference, outdoor temperature, or manually controlling the slot size [25,26]. The devices with pressure control show a reliable constant airflow rate in laboratory measurements [27]. Component performance field studies for warm and mild climates show a predictable performance for cases with a 10 Pa pressure difference or higher, thus, the airflow characteristics depend on the opening degree of the slot [28]. The system simulation studies of different types of buildings with mechanical exhaust ventilation and passive stack ventilation with self-regulating inlet devices in Belgium indicate poor IAQ conditions for low-pressure indoor to outdoor difference and possible draft issues [29]. The field studies with occupant surveys in Portugal assessed the IAQ in social buildings with partly natural ventilation, introduced by self-regulated inlets. It is reported that the average air change rate is 0.6–0.7 ACH and thermal comfort, presented with PMV and PPD in class B [4,30]. However, it is also reported that self-regulated inlets had been sealed in 40% of apartments due to draft issues and cold sensations during the winter [31]. Further laboratory device testing and investigation showed malfunction of pressure-control inlets due to the membrane, leading to an inconsistent airflow rate that differs from manufacturer data [32]. Another field study in Porto of 40 social residential buildings showed an air change rate level of 0.35 ACH in winter, best-case scenario, and around 0.1 ACH in August, in the worst-case scenario. Some of the inlets were also sealed by the occupants [33]. A study in the UK has identified that, for a significant period of time, the supply of outdoor air via the inlet devices will not provide a Category A according to the UK building regulation [30] perceived indoor air quality index [34].
In the Nordic climate, the interest in implementing such devices is presented in retrofitting protected or heritage buildings. These buildings have limited or no access to the retrofit of the envelope and ventilation system. Some retrofitted apartment multi-storey buildings in Finland are equipped with self-regulating inlets with outdoor temperature control to preserve a natural passive stack ventilation system. The ventilation system is designed for the nominal conditions; however, natural ventilation performance depends on the outdoor conditions, and yearly performance has not been assessed. Some studies have investigated the performance of the self-regulated inlet devices in cold climate via CFD analysis [35,36]; yet, no studies regarding the building ventilation system performance in Nordic climate were found. Another investigated performance of slot-controlled or pressure-controlled inlet devices, although the self-regulating inlet device with outdoor temperature control, which works on reducing the inlet area when the outdoor temperature decreases, was not assessed or simulated in the literature.
The paper novelty comes from the performance assessment of a multi-storey apartment building with natural ventilation retrofitted with self-regulated air inlets in Nordic climate. The building presents old heritage and protected building stock with limited or no access to the ventilation system reconstruction, demanding to be retrofitted to perform according to the EN energy and IAQ standards [37,38]. The importance of renovation and decarbonization of old stock buildings also empathizes with the recent European renovation wave strategy [39]. Natural ventilation systems performance depends on outdoor and weather conditions and may significantly vary during the year, making it essential to make a simulation to meet the requirements. The building performance simulation reflects various cases with the effect of poor maintenance, different retrofit strategies such as the implementation of shading and improved envelope airtightness, and effect of buildings user behaviour. Such a ventilation system has individual filters for each apartment, making maintenance demanding. The poor maintenance cases investigate the influence of dirty inlet device filter, passive stack duct, and a combination of those. The different airtightness cases describe the influence of envelope retrofitting. The air movement is also provided by infiltration and exfiltration through the building envelope; thus, the airtightness of the building might also influence the ventilation system performance. The occupant behaviour cases describe different schedules for opening windows and doors as the occupants operate doors, possibly creating additional airflow resistance. The research evaluates the impact of these factors on the system performance, along with weather conditions and building height. In this study, a building model was created in IDA ICE with a custom component to describe the temperature-dependent self-regulating inlet. The IAQ parameters were calculated and evaluated concerning requirements and legislation. The internal airflows were also calculated for various periods and assessed. The main research question is if the ventilation system with modern passive stack ventilation has sufficient performance in a multi-storey building in the Nordic climate.

2. Materials and Methods

2.1. Target Values

The chosen parameters reflect such metrics as CO2—the direct IAQ indicator and reflection of the EN standards, temperature—thermal comfort and overheating indicator, internal airflow and air change rate as an indicator of IAQ, internal airflow patterns and reflection pf EN standards. The target values used in this paper are based on national Finnish building codes, legislations and European standards EN 16798-1 [38] and EN 15251 [37] for the IAQ parameters, the CO2 concentration in residential apartments in specific.
The requirements forced by the Ministry of the Environment define overheating in the living spaces of the buildings as apartments being more than 150 °Ch over 27 °C [7]. This requirement applies to the simulated indoor temperature from June to August in the design phase of the new building, and the simulation input data required by the building code are used. In this paper, this rule is used to evaluate overheating risk and thermal comfort. However, it is not applicable to fulfil this requirement due to the different building code input data. Additionally, the requirement by the Ministry of Social Affairs and Health of Finland for all the existing residential buildings or other living spaces is 30 °C as the maximum health-related temperature for the elderly people who are cared for in the residential living spaces and 32 °C as the overall maximum indoor air temperature [40].
The guidelines suggested by EN 15251 are applied for CO2 concentration analysis. The CO2 concentration is presented for the I to IV indoor air categories with a base concentration assumed to be 430 ppm [41]. The categories from I to III present acceptable CO2 levels, also referring to the apartment airflow rates. The IV category presents all other possible cases allowed in the apartments only for a limited period of the year.
All the data are presented in hourly mean values. The degree hours are also calculated with hourly mean values.

2.2. Building Description

For the purpose of analysis, an apartment building with passive stack ventilation in Southern Finland, Helsinki, has been chosen. The building was constructed in 1951 and recently renovated during 2016–2018. The building is located close to the city centre and is sheltered from direct wind by an adjacent apartment building. During the renovation, it was equipped with self-regulating air inlet devices with filters. The building consists of 5 floors and have 600 m2 of net floor area. The ground floor is non-residential. The four residential floors have the same apartment and room layout, shown in Figure 1.
Three-room and one-room apartments on the second and fifth floor in one staircase have been chosen for the analysis and presented in Figure 2.
The outdoor air in apartments is supplied into bedrooms and living rooms through the inlet devices and the envelope. The separated exhaust stack ducts are located in the kitchen and WC. The apartment room layout and ventilation design are presented in Figure 3.
The envelope properties, window properties and other building structure properties are set according to the common practice of the construction year and shown in Table 1. The load-bearing structures of the building are massive concrete, external walls are two rows of burnt bricks with insulation layers, internal walls between the apartments are brick walls, and internal walls between rooms are lightweight structures with an air gap. The envelope airtightness was set according to the building year for the reference case, and the air leakage rate (n50) equals 2.4 L/h at a pressure difference of 50 Pa [24].
The internal doors have a gap at the floor level of 2 cm. The windows are 2 panes glazed with a U-value of 2 W/m2K and are equipped with integrated shading with blinds between panels. The window blinds are manually controlled according to the occupation profile and the intensity of solar radiation (>100 W/m2). In three-room apartments, all windows besides the ones in the kitchen are openable. In one-room apartments, all windows are openable. The openable windows area is 10% of a window.
The water radiators carry out space heating with a dimensioning temperature of 70/40 °C, and the heat distribution efficiency is 80%. The design powers are 100 W/floor-m2 on the top floor and 60 W/floor-m2 on the middle floor. The temperature setpoint of space heating is 21 °C in the apartments. In the staircase and basement floor, the setpoint of space heating is 17 °C. The annual net heating demand of domestic hot water (DHW) is 35 kWh/m2 per heated net floor area. It is assumed that DHW consumption is constant with time. Heat losses of the DHW circuit are 0.56 W/m2, and 50% of the heat losses were assumed to end up as internal heat gains in the zones.

2.3. Inlet Device

The self-regulating inlet devices are installed in the living rooms and bedrooms of the apartments. The inlet device regulates airflow based on the outdoor temperature. The minimum opening is 4 mm, and the maximum is 16 mm for −5 °C and lower, and +15 °C and higher, respectively, and the settings are linear. The inlet device flow characteristics are presented in Figure 4. The bedrooms are equipped with a 160 mm diameter inlet device with a nominal setting of 9.3 L/s at a pressure difference of 5 Pa. The living rooms are equipped with 100 mm diameter inlet devices with a nominal setting of 5.1 L/s at a pressure difference of 5 Pa. The flow characteristics are presented in Table 2.

2.4. The Building Usage

Household equipment’s total annual electricity consumption is 21.0 kWh/m2 per heated net floor area [7]. The appliances are used every day between 9:00 and 22:00. The total annual electricity consumption of indoor lighting is 7.9 kWh/m2, per the building’s total heated net floor area [7]. The electric lighting power is assumed to be evenly distributed by the floor area of all the simulated zones in the apartments and by the floor area of the staircase. The usage time of the lights is between 21:00 and 23:00 from May to August and 7:00–9:00 and 15:00–23:00 from September to April [10].
  • The occupational patterns for the rooms and the apartment occupant number are presented in Table 3.
  • The windows opening schedule is set according to the script, that during the cold period, from September to April, the windows are closed. The windows are opened from May to August if the outdoor temperature exceeds 12 °C, and indoor temperature exceeds 22 °C.
  • The internal doors of the bathrooms or WCs are always closed, but the other internal doors inside the apartments are always opened.
  • The apartments’ occupant activity level is 1.2 MET.

2.5. Weather Data

The weather data are presented with typical climatological conditions at the Helsinki-Vantaa weather station in southern Finland for the 2012 reference year [42,43]. The data consist of hourly outdoor air temperature, relative humidity, direct and diffused insolation, wind speed and direction. The temperature and wind speed are presented in Figure 5. Heating degree days at indoor temperature +17 °C annually are 3952 °Kd in the reference year.
For the purpose of the air change rate and airflow rate analyses, three weeks have been chosen. The week with the lowest outdoor temperature in winter, a week with outdoor temperature close to average 2 °C and high average wind velocity in spring, and the week with the highest outdoor temperature in summer. The outdoor conditions for chosen weeks are presented in Table 4.

2.6. IDA ICE Simulation Tool

The model of the building has been created with the IDA ICE dynamic building simulation tool [42,44]. The software allows the modelling of multi-zone buildings and provides simultaneous dynamic simulation of heat transfer and airflows, considering flows between zones, building envelope and windows. It calculates the interactions between building structures, HVAC systems, operational and occupancy schedules of the building, and outdoor climate conditions. The infiltration airflows are calculated by wind pressure on each façade combined with zones stack effects.

2.6.1. Façade Pressure Calculation

Wind pressure distribution around the house is simulated using the normal assumption in building engineering that the wind flow is horizontal and an atmospheric boundary layer is neutral without vertical airflow. The wind conditions of the environment were approximated using the wind profile equation reported in [34], see Equation (1).
Wind pressure on facades corresponds to the LBL model wind profile:
U ( h ) = U m · k · ( h h m ) a ,
where U ( h ) is the wind speed at height h (m/s), U m is the wind speed measured on open ground at the weather station (m/s), h is the height from the surface of the ground (m), h m is the height of the measurement equipment (10 m), and parameters k and a are terrain-dependent constants.
The simulated building is located in a typical Finnish city center area with closely built houses where the height of adjacent houses is approximately the same as the simulated one.
However, this study simplified the calculation of wind conditions, and wind pressure coefficients were not measured nor simulated.
The values of the wind pressure coefficients are approximated values for low-rise buildings surrounded by obstacles equal to the height and size of the house. The shape of the building being studied is more complicated, so the simulated wind pressure distribution around the building was also simplified.
The wind pressure outside the building facades P w is determined by Equation (2):
P w = c p · 1 2 ρ o u t · U 2 ,
where ρ o u t is the outdoor air density (kg/m3), Cp is the wind pressure coefficient, and U is the local wind velocity defined by Equation (1).
Because of the square dependence of the wind velocity in Equation (2), wind velocity has a more significant effect on wind pressure than the value of the wind pressure coefficient. The local outside surface pressure P s on the building facades is:
P s = P o u t ρ o u t · g · h + P w ,
where P o u t is the outdoor air pressure at ground level (Pa), ρ o u t is the outdoor air density (kg/m3), and g is the acceleration of gravity (m/s2).
The pressure difference between the zone and outdoor air is calculated as:
Δ P = P i n ρ i n · g · h i n P s ,
where P i n is the indoor air pressure at floor level (Pa), ρ i n is the indoor air density (kg/m3), and h i n is the height from floor level (m).

2.6.2. Internal Flows Calculation

IDA ICE calculates the internal flows for each zone, where large vertical openings such as an open door between the zones are simulated as bi-directional flows. The vertical flow profile in the opening depends on the density differences between the adjusted zones. If the densities are equal, the flow profile is flat. Otherwise, it is slanted. In the case of a flat velocity profile, the air mass flow between the zones is calculated with the standard orifice flow equation:
Q = C d · A 2 ρ · Δ P ,
where C d is a discharge coefficient and A is the area of the opening (m2). In the case of a slanted profile, the airflow between the zones is simultaneously bi-directional.
  • The windows are also presented with bi-directional flow openings and have 0.65 discharge coefficient, and 10% of those openable are for the mean of airflow calculation.
  • The envelope cracks (leakage) are presented as external area infiltration distributed based on the power law. The exfiltration and infiltration are separated.
  • The internal doors have a 2 cm gap for air movement. The apartment entrance door has the mail slot, which is a crack with a k coefficient equal to 9.3 × 10⁻⁴ and power-law exponent 0.7 [45].
  • The model for the internal nodes of the simulation model is fully mixed for the concentration calculation, such as CO2 level.

2.6.3. Passive Stack

The passive stack ventilation is implemented with the standard IDA ICE chimney model with stacks of different heights according to the floor. The chimney model considers the inlet and outlet loss coefficient, duct roughness, duct shape and height. The model calculates bi-directional flow.

2.6.4. Inlet Device

The self-regulating inlet device was created as a custom model based on the infiltration model with temperature-dependent power-law k-factor and exponent equal 0.5. The model has a simultaneous single direction flow.
The k-values for the inlet device and filter were calculated from the manufacturer product data for designed airflows. The following equation was used for the volumetric airflow rate:
q v = k · Δ p ,
where q v is volumetric airflow rate and Δ p is component pressure drop.
The k-value has been calculated for the given inlet device positions and linearly interpolated between the data points. The k-value has been coupled with outdoor temperature and presented as a function in Figure 6.
The calculated function for the bedroom and living room inlet devices has been used in the simulation model to calculate the airflow according to the pressure difference and outdoor temperature. Dirty filters were simulated by decreasing k-values twice, assuming that the filter had been working for the year without maintenance [46].

2.7. The Simulation Case Description

The CO2 level during the year and indoor air temperature during the summer have been chosen to assess the IAQ. The CO2 level is used as an indirect indicator for the room and personal airflow rate and compared against standards [7,10]. The indoor air temperature has been used to assess the influence of the airflow rate in apartments and occupant personal conditions.
The apartments on the second and fifth floors were chosen to represent the influence of the height on the stack effect. One and three-room apartments were selected to represent the influence of different floor areas and inlet supply ventilation system configuration.
The three time periods have been chosen to address the most critical weather conditions for the passive stack ventilation: the coldest week during the winter, a week with an average outdoor temperature of 2 °C combined with the highest average wind during spring and a week with warmest outdoor air temperature. The results during the cold week present the influence of a significant pressure difference. The spring conditions represent the case with a low pressure difference and the absence of additional windows opening ventilation. The summer case has the lowest pressure difference and influence of additional windows opening ventilation. The apartment air change rates have been calculated to present the apartment airflow rates for the chosen time. For the reference case, internal airflows and their direction have also been calculated.
A range of cases, descriptions, and abbreviations have been created to assess the chosen parameters, shown in Table 5 and Table 6.
The reference case represents the case where the inlet devices and passive stack duct are clean, and only the bedroom doors are closed at night. The windows shading is realized with blinds and operated according to the solar insolation. The windows are closed for the cold period from September to April for most of the day and open for half an hour, 22.00–22.30. In the summertime, windows are always opened if the outdoor temperature is higher than 12 °C and indoor higher than 22 °C, Table 6. The stack duct has the summed pressure loss coefficient of passive stack equal to 15. In the best-case scenario, all the doors are always opened.
The cases with dirty inlet device filters (M1) and passive stack ducts (M2) are created to represent poor maintenance cases, where the filters and duct are not serviced for more than 1 year. [46] The dirty filter is described as in the reference case presented in inlet device characteristics but with half the standard k-value. The stack duct has the summed pressure loss coefficient of the passive stack increased to 40. In these cases, the roles of the inlet device and the passive stack are assessed. The case with improved airtightness (M3) represents a building with better envelope insulation, and thus higher airtightness of 1.5 L/h to assess the influence of the infiltration airflow change on the indoor conditions. The case with no windows shading (M4) represents no integrated blinds between glazing. The cases with non-openable windows (M5) describe the ventilation only via infiltration and inlet devices, and represent the scenario where windows are not operated for some reason, such as occupant inability to do it. The worst-case scenario (M6) describes the case with closed doors due to the occupant’s possible preference or draught issues.

3. Results

3.1. Apartment Indoor Temperature Overheating Analysis Results

The apartment overheating was assessed based on the indoor air temperature results. The results are presented for three-room and one-room apartments on the second and fifth floor to consider the size of apartments and height factor influences. The results are shown for the summer period, June to August, as figures, duration curves, and tables with degree hours, in Figure 7 and Figure 8 and Table 7 and Table 8, respectively. The results are presented first for the three-room apartments and then for one-room apartments for each described case. The colours for the figures are used consistently throughout the paper to show the correlations.
The simulation shows the significant influence of the poor maintenance and ability to open the windows on the overheating possibility. The indoor air temperatures in the three-room apartments on the second and fifth floors are shown in Table 7 and in Figure 7. The reference case, best case, and cases with poor maintenance (M1, M2) show acceptable performance on both floors. The case with no integrated window blinds (M4) shows a warning performance level on the second floor and is unacceptable for new buildings on the fifth floor with more than 150 °Ch above 27 °C. The cases with no window opening (M5, M6) show a poor level of performance with most hours spent above 27 °C and around 300 °Ch above 32 °C for the first floor. For the fifth floor, more than 1000 °Ch are spent above 32 °C, which is above health legislation [40].
Overall, the higher floor shows lower performance due to more insolation, and results indicate lower airflow rates in the apartments.
The indoor air temperatures in the one-room apartments on the second and fifth floors are shown in Table 8 and in Figure 8. The results have the same trend as three-room apartments with indoor air overheating in the cases with no windows shading (M4) and non-openable windows (M5, M6). Smaller apartments have higher indoor air temperatures during the summer and are more likely to overheat, resulting in a dangerous level of performance with most hours spent above 32 °C and more than 1000 °Ch and 3800 °Ch for the first and fifth floor in the cases with no window opening (M5, M6). Time spent above 32 °C is an overall health warning level and 30 °C is a health risk for the elderly people.

3.2. The Indoor Air Quality Results

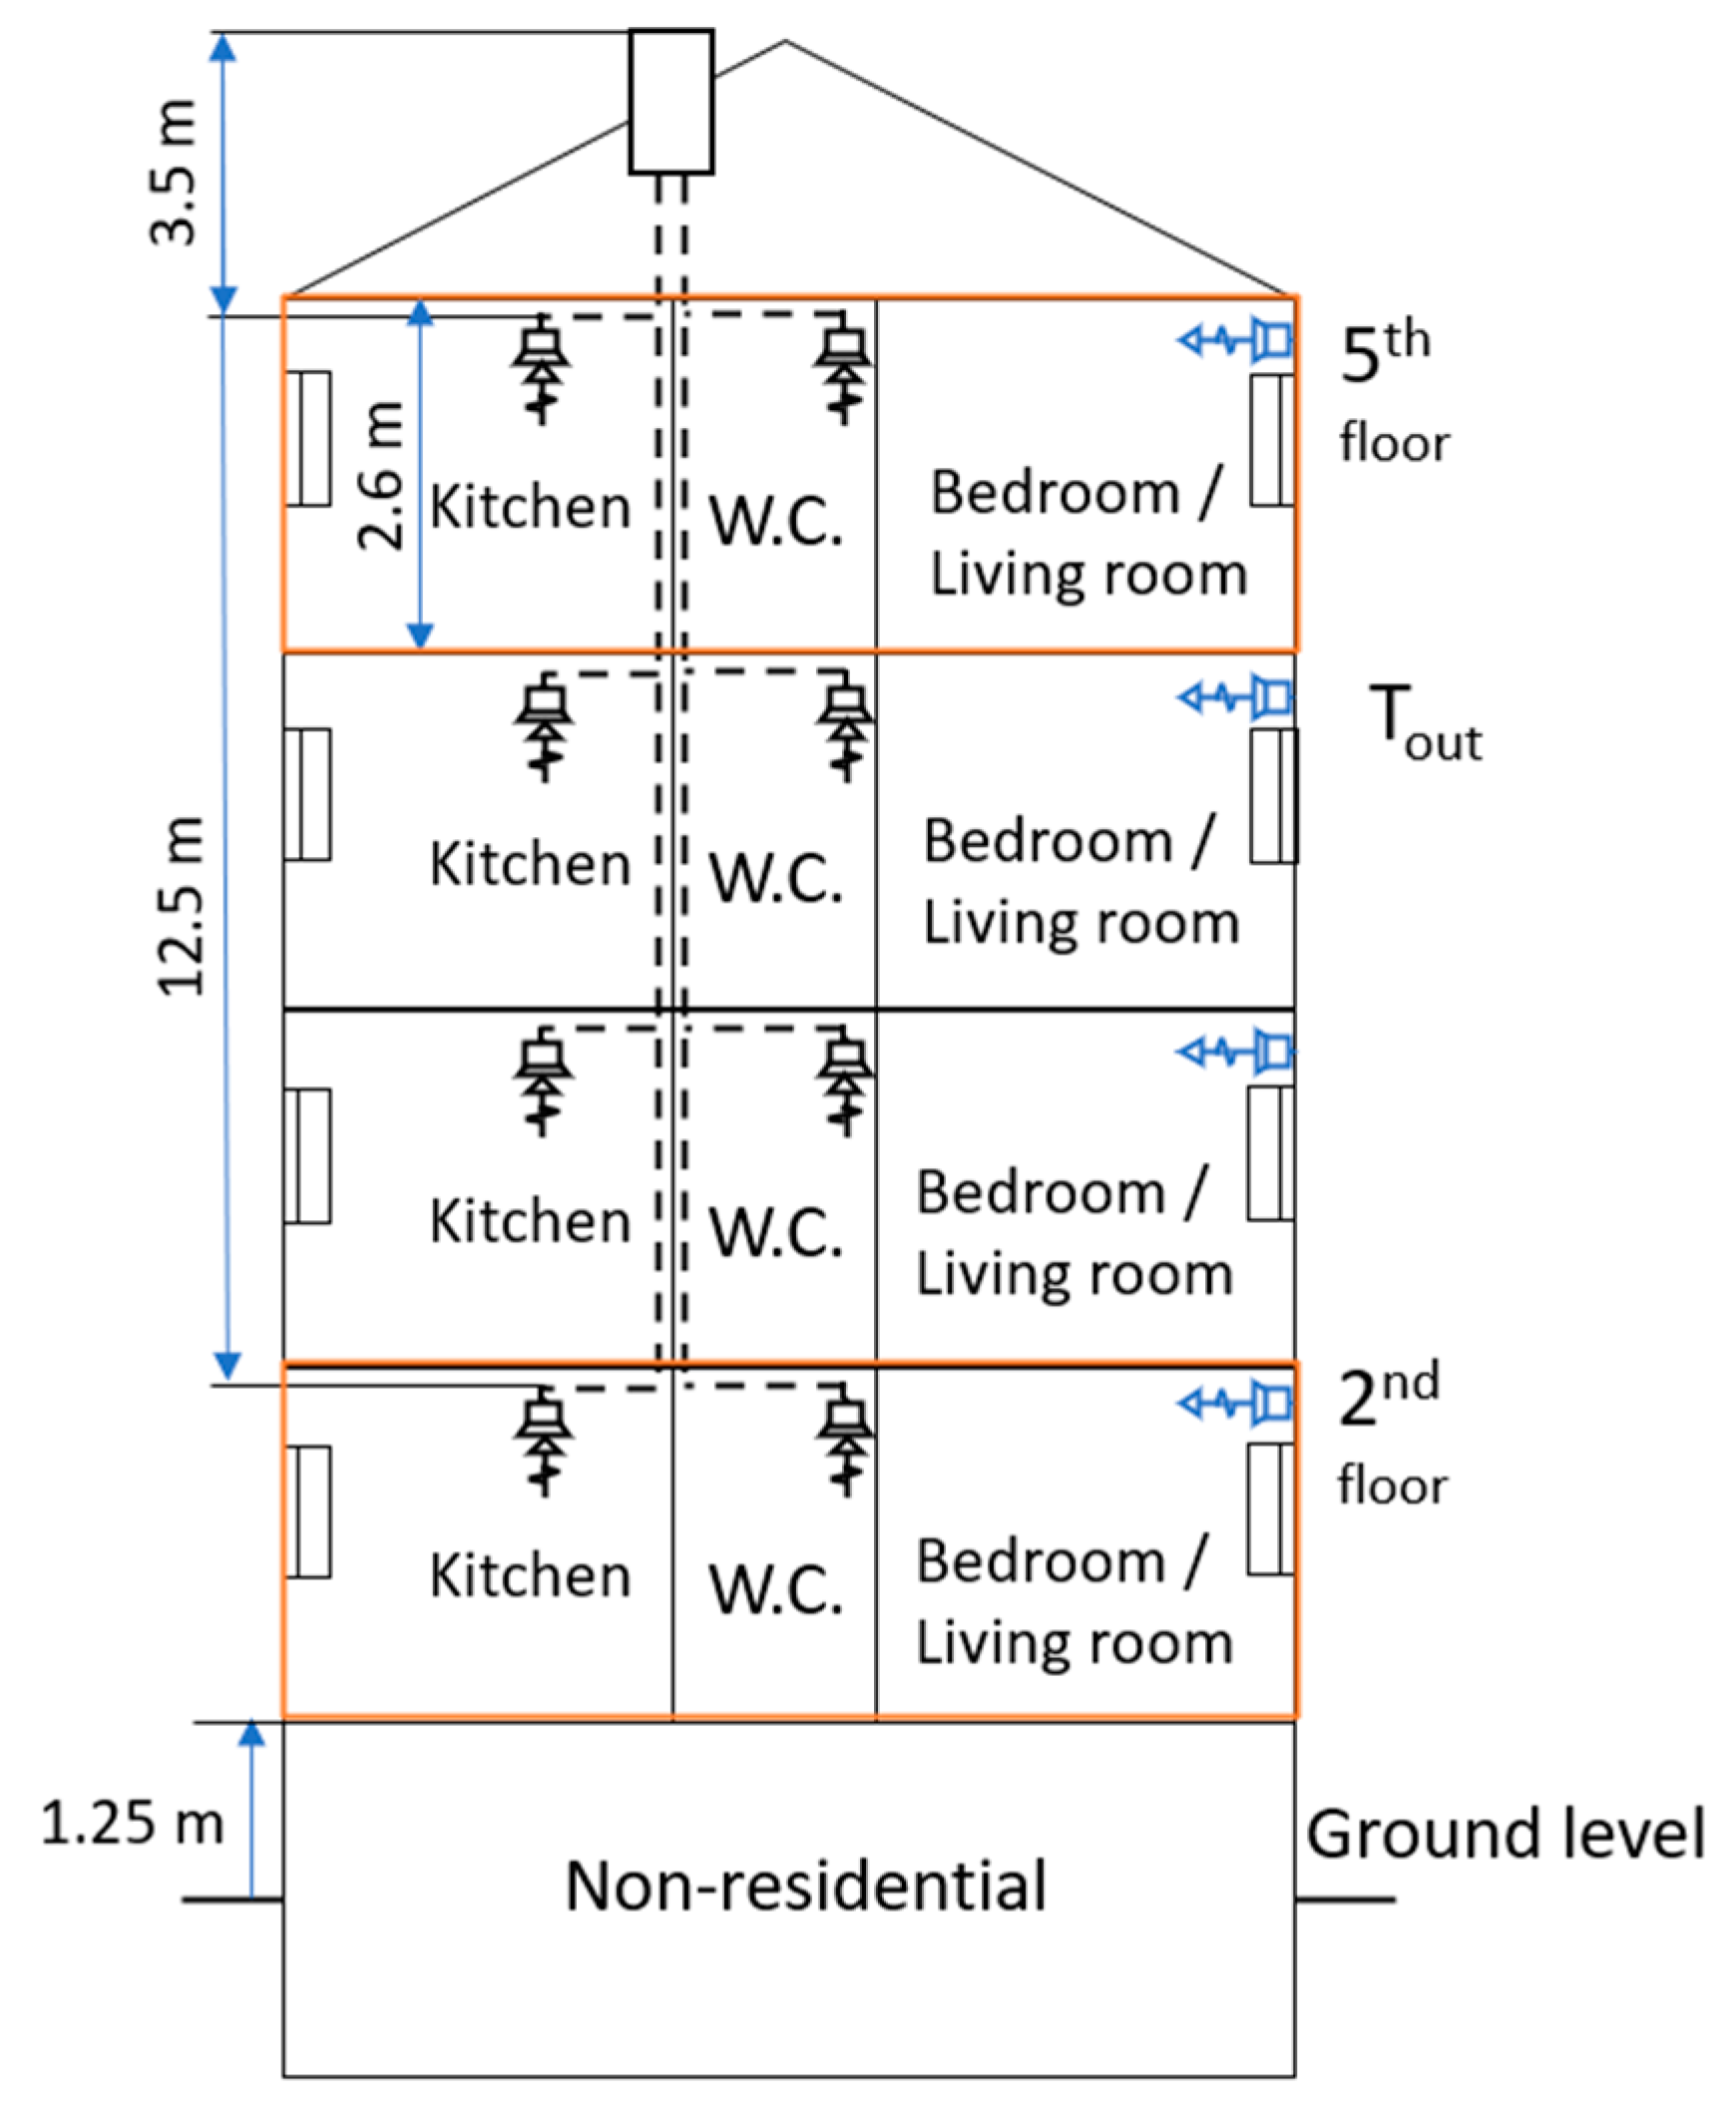
The results are presented for three-room and one-room apartments on the second and fifth floors. The results are presented separately for the winter and summer periods to present the influence of the opening window ventilation and to make the results comparable to the overheating analysis. The winter period is from January to April, and the summer period is from May to August to consider the heating period.

3.2.1. Apartment Bedroom Average CO2 Concentration Analysis Results

The CO2 concentration in the three-room apartments on the second floor is shown in Table 9 and 
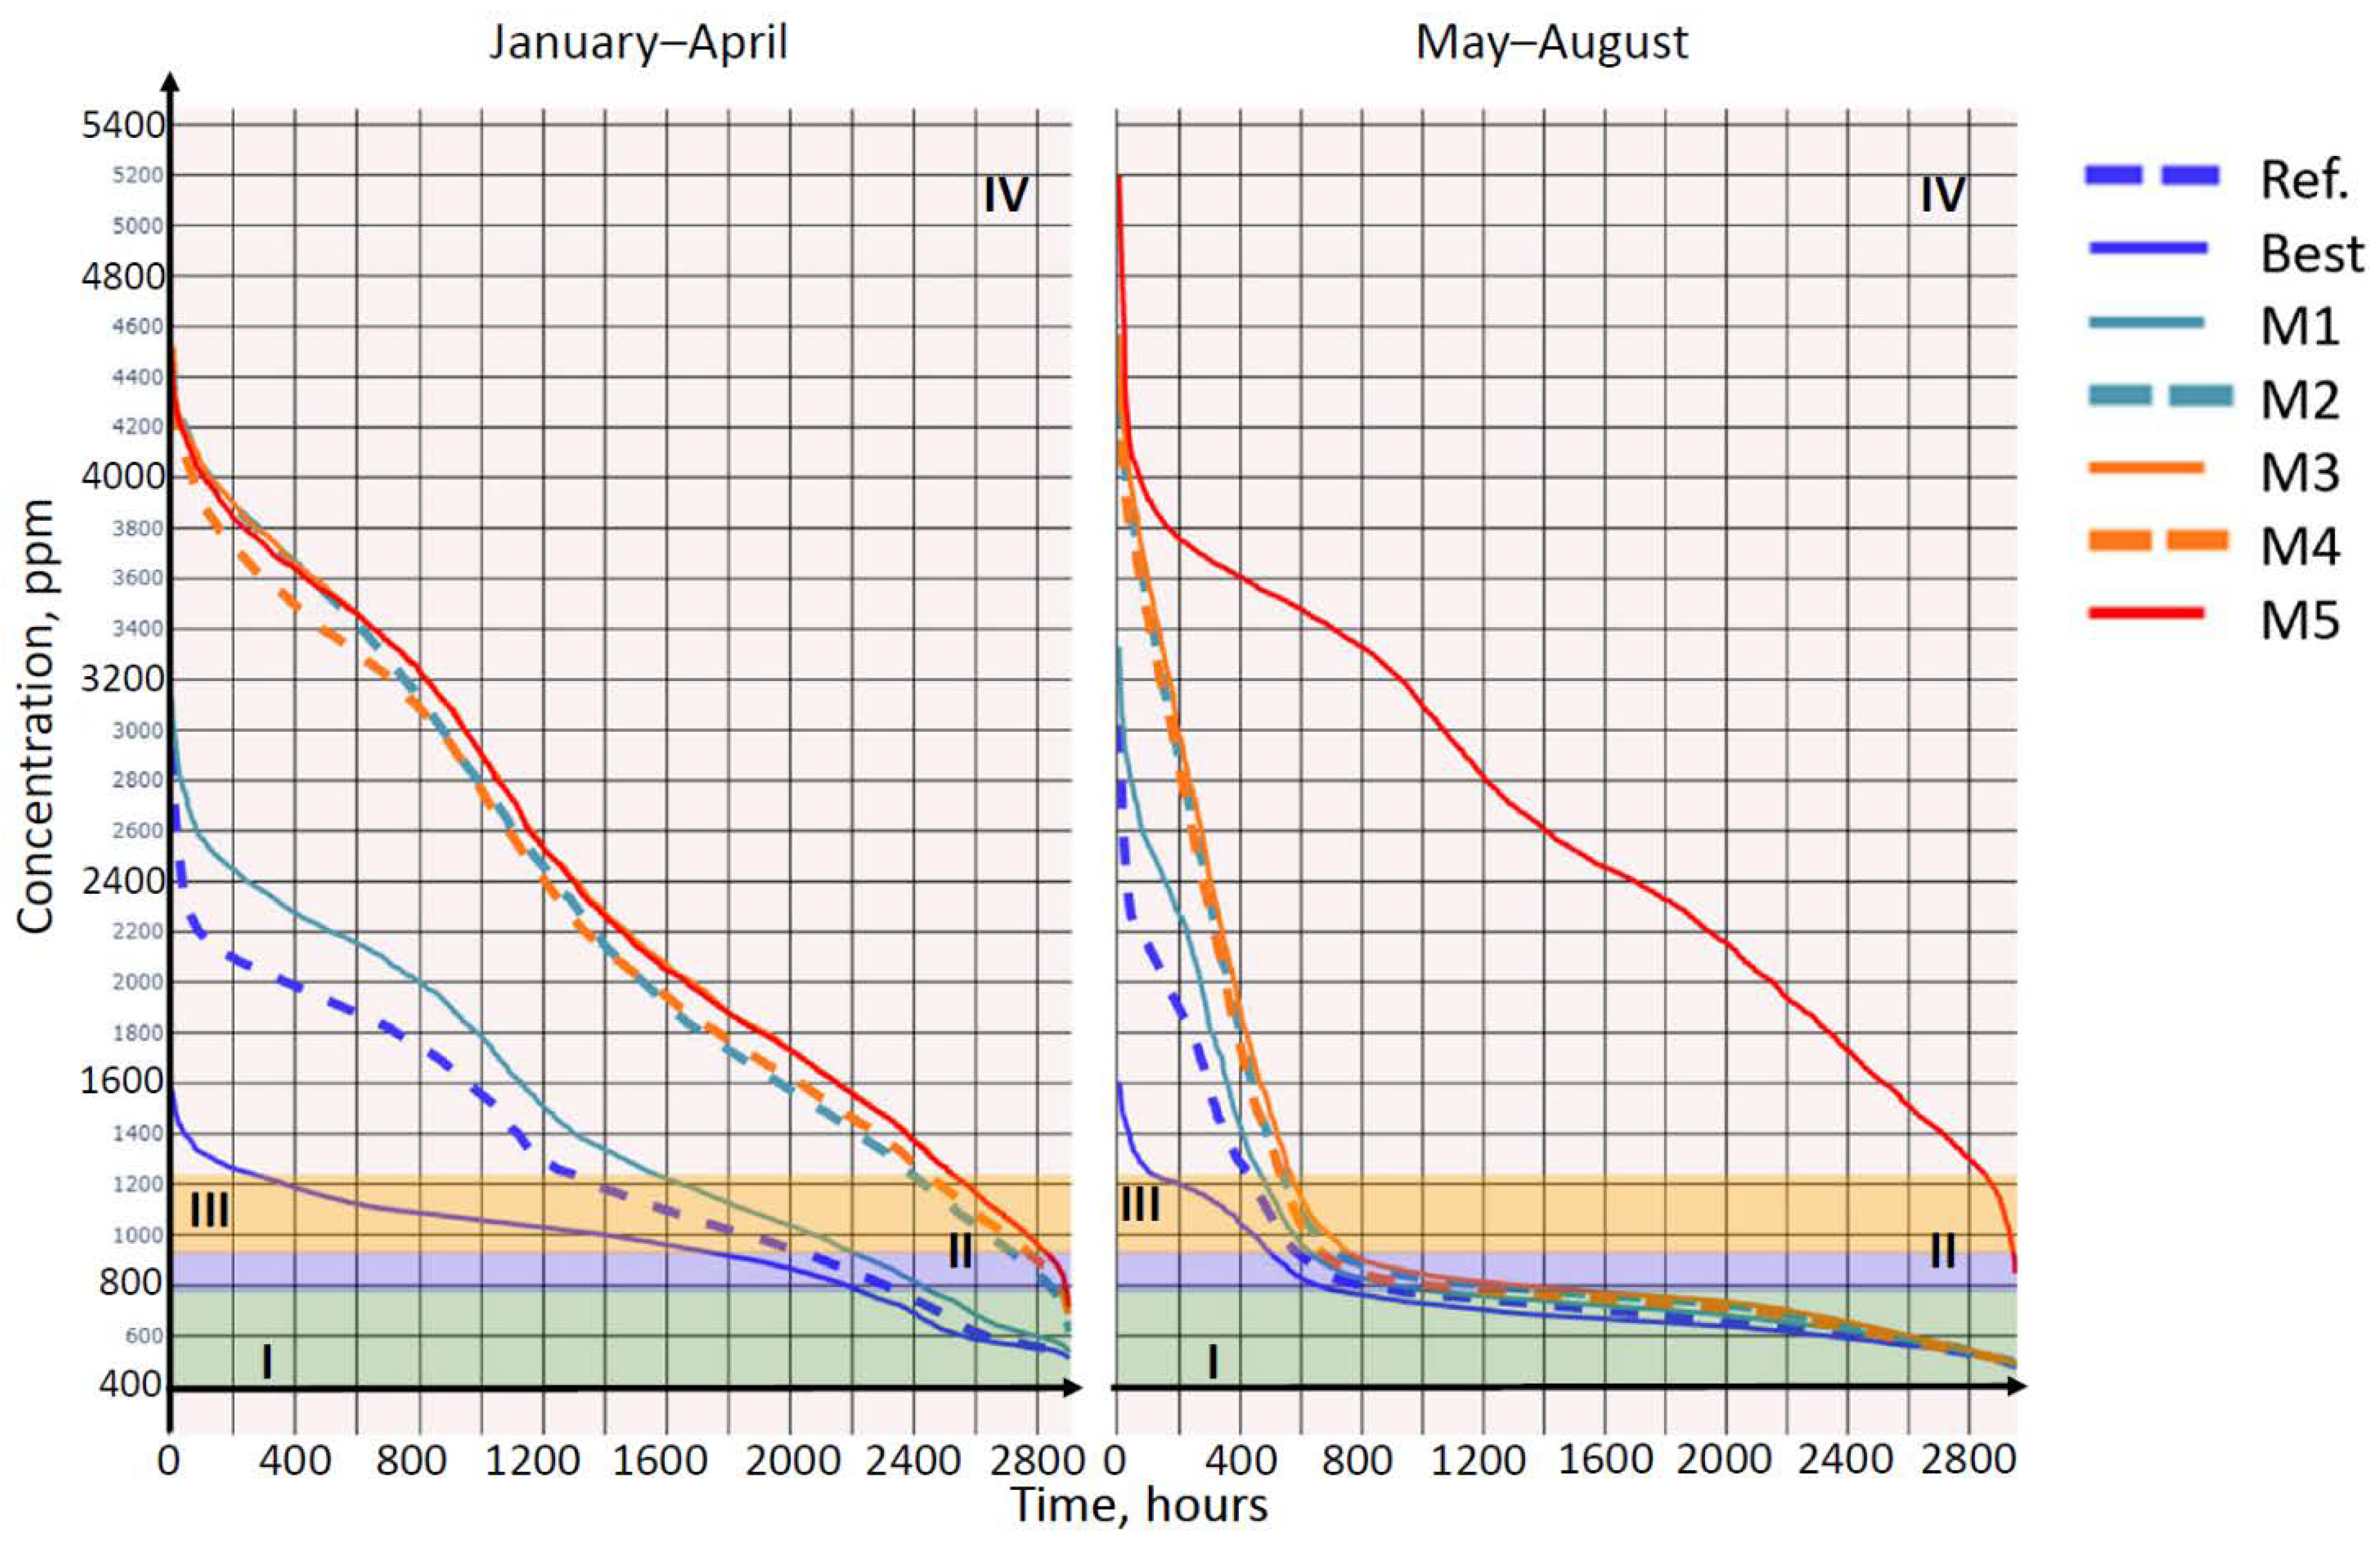
Figure 9. In winter, in the best-case scenario, the occupants spend more than 40% of the time in indoor air categories II and III and in I [37] for the rest, and the concentration is around 720 ppm on average. The reference case shows a significant effect of the occupant and door schedules, transitioning to more than 50% in the II and III categories and 890 ppm on average. Cases with maintenance issues (M1, M2) show the effects of dirty inlet device filter and passive stack duct, further deteriorating the IAQ to 25% and 35% at the IV category for the dirty filter and its combination with stack duct, with the concentrations at 960 ppm and 1200 ppm on average. High airtightness (M3) and non-openable window (M4) cases show the worst performance, with an average of around 45% of the time in the IV category and 1350 ppm.
In summer, the additional opening ventilation significantly improves cases with maintenance issues, with only around 12% and 13% of the time spent in the IV category and about 670 ppm on average. The case with high airtightness (M3) shows the same performance as the previous ones. The case with non-openable windows (M5) show the worst performance, most of the time in the IV category and around 1600 ppm on average.
The CO2 concentration in the three-room apartments on the fifth floor has the same trend as on the first floor, although the average level is much higher, as shown in Table 10 and Figure 10. Compared to the first floor, occupants spend more time in the III and IV category and only around 20% and 10% in I and II in reference, best and M1 cases. The average concentrations are around 1000 ppm. Other cases in winter (M2–M5) are presented only in the time spent in II, but mostly in III and IV categories with about 4%, 10% and 85%, respectively, with average concentrations of about 2400 ppm.
In summer, the additional opening ventilation significantly affects cases with openable windows (Ref., Best, M1–M4) showing better performance, with only around 16% and 18% of the time in the IV category and about 1000 ppm on average. Although, the case with non-openable windows (M5) shows the worse performance, with most of the time in the IV category and around 2600 ppm on average as the stack effect is lower in summer and the stack duct length in fifth floor apartments is also about three times shorter.
The CO2 concentration in the one-room apartments on the second floor is shown in Table 11 and Figure 11. Overall, in winter, most of the time is spent in the I and II categories. In the best, reference and case with dirty inlet device filter (M1), at around 100% of time spent in the I category. All other cases have comparable performance with around 60% and 30% in the I and II categories with 700 ppm on average.
In summer, the performance has the same trends as in the three-room apartments. The average time spent in the I category for all cases slightly decreased for the best reference and case with a dirty inlet device filter (M1). However, more maintenance issues (M2) and improved envelope airtightness (M3) showed better performance due to the additional airflow through the windows. The performance of the worst-case scenario is around 20%, 30% and 50% at the III, II, and I categories and indicates the significance of the additional airflow through the windows.
The CO2 concentration in the one-room apartments on the fifth floor has the same trend as on the first floor and the same, as three-room apartments on the fifth floor. Overall, the average level is between three-room apartments on the first and fifth floor. The results are shown in Figure 12 and Table 12.
In the best case, around 90% of the time is spent in the I category in winter. The rest of the time is spent in the II category. The average CO2 concentration is 650 ppm. The reference case shows a significant effect of the occupant and door schedules, transitioning to more than 25% in the IV category and 790 ppm on average. Case with dirty inlet device filter (M1) shows further deterioration of the IAQ to around 25% in the IV category. The combination of dirty inlet filter and stack duct (M2) shows mostly the same performance as with additional combination with high airtightness (M3) and non-openable windows (M5) with around 45% time in IV category and 1470 ppm on average. The worst-case (M5) with non-openable windows shows the worst performance with 45% in the IV category.
In the summer case, the additional opening ventilation significantly affects all cases, showing better performance. The best reference and cases with maintenance issues (M1, M2) show around 80% in the I and II categories with only around 2%, 4%, 12%, and 13% of the time in the IV category for reference case, cases with maintenance issues (M1, M2) and case high airtightness (M3). The case with non-openable windows (M5) shows the worst performance with 50% in the IV category.

3.2.2. Apartment Internal Airflow and Air Change Analysis Results

The results for the internal airflow rate and air change rates for the apartments are presented in Figure 13 and 
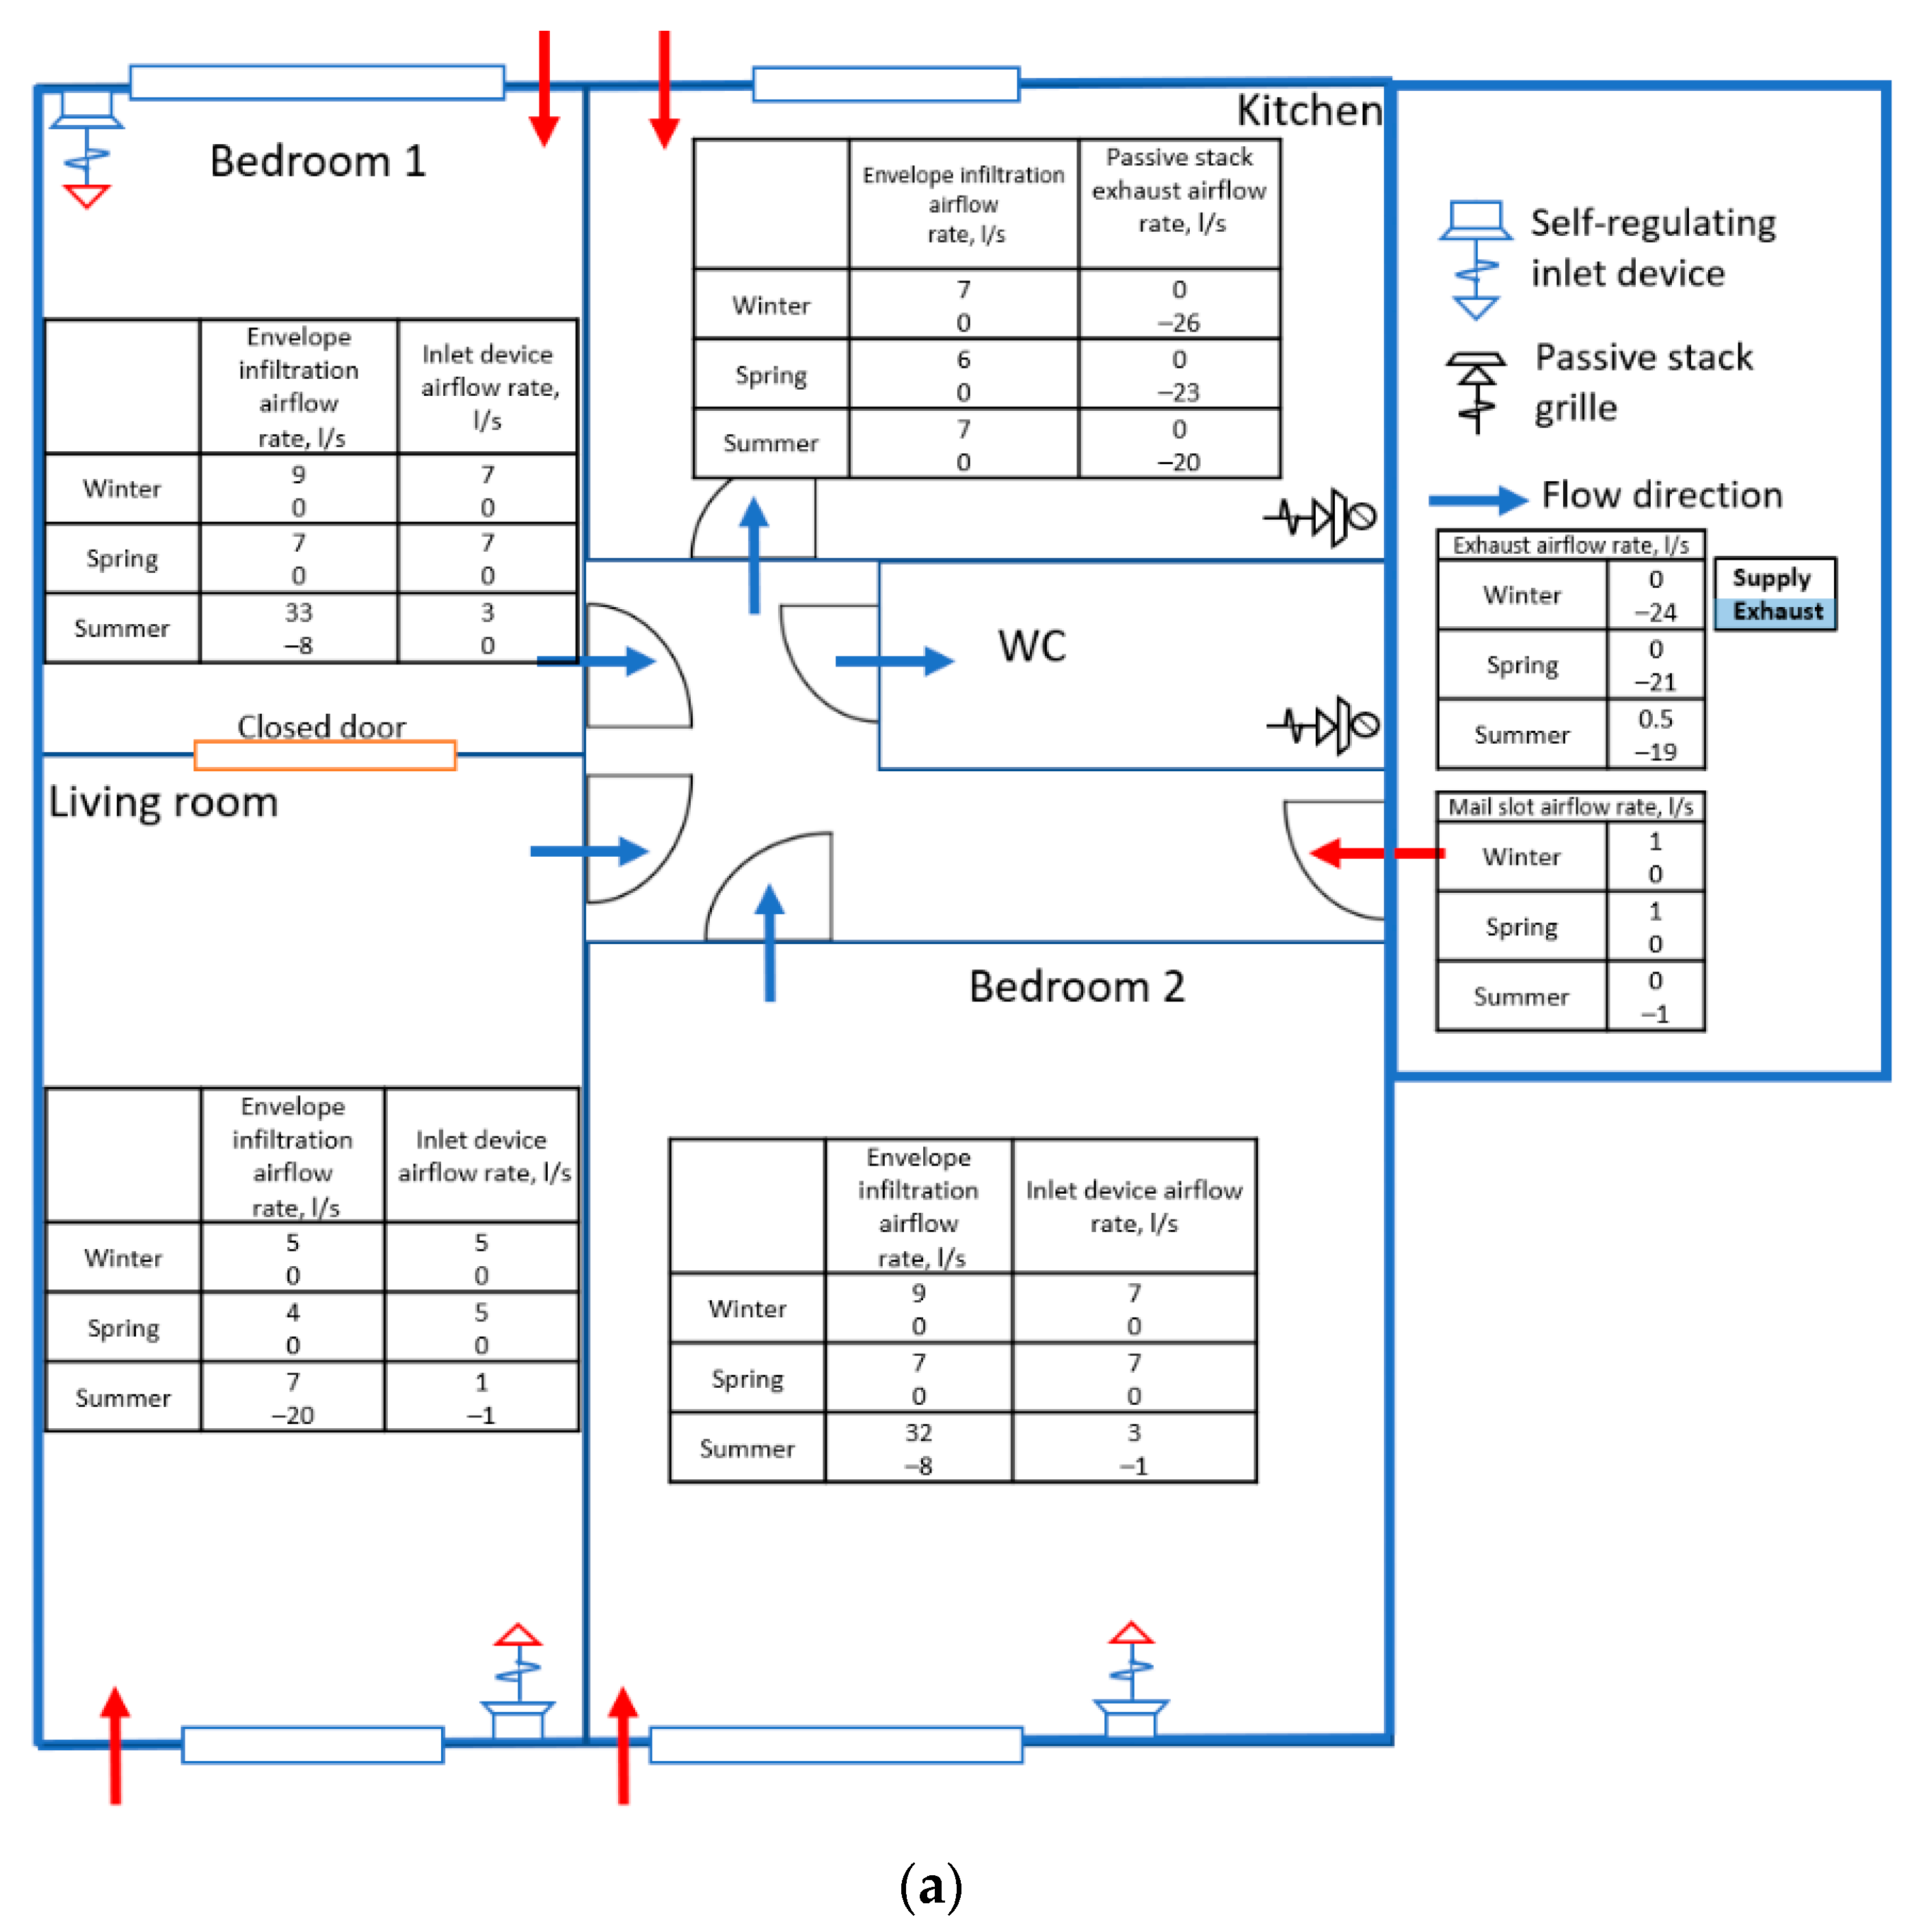
Table 13. The airflow and air change rates are average during the chosen weeks in winter, spring and summer. The nominal air change rate shows rate at 15 °C as a nominal conditions. In figures, arrows represent the average airflow direction through envelope and windows and between the rooms through doors. Additionally, the mail slot is taken into consideration as a connection to the stairwell. Tables show the average airflow rate for each room. Table 13 shows air change rates for the reference case, for the cases with poor maintenance and the worst-case scenario to show the overall influence of factors on the air change rates of the apartments. The ventilation air change rate was calculated for the exhaust airflow rate through the passive stack. The total air change rate was calculated for the exhaust airflow rate through the passive stack, envelope and windows, considering all outcoming airflow rates.
Results show the trend for the apartments air change rate. The apartments on the second floor have a higher air change rate of around 15% than apartments on the fifth floor due to the higher buoyancy effect. The ventilation air change rate deteriorates from winter to summer in all cases in percentage from 20% to 50% compared to winter cases. The total ventilation air change rate deteriorates from winter to spring around 20% compared to the winter case. The total air change rate is highest in summer due to the additional airflow through windows opening, around 20% higher than the winter case.
The one-room apartment on the fifth floor shows the highest air change rates across the apartments. However, cases show increasing deterioration from reference to the worst case at around 15%, 30%, 40% and 50% between summer and spring ventilation air change, respectively. The combination of maintenance issues shows the most significant relative effect on the air change rate. In summer, the trend is the same with 5%, 23%, 29% and 30% reductions, respectively.
The one-room apartment on the fifth floor shows less significant relative deterioration from reference case to worst case. Although, the overall air change rate is much lower. The deterioration is around 6%, 25%, 31%, and 31% for the summer case. The air change rate plummets in the spring by about 13%, 37%, 43%, and 47%, respectively. The combination of maintenance issues shows the most significant relative effect on the air change rate. In summer the trend is the same with 5%, 23%, 29% and 30% reductions.
The three-room apartment on the second floor shows a lower air change rate than both one-room apartments. Additionally, the deterioration trend from reference to worst case stays the same with around 4%, 50%, 57%, and 64% for summer. The air change rate is the same for reference case and M1 in the spring but plummets by about 52%, 57%, and 57%, respectively. The dirty inlet filter and passive stack duct combination (M2) shows the most significant relative effect on the air change rate. The trend is the same in summer with no change for the M1 case and 62% for the rest, respectively.
The three-room apartment on the fifth floor shows the lowest air change rate across the simulated apartments. The overall trend is the same. However, the case with a dirty inlet device filter also affects the results. The simulation shows deterioration from reference case to worst case of around 13%, 52%, 57% and 57% for summer. In the spring, the air change rate plummets by about 20%, 40%, 33% and 33%, respectively. The combination of maintenance issues shows the most significant relative effect on the air change rate. In summer the trend is the same with 23% for the M1 case and 62% and for the rest, respectively.
The apartment airflow rate in the one-room apartments on the fifth floor is shown in Figure 14. Due to the vertical location differences of second and fifth floors the airflow rate is lower by around 20%. The infiltration airflow rate in the bedroom is mostly equal to the inlet device airflow rate in winter and spring cases. In summer, the windows opening ventilation combined with infiltration accounts for around 80% of outdoor airflow.
The lowest apartment total supply airflow rates are presented during the springtime on both floors, with 27 L/s and 17 L/s for the second and fifth floors, respectively. In winter, the apartment total airflow rate is around 32 L/s and 25 L/s. The total apartment and supply airflows are the highest in summer, around 45 L/s and 28 L/s, respectively. During the summer, the reversed airflow may occur due to the apartment overheating. This also indicates a low apartment airflow rate in that period. Although, a low average reverse airflow rate indicates that it is a rare occurrence.
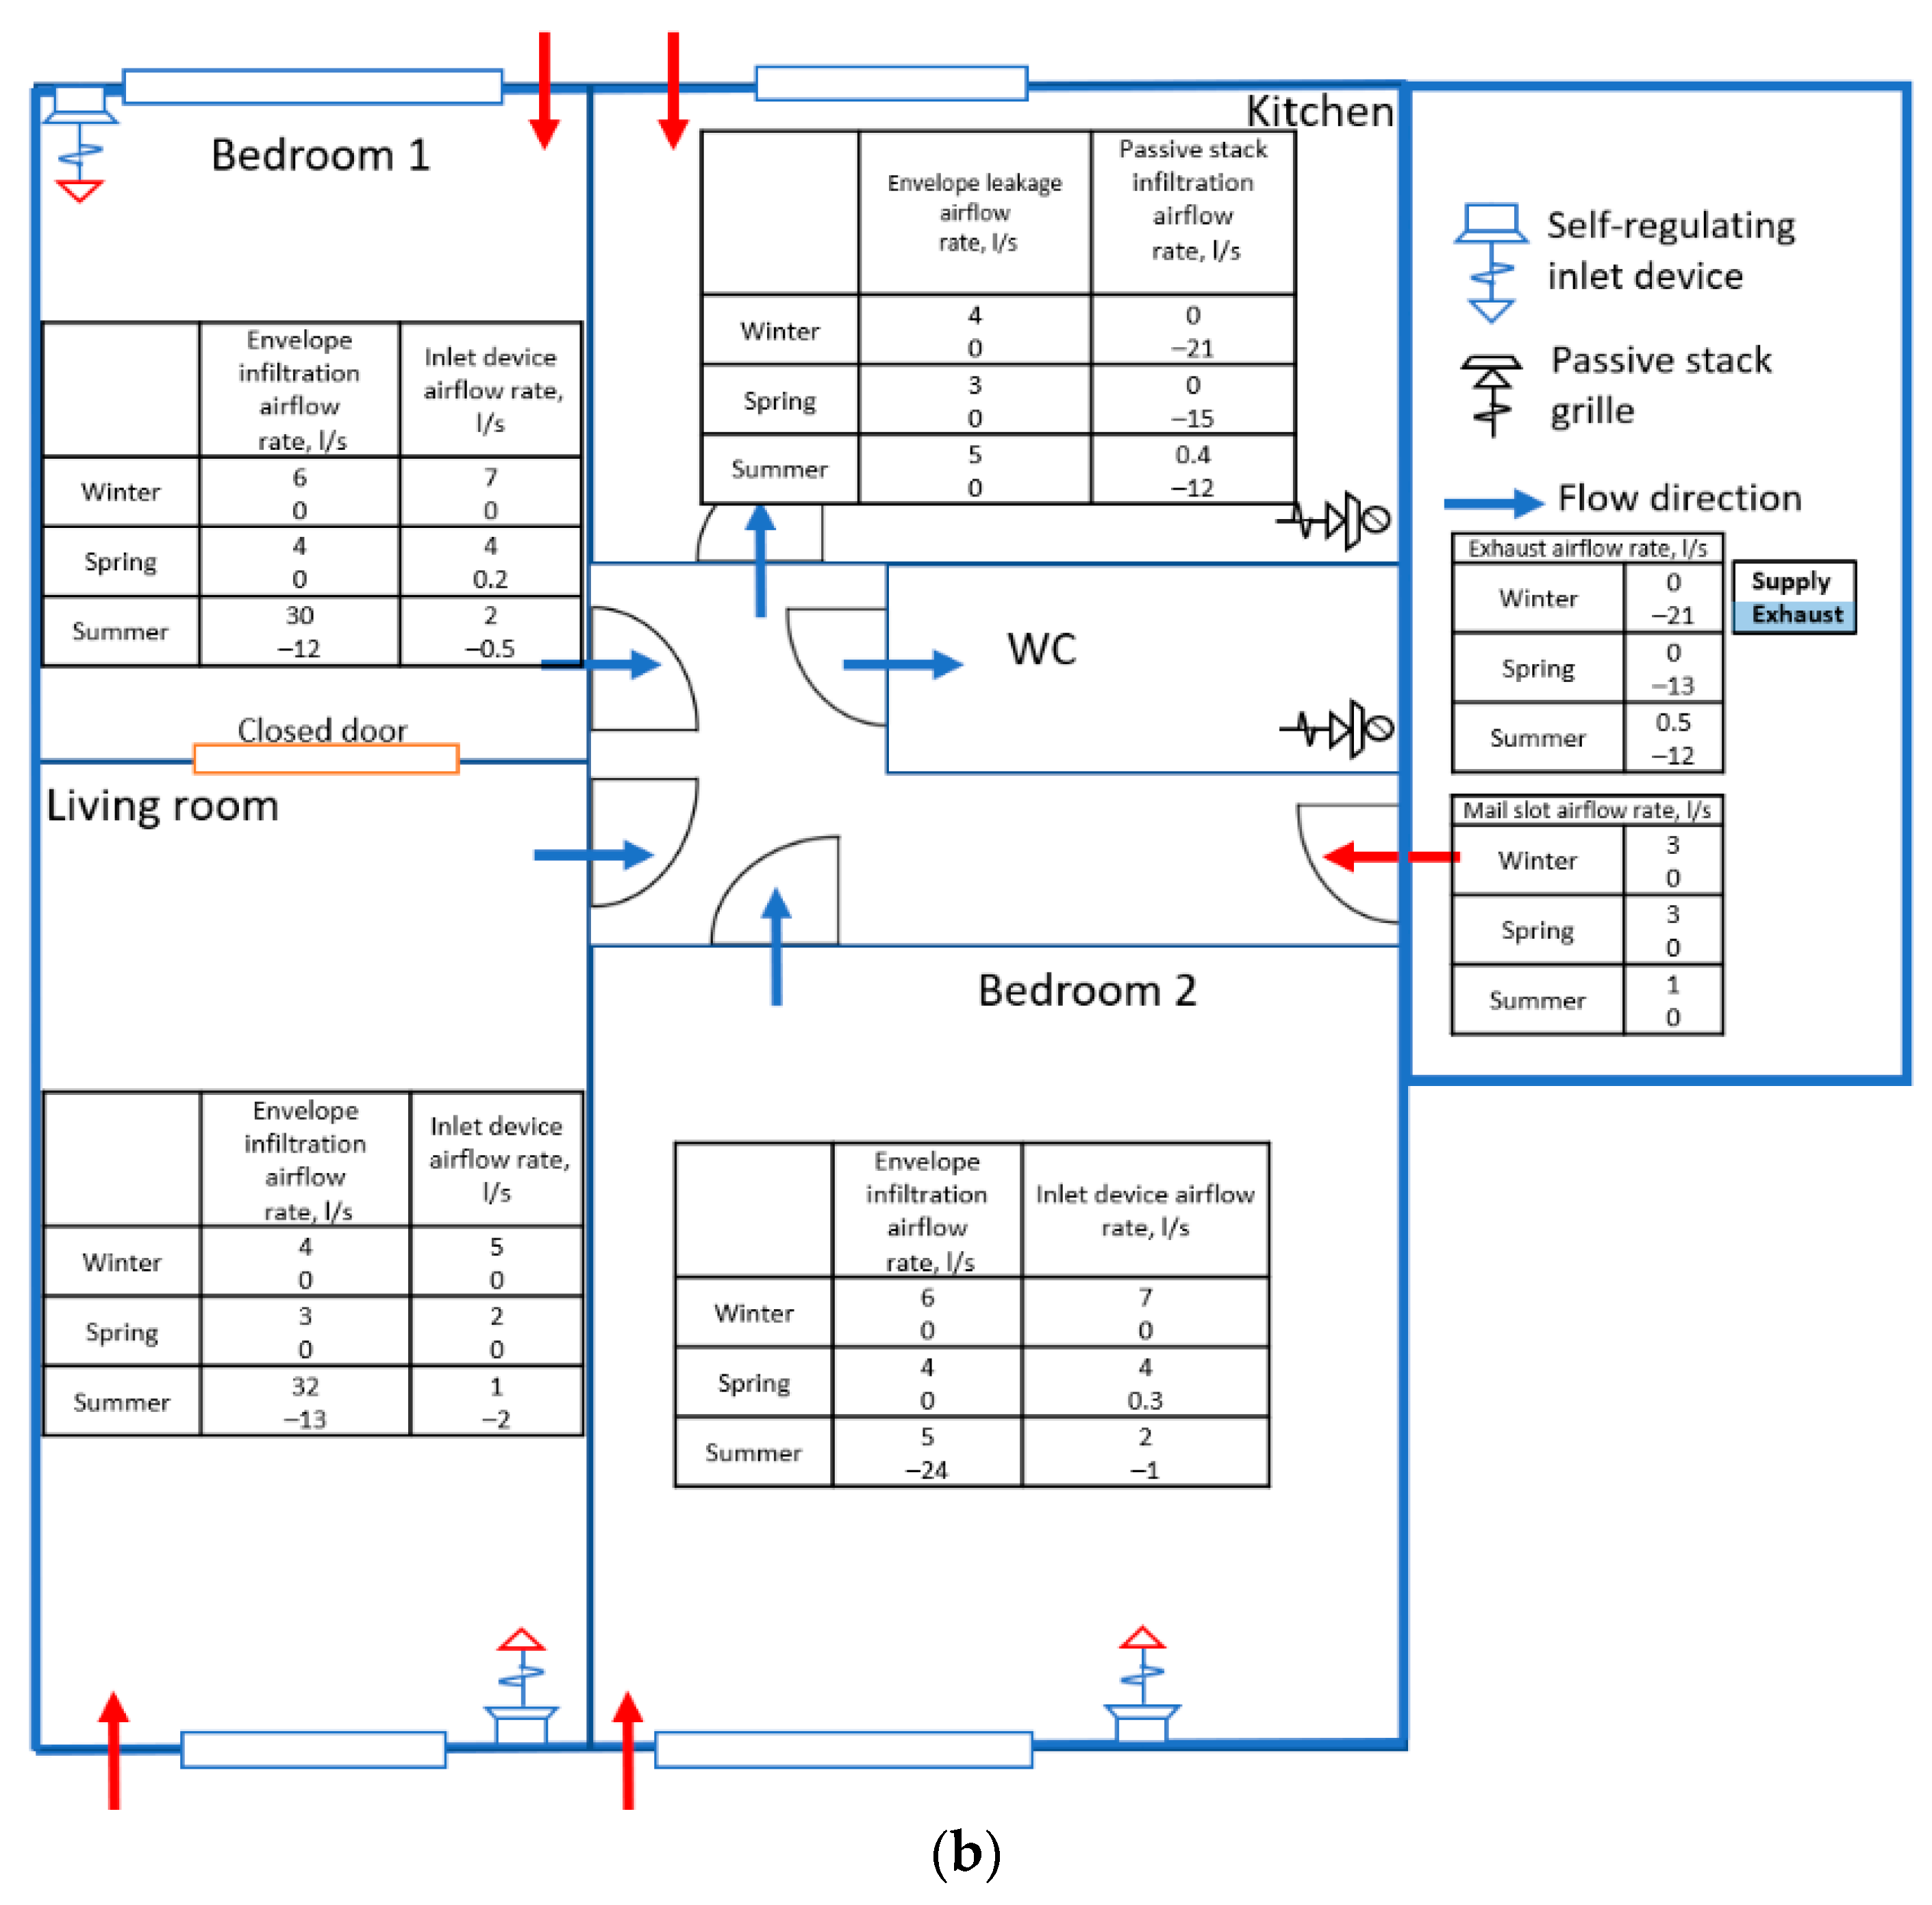
The apartment airflow rate in the three-room apartments has the same trend as in one-room apartments and shown in Figure 14, with the fifth floor lower by around 30% than the second floor due to the vertical position difference. The infiltration airflow rate in the bedroom is also almost equal to the inlet device airflow rate in winter and spring cases. In summer, the windows opening ventilation combined with infiltration accounts for around 75% of supply airflow.
The lowest apartment total supply airflow rates are presented during the springtime on both floors, with 44 L/s and 27 L/s for the second and fifth floors, respectively. In winter, the apartment total airflow rate is around 50 L/s and 42 L/s. The total supply airflow is the highest in summer, around 79 L/s and 72 L/s, respectively.
During the summer, the reversed airflow is also presented due to the apartment overheating. This also indicates a low apartment airflow rate in that period. Although, low average reverse airflow rate indicates that it is a rare occurrence.

4. Discussion

Apartment retrofitting requires a simple but efficient solution to provide adequate IAQ, energy performance, and retrofit costs. It is particularly important for protected or heritage buildings with natural passive stack ventilation and no or limited access to the building envelope or ventilation system changes. One of the solutions is the implementation of self-regulating inlet devices to preserve the initial ventilation system and envelope and provide designed airflow rates and low costs as it is commonly assumed that natural ventilation does not have much maintenance. However, modern self-regulating inlet devices have filters that require at least yearly maintenance, which should be done by the service company or by occupants. The results clearly show that maintenance of the modern passive stack system with openable apartment windows is essential. These results are to consider, as if it is the occupant responsibility to do maintenance, it might be a challenge doing that without much experience. On the other hand, if the service company does it, it requires labour and the ability to visit apartments to be carried out. Additionally, the maintenance of the passive stack duct should be carefully planned to prevent its clogging.
It is also crucial to avoid overheating in the cases of a group of vulnerable people, such as elderly people who have openable windows but cannot operate them. Otherwise, the apartment temperature exceeds 30 °C, which is a health risk for elderly people. In some cases, the temperature exceeds 32 °C, which is a health limit for other occupants.
The three-room and one-room apartments, both equipped with the same exhaust system, consist of two passive stacks in the bathroom and kitchen. The difference is the number of rooms with inlet devices and an external surface for infiltration, thus lowering system resistance. In general, it means that three-room apartments are more sensible for the passive stack ventilation system poor maintenance than one-room apartments. Therefore, three-room apartments on the fifth floor with a low buoyancy effect show a CO2 level higher than 4000 ppm. On the other hand, improved airtightness in such apartments does not benefit the ventilation system and IAQ performance.
It is presented in the simulation of the reference case that the CO2 level in one-room apartments is lower than in three-room apartments. However, they are much more likely to overheat. Although, this is partly mitigated by the fact that the air movement rate in a one-room apartment is higher, creating more pleasant indoor thermal conditions.
In cases with poor maintenance, with dirty inlet devices and passive stack, the most crucial effect is shown on the fifth-floor apartments for the CO2 level, which rises due to the significantly lower passive stack exhaust rates. The case with improved airtightness restricts infiltration and exfiltration airflow rate in all the apartments. It leads to significant overheating in the one-room apartments with an indoor air temperature of 30 °C and higher. The additional airflow rate of the windows opening ventilation shows a crucial effect with a much lower CO2 level in summer. However, the window opening ventilation has its limitation due to the outdoor airborne and noise pollution, and it is preferable not to be utilized in the cities with high population density, near roads and traffic lines.
The limitations of the study are mostly presented with physical model limitations and case-specific input data. This simulation analysis assesses the average airflow and air change rates calculated via hourly average outdoor conditions. However, the momentary airflow rate may be significantly different. The building simulation model considers building design and structure, device parameters, occupant behaviour, and lighting and heating schedule, but it still has some limitations. The simulation model is created with separate nodes for each room, but each node represents the entire room. All the nodes are calculated to be in balance. The distribution of the parameters within each node is calculated only for the boundary elements, such as inlets, doors and windows. As the distribution in each node, room, is even as for the mixed model, the calculated values are average, but local values are needed to analyze draught. This means that cold draughts, airflow patterns etc., may be calculated indirectly and may significantly change the occupant thermal comfort sensations. The case-specific input is presented with the Nordic climate weather and outdoor conditions. The façade wind pressure coefficients and building structure materials were assumed according to the building age. Furthermore, the inlet device model is created based on the design manufacturer data, representing its theoretical performance and placed according to the building documentation. The pressure drop in filters and stack ducts in cases of poor maintenance has been assumed based on literature. The case building is presented with five floors; thus, the simulation results for high-rise buildings might differ due to the significant effect of the wind pressure.
The simulation results of ACH may be compared against previous experimental studies of passive stack ventilation. The study was conducted in the warm climate of Portugal and showed a good correlation. The average air change rate was 0.6–0.7 ACH with window opening ventilation [31] and the air change level of 0.35 ACH in winter, best-case scenario, and around 0.1 ACH in August, in the worst-case scenario for the cases without opening ventilation [33]. Additionally, the results agree with previous field studies in Nordic climate, Helsinki, where the mean air-exchange rates in apartments had a high variation (average 0.6 L/h, range 0.1–1.2 L/h) [47]. The ASHRAE minimum value of 0.35 L/h was not achieved in 28% of all dwellings, and the average air change rate in the naturally ventilated apartments is 0.64 L/h [47]. Some previous studies assessed the CO2 in the cold climate, Beijing, in bedrooms, concluding the necessity of additional windows opening ventilation. The maximum CO2 level was observed at around 4000 to 5000 ppm [48].
Natural ventilation advancements present the trend of making systems less dependent on outdoor weather conditions and having reliable and constant airflow rates. In practice, one of the most demanding paths is the building stock retrofit, which requires high IAQ, but simple solutions, presented with such devices as self-controlled air inlets or passive stack outlets and wise windows opening strategies. The results and highlighted points may be considered in the renovation design for the buildings with passive stack ventilation in the Nordic conditions to ensure good IAQ and prevent apartment overheating, especially in homes of vulnerable groups of people.

5. Conclusions

The regulations and standards are developed to ensure high indoor environment quality in the building stock, and that the classification of the IAQ parameters reflects the desirable level in residential buildings. In practice, the lowest level considers the effect of health; thus, renovation and retrofit of the old buildings should aim to provide a high IAQ level. The paper analyses the performance of a retrofitted five-storey apartment building equipped with modern passive stack ventilation in Nordic conditions. The passive stack ventilation system was retrofitted in 2018, and novel self-regulating air inlet devices with filters were equipped. The building was simulated with IDA ICE software, where the model of the self-regulating inlet devices was developed using manufacturer product data. Several case scenarios were created to analyze the effect of poor maintenance, improved airtightness, and window opening on the system performance. For the analysis, one-room and three-room apartments on the second and fifth floors were chosen. The CO2 levels and indoor air temperature were analyzed and compared with EN 16798-1 to assess the IAQ. The results are separated for the winter and summer to show the influence of additional airflow from opening ventilation. The apartment air change rate and internal airflow patterns were assessed and compared case by case.
The results show a trend for the one-room apartment to overheat, despite having a higher air change rate than the three-room apartments. The three-room apartments tolerate overheating, although they are much more sensible considering the poor maintenance. Improving the envelope airtightness does not benefit the IAQ of the apartments. The results show a significant effect of poor maintenance and window opening possibility on the CO2 concentration. Furthermore, the apartments on the fifth floor are more sensitive to poor maintenance, and three-room apartments situated there showed warning levels of CO2. The case with non-openable windows showed more than 150 °Ch over 32 °C in all apartments.
Filter replacement is essential for the desired operation of the modern passive stack ventilation system. Additionally, the maintenance of the passive stack duct should be carefully planned to prevent its clogging. It is crucial to prevent overheating due to windows being left closed. Otherwise, the temperature in the apartments can reach above 32 °C, which is a health risk.
The results and highlighted points are crucial as the protected and heritage buildings with natural ventilation and limited or no access to the envelope or ventilation system reconstruction require retrofit to meet current building codes requirements. The results may be applied to retrofit the buildings with passive stack ventilation in the Nordic conditions to ensure good IAQ and prevent apartment overheating, especially in the homes of vulnerable groups of people.

Author Contributions

Conceptualization, I.K., R.K., J.J., S.K.; methodology, I.K., J.J., R.K.; software, I.K., J.J.; validation, I.K., J.J., S.K.; formal analysis, I.K.; investigation, I.K., J.J.; resources, I.K.; data curation, I.K.; writing—original draft preparation, I.K.; writing—review and editing, R.K., J.J., S.K.; visualization, I.K.; supervision, R.K.; project administration, R.K.; funding acquisition, R.K., J.J. All authors have read and agreed to the published version of the manuscript.

Funding

This research was funded by HEATCLIM (Heat and health in the changing climate, Grant No. 329306) funded by the Academy of Finland within the CLIHE (Climate change and health) program. SUREFIT (Sustainable solutions for affordable retrofit of domestic buildings) funded by the European Union (Horizon 2020 program, Grant No. 894511).

Institutional Review Board Statement

Not applicable.

Informed Consent Statement

Not applicable.

Acknowledgments

The authors would like to acknowledge Mika Vuolle from Equa Simulation Finland Ltd. for developing the inlet device model, IDA ICE software support and cooperation.

Conflicts of Interest

The authors declare no conflict of interest.

References

  1. World Health Organization. The World Health Report 2000: Health Systems: Improving Performance; WHO: Geneva, Switzerland, 2000; ISBN 978-92-4-156198-3. [Google Scholar]
  2. Olesen, B.W. Indoor Environment Criteria for Design and Calculation of Energy Performance of Buildings EN15251. In Proceedings of the 6th International Conference on Indoor Air Quality, Ventialtion & Energy Conservation in Buildings: Sustainable Build Environment, Sendai, Japan, 28–31 October 2007. [Google Scholar]
  3. Brelih, N.; Seppanen, O. Ventilation Rates and IAQ in European Standards and National Regulations. In Proceedings of the 32nd AIVC Conference and 1st TightVent Conference, Brussels, Belgium, 12–13 October 2011. [Google Scholar]
  4. Fernbas Energy Performance of Buildings Directive. Available online: https://ec.europa.eu/energy/topics/energy-efficiency/energy-efficient-buildings/energy-performance-buildings-directive_en (accessed on 5 November 2020).
  5. Dimitroulopoulou, C. Ventilation in European Dwellings: A Review. Build. Environ. 2012, 47, 109–125. [Google Scholar] [CrossRef]
  6. The National Building Code of Finland. Available online: https://ym.fi/en/the-national-building-code-of-finland (accessed on 11 November 2020).
  7. Ministry of the Environment (Finland). Ministry of Environment Decree (1010/2017) on the Energy Performance of the New Building; Ministry of the Environment: Helsinki, Finland, 2018.
  8. Ahola, M.; Säteri, J.; Sariola, L. Revised Finnish Classification of Indoor Climate 2018. E3S Web Conf. 2019, 111, 02017. [Google Scholar] [CrossRef] [Green Version]
  9. Rämö, A. Statistics Finland—Building Stock 2019. Available online: http://www.stat.fi/til/rakke/2019/rakke_2019_2020-05-27_kat_002_en.html (accessed on 5 November 2020).
  10. Department of Built Environment, Ministry of the Environment (Finland). National Building Code of Finland. Part D2. Indoor Climate and Ventilation of Buildings Regulations and Guidelines; Department of Built Environment, Ministry of the Environment (Finland): Helsinki, Finland, 2012.
  11. International Energy Agency. Ministry of the Environment Decree (4/13, Amendment 2/17) on Improving the Energy Performance of Buildings Undergoing Renovation or Alteration; International Energy Agency: Paris, France, 2013. [Google Scholar]
  12. Nazaroff, W.W. Residential Air-Change Rates: A Critical Review. Indoor Air 2021, 31, 282–313. [Google Scholar] [CrossRef] [PubMed]
  13. Liddament, M.; Axley, J.; Heiselberg, P.; Li, Y.; Stathopoulos, T. Achieving Natural and Hybrid Ventilation in Practice. Int. J. Vent. 2006, 5, 115–130. [Google Scholar] [CrossRef]
  14. Gou, Z.; Gamage, W.; Lau, S.S.-Y.; Lau, S.S.-Y. An Investigation of Thermal Comfort and Adaptive Behaviors in Naturally Ventilated Residential Buildings in Tropical Climates: A Pilot Study. Buildings 2018, 8, 5. [Google Scholar] [CrossRef] [Green Version]
  15. Saif, J.; Wright, A.; Khattak, S.; Elfadli, K. Keeping Cool in the Desert: Using Wind Catchers for Improved Thermal Comfort and Indoor Air Quality at Half the Energy. Buildings 2021, 11, 100. [Google Scholar] [CrossRef]
  16. Calautit, J.K.; O’Connor, D.; Hughes, B.R. A Natural Ventilation Wind Tower with Heat Pipe Heat Recovery for Cold Climates. Renew. Energy 2016, 87, 1088–1104. [Google Scholar] [CrossRef]
  17. Gong, J.; Hang, J. Buoyancy-Driven Natural Ventilation in One Storey Connected with an Atrium. Int. J. Vent. 2018, 18, 281–302. [Google Scholar] [CrossRef]
  18. Hussain, S.; Oosthuizen, P.H. Numerical Investigations of Buoyancy-Driven Natural Ventilation in a Simple Atrium Building and Its Effect on the Thermal Comfort Conditions. Appl. Therm. Eng. 2012, 40, 358–372. [Google Scholar] [CrossRef]
  19. Khanal, R.; Lei, C. Solar Chimney—A Passive Strategy for Natural Ventilation. Energy Build. 2011, 43, 1811–1819. [Google Scholar] [CrossRef]
  20. Salata, F.; Alippi, C.; Tarsitano, A.; Golasi, I.; Coppi, M. A First Approach to Natural Thermoventilation of Residential Buildings through Ventilation Chimneys Supplied by Solar Ponds. Sustainability 2015, 7, 9649–9663. [Google Scholar] [CrossRef] [Green Version]
  21. Barbosa, S.; Ip, K. Perspectives of Double Skin Façades for Naturally Ventilated Buildings: A Review. Renew. Sustain. Energy Rev. 2014, 40, 1019–1029. [Google Scholar] [CrossRef]
  22. Kim, Y.-M.; Kim, S.-Y.; Shin, S.-W.; Sohn, J.-Y. Contribution of Natural Ventilation in a Double Skin Envelope to Heating Load Reduction in Winter. Build. Environ. 2009, 44, 2236–2244. [Google Scholar] [CrossRef]
  23. Hsu, H.-H.; Chiang, W.-H.; Huang, J.-S. Hybrid Ventilation in an Air-Conditioned Office Building with a Multistory Atrium for Thermal Comfort: A Practical Case Study. Buildings 2021, 11, 625. [Google Scholar] [CrossRef]
  24. Vinha, J.; Manelius, E.; Korpi, M.; Salminen, K.; Kurnitski, J.; Kiviste, M.; Laukkarinen, A. Airtightness of Residential Buildings in Finland. Build. Environ. 2015, 93, 128–140. [Google Scholar] [CrossRef] [Green Version]
  25. Biler, A.; Unlu Tavil, A.; Su, Y.; Khan, N. A Review of Performance Specifications and Studies of Trickle Vents. Buildings 2018, 8, 152. [Google Scholar] [CrossRef] [Green Version]
  26. Choi, Y.; Song, D. How to Quantify Natural Ventilation Rate of Single-Sided Ventilation with Trickle Ventilator? Build. Environ. 2020, 181, 107119. [Google Scholar] [CrossRef]
  27. Karava, P.; Stathopoulos, T.; Athienitis, A.K. Investigation of the Performance of Trickle Ventilators. Build. Environ. 2003, 38, 981–993. [Google Scholar] [CrossRef] [Green Version]
  28. Willems, L.; Janssens, A. Performance Prediction of Dwelling Ventilation with Self-Regulating Air Inlets. In Proceedings of the 26th AIVC Conference: Ventilation in Relation to the Energy Performance of Buildings, Brussels, Belgium, 21–23 September 2005; pp. 197–202. [Google Scholar]
  29. Janssens, A.; Willems, L.; Laverge, J. Performance Evaluation of Residential Ventilation Systems Based on Multi-Zone Ventilation Models. In Proceedings of the 4th International Building Physics Conference: Energy Efficiency and New Approaches, Istanbul, Turkey, 15–18 June 2009. 7p. [Google Scholar]
  30. Building Regulation—GOV.UK. Available online: https://www.gov.uk/housing-local-and-community/building-regulation (accessed on 3 August 2021).
  31. Pinto, M.; Freitas, V.; Viegas, J.; Matias, L. Residential Hybrid Ventilation Systems in Portugal: Experimental Characterization. In Proceedings of the 8th International Conference and Exhibition on Healthy Buildings 2006, Lisbon, Portugal, 1–8 June 2006; Volume 4, pp. 357–362. [Google Scholar]
  32. Pinto, M.; Viegas, J.; de Freitas, V.P. Air Permeability Measurements of Dwellings and Building Components in Portugal. Build. Environ. 2011, 46, 2480–2489. [Google Scholar] [CrossRef] [Green Version]
  33. Ramos, N.M.M.; Almeida, R.M.S.F.; Curado, A.; Pereira, P.F.; Manuel, S.; Maia, J. Airtightness and Ventilation in a Mild Climate Country Rehabilitated Social Housing Buildings—What Users Want and What They Get. Build. Environ. 2015, 92, 97–110. [Google Scholar] [CrossRef]
  34. Ward, I.C. The Potential Impact of the New (UK) Building Regulations on the Provision of Natural Ventilation in Dwellings—A Case Study of Low Energy Social Housing. Int. J. Vent. 2008, 7, 77–88. [Google Scholar] [CrossRef]
  35. Neve, J.D.; Denys, S.; Pieters, J.G.; Pollet, I.; Denul, J. CFD Analysis of the Effect of Self-Regulating Devices on the Distribution of Naturally Supplied Air. In Proceedings of the 26th AIVC Conference: Ventilation in Relation to the Energy Performance of Buildings, Brussels, Belgium, 21–23 September 2005. 6p. [Google Scholar]
  36. Arendt, K.; Krzaczek, M. Co-Simulation Strategy of Transient CFD and Heat Transfer in Building Thermal Envelope Based on Calibrated Heat Transfer Coefficients. Int. J. Therm. Sci. 2014, 85, 1–11. [Google Scholar] [CrossRef]
  37. Indoor Environmental Input Parameters for Design and Assessment of Energy Performance of Buildings Addressing Indoor Air Quality, Thermal Environment, Lighting and Acoustics; EN 15251:2007; European Committee for Standardization: Brussels, Belgium, 2007.
  38. Energy Performance of Buildings—Ventilation for Buildings—Part 1: Indoor Environmental Input Parameters for Design and Assessment of Energy Performance of Buildings Addressing Indoor Air Quality, Thermal Environment, Lighting and Acoustics; EN 16798-1:2019; European Committee for Standardization: Brussels, Belgium, 2019.
  39. Renovation and Decarbonisation of Buildings. Available online: https://ec.europa.eu/commission/presscorner/detail/en/ip_21_6683 (accessed on 29 December 2021).
  40. Ministry of Social Affairs and Health (Finland). 35. Decree (525/2015) of the Ministry of Social Affairs and Health on Health-related Conditions of Housing and Other Residential Buildings and Qualification Requirements for Third-party Experts; Ministry of Social Affairs and Health (Finland): Helsinki, Finland, 2015.
  41. Observations in Finland—Finnish Meteorological Institute. Available online: https://en.ilmatieteenlaitos.fi/observations-in-finland (accessed on 22 June 2021).
  42. Validation & Certifications—Simulation Software|EQUA. Available online: https://www.equa.se/en/ida-ice/validation-certifications (accessed on 22 June 2021).
  43. Kalamees, T.; Jylhä, K.; Tietäväinen, H.; Jokisalo, J.; Ilomets, S.; Hyvönen, R.; Saku, S. Development of Weighting Factors for Climate Variables for Selecting the Energy Reference Year According to the EN ISO 15927-4 Standard. Energy Build. 2012, 47, 53–60. [Google Scholar] [CrossRef]
  44. Kontonasiou, E. Analysis of Indoor Air Quality & Thermal Comfort Parameters in Building Regulations in 8 Member States. In Proceedings of the 36th AIVC Conference “Effective Ventilation in High Performance Buildings”, Madrid, Spain, 23–24 September 2015. 10p. [Google Scholar]
  45. Jokisalo, J.; Kurnitski, J.; Vuolle, M.; Torkki, A. Performance of Balanced Ventilation with Heat Recovery in Residential Buildings in a Cold Climate. Int. J. Vent. 2003, 2, 223–236. [Google Scholar] [CrossRef]
  46. REHVA Guidebook 29. Available online: https://www.rehva.eu/hvac-guidebook-repository/rehva-guidebook-29 (accessed on 7 July 2021).
  47. Ruotsalainen, R.; Ronnberg, R.; Sateri, J.; Majanen, A.; Seppanen, O.; Jaakkola, J.J.K. Indoor Climate and the Performance of Ventilation in Finnish Residences. Indoor Air 1992, 2, 137–145. [Google Scholar] [CrossRef]
  48. Lei, Z.; Liu, C.; Wang, L.; Li, N. Effect of Natural Ventilation on Indoor Air Quality and Thermal Comfort in Dormitory during Winter. Build. Environ. 2017, 125, 240–247. [Google Scholar] [CrossRef]
Figure 1. The building natural passive stack ventilation system design with openable windows and self-regulating inlet devices with an outdoor temperature-dependent airflow rate.
Buildings 12 00096 g001
Figure 2. The building simulation model for the three and one-room apartments on the second and fifth floors connected with stairwell.
Buildings 12 00096 g002
Figure 3. The building floor level ventilation system design and airflow rates at nominal conditions of 5 Pa pressure difference over the inlet device and outdoor temperature of 15 °C.
Buildings 12 00096 g003
Figure 4. The inlet device product scheme (a); The inlet device opening as a function of outdoor temperature (b).
Buildings 12 00096 g004
Figure 5. The yearly outdoor temperature and wind velocity of the reference year with chosen example weeks.
Buildings 12 00096 g005
Figure 6. The inlet device flow characteristics via k-value against outdoor temperature: (a) bedroom inlet device; (b) living room inlet device.
Buildings 12 00096 g006
Figure 7. The indoor air temperature duration curves for the three-room apartments on the second and fifth floors from June to August.
Buildings 12 00096 g007
Figure 8. The indoor air temperature duration curves for the one-room apartments on the second and fifth floors from June to August.
Buildings 12 00096 g008
Figure 9. The duration curves of CO2 level in the three-room apartment on the second floor for different cases for winter and summer with indoor air quality reference levels.
Buildings 12 00096 g009
Figure 10. The duration curves of CO2 level in the three-room apartment on the fifth floor for different cases for winter and summer periods with indoor air quality reference levels.
Buildings 12 00096 g010
Figure 11. The duration curves of CO2 level in the one-room apartment on the second floor for different cases for winter and summer with indoor air quality reference levels.
Buildings 12 00096 g011
Figure 12. The duration curves of CO2 level in the one-room apartment on the fifth floor for different cases for winter and summer with indoor air quality reference levels.
Buildings 12 00096 g012
Figure 13. The building simulation airflow directions pattern and rate values for the one-room apartments on the second floor (a); And on the fifth floor (b), where red arrows are external airflows and blue are internal.
Buildings 12 00096 g013
Figure 14. The building simulation airflow directions pattern and airflow rates for the three-room apartments on the second floor (a); And fifth floor (b), where red arrows are external airflows and blue are internal.
Buildings 12 00096 g014aBuildings 12 00096 g014b
Table 1. The structural building details and properties of windows.
DescriptionBuilding Details
U-values, (W/m2K)
Roof0.5
Floor0.5
External walls0.5
Entrance doors1.1
Apartment doors2.2
Windows properties
U-value, (W/m2K)2
Total solar heat transmittance (g-value)0.44
Direct solar transmittance (ST)0.72
Integrated shadingBlinds
External shadingNo
Table 2. The inlet device airflow rate at different pressure differences and opening degree. Nominal conditions 5 Pa, 15 °C outdoor air temperature.
Airflow Rate, L/s
Living Room DeviceBedroom Device
Opening, b, mmPressure Difference, Pa
51020305102030
43.22.97.59.54.56.69.513
84.56.911137111621
124.97.512148.5132025
165.1 *7.812159.3 *142228
* nominal conditions 5 Pa, 15 °C outdoor air temperature.
Table 3. The apartment occupancy and occupancy patterns.
ApartmentOccupancyBedroom 1Bedroom 2Living RoomKitchen
Three-room422.00–9.00
2 Occ.
22.00–9.00
2 Occ.
9.00–22.00
2 Occ.
9.00–22.00
2 Occ.
One-room122.00–9.00
1 Occ.
9.00–22.00
1 Occ.
Table 4. The example weeks outdoor temperature and wind data.
Week MaximumMinimumAverage
WinterTemperature, °C1.1−19.7−9.3
Wind velocity, m/s713.5
SpringTemperature, °C7.8−3.62.4
Wind velocity, m/s1205.3
SummerTemperature, °C28.813.120.1
Wind velocity, m/s903.6
Table 5. The simulation case scenarios, name and abbreviation cross-dependency.
AbbreviationDescription
Ref.Reference case. Similar to best case, but bedroom doors are closed (20 mm slot below the door) during the night
BestBest case. Any external or internal factor does not decrease performance
M1Maintenance issue: filter loaded (pressure drop is higher in 1.4 times compare to reference case)
M2Similar to M1, but stack ducts are dirty. (Exhaust pressure drop is higher in 1.4 times)
M3Similar to M2, but the higher envelope airtightness. (from n50 2.4 L/h to 1.5 L/h)
M4Maintenance issues, high envelope airtightness and no windows shading (g = 0.39 blinds, g = 0.55 without blinds)
M5Maintenance issues, high envelope airtightness, no windows opening and shading
M6Maintenance issues, high envelope airtightness, no windows opening and shading, all apartments doors are closed
Table 6. The building simulation case scenarios.
Case ScenarioBedroom DoorBathroom DoorInlet DeviceStack DuctAirtightness n50, L/hWindowsWindows Opening
ShadingSummerWinter
Ref.Closed, NightOpenedCleanClean2.4YesAlways, if >12 °C30 min. before sleep
BestOpenedOpenedCleanClean2.4YesSameSame
M1Closed, NightClosedDirtyClean2.4YesSameSame
M2Closed, NightClosedDirtyDirty2.4YesSameSame
M3Closed, NightClosedDirtyDirty1.5YesSameSame
M4Closed, NightClosedDirtyDirty1.5NoSameSame
M5Closed, NightClosedDirtyDirty1.5NoNoSame
M6ClosedClosedDirtyDirty1.5NoNoNo
Table 7. The three-room apartment on the second and fifth floor overheating results—number of degree hours above 27 °C, 30 °C and 32 °C during the year.
Second FloorDegree Hours, °Ch
273032
Ref.200
Best200
M1400
M21700
M31900
M428620
M559561366324
M661851484366
FifthFloor
Ref.1300
Best1900
M12600
M25600
M36400
M4581140
M511,06641301196
M611,08842461282
Table 8. The one-room apartment on the second and fifth floor overheating results—number of degree hours over 27 °C, 30 °C and 32 °C during the year.
Second FloorDegree hours, °Ch
273027
Ref.200
Best400
M1700
M24700
M34900
M4676715
M5795729581159
M6797129701167
Fifthfloor
Ref.4100
Best5400
M17900
M221500
M322700
M4232829835
M515,81478983887
M615,98780834047
Table 9. The three-room apartment on the second floor CO2 level results. Percentage of hours in each indoor air quality category (I–IV) during the year.
CaseWinter (January–May)Summer (June–August)
I, %II, %III, %IV, %Average, ppmI, %II, %III, %IV, %Average, ppm
Ref.47.118.434.10.589073.210.912.13.8720
Best59.836.83.40.072077.817.05.20.0670
M132.419.722.025.996071.810.66.311.3760
M220.410.326.343.0120067.611.96.414.1860
M315.27.523.154.2135066.012.85.615.7900
M415.17.623.154.2135065.013.55.915.7910
M515.47.523.453.813507.56.710.675.31630
Table 10. The three-room apartment on the fifth floor IAQ results. Time spent in each indoor air category in percent.
CaseWinter (January–May)Summer (June–August)
I, %II, %III, %IV, %Average, ppmI, %II, %III, %IV, %Average, ppm
Ref.19.110.625.544.8130069.011.15.414.6870
Best23.616.849.710.095075.77.512.54.3750
M115.68.721.354.4145065.413.15.416.0950
M21.74.810.782.8230052.623.06.118.31070
M30.32.310.287.1240048.625.76.419.21100
M40.32.210.387.1240048.625.56.519.31150
M50.32.210.487.124000.00.23.196.72600
Table 11. The one-room apartment on the second floor IAQ results. Time spent in each indoor air category in percent.
CaseWinter (January–May)Summer (June–August)
I, %II, %III, %IV, %Average, ppmI, %II, %III, %IV, %Average, ppm
Ref.100.00.00.00.056096.63.40.00.0560
Best100.00.00.00.057096.83.20.00.0570
M198.61.30.20.060093.36.40.30.0570
M272.626.21.20.068086.78.44.80.0620
M357.432.510.10.074085.55.68.90.0630
M457.432.410.20.074585.55.78.80.0625
M557.131.811.10.074042.028.328.51.2820
Table 12. The one-room apartment on the fifth floor IAQ results. Time spent in each indoor air category in percent.
CaseWinter (January–May)Summer (June–August)
I, %II, %III, %IV, %Average, ppmI, %II, %III, %IV, %Average, ppm
Ref.60.76.628.04.779085.83.48.52.3650
Best89.010.80.20.065089.27.83.00.0610
M154.67.013.325.190084.23.34.08.5700
M220.517.116.346.1150079.94.23.512.5845
M317.817.918.845.5147078.34.94.012.7850
M417.817.818.945.51490784.94.212.8860
M518.317.819.044.914707.412.330.450.01450
Table 13. Apartment average ventilation and total air change rates for the second and fifth floor apartments during the example weeks.
Apartment TypeSeasonReferenceM1M2M3M5
Vent *Total *VentTotalVentTotalVentTotalVentTotal
One-room, second floorWinter0.380.380.350.350.260.260.230.230.210.21
Spring0.32 *0.320.30.30.210.210.180.180.150.15
Summer0.310.520.30.50.190.270.180.260.150.15
One-room, fifth floorWinter0.320.320.30.30.240.240.220.220.20.2
Spring0.30.30.260.260.190.190.170.170.130.13
Summer0.230.350.20.320.130.270.130.270.10.1
Three-room, second floorWinter0.280.280.270.270.140.140.120.140.10.12
Spring0.230.230.230.230.110.110.110.110.10.1
Summer0.210.360.210.370.080.30.080.30.080.1
Three-room, fifth floorWinter0.230.230.20.20.110.120.10.120.10.1
Spring0.150.150.120.120.090.090.10.10.10.1
Summer0.130.260.10.260.050.260.050.260.050.1
* nominal airflow rate.
Publisher’s Note: MDPI stays neutral with regard to jurisdictional claims in published maps and institutional affiliations.

