Article

Seismic Risk Assessment for Elements of the Electric Network in Romania

Seismic Risk Assessment Research Centre, Technical University of Civil Engineering Bucharest, Bd. Lacul Tei, 122-124 Bucharest, Romania
*
Author to whom correspondence should be addressed.
Buildings 2022, 12(2), 244; https://doi.org/10.3390/buildings12020244
Submission received: 23 January 2022 / Revised: 16 February 2022 / Accepted: 18 February 2022 / Published: 19 February 2022

Abstract

:
This study is focused on the assessment of the seismic risk for elements of the electric network (thermoelectric powerplants and substations) in Romania. Firstly, the main elements of the electric network analyzed in this study are briefly presented. Thermoelectric powerplants account for about 30% of the electricity production capacity and for about 40% of electricity production. The damage to the electric network in Romania caused by the Vrancea 1977 seismic event is presented in this study. The seismic fragility of thermoelectric powerplants as recommended by the SYNER-G project is evaluated in relation to the damage observed after the Vrancea intermediate-depth earthquake of March 1977. The impact of anchoring the components of substations and of powerplants on the seismic risk metrics is also evaluated using fragility parameters from the literature. The analyses show that the impact of anchoring the components on the seismic risk metrics is less important for substations than for thermoelectric powerplants. In addition, it was observed that the level of seismic risk is larger in the case of electric substations as compared to powerplants.

1. Introduction

The evaluation of the seismic risk for the European gas and electricity systems was performed by Poljanŝek et al. [1] considering the seismic hazard results for rock conditions obtained in the GSHAP project [2]. Kongar et al. [3] performed a seismic risk assessment for the electric and water networks in Christchurch (New Zealand). Salman and Li [4] proposed a framework for the seismic risk assessment of the electric network. A multihazard risk assessment framework of electric power systems subjected to earthquake and hurricane was proposed in the paper by Salman and Li [5]. Liu et al. [6] developed in their study a seismic risk assessment framework for the electric power distribution system which considered both the network topology and the functional vulnerability of distribution substations. A regional seismic risk assessment of electric substations was performed in the study by Zekavati et al. [7]. Nuti et al. [8] evaluated the safety of electric networks under seismic action and concluded that the modelling of soil conditions has an important impact on damage assessment. The study by Fregonese et al. [9] proposed a structural upgrading procedure for the reduction of the seismic risk of electricity grids. Vanzi [10] presented a procedure for choosing the optimal retrofitting strategy of electric networks subjected to earthquake action. The structural retrofit of the components of an electric network was also discussed in the study by Romero et al. [11]. Lee et al. [12] estimated the seismic damage to electric and water networks using a Bayesian network. The impact of spatial ground motion correlation on the seismic performance of an electric network was analyzed in the study of Wang et al. [13]. The dynamic interaction between components of electrical substation equipment interconnected by rigid bus conductors was studied by Filiatrault and Kremmidas [14]. Shinozuka et al. [15] noted that within the electrical equipment, buses, circuit breakers, and disconnect switches are the most seismically vulnerable. Sarreshtehdari et al. [16] proposed an approach to evaluate the post-earthquake performance of an electric network in order to determine the regions without power. The seismic resilience of a 220 kV substation in China was analyzed in the study of Li et al. [17].
In the study of Pavel et al. [18], a seismic risk assessment of lifelines (gas, electricity, water, and sewage) in Bucharest was performed. The study of Pavel et al. [18] showed that larger mean damage probabilities were associated with components of the electricity distribution system, namely, electric substations and small generation plants in Bucharest. A preliminary study on the seismic risk of the electric network in Romania using an earthquake scenario-based approach was performed within the RO-RISK project [19]. In both studies, the fragility functions recommended by the SYNER-G project were employed [20]. This study is an extension of the previous two researches in the sense that: (i) the seismic risk was evaluated for ground motion levels computed through probabilistic seismic hazard assessment; (ii) an evaluation of the damage sustained by thermoelectric powerplants after the Vrancea 1977 earthquake was performed; (iii) the seismic risk assessment was evaluated using fragility functions from the literature, as well as models derived from the damage observed after the Vrancea 1977 seismic event; (iv) the seismic exposure was updated using other relevant information from the literature (in Romanian language).

2. Seismic Damage of the Electric Network

The post-earthquake performance of electric networks has been studied in a significant number of literature studies. For instance, Erdik [21] showed the impact of the two earthquakes occurred in Turkey in 1999. In the case of the electric network, damage was concentrated to the substations and to the distribution lines. No damage was observed to the powerplants in the affected area. Scawthorn et al. [22] discussed the impact of the Niigata (Japan) 2004 earthquake on the lifelines. The effects of the Molise (2002) seismic event on the electric network were minimal, as shown in the study of Rasulo et al. [23]. Kwasinski et al. [24] analyzed the seismic performance of the electric network in Christchurch (New Zealand) affected by the 2010–2011 series of earthquakes. The overall seismic performance of the network was satisfactory. The damage to the substation buildings was limited due to a previous seismic upgrade program, but significant damage to underground cables due to liquefaction was observed. The damage of the electric network in China due to the Wenchuan 2008 earthquake was presented by Liu et al. [25]. In addition, this study provided information regarding the recovery of the functionality of the substations as a function of macroseismic intensity. Estimated repair times for some elements of the electric network were presented in Karagiannis et al. [26]. In addition, this study provided a description of the damage scales for the buildings and the equipment of the electric network. A statistics of the damage to the low-voltage distribution system in the area affected by the Napa 2014 seismic event was presented by Eidinger [27]. The Maule (Chile) 2010 earthquake caused damage to about a quarter of the substations, while the immediate load blackout was of more than 4500 MW [28].
Some information regarding the seismic performance of the electric network in Romania and of its main elements during the major Vrancea earthquake of March 1977 (moment magnitude Mw = 7.4 and focal depth h = 94 km) was presented in several studies [29,30,31,32,33]. The 1977 seismic event caused the collapse of the roofs (made of heavy precast concrete elements) of two thermoelectric powerplants (one in Bucharest, and the other near Ploiesti). In both cases, the roof elements were supported by steel purlins and trusses. The use of heavy precast concrete elements for single-story industrial buildings was widespread before 1977 in order to limit steel consumption. In addition to the heavy damage sustained by the two above-mentioned plants, moderate damage was observed to another thermoelectric powerplant in Bucharest. Only repair works aiming at restoring the original seismic capacity of the damaged buildings were performed after the earthquake.
The March 1977 earthquake caused damage to a significant number of substations in the affected area (damage to circuit breakers, transformer bushing leaks, transformers or autotransformers were displaced from their foundation, breaking of the isolation for the dischargers). About 25 % of the substations in use at the moment of the earthquake were damaged. The damage observed to the buildings which housed interior substations (having masonry structures) was limited, even though the ground motion amplitude levels were significant in some areas. The damage sustained by the reinforced concrete chimneys and cooling towers was very limited.

3. Elements at Seismic Risk

The identification of the main elements at seismic risk was performed using publicly available data. No information related to the main elements at seismic risk was obtained from other sources. The elements at seismic risk analyzed in this study were:
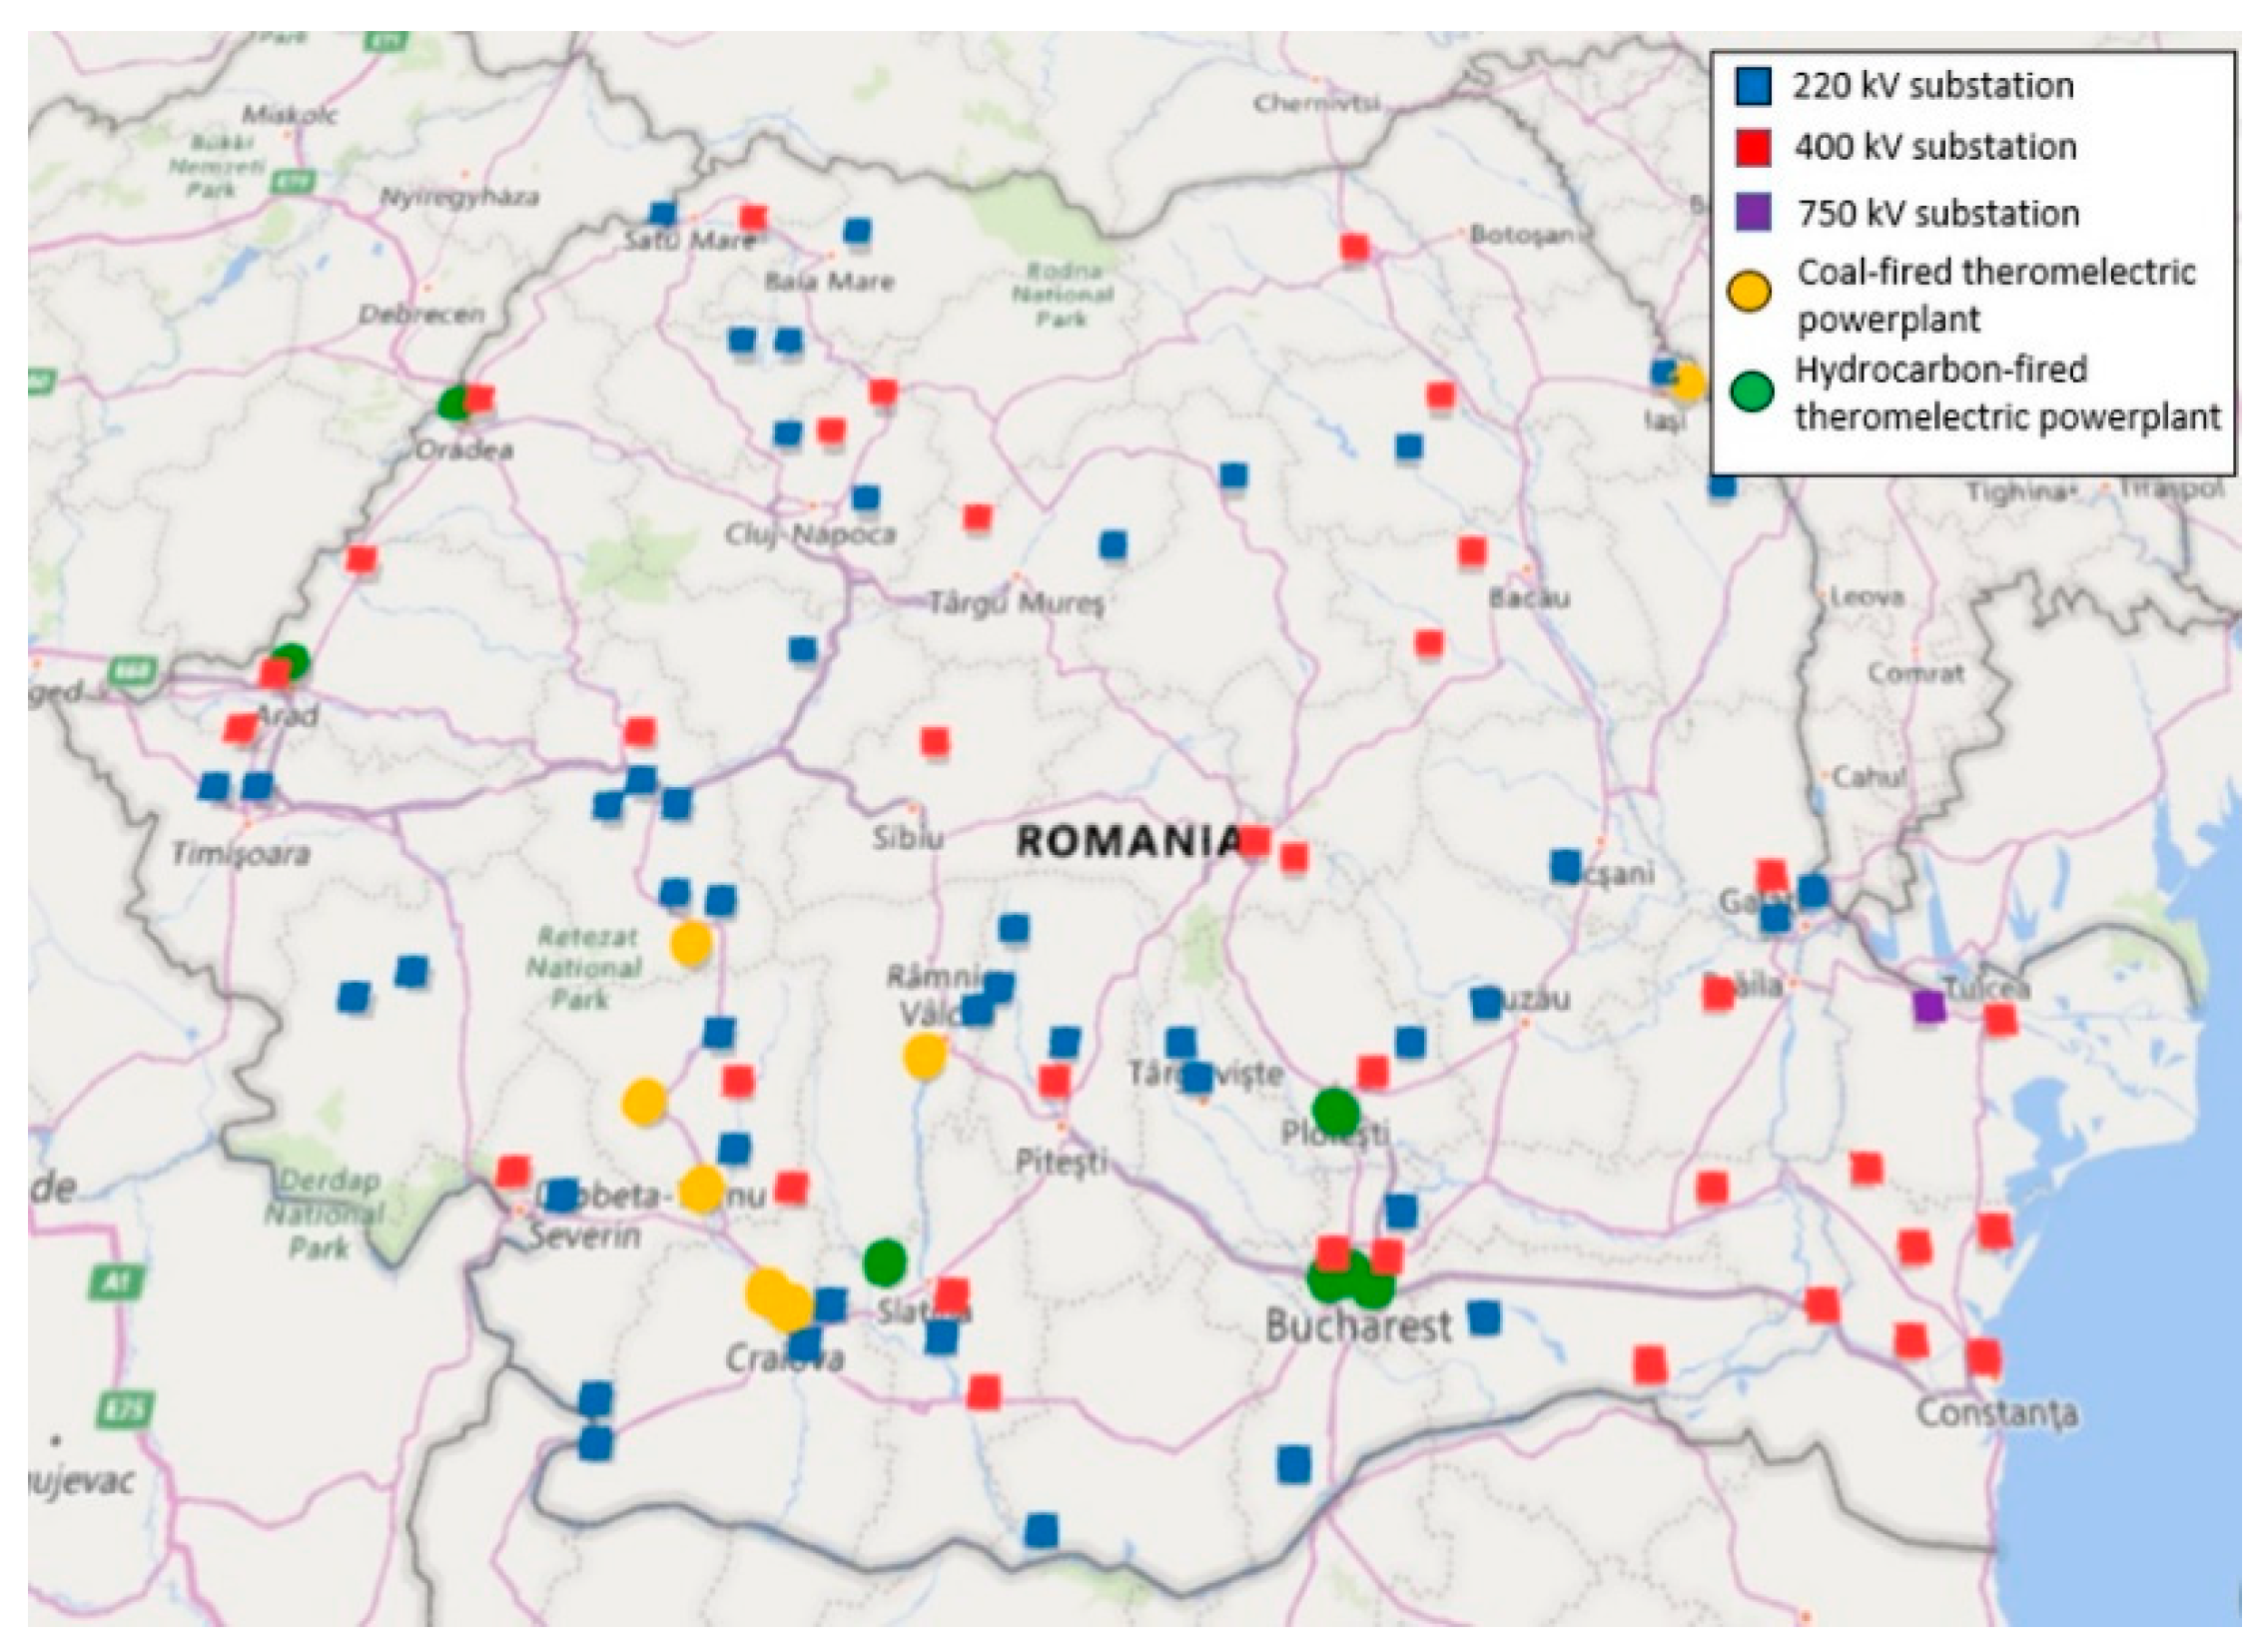
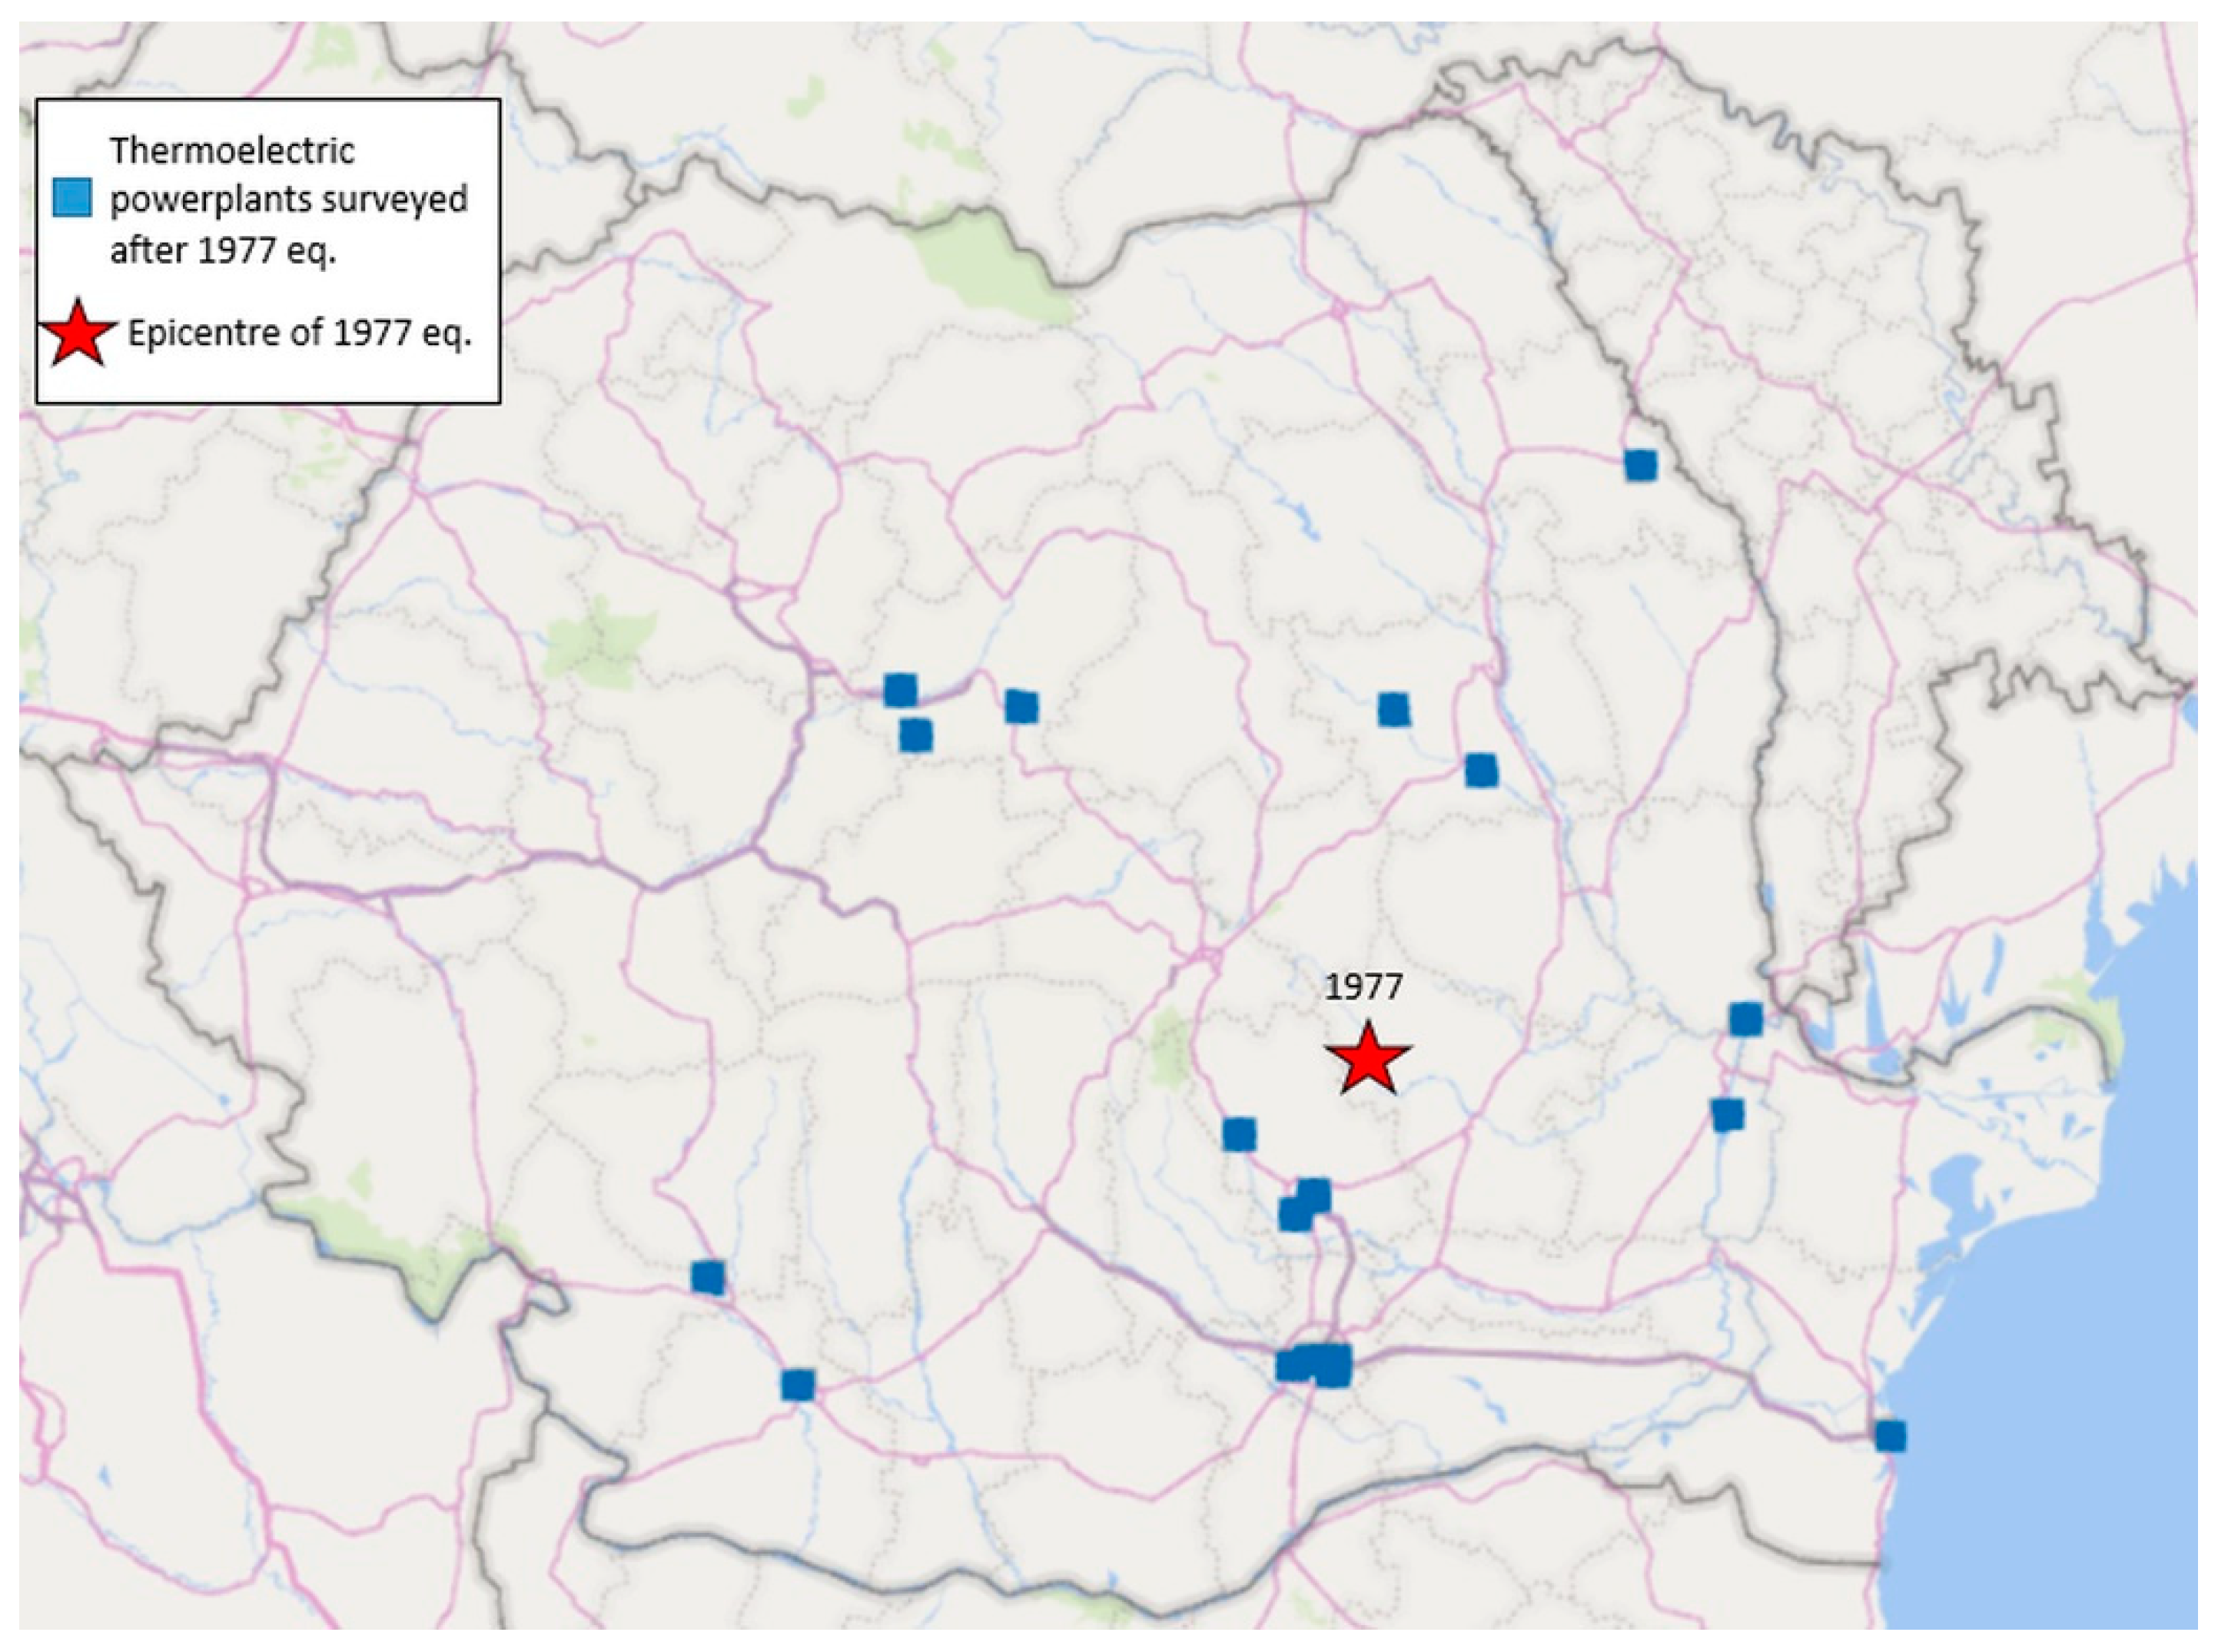
  • The main thermoelectric powerplants (coal- or hydrocarbon-fired). Only the powerplants delivering electricity were considered in this study, while the heat-producing plants were not included. A total of 15 thermoelectric powerplants (7 coal-fired and 8 hydrocarbon-fired) were considered in the analysis. Among the thermoelectric powerplants, two (one at Brazi and the other in Bucharest) were built in the past 15 years and used a combined cycle for the production of electricity;
  • The main substations of the electric network (220 kV, 400 kV, and 750 kV). According to the data provided by Transelectrica (the company in charge of the transport of electricity in Romania), the electricity transport network in Romania consists of one 750 kV substation (at Isaccea), 38,400 kV substations, and 42,220 kV substations. The number of 110 kV substations in the network is more than 1000 [34].
The nuclear power plant at Cernavoda, the hydroelectric facilities, as well as other electricity-producing facilities (solar, wind, etc.) were not considered in this study, since the necessary information for the risk analyses was not available. In addition, the corresponding transmission and distribution lines were not considered.
The distribution of the production of electricity as a function of the source is shown in Figure 1. The information in Figure 1 is based on public data from the Transelectrica company website [35]. It can be observed that the coal and hydrocarbon powerplants made up about a third of the total electric power capacity in Romania in 2021.
Figure 2 shows a comparison of the average production of energy as a function of the source for July 2021 and December 2021 [35]. In Figure 2, it can be observed that the thermoelectric powerplants accounted for about 40% of the electricity production in each of the two analyzed months. The coefficients of variation of the daily electricity production from the two sources was, in both July 2021 and December 2021, less than 10%. The most important daily variations of electricity production were encountered for wind-generated electricity. In addition, the share of electricity production of the hydroelectric powerplants was much smaller in December as compared to July.
The positions of the main elements at seismic risk analyzed in this study (thermoelectric powerplants and substations) is shown in Figure 3. It can be observed that most of the thermoelectric powerplants are grouped in the southern part of Romania, while the substations are spread in the entire territory. A significant number of high-voltage substations can be found in the eastern part of Romania (towards the Black Sea), mainly because: (i) the nuclear powerplant at Cernavoda is also situated in that part and (ii) the connection with Ukraine and Bulgaria also passes through that region.
A brief description of the structural systems employed for the main buildings of the thermoelectric powerplants in Romania was presented in the study of Hristoforov et al. [36]. The general layout of the main building of the thermoelectric powerplants built in Romania consisted of three parts:
  • The generator room;
  • The boiler room;
  • The intermediary building.
The first two rooms are single-story buildings generally consisting of reinforced concrete columns (precast or cast in place) which support the roof trusses, while the intermediary building has a reinforced concrete frame structure. Few thermoelectric powerplants built before 1977 have a steel structure for any of the components of the main building. The height of the boiler room could reach more than 100 m, as in the case of the large thermoelectric powerplants in Turceni and Rovinari [34]. Besides the main building, each thermoelectric powerplant has other installations and equipment housed in various buildings. Reinforced concrete chimneys having heights of up to 280 m are employed in all thermoelectric powerplants. In addition, a number of cooling towers (depending on the capacity of the powerplant) having also a reinforced concrete structure are also present in each plant. The seismic design of the thermoelectric powerplants was in line with the official seismic prescriptions in Romania (e.g., the P13-63 [37] and P13-70 [38] design regulations in use before the Vrancea 1977 earthquake). After 1977, the seismic design regulations were significantly improved in the light of the observations made as a result of the Vrancea March earthquake.

4. Seismic Hazard Assessment

The seismic hazard for each considered element at seismic risk was based on the seismic hazard model developed in the study of Pavel et al. [39]. Based on this model, 13 crustal seismic sources and the Vrancea intermediate-depth seismic source can influence the seismic hazard of the Romanian territory. The site conditions for each element at seismic risk were taken from the study of Pavel et al. [40] or based on the topographic slope method of Wald and Allen [41]. Some examples of seismic hazard curves for peak ground acceleration (PGA) are illustrated in Figure 4. Four of the considered sites, namely, Bucharest, Craiova, Iasi, and Ploiesti are under the influence of the Vrancea intermediate-depth seismic source, while the seismic hazard of the other four sites (Resita, Satu Mare, Sibiu, and Timisoara) is mainly affected by local crustal seismic sources. The different slopes of the hazard curves of the sites under the influence of the Vrancea intermediate-depth seismic source compared to the hazard curves of the sites under the influence of crustal seismic sources are clearly visible in Figure 4. The recent study of Pavel et al. [42] compared the seismic hazard results from two different models (ESHM 2020 [43] and Pavel et al. [40]). The results showed a good match in terms of spectral accelerations for the two models.

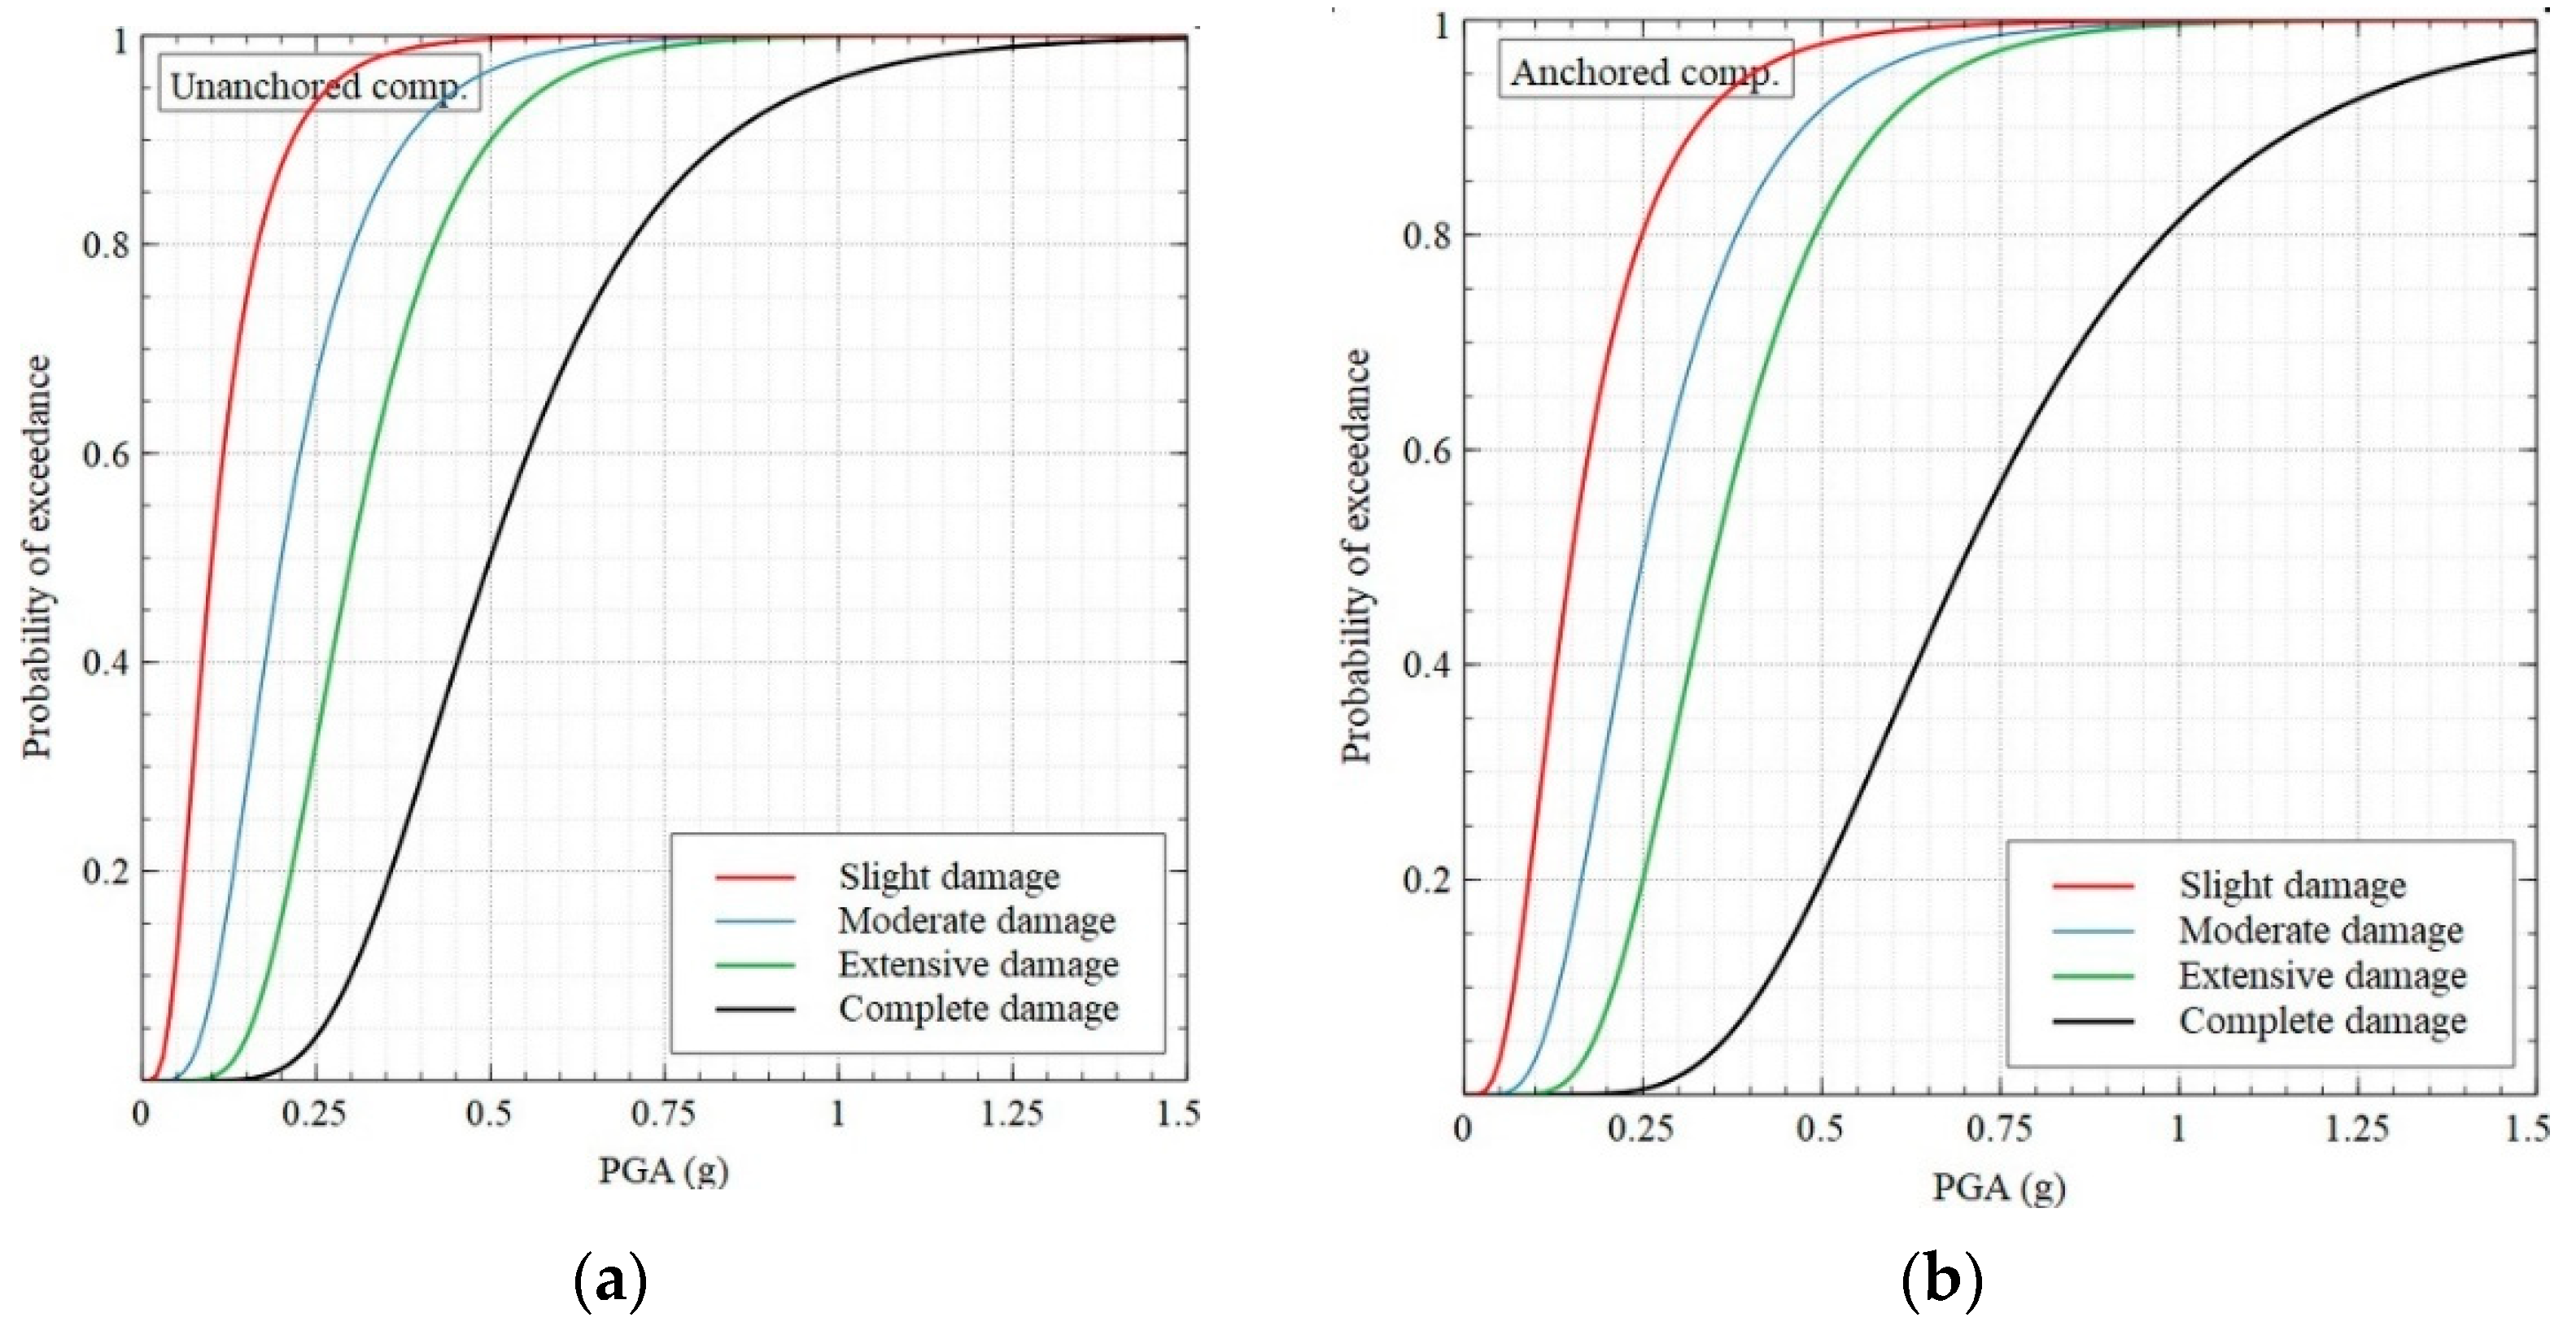
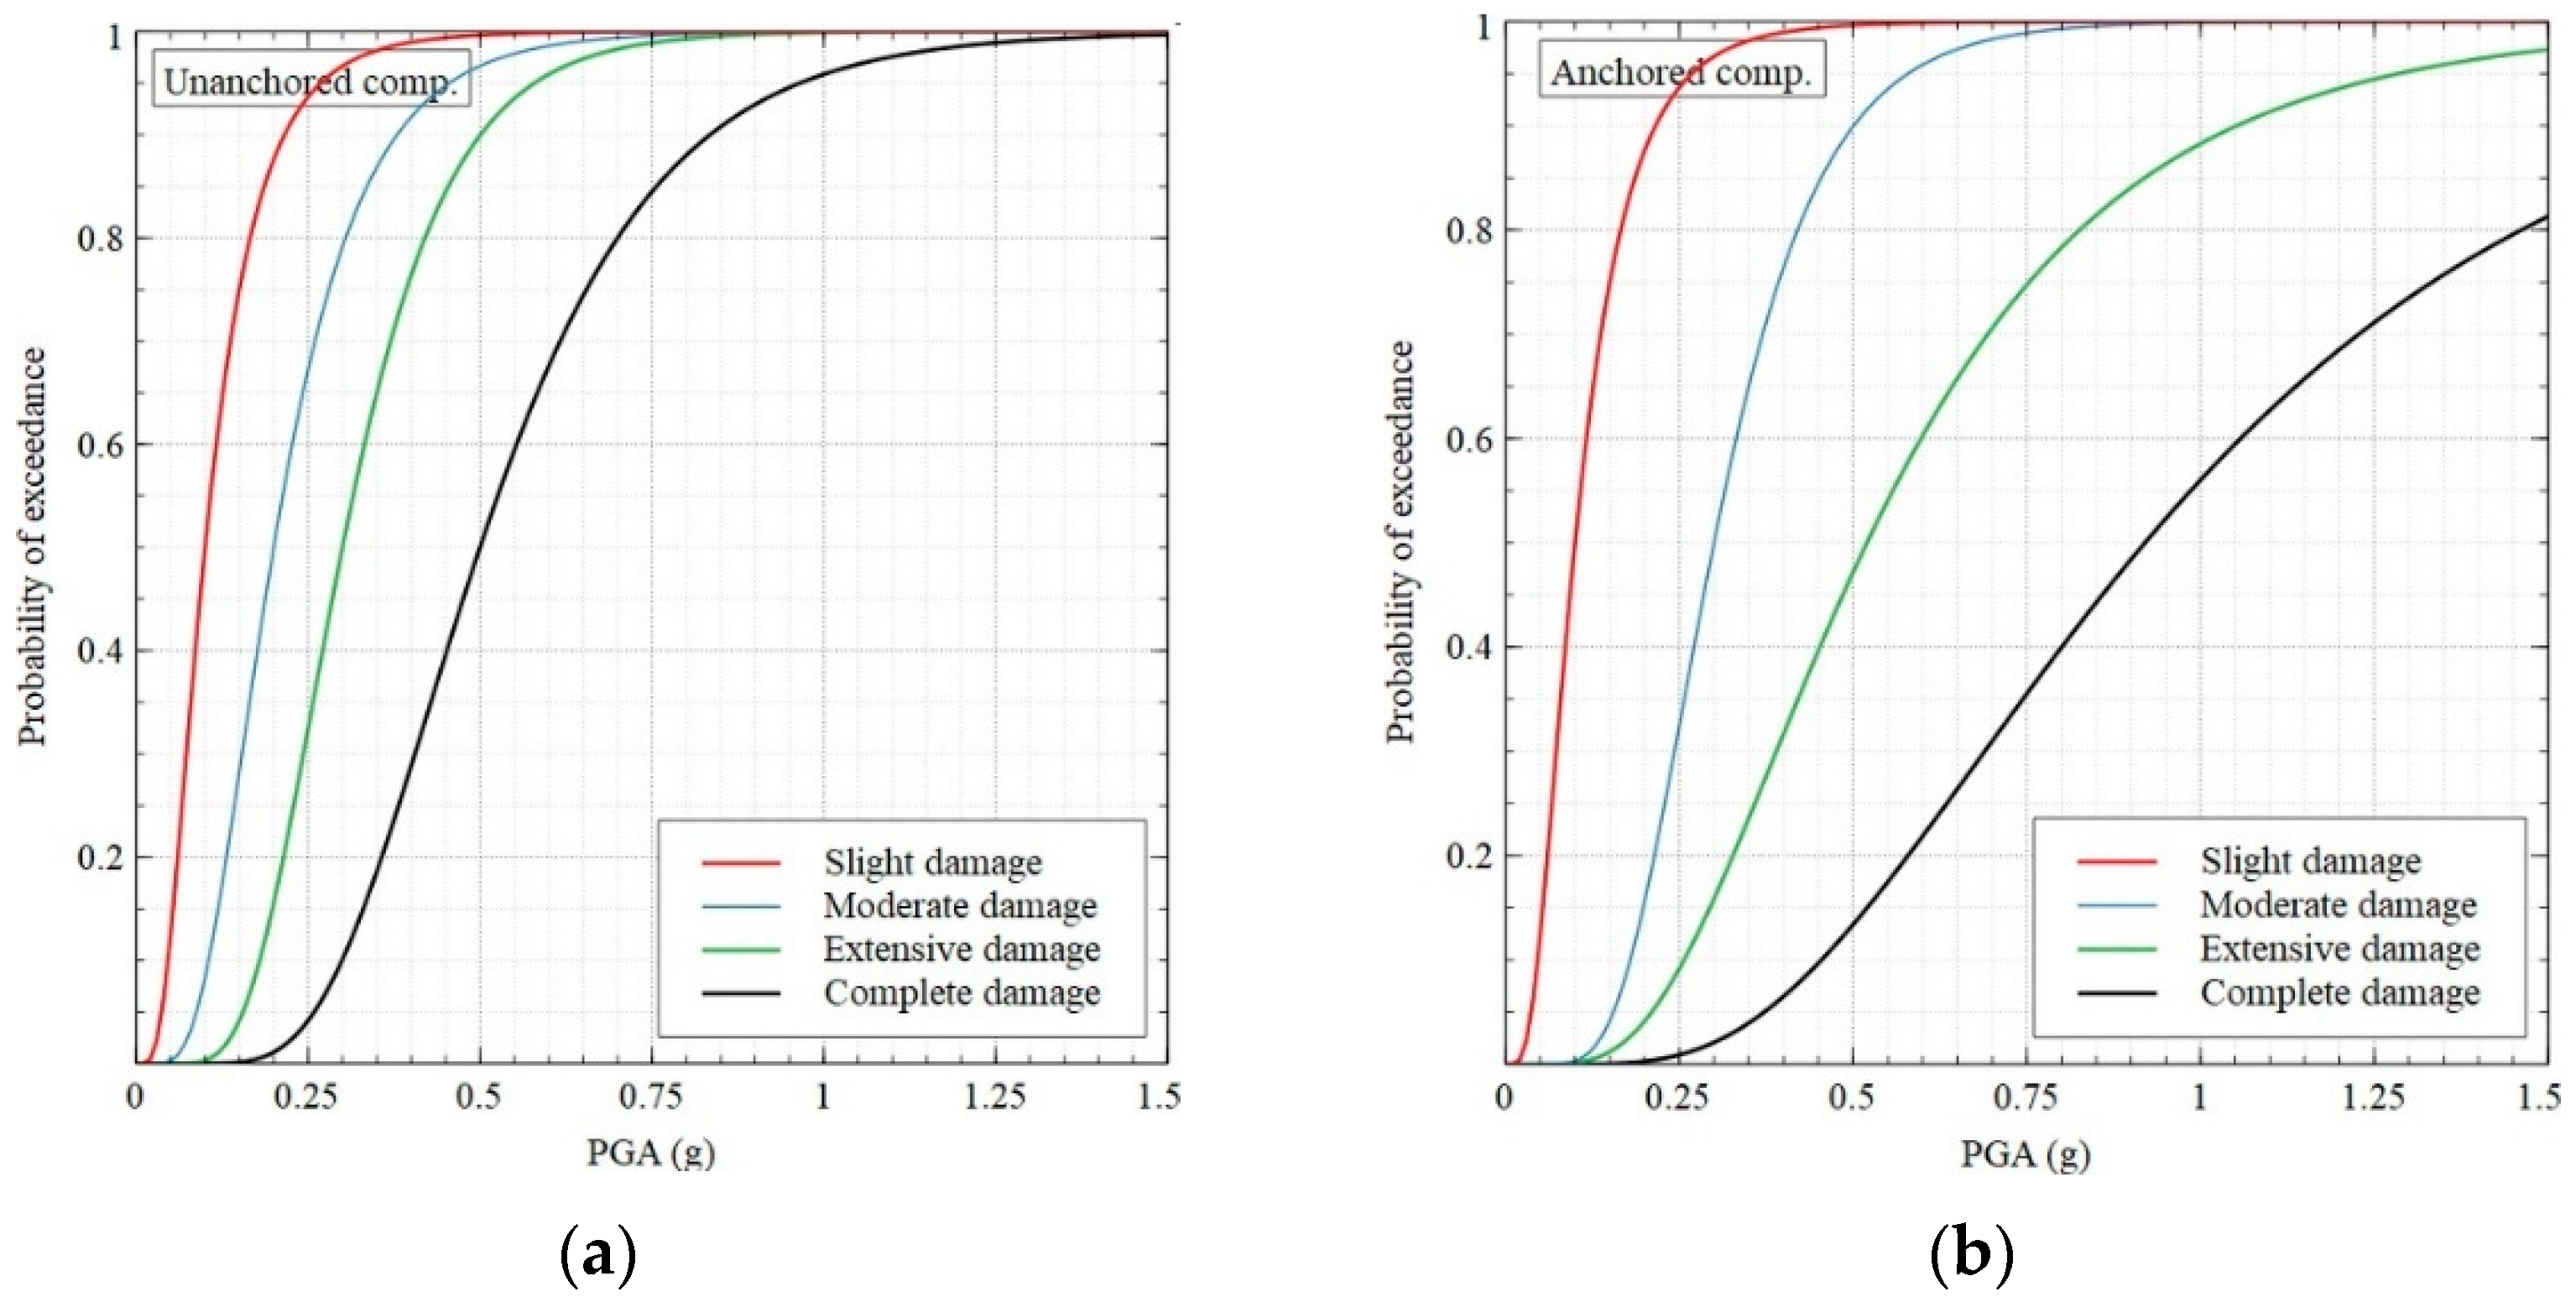
5. Seismic Fragility and Vulnerability Assessment

The seismic fragility assessment of the main elements at seismic risk was based on the recommendations of the SYNER-G project [20], which used the functions from HAZUS [44]. The same approach was also employed in other studies with the same focus (e.g., [5,7,45,46]). Dunn et al. [47] developed fragility functions for overhead electric lines due to wind action. A discussion regarding the development of vulnerability models for the electric network can be found in the paper of Holmgren [48]. Shinozuka et al. [49] proposed fragility functions for the transformer stations in the electric network. The fragility functions developed by Dueñas-Osorio [50] for three levels of connectivity loss can be used in order to perform the seismic risk assessment of an entire power grid. The elements at seismic risk considered in this study were (according to the notations given in HAZUS [44]):
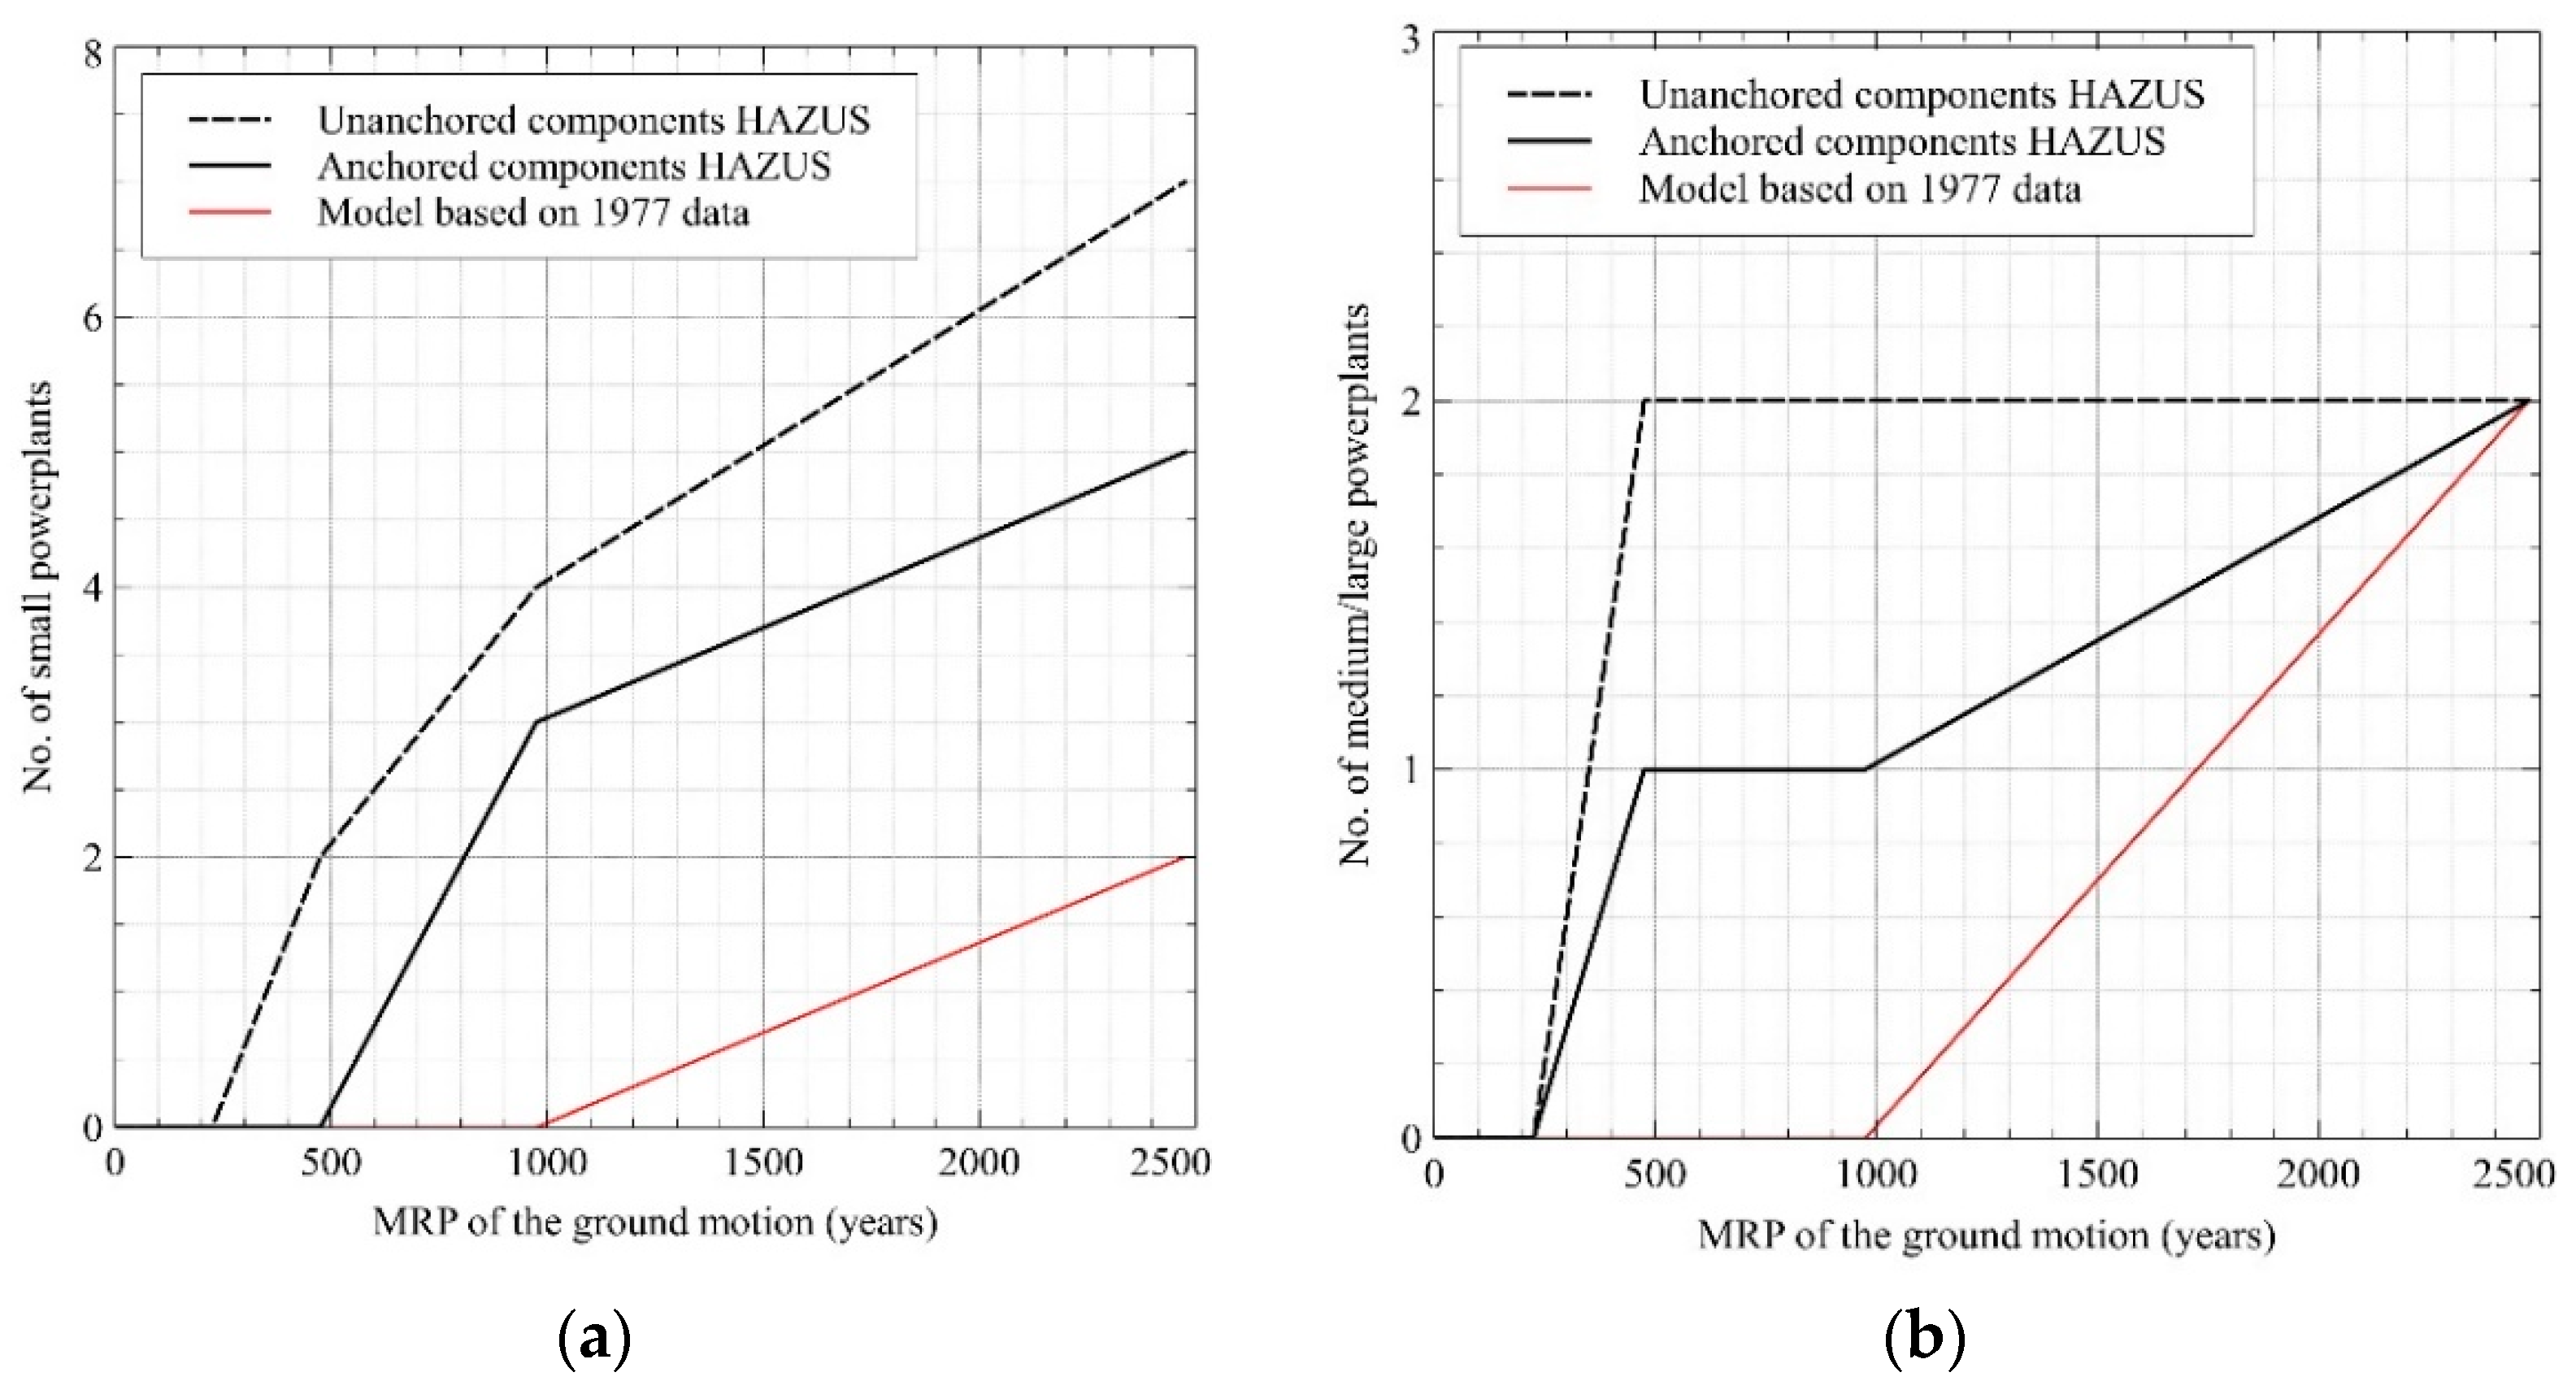
  • Small generation plants (with a capacity of less than 200 MW)—9 powerplants;
  • Medium/large generation plants (with a capacity of more than 200 MW)—6 powerplants;
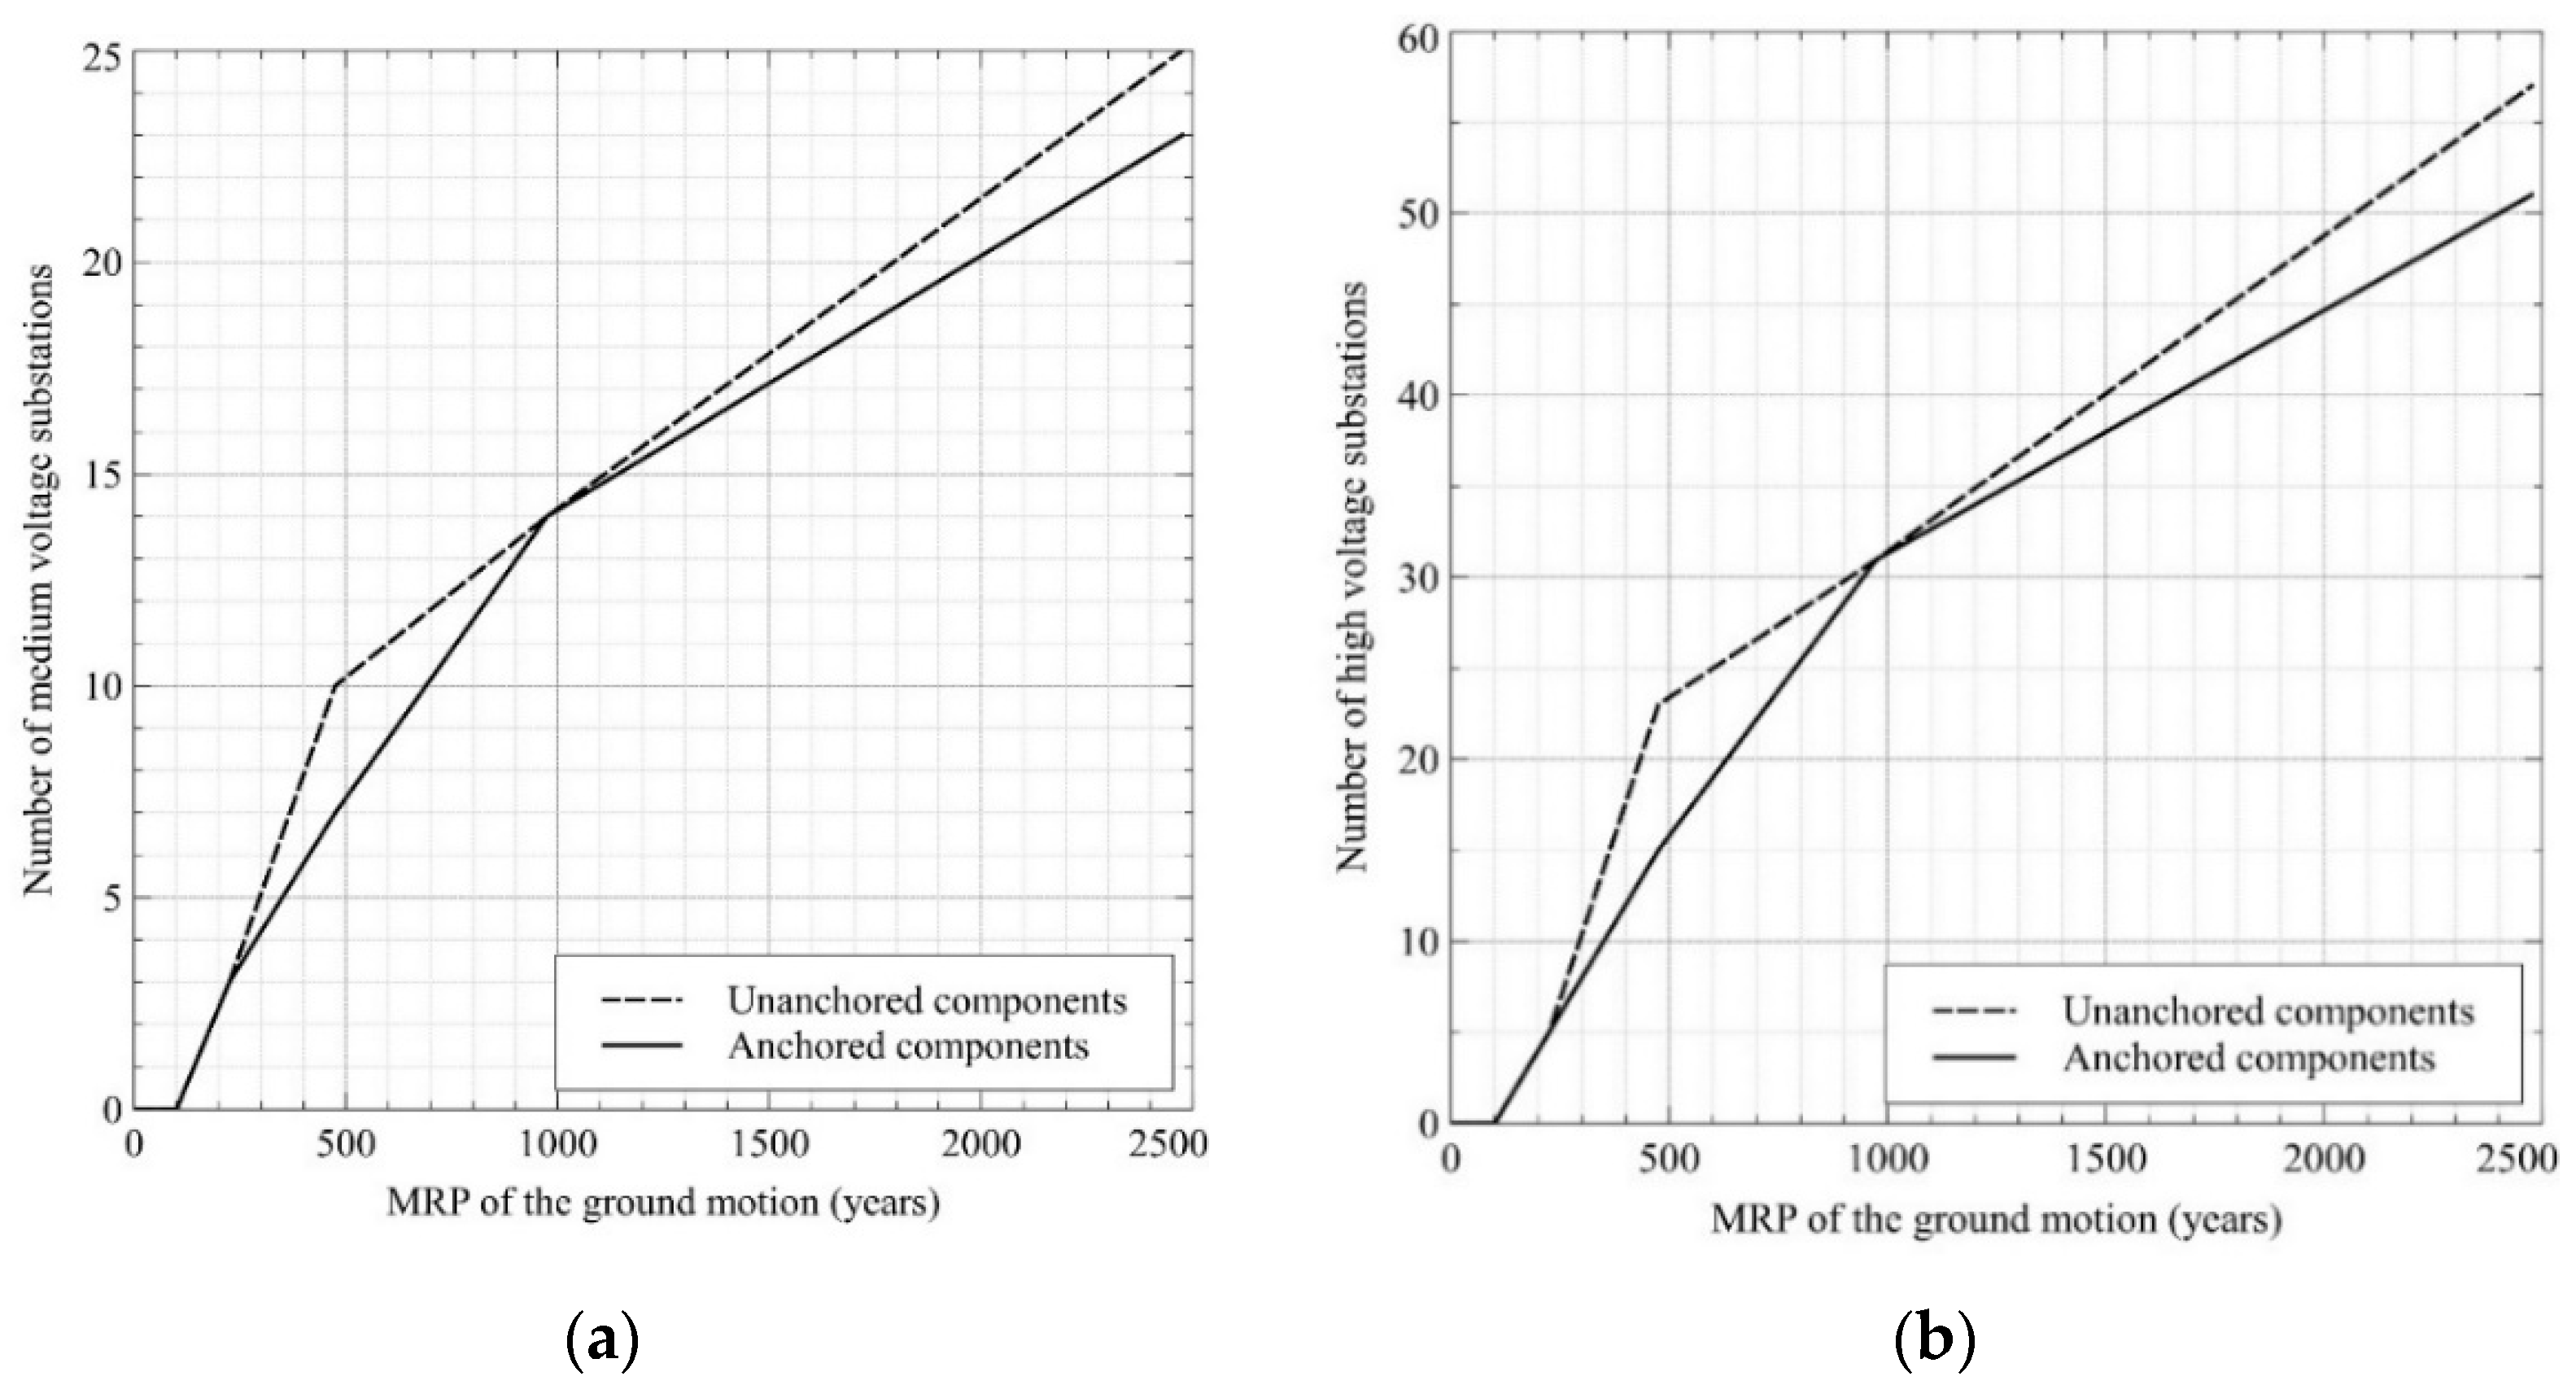
  • Medium-voltage substations (220 kV substations)—42 substations;
  • High-voltage substations (400 kV substations and 750 kV substation)—39 substations.
A comparison between the seismic fragility curves for the medium-voltage substations and for medium/large powerplants is illustrated in Figure 5 and Figure 6, considering unanchored and anchored components [44]. The fragility parameters for the other elements at seismic risk can be found in HAZUS [44]. The adequacy of using PGA as a ground motion intensity measure has been discussed extensively in the literature, and it has been observed that other measures (e.g., spectral accelerations) are more appropriate [51,52,53,54,55,56,57]. However, since in this study the focus was on powerplants which consist of buildings having various dynamic properties, the peak ground acceleration was employed as an intensity measure.
Subsequently, empirical fragility functions based on damage data collected after the Vrancea 1977 earthquake were derived. Schitco et al. [30] analyzed the damage degrees of 18 thermoelectric powerplants after the Vrancea 1977 earthquake. The positions of the 18 powerplants and the epicenter of the 1977 event are illustrated in Figure 7. It can be noticed that the surveyed powerplants were situated in various regions across Romania. Some of the thermoelectric powerplants are still in use today.
The distribution of the damage degree as a function of the epicentral distance and ground motion amplitude (e.g., peak ground acceleration) of some thermoelectric powerplants in Romania is shown in Figure 8 based on the results of Schitco et al. [30]. The epicentral distance for the 18 sites was in the range of 47–239 km. The peak ground acceleration for each site was estimated using the ground motion model of Vacareanu et al. [58]. This ground motion model indicated different coefficients for the sites situated in the forearc (regions to the south and east of the Carpathian Mountains) and backarc regions (regions to the west and north of the Carpathian Mountains) due to the different attenuation of ground motions in the two areas. The range of the PGA values was 0.02–0.35 g.
Based on the damage data provided by Schitco et al. [30], a fragility model for the Romanian thermoelectric powerplants built before 1977 was constructed. The analyzed thermoelectric powerplants were all built in the 1960s and 1970s. Guidelines for constructing vulnerability functions based on empirical data can be found in the study of Rossetto et al. [59]. A maximum likelihood approach was applied for the derivation of the fragility function parameters. This procedure was also described in the study of Baker [60]. The damage states were assigned to each individual powerplant based on the description by Karagiannis et al. [26] and HAZUS [44]. The parameters obtained for the lognormal fragility function are presented in Table 1. It can be observed in Table 1 that the variability of the fragility functions derived from the damage observed after the Vrancea 1977 earthquake was much larger compared to that of the curves presented by HAZUS [44]. In addition, the median values for the slight, moderate, and extensive damage states were significantly larger than those of the corresponding curves by HAZUS [44].

6. Evaluation of Seismic Risk

For each element at seismic risk, the damage probabilities were obtained by combining the results of the site-specific seismic hazard with those of the seismic fragility models. Since the information regarding the anchoring of the components for the powerplants and for the substations was missing, the seismic risk assessment was performed considering both hypotheses. The failure of an element at seismic risk occurs when a state of extensive damage is realized [1,50]. This extensive damage state implies damage beyond short-term repairs [50].
Figure 9 and Figure 10 show the curves representing the number of thermoelectric elements reaching extensive or complete damage as a function of the mean return period (MRP) of the ground motion, as well as the curve for the loss of electricity production capacity. The computations in Figure 9 and Figure 10 were performed for both anchored and unanchored components. The curves showing the loss of electricity production capacity were computed by removing the capacity of the powerplants reaching extensive or complete damage states from the total production capacity. The computations were performed considering the fragility curves from HAZUS [44], as well as the model derived using the damage observed after the Vrancea 1977 earthquake (shown in Table 1). It can be noticed in Figure 9 and Figure 10 that the risk metrics determined using the fragility model derived from the damage observed after the Vrancea 1977 earthquake provided smaller risk estimates as compared to the results computed with the fragility functions from HAZUS [44]. Figure 10 shows that the largest loss in the electricity production capacity of thermoelectric powerplants occurred for ground motions having mean return periods lower than 500 years. In addition, from the seismic risk analysis, it was observed that the five main coal-fired powerplants in the South-Western part of Romania (Turceni, Rovinari, Craiova, Isalnita, and Paroseni) would not reach the extensive damage state even for ground motions having mean return periods of 2500 years. The most affected powerplants would be the ones situated at Brazi and Bucharest, close to the Vrancea intermediate-depth seismic source. Nevertheless, the maximum loss in electricity production capacity obtained for a ground motion with a mean return period of 2500 years appeared to be less than half of the current production capacity. The impact of anchoring the components is clearly visible in Figure 9 and Figure 10 in the sense that the seismic risk metrics are reduced (as expected).
Figure 11 and Figure 12 show the curves representing the number of substations reaching or exceeding an extensive damage state as a function of the mean return period (MRP) of the ground motion and the loss of connectivity curves. The computations were performed considering both anchored and unanchored components of the substations using the fragility curves from HAZUS [44]. It can be observed that the influence of anchoring the components on the seismic risk metrics for substations is less important than for thermoelectric powerplants. The number of substations reaching or exceeding an extensive damage state increases steadily with the level of the ground motion.
Figure 12 shows the loss-of-connectivity curves taking into account the number of connections lost. The lost connections occur when a substation reaches an extensive or complete damage state. The curve for the loss of connectivity resembles that of the loss of electric production capacity, in the sense that the largest losses occur for ground motions having mean return periods lower than 500–1000 years. It appears that the number of connections lost exceeds 50% of the total number for ground motions having a mean return period of 1000 years.
The distribution of the powerplants and substations reaching or exceeding an extensive damage state for a ground motion corresponding to a mean return period of 475 years (considering the seismic fragility for unanchored elements) is shown in Figure 13. It can be easily noticed that the relative number of electric substations (36 out of 81) reaching or exceeding an extensive damage state is much larger than in the case of thermoelectric powerplants (4 out of 15) for the selected ground motion level.

7. Conclusions

This study was focused on the seismic risk assessment of elements of the electric network in Romania. Only thermoelectric powerplants and medium- and high-voltage substations were considered in the analyses, since very limited information was available for the other elements of the network. Seismic fragility, as recommended in the SYNER-G project, was evaluated in relation to the damage to thermoelectric powerplants observed after the Vrancea 1977 intermediate-depth earthquake. The impact of anchoring the components of the main elements at seismic risk was also evaluated in this study. The most important observations of the study can be summarized as follows:
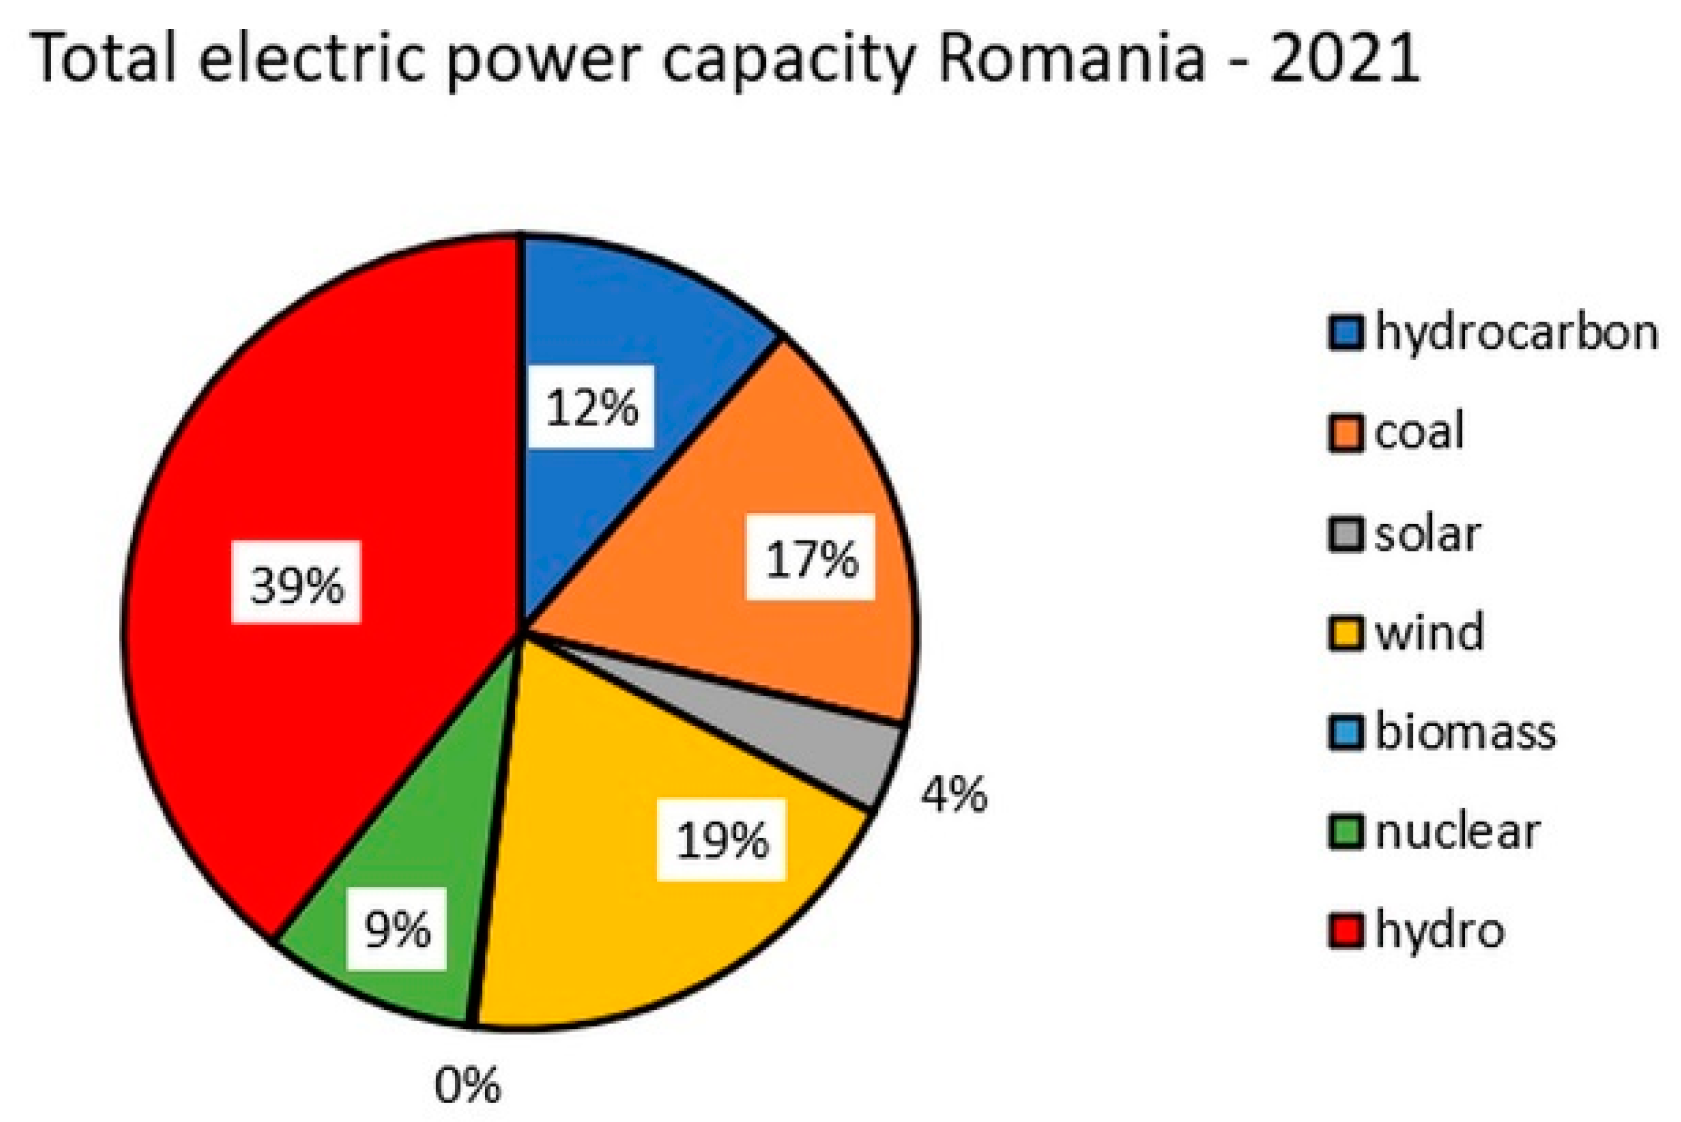
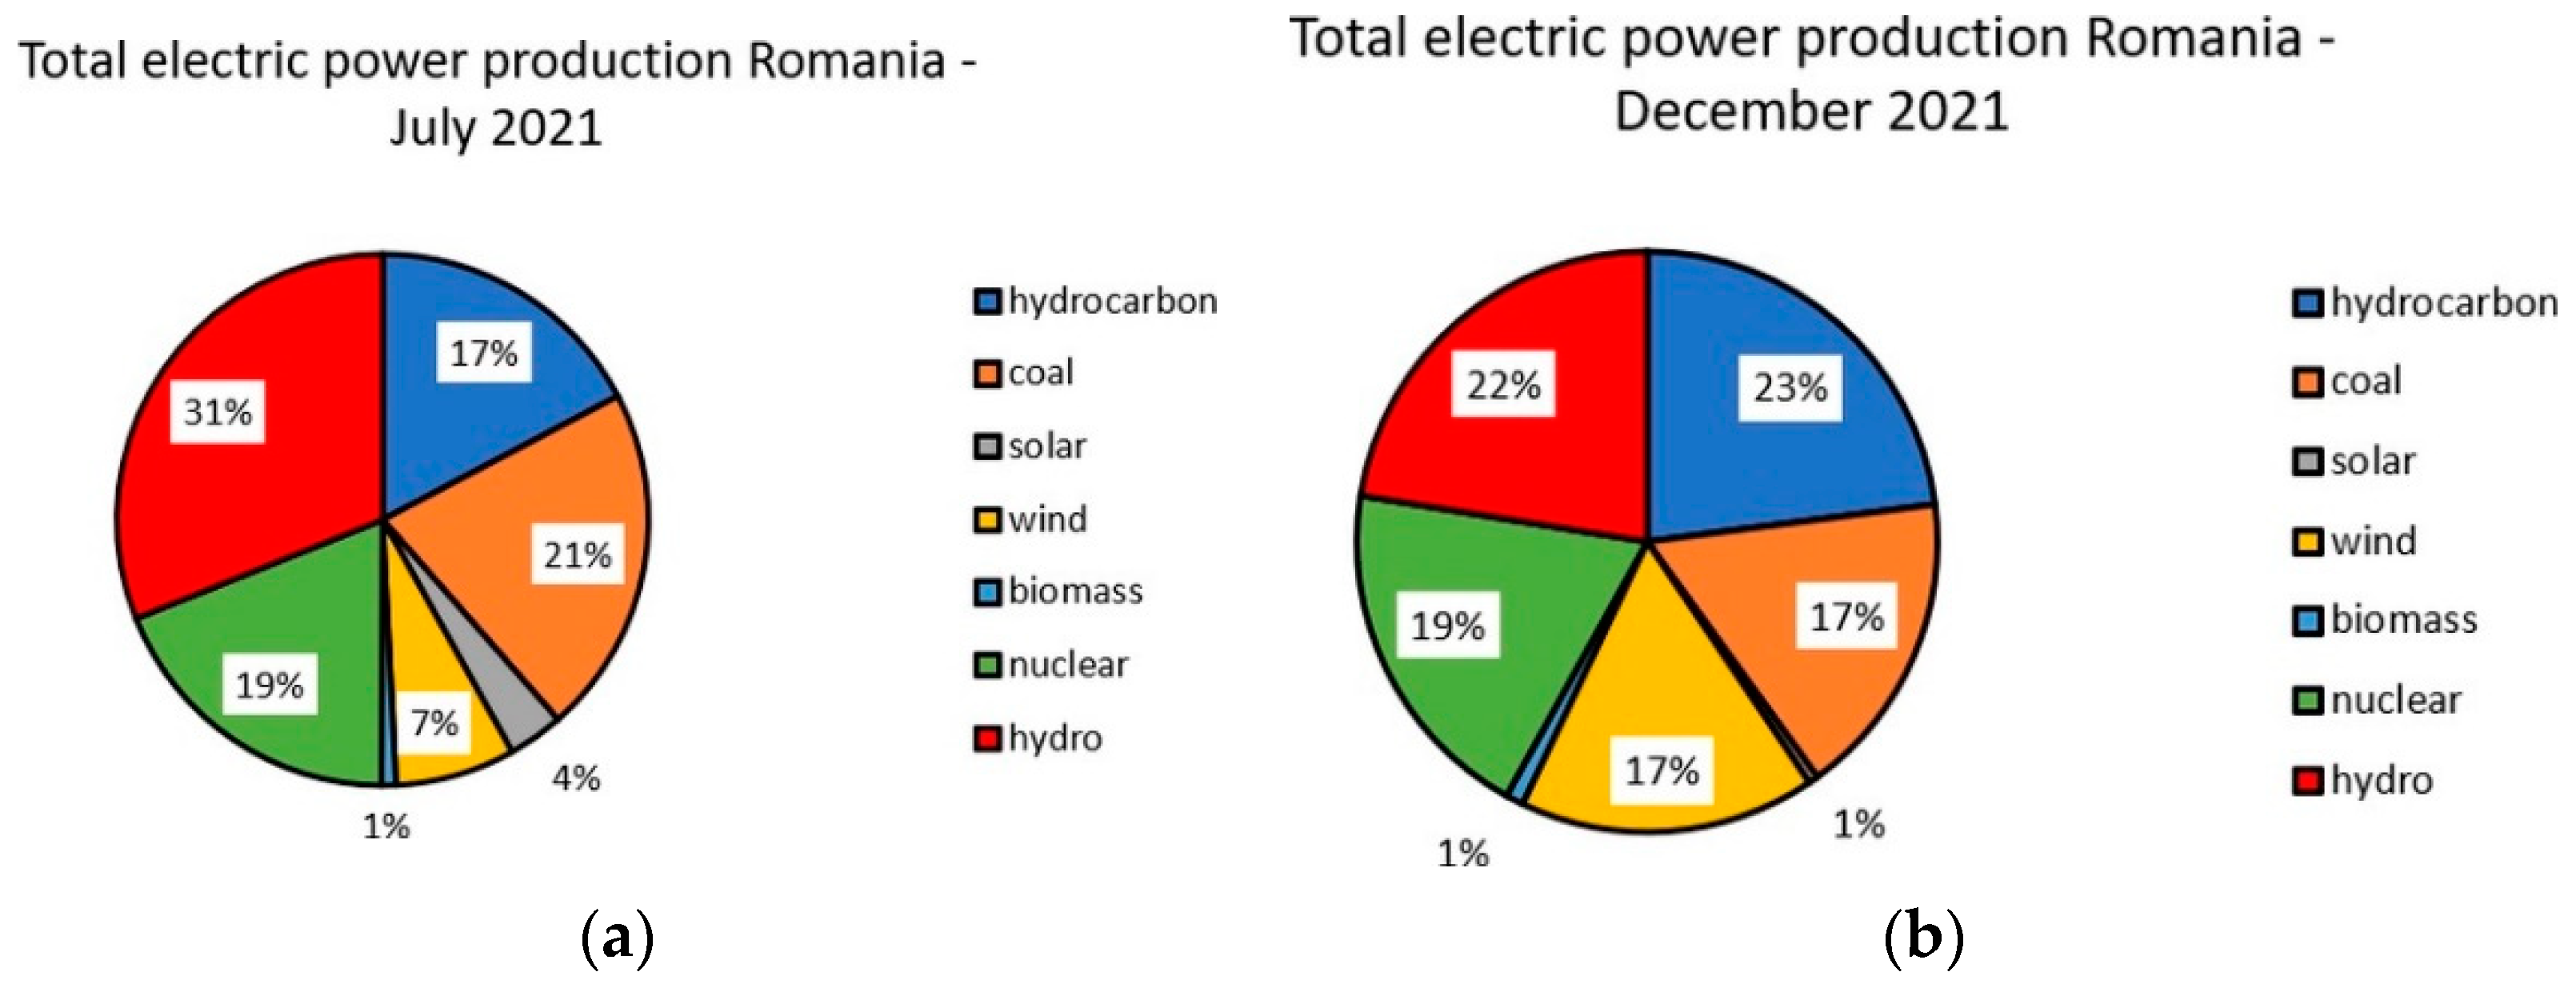
  • The thermoelectric powerplants (coal-fired or hydrocarbon-fired) accounted for about 30% of the electricity production capacity and for about 40% of the actual electricity production in both July 2021 and December 2021;
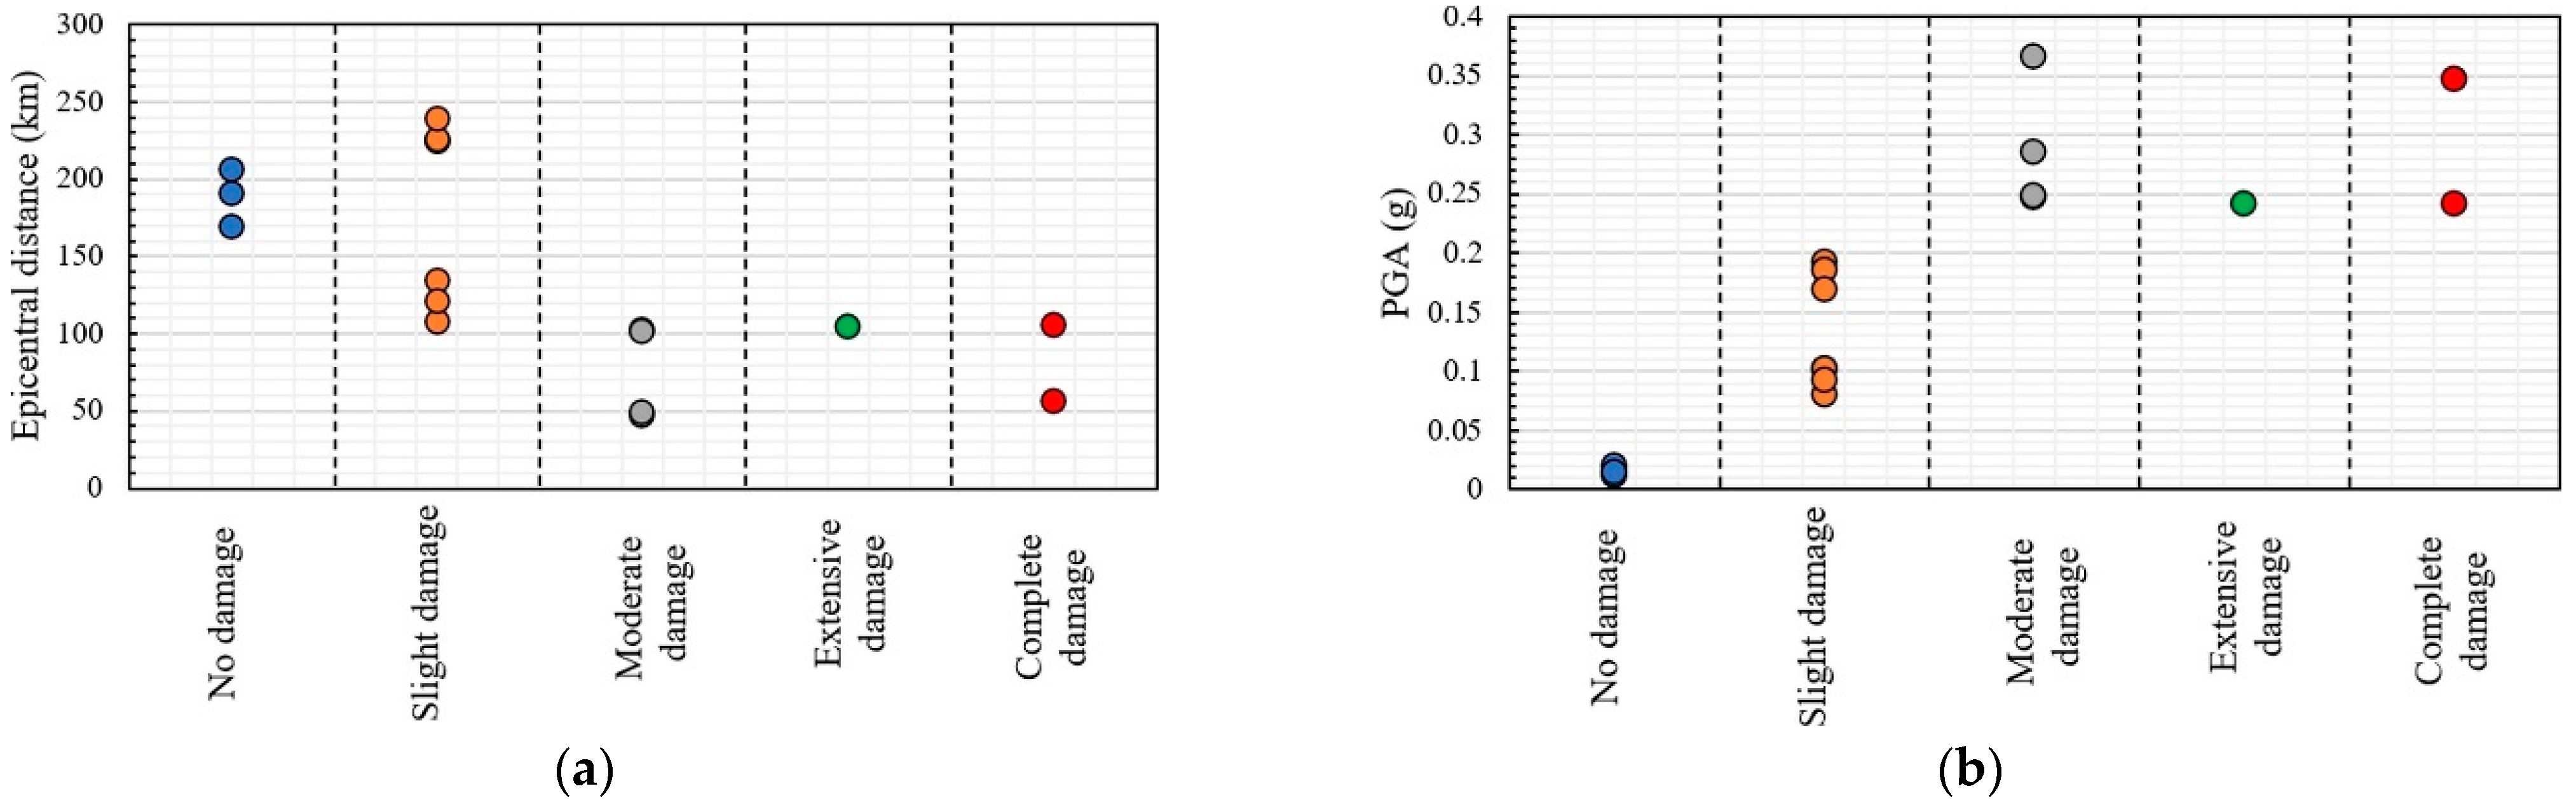
  • Extensive damage was observed at two thermoelectric powerplants in Bucharest and near Ploiesti as a result of the Vrancea 1977 earthquake;
  • The damage to the substations of the electric network in Romania consisted of damage to circuit breakers, transformer bushing leaks, displacement of transformers or autotransformers from their foundation, break of the isolation for the dischargers. The seismic damage to the buildings housing the substations was not significant;
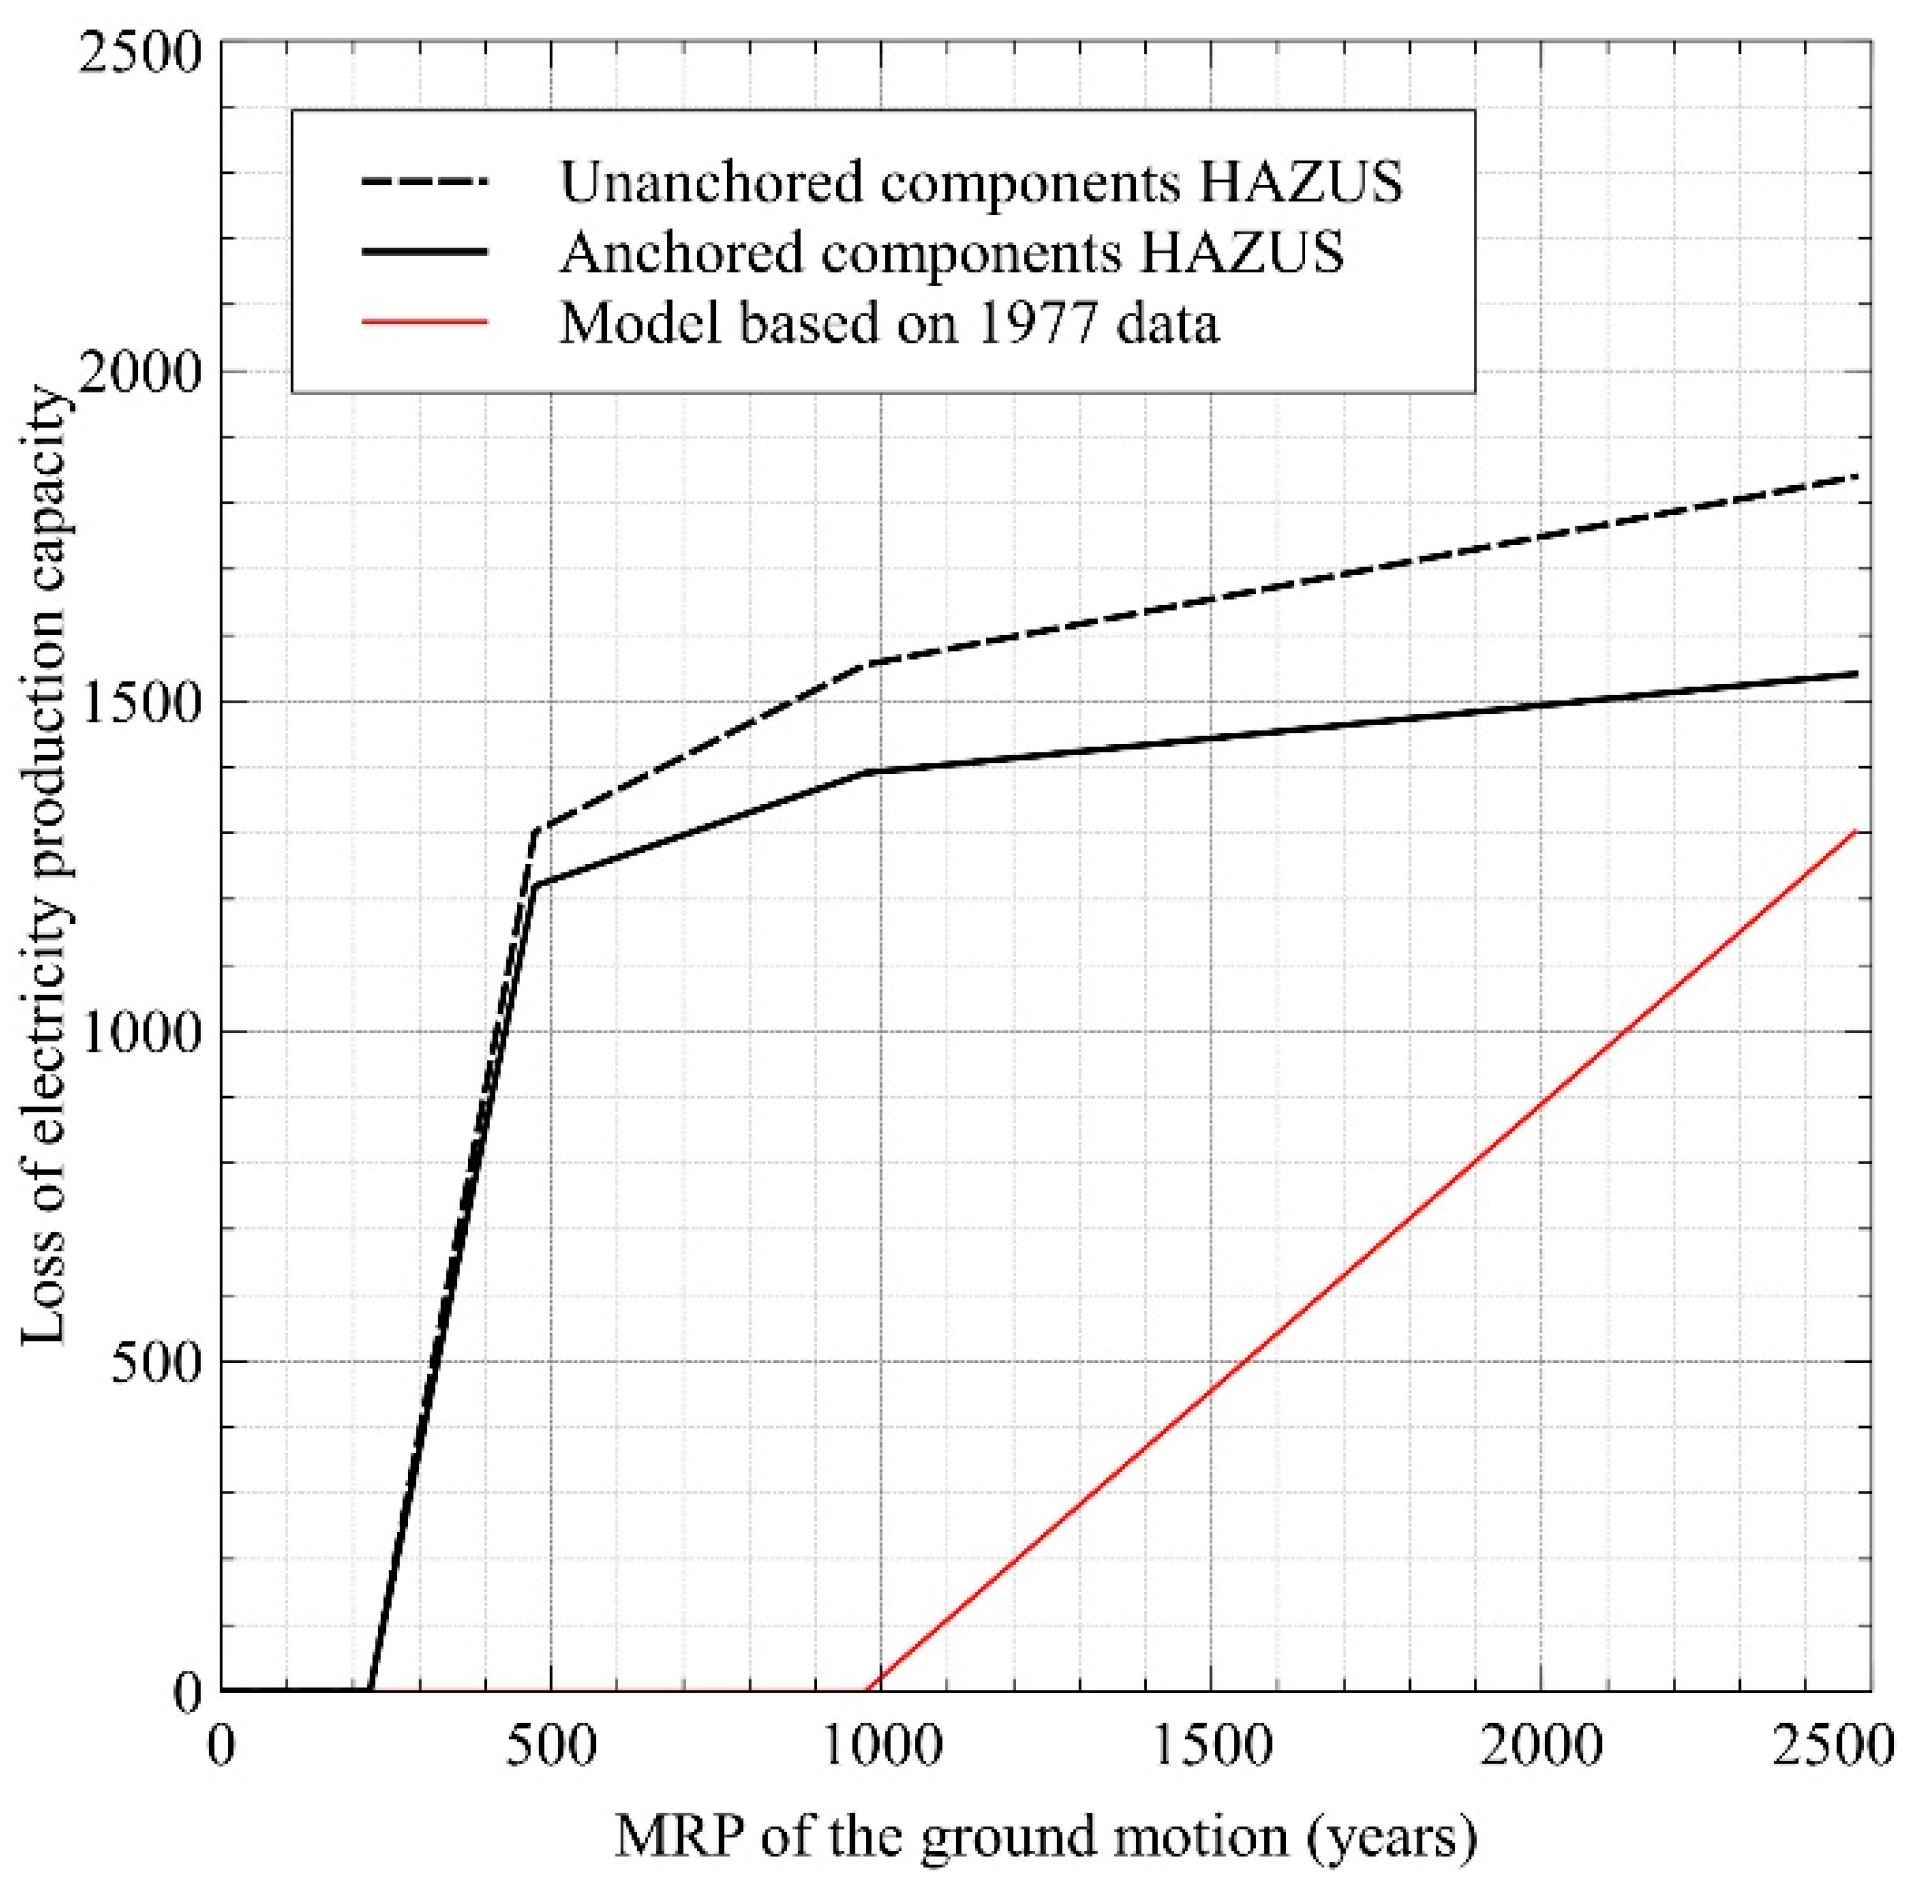
  • The risk metrics computed using the fragility model derived from the damage observed after the Vrancea 1977 earthquake provided smaller risk estimates as compared to the results computed with the fragility functions from HAZUS [44];
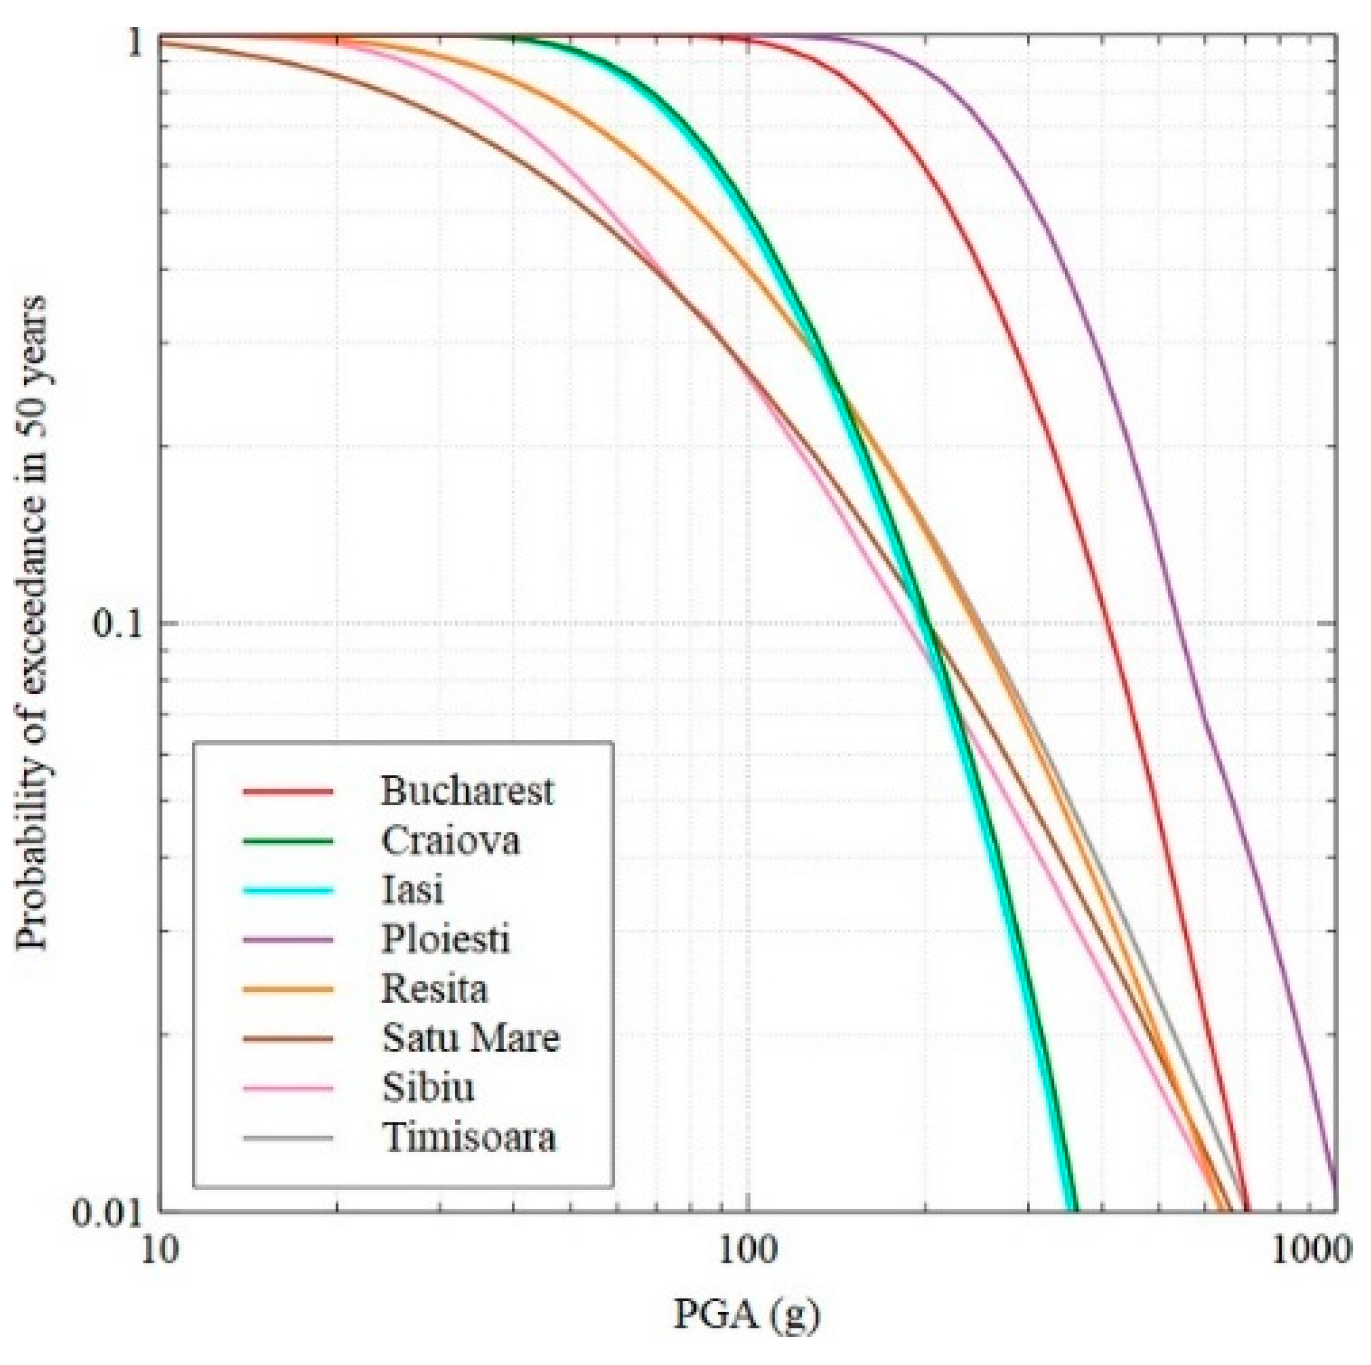
  • The maximum loss in electricity production capacity obtained for a ground motion with a mean return period of 2500 years (ranging from 0.13 g to 0.85 g) was less than half of the current production capacity of thermoelectric powerplants in Romania. The five main coal-fired powerplants in the South-Western part of Romania (Turceni, Rovinari, Craiova, Isalnita, and Paroseni) would not reach an extensive damage state even for ground motions having mean return periods of 2500 years;
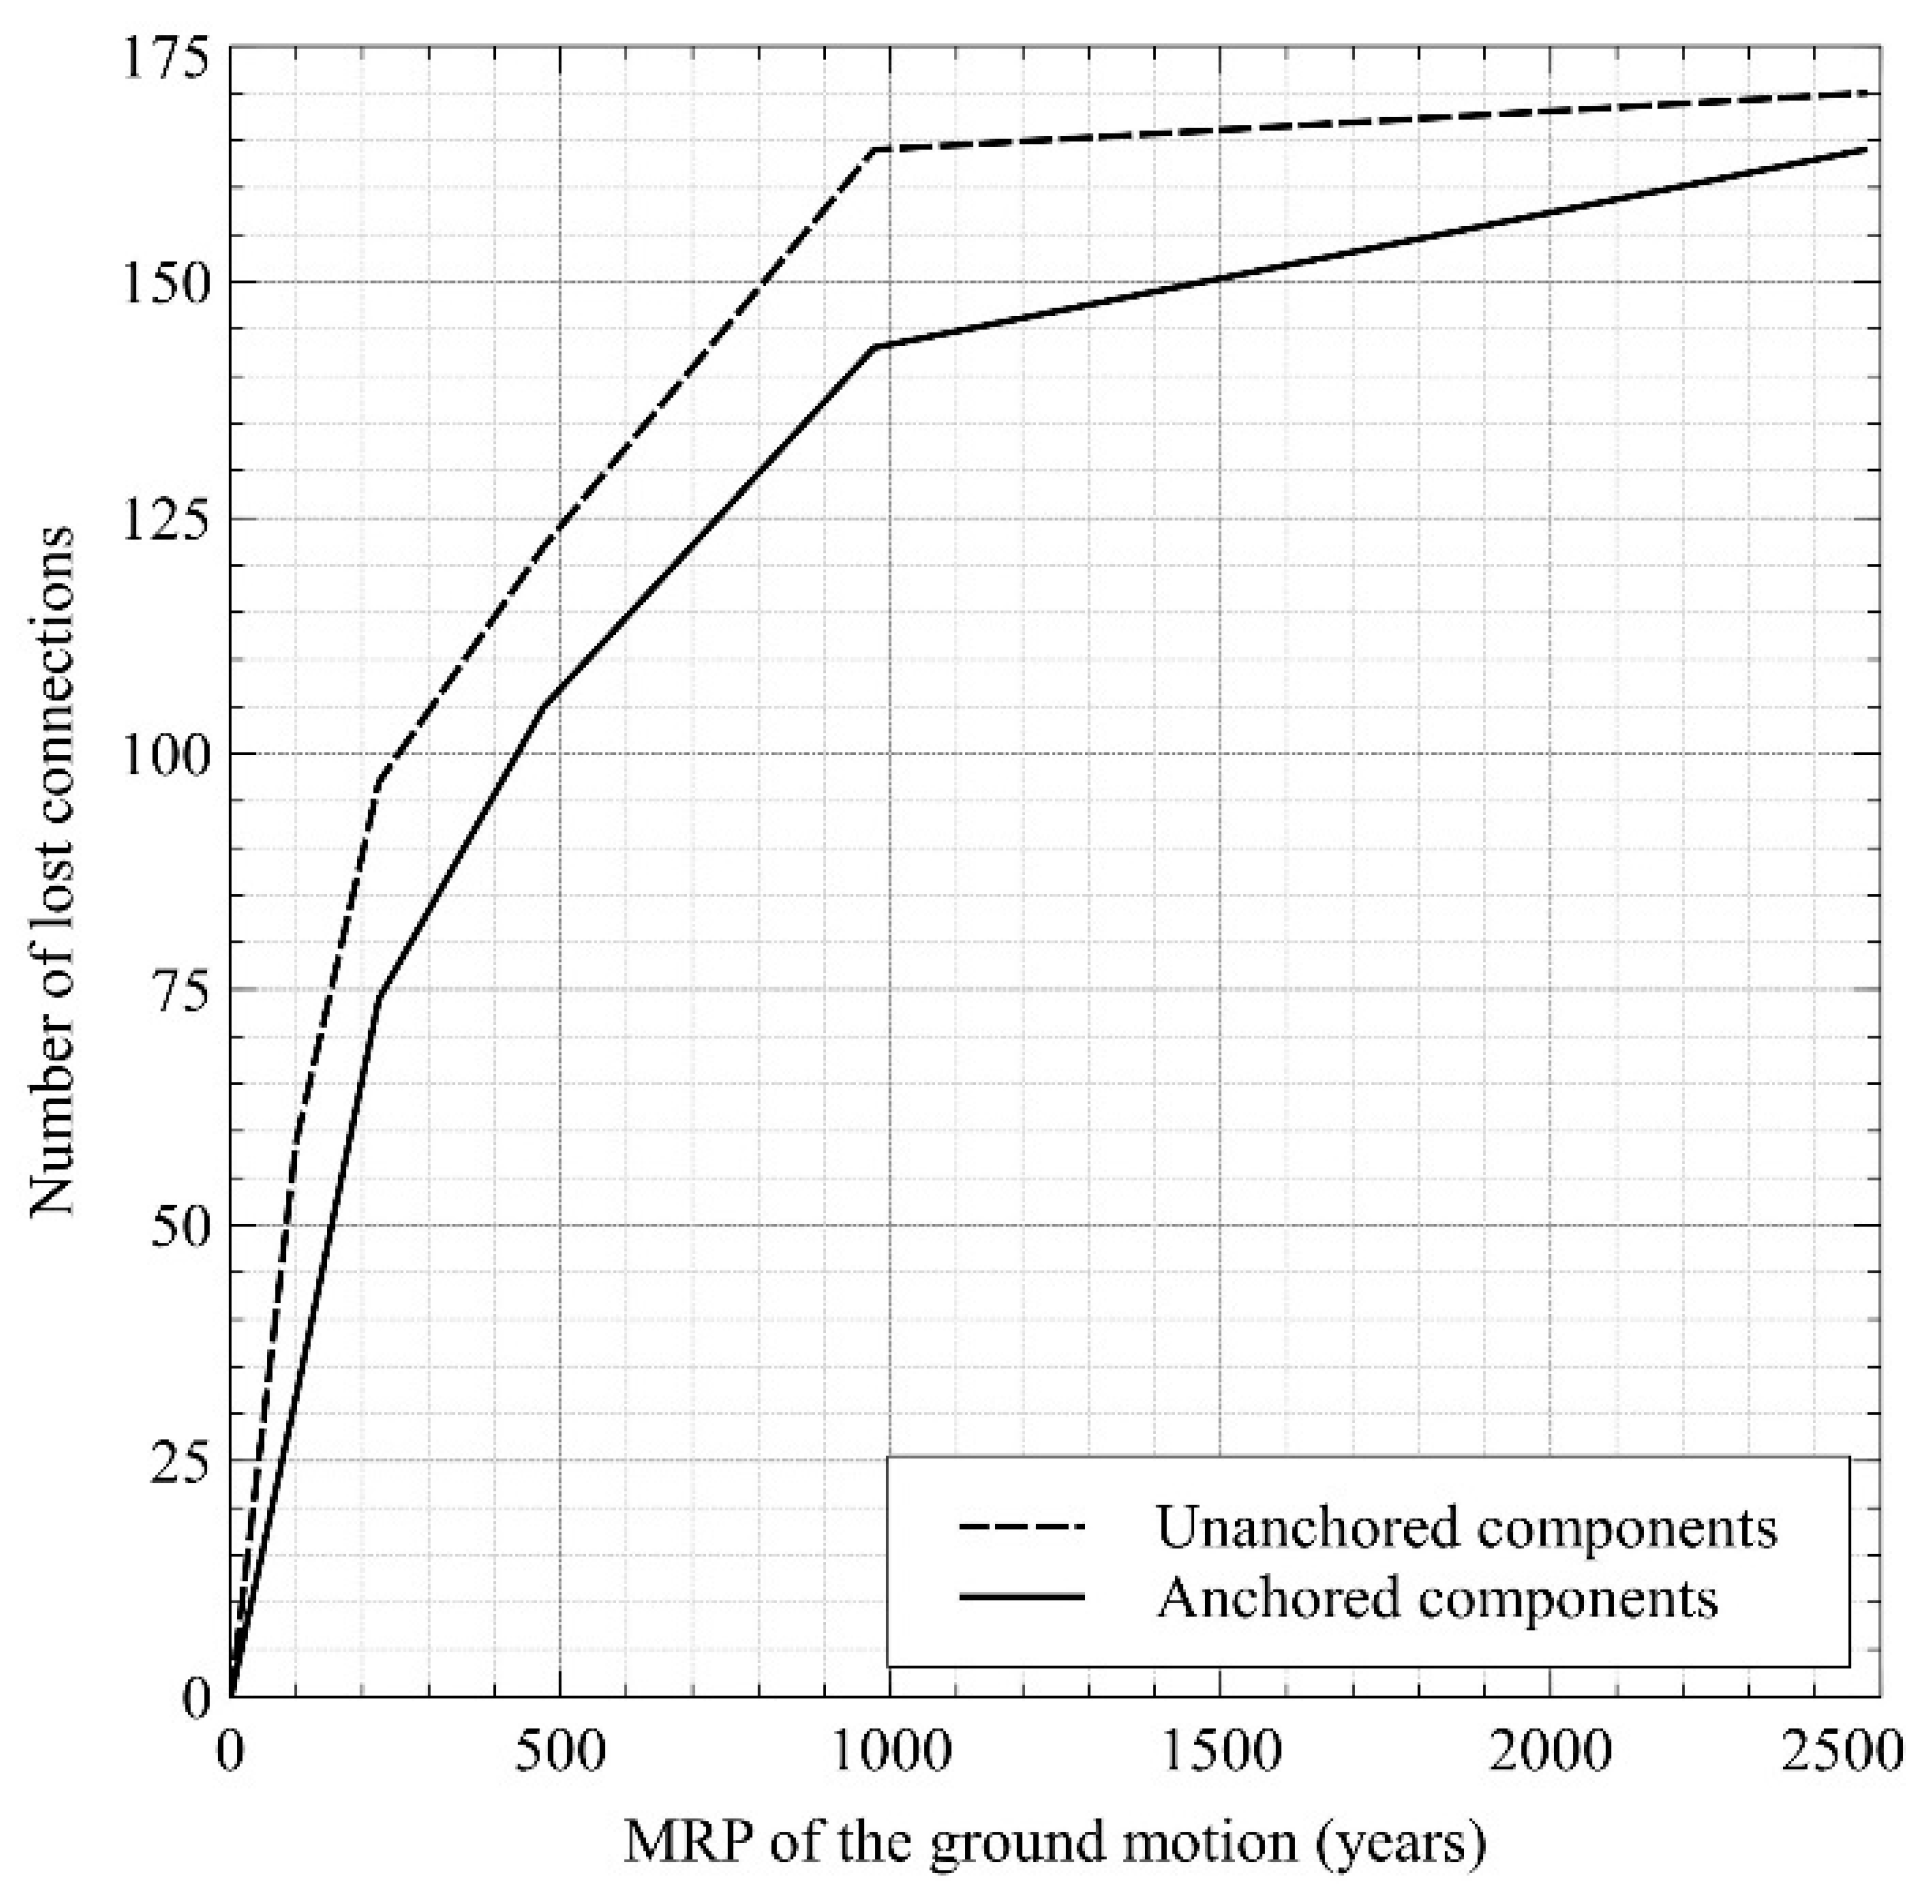
  • The influence of anchoring the components on the seismic risk metrics for substations was less important than in the case of thermoelectric powerplants;
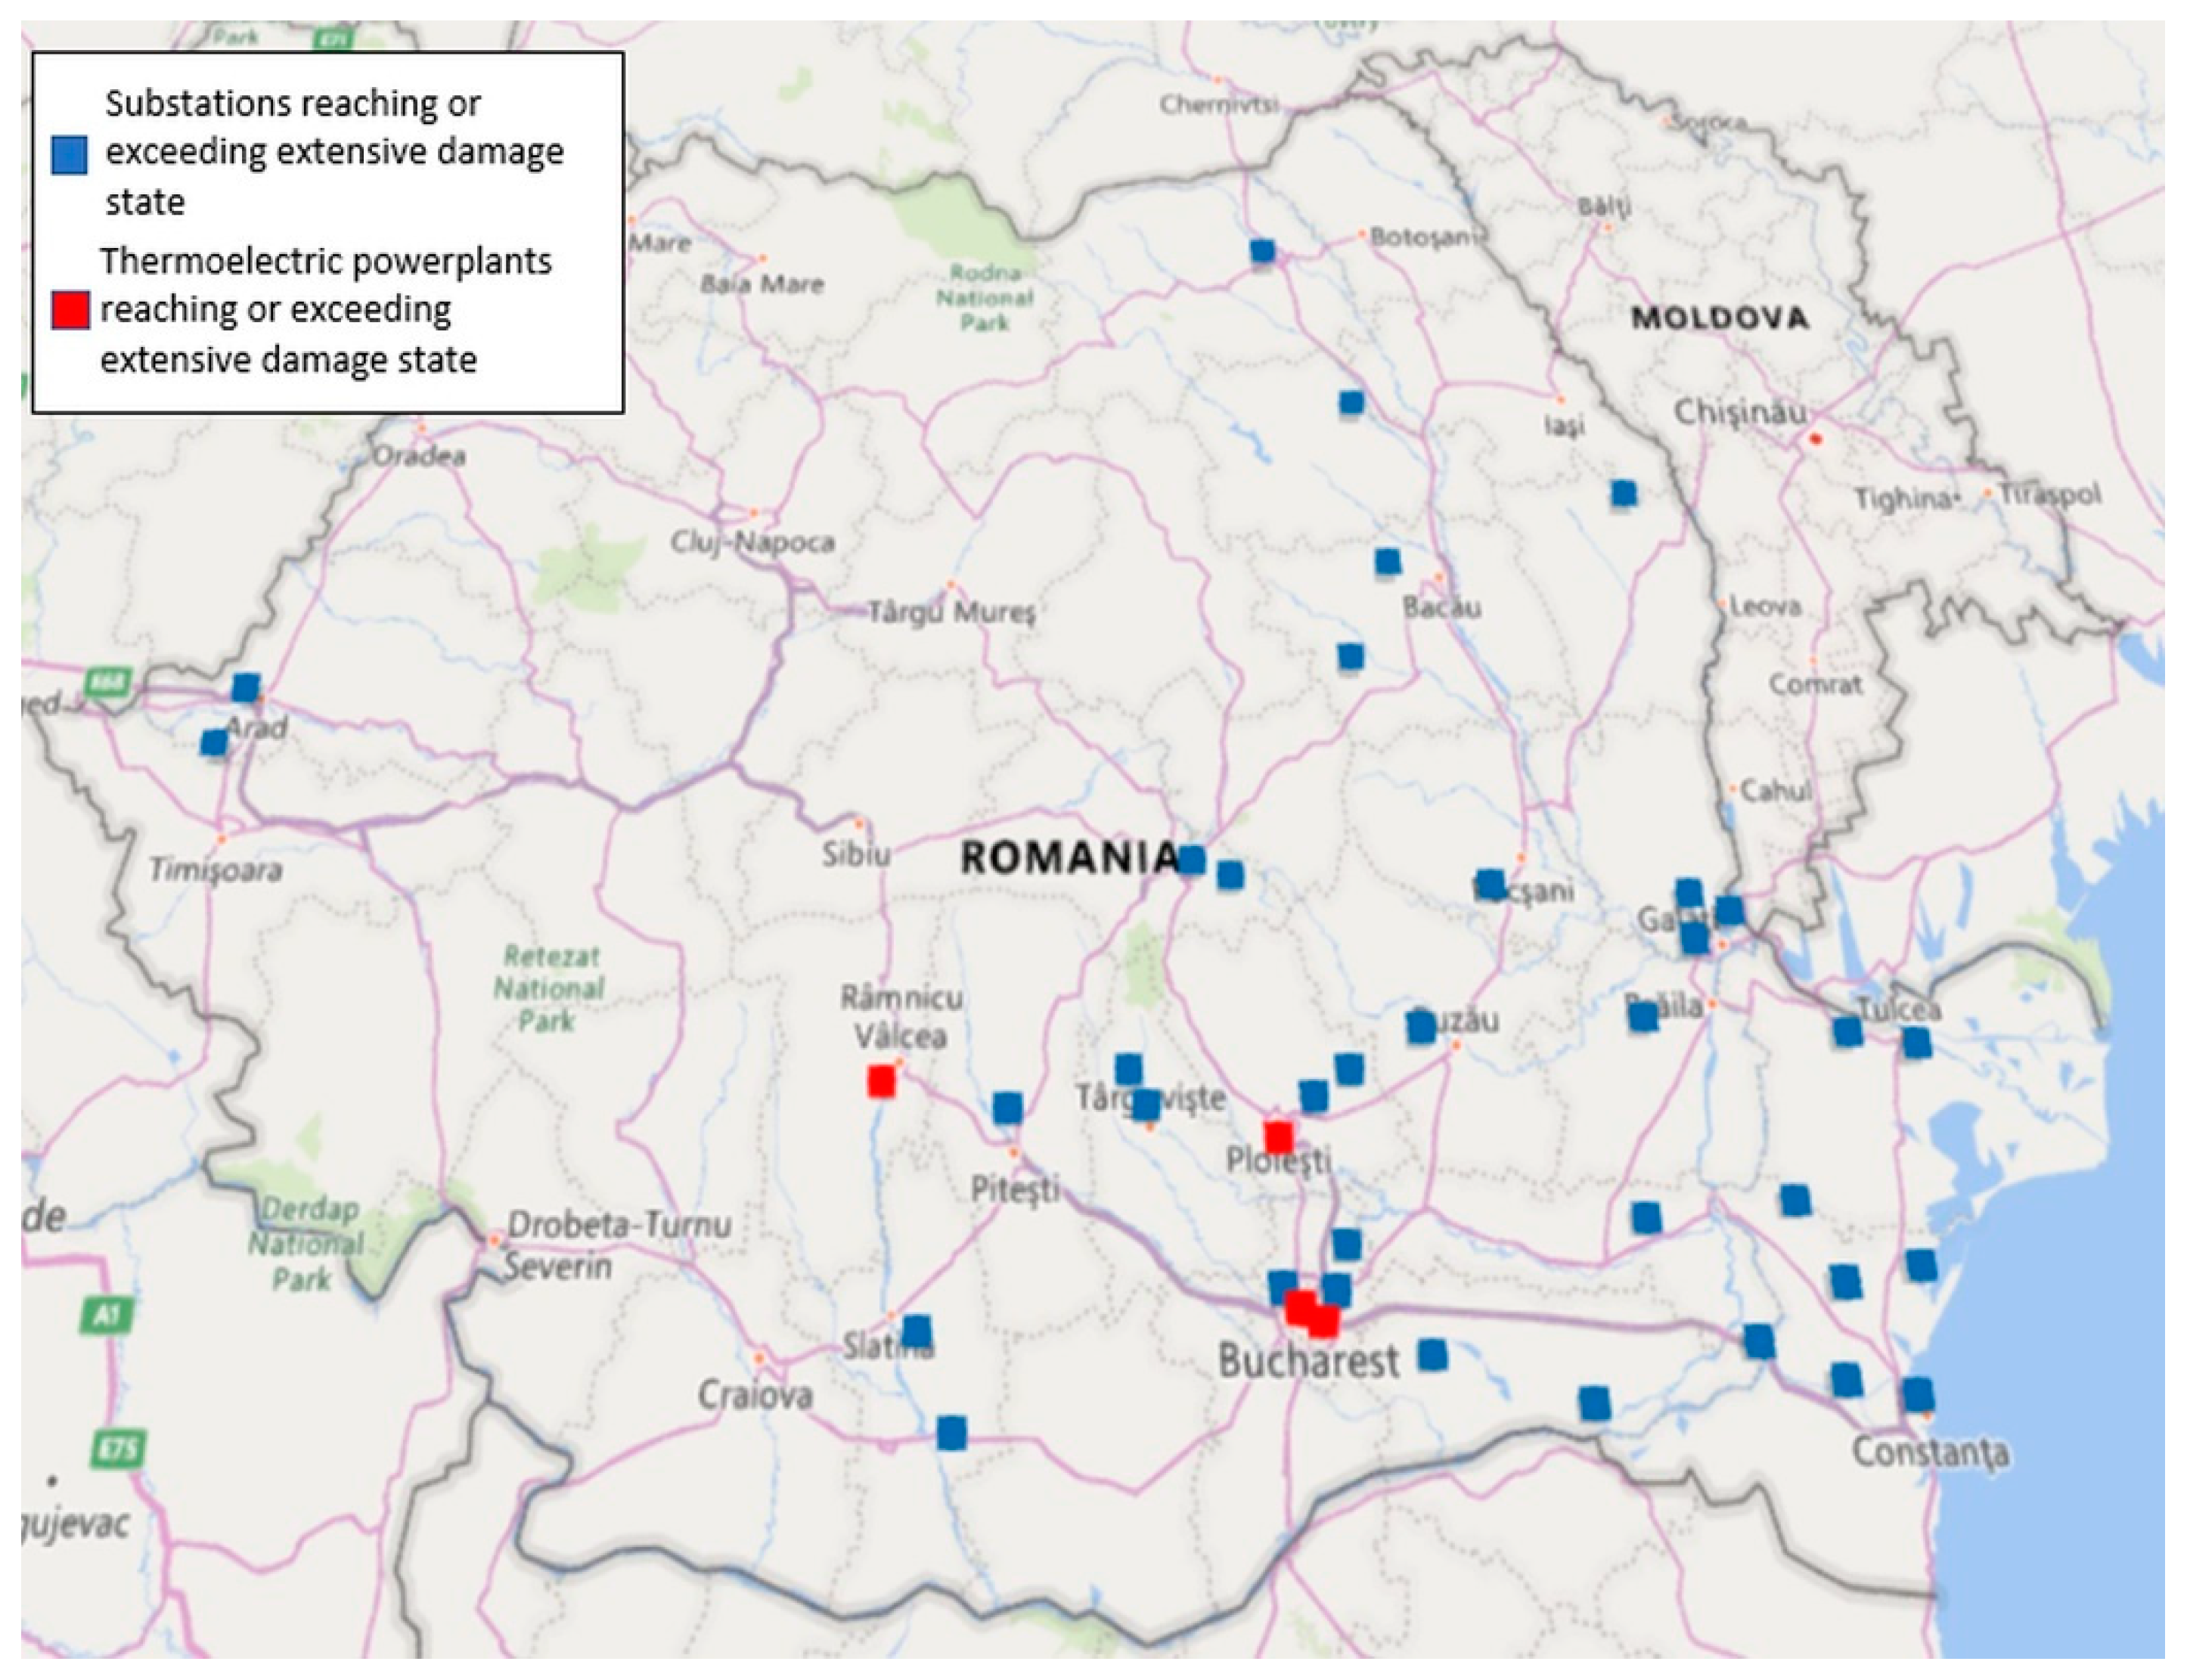
  • The relative number of electric substations (36 out of 81) reaching or exceeding an extensive damage state was much larger than in the case of thermoelectric powerplants (4 out of 15) for the selected ground motion level;
  • As a general observation, it appears that the level of seismic risk is larger for electric substations than for powerplants, due to the parameters of seismic fragility. More analyses and a validation of HAZUS [44] seismic fragility using data from the Romanian electricity network should be performed in the future. In addition, more data about seismic exposure (considering other energy production facilities, transformers, etc.) are needed in order to improve the quality of the seismic risk model. The impact of the spatial correlation of ground motion amplitudes on the seismic risk metrics should also be assessed.

Author Contributions

Conceptualization, F.P. and R.V.; methodology, F.P. and R.V.; investigation, F.P.; data curation, F.P.; writing—original draft preparation, F.P.; writing—review and editing, R.V.; visualization, R.V. All authors have read and agreed to the published version of the manuscript.

Funding

This research received no external funding.

Institutional Review Board Statement

Not applicable.

Informed Consent Statement

Not applicable.

Data Availability Statement

The data presented in this study are available on request from the first author.

Conflicts of Interest

The authors declare no conflict of interest.

References

  1. Poljanšek, K.; Bono, F.; Gutiérrez, E. Seismic risk assessment of interdependent critical infrastructure systems: The case of European gas and electricity networks. Earthq. Eng. Struct. Dyn. 2012, 41, 61–79. [Google Scholar] [CrossRef]
  2. Giardini, D.; Grünthal, G.; Shedlock, K.M.; Zhang, P. The GSHAP Global Seismic Hazard Map. Ann. Geophys. 1999, 42. [Google Scholar] [CrossRef]
  3. Kongar, I.; Giovinazzi, S.; Rossetto, T. Seismic risk assessment of interdependent electric power and water supply systems in Christchurch, New Zealand. In Proceedings of the 16th World Conference on Earthquake Engineering, Santiago, Chile, 9–13 January 2017; p. 12. [Google Scholar]
  4. Salman, A.M.; Li, Y. A Probabilistic Framework for Seismic Risk Assessment of Electric Power Systems. Procedia Eng. 2017, 199, 1187–1192. [Google Scholar] [CrossRef]
  5. Salman, A.M.; Li, Y. Multihazard Risk Assessment of Electric Power Systems. J. Struct. Eng. 2017, 143, 04016198. [Google Scholar] [CrossRef]
  6. Liu, Y.; Wotherspoon, L.; Nair, N.-K.C.; Blake, D. Quantifying the seismic risk for electric power distribution systems. Struct. Infrastruct. Eng. 2021, 17, 217–232. [Google Scholar] [CrossRef]
  7. Zekavati, A.A.; Jafari, M.A.; Mahmoudi, A. Regional seismic risk assessment method for electric power substations: A case study. Life Cycle Reliab. Saf. Eng. 2021. [Google Scholar] [CrossRef]
  8. Nuti, C.; Rasulo, A.; Vanzi, I. Seismic safety evaluation of electric power supply at urban level. Earthq. Eng. Struct. Dyn. 2007, 36, 245–263. [Google Scholar] [CrossRef]
  9. Fregonese, R.; Gardini, G.; Gobbi, M.E. Seismic vulnerability of electrical grids: A structural upgrading procedure. Struct. Infrastruct. Eng. 2014, 10, 1648–1665. [Google Scholar] [CrossRef]
  10. Vanzi, I. Structural upgrading strategy for electric power networks under seismic action. Earthq. Eng. Struct. Dyn. 2000, 29, 1053–1073. [Google Scholar] [CrossRef]
  11. Romero, N.; Nozick, L.K.; Dobson, I.; Xu, N.; Jones, D.A. Seismic Retrofit for Electric Power Systems. Earthq. Spectra 2015, 31, 1157–1176. [Google Scholar] [CrossRef] [Green Version]
  12. Lee, S.; Choi, M.; Lee, H.-S.; Park, M. Bayesian network-based seismic damage estimation for power and potable water supply systems. Reliab. Eng. Syst. Saf. 2020, 197, 106796. [Google Scholar] [CrossRef]
  13. Wang, C.; Feng, K.; Zhang, H.; Li, Q. Seismic performance assessment of electric power systems subjected to spatially correlated earthquake excitations. Struct. Infrastruct. Eng. 2019, 15, 351–361. [Google Scholar] [CrossRef]
  14. Filiatrault, A.; Kremmidas, S. Seismic Interaction of Interconnected Electrical Substation Equipment. J. Struct. Eng. 2000, 126, 1140–1149. [Google Scholar] [CrossRef]
  15. Shinozuka, M.; Rose, A.; Eguchi, R.T. Engineering and Socioeconomic Impacts of Earthquakes—An Analysis of Electricity Lifeline Disruptions in the New Madrid Area; MCEER; University at Buffalo: Buffalo, NY, USA, 1998. [Google Scholar]
  16. Sarreshtehdari, A.; Elhami Khorasani, N.; Coar, M. A streamlined approach for evaluating post-earthquake performance of an electric network. Sustain. Resilient Infrastruct. 2020, 5, 232–251. [Google Scholar] [CrossRef]
  17. Li, J.; Wang, T.; Shang, Q. Probability-based seismic resilience assessment method for substation systems. Struct. Infrastruct. Eng. 2022, 18, 71–83. [Google Scholar] [CrossRef]
  18. Pavel, F.; Vacareanu, R.; Arion, C.; Aldea, A.; Scupin, A. Seismic risk assessment of lifelines in Bucharest. Int. J. Disaster Risk Reduct. 2021, 66, 102629. [Google Scholar] [CrossRef]
  19. Arion, C.; Pavel, F.; Vacareanu, R.; Neagu, C.; Iancovici, M.; Popa, V.; Damian, I. Seismic risk assessment of Romania. In Seismic Hazard and Risk Assessment Updated Overview with Emphasis on Romania; Springer: Berlin/Heidelberg, Germany, 2018; pp. 251–265. ISBN 978-3-319-74723-1. [Google Scholar]
  20. Cavalieri, F.; Franchin, P.; Pinto, P.E. Fragility Functions of Electric Power Stations. In SYNER-G: Typology Definition and Fragility Functions for Physical Elements at Seismic Risk: Buildings, Lifelines, Transportation Networks and Critical Facilities; Pitilakis, K., Crowley, H., Kaynia, A.M., Eds.; Geotechnical, Geological and Earthquake Engineering; Springer: Dordrecht, The Netherlands, 2014; pp. 157–185. ISBN 978-94-007-7872-6. [Google Scholar]
  21. Erdik, M. Report on 1999 Kocaeli and Duzce (TURKEY) Earthquakes. 2001. Available online: http://www.koeri.boun.edu.tr/depremmuh/eqspecials/kocaeli/kocaelireport.pdf (accessed on 11 January 2022).
  22. Scawthorn, C.; Miyajima, M.; Ono, Y.; Kiyono, J.; Hamada, M. Lifeline Aspects of the 2004 Niigata Ken Chuetsu, Japan, Earthquake. Earthq. Spectra 2006, 22, 89–110. [Google Scholar] [CrossRef]
  23. Rasulo, A.; Goretti, A.; Nuti, C. Performance of Lifelines during the 2002 Molise, Italy, Earthquake. Earthq. Spectra 2004, 20, 301–314. [Google Scholar] [CrossRef]
  24. Kwasinski, A.; Eidinger, J.; Tang, A.; Tudo-Bornarel, C. Performance of Electric Power Systems in the 2010–2011 Christchurch, New Zealand, Earthquake Sequence. Earthq. Spectra 2014, 30, 205–230. [Google Scholar] [CrossRef]
  25. Liu, R.S.; Zhang, M.J.; Wu, Y.B. Vulnerability Study of Electric Power Grid in Different Intensity Area in Wenchuan Earthquake. In Proceedings of the 15th World Conference on Earthquake Engineering, Lisbon, Portugal, 24–28 September 2012; p. 10. [Google Scholar]
  26. Karagiannis, G.M.; Chondrogiannis, S.; Krausmann, E.; Turksezer, Z.I. Power Grid Recovery after Natural Hazard Impact; JRC: Ispra, Italy, 2017. [Google Scholar]
  27. Eidinger, J. Fragility of electric power distribution systems. In Proceedings of the 16th World Conference on Earthquake Engineering, Santiago, Chile, 9–13 January 2017; p. 12. [Google Scholar]
  28. Araneda, J.C.; Rudnick, H.; Mocarquer, S.; Miquel, P. Lessons from the 2010 Chilean earthquake and its impact on electricity supply. In Proceedings of the 2010 International Conference on Power System Technology, Hangzhou, China, 24–28 October 2010; pp. 1–7. [Google Scholar]
  29. Balan, S.; Cristescu, V.; Cornea, I. The March 4, 1977 Romanian Earthquake; Editura Academiei: Bucharest, Romania, 1982. [Google Scholar]
  30. Schitco, V.; Ghergu, I.; Badescu, F. The seismic behaviour of constructions for thermoelectric powerplants. In Proceedings of the National Conference for Design, Execution an Expertise of Structures in Seismic Areas, Iasi, Romania, 27 April 1983; Volume I, pp. 301–310. [Google Scholar]
  31. Nitu, V.; Rascu, P.; Stoleru, B.; Voinea, D. Aspects regarding the earthquake behaviour of electric installations. Conclusions for design. Energetica 1977, 1977, 439–449. [Google Scholar]
  32. Popescu, H.; Enescu, C.; Peneaca, G.; Pintea, K. The behaviour of the installations from thermoelectric power plants during the March 4, 1977 earthquake. Energetica 1977, 1977, 437–438. [Google Scholar]
  33. ICCPDC. The March 4, 1977 Earthquake in Romania and Its Effects on Constructions; ICCPDC: Bucharest, Romania, 1978; Volume 1. [Google Scholar]
  34. Ganea, I.; Croitoru, M.; Savin, F. The Electrification Process in Romania 1951–1992; Ed. Tehnica: Bucharest, Romania, 1996. [Google Scholar]
  35. Electricity Production—Transelectrica. Available online: https://www.transelectrica.ro/ro/web/tel/productie (accessed on 14 January 2022).
  36. Hristoforov, A.; Mustata, V.; Nedelcu, O.; Stoica, F.; Schitco, V. The evolution of the design solutions for the main building of thermoelectric powerplants. Energetica 1978, 1978, 393–395. [Google Scholar]
  37. CSCAS P13-63: Code for the Design of Civil and Industrial Buildings in Seismic Regions; CSCAS: Bucharest, Romania, 1963.
  38. INCERC P13-70: Code for the Design of Civil and Industrial Buildings in Seismic Regions; NCERC: Bucharest, Romania, 1970.
  39. Pavel, F.; Vacareanu, R.; Douglas, J.; Radulian, M.; Cioflan, C.; Barbat, A. An Updated Probabilistic Seismic Hazard Assessment for Romania and Comparison with the Approach and Outcomes of the SHARE Project. Pure Appl. Geophys. 2016, 173, 1881–1905. [Google Scholar] [CrossRef] [Green Version]
  40. Pavel, F.; Vacareanu, R.; Pitilakis, K. Preliminary revision of the seismic zonation from the current Romanian seismic design code. In Earthquake Geotechnical Engineering for Protection and Development of Environment and Constructions; CRC Press: Rome, Italy, 2019; pp. 4412–4419. ISBN 978-0-429-63350-8. [Google Scholar]
  41. Wald, D.J.; Allen, T.I. Topographic Slope as a Proxy for Seismic Site Conditions and Amplification. Bull. Seismol. Soc. Am. 2007, 97, 1379–1395. [Google Scholar] [CrossRef] [Green Version]
  42. Pavel, F.; Vacareanu, R.; Pitilakis, K. Preliminary Evaluation of the Impact of Eurocode 8 Draft Revision on the Seismic Zonation of Romania. Appl. Sci. 2022, 12, 649. [Google Scholar] [CrossRef]
  43. EFEHR|Hazard.EFEHR. Available online: http://hazard.efehr.org/en/home/ (accessed on 3 January 2022).
  44. FEMA Multi-Hazard Loss Estimation Methodology—HAZUS-MH 2.1. Technical Manual. 2012. Available online: https://www.fema.gov/sites/default/files/2020-09/fema_hazus_earthquake-model_technical-manual_2.1.pdf. (accessed on 11 January 2022).
  45. Mehralian, H.; Azarbakht, A. Seismic loss assessment: The case study of the power distribution network in Arak city, Iran. J. Civ. Eng. Mater. Appl. 2020, 4, 195–207. [Google Scholar] [CrossRef]
  46. Poulos, A.; Espinoza, S.; De la Llera, J.C.; Rudnick, H. Seismic risk asseessment of spatially distributed electric power systems. In Proceedings of the 16th World Conference on Earthquake Engineering, Santiago, Chile, 9–13 January 2017; p. 12. [Google Scholar]
  47. Dunn, S.; Wilkinson, S.; Alderson, D.; Fowler, H.; Galasso, C. Fragility Curves for Assessing the Resilience of Electricity Networks Constructed from an Extensive Fault Database. Nat. Hazards Rev. 2018, 19, 04017019. [Google Scholar] [CrossRef] [Green Version]
  48. Holmgren, Å.J. A Framework for Vulnerability Assessment of Electric Power Systems. In Critical Infrastructure: Reliability and Vulnerability; Advances in Spatial Science; Murray, A.T., Grubesic, T.H., Eds.; Springer: Berlin/Heidelberg, Germany, 2007; pp. 31–55. ISBN 978-3-540-68056-7. [Google Scholar]
  49. Shinozuka, M.; Feng, M.; Dong, X.; Chang, S.; Cheng, T.-C.; Jin, X.; Saadeghvaziri, M.A. Advances in Seismic Performance Evaluation of Power Systems (2001–2003). Available online: https://citeseerx.ist.psu.edu/viewdoc/download?doi=10.1.1.522.2072&rep=rep1&type=pdf (accessed on 14 January 2022).
  50. Dueñas-Osorio, L.; Craig, J.I.; Goodno, B.J. Seismic response of critical interdependent networks. Earthq. Eng. Struct. Dyn. 2007, 36, 285–306. [Google Scholar] [CrossRef]
  51. Yakhchalian, M.; Nicknam, A.; Amiri, G.G. Optimal vector-valued intensity measure for seismic collapse assessment of structures. Earthq. Eng. Eng. Vib. 2015, 14, 37–54. [Google Scholar] [CrossRef]
  52. Kostinakis, K.; Athanatopoulou, A. Incremental dynamic analysis applied to assessment of structure-specific earthquake IMs in 3D R/C buildings. Eng. Struct. 2016, 125, 300–312. [Google Scholar] [CrossRef]
  53. Jamshidiha, H.R.; Yakhchalian, M.; Mohebi, B. Advanced scalar intensity measures for collapse capacity prediction of steel moment resisting frames with fluid viscous dampers. Soil Dyn. Earthq. Eng. 2018, 109, 102–118. [Google Scholar] [CrossRef]
  54. Málaga-Chuquitaype, C.; Bougatsas, K. Vector-IM-based assessment of alternative framing systems under bi-directional ground-motion. Eng. Struct. 2017, 132, 188–204. [Google Scholar] [CrossRef] [Green Version]
  55. Bojórquez, E.; Chávez, R.; Reyes-Salazar, A.; Ruiz, S.E.; Bojórquez, J. A new ground motion intensity measure IB. Soil Dyn. Earthq. Eng. 2017, 99, 97–107. [Google Scholar] [CrossRef]
  56. Minas, S.; Galasso, C. Accounting for spectral shape in simplified fragility analysis of case-study reinforced concrete frames. Soil Dyn. Earthq. Eng. 2019, 119, 91–103. [Google Scholar] [CrossRef]
  57. Bojórquez, E.; Baca, V.; Bojórquez, J.; Reyes-Salazar, A.; Chávez, R.; Barraza, M. A simplified procedure to estimate peak drift demands for mid-rise steel and R/C frames under narrow-band motions in terms of the spectral-shape-based intensity measure INp. Eng. Struct. 2017, 150, 334–345. [Google Scholar] [CrossRef]
  58. Vacareanu, R.; Radulian, M.; Iancovici, M.; Pavel, F.; Neagu, C. Fore-Arc and Back-Arc Ground Motion Prediction Model for Vrancea Intermediate Depth Seismic Source. J. Earthq. Eng. 2015, 19, 535–562. [Google Scholar] [CrossRef]
  59. Rossetto, T.; Ioannou, I.; Grant, D.; Maqsood, T. Guidelines for Empirical Vulnerability Assessment; GEM: Pavia, Italy, 2014. [Google Scholar]
  60. Baker, J.W. Efficient Analytical Fragility Function Fitting Using Dynamic Structural Analysis. Earthq. Spectra 2015, 31, 579–599. [Google Scholar] [CrossRef]
Figure 1. Distribution of the sources for electricity production in Romania [35].
Buildings 12 00244 g001
Figure 2. Comparison of the average electricity production as a function of the source for (a) July 2021; (b) December 2021.
Buildings 12 00244 g002
Figure 3. Positions of the main elements at seismic risk (substations and thermoelectric powerplants) analyzed in this study.
Buildings 12 00244 g003
Figure 4. Seismic hazard curves for PGA at the eight analyzed sites.
Buildings 12 00244 g004
Figure 5. Comparison of the seismic fragility functions for medium-voltage substations [44] considering: (a) unanchored components; (b) anchored components.
Buildings 12 00244 g005
Figure 6. Comparison of the seismic fragility functions for medium/large powerplants [44] considering: (a) unanchored components; (b) anchored components.
Buildings 12 00244 g006
Figure 7. Positions of the 18 thermoelectric powerplants surveyed by Schitco et al. [30] and epicenter of the Vrancea 1977 intermediate-depth earthquake.
Buildings 12 00244 g007
Figure 8. Distribution of the damage degree of thermoelectric powerplants during the Vrancea 1977 earthquake as a function of (a) actual epicentral distance; (b) estimated peak ground acceleration.
Buildings 12 00244 g008
Figure 9. (a) Number of small powerplants reaching or exceeding an extensive damage state using the fragility functions from HAZUS [44] with and without anchored components, as well as using the model derived from the damage observed after the Vrancea 1977 earthquake; (b) number of medium/large powerplants reaching or exceeding an extensive damage state using the fragility functions from HAZUS [44] with and without anchored components, as well as the model derived from the damage observed after the Vrancea 1977 earthquake.
Buildings 12 00244 g009
Figure 10. Loss of electricity production capacity curves obtained using the fragility functions from HAZUS [44] with and without anchored components, as well as the model derived from the damage observed after the Vrancea 1977 earthquake.
Buildings 12 00244 g010
Figure 11. (a) Number of medium-voltage substations reaching or exceeding an extensive damage state with and without anchored components; (b) number of high-voltage substations reaching or exceeding an extensive damage state with and without anchored components.
Buildings 12 00244 g011
Figure 12. Loss of connectivity curves for substations with and without anchored components.
Buildings 12 00244 g012
Figure 13. Distribution of powerplants and substations reaching or exceeding an extensive damage state considering a ground motion with a mean return period of 475 years and seismic fragility for unanchored components.
Buildings 12 00244 g013
Table 1. Parameters (median and logarithmic standard deviation) of the fragility functions obtained for the Romanian thermoelectric powerplants built before 1977 and comparison with the HAZUS [44] parameters.
Damage StateRomanian Powerplants Built before 1977 (This Study)Small Powerplants with Unanchored Components (HAZUS)Medium/Large powerplants with Unanchored Components (HAZUS)
MedianβMedianβMedianβ
Slight0.210.780.100.500.100.60
Moderate0.450.720.170.500.220.55
Extensive0.650.830.420.500.490.50
Complete0.780.760.580.550.790.50
Publisher’s Note: MDPI stays neutral with regard to jurisdictional claims in published maps and institutional affiliations.

