
Cyclic Behavior of High-Strength Lightweight Concrete Exterior Beam-Column Connections Reinforced with GFRP

Abstract
:1. Introduction
2. Experimental Program
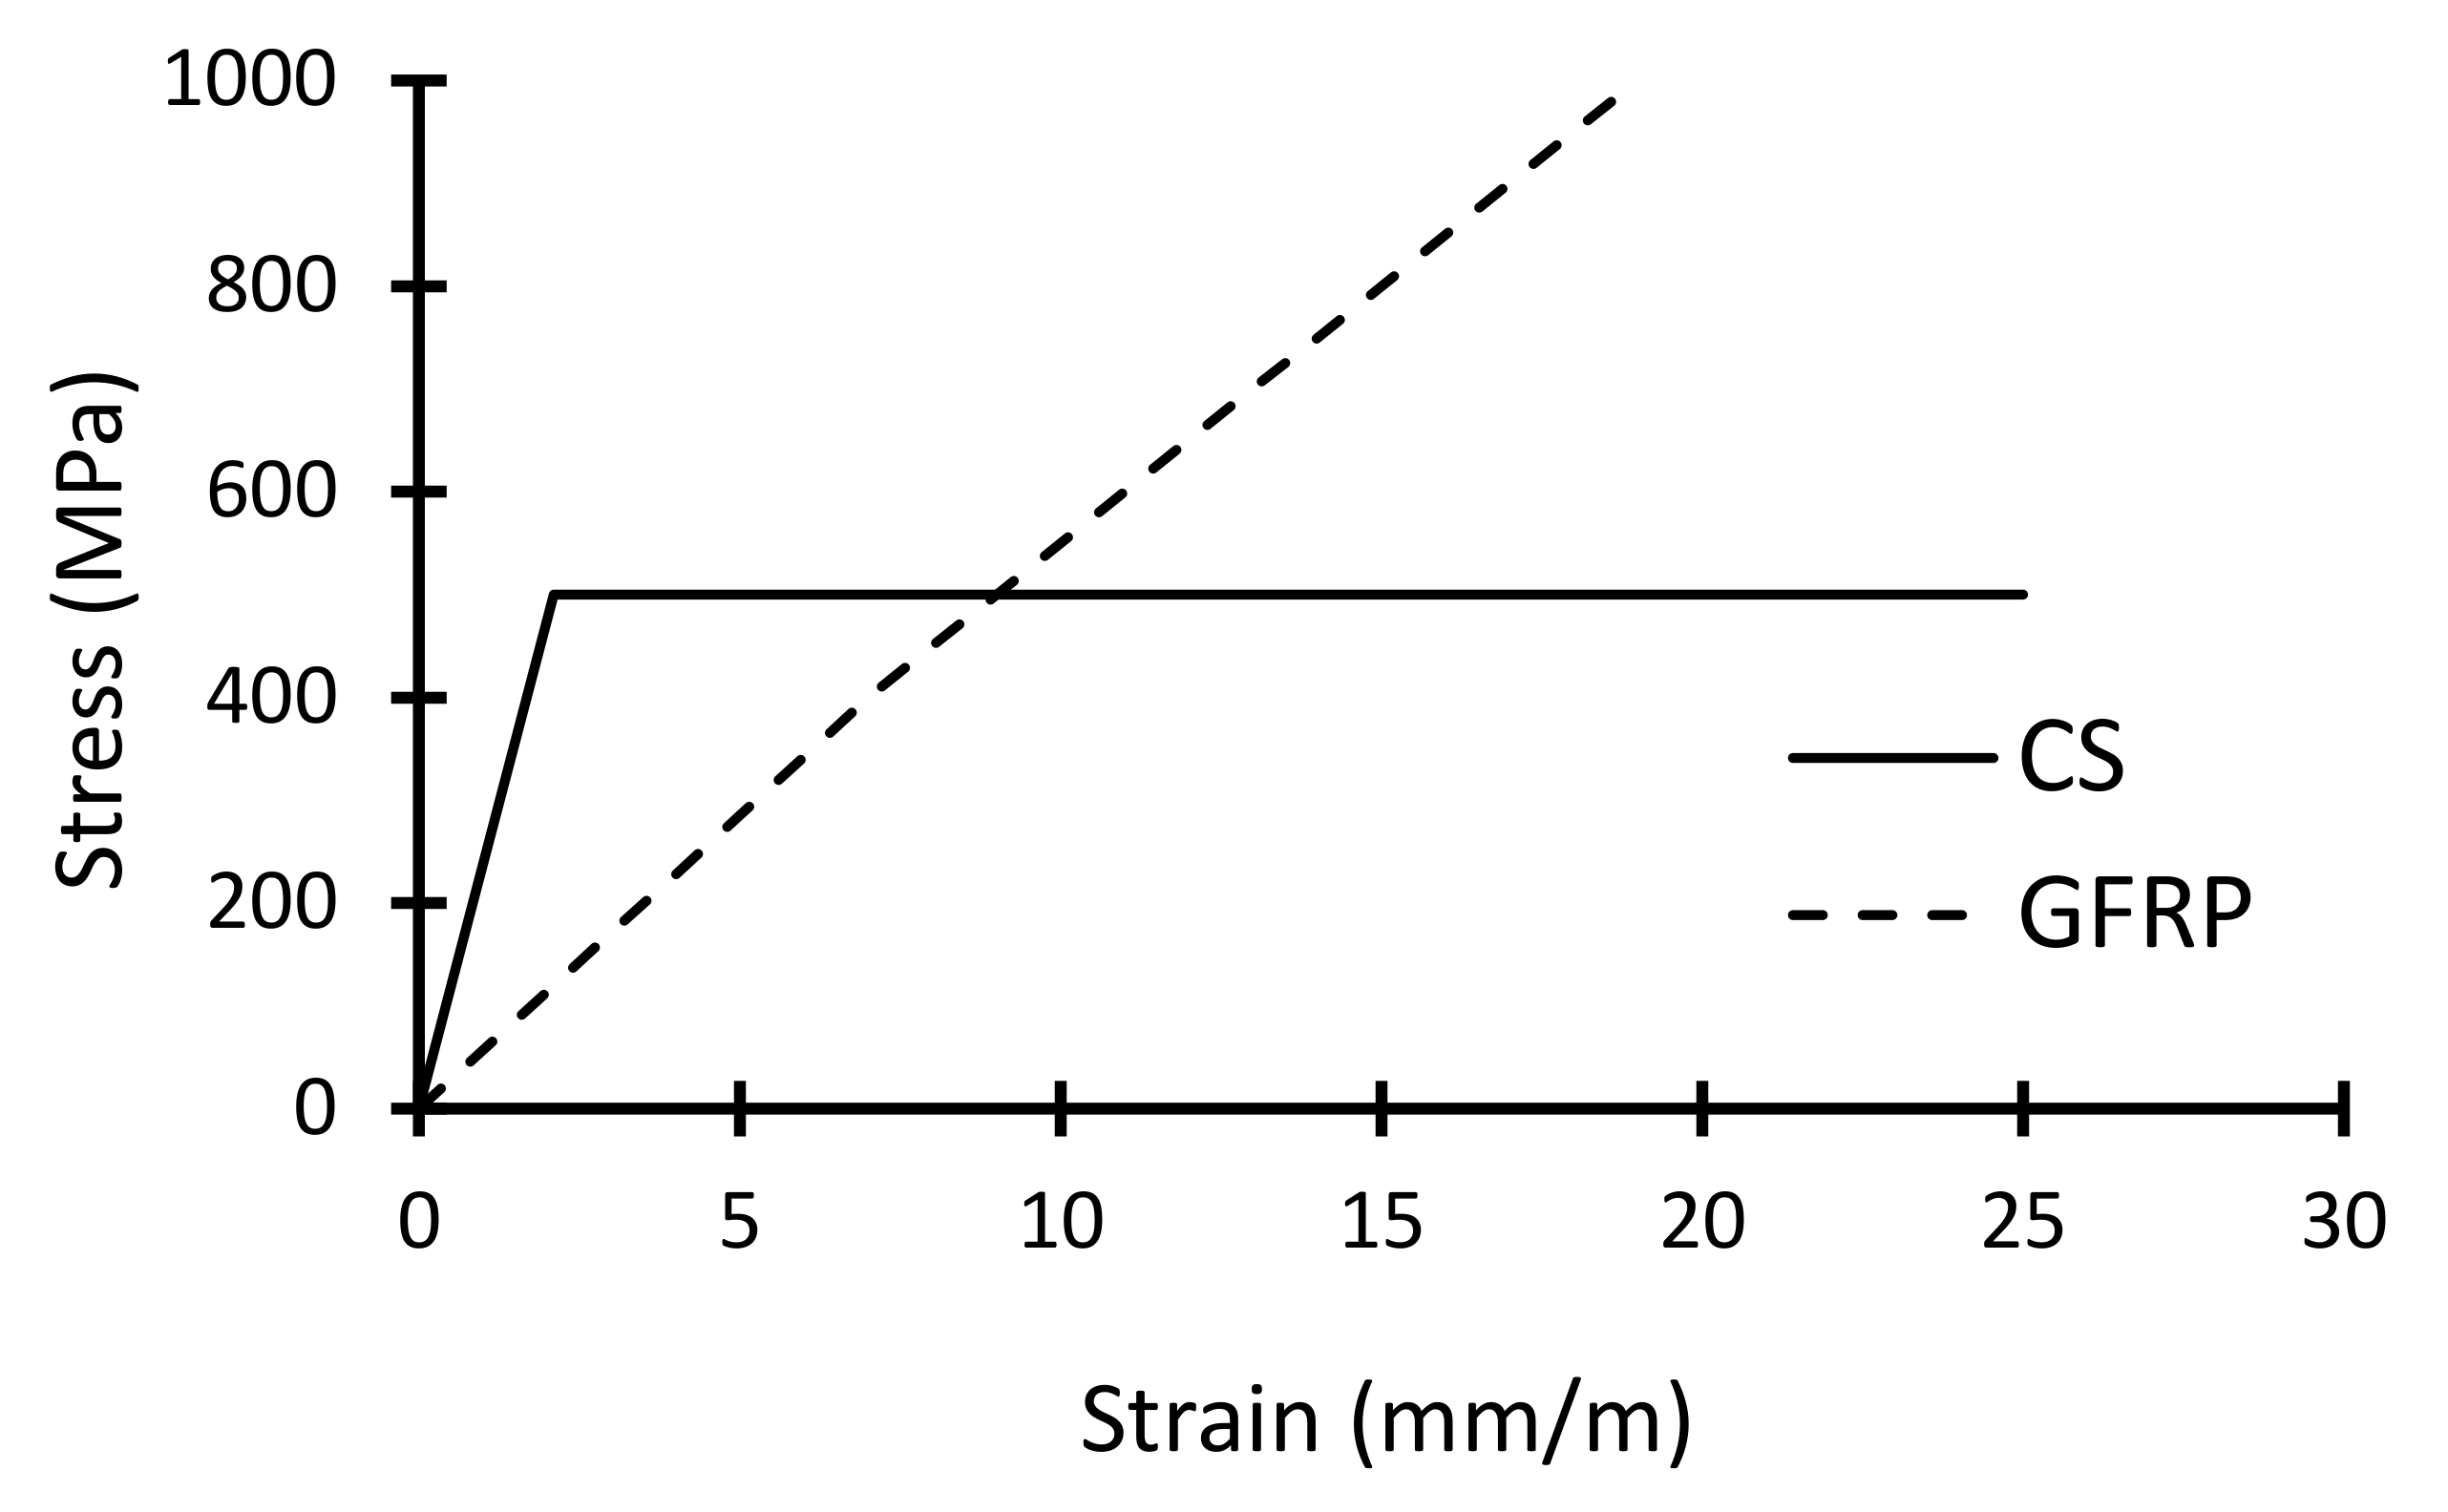
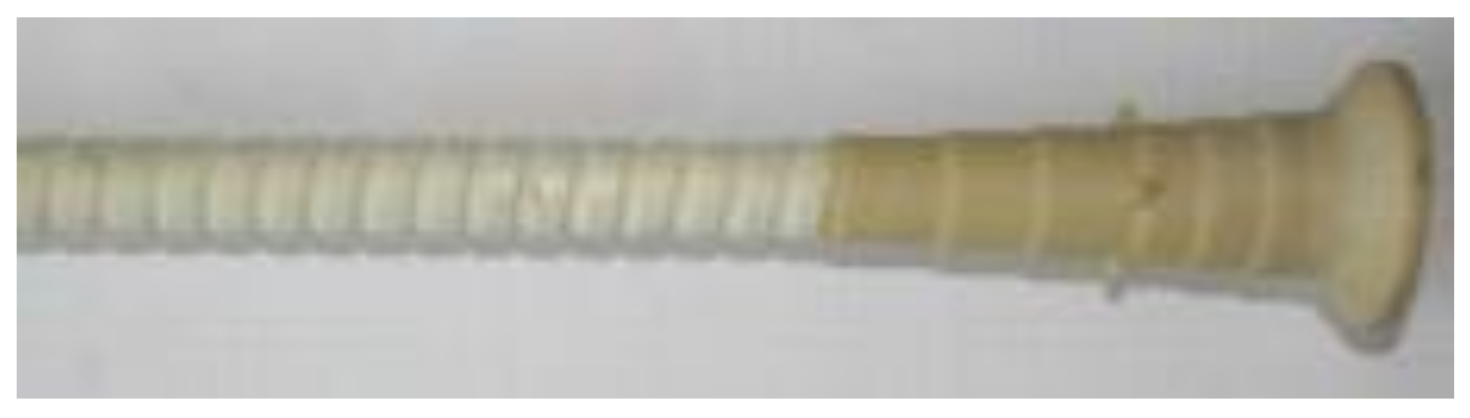
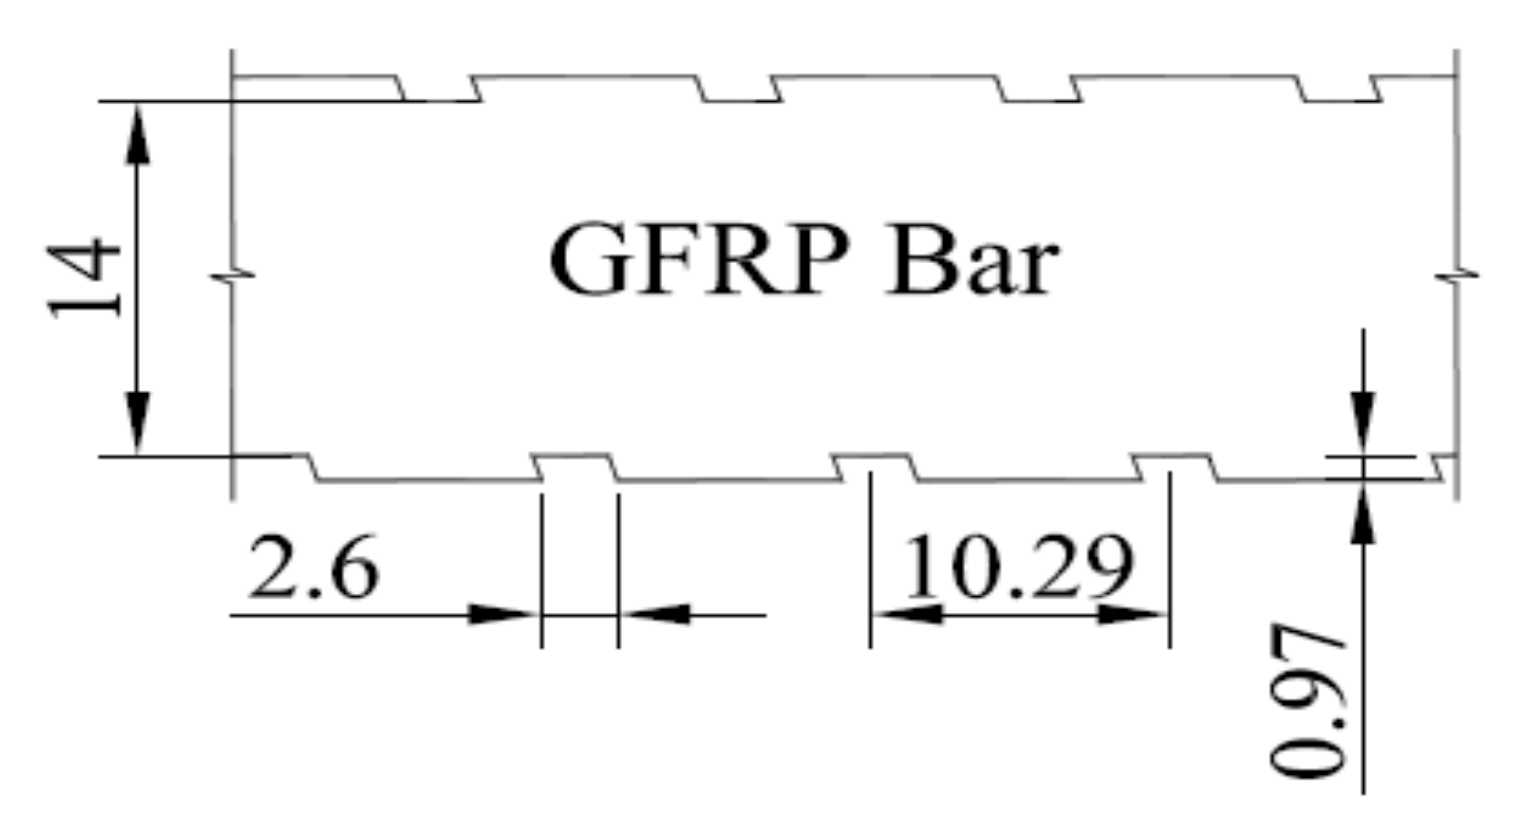
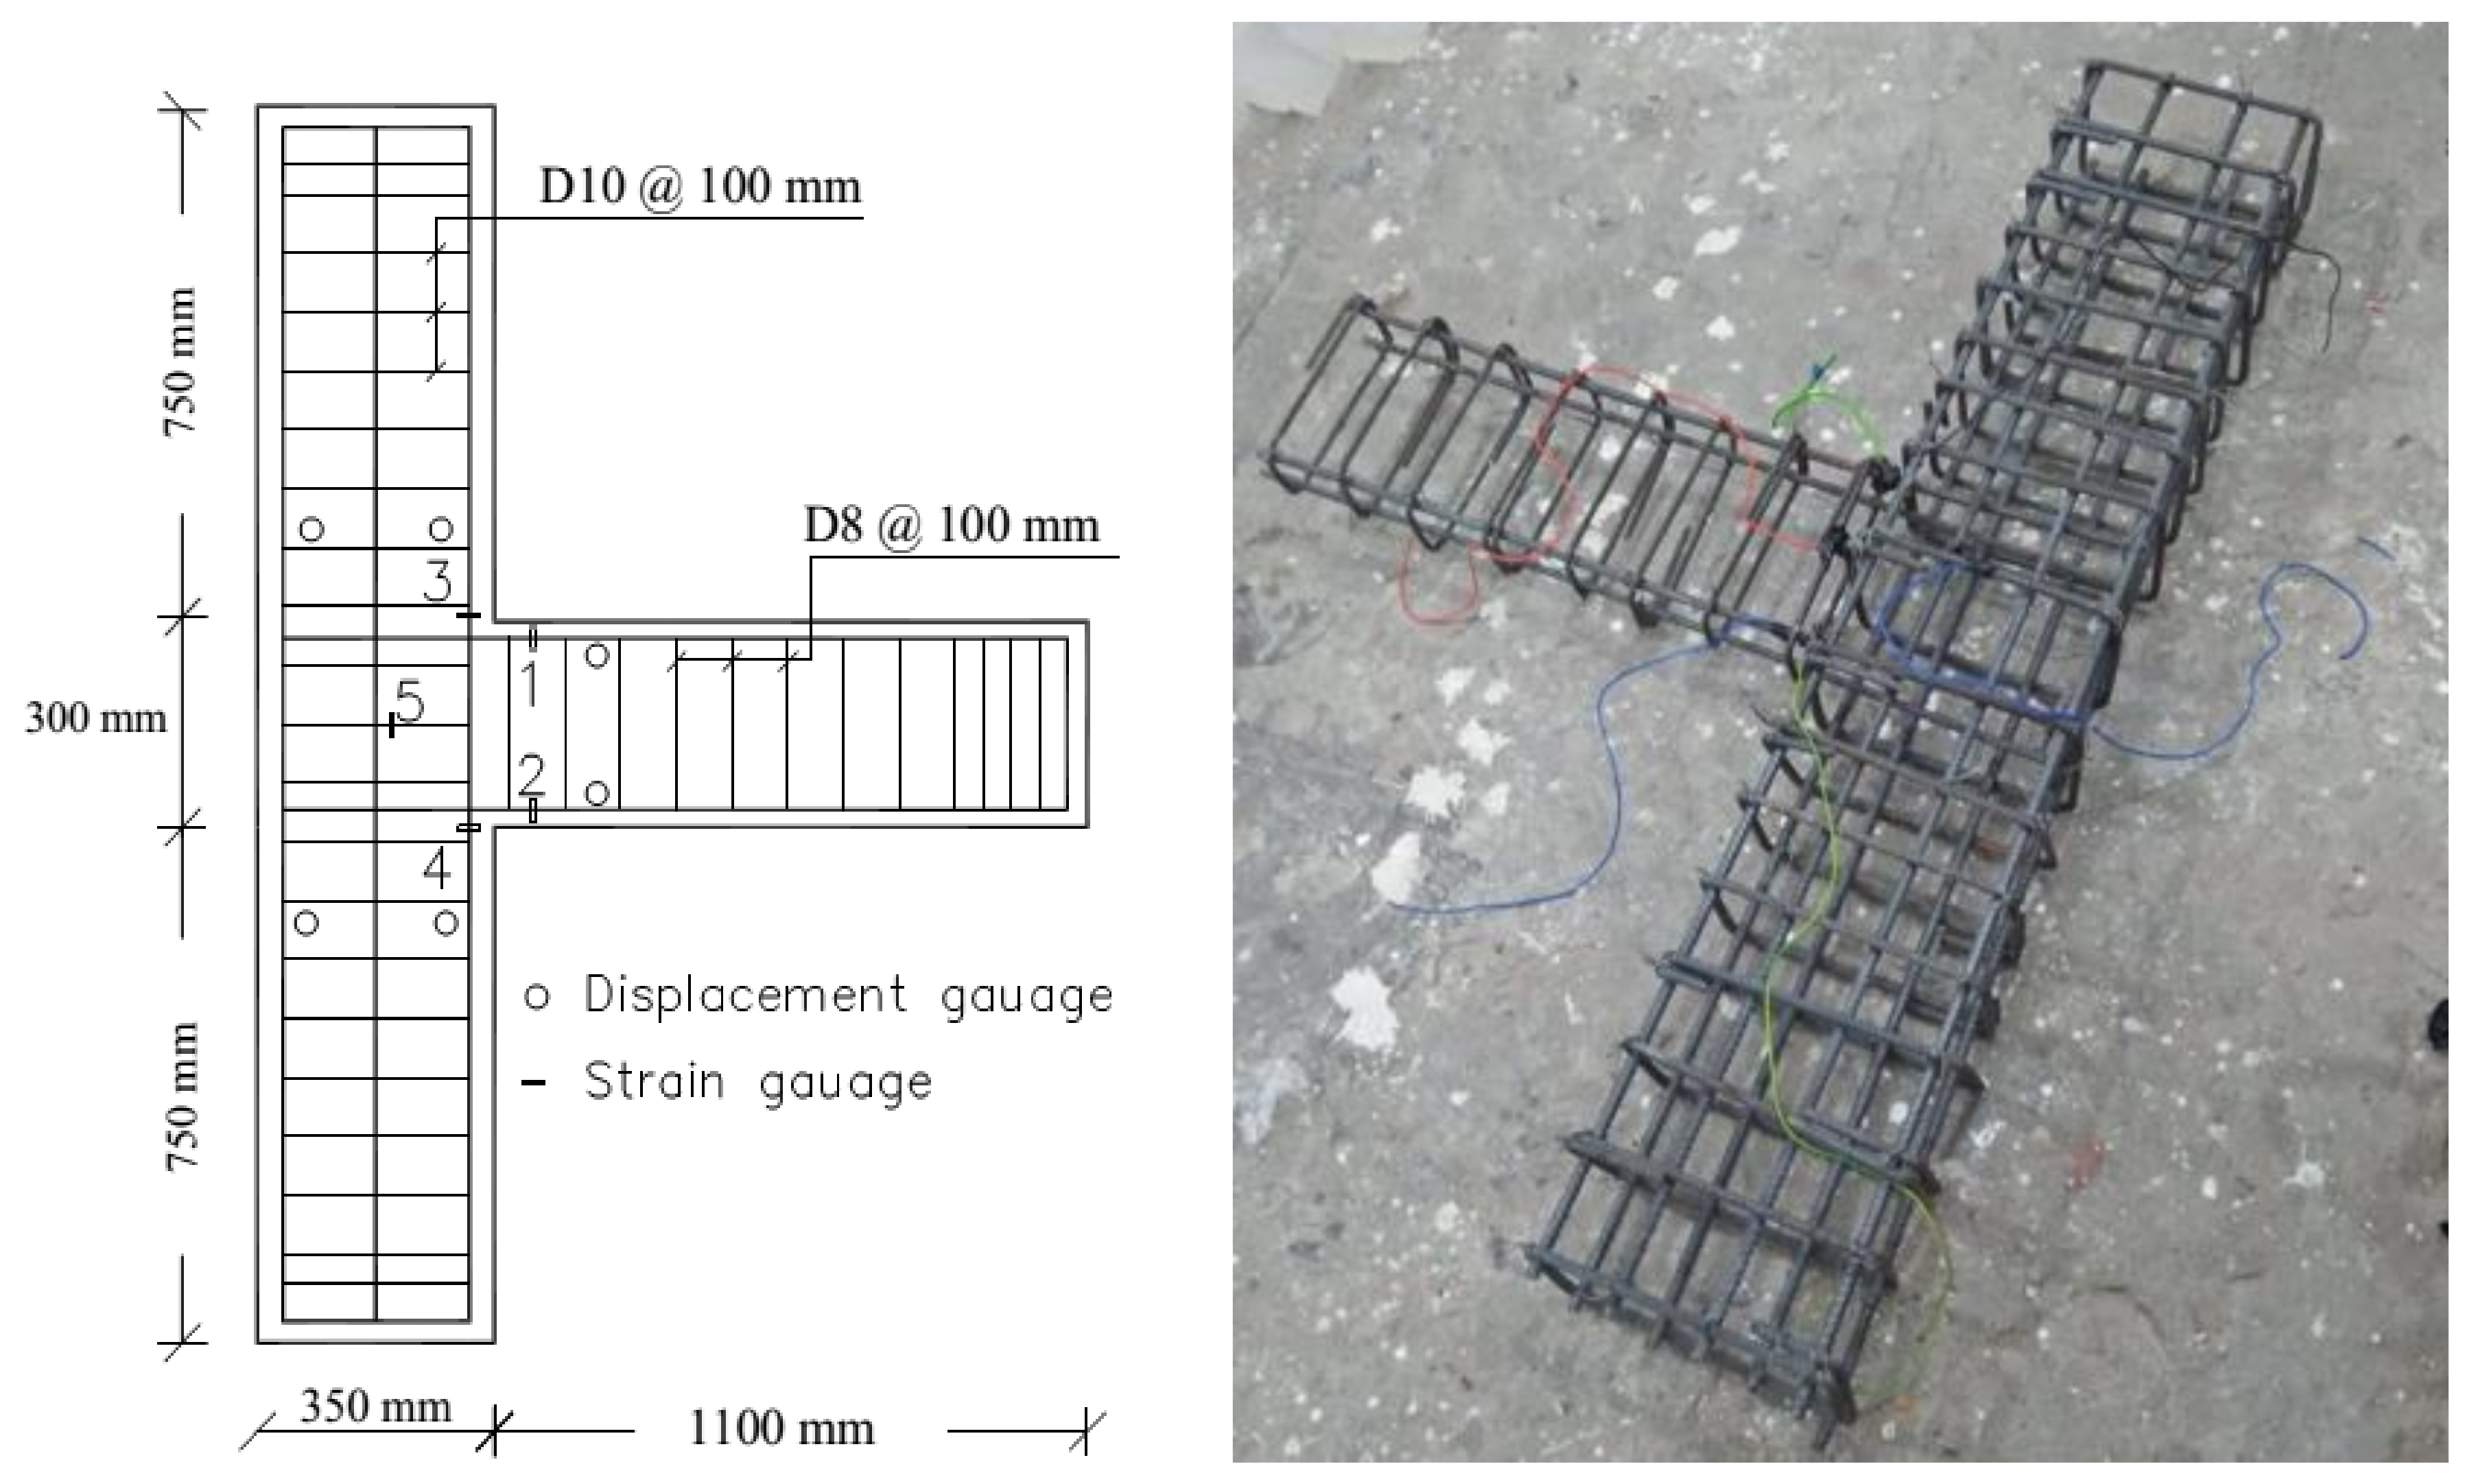
2.1. Reinforcement
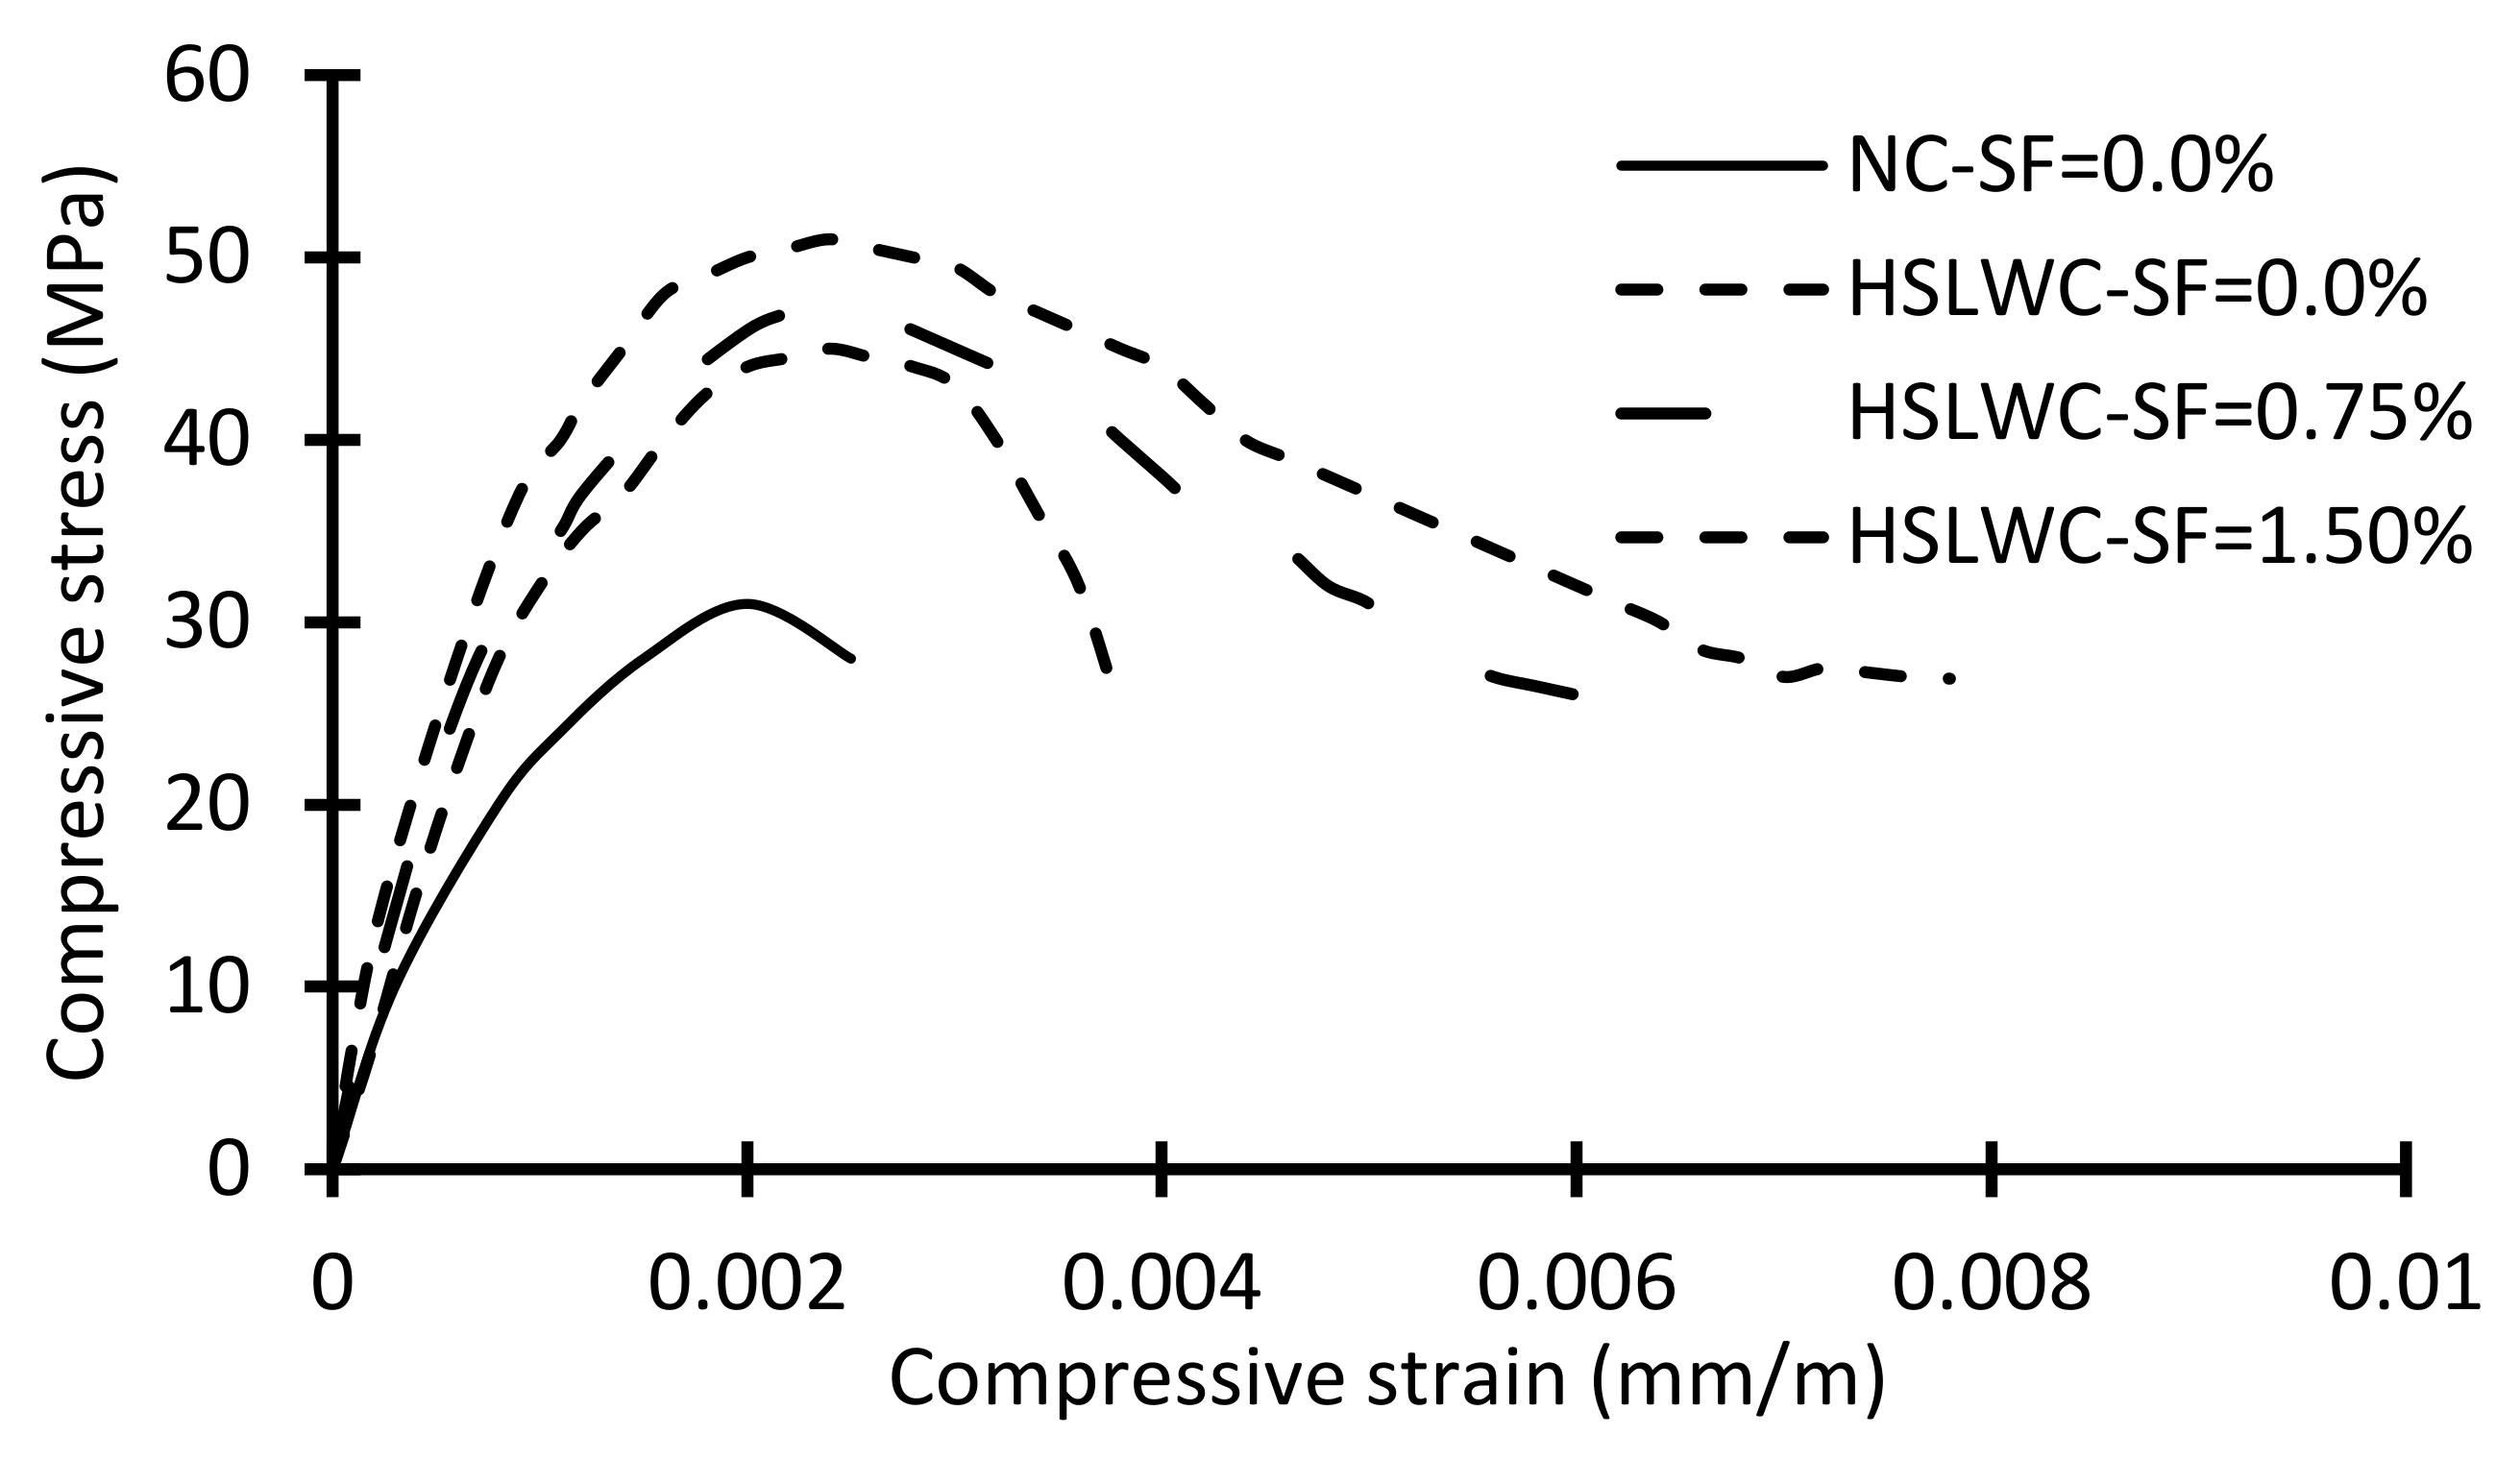
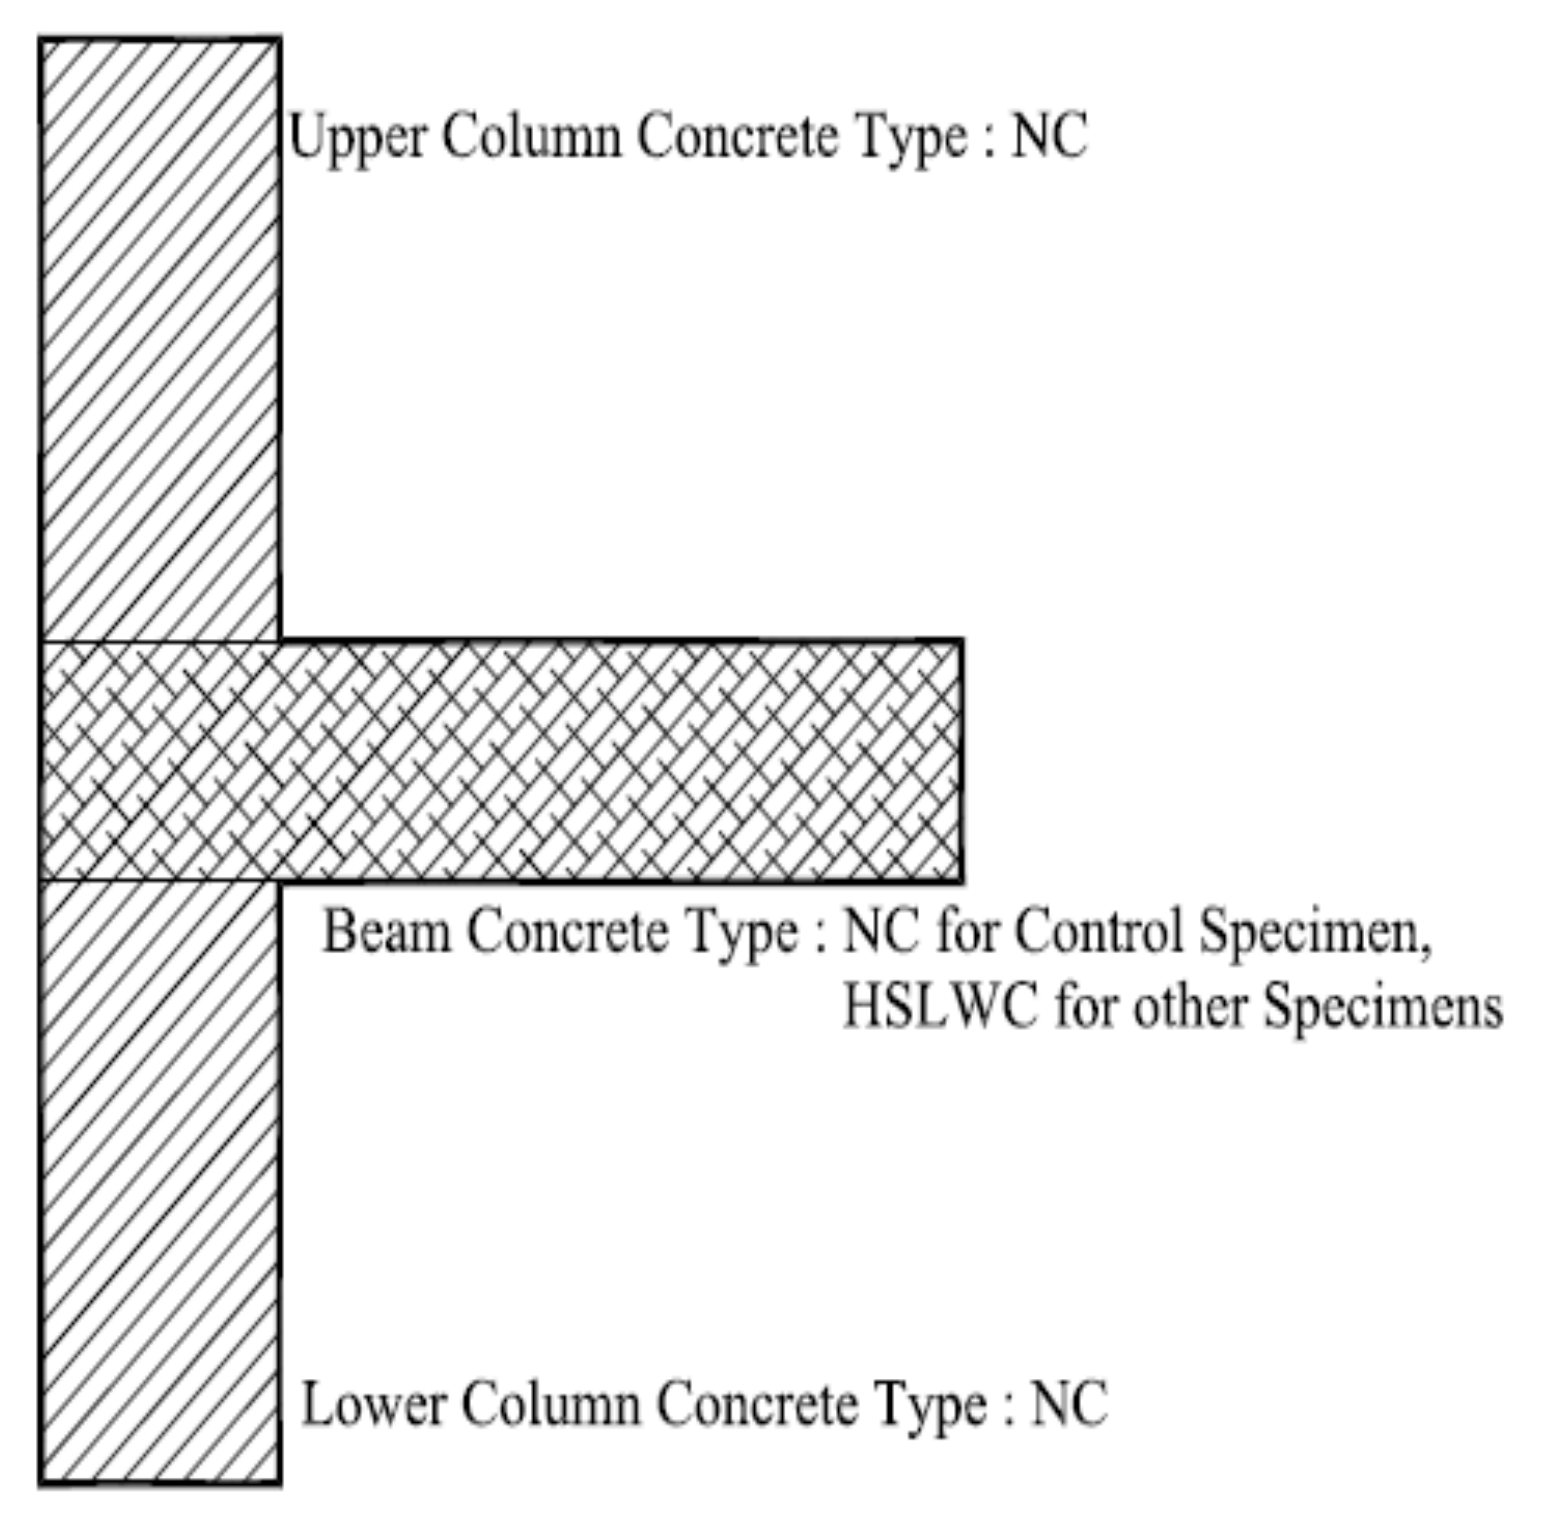
2.2. Concrete Properties
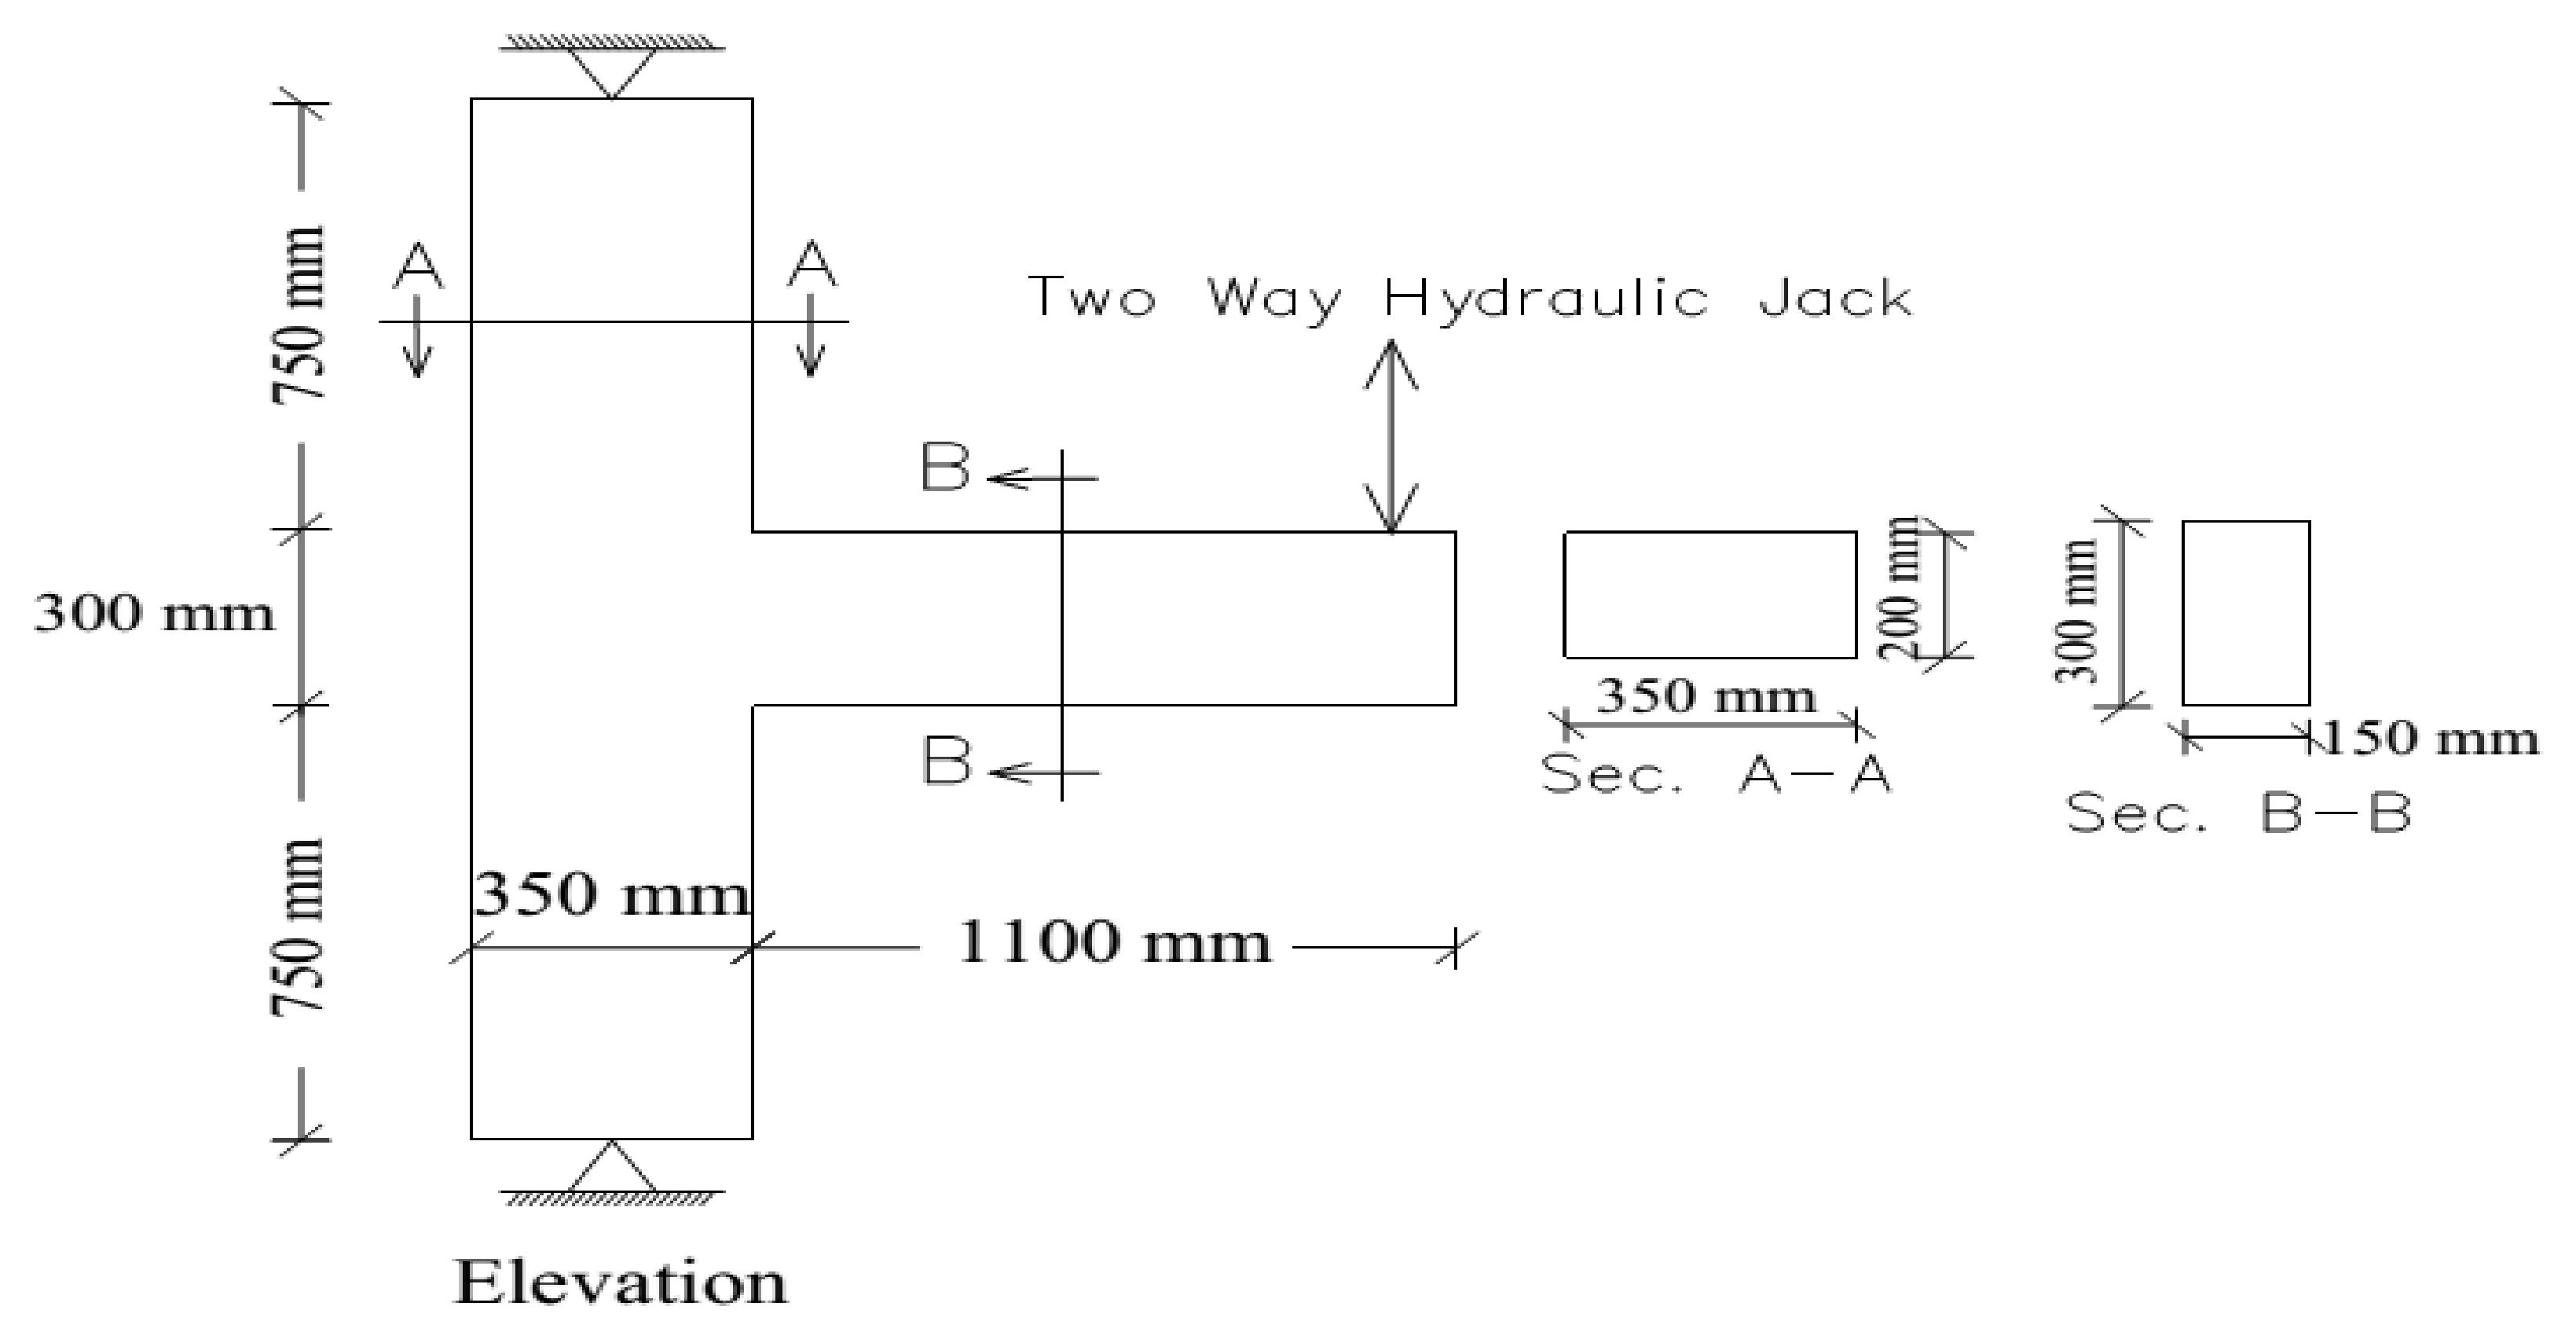
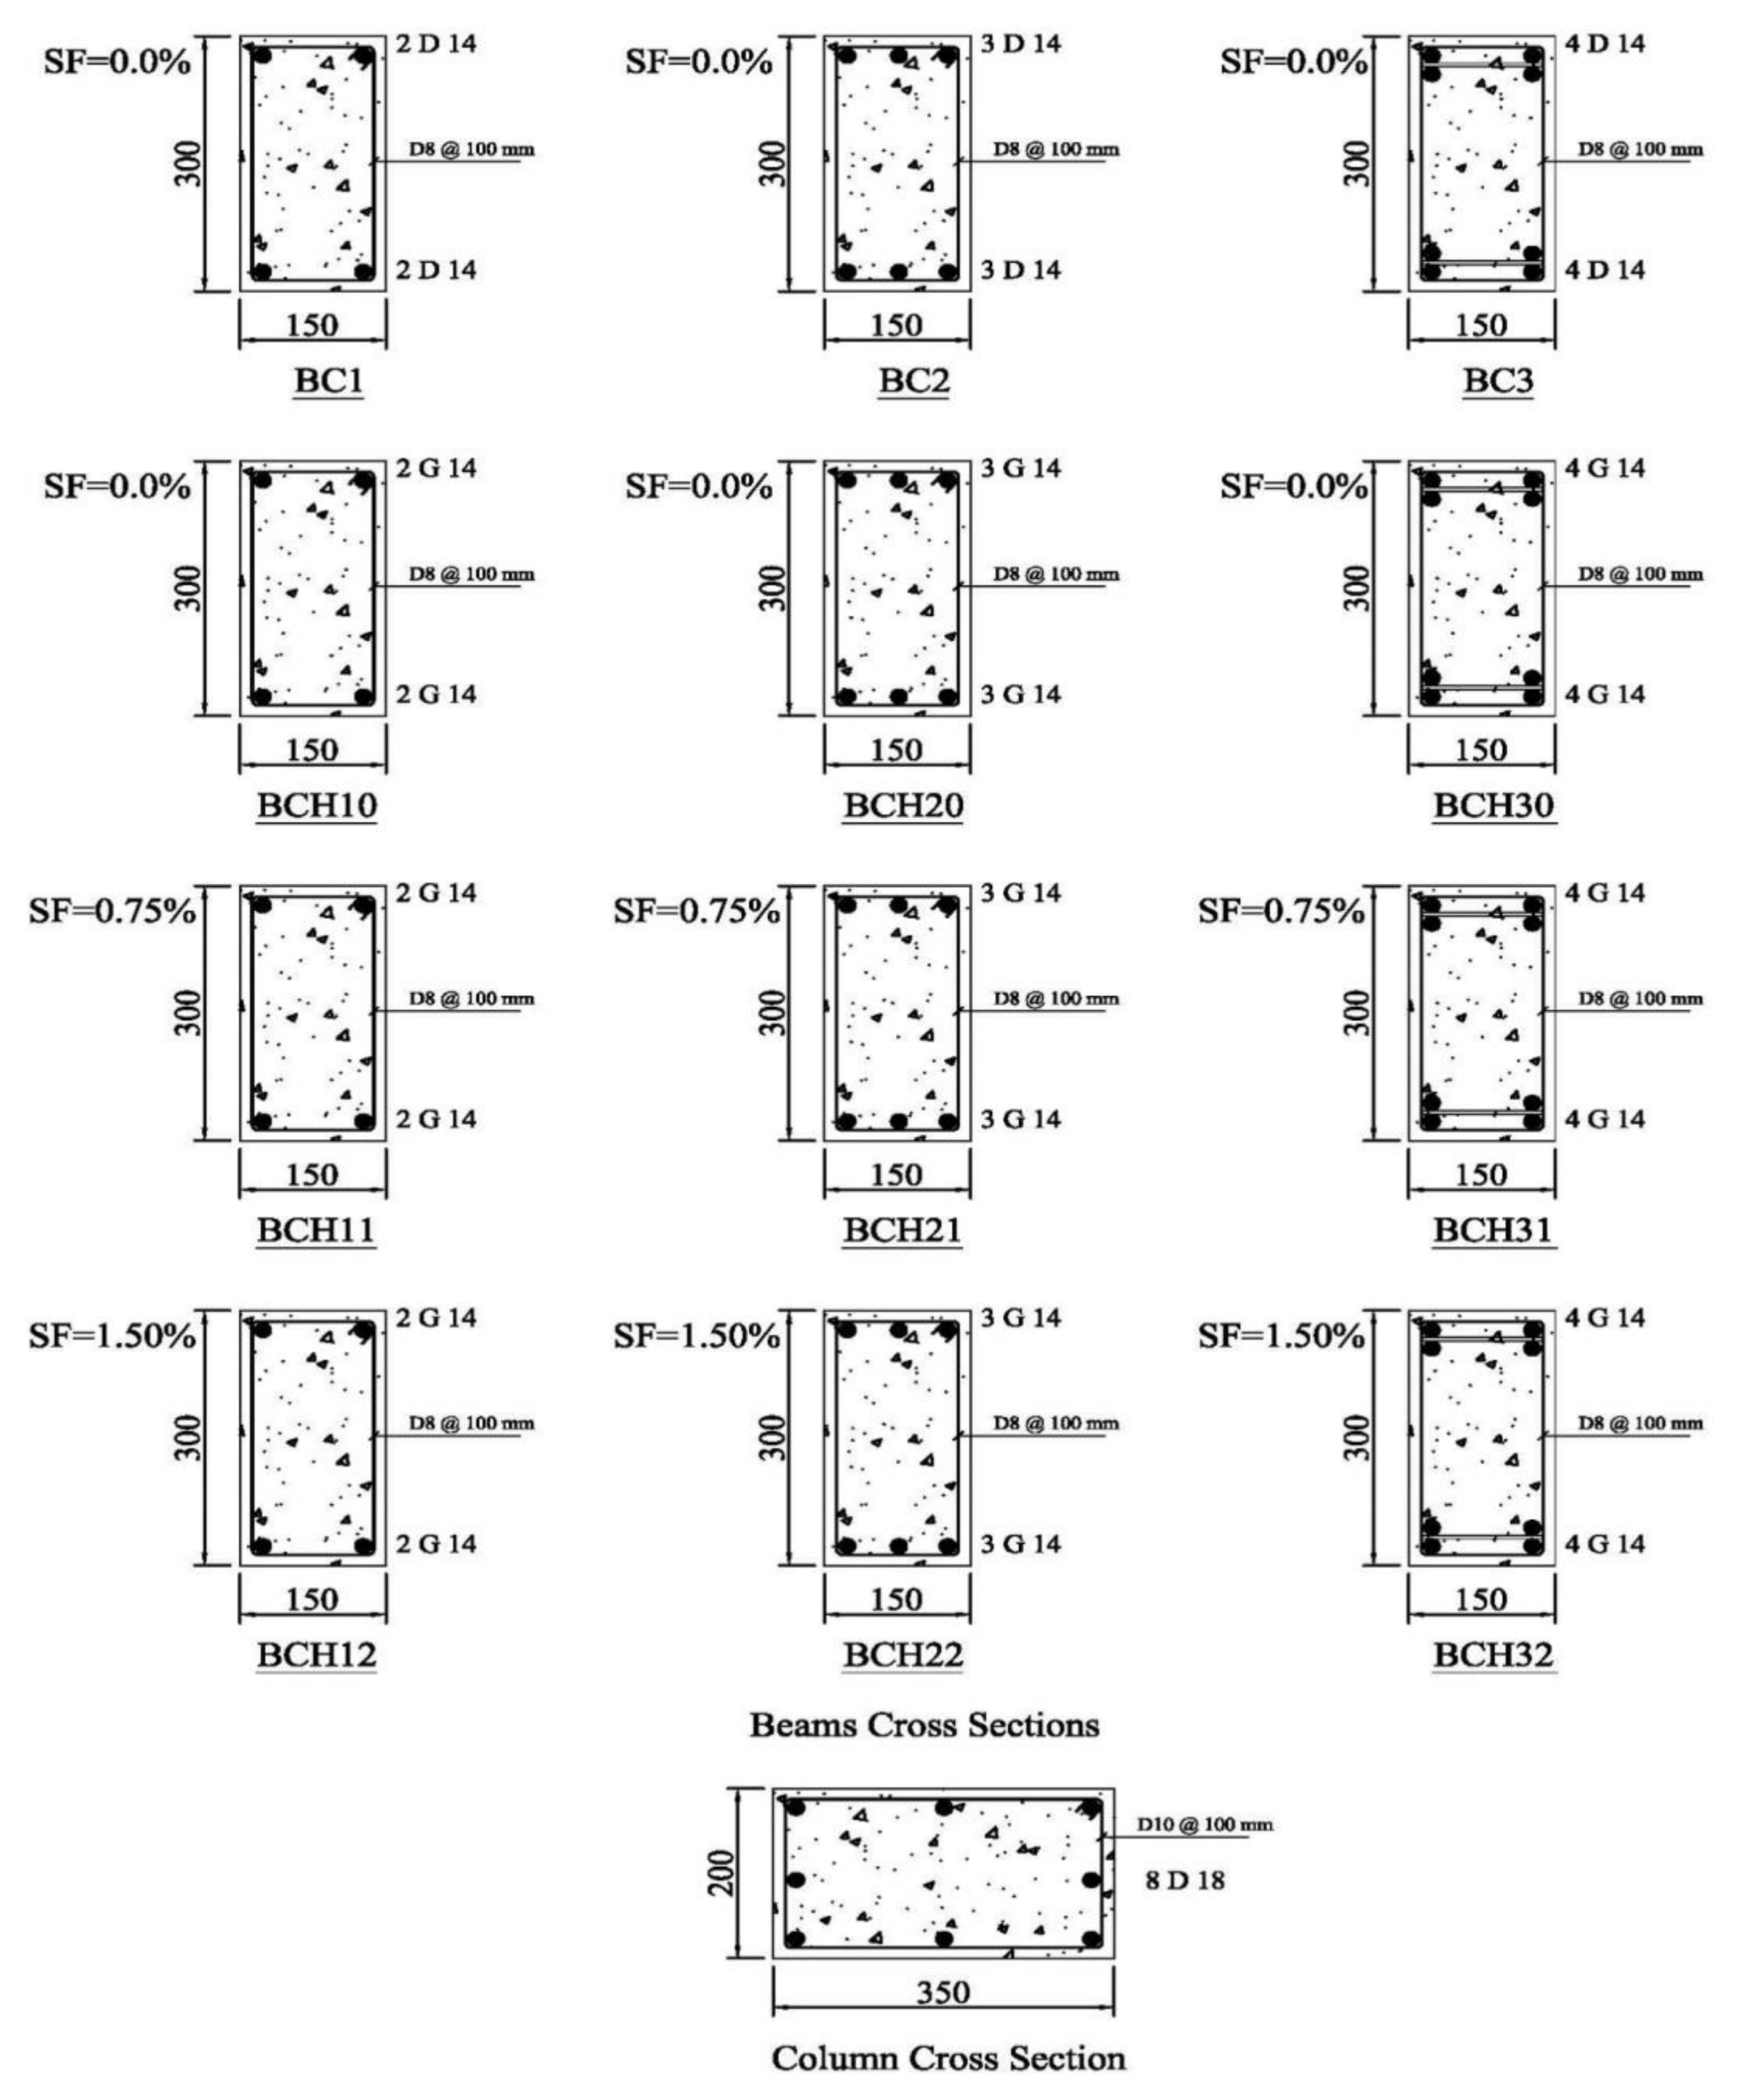
2.3. Test Specimens
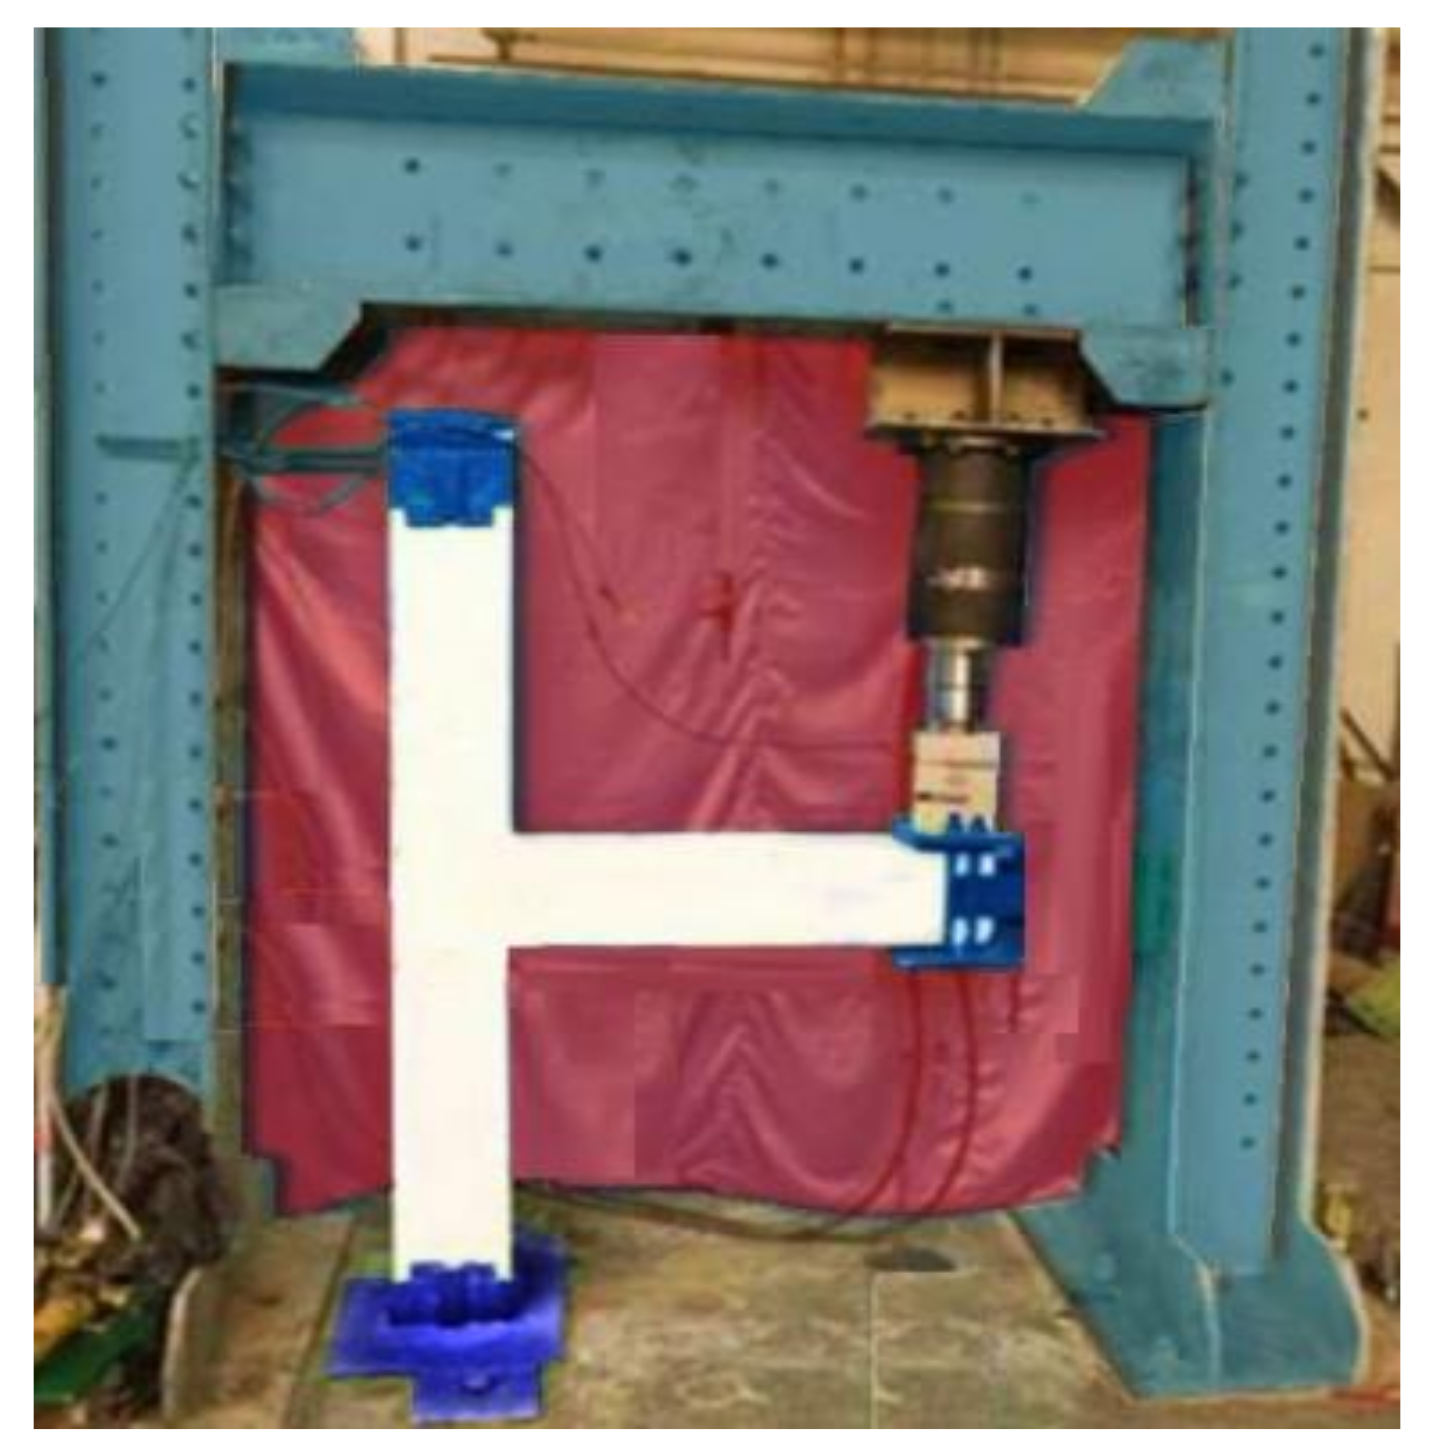
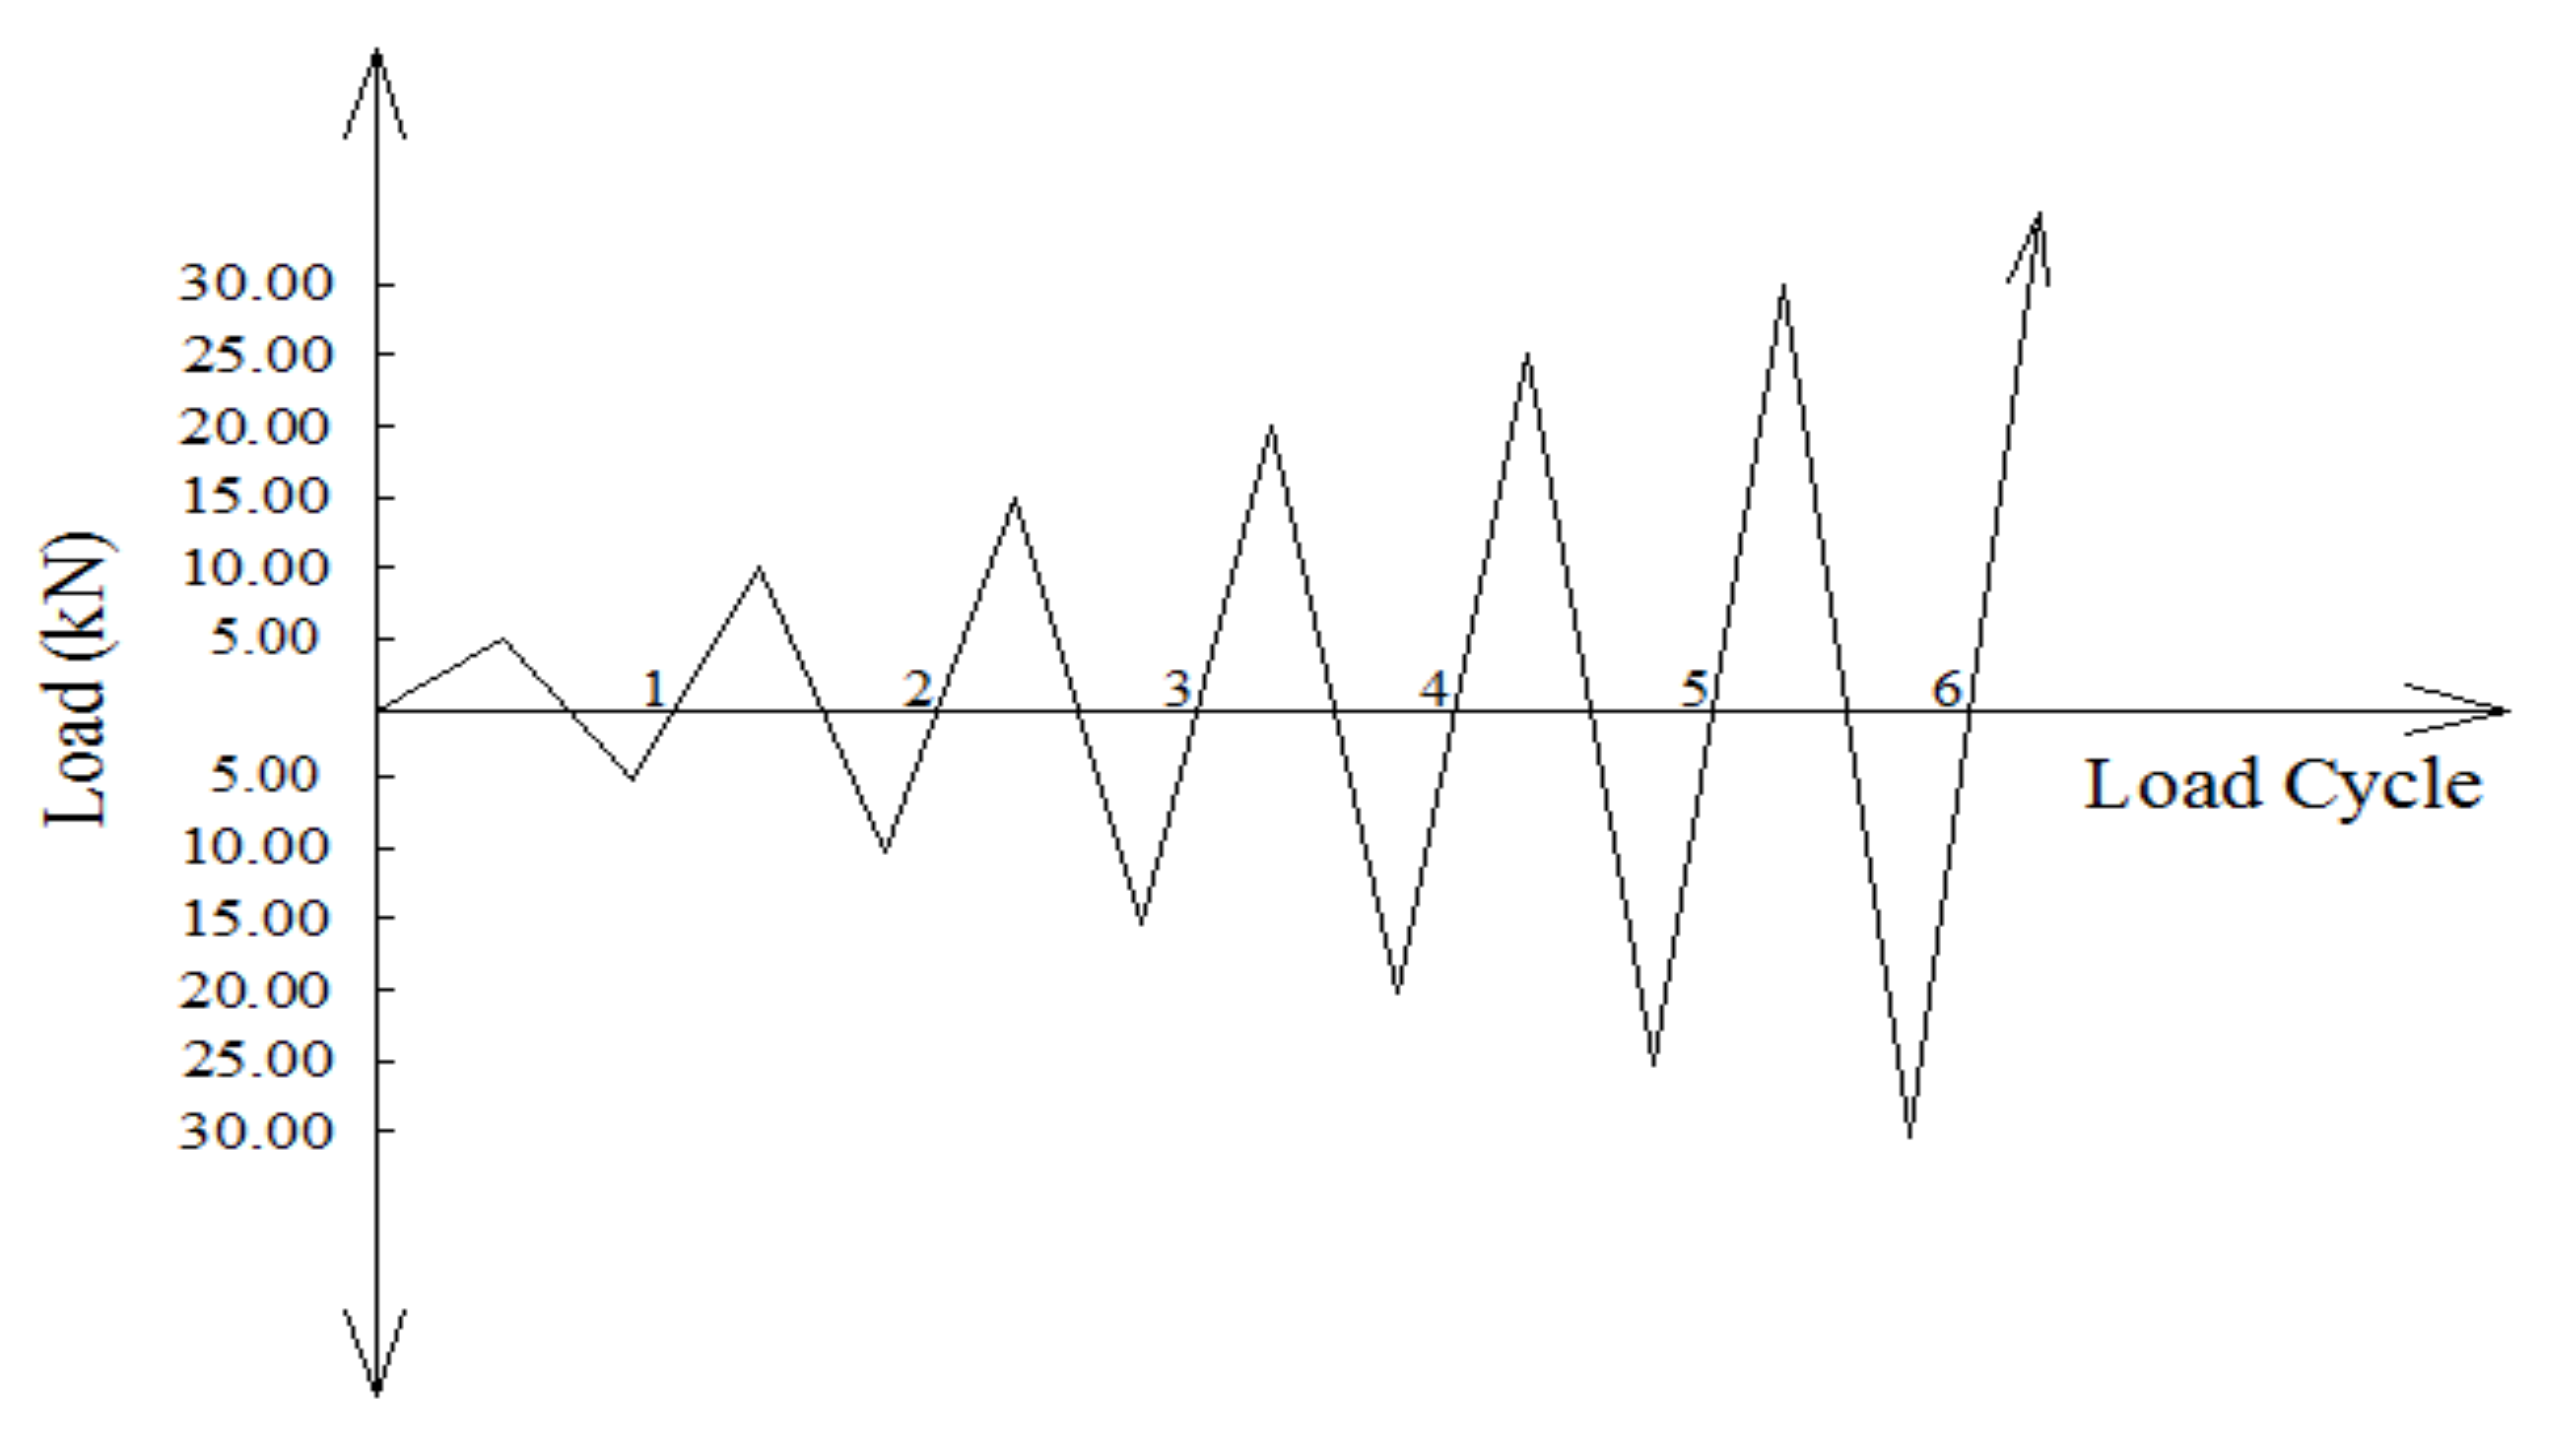
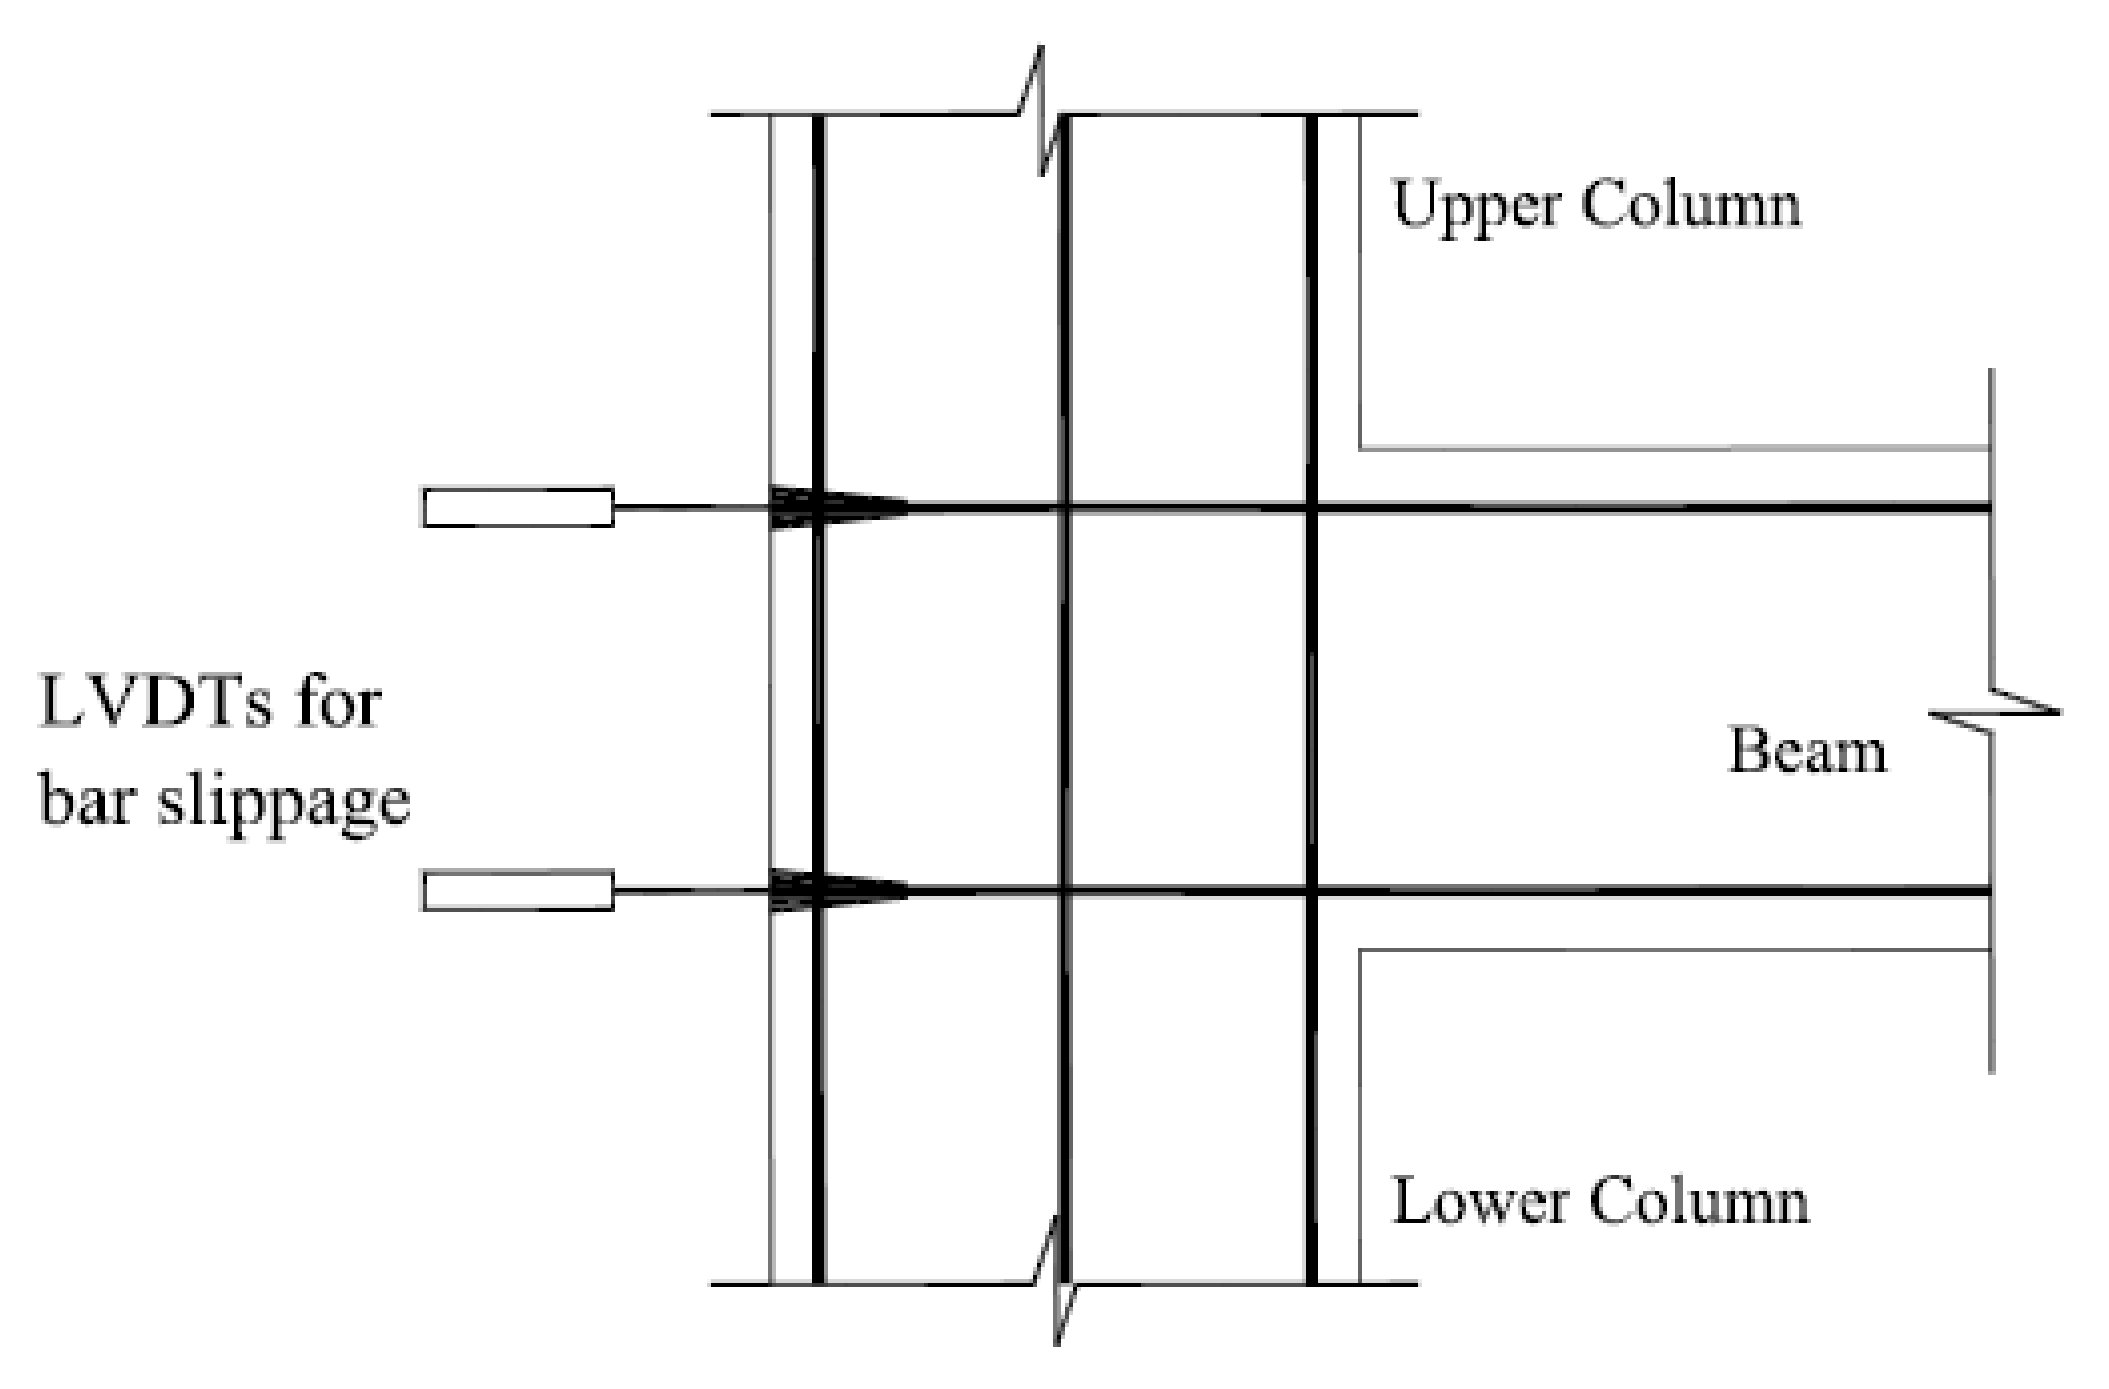
2.4. Test Setup, Load History, and Instrumentation
3. Experimental results and discussion
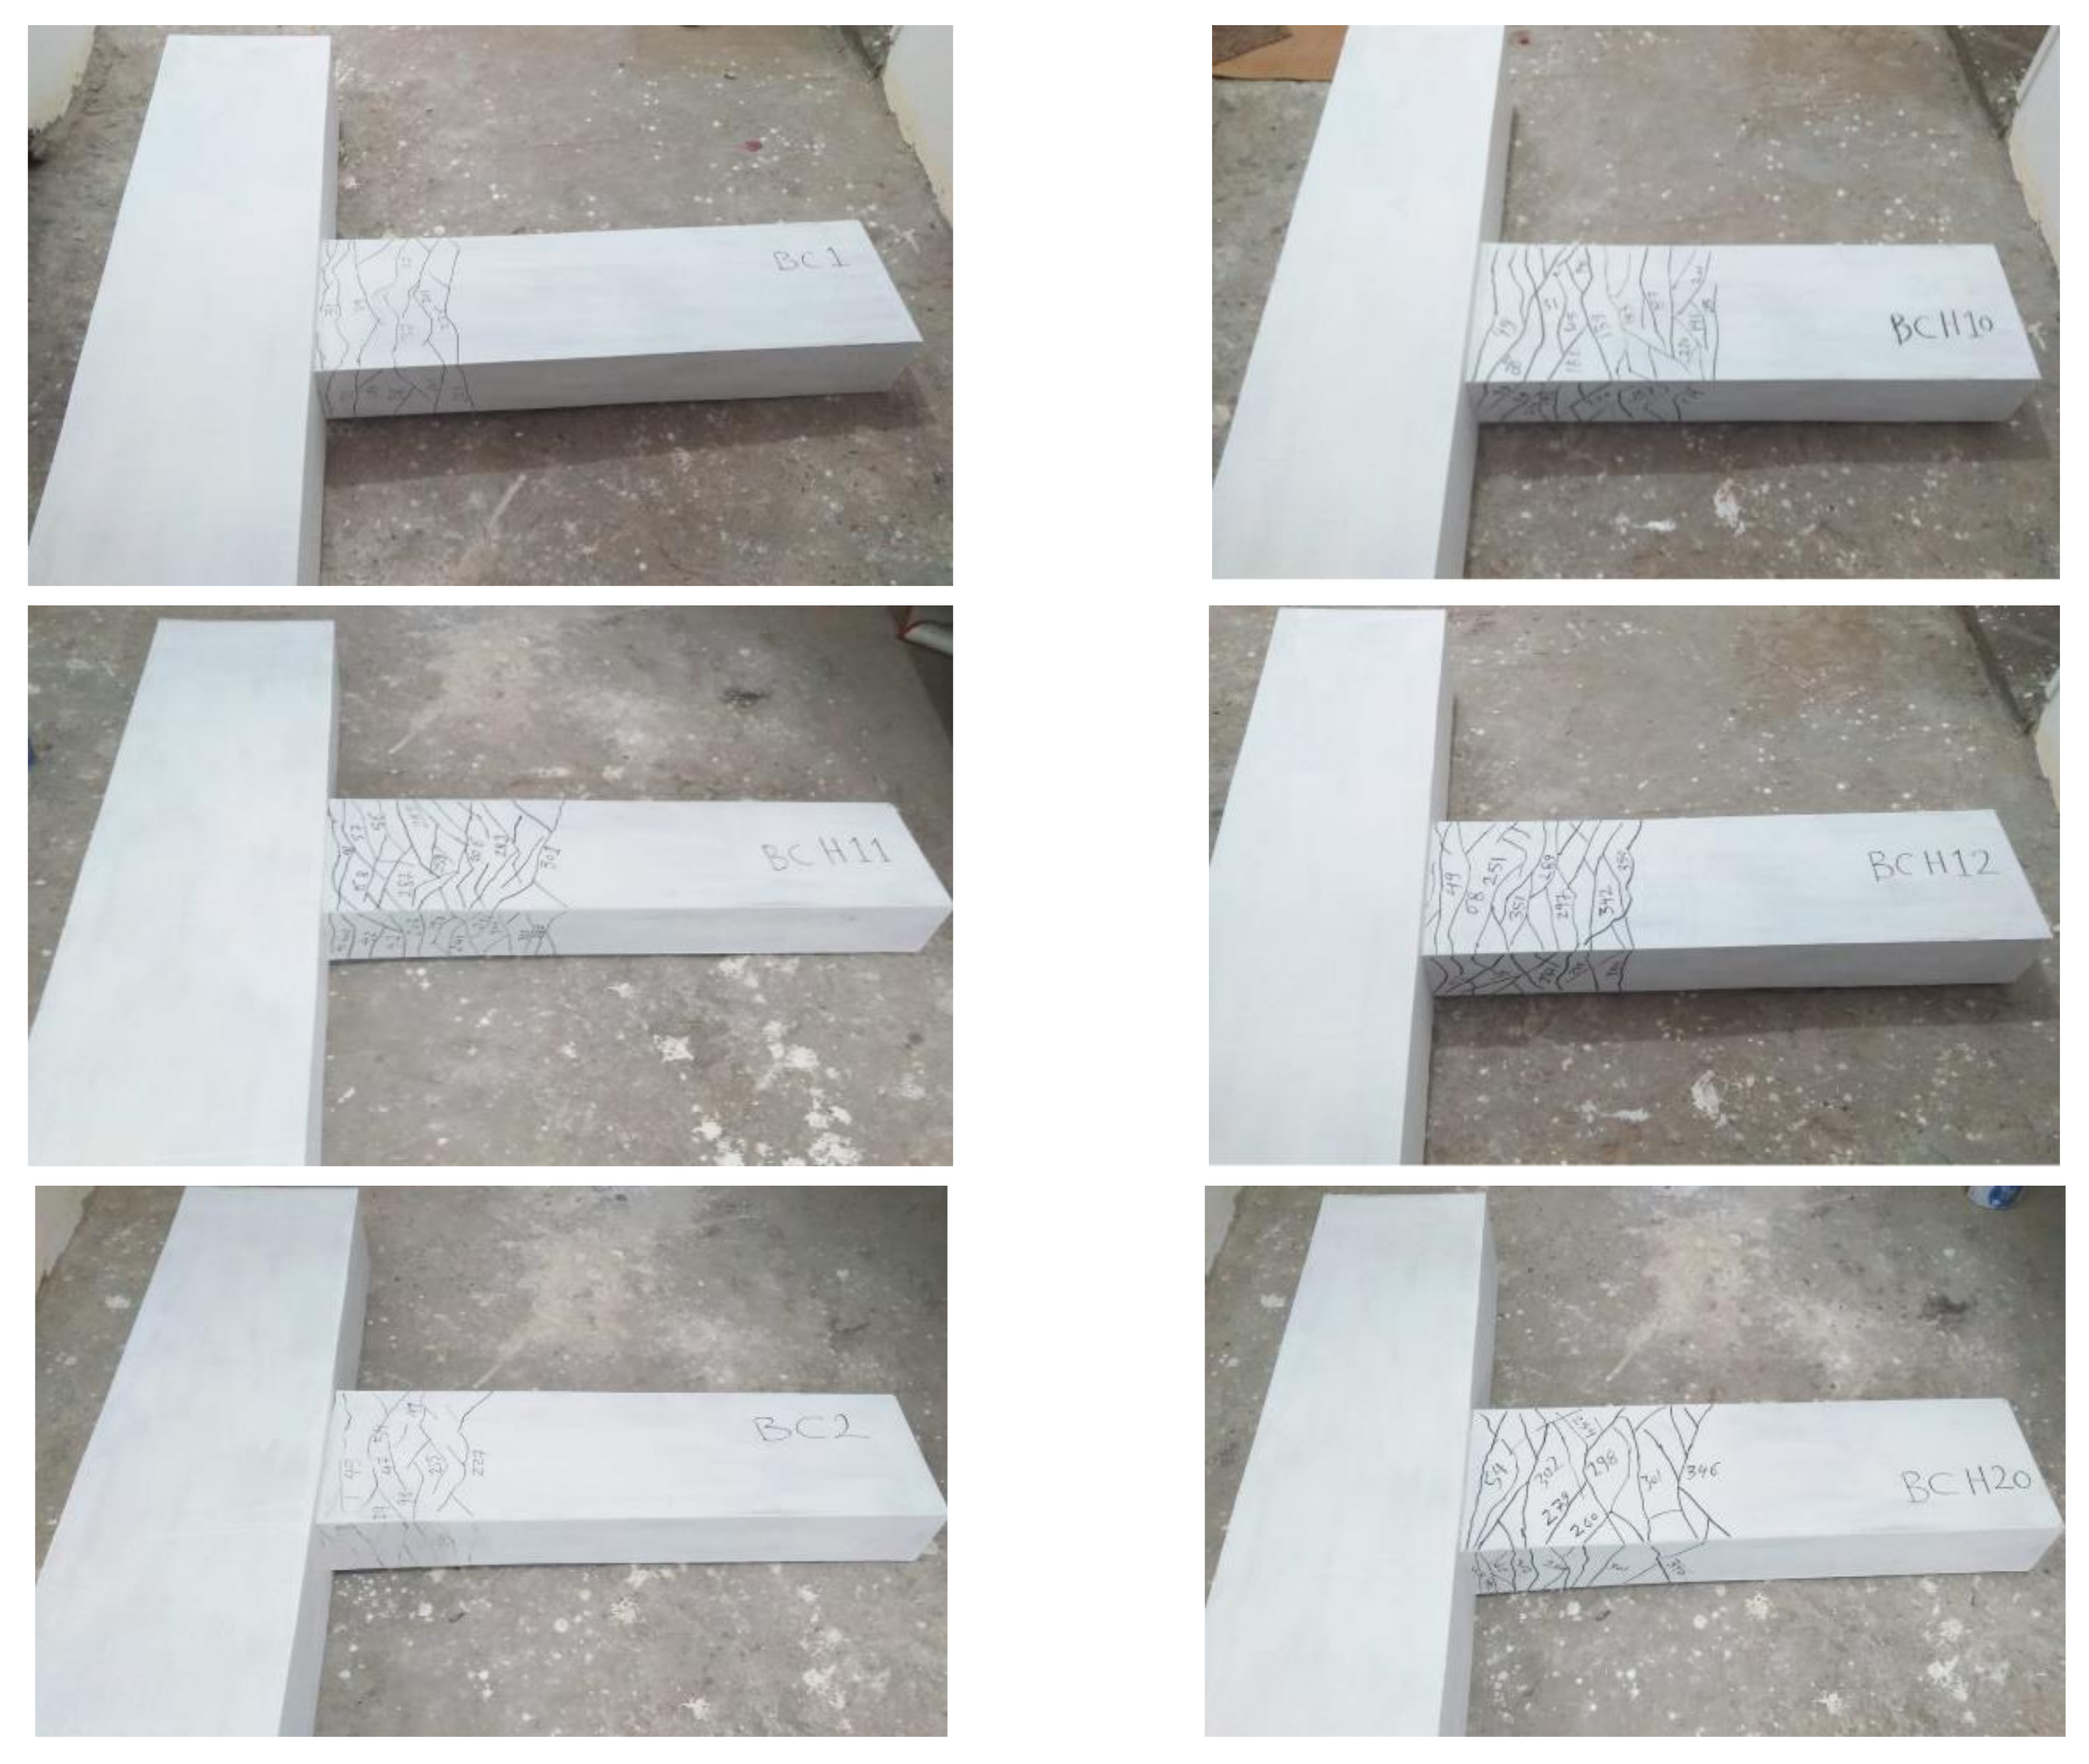
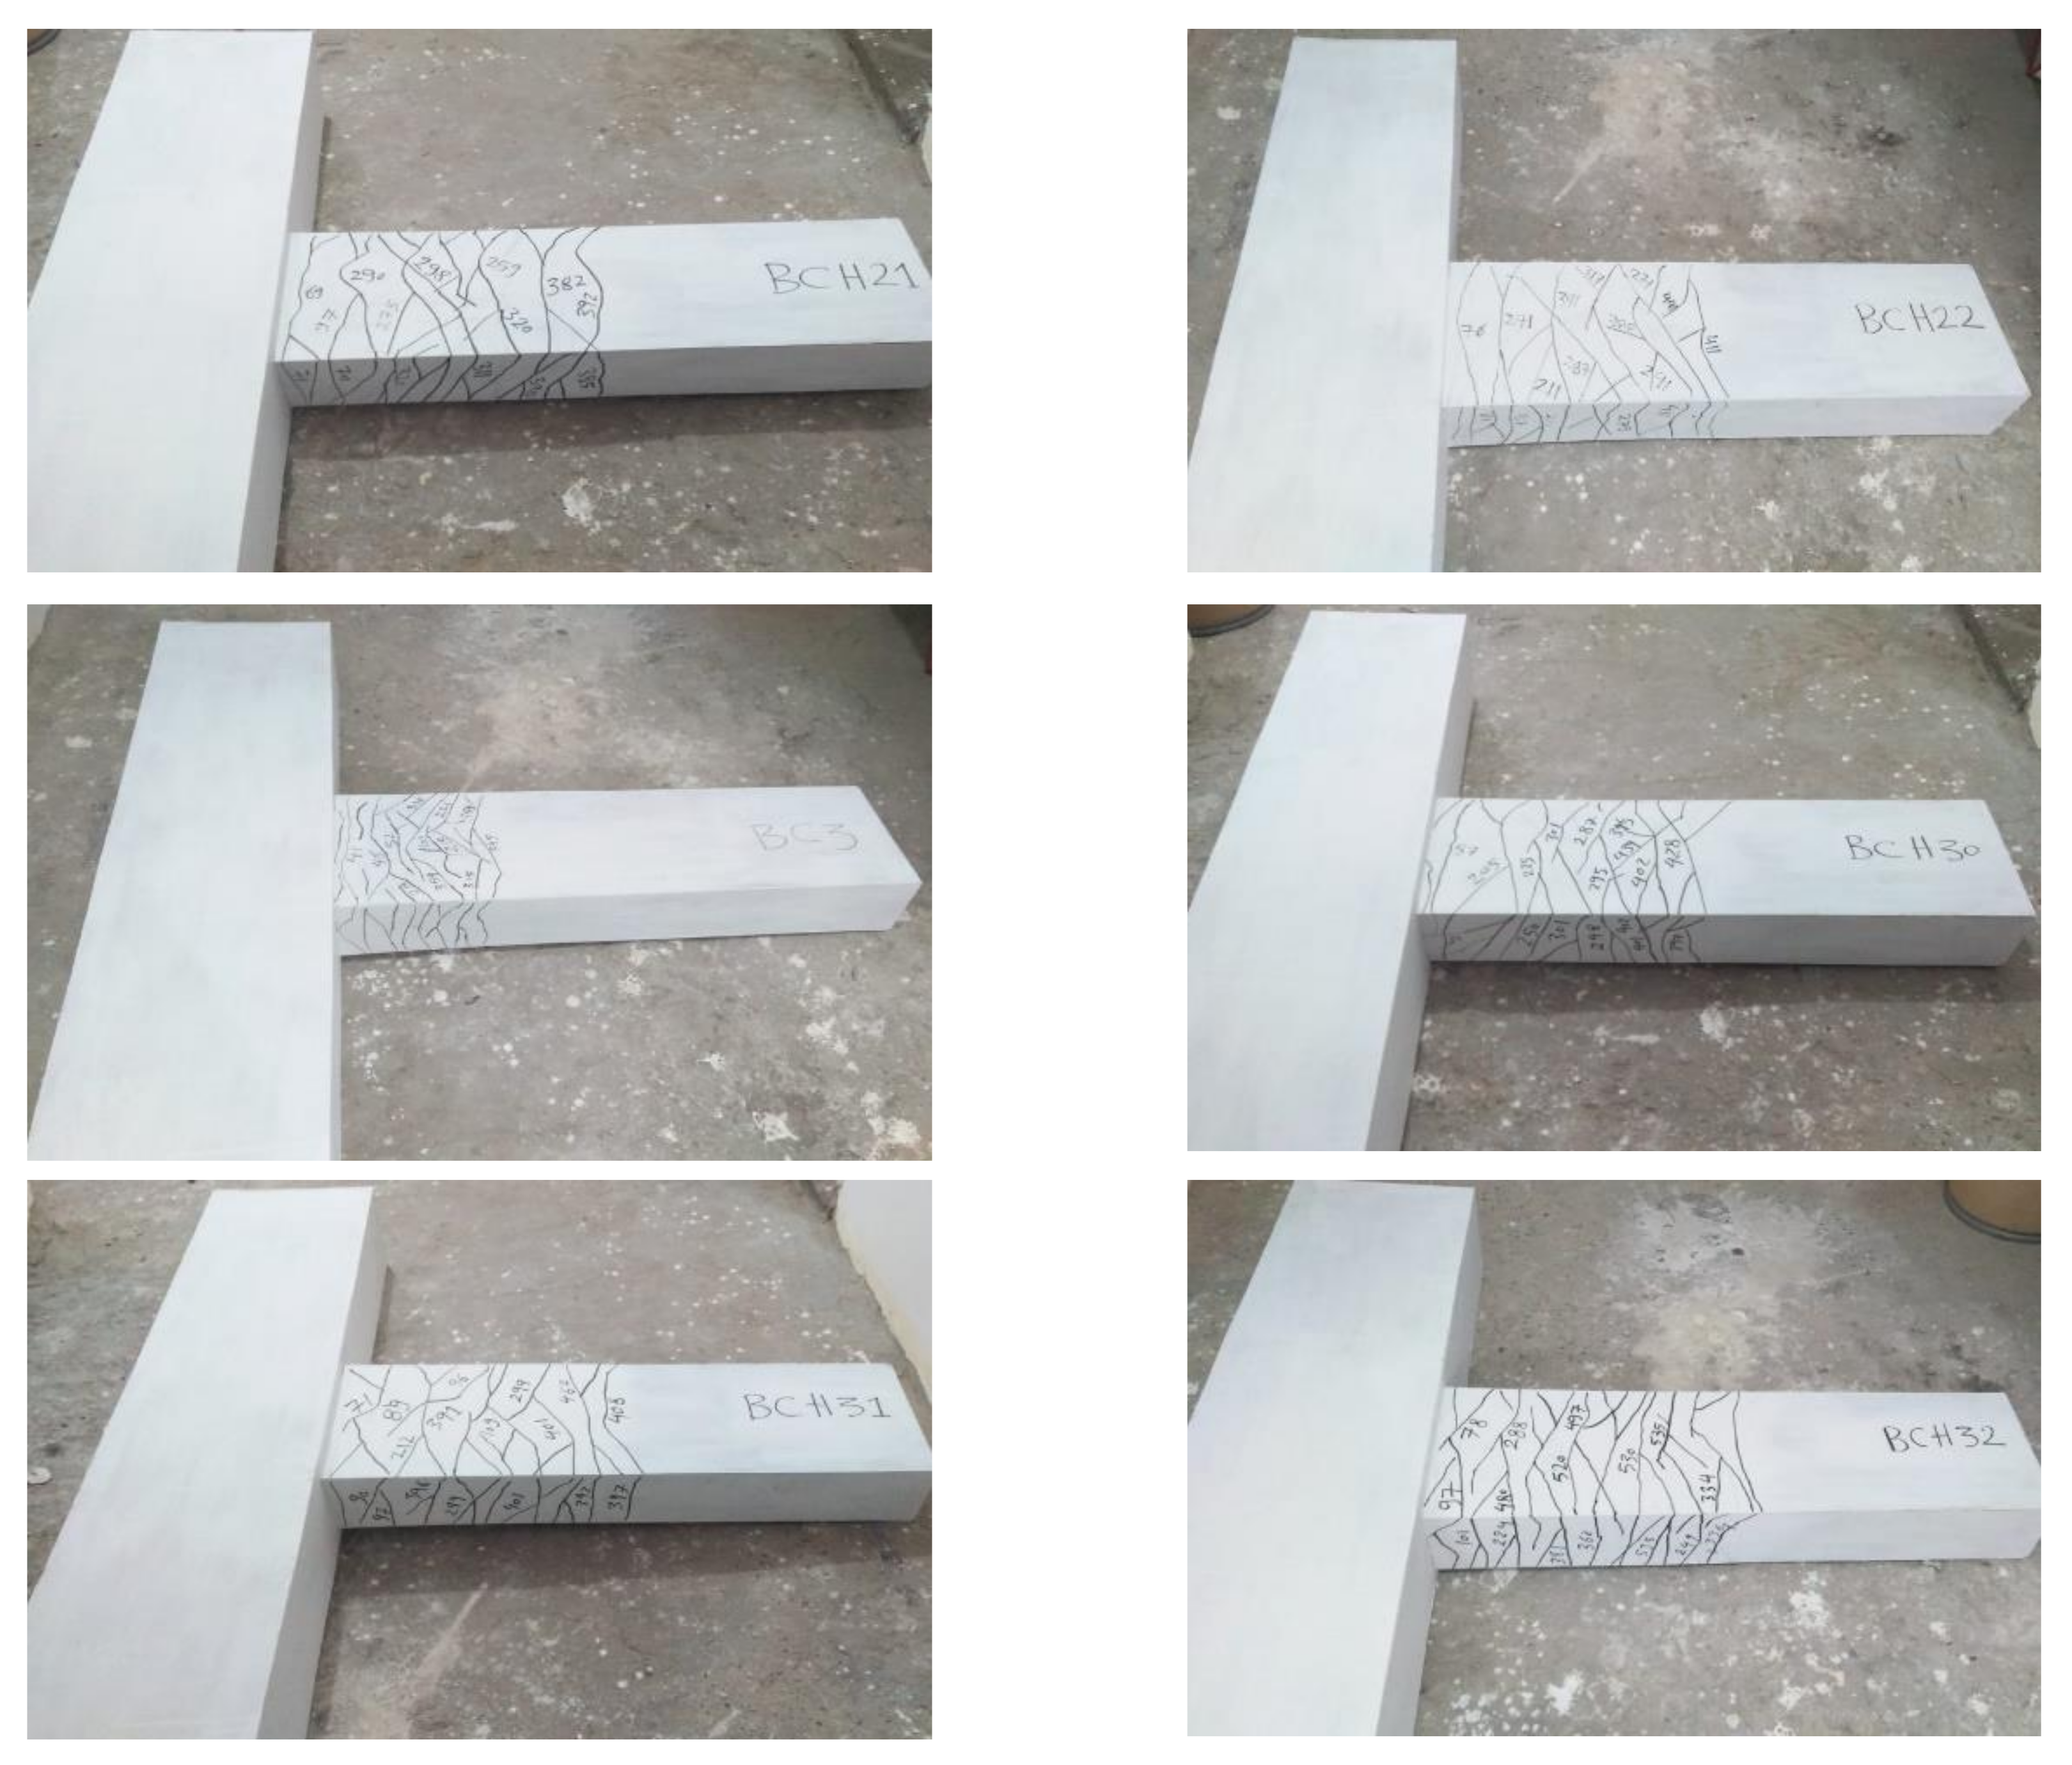
3.1. Cracking Behavior and Ultimate Strength
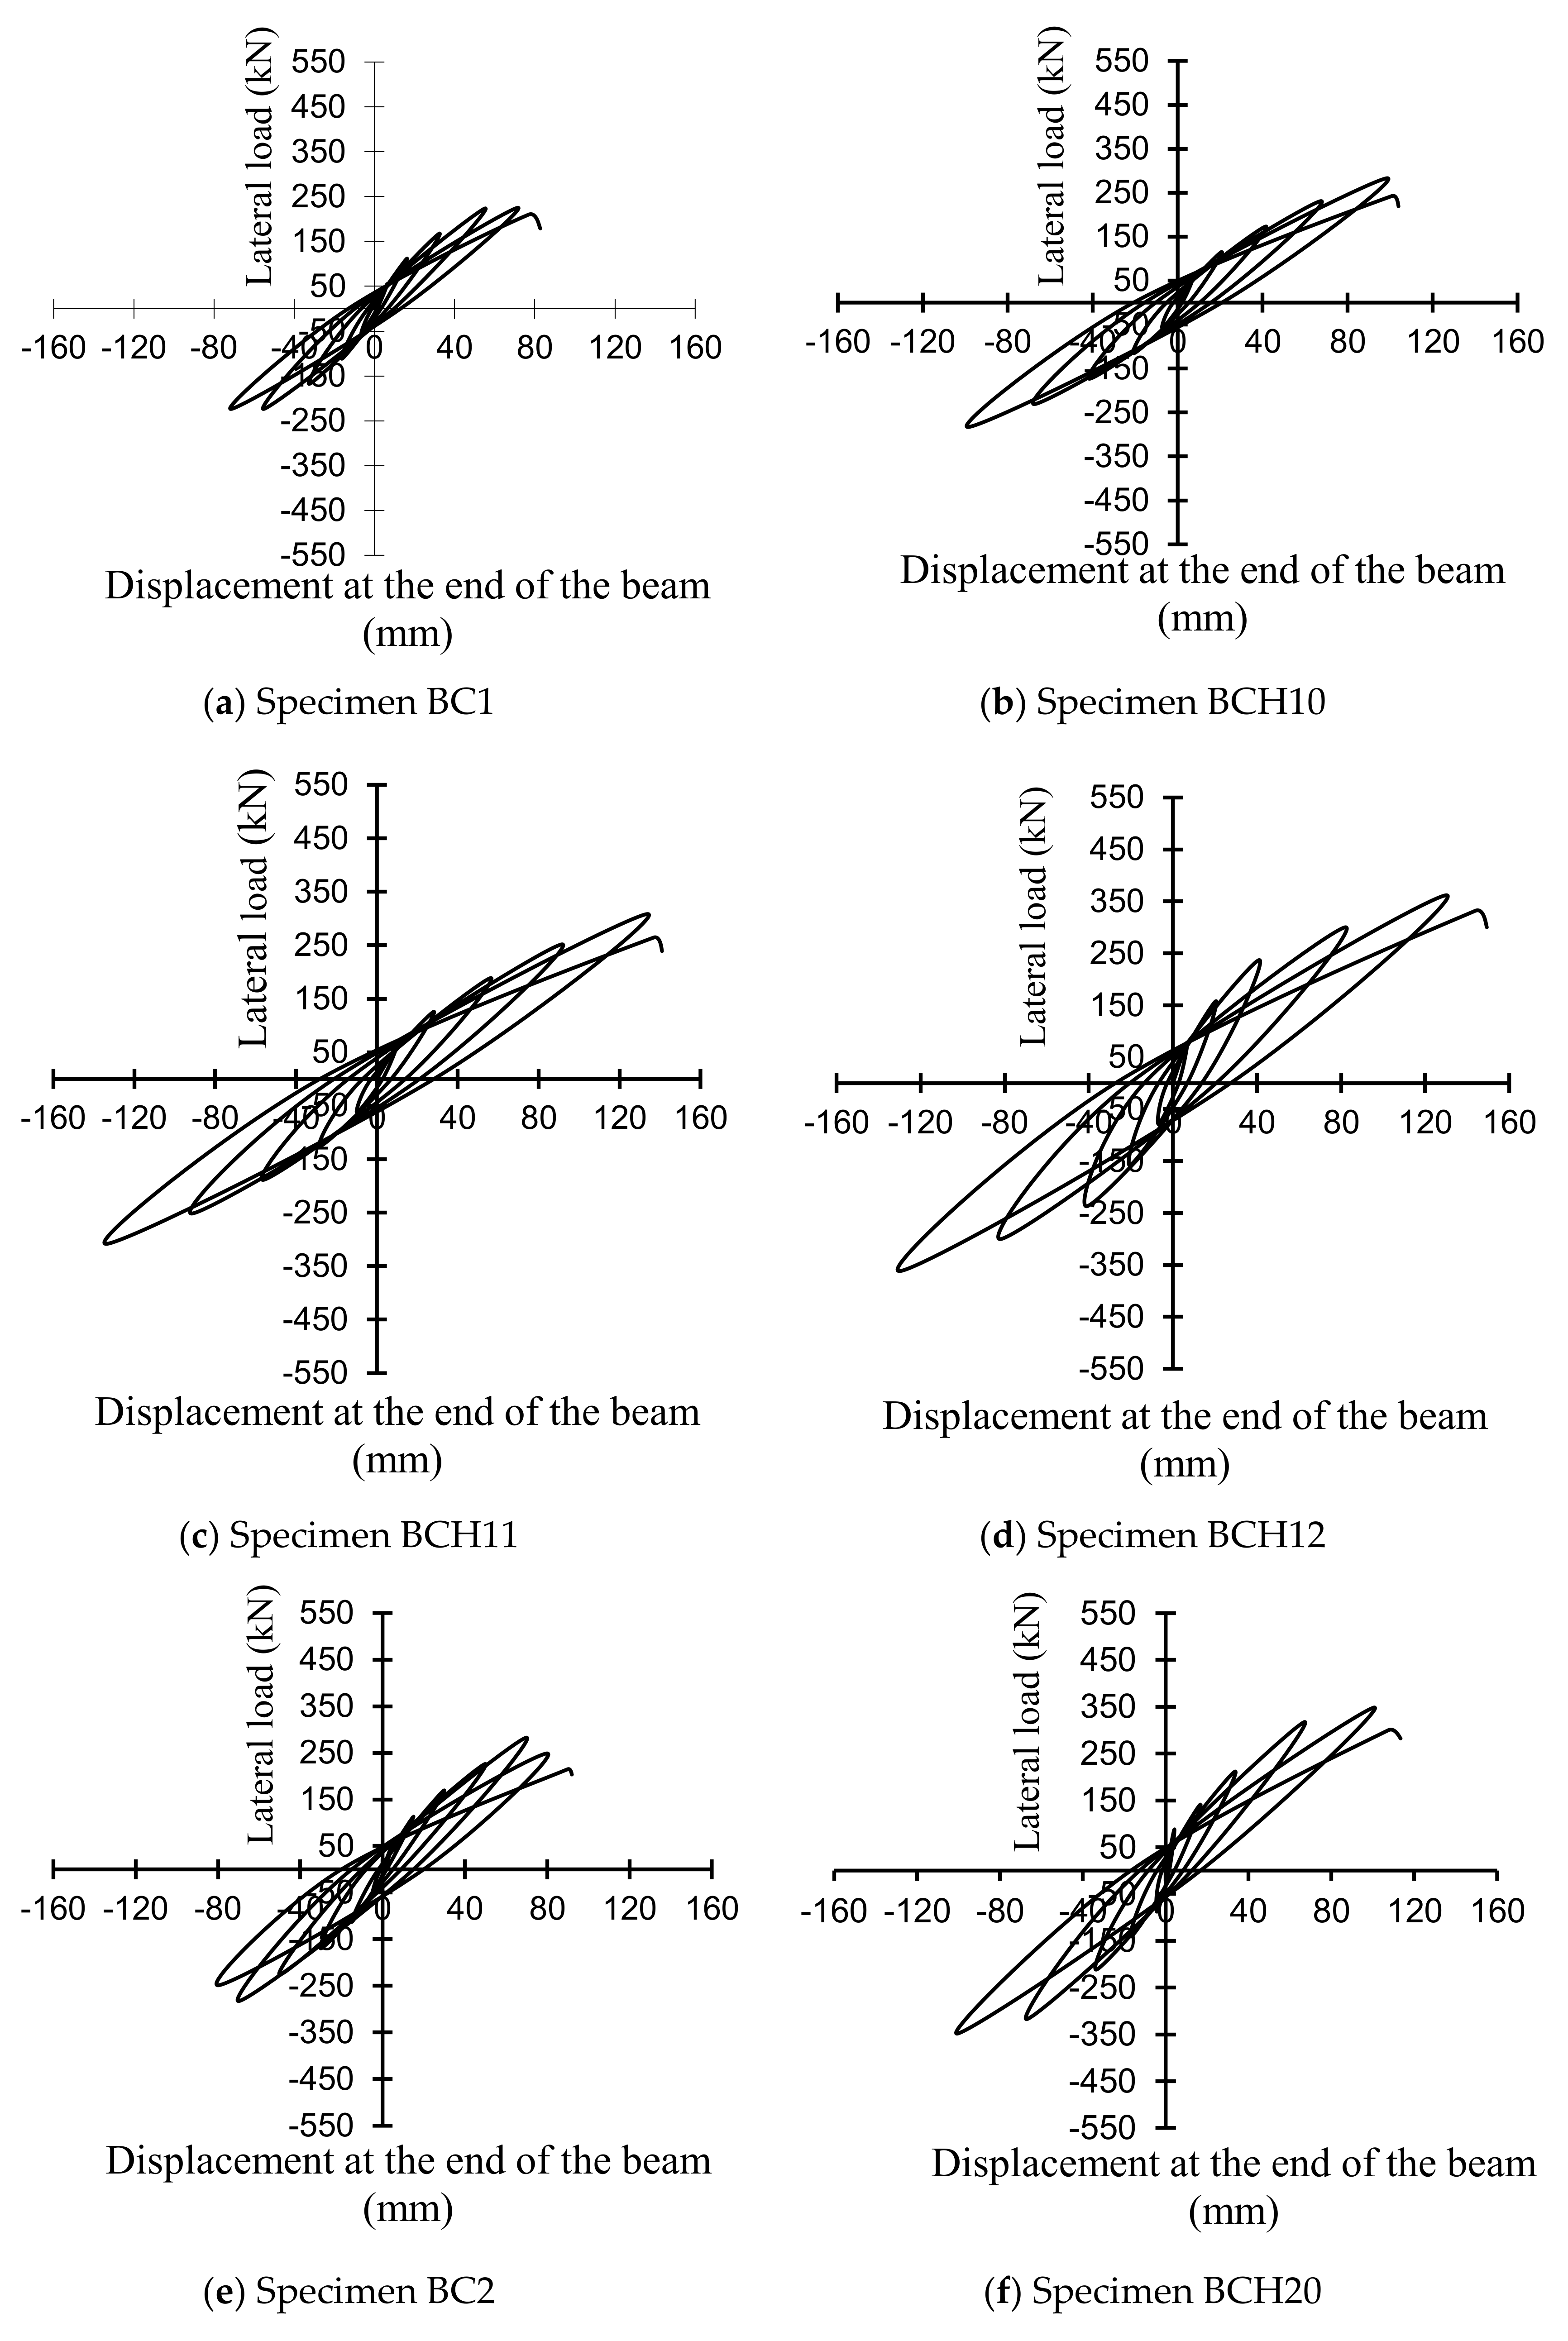
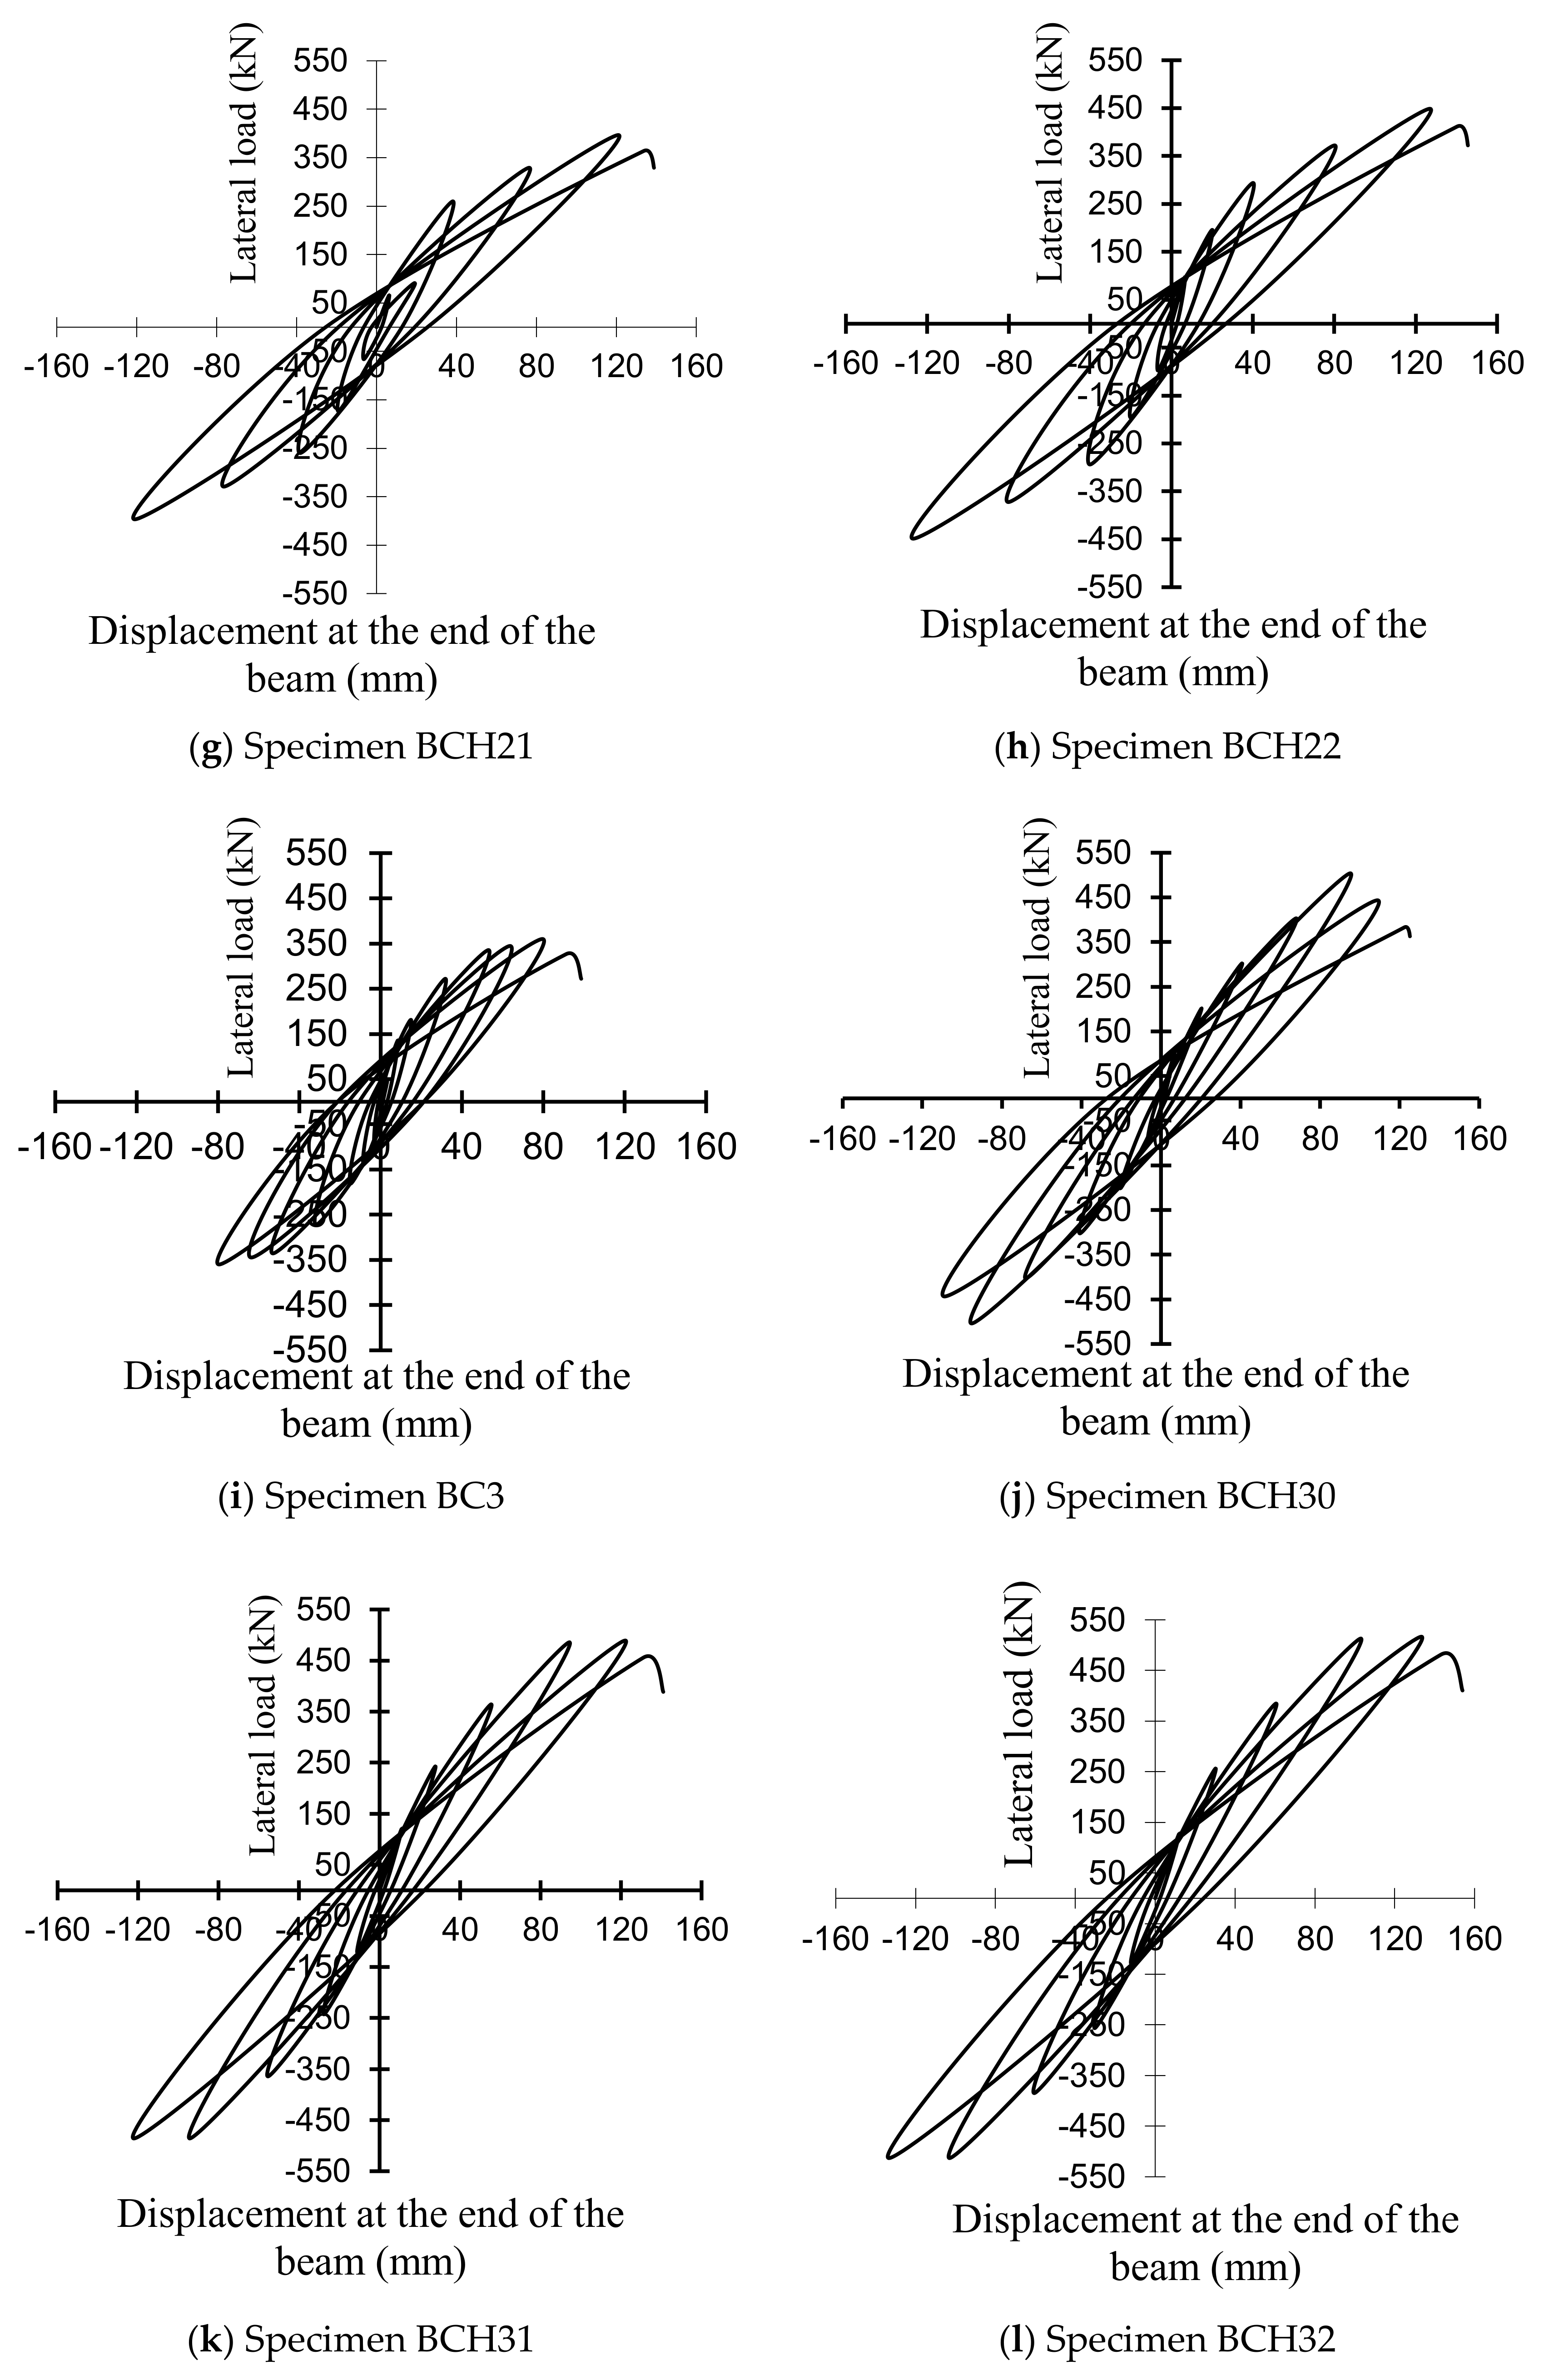
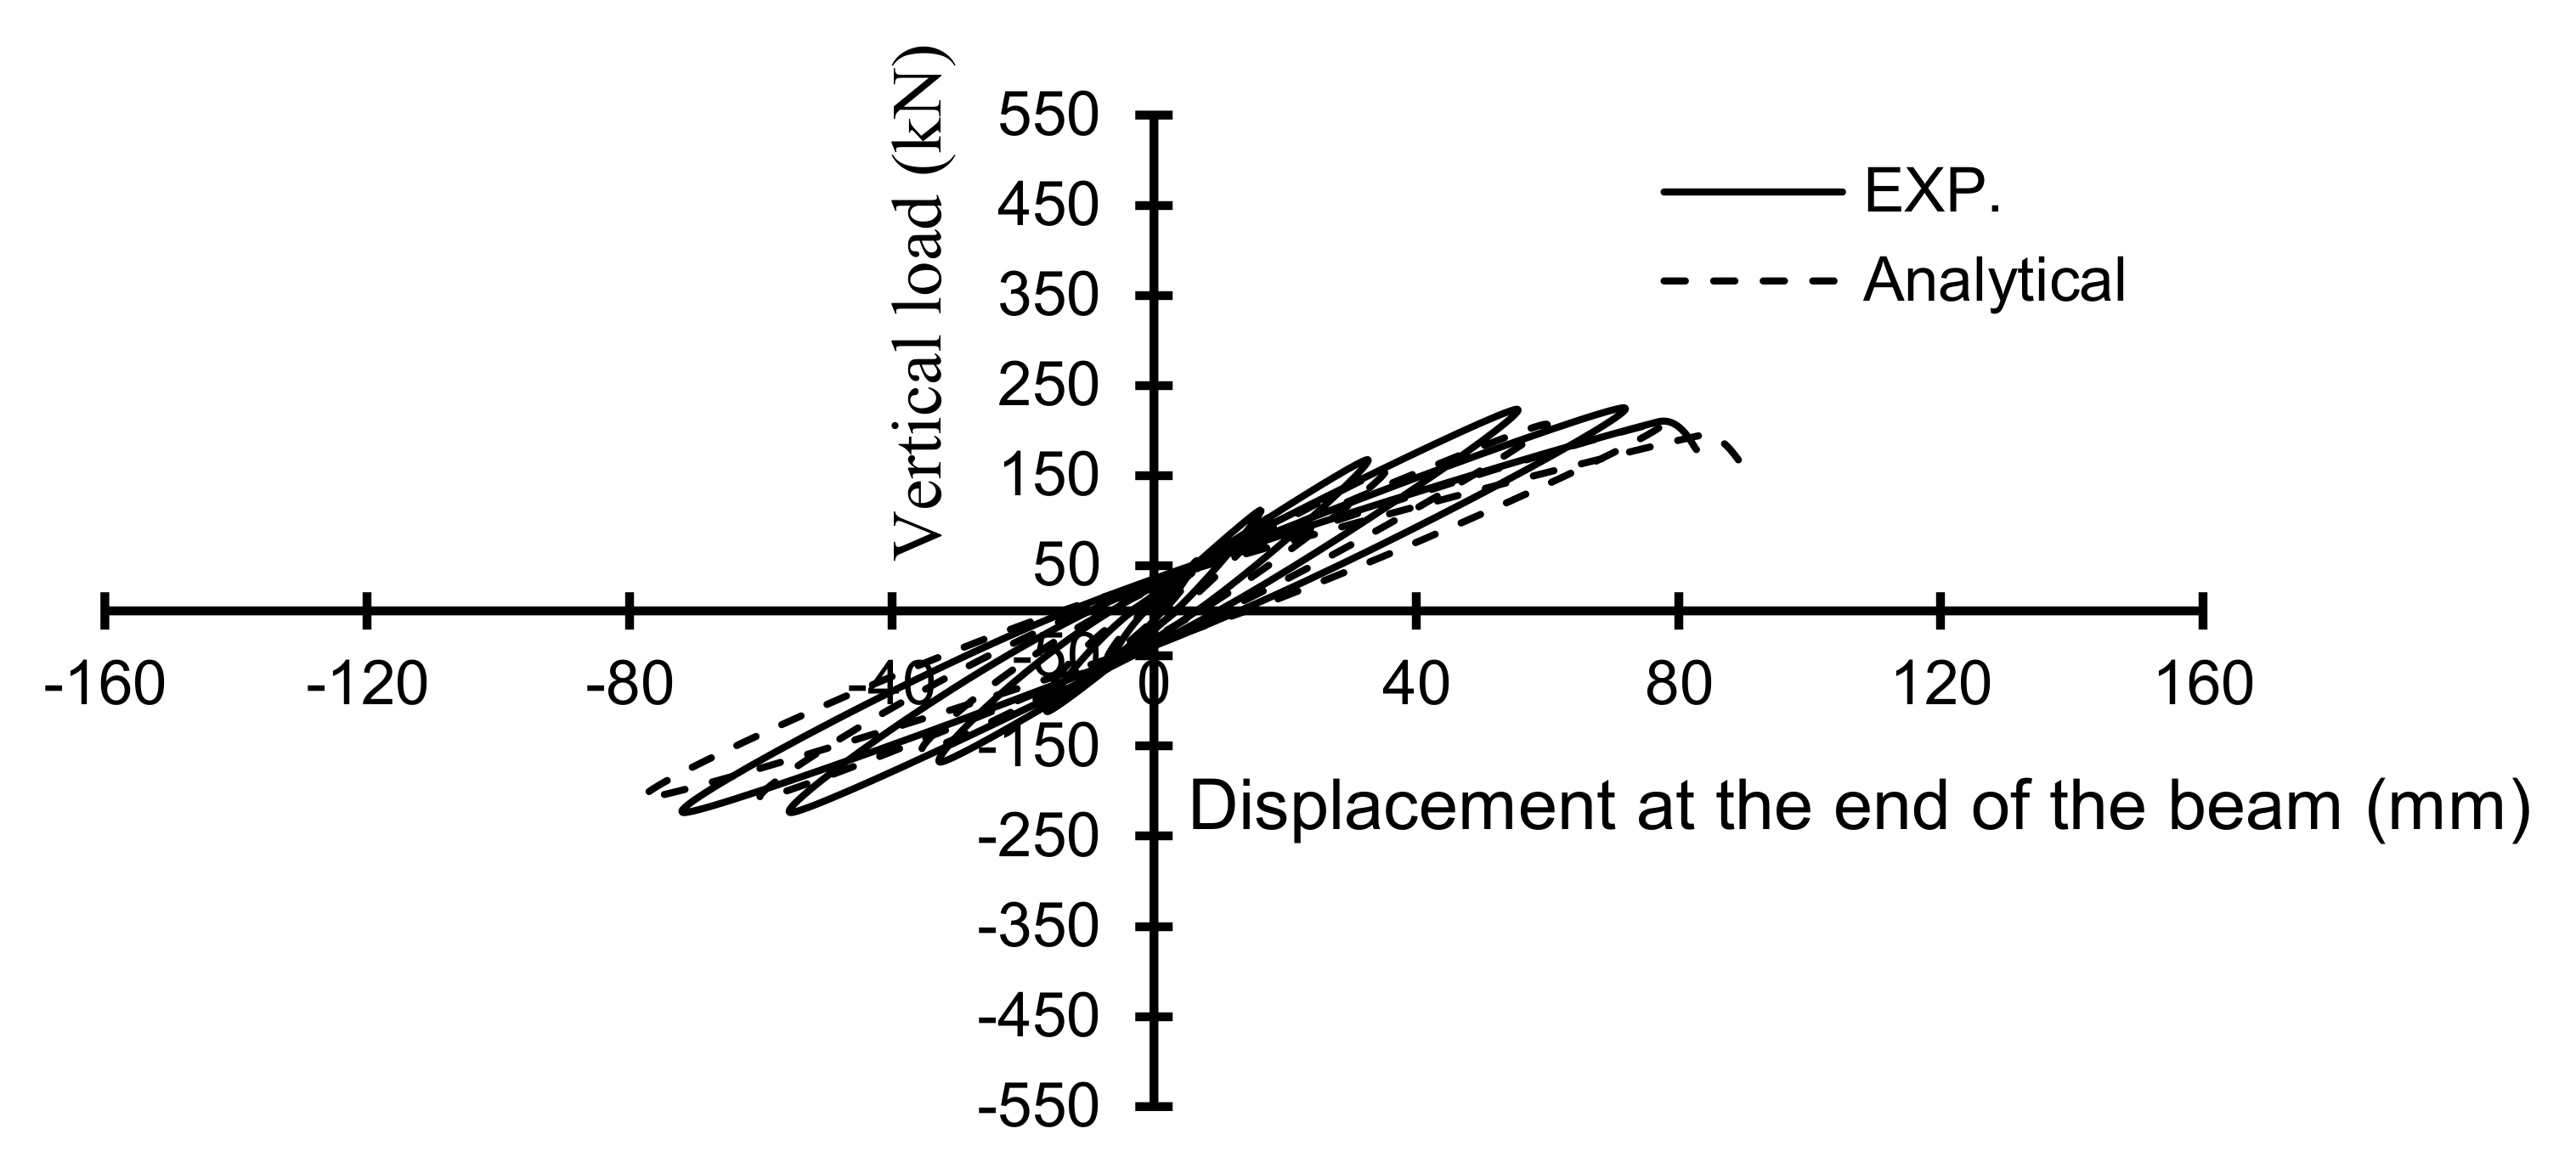
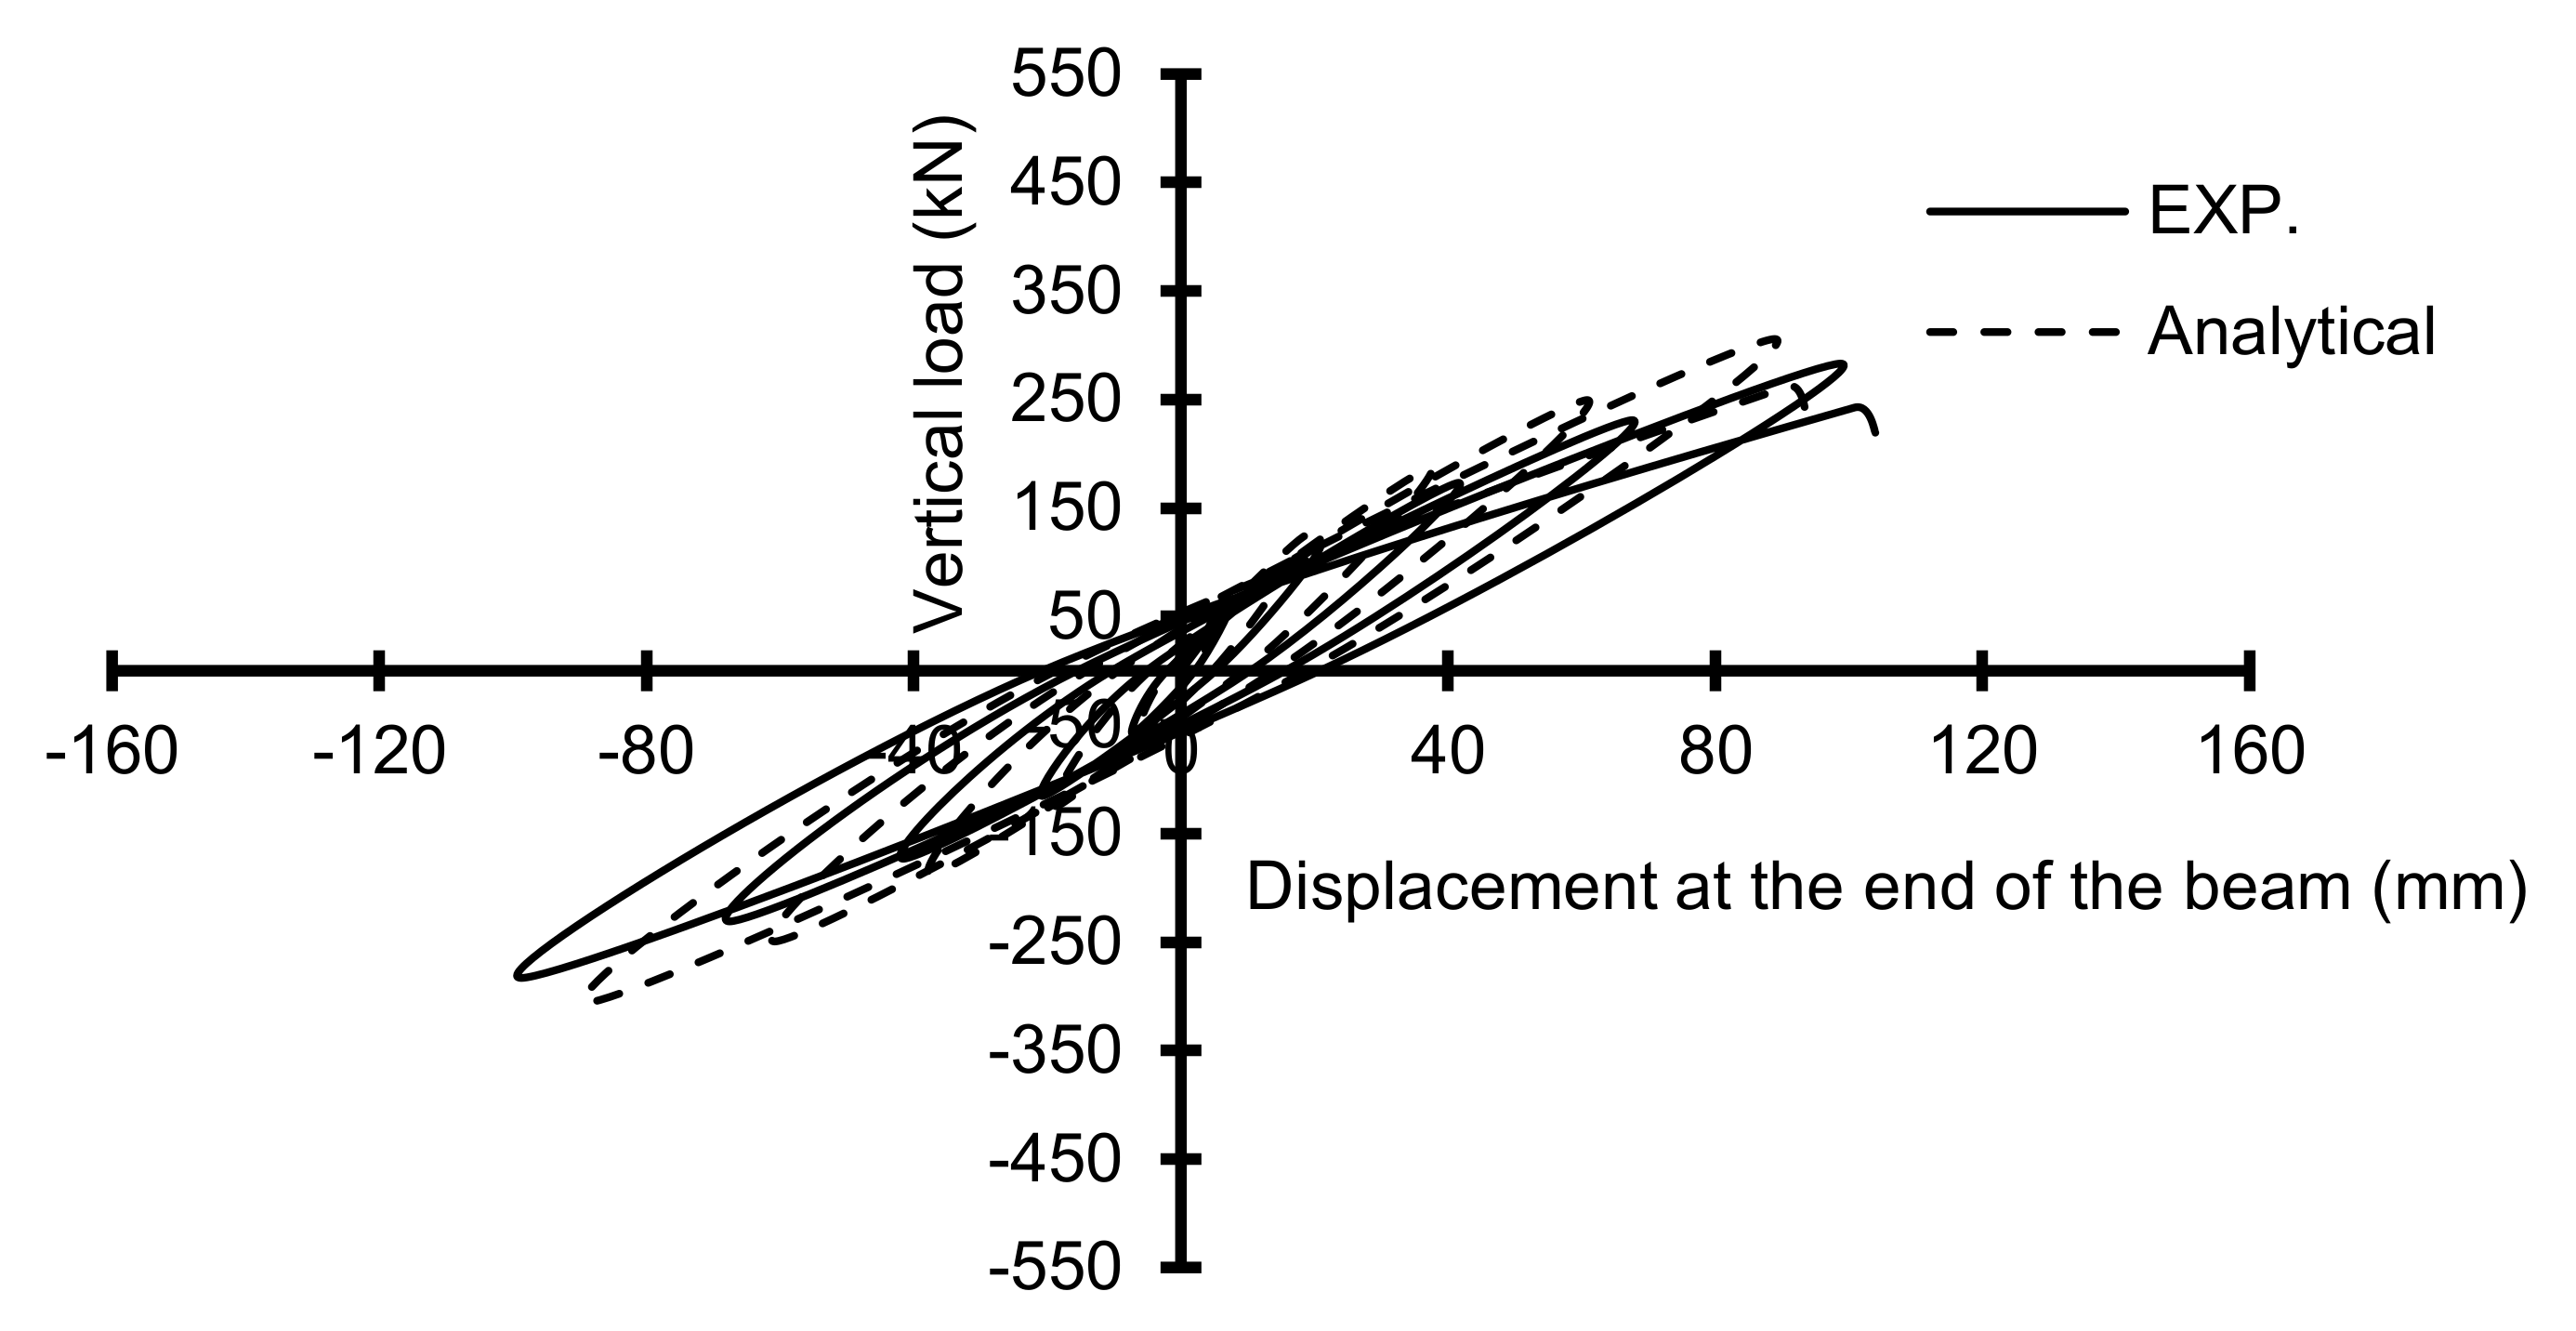
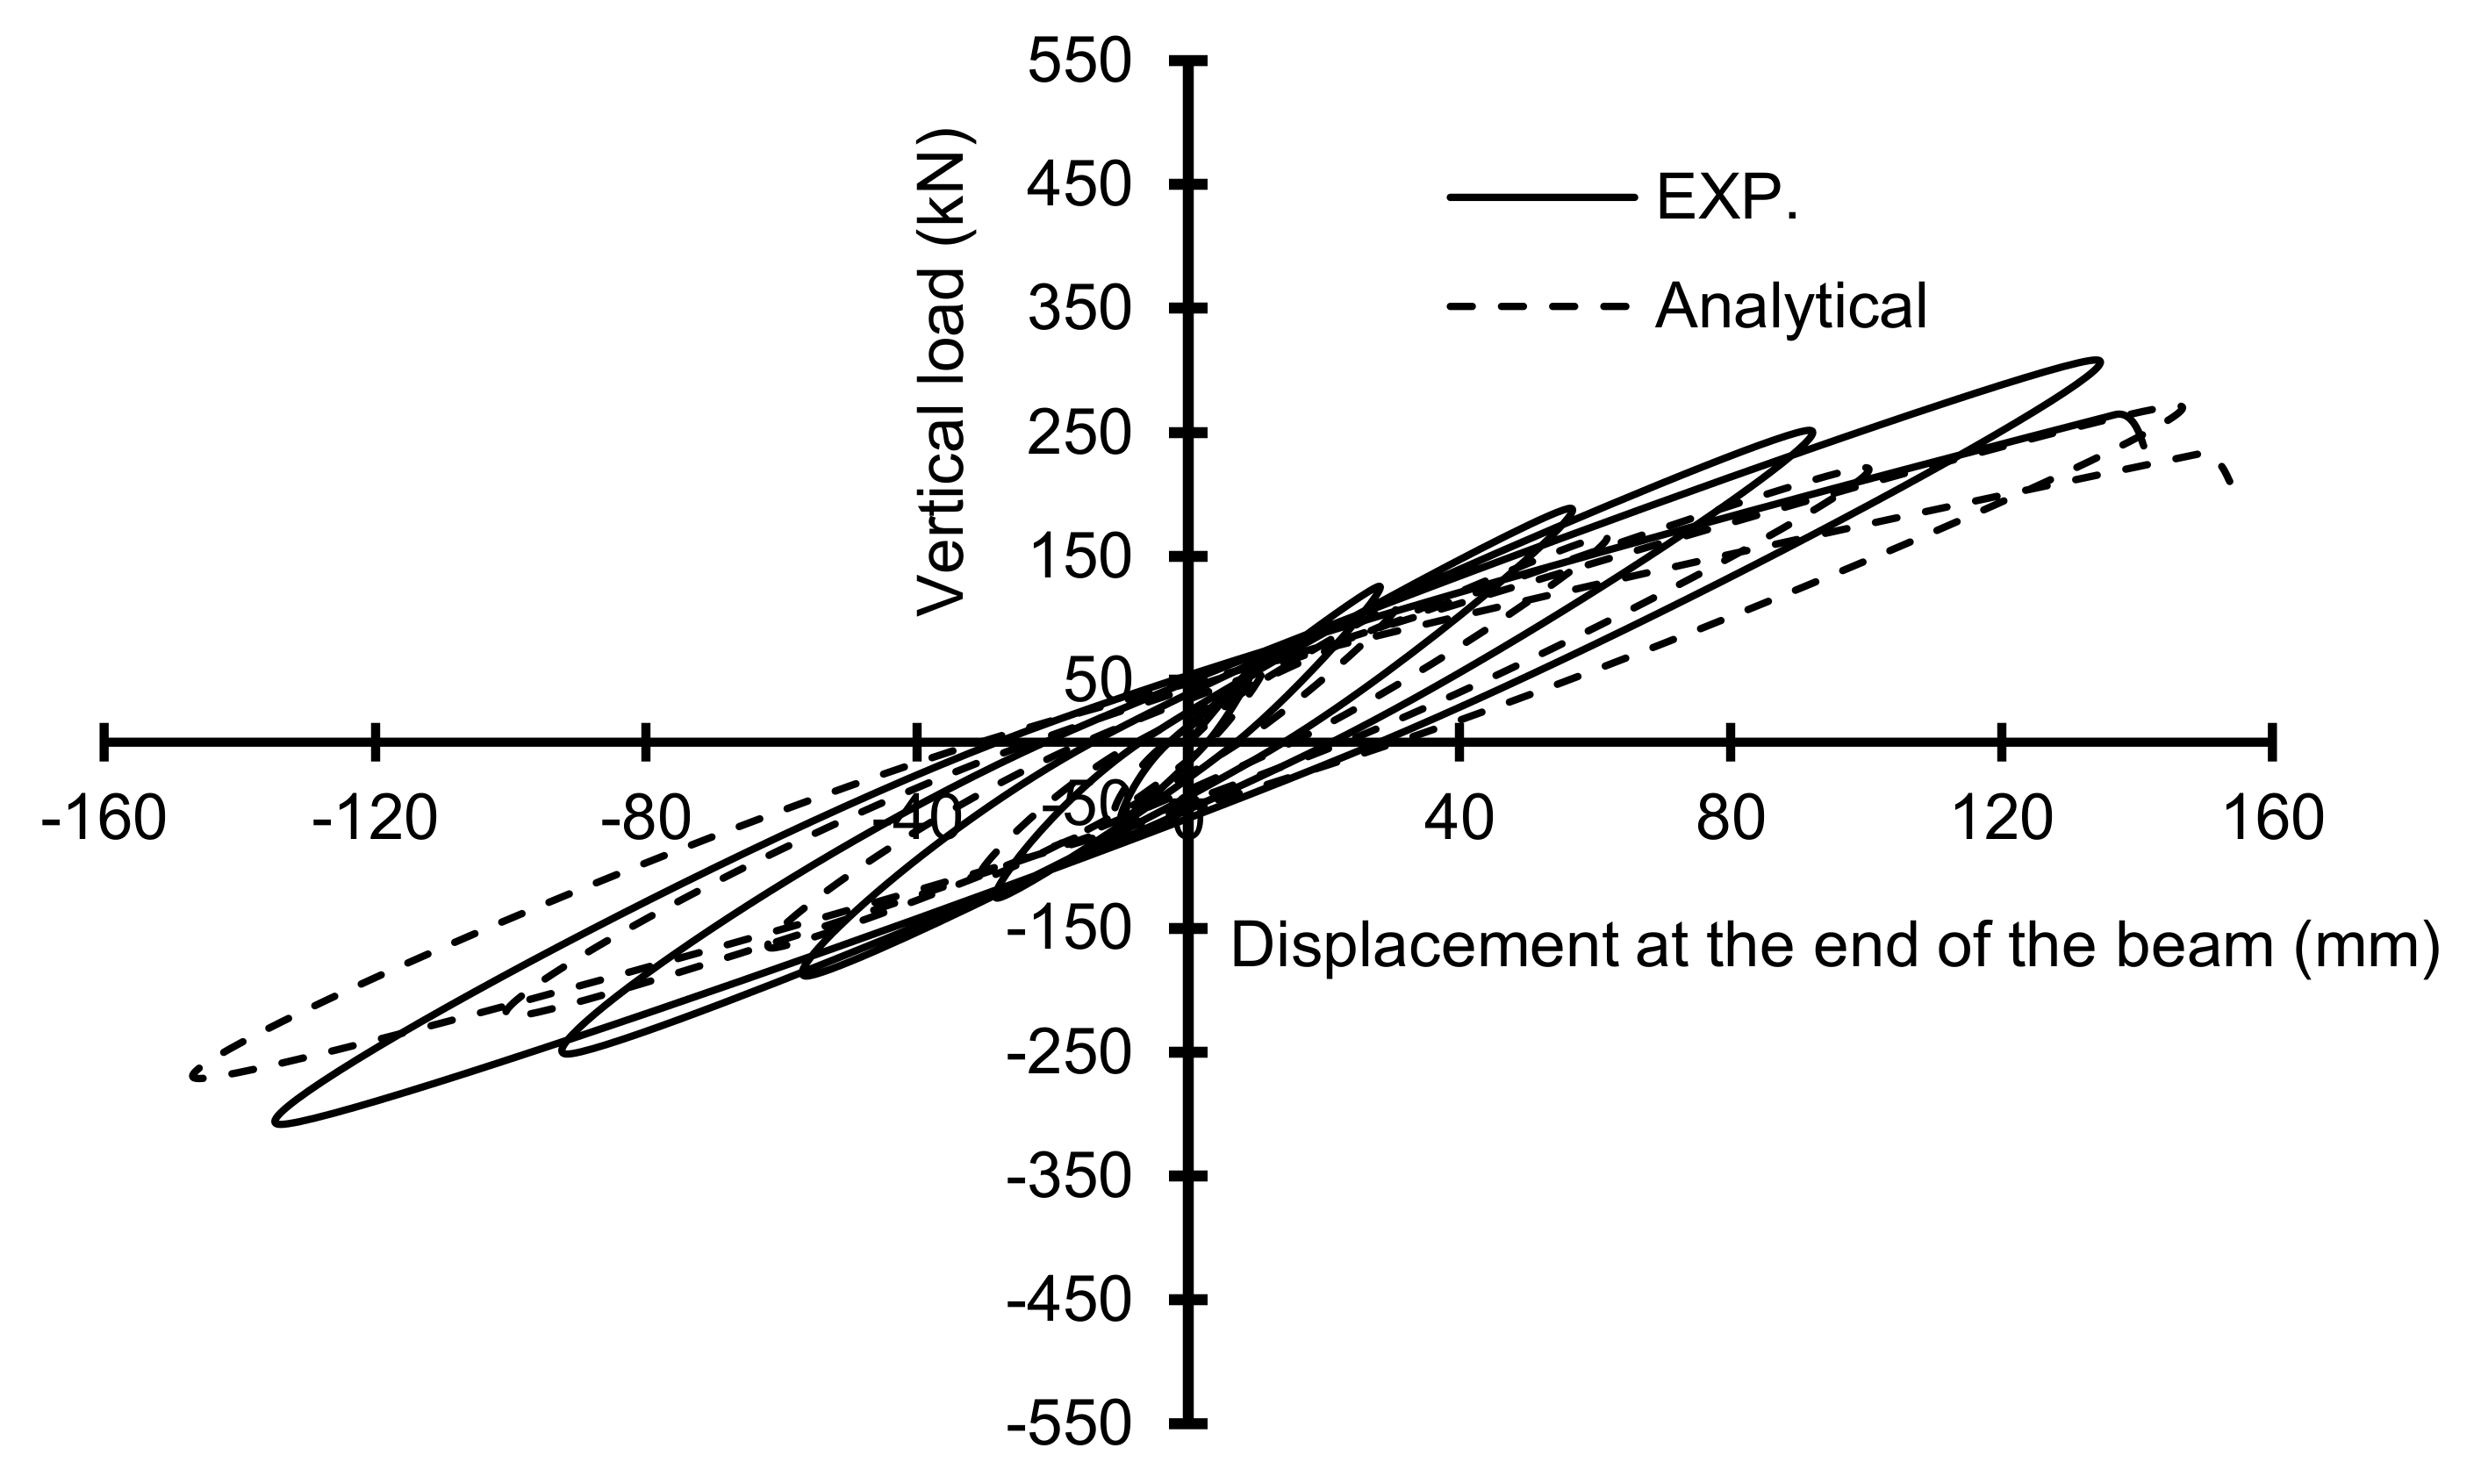
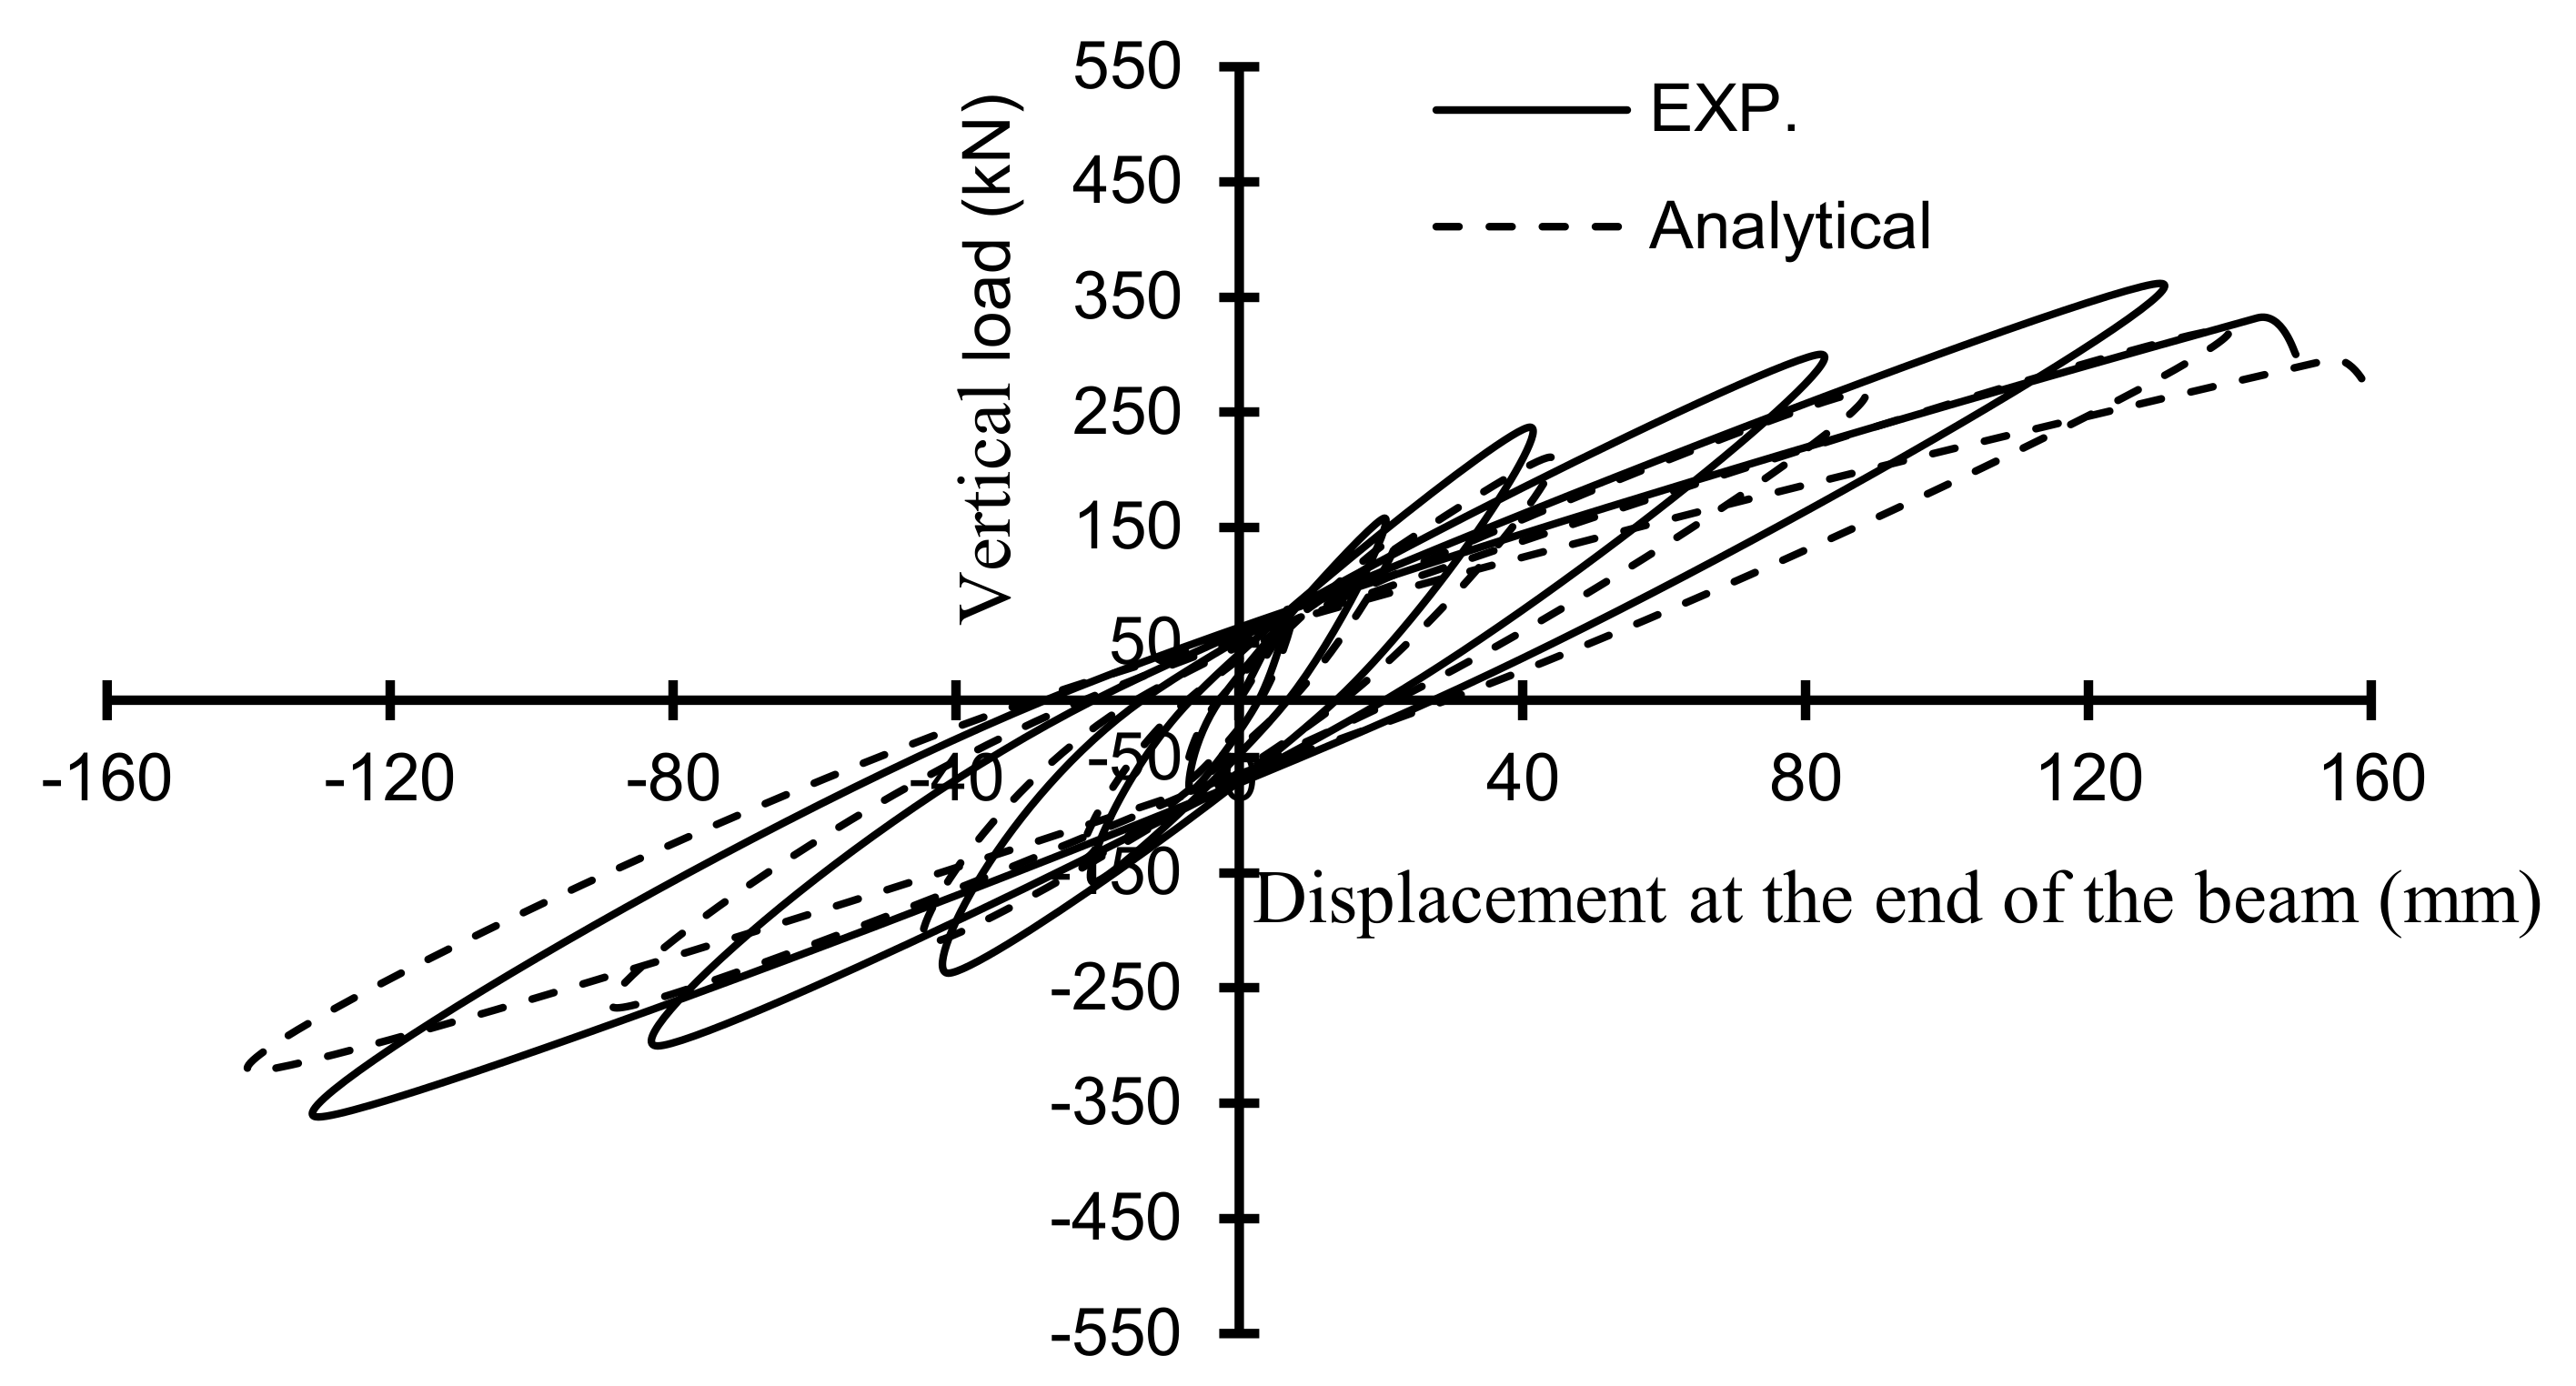
3.2. Hysteretic Curves of Lateral Load against End Vertical Beam Displacement
3.3. Strains in Bars
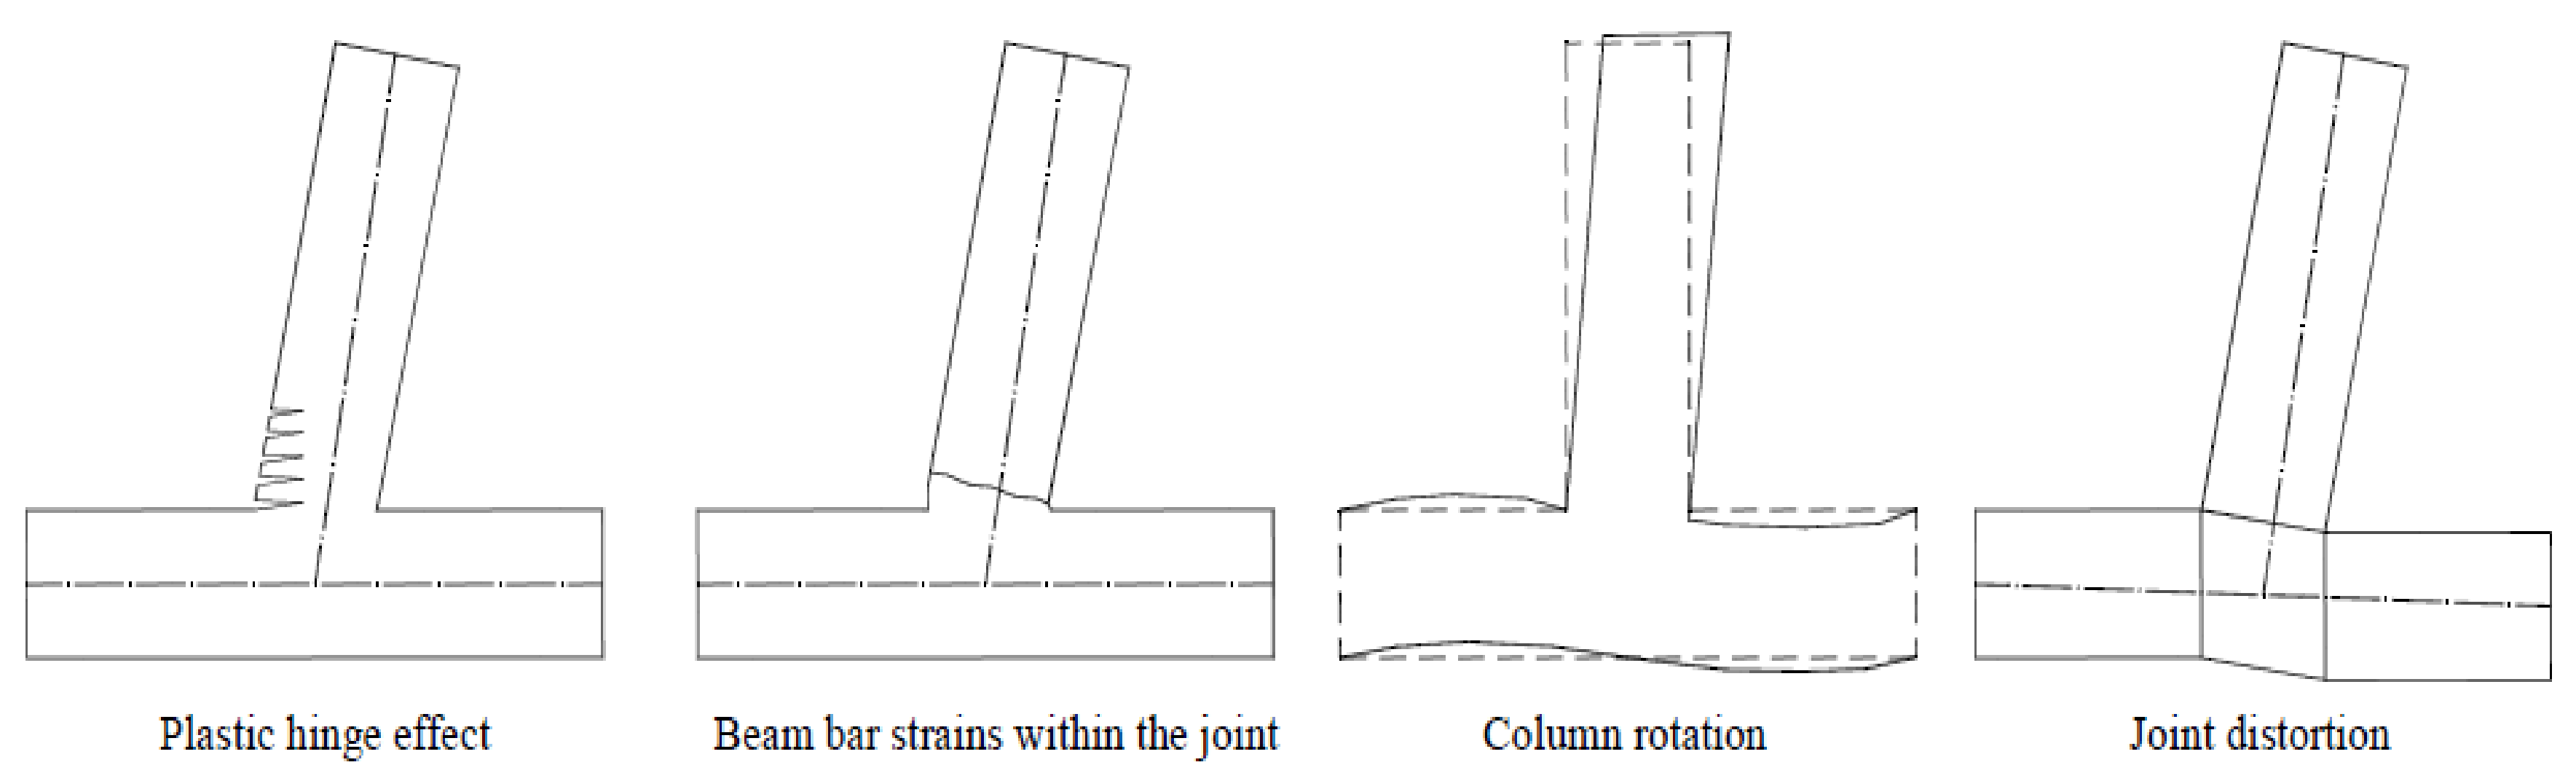
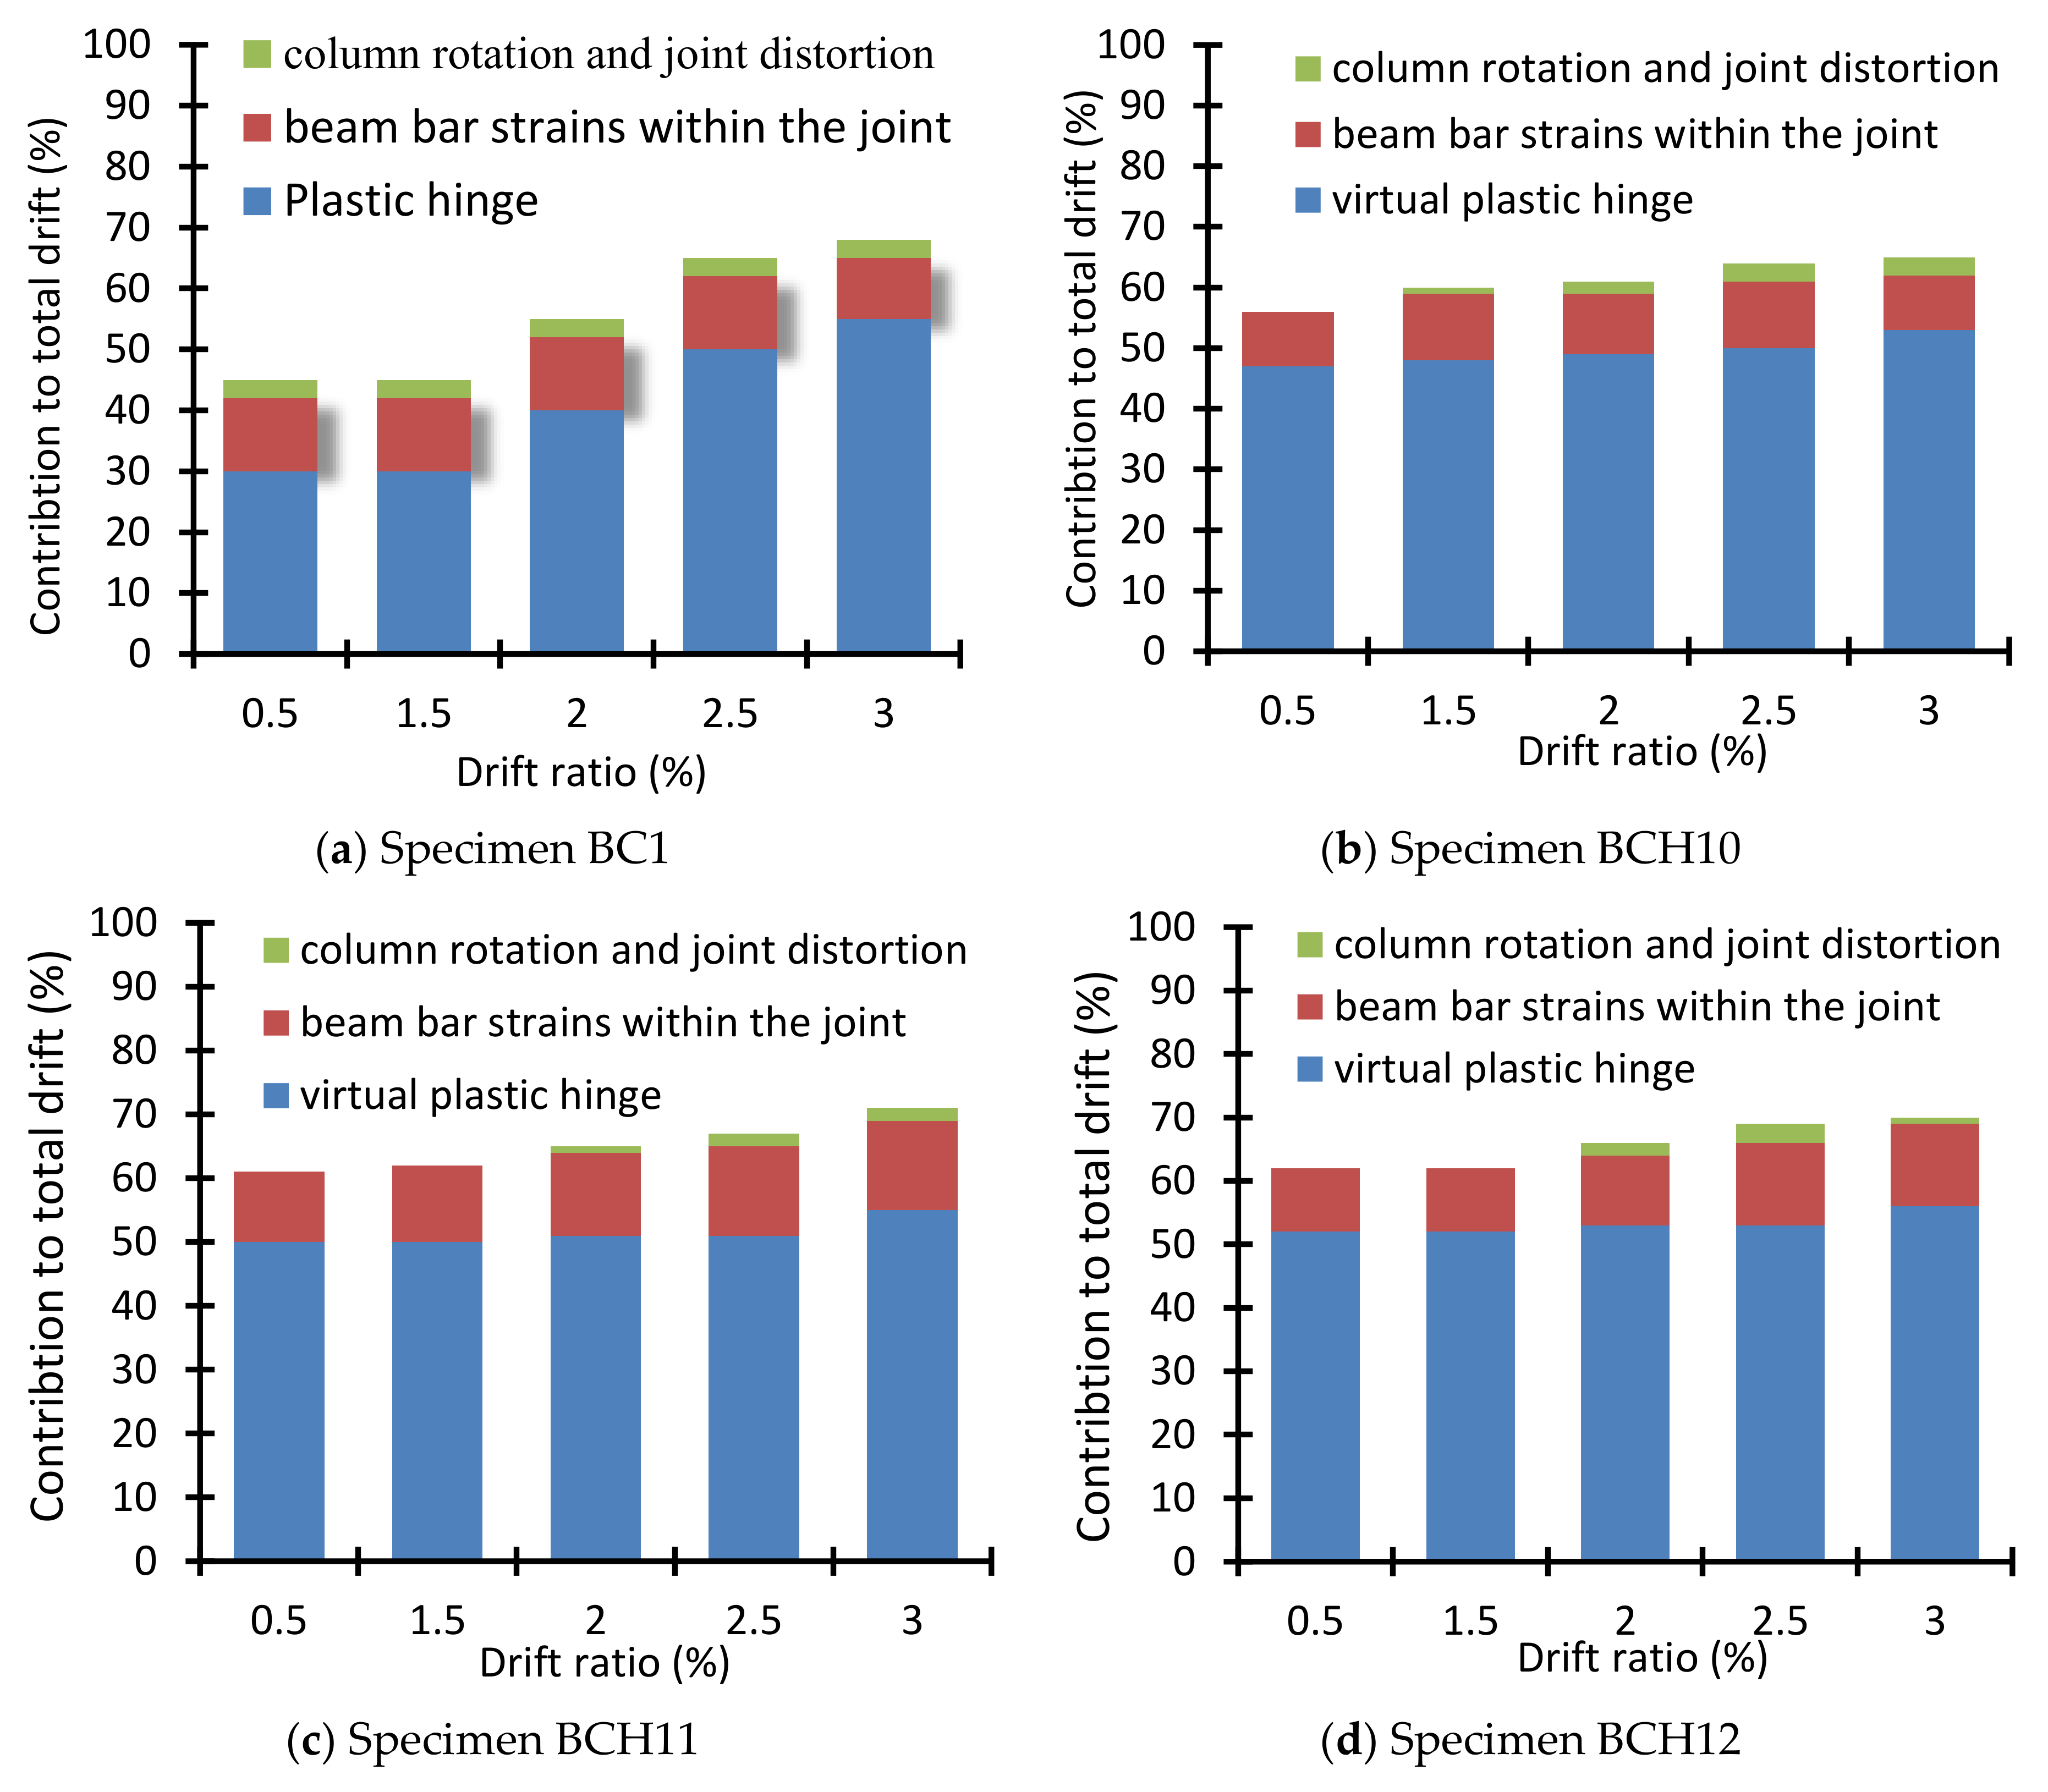
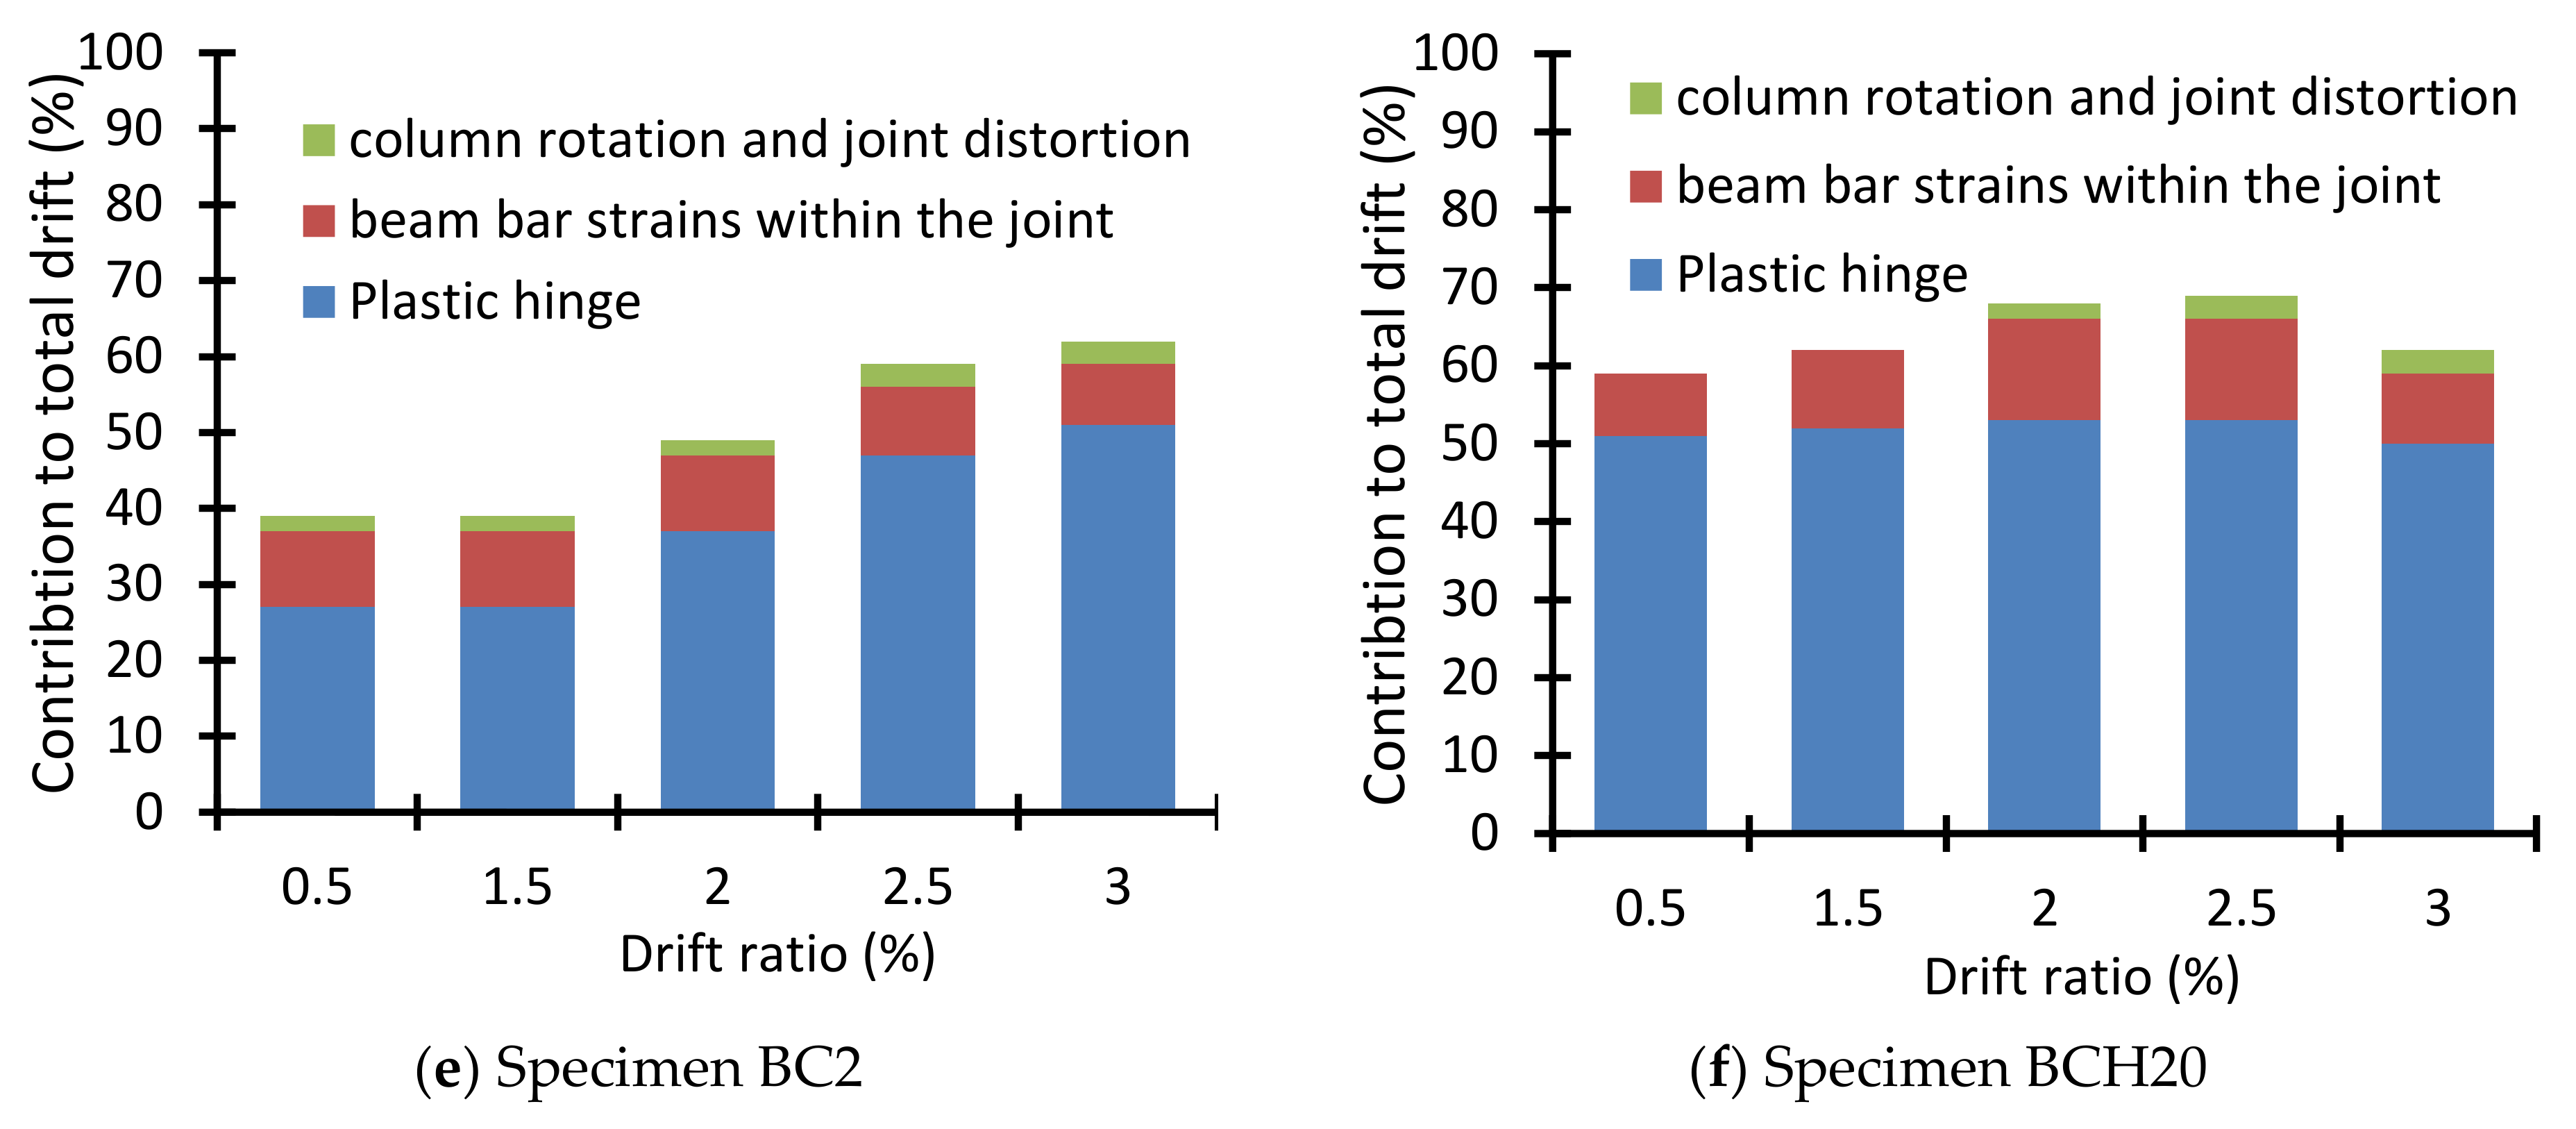
3.4. Rotation Measurements
4. Codes Provisions
4.1. ACI 318-19
4.2. NZS-07
4.3. ECP-07
5. Test Results and Code Predictions Comparison
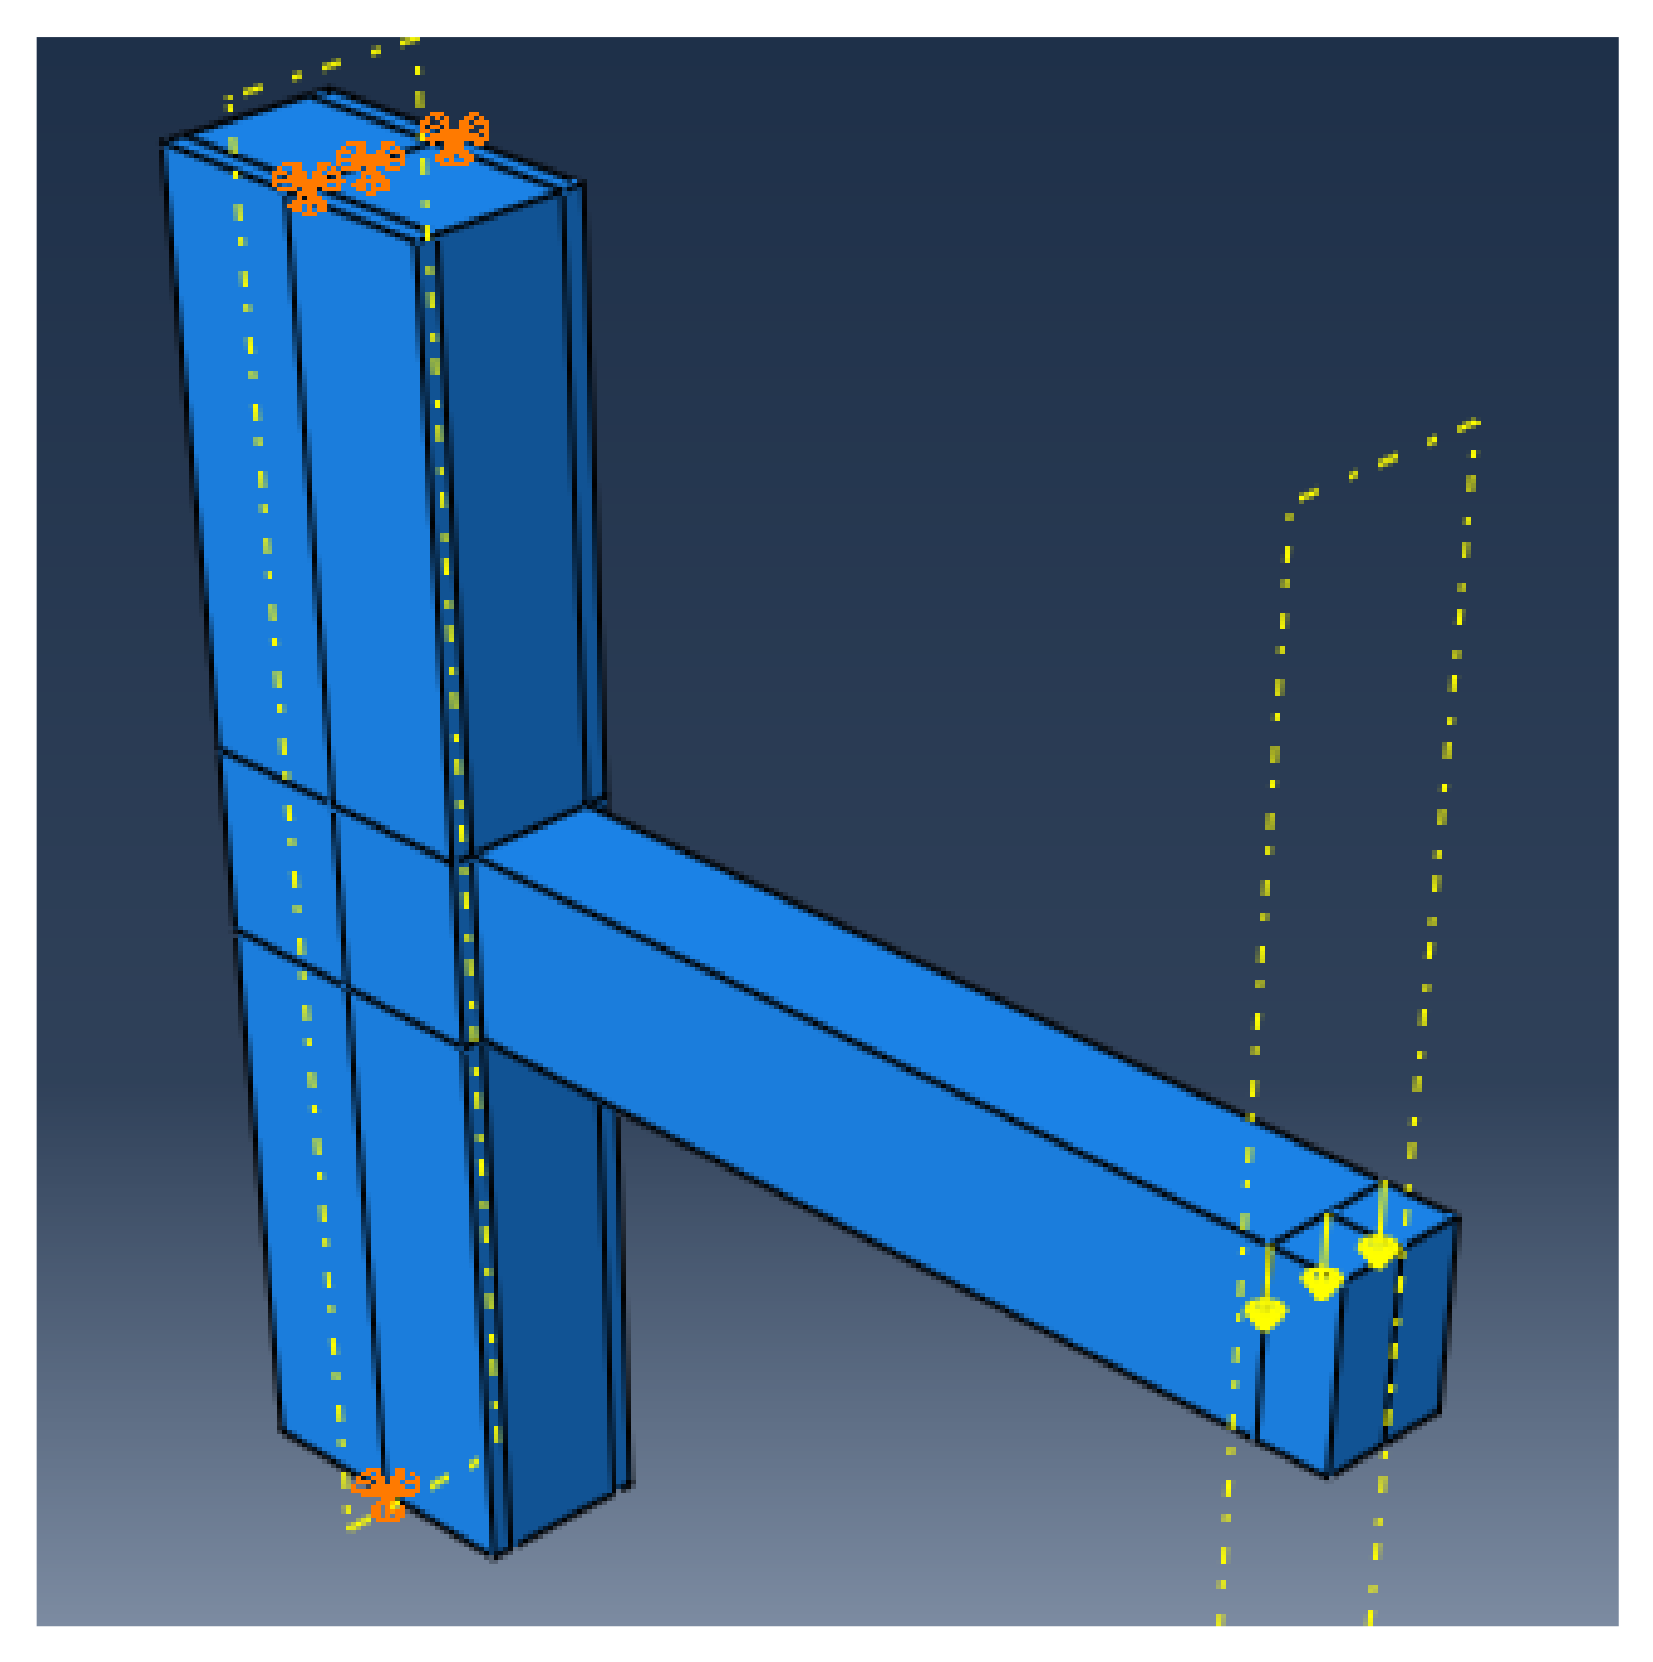
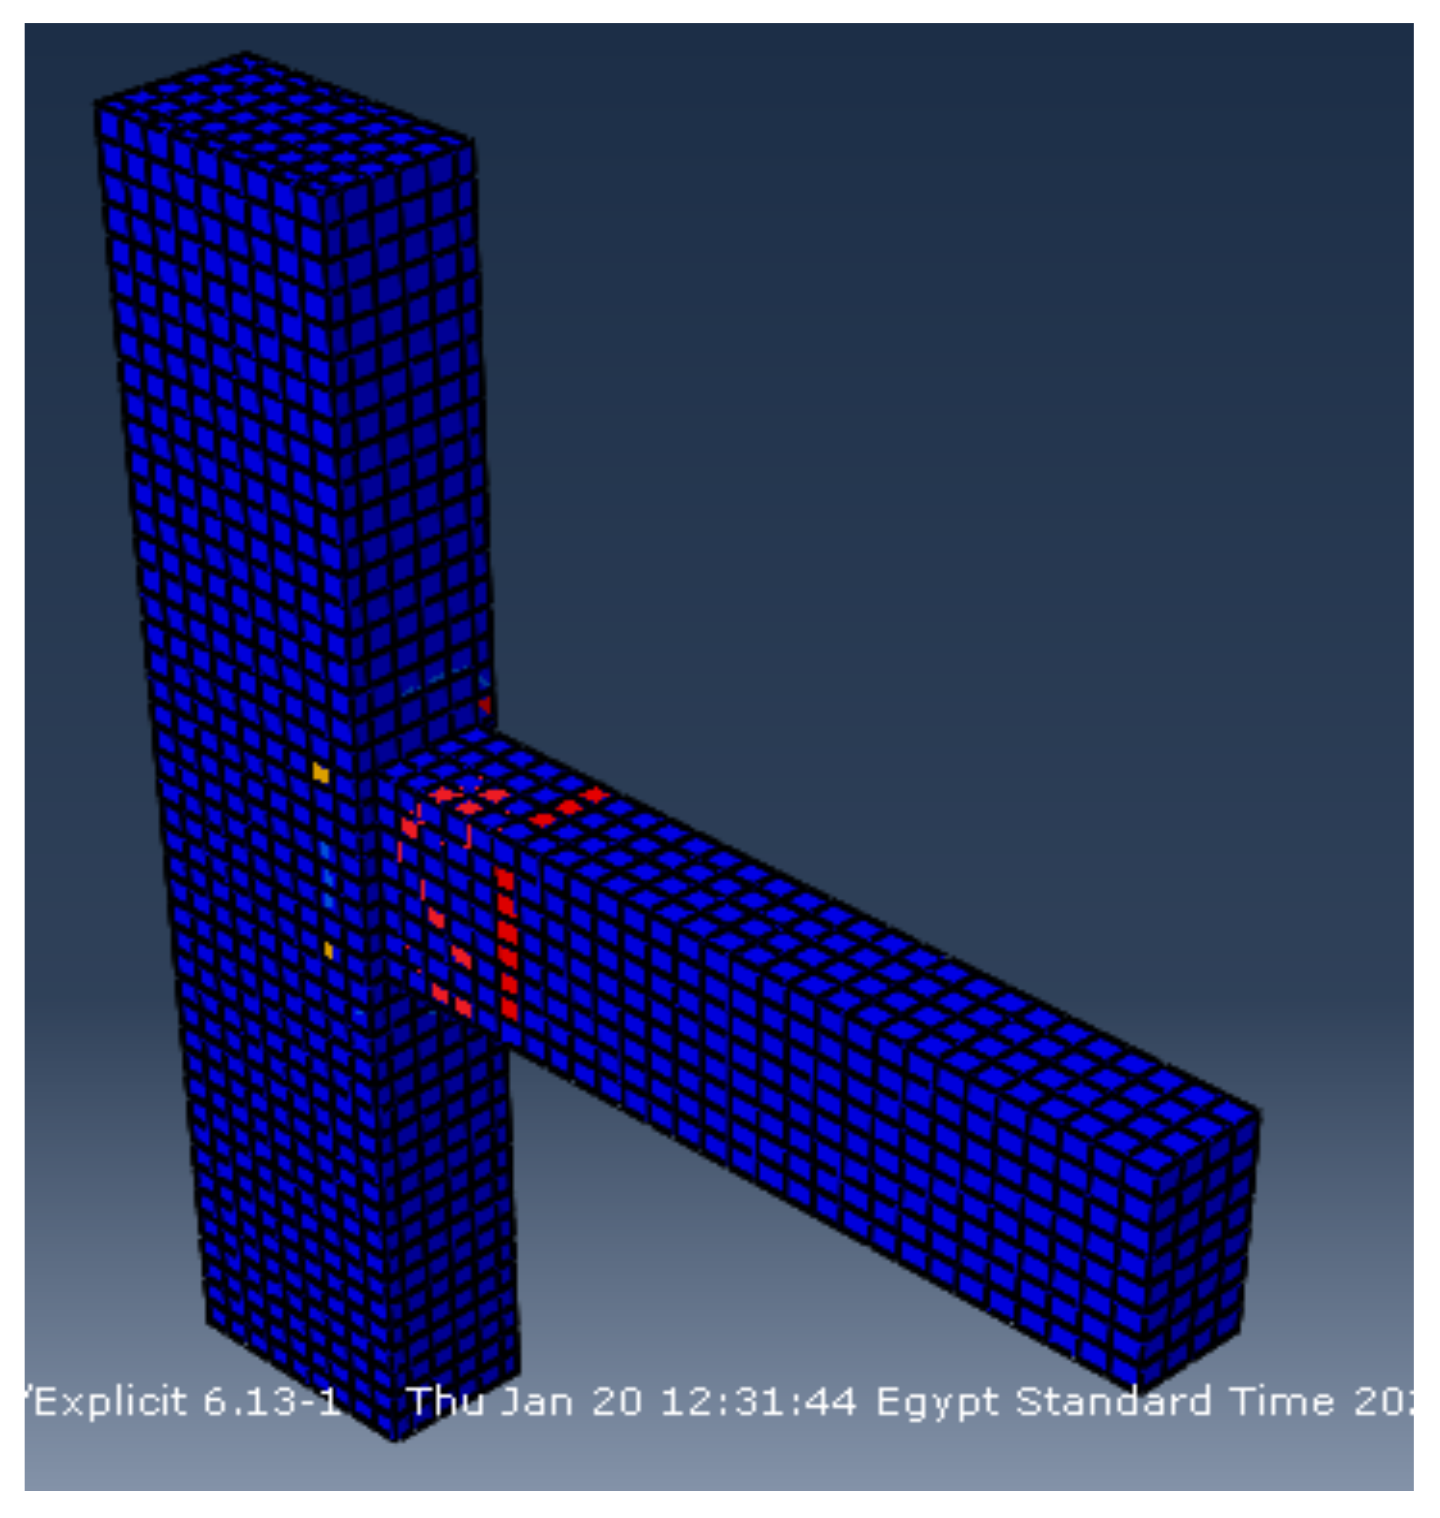
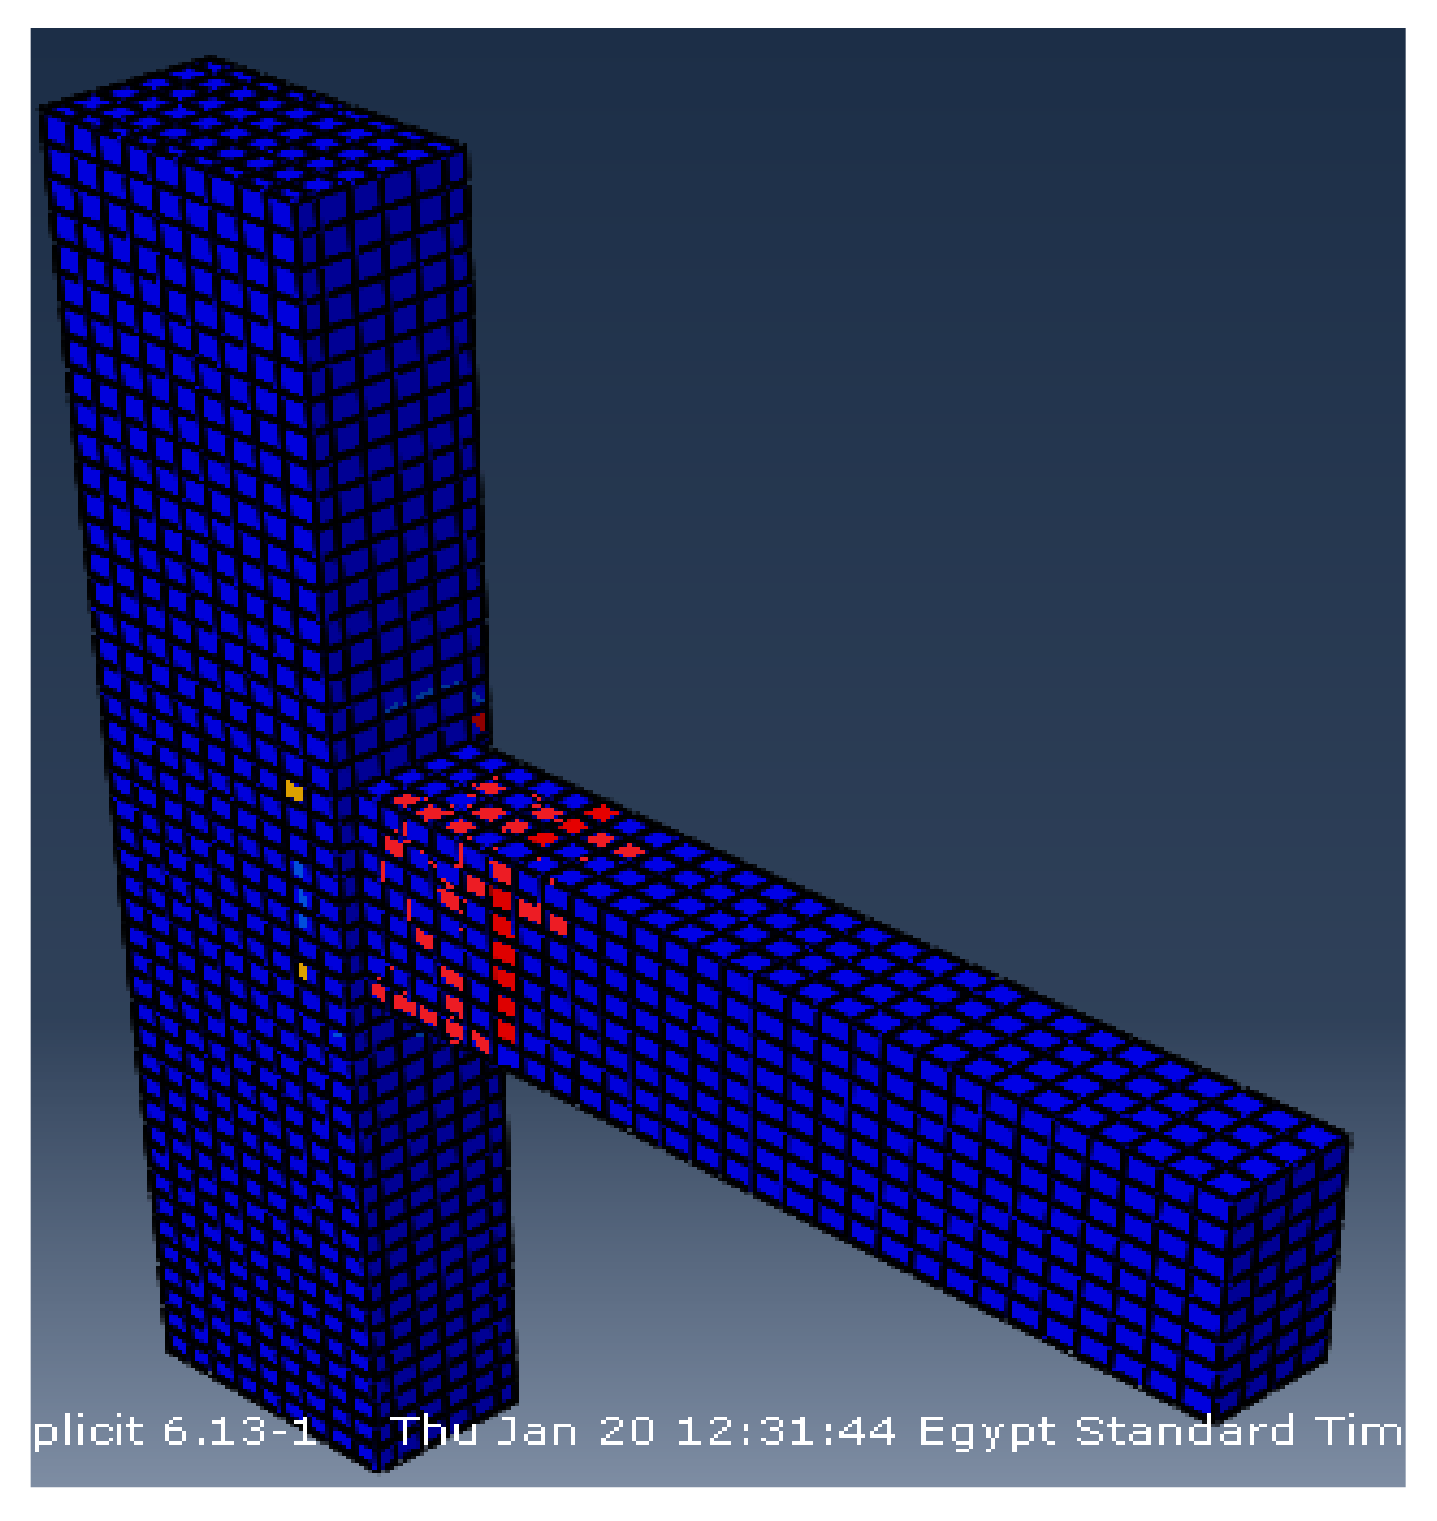
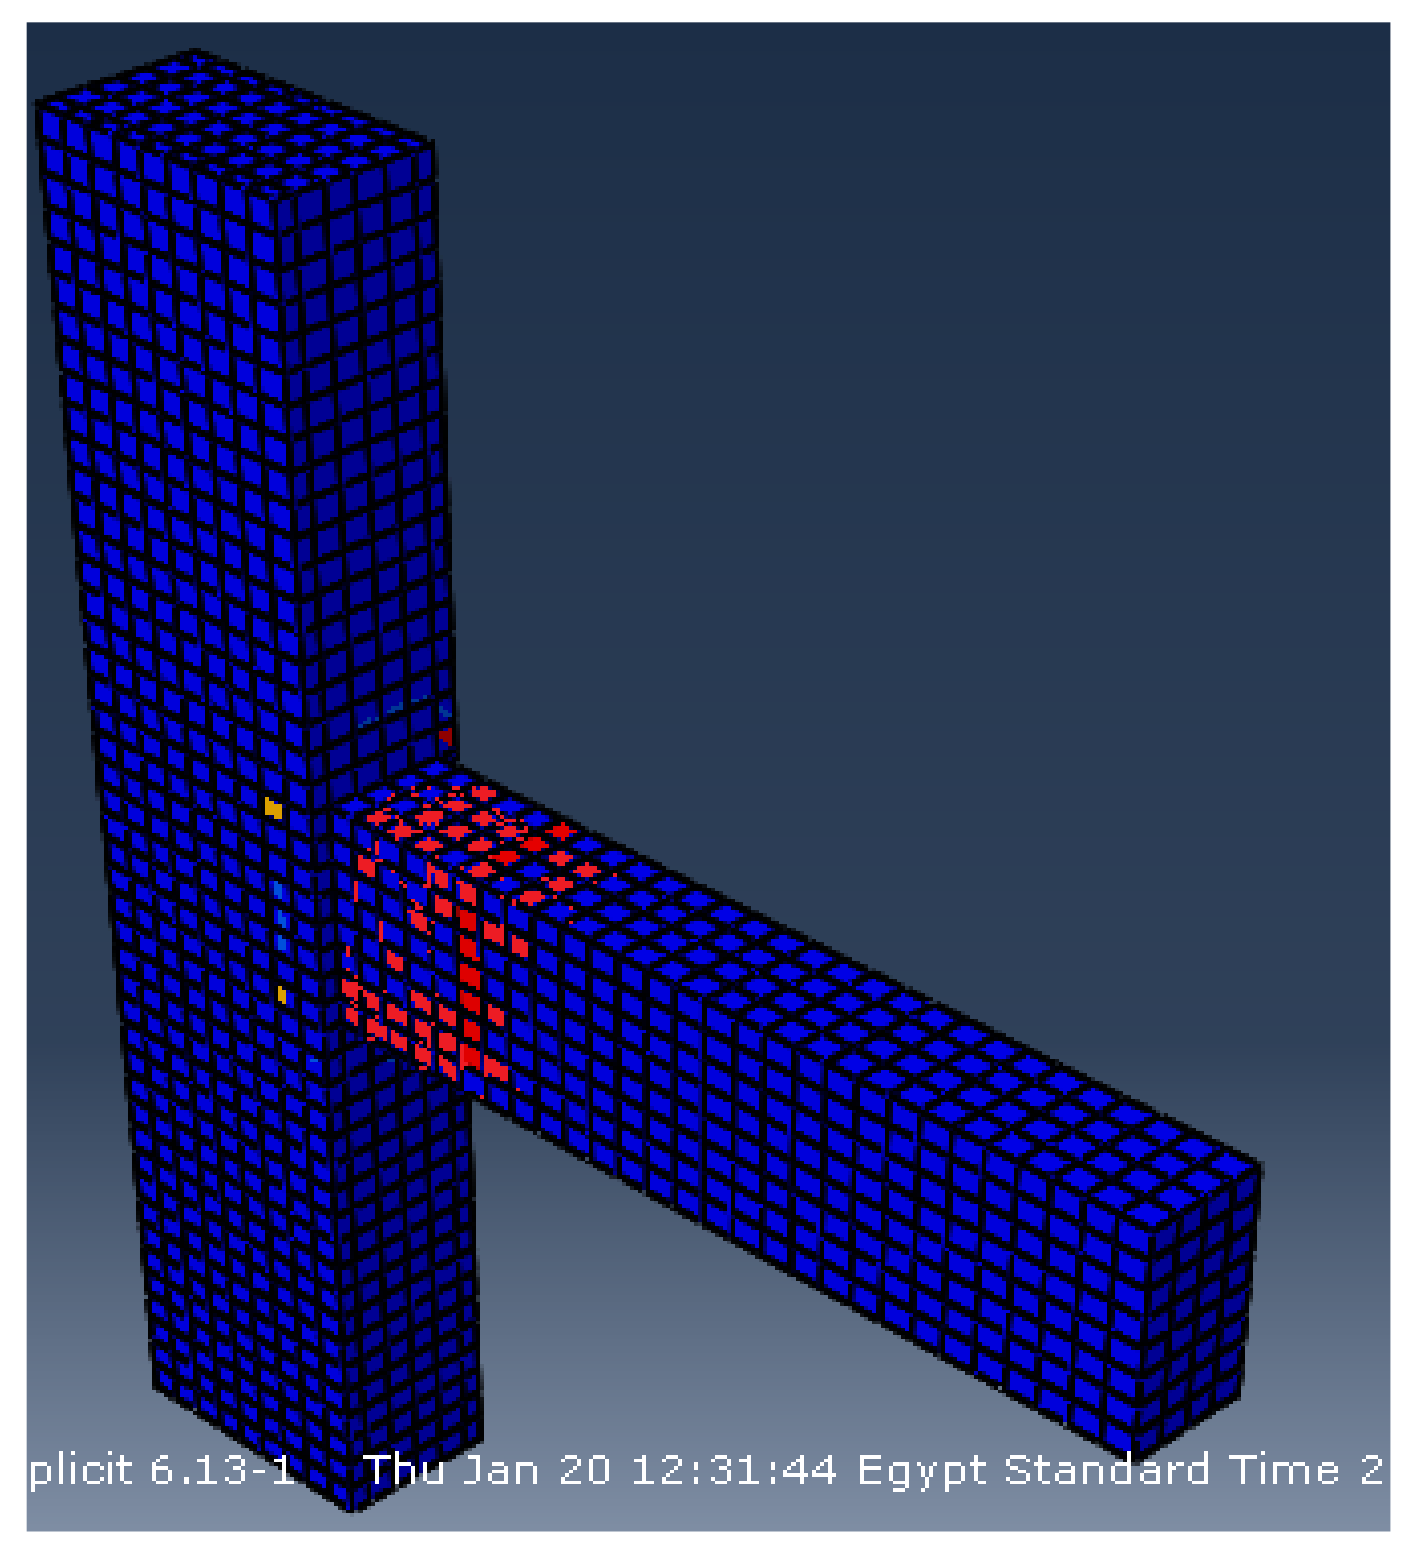
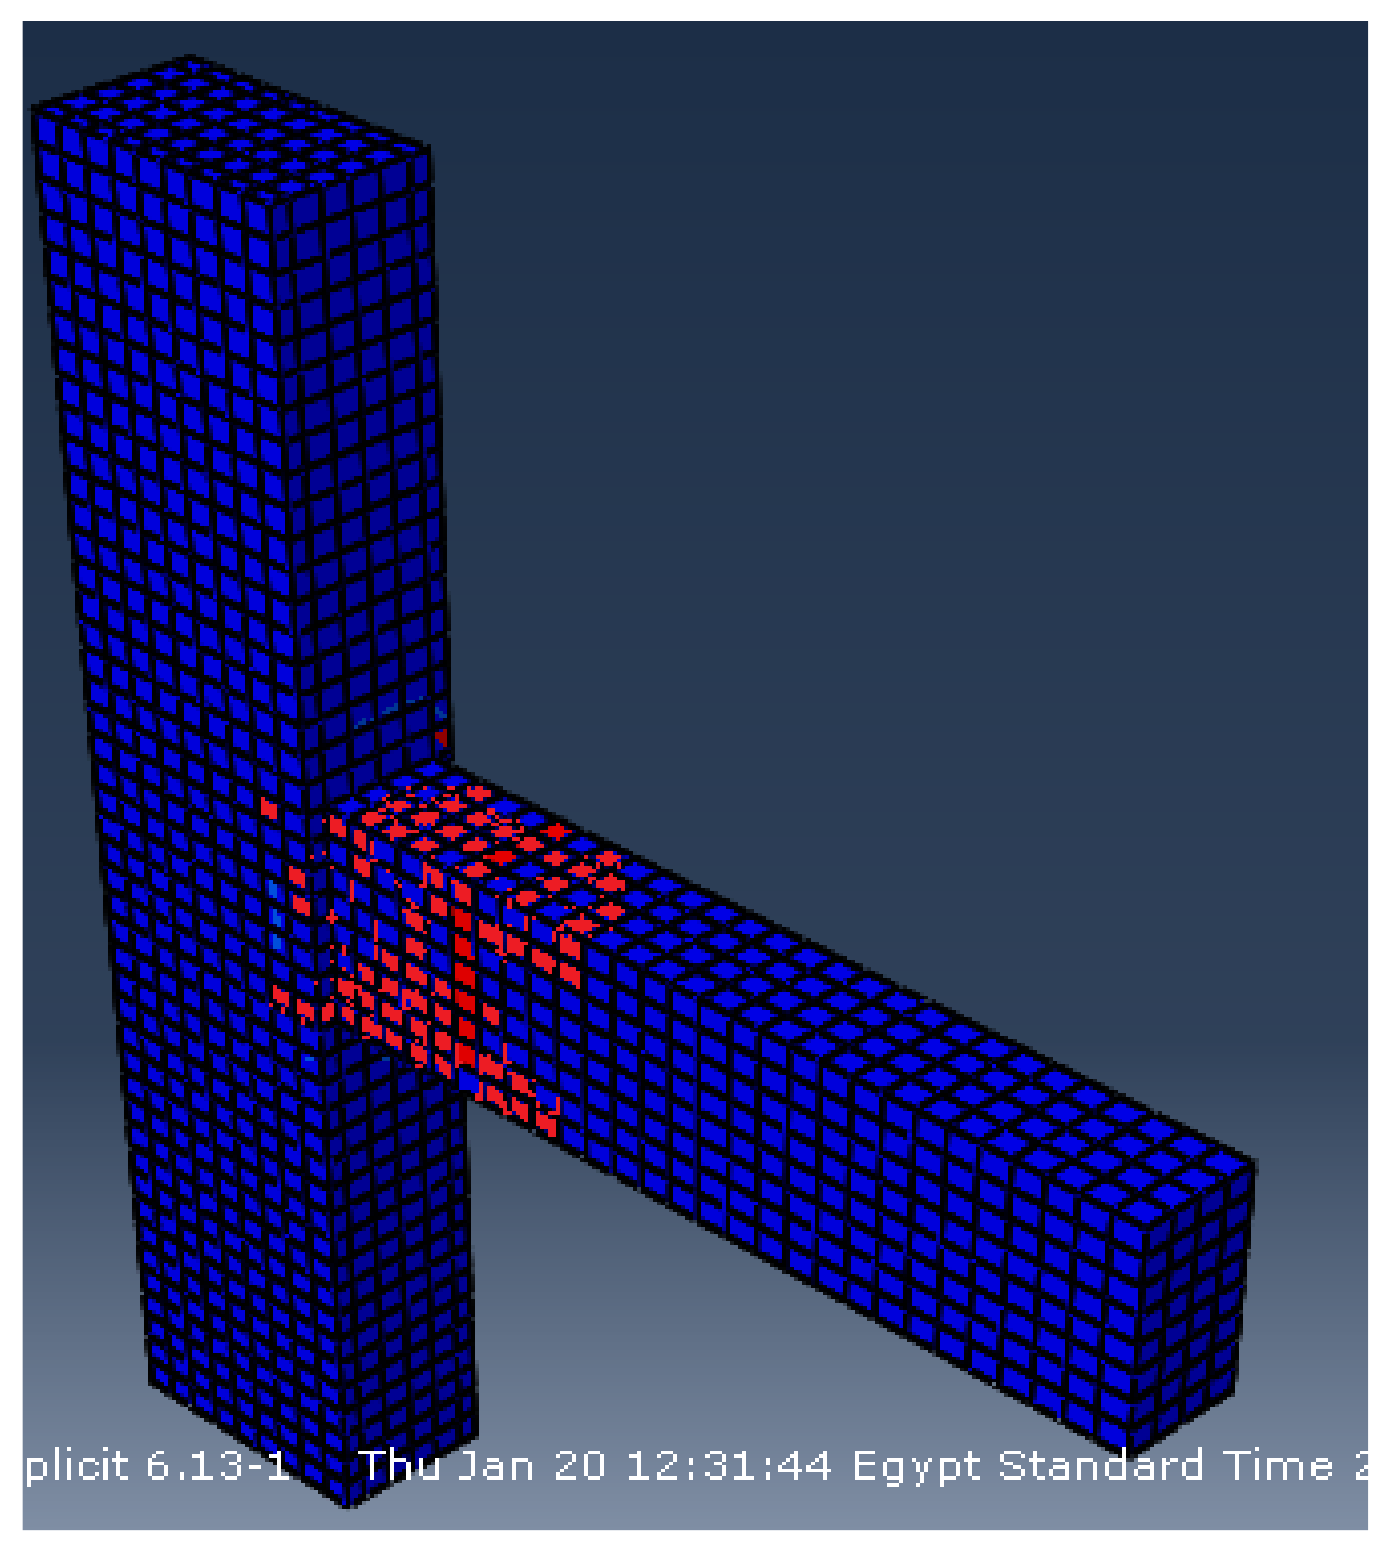
6. Finite Element Analyses
6.1. Modeling Using Finite Elements
6.2. Reinforcement
6.3. Concrete
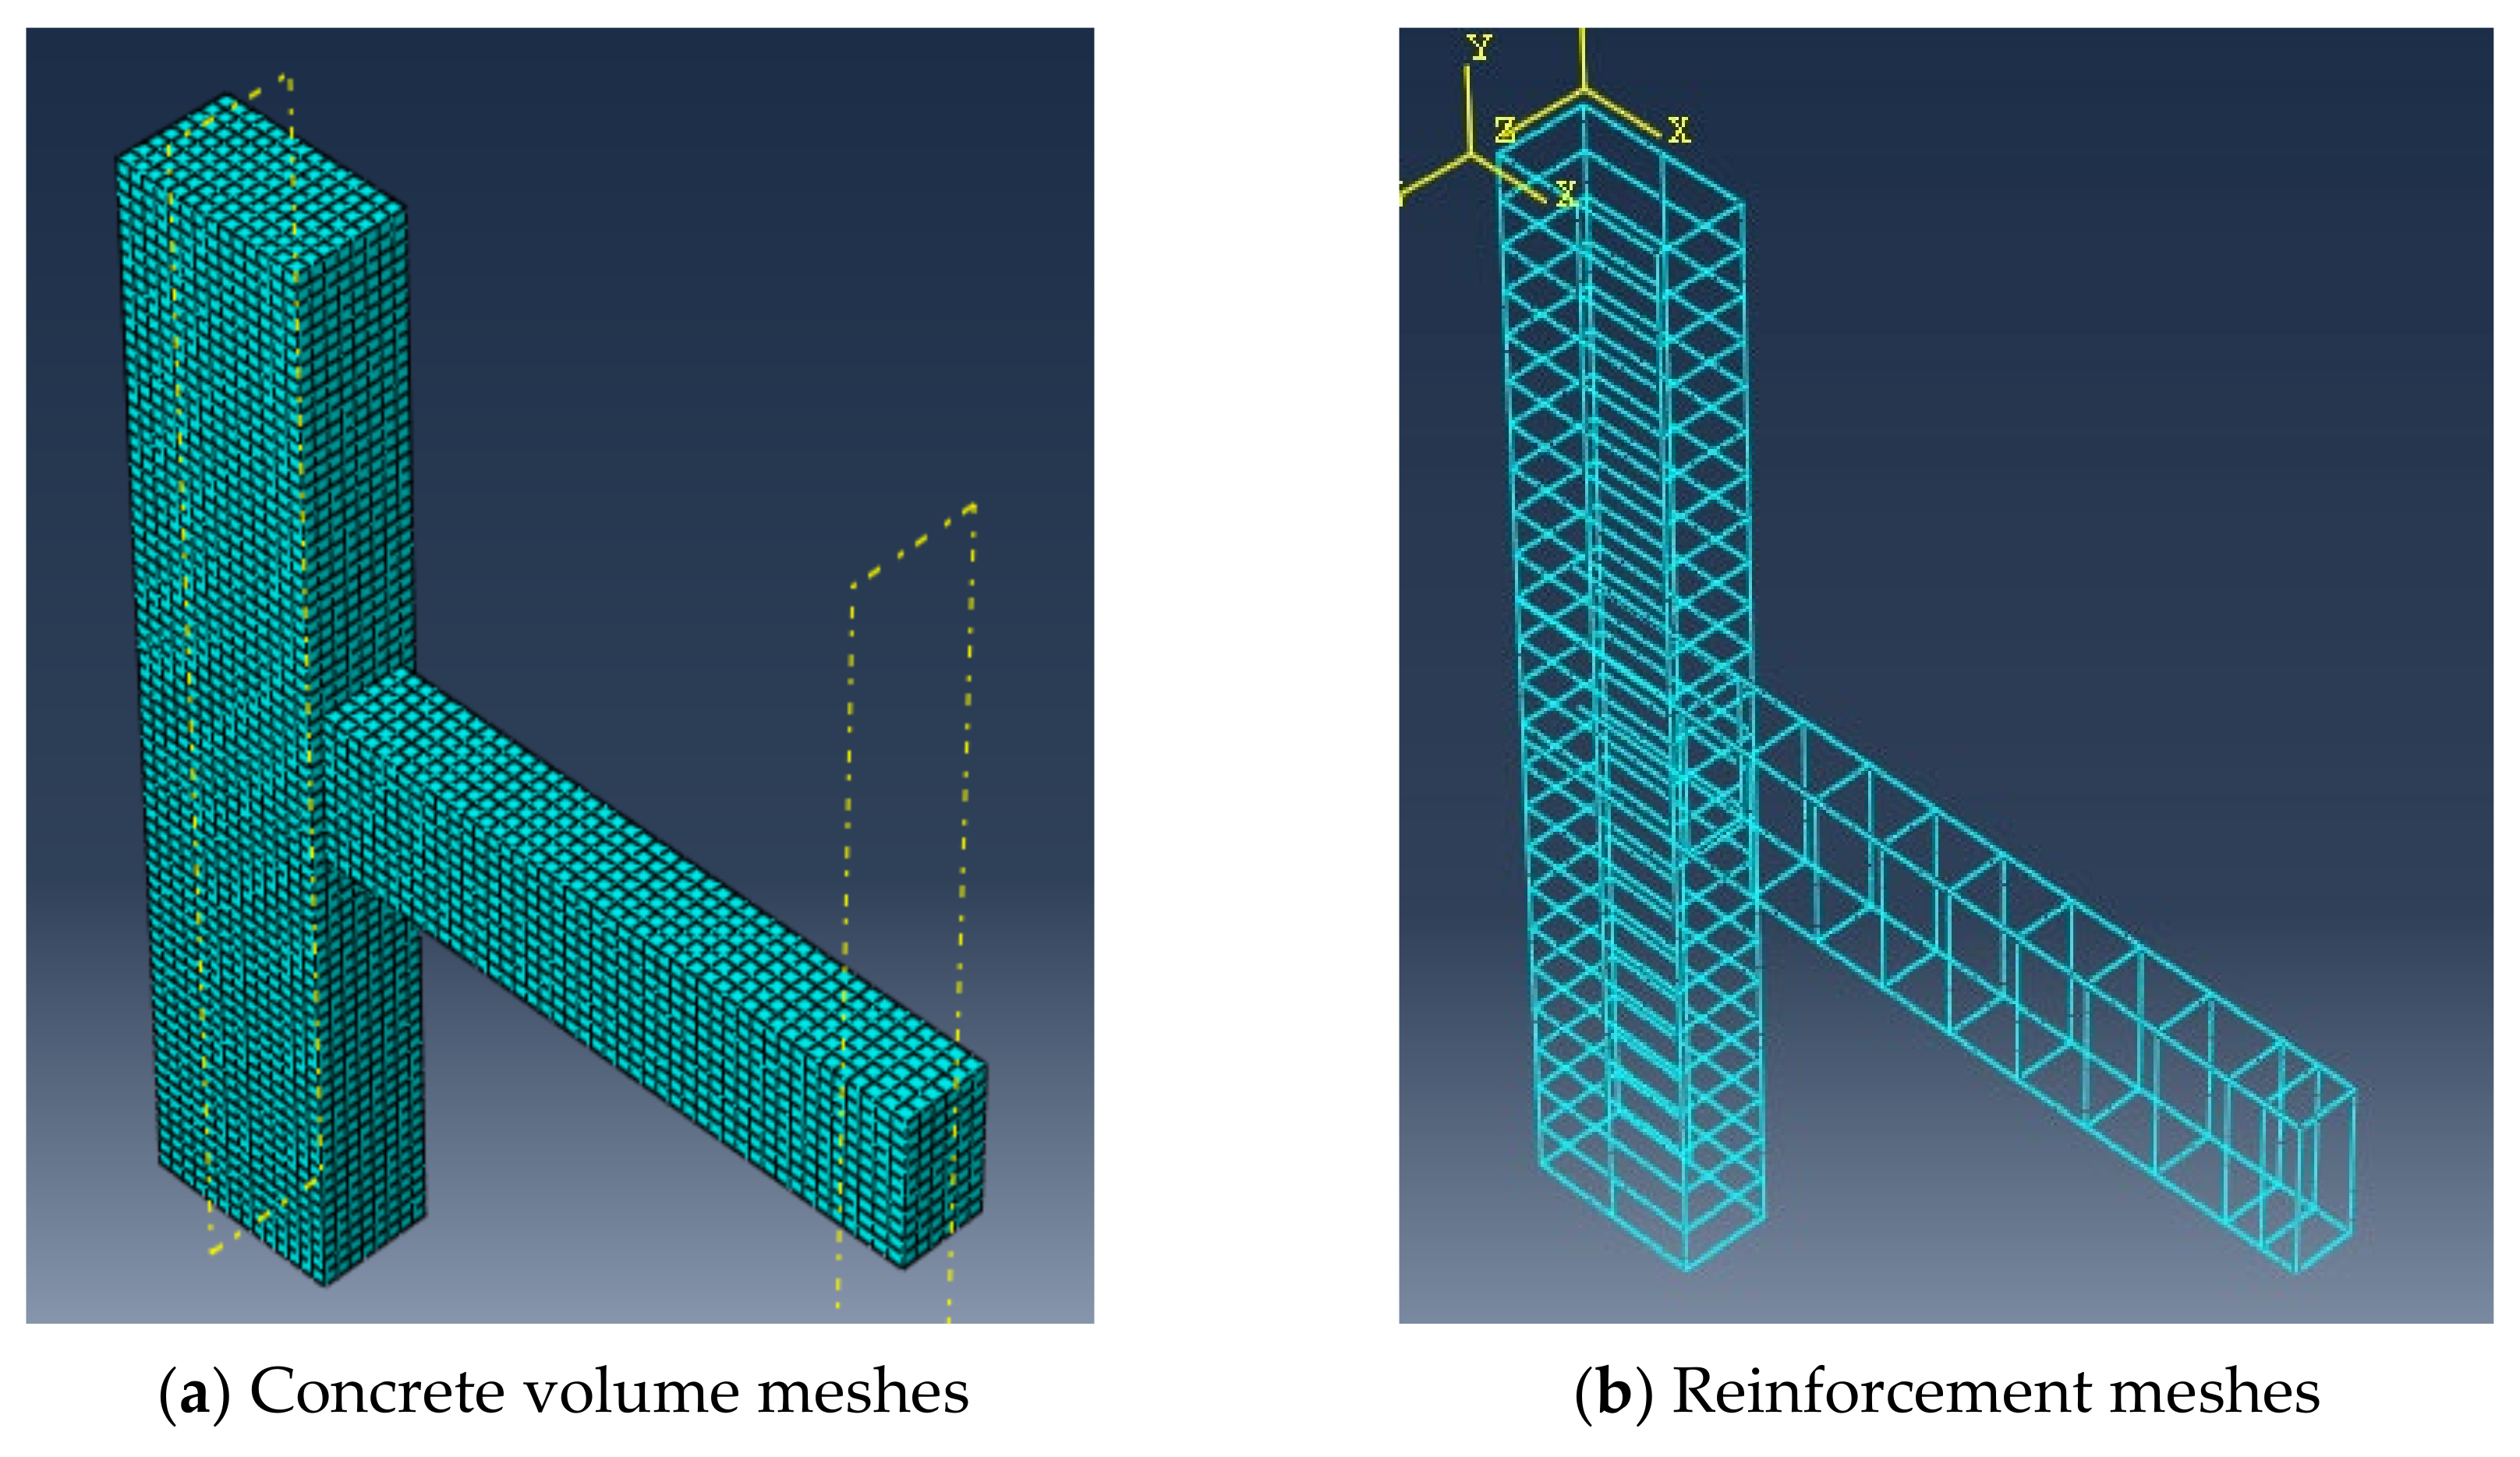
6.4. The Finite Element Mesh
7. Conclusions
Author Contributions
Funding
Institutional Review Board Statement
Informed Consent Statement
Data Availability Statement
Conflicts of Interest
References
- Abbass, A.; Abid, S.; Ozakça, M. Experimental Investigation on the Effect of Steel Fibers on the Flexural Behavior and Ductility of High-Strength Concrete Hollow Beams. J. Adv. Civ. Eng. 2019, 2019, 1–13. [Google Scholar] [CrossRef]
- Schlaich, J.; Schäfer, K. Konstruieren im Stahlbetonbau, Beton Kalender, Part 2; Ernest and Son: Berlin, Germany, 2001; pp. 311–492. ISBN 9783433015834. [Google Scholar]
- Gustavo, J.; Parra, M.; Sean, W.P.; Shih-Ho, C. Highly Damage-Tolerant Beam-Column Joints Through Use of High-Performance Fiber-Reinforced Cement Composites. ACI Struct. J. 2005, 102, 487–495. [Google Scholar]
- ACI-ASCE Joint Committee 352. Recommendations for Design of Beam-Column Joints in Monolithic Reinforced Concrete Structures; American Concrete Institute: Farmington Hills, MI, USA, 2019; p. 37. [Google Scholar]
- Chalioris, C.E.; Favvata, M.J.; Karayannis, C.G. Reinforced Concrete Beam-Column Joints with Crossed Inclined Bars under Cyclic Deformations. Earthq. Eng. Struct. Dyn. J. 2008, 37, 881–897. [Google Scholar] [CrossRef]
- Shannag, M.J.; Abu-Dyya, N.; Abu-Farsakh, G. Lateral Load Response of High Performance Fiber Reinforced Concrete Beam-Column Joints. Constr. Build. Mater. J. 2005, 19, 500–508. [Google Scholar] [CrossRef]
- Ghobarah, A.; Said, A. Seismic Rehabilitation of Beam-Column Joints Using FRP Laminates. J. Earthq. Eng. 2001, 5, 113–129. [Google Scholar] [CrossRef]
- Karayannis, C.G.; Sirkelis, G.M. Effectiveness of RC Beam-Column Connections Strengthening Using Carbon-FRP Jackets. In Proceedings of the 12th European Conference on Earthquake Engineering, London, UK, 9–13 September 2002; p. 549. [Google Scholar]
- Karayannis, C.G.; Sirkelis, G.M. Response of Columns and Joints with Spiral Shear Reinforcement. In Proceedings of the 12th Computational Methods and Experimental Measurements (CMEM), Wessex Institute of Technology, Malta, 20–22 June 2005. [Google Scholar]
- Paulay, T.; Park, R. Joints in Reinforced Concrete Frames Designed for Earthquake Resistance: A Report Prepared for a US-New Zealand-Japan Seminar, 30 July–1 August 1984, Monterey, California; Department of Civil Engineering, University of Canterbury: Christchurch, New Zealand, 1948. [Google Scholar]
- Bertero, V.V.; Popov, E.P.; Forzani, B. Seismic Behavior of Lightweight Concrete Beam-Column Subassemblages. ACI J. 1980, 87, 44–52. [Google Scholar]
- Ricardo, N.F.; Hugo, C.; Gonçalo, G.; Onatas, V. Experimental evaluation of lightweight aggregate concrete beam-column joints with different strengths and reinforcement ratios. Struct. Concr. 2017, 18, 1–12. [Google Scholar]
- Nawaz, W.A.; Abdalla, J.A.; Hawileh, R.A.; Alajmani, H.S. Experimental study on the shear strength of reinforced concrete beams cast with Lava lightweight aggregates. Arch. Civ. Mech. Eng. 2019, 19, 981–996. [Google Scholar] [CrossRef]
- Azariani, H.R.; Shariatmadar, H.; Esfahani, M.R. Exterior Concrete Beam-Column Connection Reinforced with Glass Fiber Reinforced Polymers (GFRP) Bars Under Cyclic Loading. AUT J. Civ. Eng. 2018, 2, 161–176. [Google Scholar] [CrossRef]
- Ghomi, S.J.; El-Salakawy, E.F. Seismic Performance of Interior GFRP-RC Beam-Column Joints. In Proceedings of the 13th International Symposium on Fiber-Reinforced Polymer Reinforcement for Concrete Structures, Anaheim, CA, USA, 15–19 October 2017; ACI Special Publication. American Concrete Institute: Farmington, MI, USA, 2017; pp. 163–180. [Google Scholar]
- Mady, M.; El-Ragaby, A.; El-Salakawy, E.F. Seismic Behavior of Beam-Column Joints Reinforced with GFRP Bars and Stirrups. J. Compos. Constr. 2011, 6, 875–886. [Google Scholar] [CrossRef]
- Mady, M.; El-Ragaby, A.; El-Salakawy, E.F. Experimental Investigation on the Seismic Performance of Beam-Column Joints Reinforced with GFRP Bars. J. Earthq. Eng. 2011, 15, 7798. [Google Scholar] [CrossRef]
- Sharbatdar, M.K.; Saatcioglu, M.; Benmokrane, B. Seismic Flexural Behavior of Concrete Connections Reinforced with CFRP Bars and Grids. J. Compos. Struct. 2011, 93, 2439–2449. [Google Scholar] [CrossRef]
- Ghomi, S.J.; El-Salakawy, E.F. Seismic Behavior of Exterior GFRP-RC Beam-Column Connections. J. Compos. Constr. 2018, 22, 1–13. [Google Scholar] [CrossRef]
- Mamaghani, M.A.; Khaloo, A. Seismic Behavior of Concrete Moment Frame Reinforced with GFRP Bars. J. Compos. Part B Eng. 2019, 163, 324–338. [Google Scholar] [CrossRef]
- Hopartean, G.; Donchev, T.; Petkova, D.; Costas, G.; Mukesh Limbachiya, M.; Parnada, N. Experimental Testing of Medium Scale GFRP Reinforced Concrete Frames. Issue MATEC Web Conf. 2019, 289, 04004. [Google Scholar] [CrossRef]
- Yang, K.H.; Mun, J.H. Cyclic Flexural and Shear Performances of Beam Elements with Longitudinal Glass Fiber Reinforced Polymer (GFRP) Bars in Exterior Beam-Column Connections. J. Appl. Sci. 2018, 8, 2353. [Google Scholar] [CrossRef] [Green Version]
- Hasaballa, M.; El-Salakawy, E.F. Anchorage Performance of GFRP Headed and Bent Bars in Beam-Column Joints Subjected to Seismic Loading. J. Compos. Constr. 2018, 22, 1–14. [Google Scholar] [CrossRef]
- Ghomi, S.J.; El-Salakawy, E.F. Effect of Geometrical Configuration on Seismic Behavior of GFRP-RC Beam-Column Joints. J. Adv. Concr. Constr. 2020, 9, 313–326. [Google Scholar] [CrossRef]
- Gajendra; Kulkarni, D.K. K. Seismic Evaluation of Beam-Column Joints Using GFRP Bars in Multi-Story Building Using Etabs. Int. Res. J. Eng. Technol. (IRJET) 2015, 2, 91–95. [Google Scholar]
- Hasaballa, M.; El-Salakawy, E.F. Shear Capacity of Exterior Beam-Column Joints Reinforced with GFRP Bars and Stirrups. J. Compos. Constr. 2016, 20, 1–13. [Google Scholar] [CrossRef]
- El-Zareef, M.A.M. Conceptual and Structural Design of Buildings made of Lightweight and Infra-Lightweight Concrete. Master’s Thesis, Technische University, Berlin, Germany, 2010. [Google Scholar]
- Chalioris, C.E.; Kosmidou, P.M.K.; Karayannis, C.G. Cyclic Response of Steel Fiber Reinforced Concrete Slender Beams: An Experimental Study. Materials 2019, 12, 1398. [Google Scholar] [CrossRef] [PubMed] [Green Version]
- Kytinou, V.K.; Chalioris, C.E.; Karayannis, C.G.; Elenas, A. Effect of steel fibers on the hysteretic performance of concrete beams with steel reinforcement-Tests and analysis. Materials 2020, 13, 2923. [Google Scholar] [CrossRef] [PubMed]
- American Concrete Institute. Building Code Requirements for Reinforced Concrete, ACI318-99; American Concrete Institute: Detroit, MI, USA, 2019. [Google Scholar]
- Ministry of Housing and Development, Housing and Building National Research Centre. Egyptian Code of Practice for Design and Construction of Concrete Structures, ECP-RC; Ministry of Housing and Development, Housing and Building National Research Centre: Cairo, Egypt, 2007. [Google Scholar]
- STANDARDS NEW ZEALAND (NZS 3101); Concrete Structures Standard-Amendment 1, 2 and 3; Standards New Zealand: Wellington, New Zealand, 2017.
- Dassault Systems Corp. ABAQUS: Abaqus Analysis User’s Manual, Version 6.9; Dassault Systems Corp: Providence, RI, USA, 2014. [Google Scholar]
- Newman, J.B. Properties of Structural Lightweight Concrete in Structural Lightweight Concrete; Clarke, J.L., Ed.; Chapman & Hall: London, UK, 1993; pp. 19–44. [Google Scholar]


| Material Properties | CS | GFRP | |
|---|---|---|---|
| Tensile strength, ft | 550 | 1000 | MPa |
| Characteristic yield strength, fy | 500 | - | MPa |
| Designed yield strength, fyd | 435 | - | MPa |
| Strain yield stress, εy | 2.18 | - | mm/m |
| Elasticity modulus, E | 2 × 10⁵ | 6 × 10⁴ | MPa |
| Mix. No. | Weight (Kg) | ||||||||
|---|---|---|---|---|---|---|---|---|---|
| Cement CEMI 52.5 | Silica Fume | Sand * 0/2 | Liapor * 2/9E | Liapor * 6/5 | Dolomite (10 mm) | Water | Super-Plasticizer | SF% | |
| 1 | 400 | 32 | 333 | 59 | 425 | - | 255 | 4.0 | 0.0 |
| 2 | 400 | 32 | 333 | 59 | 425 | - | 255 | 4.0 | 0.75 |
| 3 | 400 | 32 | 333 | 59 | 425 | - | 255 | 4.0 | 1.50 |
| 4 | 500 | - | 595 | - | - | 1105 | 215 | - | 0.0 |
| Mix. No. | SF% | fc`(MPa) | St. Deviation | ft (MPa) | St. Deviation | fcu (MPa) | St. Deviation | Ec (MPa) | St. Deviation |
|---|---|---|---|---|---|---|---|---|---|
| 1 | 0.0 | 42 | 0.07 | 2.29 | 0.07 | 53 | 0.06 | 25,622 | 0.10 |
| 2 | 0.75 | 49 | 0.11 | 2.89 | 0.11 | 61 | 0.10 | 28,000 | 0.11 |
| 3 | 1.50 | 51 | 0.13 | 3.97 | 0.12 | 64 | 0.13 | 27,600 | 0.12 |
| 4 | 0.0 | 32 | 0.05 | 2.90 | 0.04 | 40 | 0.04 | 24,890 | 0.08 |
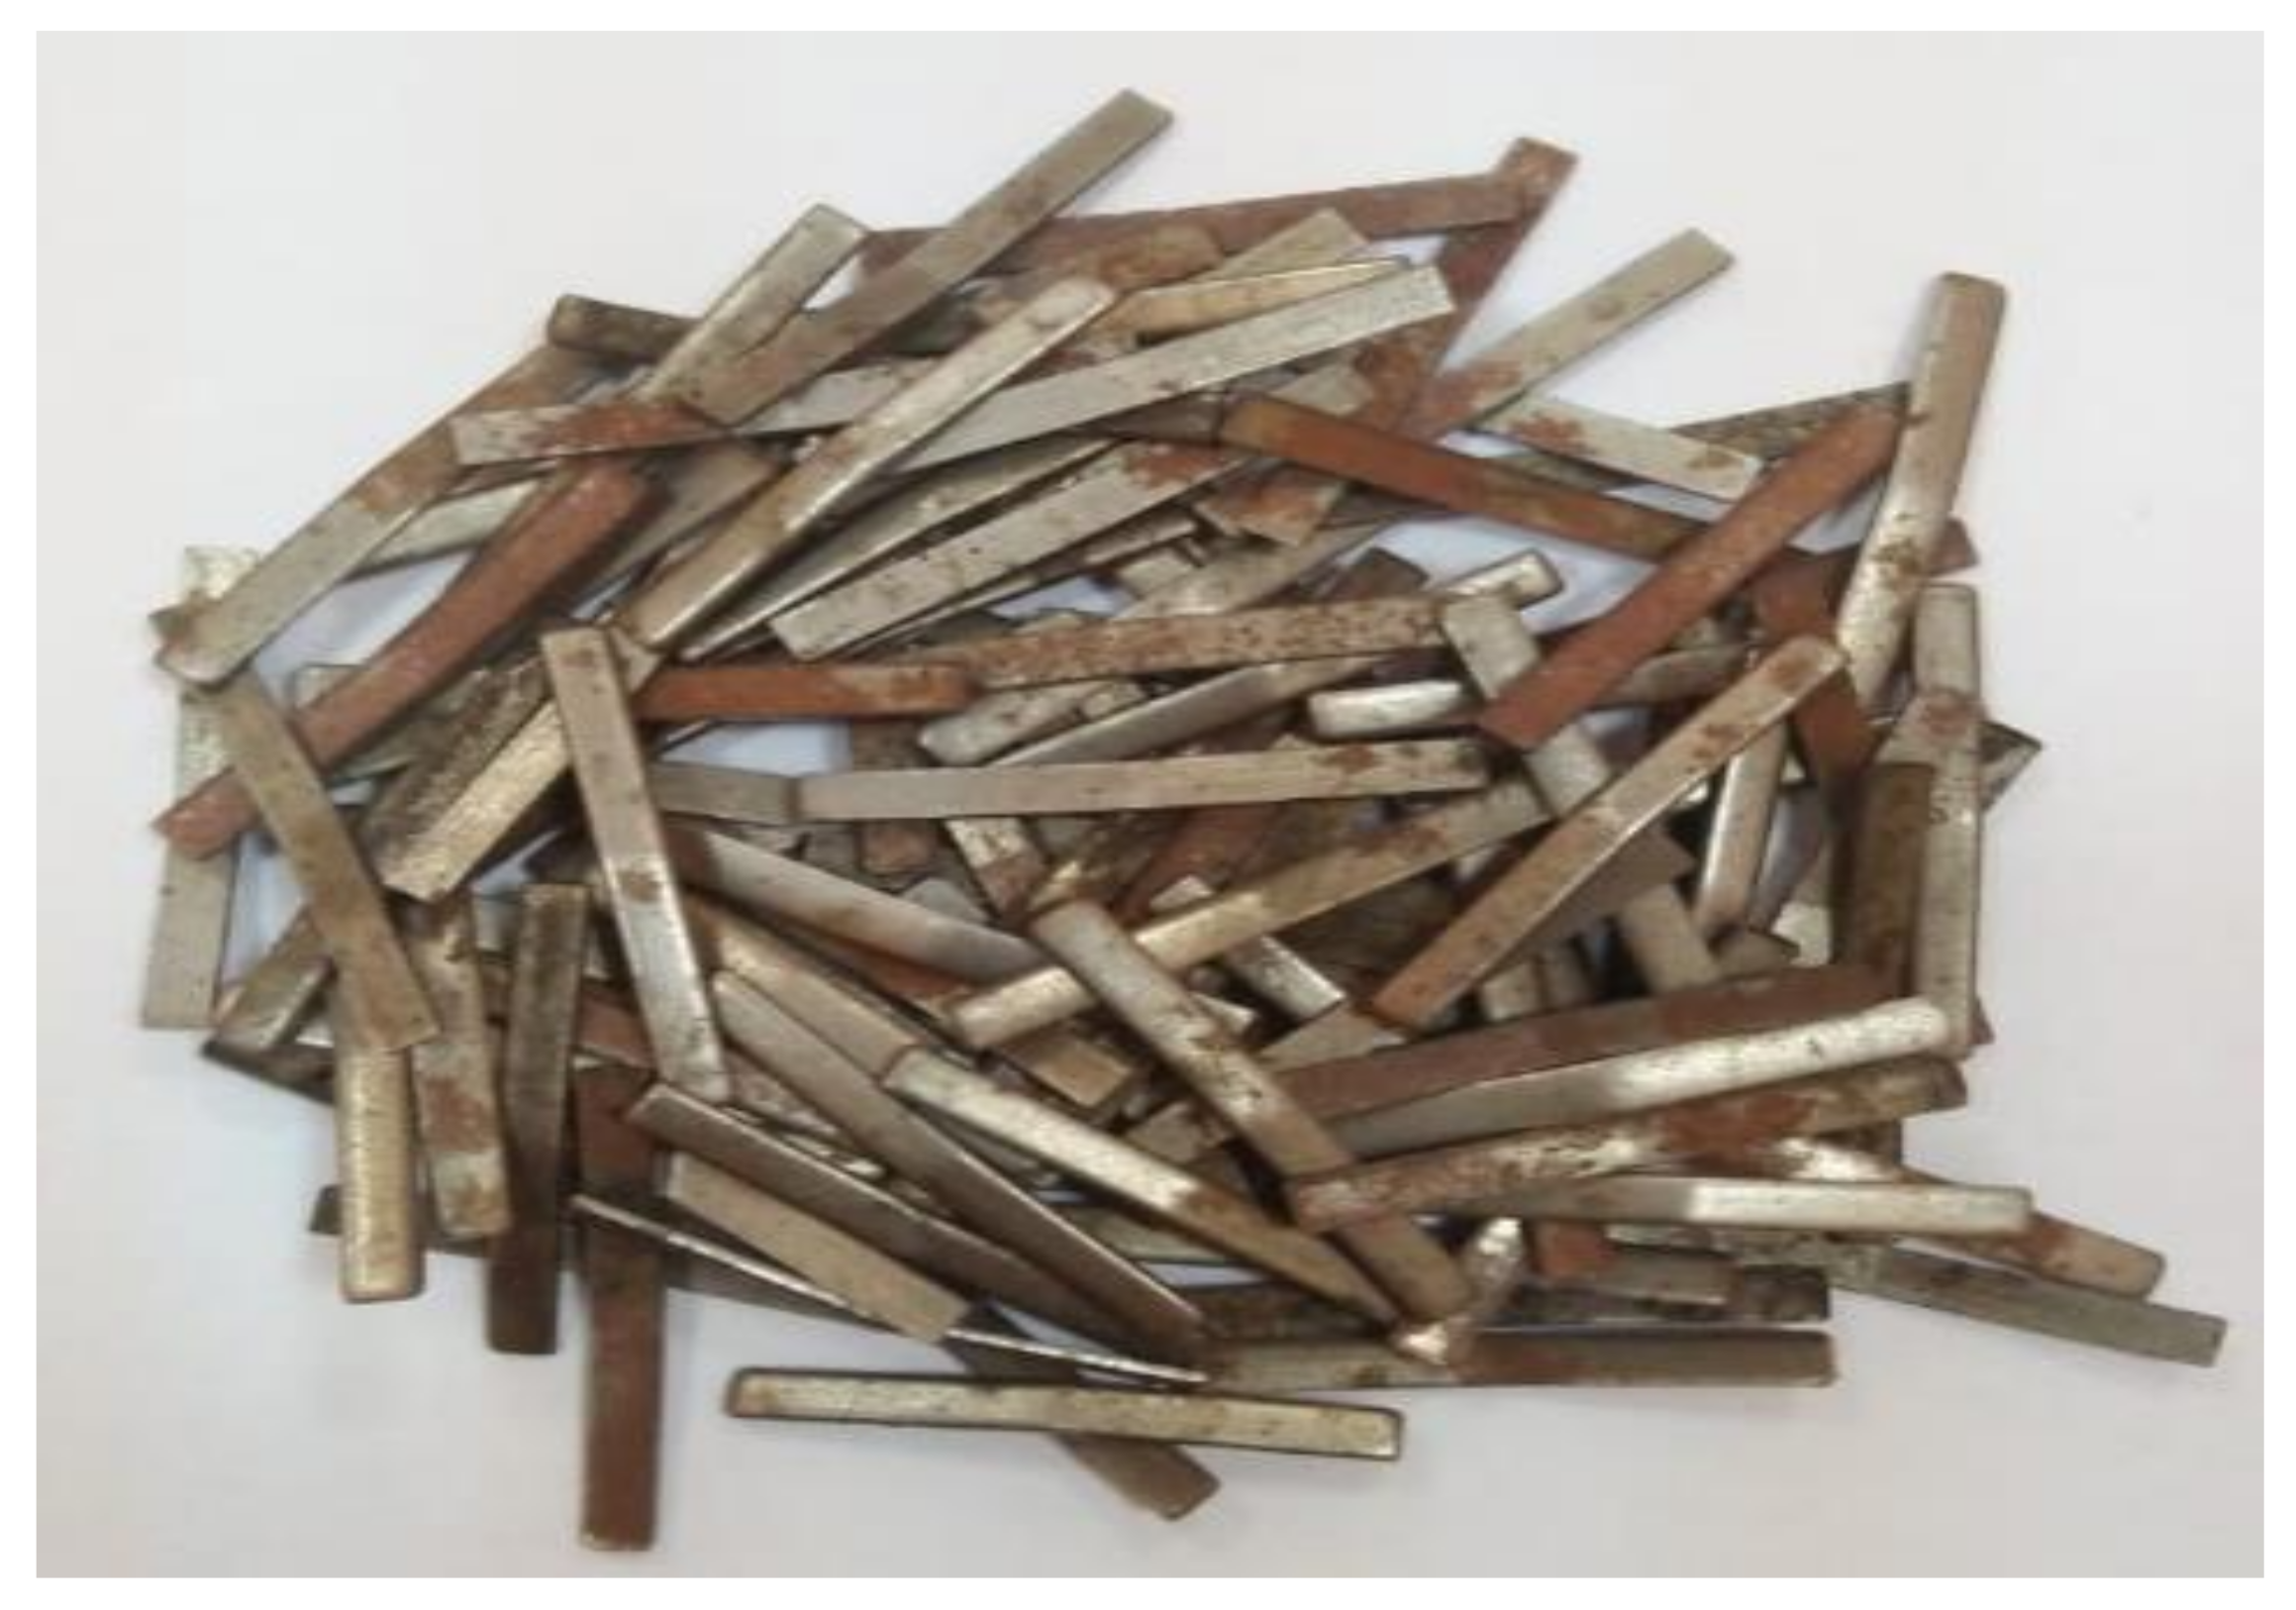
| Length (mm) | Thickness (mm) | Tensile Strength (MPa) | Elastic Modulus (GPa) | Density (g/cm3) | Elongation% | Aspect Ratio (Length/Thickness) |
|---|---|---|---|---|---|---|
| 50 | 0.5 | 1620 | 42.80 | 1.3 | 7.0 | 100 |
| Specimen | Mix. No. | SF% | Beams | Column | ||
|---|---|---|---|---|---|---|
| Top and Bottom Bars | Stirrups (CS) | Longitudinal Bars (CS) | Stirrups (CS) | |||
| BC1 (control) | 4 | 0.0 | 2D14 mm (CS) | D8 @100 mm | 8D18 | D10 @100 mm |
| BCH10 | 1 | 0.0 | 2G14 mm(GFRP) | D8 @100 mm | 8D18 | D10 @100 mm |
| BCH20 | 1 | 0.0 | 3G14 mm(GFRP) | D8 @100 mm | 8D18 | D10 @100 mm |
| BCH30 | 1 | 0.0 | 4G14 mm(GFRP) | D8 @100 mm | 8D18 | D10 @100 mm |
| BC2 (control) | 4 | 0.0 | 3D14 mm(CS) | D8 @100 mm | 8D18 | D10 @100 mm |
| BCH11 | 2 | 0.75 | 2G14 mm(GFRP) | D8 @100 mm | 8D18 | D10 @100 mm |
| BCH21 | 2 | 0.75 | 3G14 mm(GFRP) | D8 @100 mm | 8D18 | D10 @100 mm |
| BCH31 | 2 | 0.75 | 4G14 mm(GFRP) | D8 @100 mm | 8D18 | D10 @100 mm |
| BC3 (control) | 4 | 0.0 | 4D14 mm(CS) | D8 @100 mm | 8D18 | D10 @100 mm |
| BCH12 | 3 | 1.50 | 2G14 mm(GFRP) | D8 @100 mm | 8D18 | D10 @100 mm |
| BCH22 | 3 | 1.50 | 3G14 mm(GFRP) | D8 @100 mm | 8D18 | D10 @100 mm |
| BCH32 | 3 | 1.50 | 4G14 mm(GFRP) | D8 @100 mm | 8D18 | D10 @100 mm |
| Specimen | SF% | Experimental Test Results | ||||
|---|---|---|---|---|---|---|
| Pcr (kN) | Py (kN) | δL (mm) | Pu (kN) | δu (mm) | ||
| BC1 (control) | 0 | 39.44 | 194.4 | 14.40 | 226.0 | 82.96 |
| BCH10 | 0.0 | 49.3 | - | 18.00 | 282.6 | 103.70 |
| BCH11 | 0.75 | 56.1 | - | 21.60 | 306.0 | 141.10 |
| BCH12 | 1.50 | 68 | - | 21.78 | 351.0 | 145.60 |
| BC2 (control) | 0 | 43.52 | 223.2 | 12.96 | 277.9 | 91.12 |
| BCH20 | 0.0 | 54.4 | - | 16.20 | 347.4 | 113.90 |
| BCH21 | 0.75 | 69.7 | - | 18.90 | 390.6 | 142.10 |
| BCH22 | 1.50 | 76.5 | - | 19.80 | 442.8 | 148.20 |
| BC3 (control) | 0 | 46.24 | 316.8 | 17.28 | 354.2 | 99.28 |
| BCH30 | 0.0 | 57.8 | - | 21.60 | 442.8 | 124.10 |
| BCH31 | 0.75 | 71.4 | - | 23.40 | 469.8 | 142.80 |
| BCH32 | 1.50 | 78.2 | - | 25.20 | 513.0 | 153.00 |
| Specimen | Experimental Test Results | ||
|---|---|---|---|
| I (kN.mm) | μ | ε | |
| BC1 (control) | 6640 | 5.76 | 0.0241 |
| BCH10 | 8300 | 5.72 | 0.0153 |
| BCH11 | 13115 | 6.53 | 0.0168 |
| BCH12 | 15500 | 6.87 | 0.0180 |
| BC2 (control) | 9440 | 7.03 | 0.0231 |
| BCH20 | 11800 | 7.03 | 0.0112 |
| BCH21 | 16400 | 7.38 | 0.0127 |
| BCH22 | 19600 | 7.38 | 0.0145 |
| BC3 (control) | 13520 | 7.75 | 0.0221 |
| BCH30 | 16900 | 7.75 | 0.0074 |
| BCH31 | 20418 | 8.07 | 0.0090 |
| BCH32 | 23600 | 8.10 | 0.0108 |
| Specimen | Experimental Joint Shear Strength VjhE (kN) | Predicted Joint Shear Strength According to Studied International Codes Vjh (kN) | |||||
|---|---|---|---|---|---|---|---|
| ACI 318-19 | Exp./ Code | NZS-07 | Exp./ Code | ECP-07 | Exp./ Code | ||
| BC1 (control) | 169.5 | 208.6 | 0.81 | 183.685 | 0.92 | 190.2 | 0.89 |
| BCH10 | 211.95 | 239.1 | 0.89 | 263.415 | 0.80 | 195.2 | 1.09 |
| BCH11 | 229.5 | 239.1 | 0.96 | 263.415 | 0.87 | 195.2 | 1.18 |
| BCH12 | 263.25 | 239.1 | 1.10 | 263.415 | 1.00 | 195.2 | 1.35 |
| BC2 (control) | 208.425 | 208.6 | 1.00 | 183.685 | 1.13 | 190.2 | 1.10 |
| BCH20 | 260.55 | 258.3 | 1.01 | 307.36 | 0.85 | 210.9 | 1.24 |
| BCH21 | 292.95 | 258.3 | 1.13 | 307.36 | 0.95 | 210.9 | 1.39 |
| BCH22 | 332.1 | 258.3 | 1.29 | 307.36 | 1.08 | 210.9 | 1.57 |
| BC3 (control) | 265.65 | 208.6 | 1.27 | 183.685 | 1.45 | 190.2 | 1.40 |
| BCH30 | 332.1 | 263.2 | 1.26 | 319.855 | 1.04 | 215 | 1.54 |
| BCH31 | 352.35 | 263.2 | 1.34 | 319.855 | 1.10 | 215 | 1.64 |
| BCH32 | 384.75 | 263.2 | 1.46 | 319.855 | 1.20 | 215 | 1.79 |
| Average | 1.13 | Average | 1.03 | Average | 1.35 | ||
| st. deviation | 0.20 | st. deviation | 0.18 | st. deviation | 0.26 | ||
| Specimen | Failure Load, kN | Maximum End Beam’s Vertical Displacement Just Before Failure (mm). | ||
|---|---|---|---|---|
| Finite Element | EXP./Finite Element | Finite Element | EXP./Finite Element | |
| BC1 (control) | 209 | 1.08 | 89 | 0.92 |
| BCH10 | 256 | 1.10 | 117 | 0.88 |
| BCH11 | 268 | 1.14 | 169 | 0.83 |
| BCH12 | 297 | 1.18 | 175 | 0.85 |
| BC2 (control) | 245 | 1.13 | 105 | 0.86 |
| BCH20 | 324 | 1.07 | 132 | 0.85 |
| BCH21 | 378 | 1.03 | 171 | 0.81 |
| BCH22 | 420 | 1.05 | 175 | 0.83 |
| BC3 (control) | 340 | 1.04 | 120 | 0.82 |
| BCH30 | 384 | 1.15 | 144 | 0.86 |
| BCH31 | 390 | 1.20 | 159 | 0.89 |
| BCH32 | 438 | 1.17 | 180 | 0.85 |
Publisher’s Note: MDPI stays neutral with regard to jurisdictional claims in published maps and institutional affiliations. |
© 2022 by the authors. Licensee MDPI, Basel, Switzerland. This article is an open access article distributed under the terms and conditions of the Creative Commons Attribution (CC BY) license (https://creativecommons.org/licenses/by/4.0/).
Share and Cite
El-Mandouh, M.A.; Omar, M.S.; Elnaggar, M.A.; Abd El-Maula, A.S. Cyclic Behavior of High-Strength Lightweight Concrete Exterior Beam-Column Connections Reinforced with GFRP. Buildings 2022, 12, 179. https://doi.org/10.3390/buildings12020179
El-Mandouh MA, Omar MS, Elnaggar MA, Abd El-Maula AS. Cyclic Behavior of High-Strength Lightweight Concrete Exterior Beam-Column Connections Reinforced with GFRP. Buildings. 2022; 12(2):179. https://doi.org/10.3390/buildings12020179
Chicago/Turabian StyleEl-Mandouh, Mahmoud A., Mostafa. S. Omar, Mohamed A. Elnaggar, and Ahmed S. Abd El-Maula. 2022. "Cyclic Behavior of High-Strength Lightweight Concrete Exterior Beam-Column Connections Reinforced with GFRP" Buildings 12, no. 2: 179. https://doi.org/10.3390/buildings12020179