1. Introduction
Over the years, designers have had different opinions on corridors and their importance in a building regarding their functionality and aesthetics. Historically, when corridors were not yet typical features in architectural designs, people moved from one room by crossing through adjoining rooms, which could be disruptive and intrusive.
When corridors were introduced towards the end of the 17th century, their use was heavily influenced by socioeconomic factors, and they were often used to ensure that people from different socioeconomic classes did not have to cross paths. However, modern corridors are considered a key feature in building design, both for their function and aesthetic contribution [
1]. Although corridors serve similar purposes, they should be tailored to fit specific standards based on a building’s size and function.
Two main features define the function and design of a corridor. The first feature concerns the entrance or the opening, which has different types including: (1) unshaded, open exterior corridors; (2) shaded, semi-open exterior corridors, and (3) closed interior corridors.
The second category concerns access points and their distribution in a corridor, such as: (1) a connector corridor with no access points; (2) a single-loaded corridor with access points along one side, and (3) a double-loaded corridor with access points along both sides [
2]).
Energy performance, solar radiation, and daylight are crucial environmental factors in a desert climate, and they present design challenges in terms of environmental comfort and air flow when including open and semi-open corridors. Much of the United Arab Emirates is characterized by a hot and humid climate, so architectural design that provides both aesthetic appeal as well as adaptable thermal control and environmental comfort has been a significant challenge [
3].
In educational facilities, especially at universities, corridors influence the productivity and behavior of students, educators and staff. At institutions of higher education, corridors are typically one the most active spaces at different times of day, as they connect multiple rooms or buildings; therefore, an efficient, practical layout for aesthetic and thermal comfort is essential [
4].
At the University of Sharjah, the semi-open corridors require climate-responsive screens that can take advantage of available natural light throughout the day while maintaining energy efficiency and thermal comfort according to programmed parameters. This study employed parametric modeling to investigate these goals and ensure that the university’s corridors are comfortable and can attract more foot-traffic than alternative routes between buildings and rooms. Improvements in the energy performance were verified by the Estidama Pearl Building Rating System.
2. Research Background
Given the University of Sharjah’s location and challenges due to harsh climate conditions, achieving optimum energy performance is crucial. For example, natural lighting including direct sunlight can affect visual comfort due to glare, shadows, dramatic changes in light levels, and reflections. These factors may cause headaches, fatigue, and nausea, as well as itchy and watery eyes. Without adequate environmental awareness and controls in “daylighting” designs, interior temperatures may increase or decrease too quickly and result in discomfort for the building occupants [
5].
The use of specific parametric designs can help with thermal control and the impact of daylight on a building’s interior temperatures. Parametric designs using dynamic façades that respond to the sun’s movement and weather employ dynamic screens that control the amount of natural light admitted throughout the day. These screens could be applied to windows or as shading in semi-open corridors [
6]. Any design considerations and improvements should be compared against the existing thermal strategies and outcomes as well as validated according to the standards set by the Estidama rating system.
2.1. Case Study: The University of Sharjah
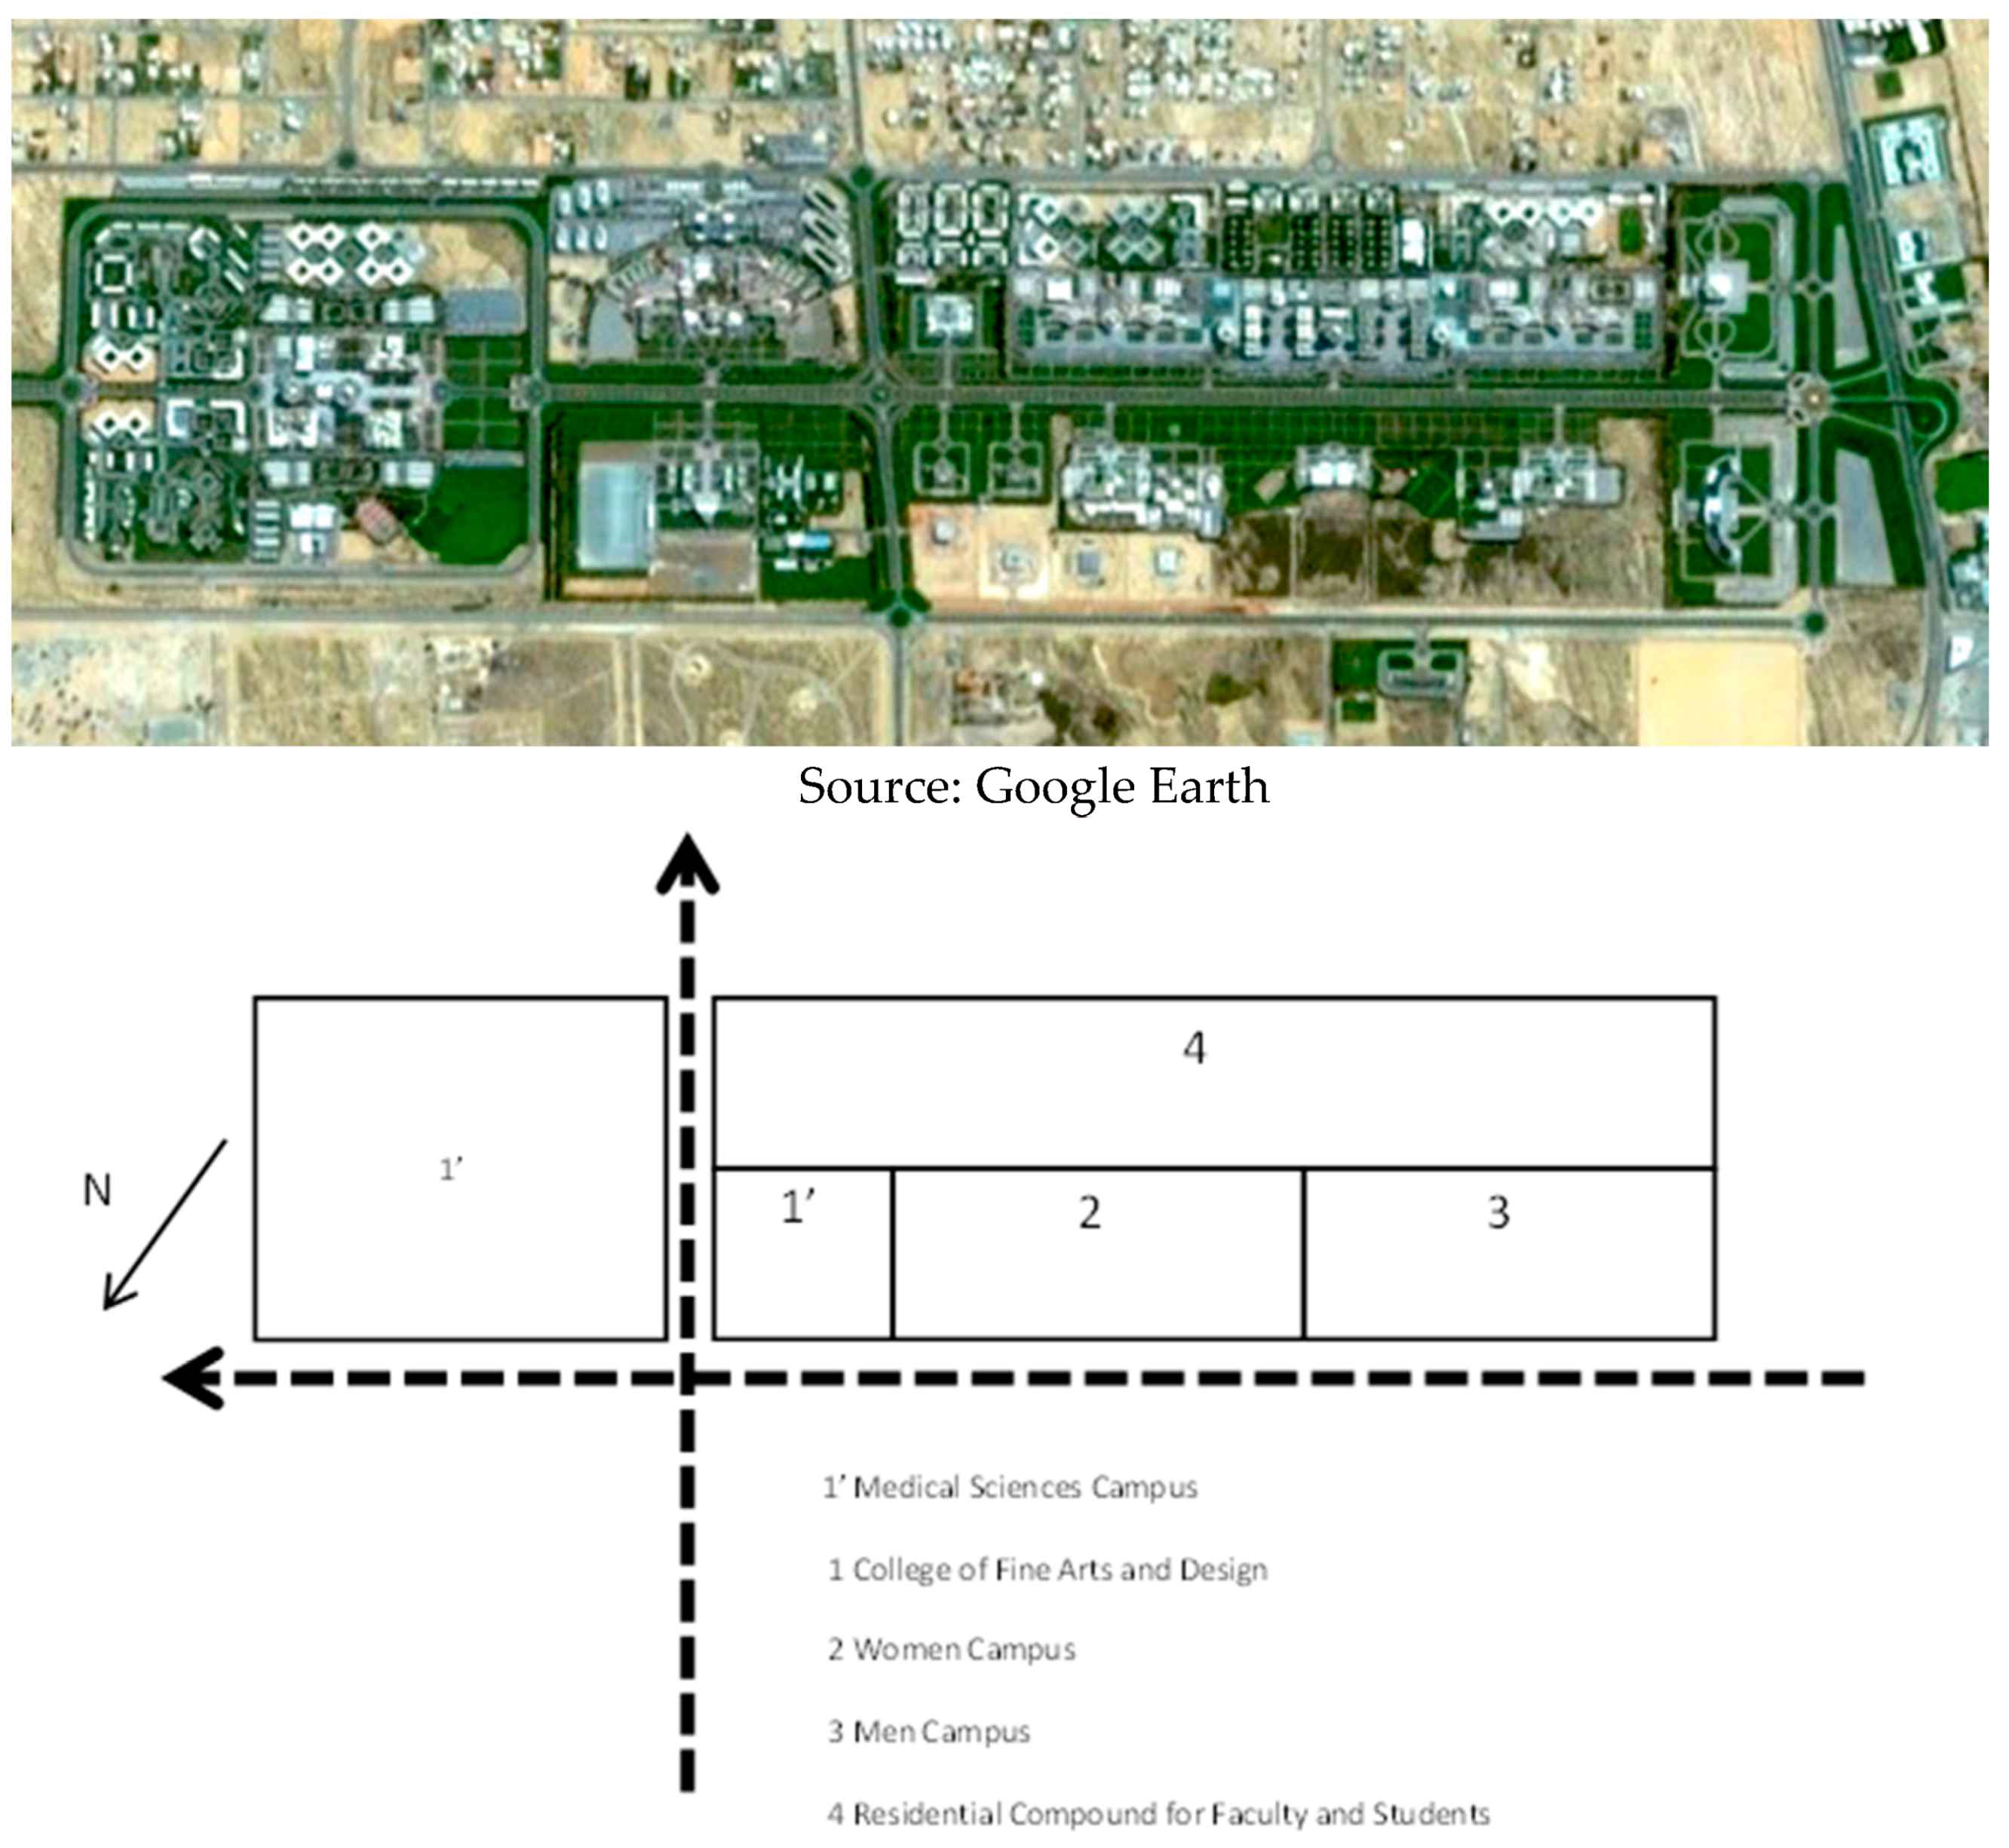
The University of Sharjah is one of the largest universities in the United Arab Emirates, with 14 colleges offering different academic degree programs, of which 55 are bachelor’s degrees, 17 are master of science degrees, and four doctoral degrees. The university currently has 16,982 students enrolled in the various academic programs. All the colleges have been accredited by multiple national and international accreditation boards and have been holistically accredited by the Commission for Academic Accreditation (CAA) of the Ministry of Higher Education and Scientific Research in the United Arab Emirates [
7]). The university compound consists of four campuses: a female campus and a male campus, where each provides access to different colleges, as described in the site plan in
Figure 1.
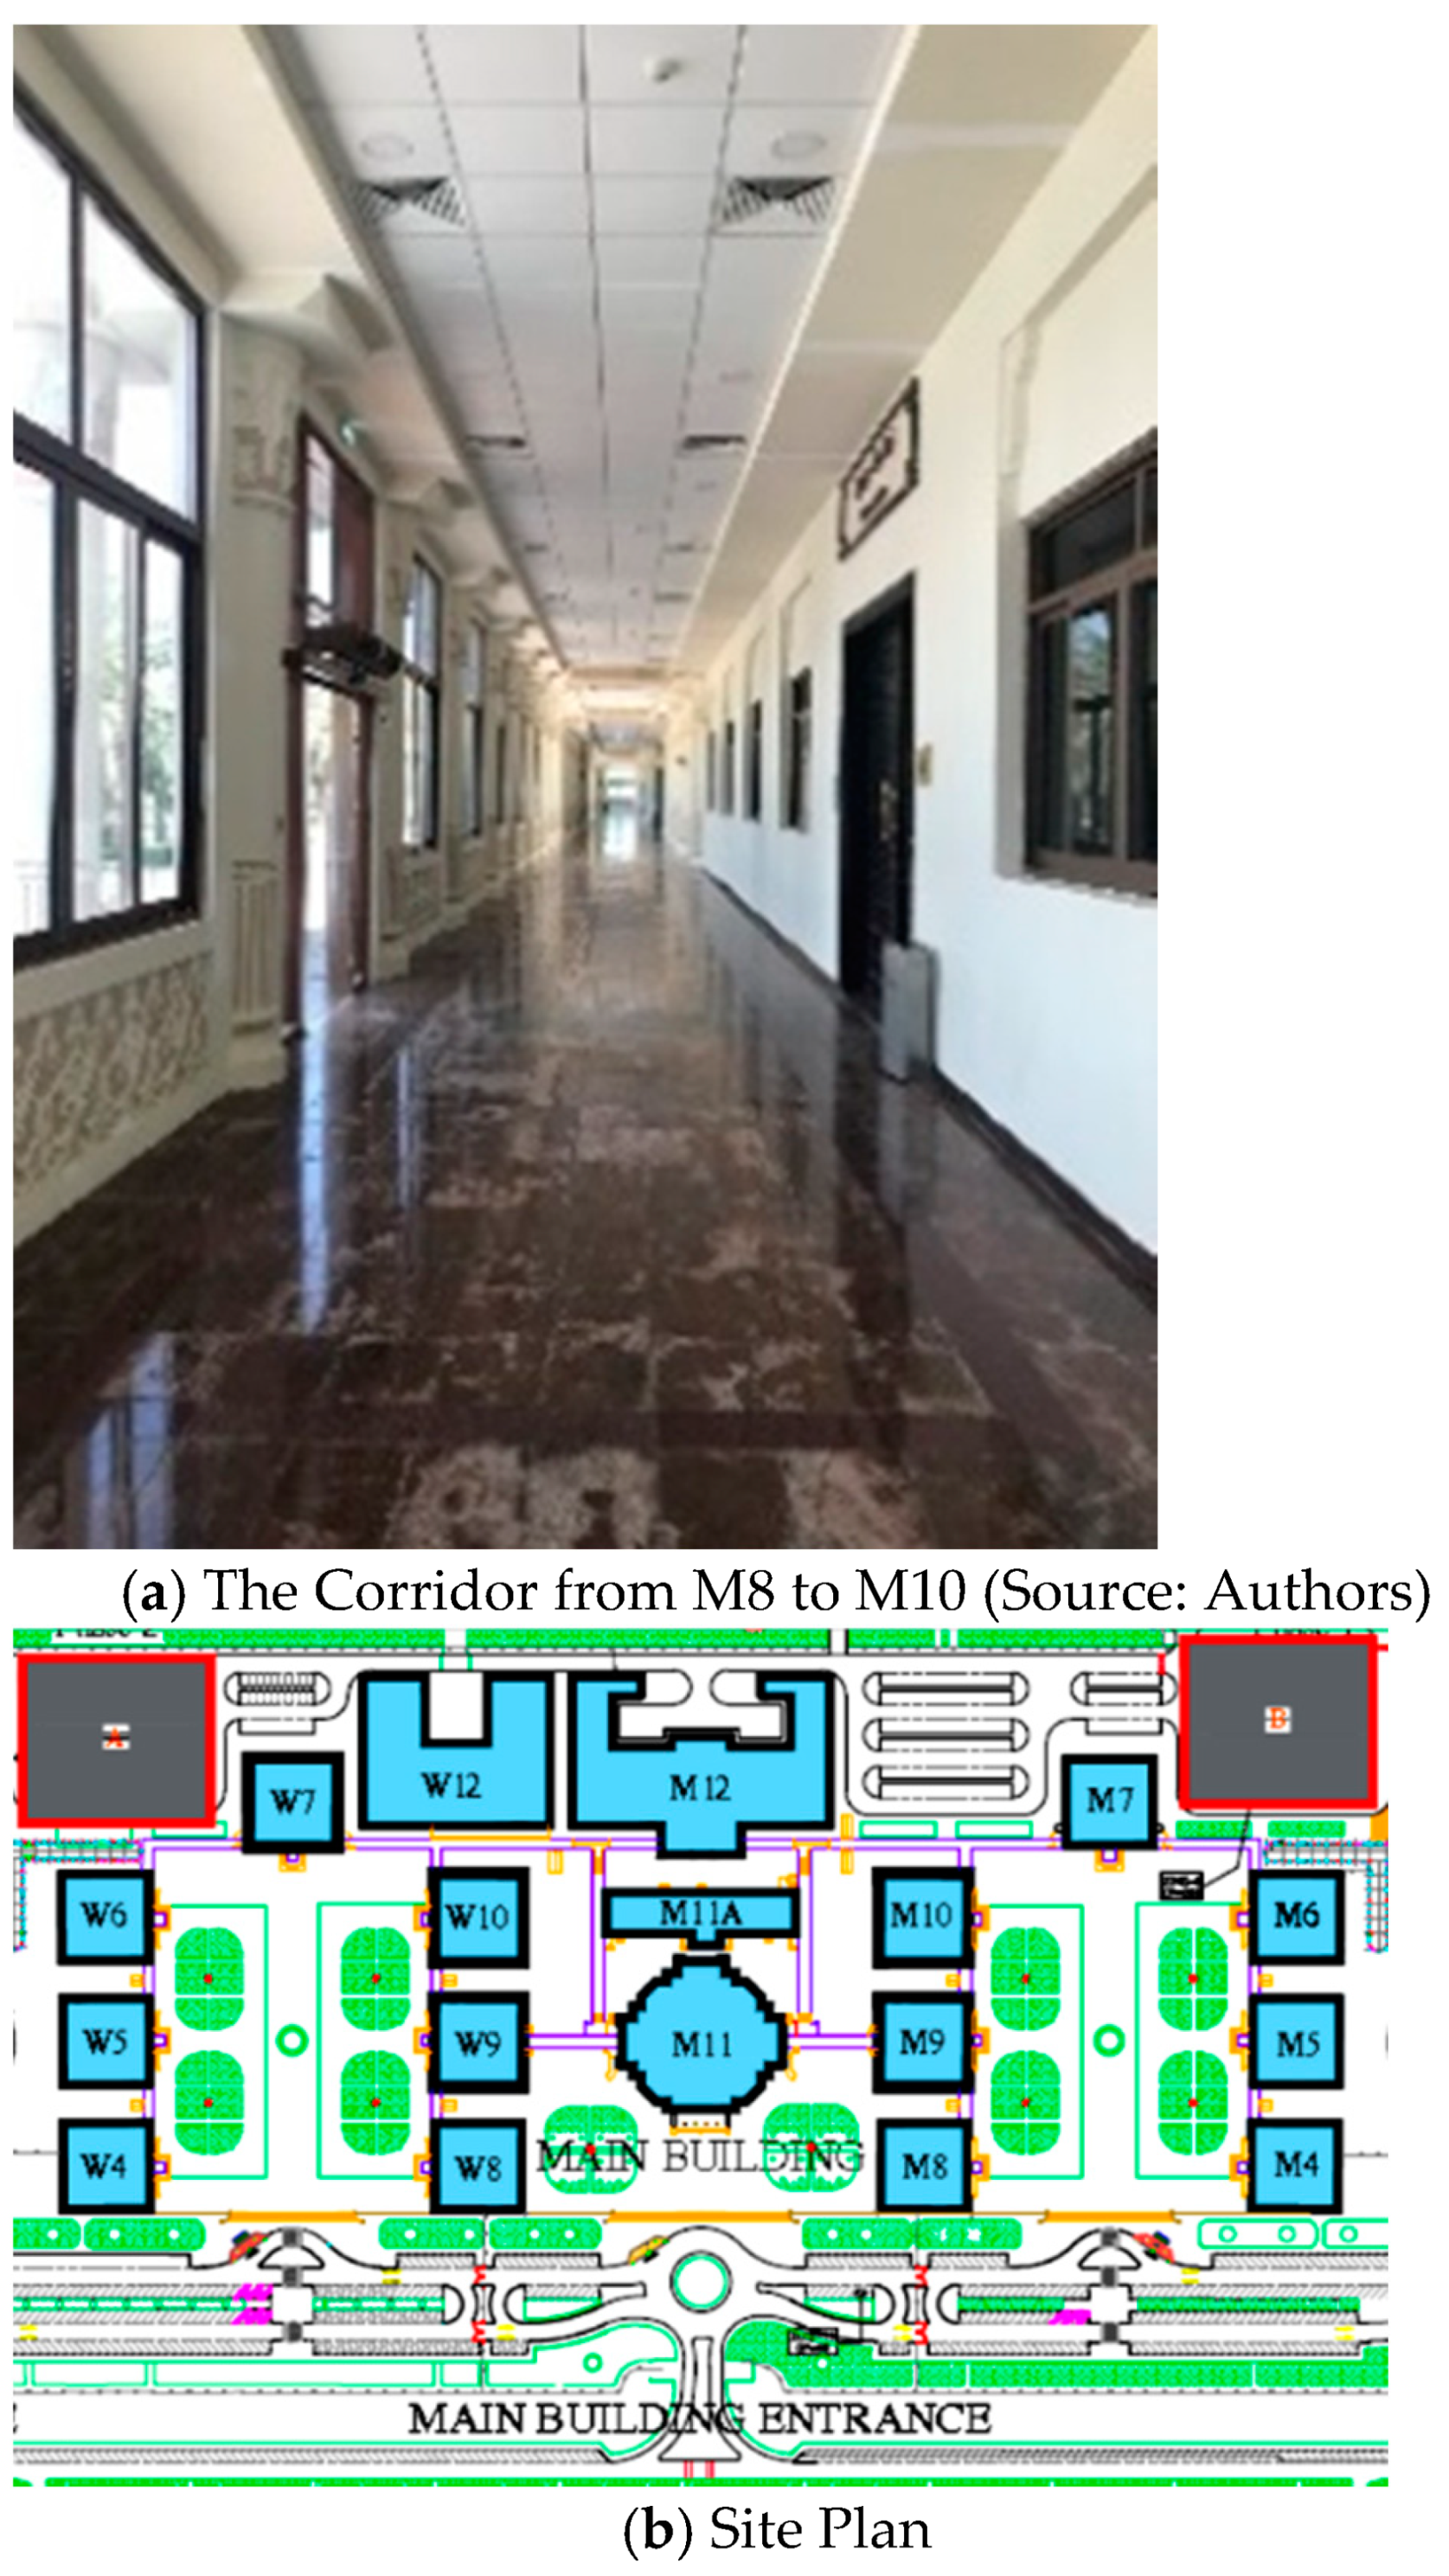
The existing corridors were categorized into two types: single-loaded corridors with an approximate length of 55 m, and double-loaded closed corridors with an approximate length of 30 m. The university has connected the buildings by enclosing all the single-loaded corridors from the male to the female campus (
Figure 2). Accordingly, the corridor connecting the three engineering buildings (M8, M9, and M10) on the male campus was taken as a reference for the study due to its close location to the College of Engineering, one of the busiest corridors at the university. This corridor is approximately 45 m in length by 4.5 m in width, and it provides access between M8 and M10, where temporary facilities and kiosks are most likely to be located (
Figure 3). Given these circumstances and the fact that this was one of the most active corridors on campus, it was essential to improve the environmental performance of this corridor, along with other corridors at the university, to create a walkable campus [
8].
2.2. Parametric Design
The term “parametric design” refers to the practice of digitally modeling a series of design variants whose relationships to each other are defined through one or several mathematical relationships (i.e., parameters) to form a parametric space that may comprise dozens or thousands of related but distinct factors [
9].
Rhinoceros 3D (version 6 and 7, Robert McNeel & Associates, Seattle, WA, USA) is a robust modeling software platform produced by McNeil, which can produce geometries based on lines. Rhinoceros 3D provides accurate performance due to its mathematical definition of lines, as compared to other 3-D modeling software such as Autodesk’s 3ds Max (Max version 2021) [
10].
Grasshopper is a script-based modeling algorithm that offers designers a novel way of specifying their design and controls the design process and automation by defining geometry through mathematical functions. Parametric model generation allows rapid, significant changes to be made to the initial model and to quickly obtain complex shapes through geometrical iterations [
10].
2.3. Environmental Specifications
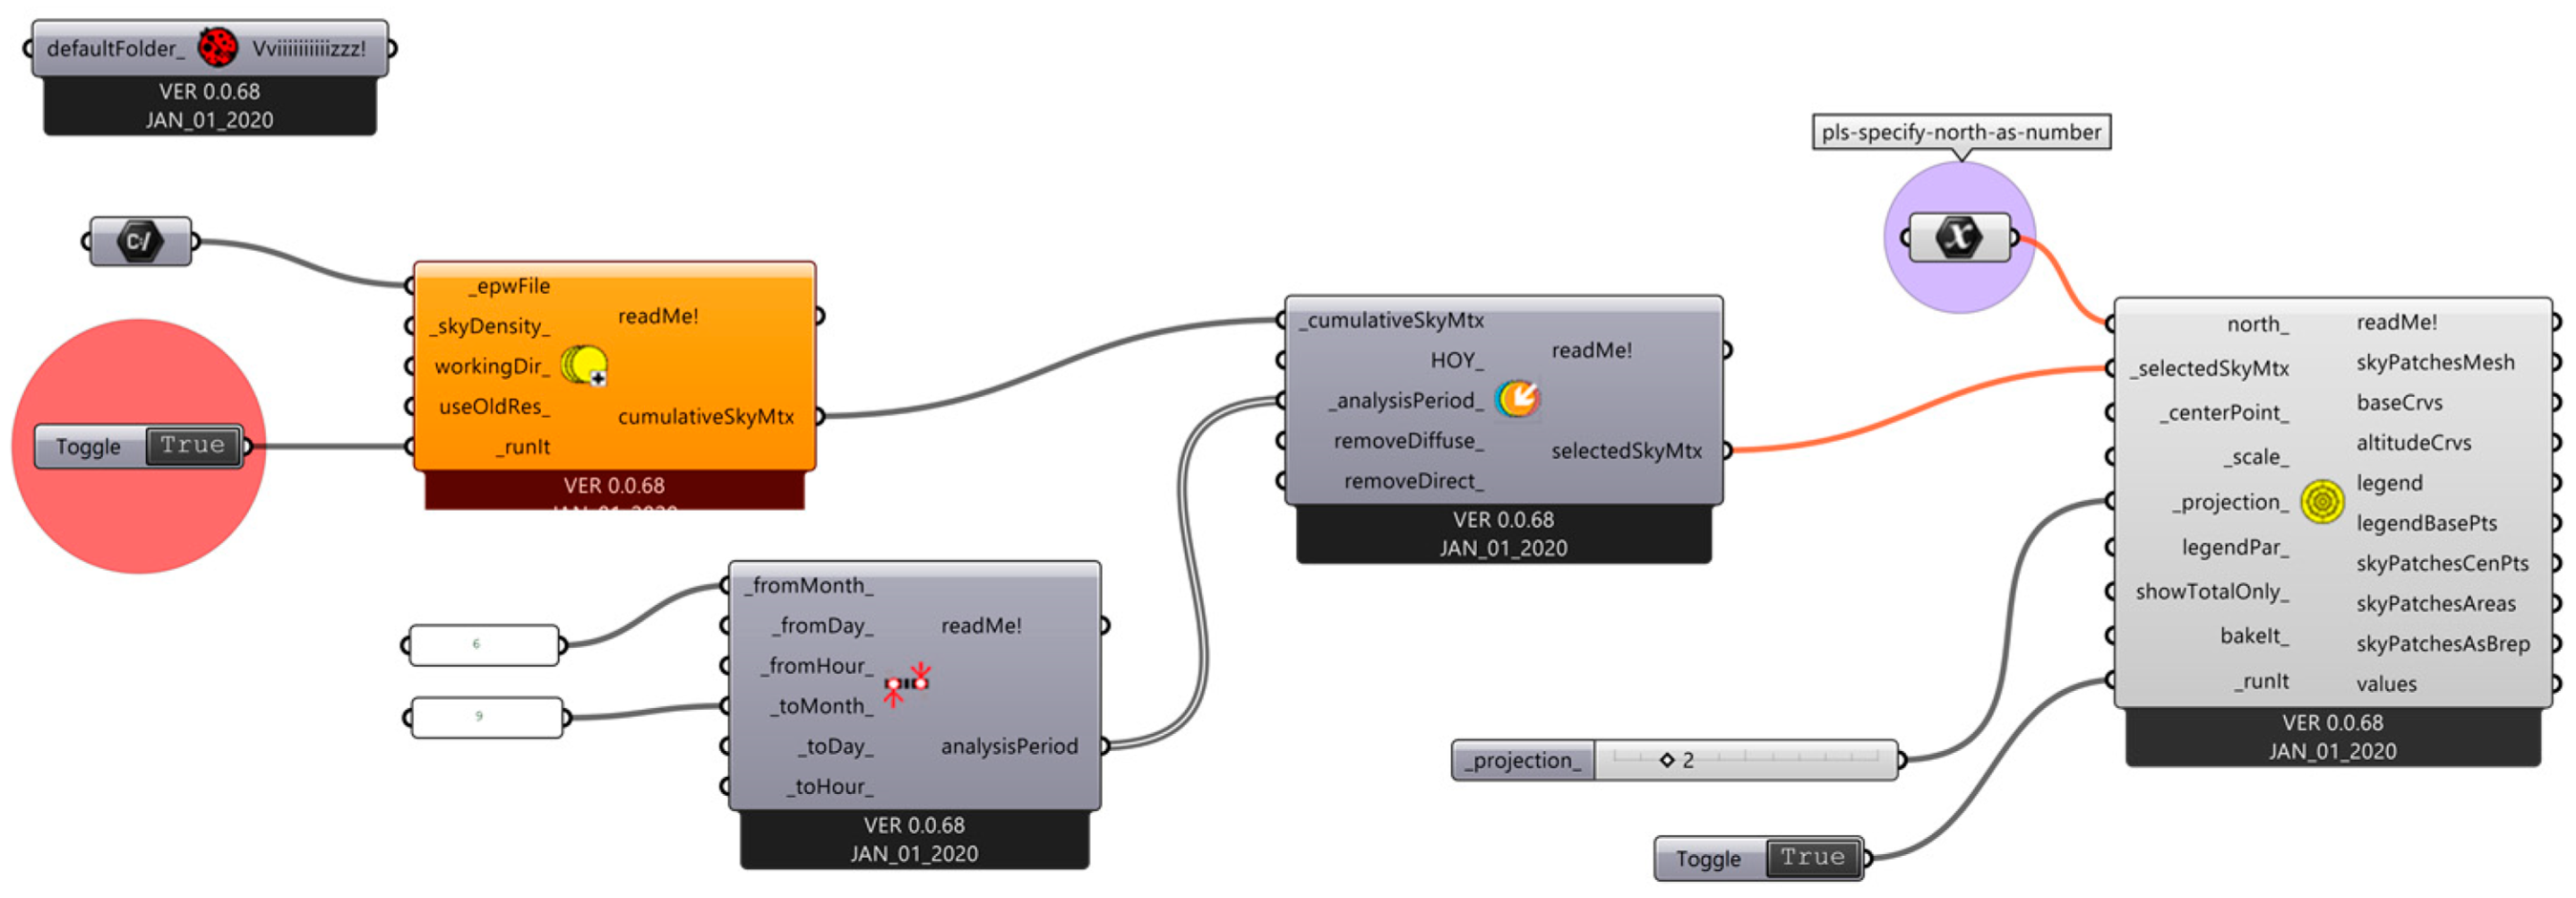
To achieve ideal energy performance and design, and an energy-efficient parametric screen, multiple codes were written to assess variable environmental factors such as sun path, shadows, solar radiation, and wind direction.
The sun is the most significant source of daylight; therefore, it was necessary to understand its movement and positions in the sky as well as its influence on thermal conditions in the corridor. The sun path is a diagram that indicates the sun’s position as it rises and sets throughout the day, providing an estimate of how much daylight a location receives as the earth orbits around the sun [
11].
The sun path diagram in
Figure 4 was obtained via the azimuth and altitude lines that provided an approximation of the sun’s exact location. The annual sun path diagram offers an approximation of the sun’s position throughout the year; therefore, it indicates the peak summer months for which a design should account [
12] (Muneer, 2004).
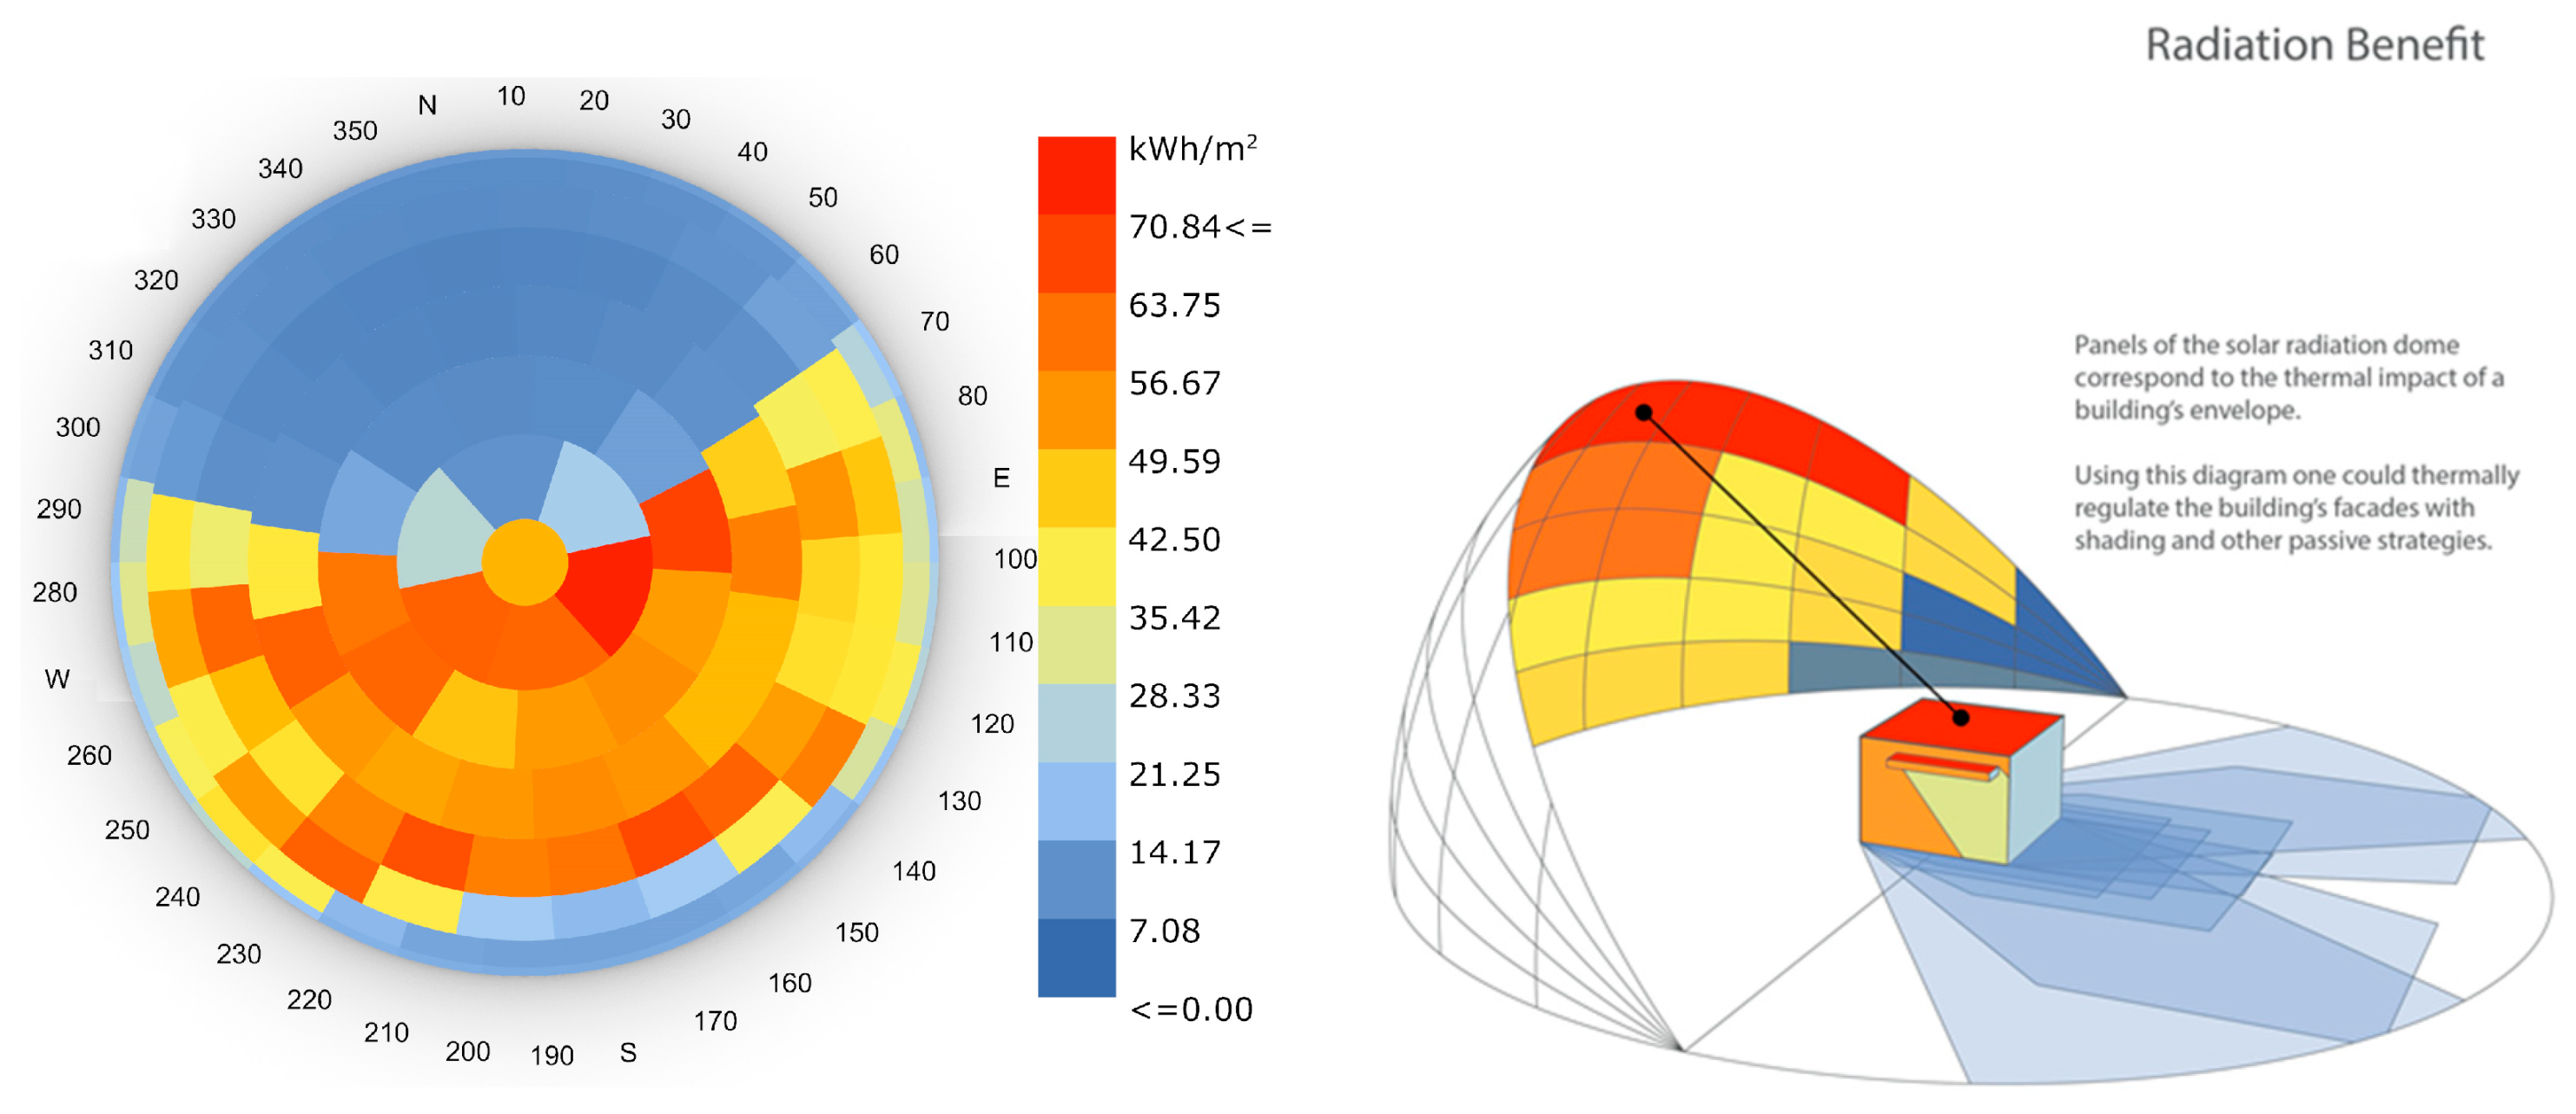
Sun radiation (
Figure 5) combines electromagnetic waves varying from infrared radiation to ultraviolet radiation. Within this spectrum are the wavelengths referred to as “visible light”. The sun radiation diagrams provided an estimation of the amount of daylight the studied space received. As previously mentioned, the sun is the most significant light source, so it is crucial to understand how to optimize its benefits while minimizing its negative impacts [
13].
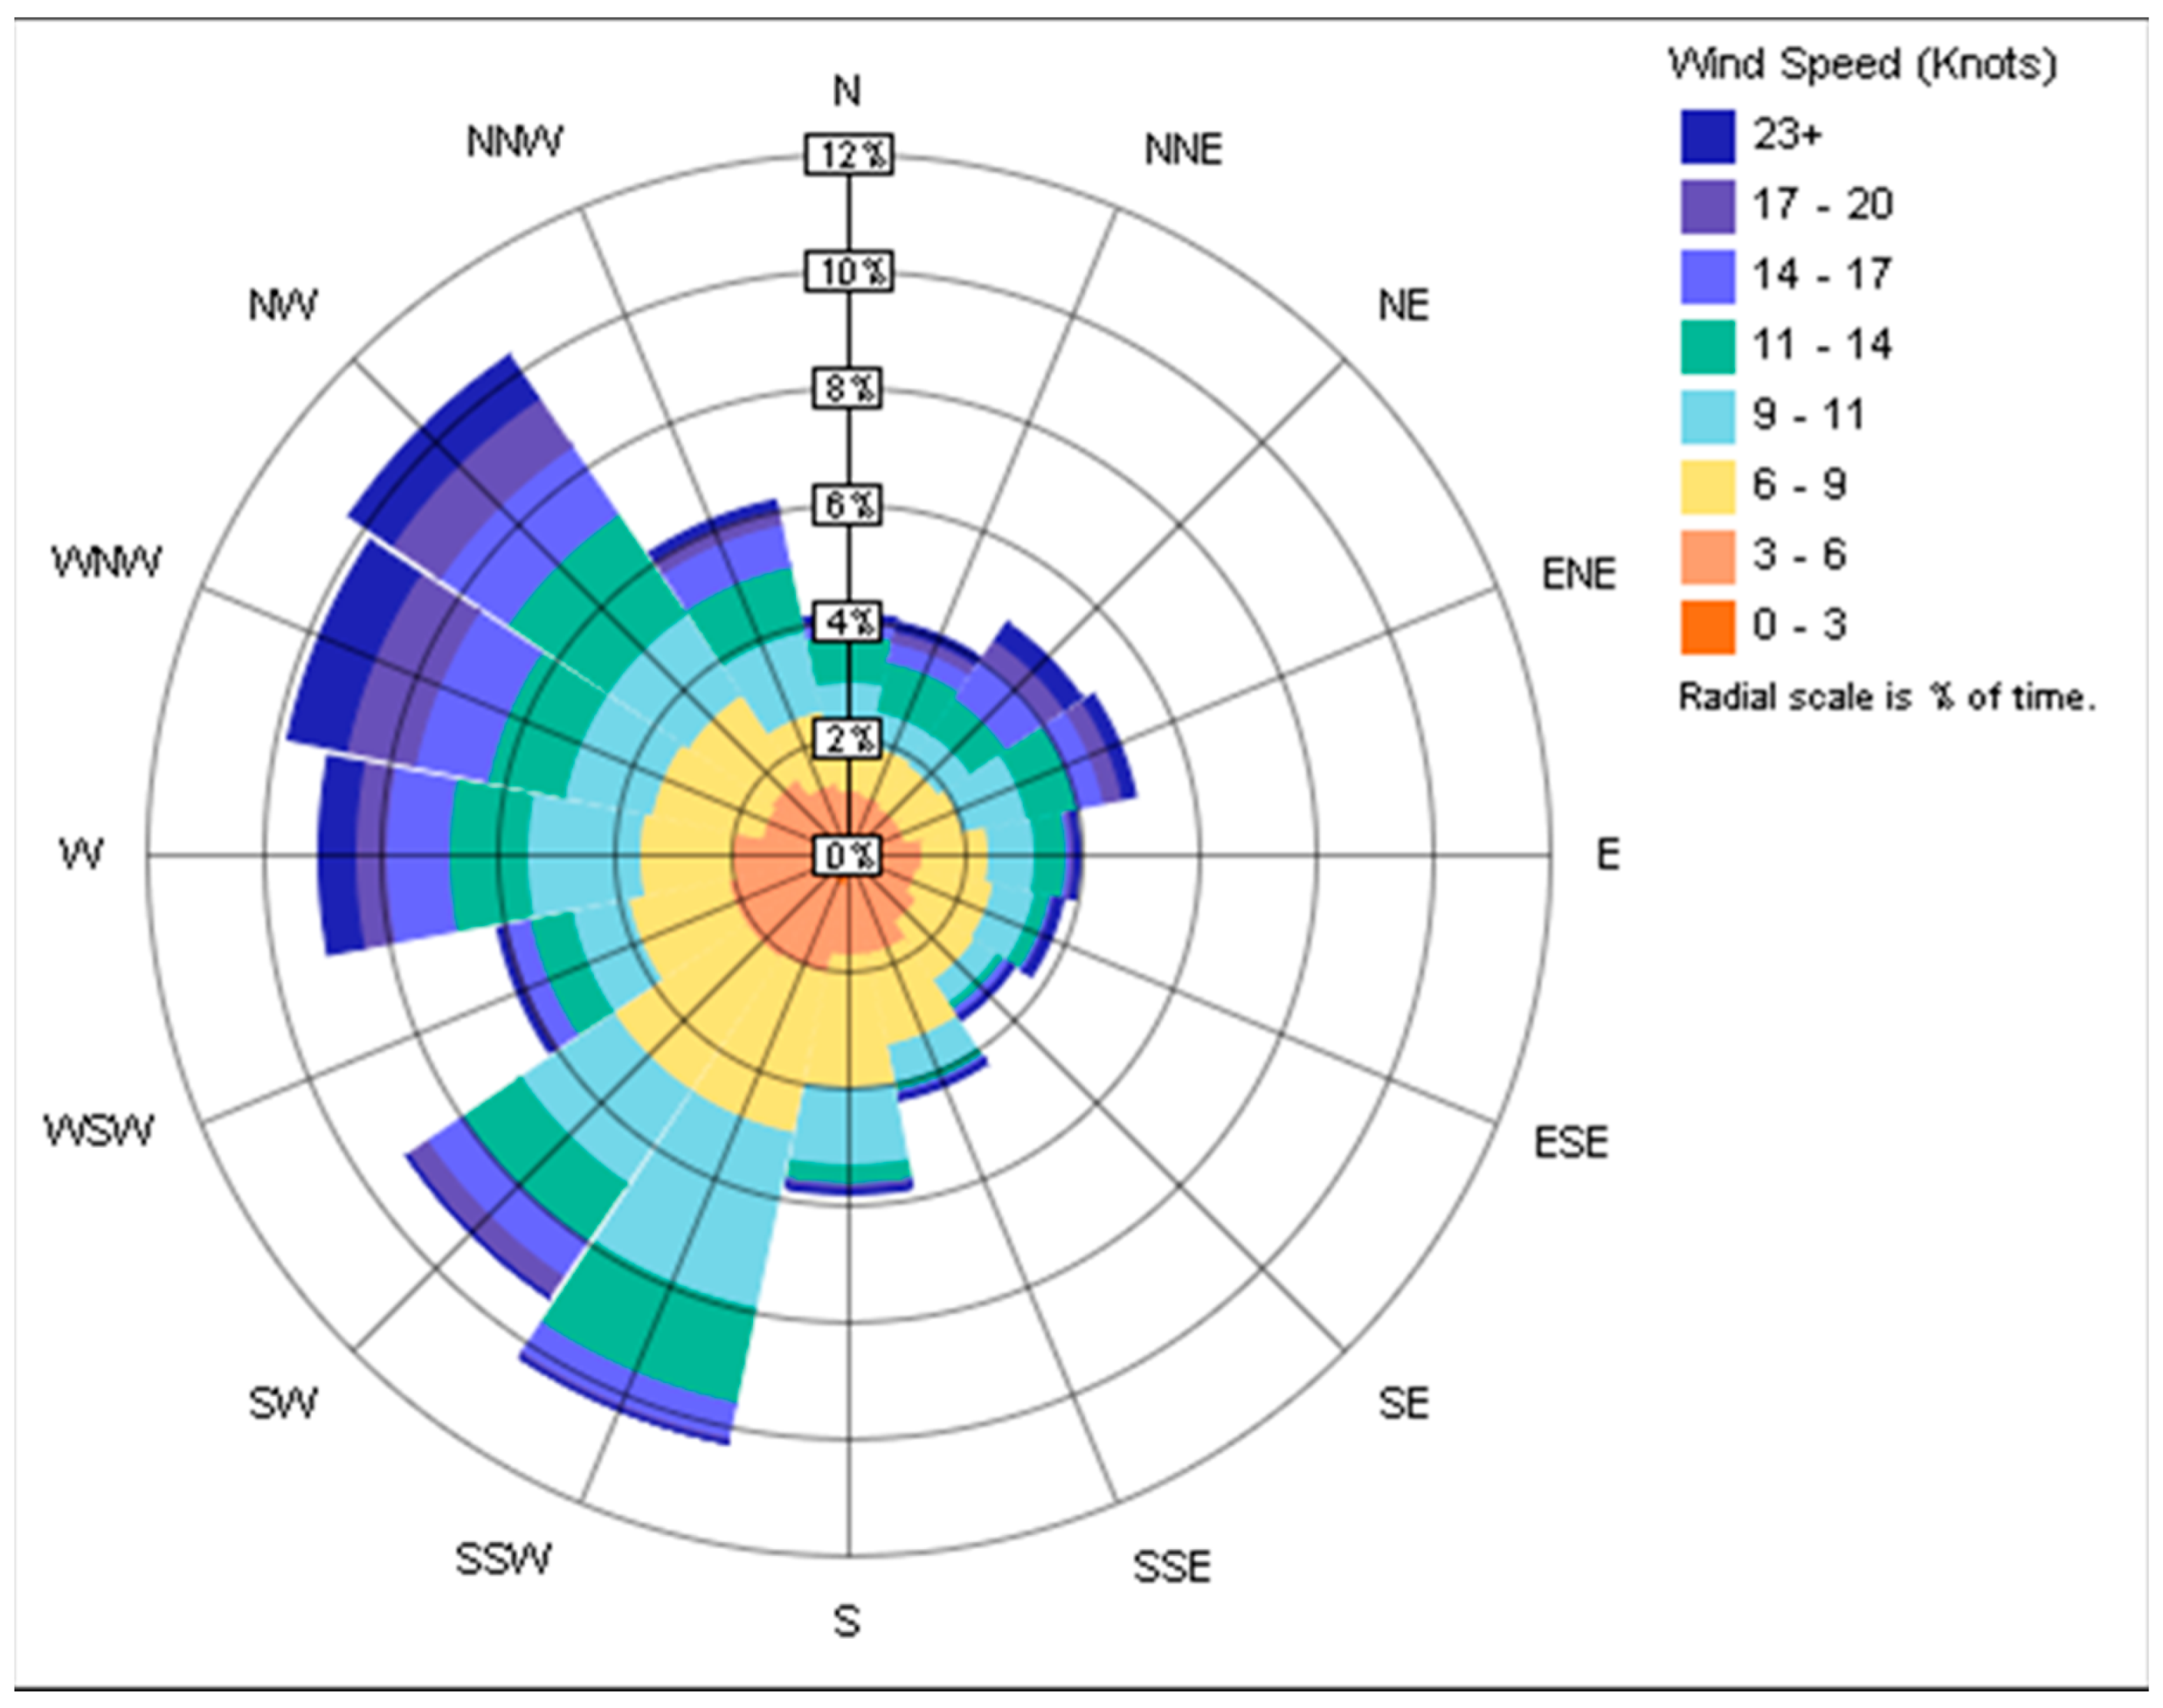
The wind analysis diagram in
Figure 6 displays wind speeds and directions at a given time [
13]. In the United Arab Emirates, the prevailing winds have a northwest orientation. In this study, the selected corridor is at a 35° counterclockwise tilt from the north, which is advantageous in terms of wind direction. In order to ensure an optimal design, the openings on the façade were strategically sized to improve the energy performance, solar radiation impact, and daylight exposure of the corridor [
8].
3. Research Methodology
By analyzing the key factors in parametric and computational design, the environmental performance of the chosen corridor and its compliance with Estidama regulations could be assessed to achieve optimal performance.
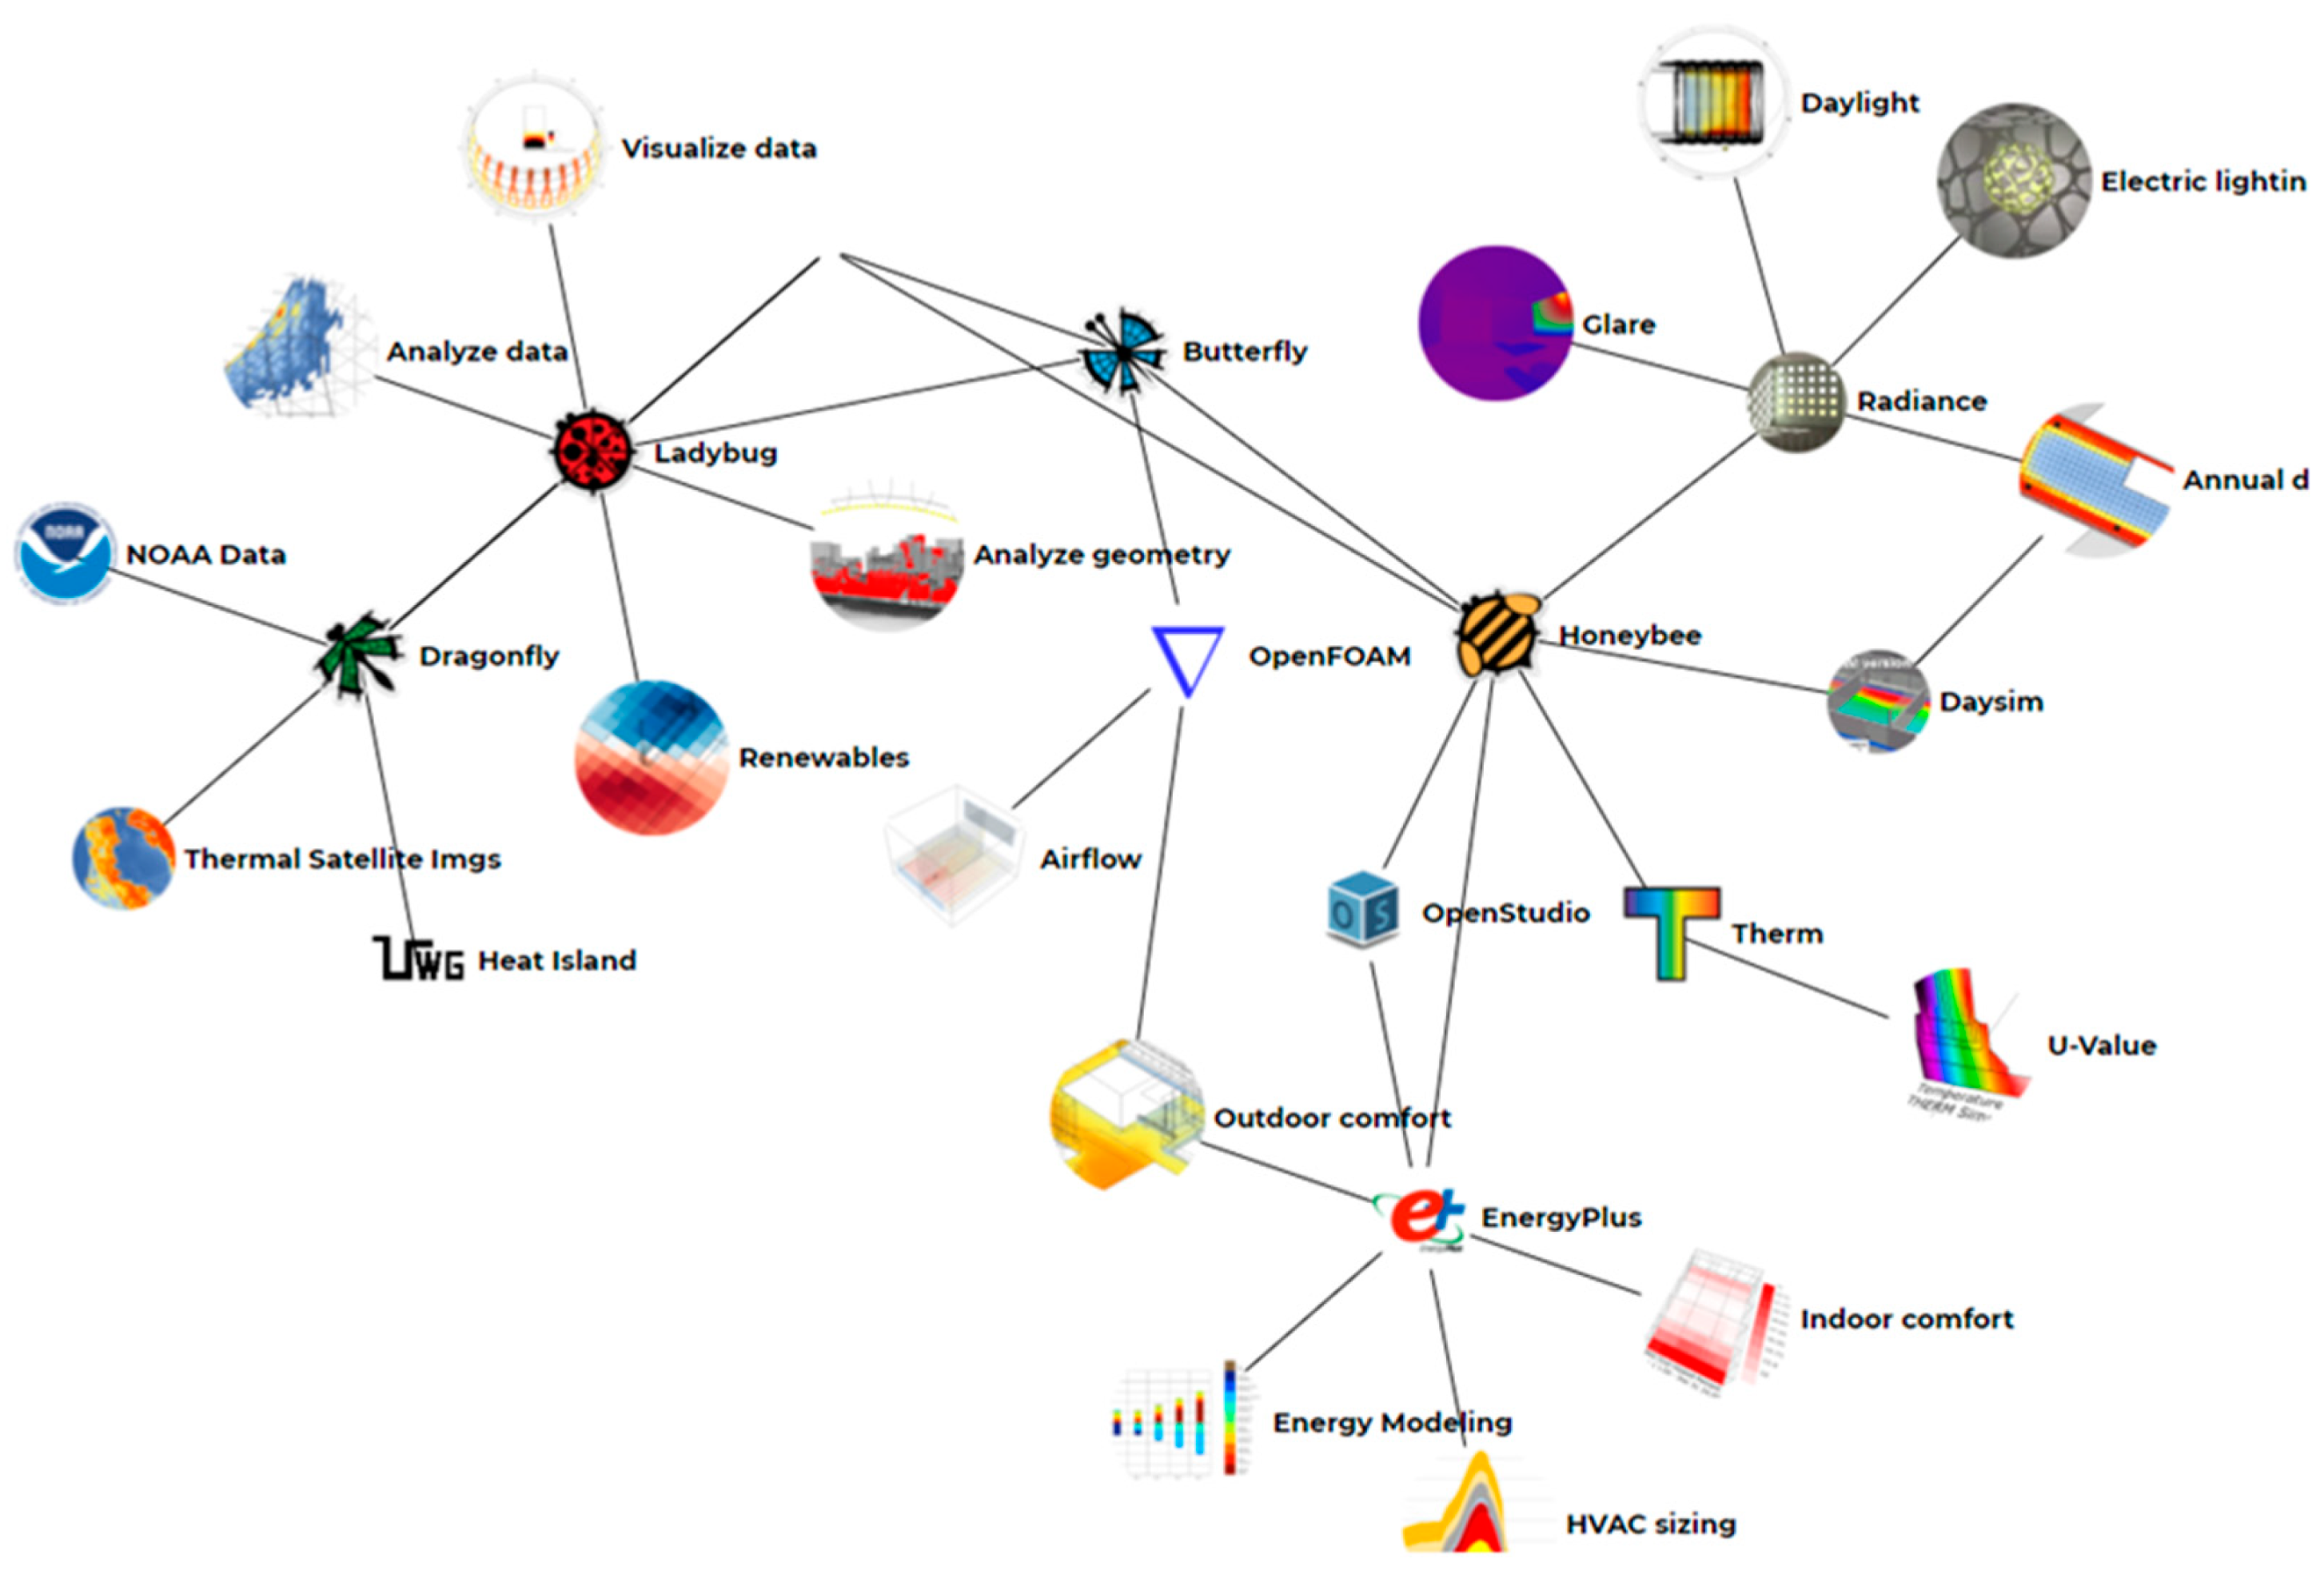
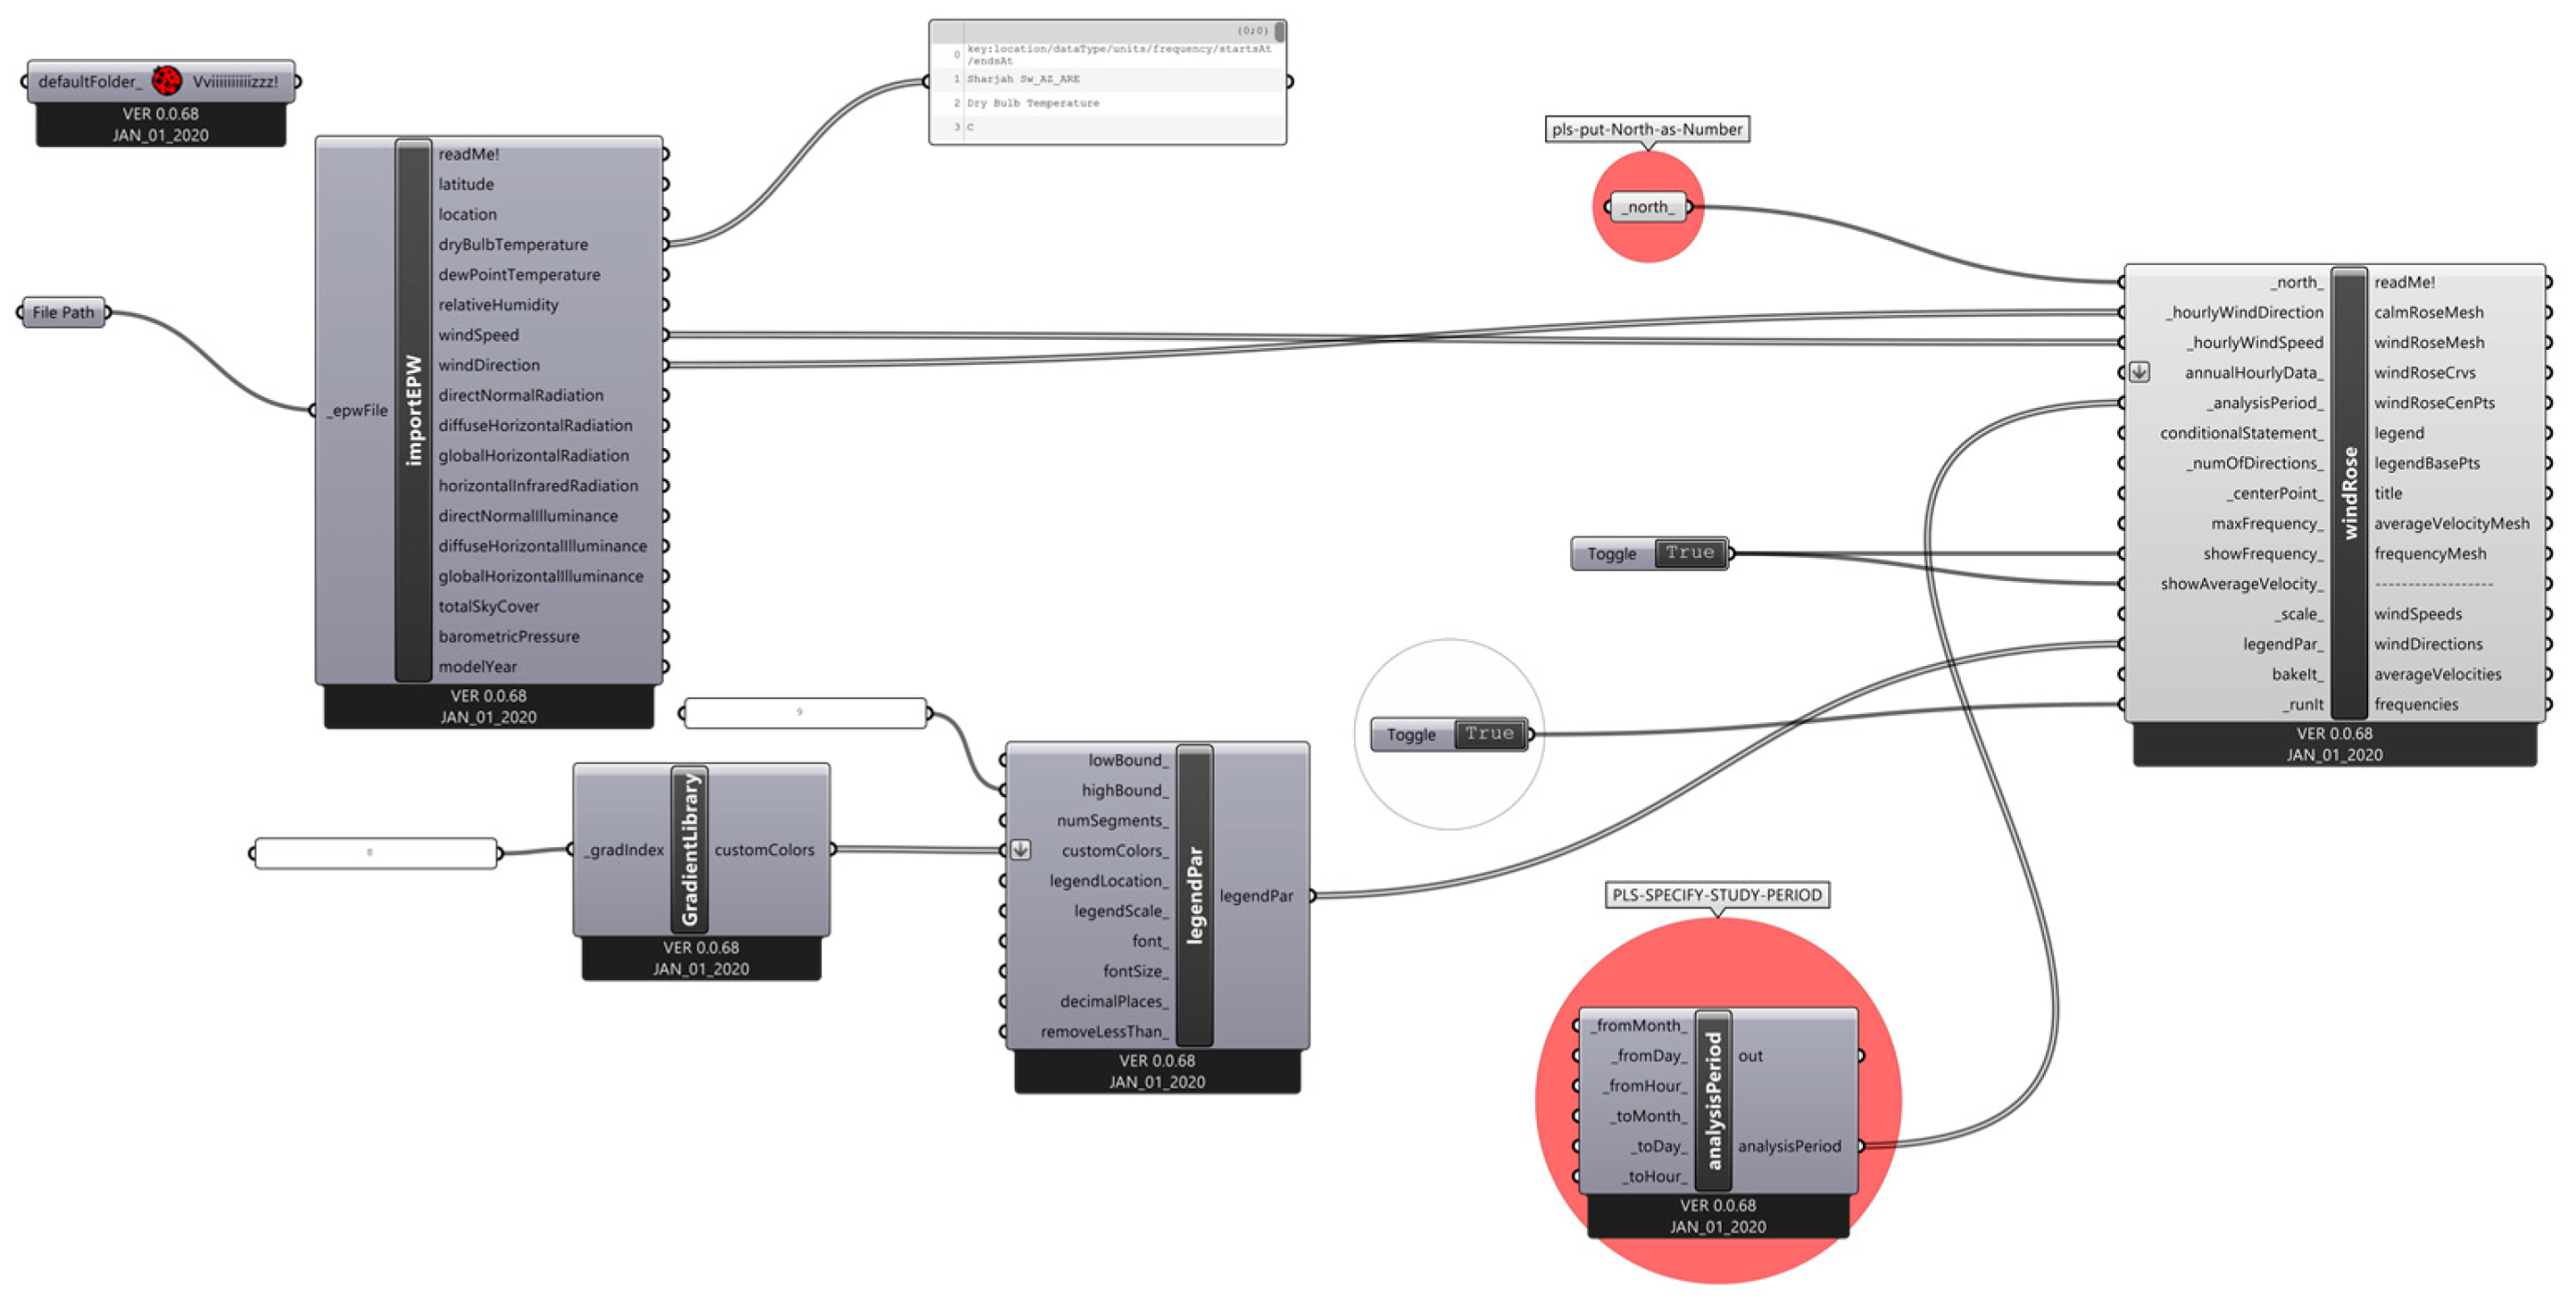
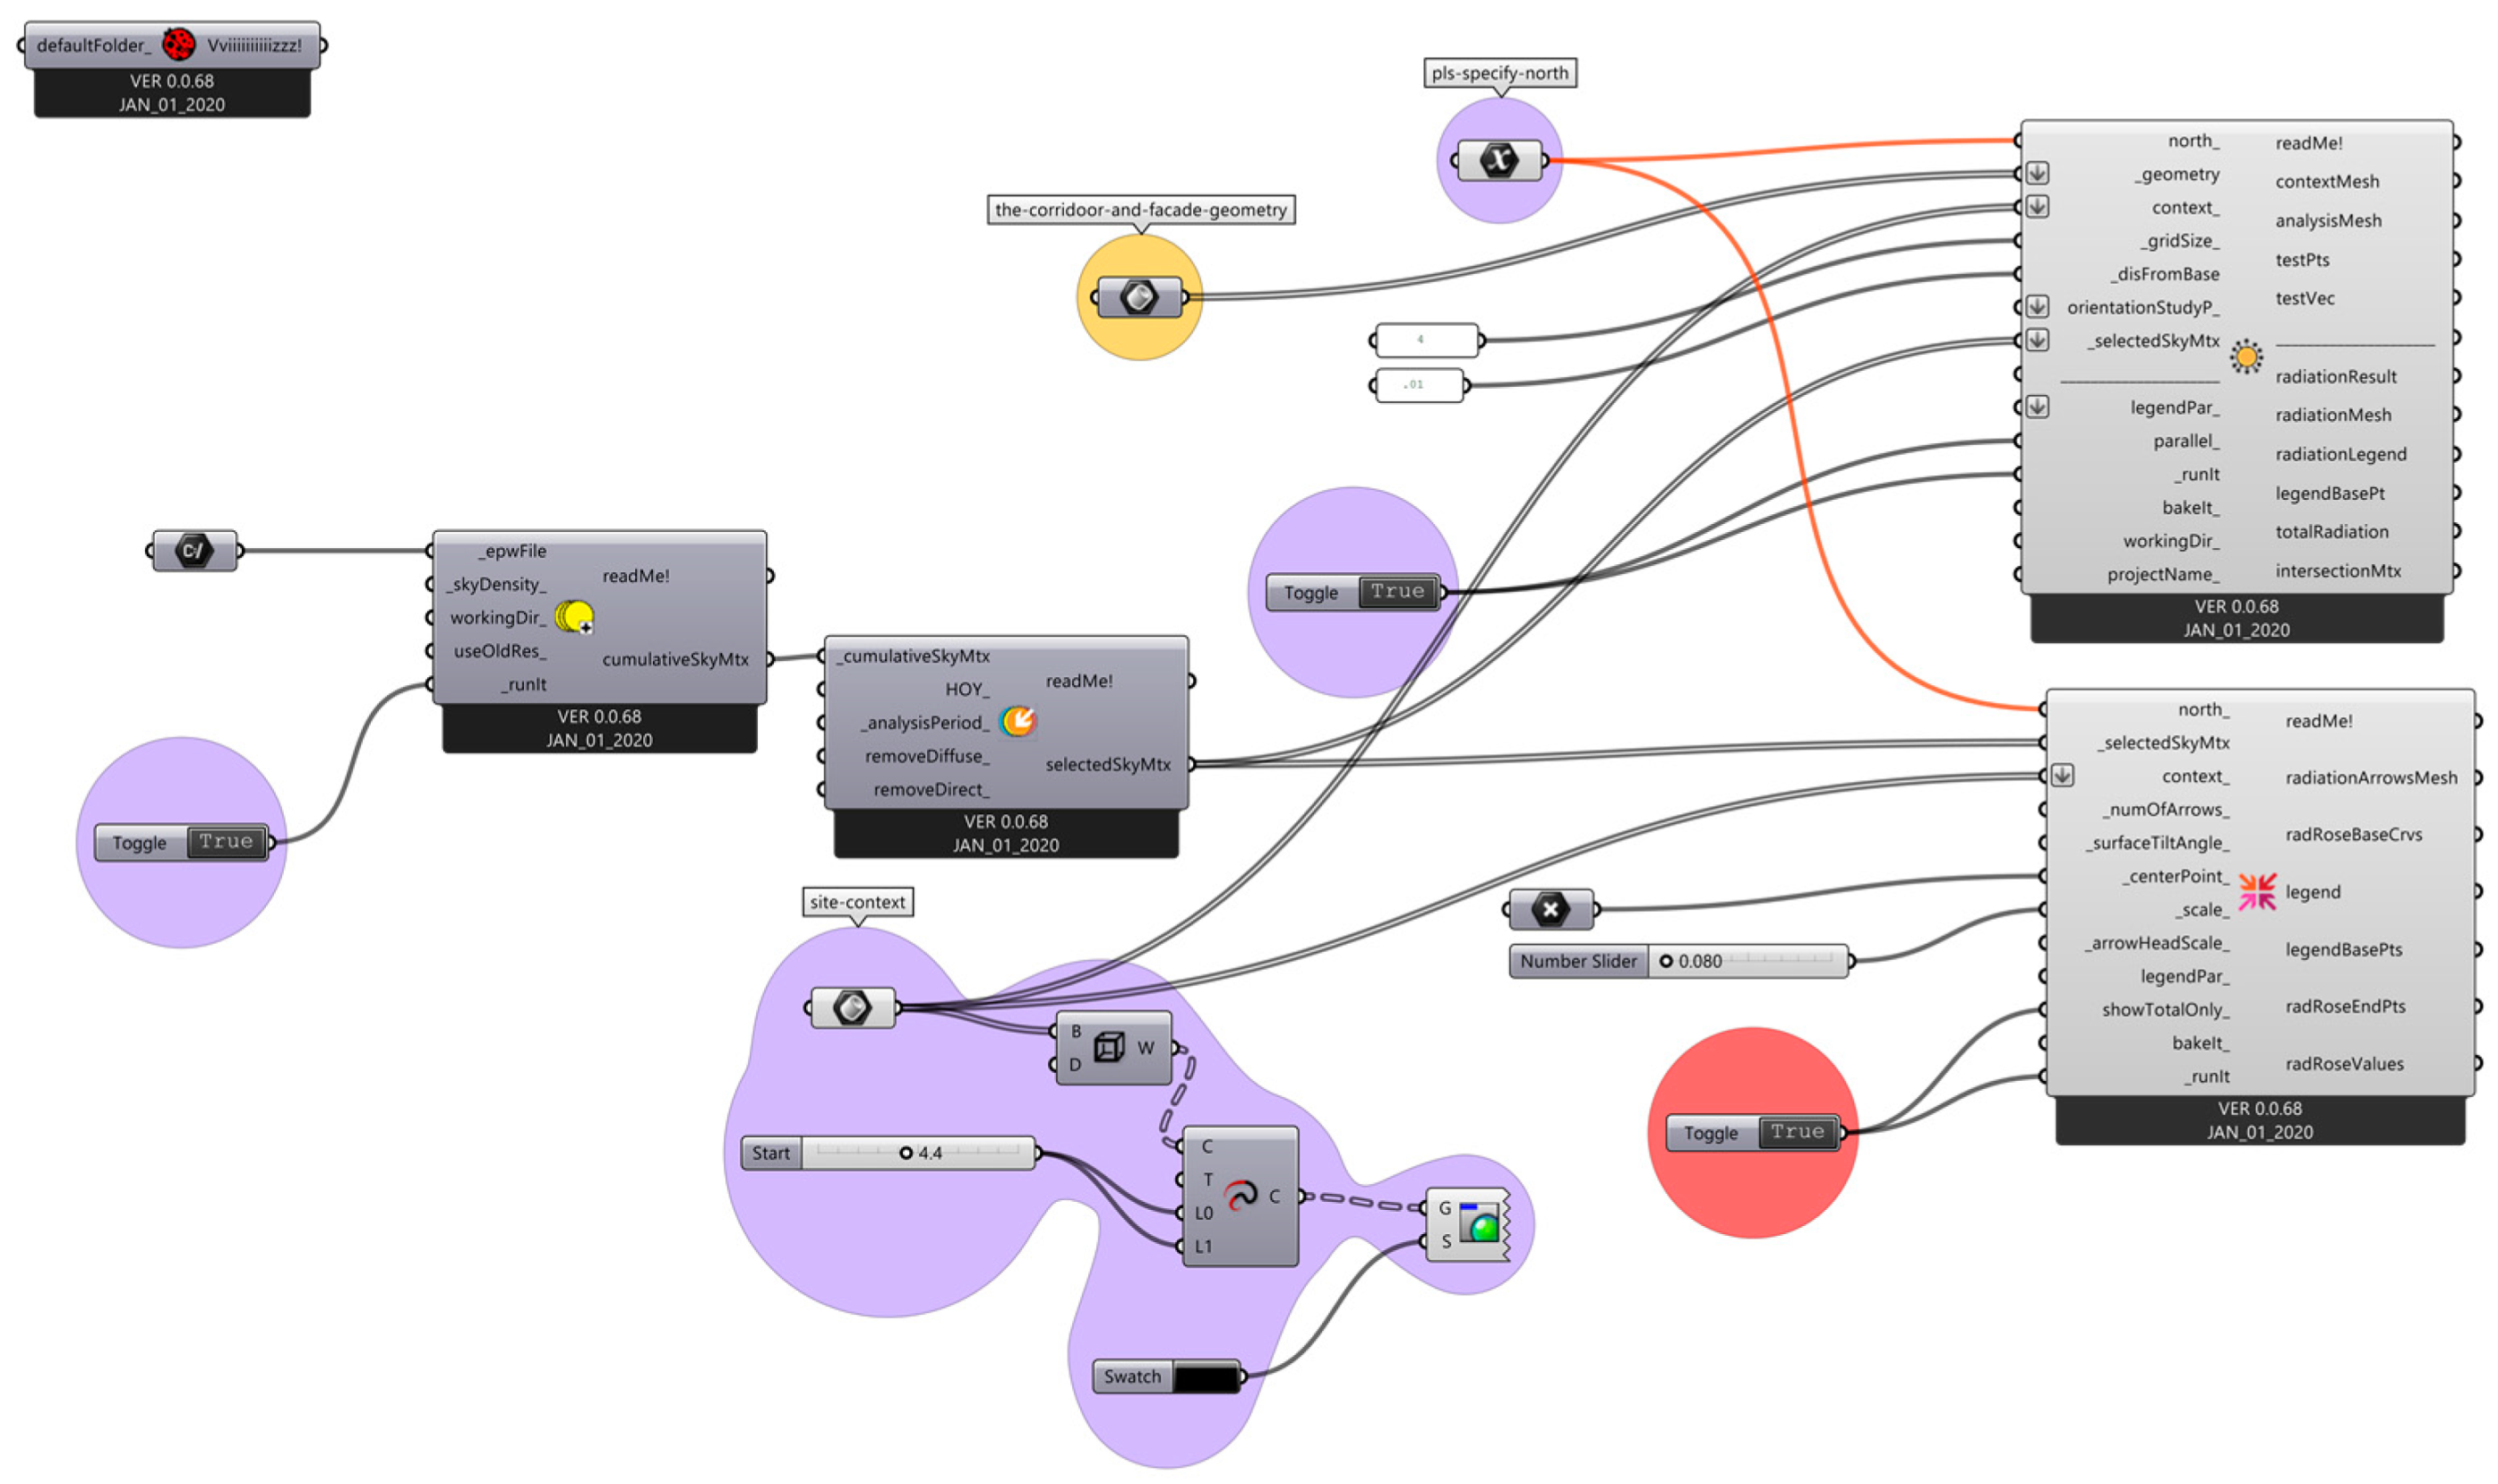
First, we connected Rhinoceros 3D and its Grasshopper plug-in with another tool, Ladybug for Grasshopper, that analyzed weather files and generated specific environmental diagrams. The Ladybug tool consists of Dragonfly, Butterfly, Honeybee, and Ladybug. Each specializes in a particular field and analyzes certain factors. For example, the Dragonfly tool analyzes large-scale factors such as climate change parameters and performs further analysis through other Ladybug tools. The Butterfly tool performs advanced fluid-dynamics simulations, while the Honeybee tool analyzes daylighting and thermodynamics through EnergyPlus and other environmental design engines [
14]. Moreover, the Ladybug tool is a comprehensive tool used to validate simulation engines and translate them into computer-aided design interfaces. Using this interactive plug-in for Grasshopper allows the user to visualize slight variable changes and to make instant modifications at any stage of a design based on the feedback of Rhinoceros 3D [
15]).
For our study, Ladybug also provided climatic graphs of the path of the sun, solar radiation, the shadow studies, and the wind diagrams, which indicated the energy performance of the screen.
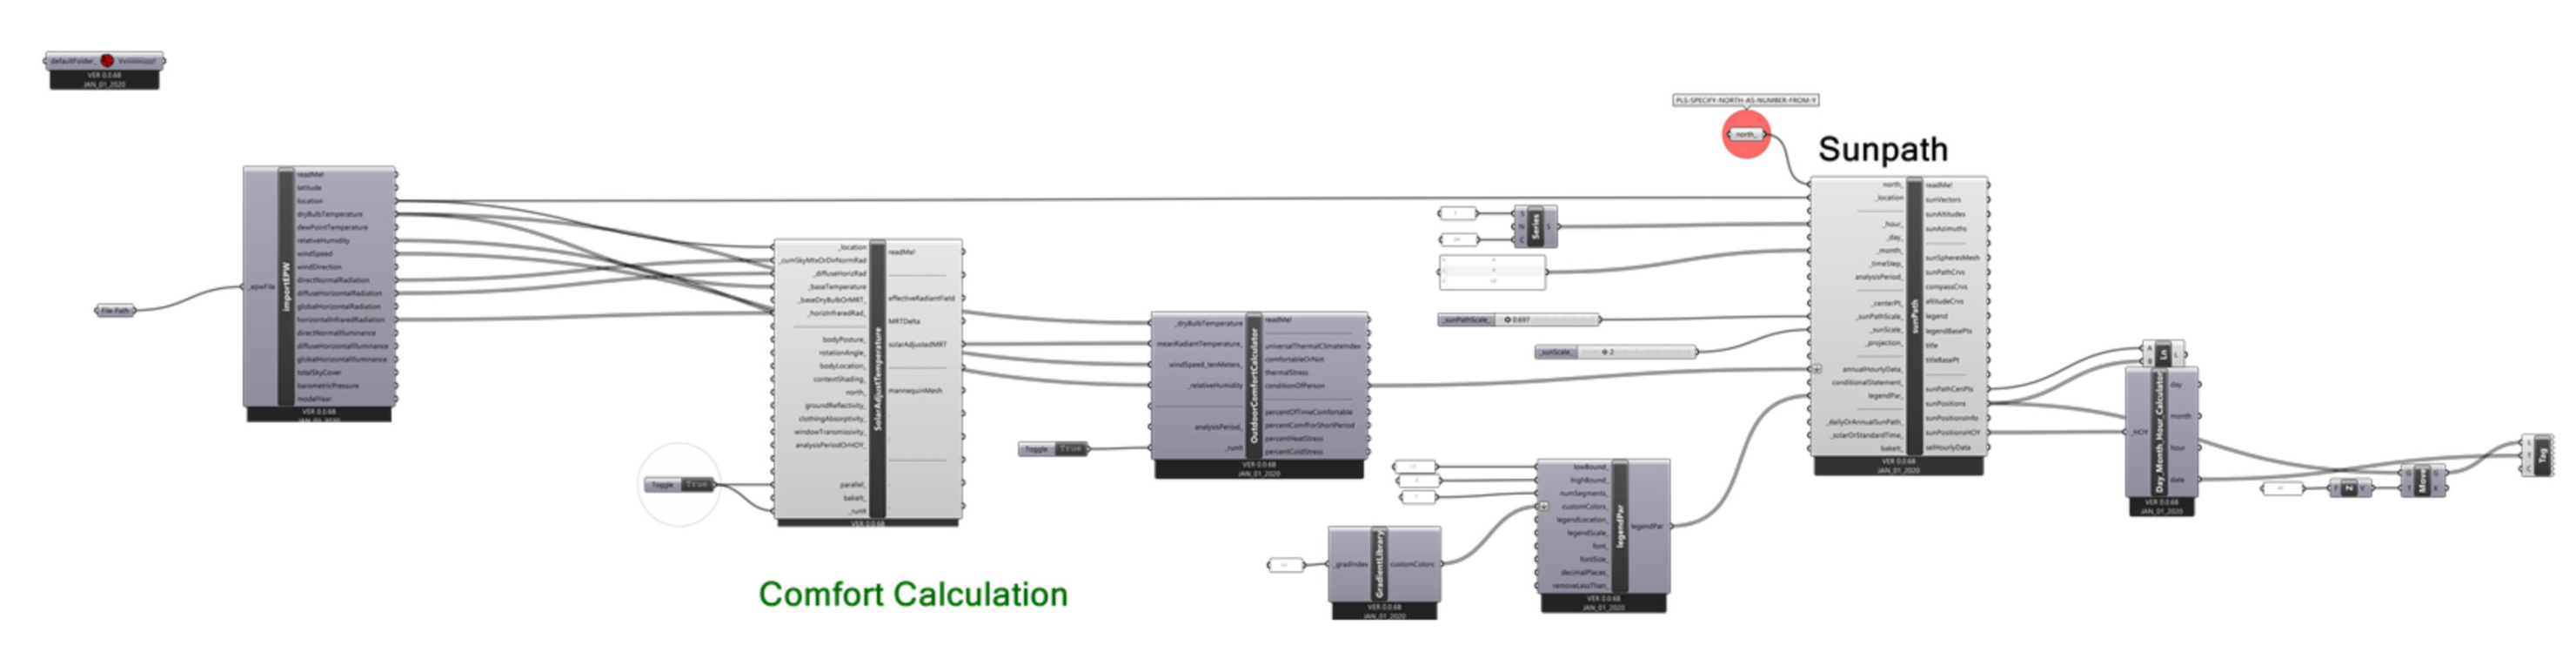
Figure 7 shows the software workflow when using Ladybug for Grasshopper [
15]. Once the coding was written, the energy performance of the screen was demonstrated by diagrams obtained through Ladybug and showcased in Rhinoceros 3D. These data were either direct outcomes or required calculation methods to reach specific outcomes. The sun path and wind rose diagrams, for example, illustrated direct outcomes that did not require further calculations. As for the shadow study and solar radiation diagrams, the results required additional calculations to obtain possible estimations [
15].
4. Preparing Parametric Design Model with Parametric Logics
Since this study focused on the visual and thermal comfort of the corridors at the University of Sharjah, multiple parameters were tested to achieve an ideal design in terms of energy efficiency. A set of codes was written to evaluate the corridor’s performance due to various environmental factors. These environmental specifications fell under two categories: (1) site-dependent parameters such as the annual sun path and the wind direction that were static factors including the site location and building orientation [
13], and (2) pattern-dependent parameters that varied with each generated pattern, which included the shadow study and the solar radiation analysis [
16].
4.1. Site-Dependent Parameters
The annual sun path diagram allowed us to identify the sun’s position during the hottest months of the year, namely June to August, during which summer courses were offered. In addition, we could track the sun position throughout the year, including the fall semester (i.e., September to December) and the spring semester (i.e., January to May). This developed our understanding of how much shading of the corridor would be required to ensure thermal comfort, along with the shadow study, which was a pattern-dependent parameter. The direction of the openings would be determined based on the shading coefficient provided by the screen [
15]).
Wind analysis indicated both the wind speed and the wind direction. It was necessary to consider these, as they play a significant role in improving the environmental conditions in the corridor. This diagram identified potential opportunities for cool breezes, resulting from the pattern of the prevailing winds throughout the year, specifically during the hot summer months. Considering these factors, the positions of varying opening sizes were determined to maximize airflow and bolster the stack effect [
13].
4.2. Pattern-Dependent Parameters
The pattern-dependent parameters are environmental factors that are influenced by the geometric pattern on the façade. These parameters include the shadow study and the sun radiation analysis.
The shadow study provided explicit assumptions based on the analysis of the visual performance of the corridor. The second pattern-dependent parameter was the sun radiation analysis that evaluated how much exposure to daylight the corridor received. The solar radiation analysis was a core specification as it estimated the amount of artificial lighting that would be essential in the corridor, and the cooling load that would be required to compensate for the additional heat gain. Along with the shadow study, it suggested a preliminary number of openings with varying sizes for the screen [
17].
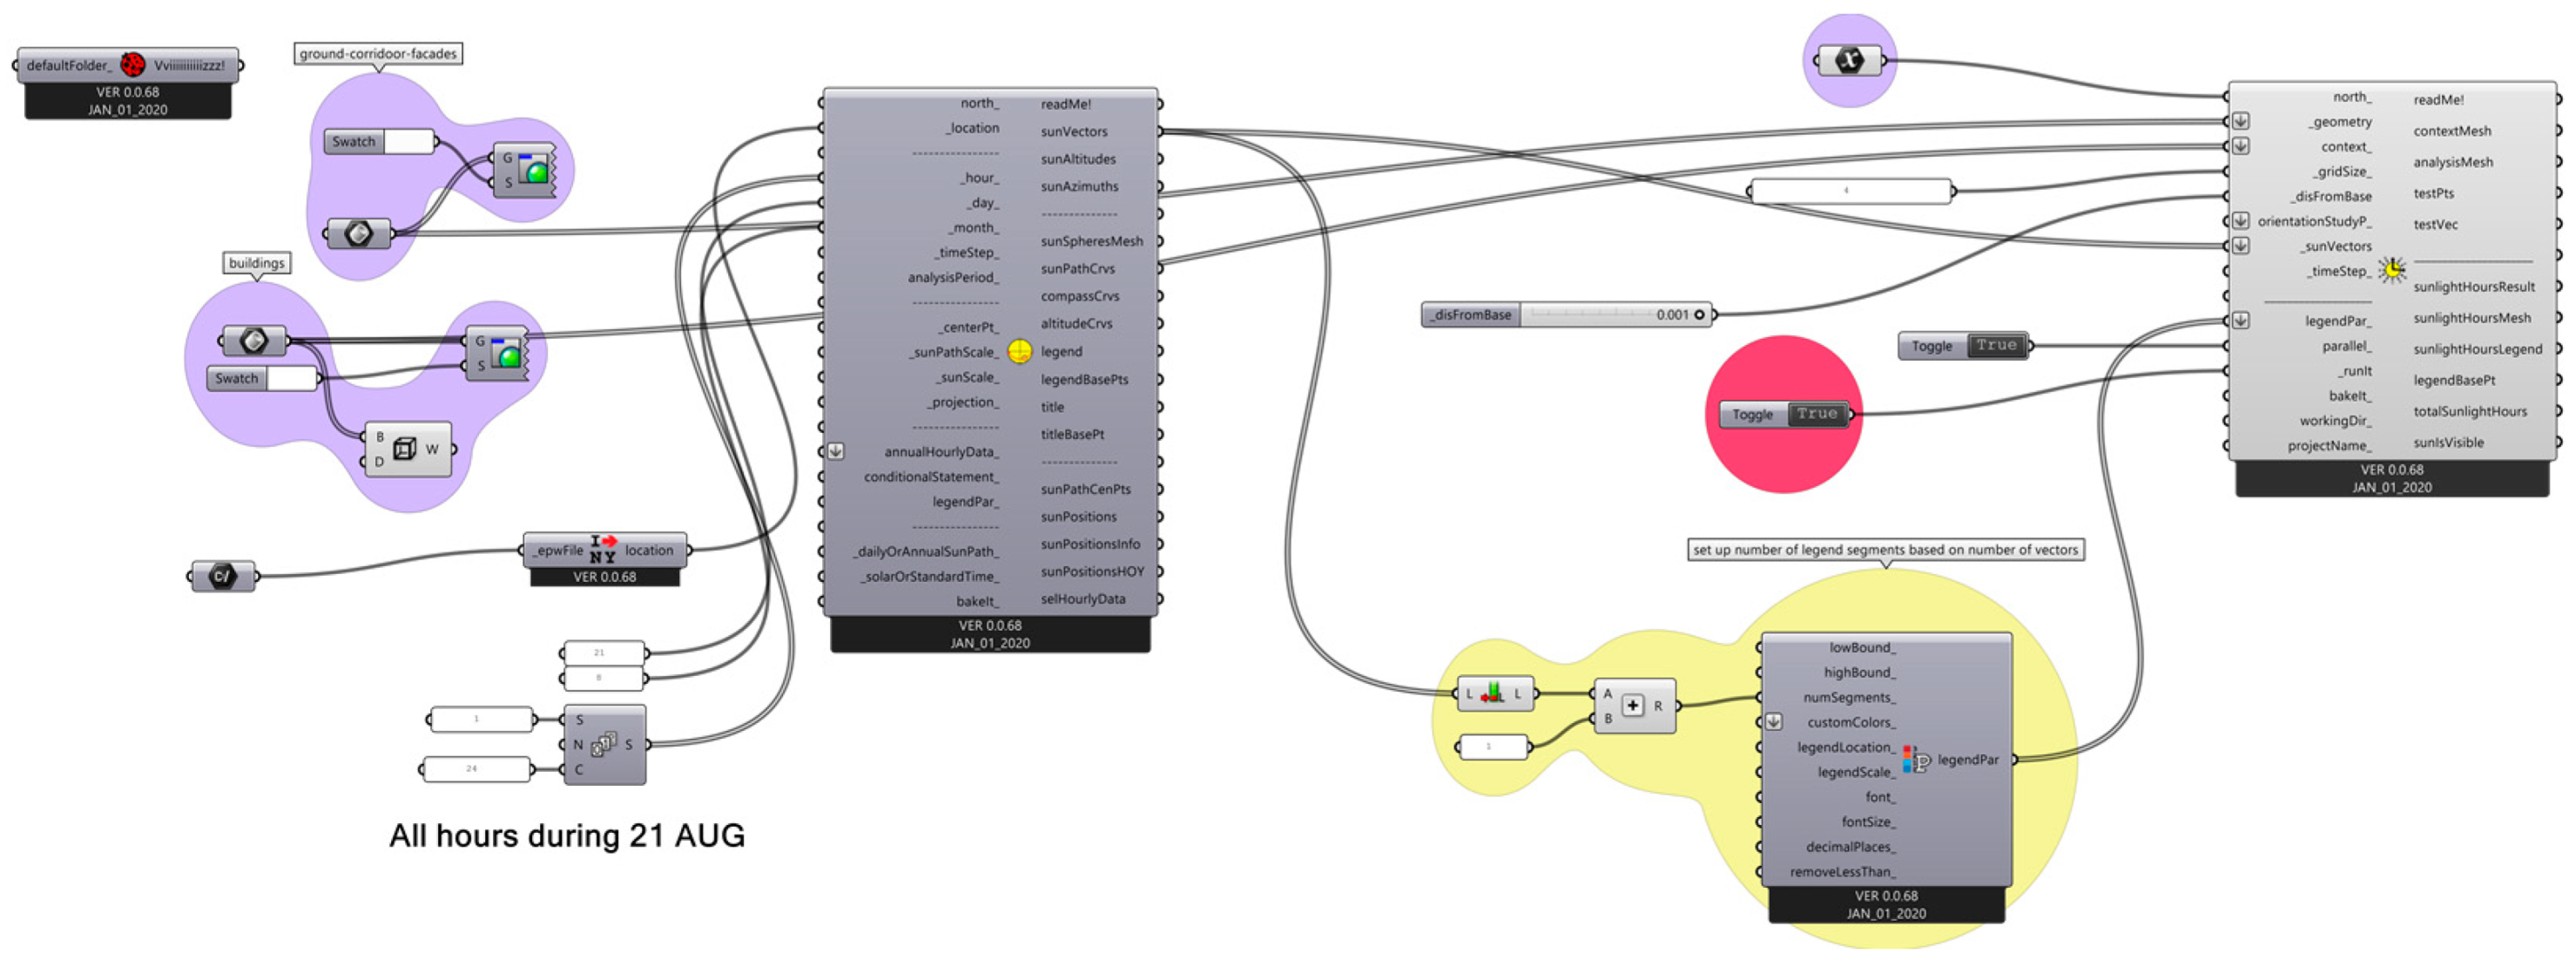
4.3. Data Inputs and Analysis
For the generated codes to function, specific parameters were fed into Grasshopper to perform the simulations. The aforementioned environmental specifications had similar inputs, in addition to a few varying inputs, that allowed the program to predict potential values and indicate the energy performance, precipitation, solar radiation, sun path, and the building orientation impact. The varying inputs impacted the time duration of specific simulations, whether it was the peak hours of certain days, a specific week, or a range of months in a year.
The annual sun path diagram code (
Figure 8 and
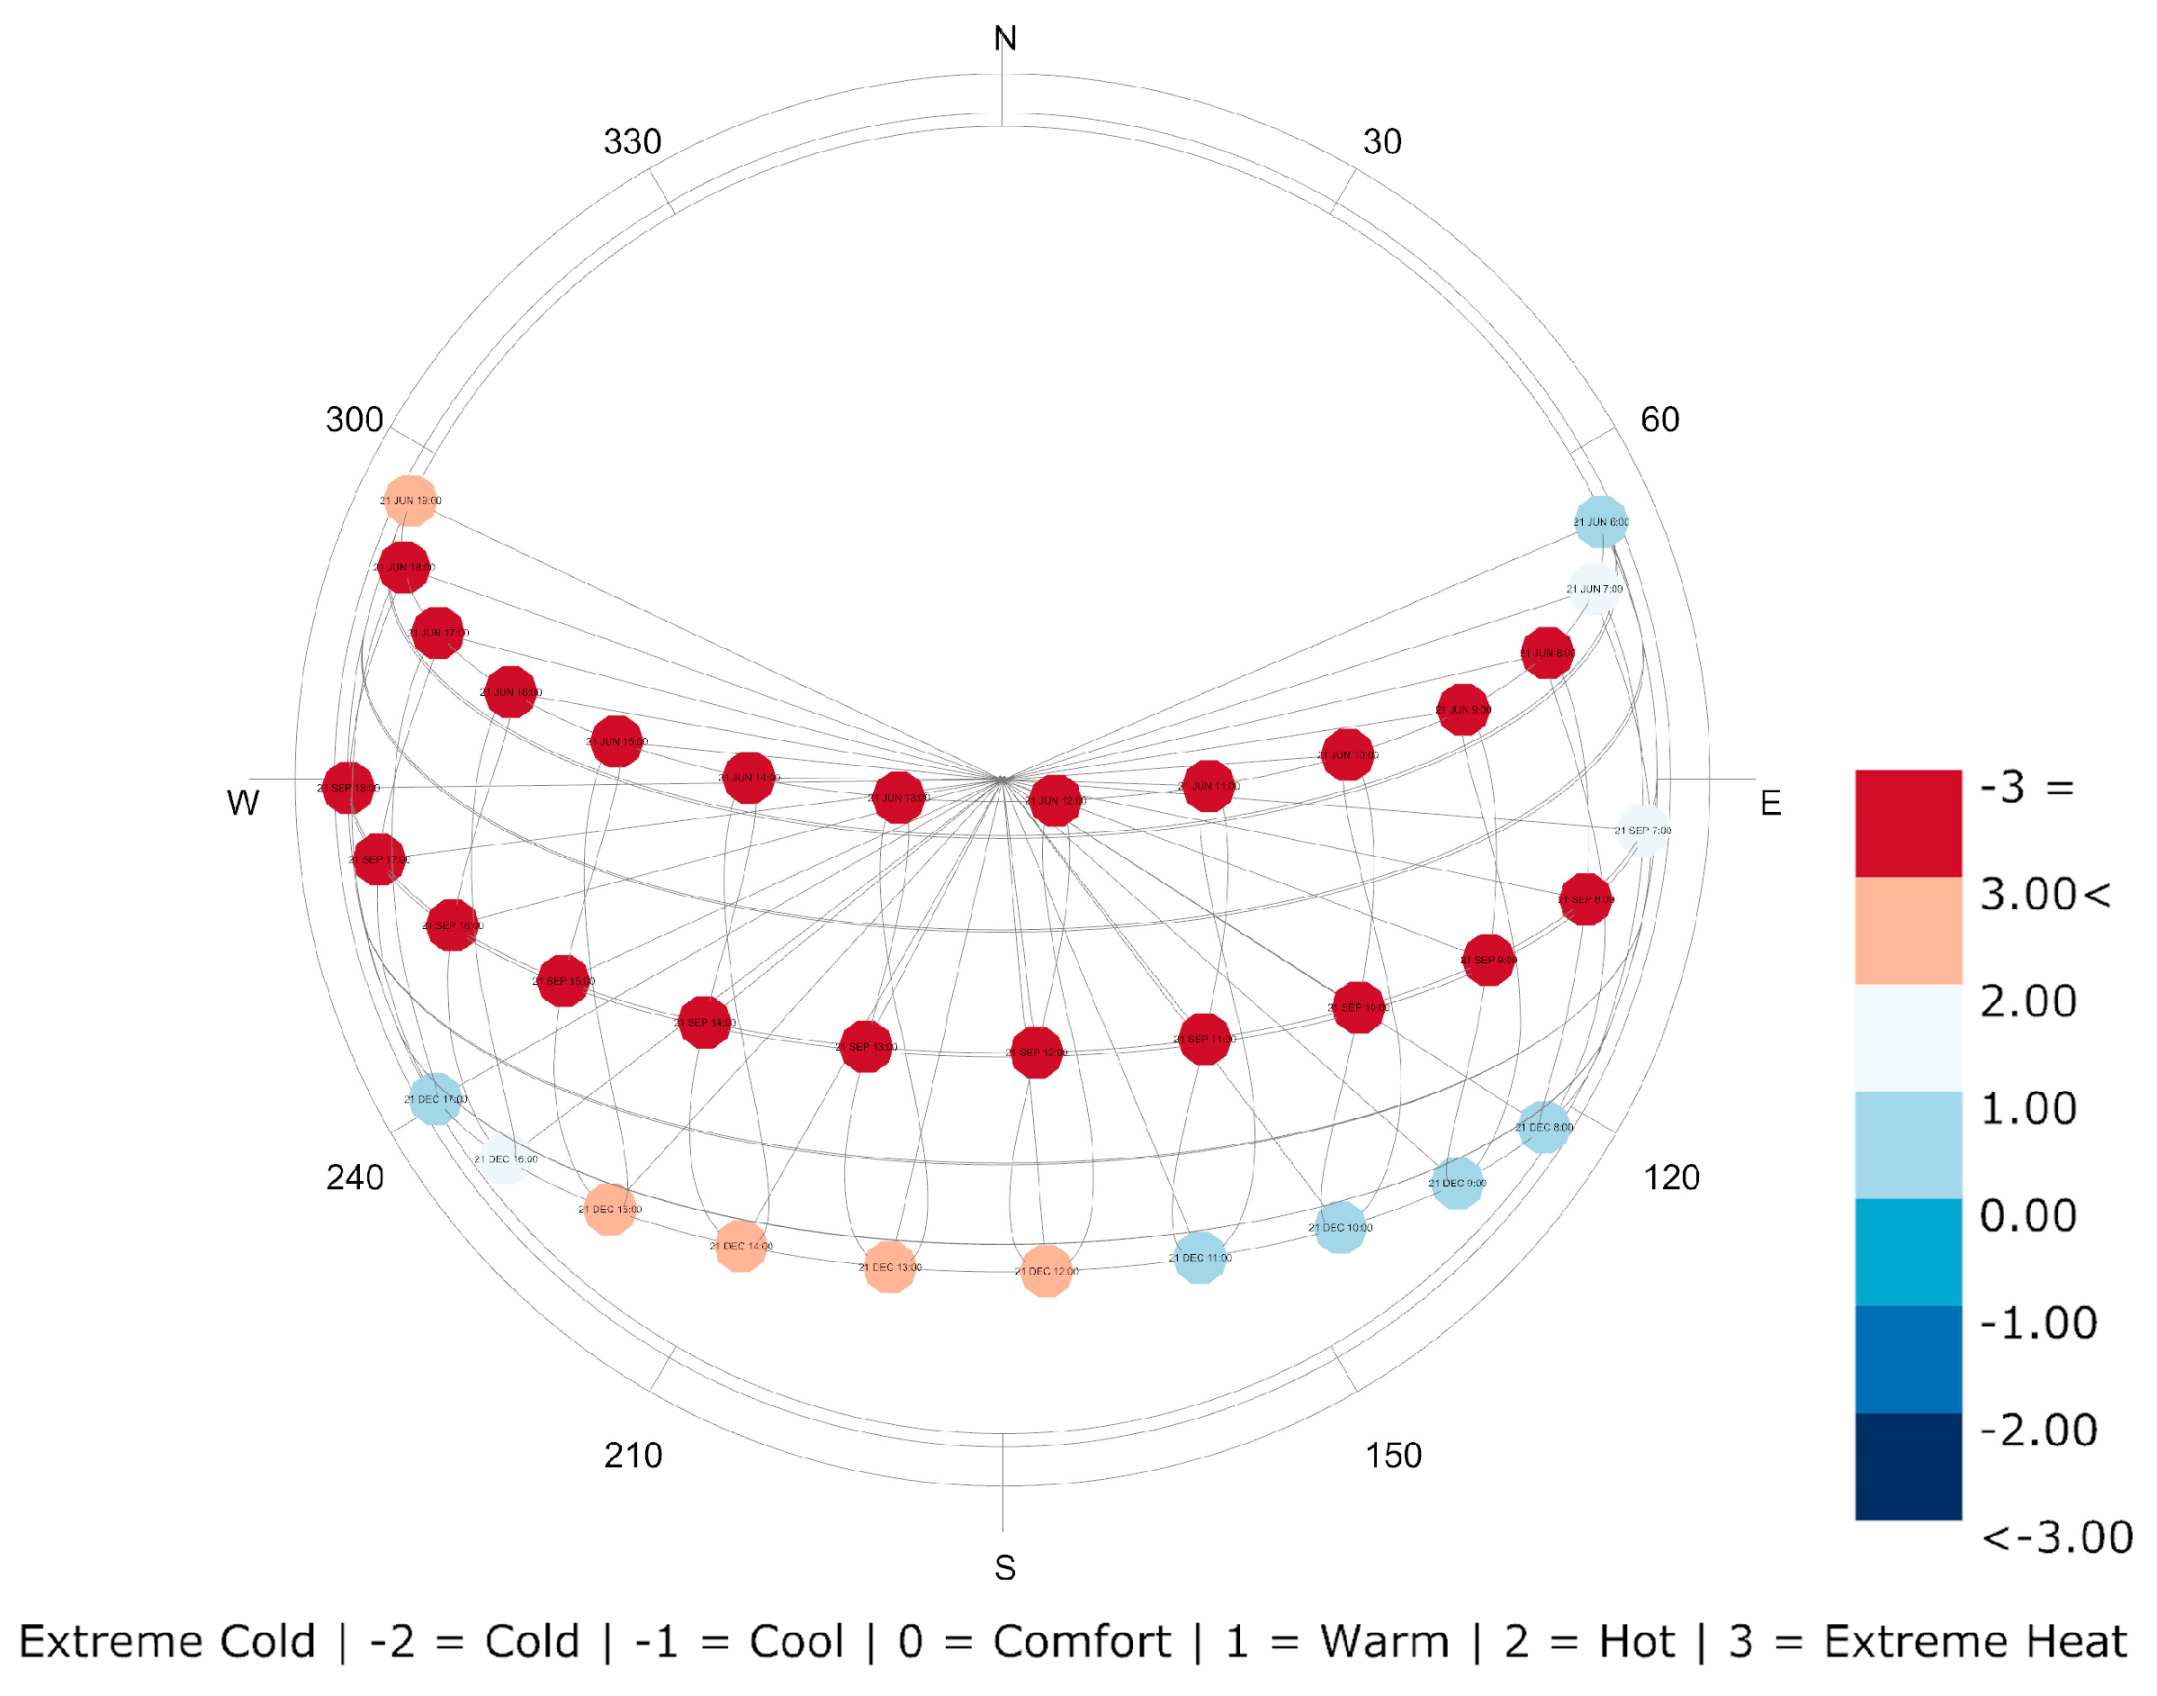
Figure 9) was written to demonstrate the path in which the sun orbits around the earth on a given day, highlighting the sun’s position during varying hours, starting at sunrise and ending at sunset. The simulation exhibited the sun’s position and its path on the 21st days of June, September, and December. These three months specifically mark the start of the summer, fall, and winter seasons, respectively. In June, the sun path started from sunrise at 6:00 a.m., when the sun offered less heat, as compared to that of sunset at 7:00 p.m. However, in September, when the transition between summer and winter occurred, the morning temperatures were cooler. In December, the sun was hot at noon and started to cool at 3:00 p.m. Although the sun in December was fairly hot through noon, it was still cooler when compared to other days of the year. This indicated that the screen should consider the radiation during the months June to September, in which the sun was at a higher angle and extra shading would be required to protect against excess heat gain.
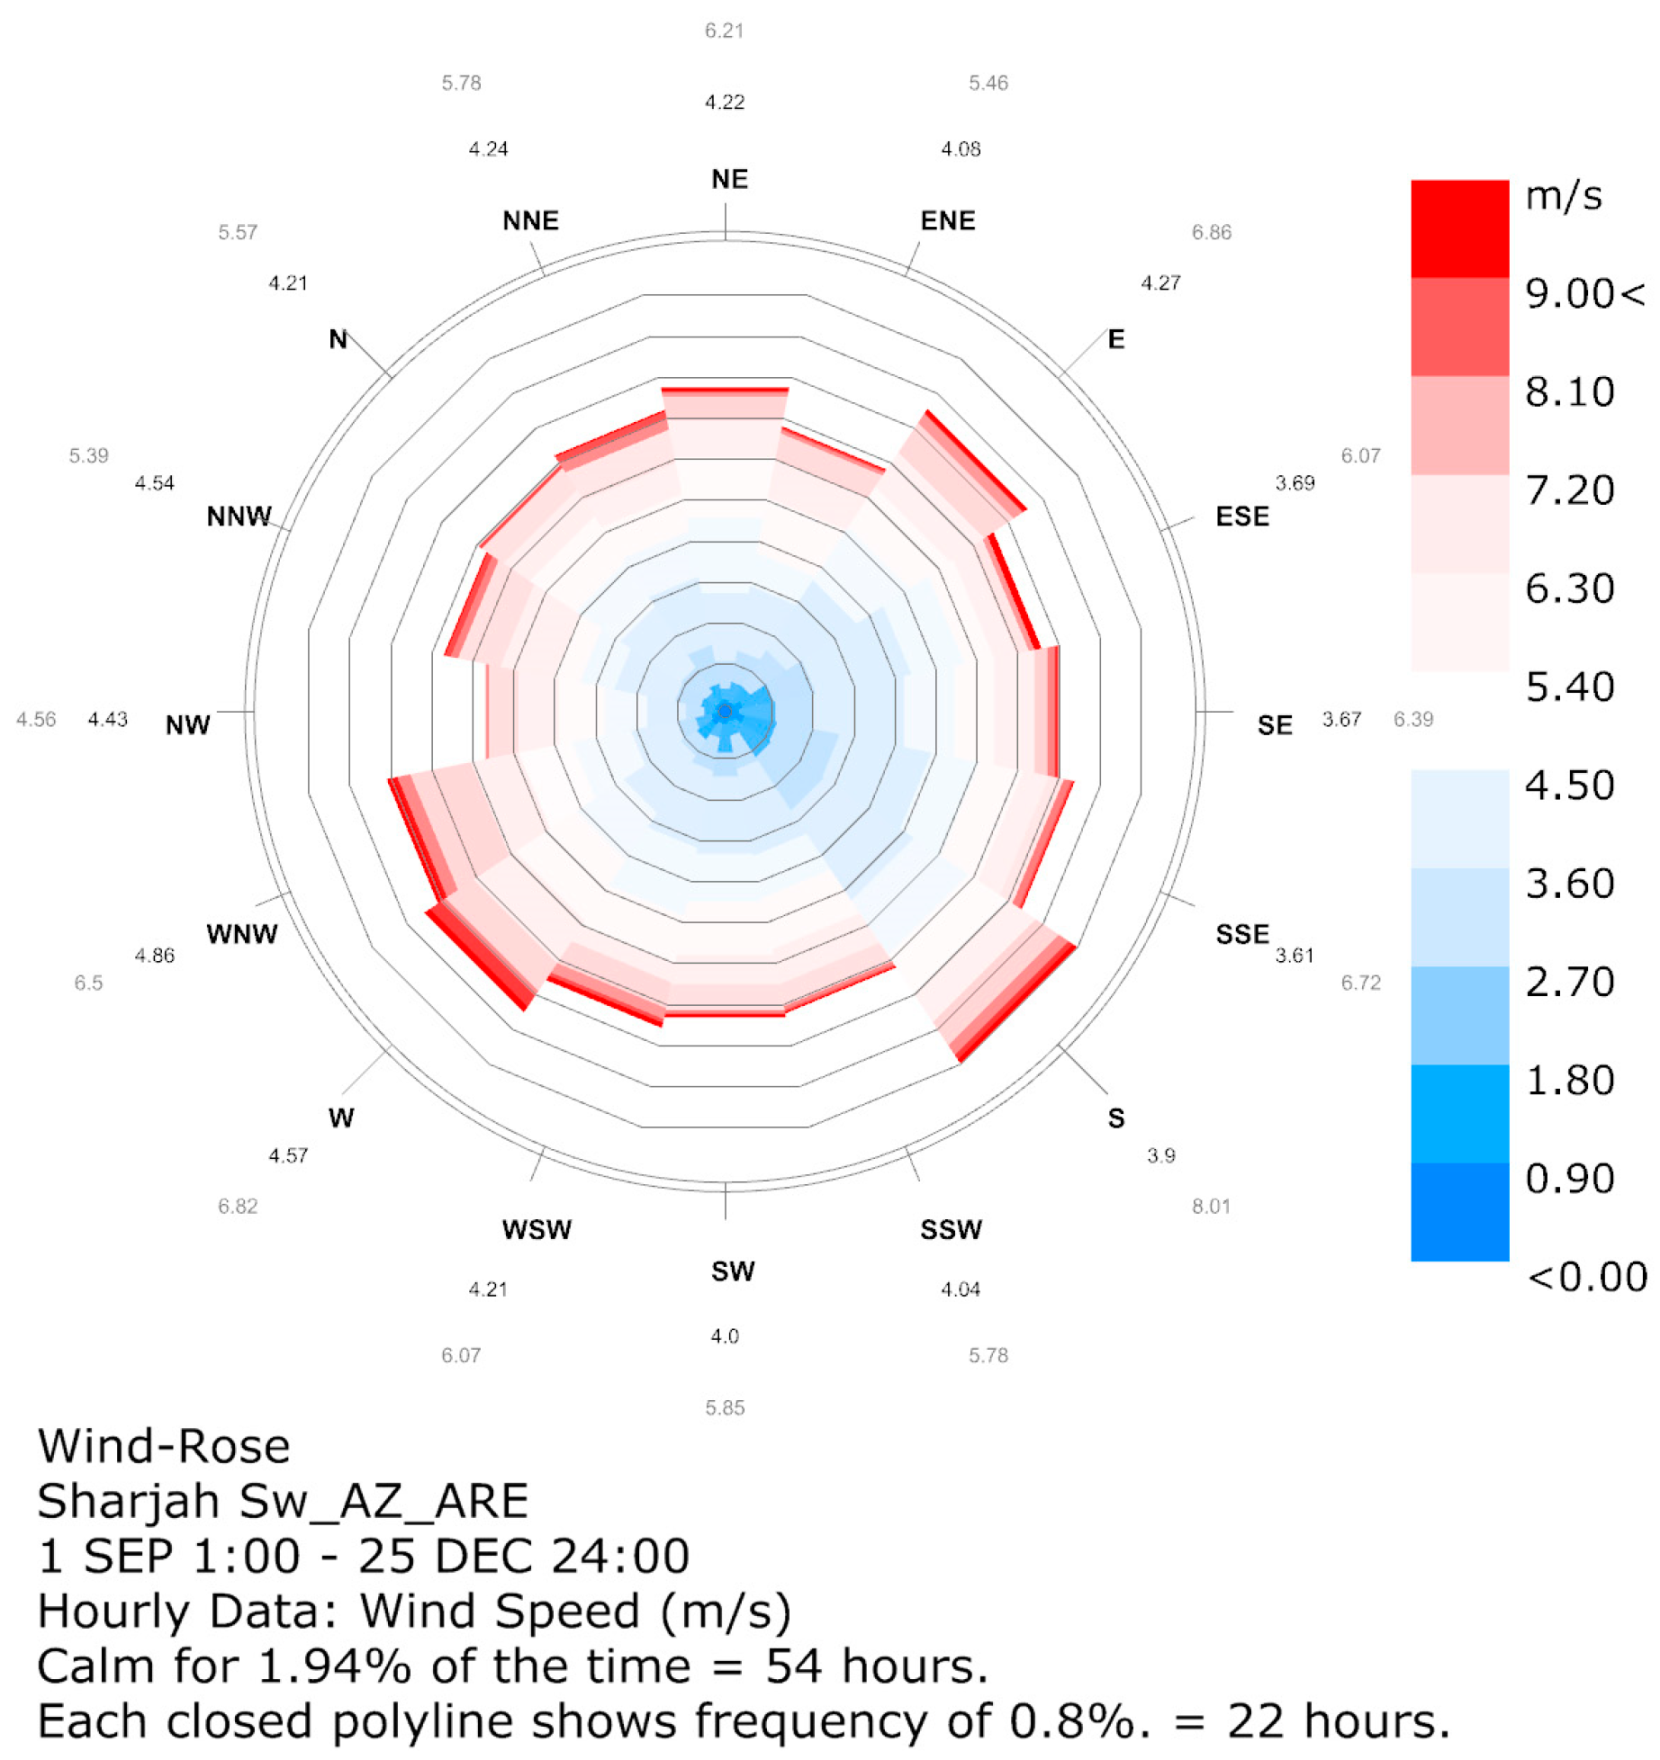
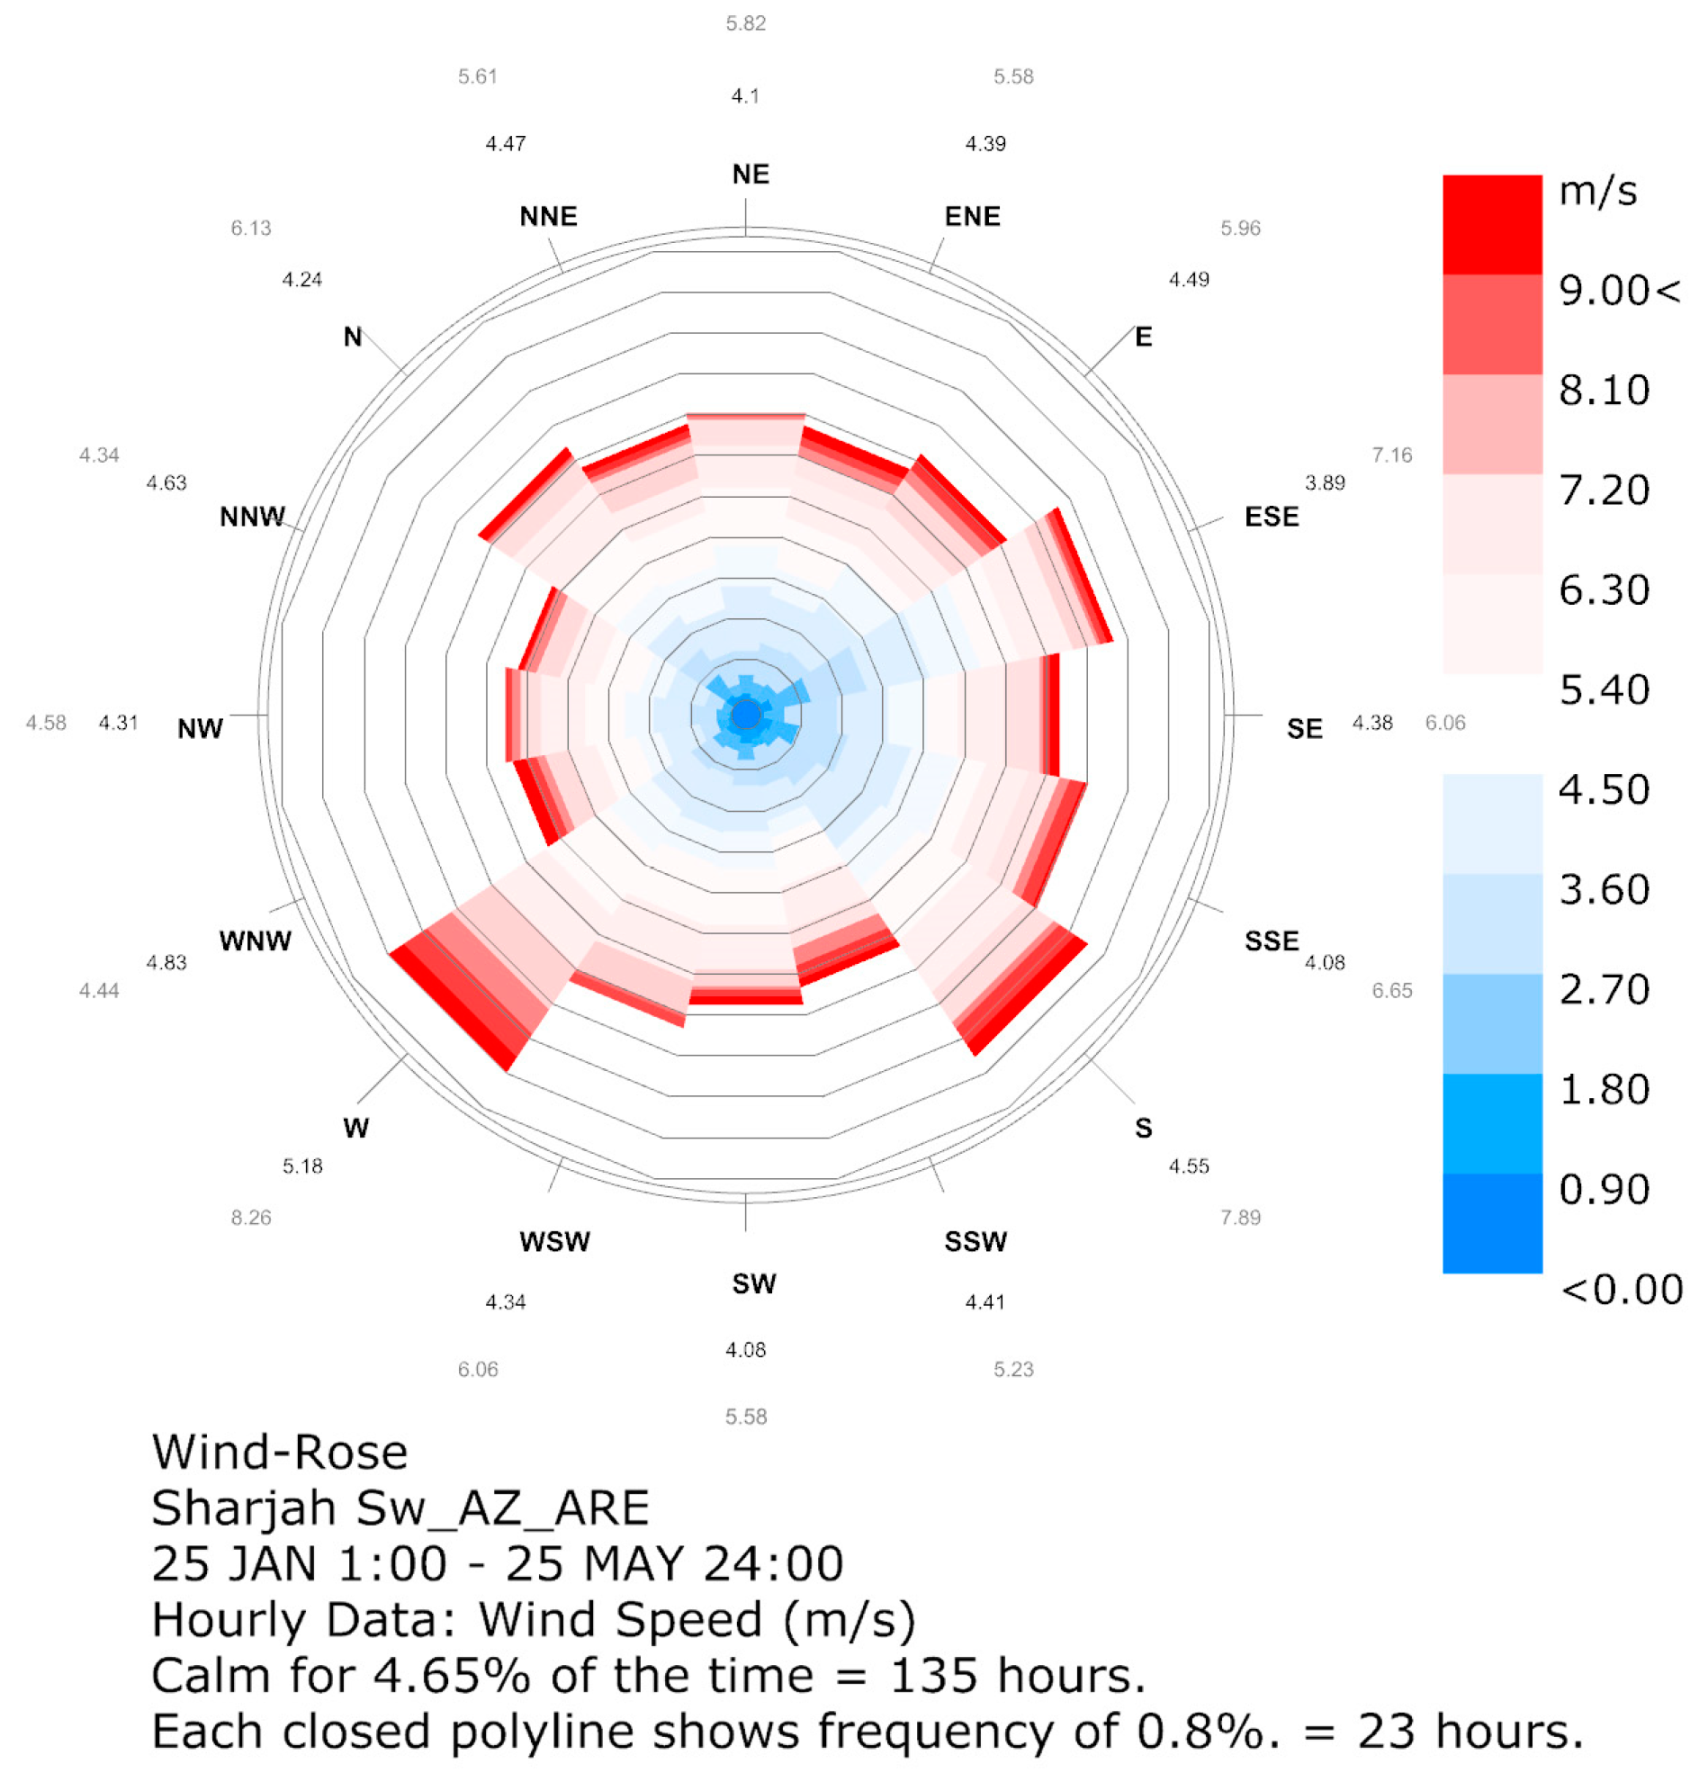
Wind analysis codes (
Figure 10) were written to generate a wind rose diagram that indicated the direction and speed of the wind during a specific period. During the fall semester, the wind blew southwardly 8% of the time at a minimum speed of 3.9 m/s and a maximum speed of 8.01 m/s, as illustrated in
Figure 11. The wind blew eastwardly approximately 6.4% of the time with a minimum speed of 4.27 m/s and a maximum of 6.86 m/s. The wind blew northwestwardly 4% of the time, at a minimum of 4.43 m/s and a maximum speed of 4.56 m/s. For the spring semester, the wind was more likely to blow westwardly with an 8% probability with a minimum wind speed of 5.8 m/s and a maximum speed of 8.26 m/s. The wind blew southwardly with a 7.2% chance with a minimum wind speed of 4.55 m/s and a maximum of 7.86 m/s, as illustrated in
Figure 12. The lowest wind direction frequency was towards the north-northwest with a possibility of 4% and a maximum wind speed of 4.63 m/s.
The codes written to run the wind analysis simulations highlighted the peak months in which higher cooling loads were required. In the fall semester, the months of September to November were considered when testing the performance of the parametric screen. In the spring semester, the month of May was when temperatures began to rise; therefore, the screen’s performance was assessed during this month. As for the peak summer months of June to August, the screen was designed to specifically improve the thermal conditions of the corridor in response to the drastic increases in temperatures and compensate for the decreases in wind frequency and speed.
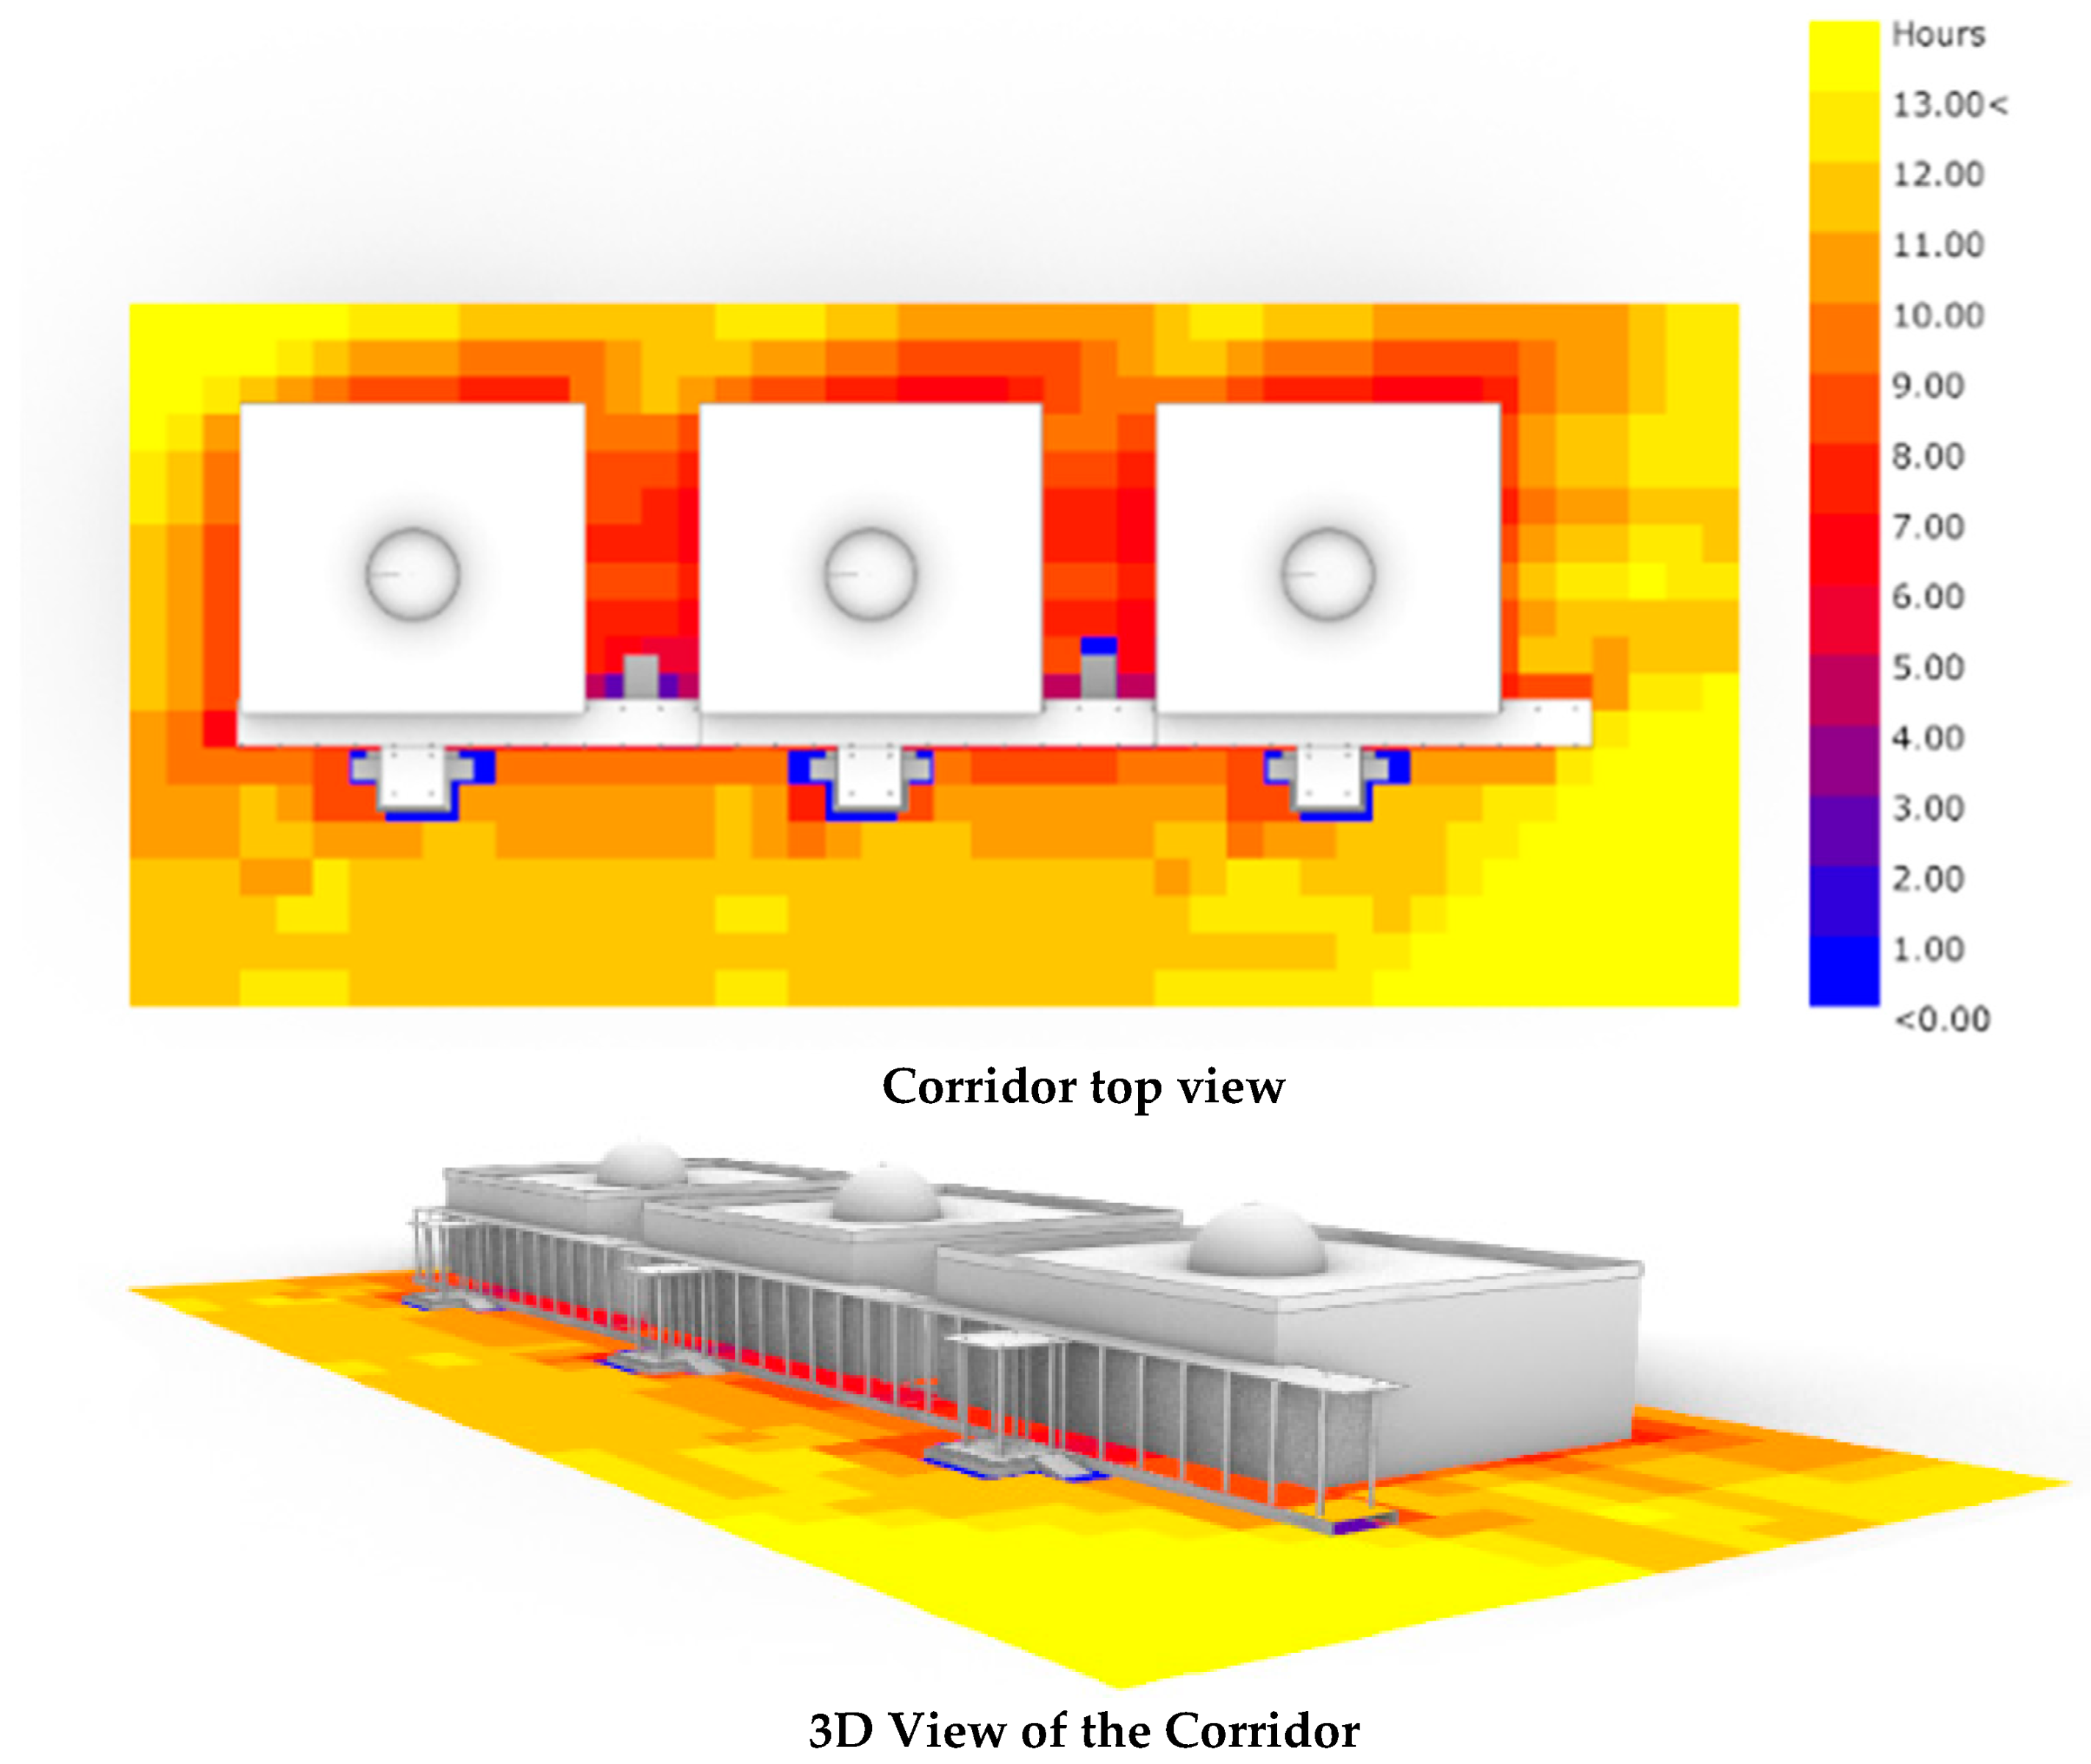
The shadow study codes were written (
Figure 13 and
Figure 14) to estimate the brightness levels and the shadows cast on the corridor due to neighboring buildings. It illustrated the number of hours during which the corridors and their surroundings were exposed to daylight. As shown in
Figure 14, yellow indicates the longest period of 13 h, and blue the lowest with no hours of sunlight.
This environmental specification was a pattern-dependent parameter, meaning that its performance would be influenced by the screen design. As stated by Estidama regulations, the corridor should be shaded for a minimum of 75% during the daytime, which was at least 10 h. This had to be considered when designing the screen to ensure an energy-efficient performing corridor.
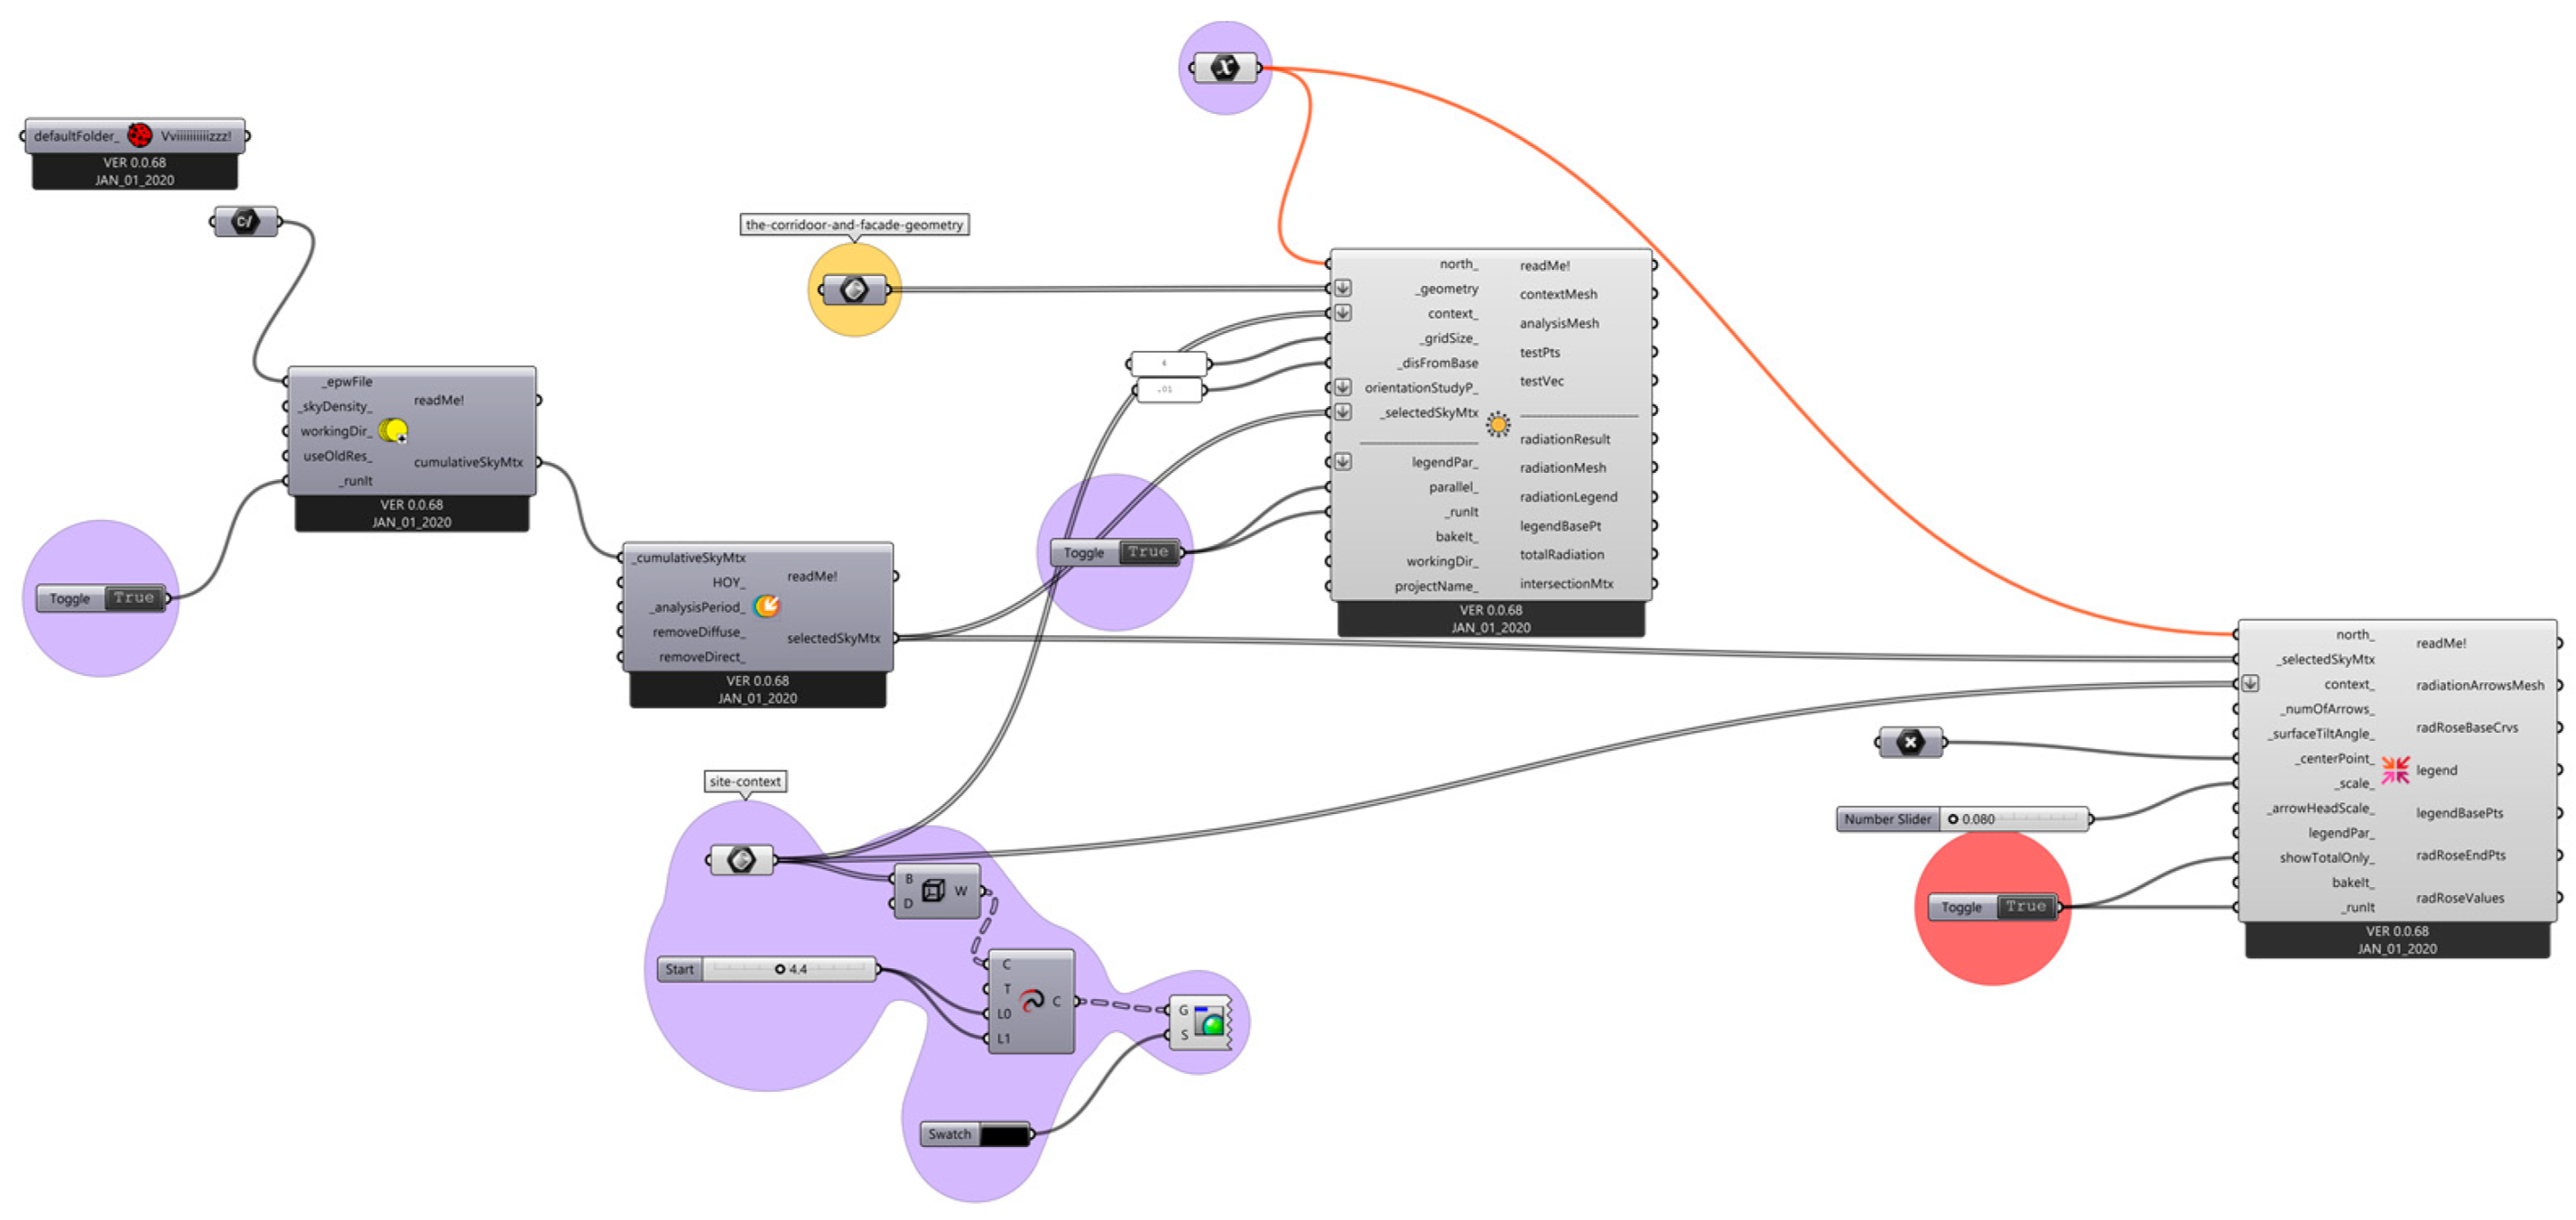
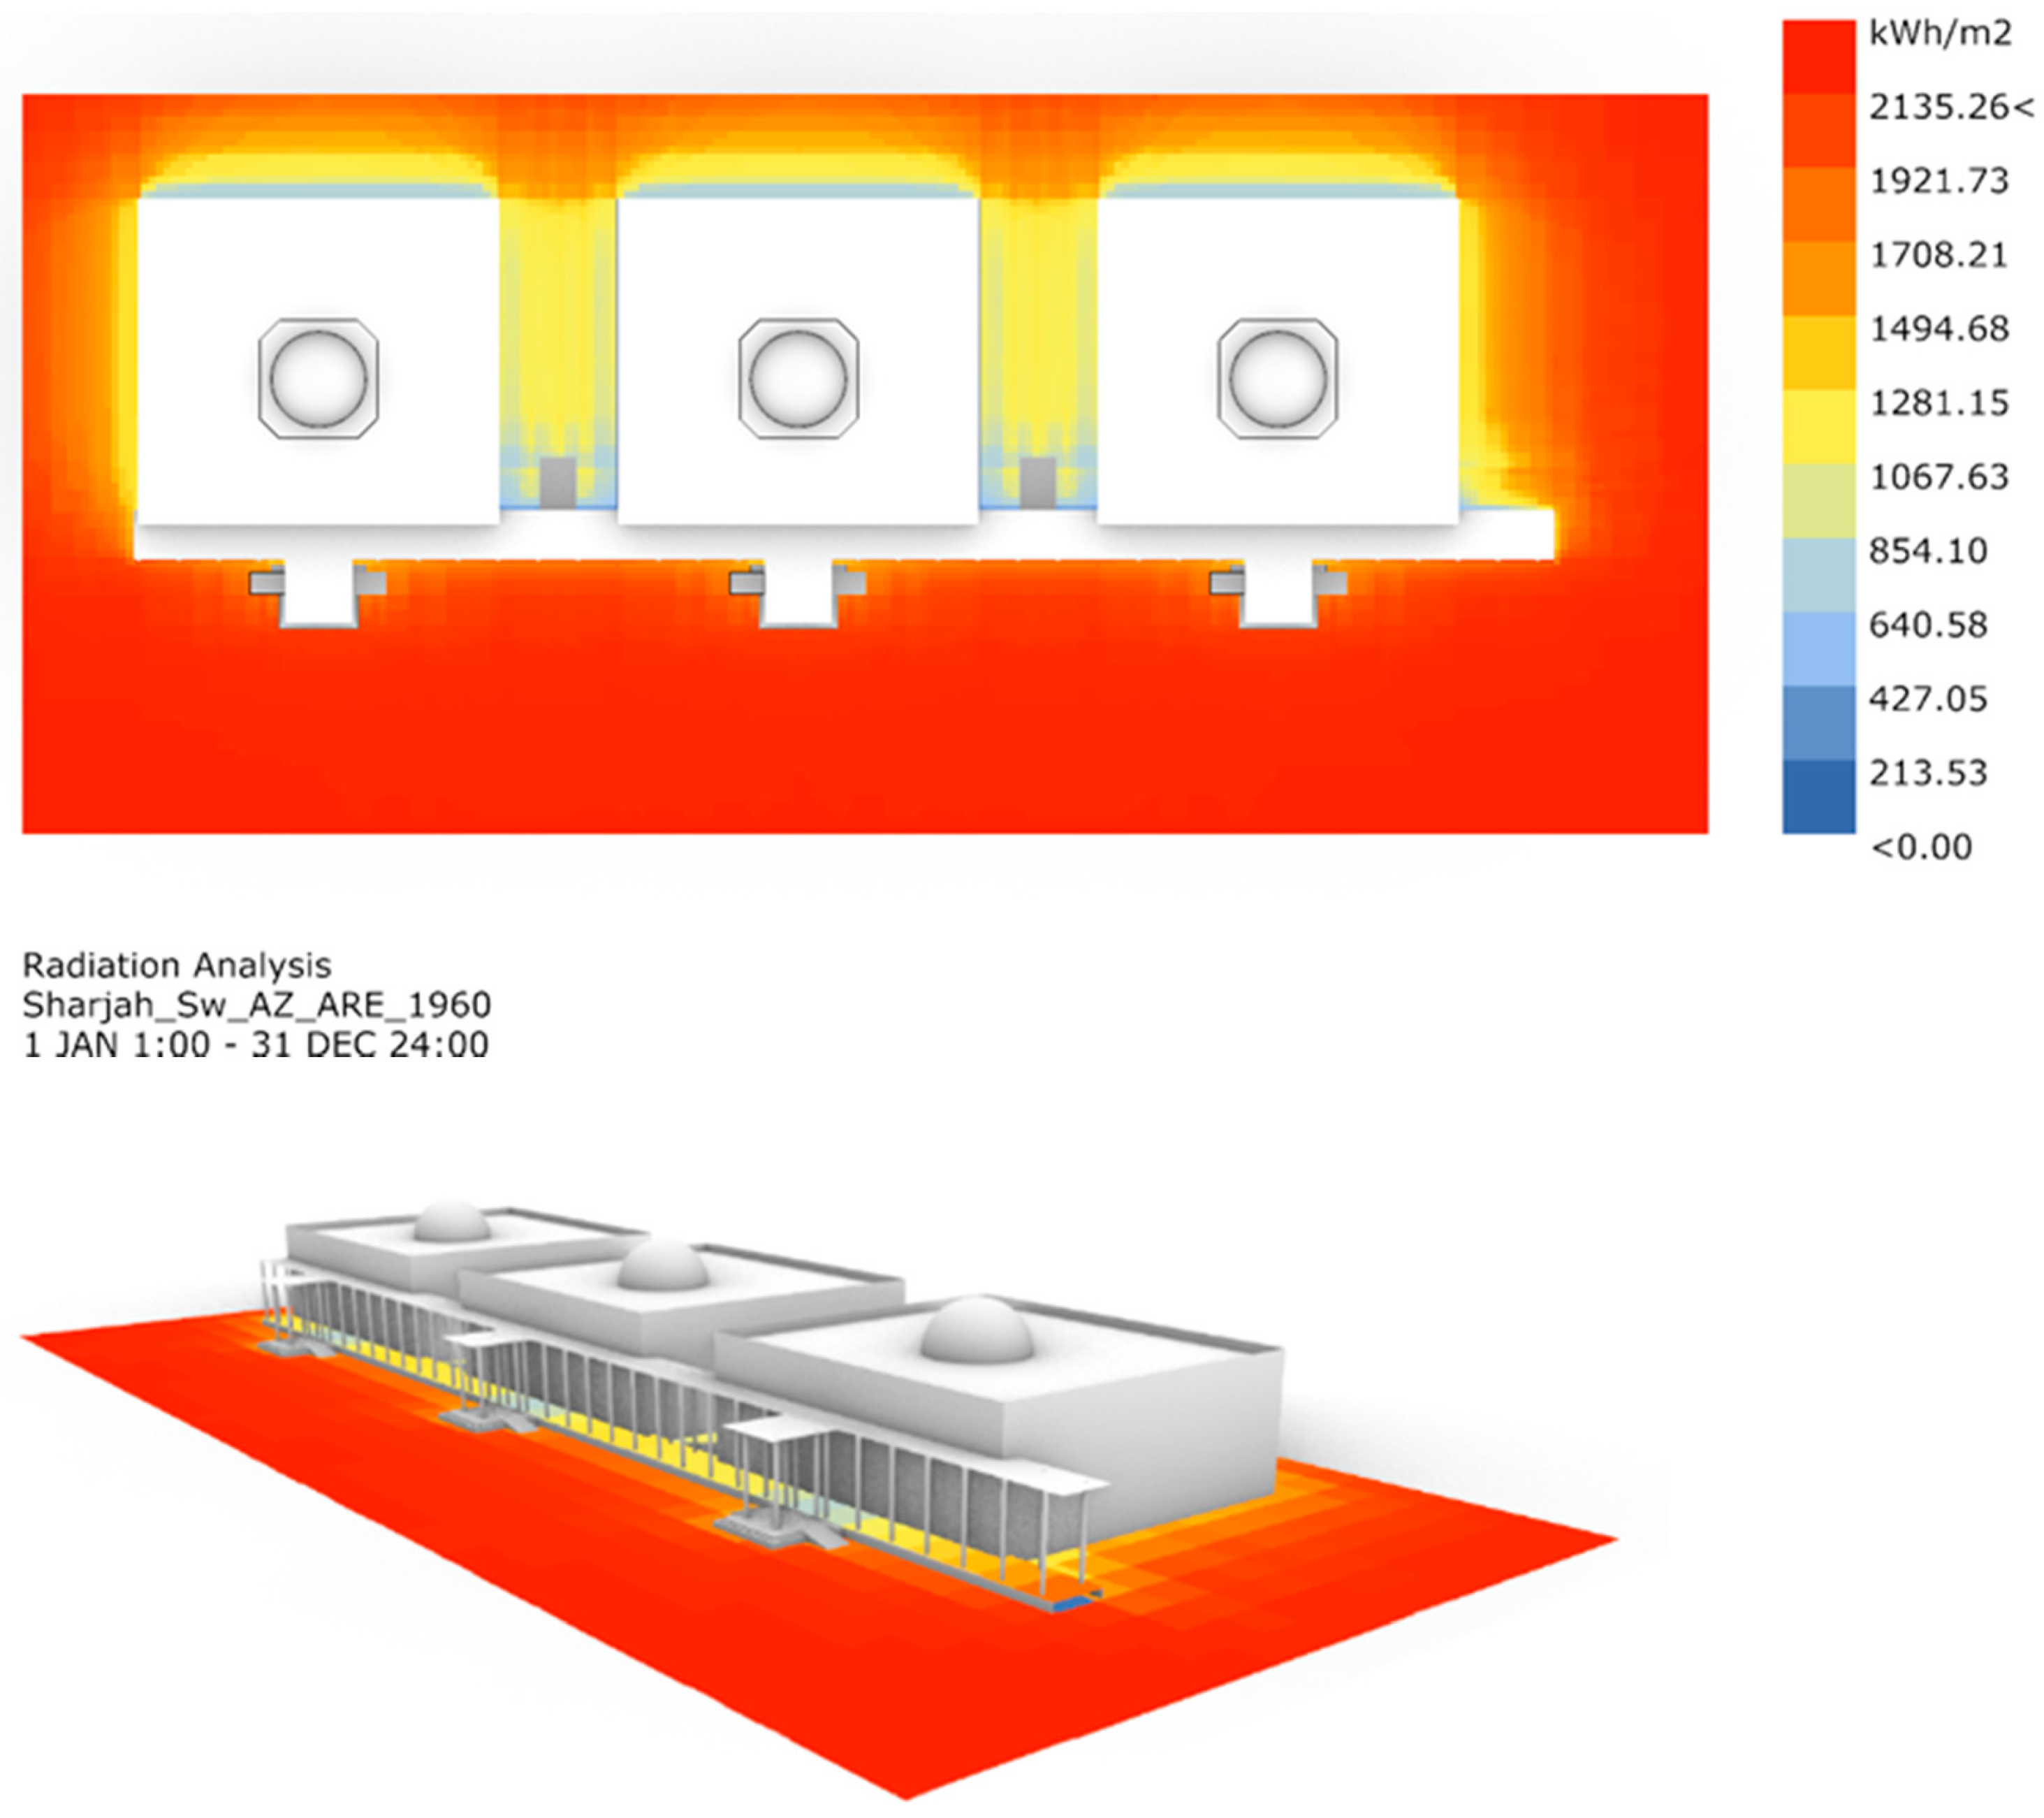
The second specification influenced by the pattern design was the solar radiation analysis. A set of codes was written to illustrate the radiation analysis at a given time, the annual radiation analysis, and the cumulative radiation analysis.
The first code, as in
Figure 15, was written to demonstrate the radiation analysis between June and September during the peak summer months. It illustrated the diffuse radiation, direct radiation, and total radiation in kWh/m
2. For this specification, the north direction and space were the input values to generate the radiation analysis, as shown in
Figure 16. During the hot months of the summer and given that the United Arab Emirates has a desert climate, most of the direct solar radiation reached more than 1100 kWh/m
2 in the southeast and southwest directions, as illustrated in
Figure 17. There was not much overcast solar radiation.
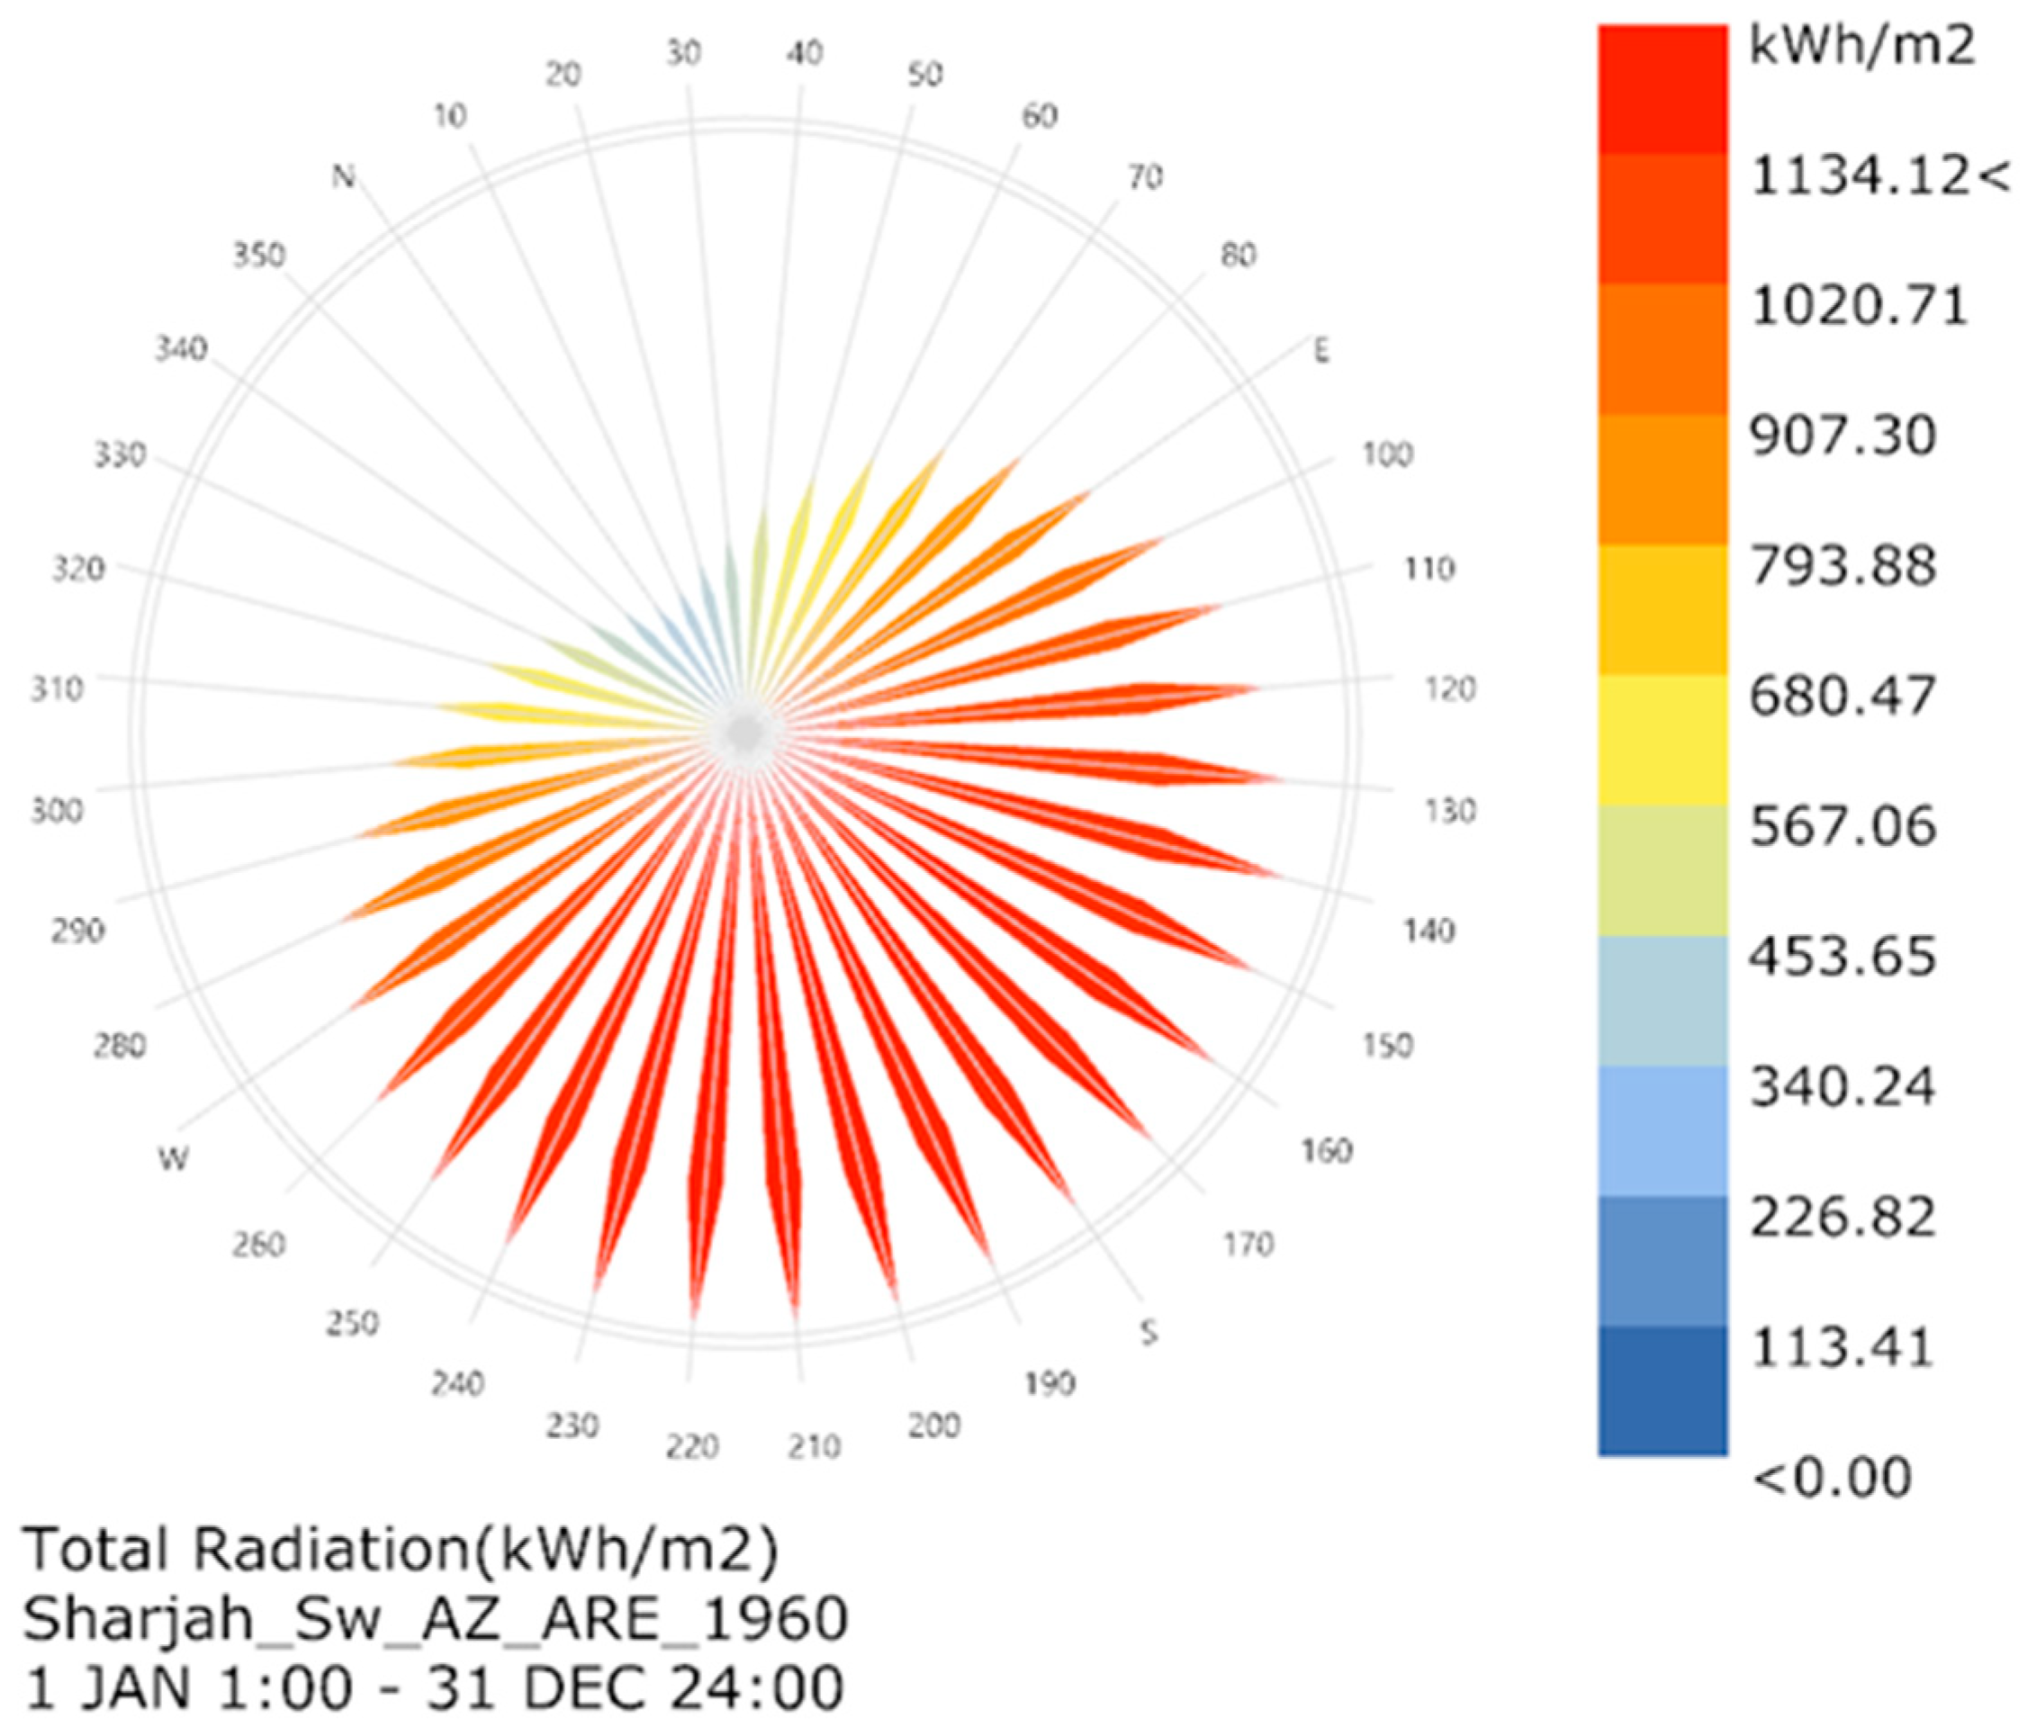
The second set of codes illustrated in
Figure 18 was the total radiation depending on the building orientation. As illustrated in
Figure 17, the north direction received adequate radiation levels of approximately 340 kWh/m
2; for the south direction, where the sun was perpendicular to the ground at noon during peak summer months, there was an estimated level of 1134 kWh/m
2.
The final set of codes,
Figure 19, demonstrated the cumulative solar analysis radiation with the average daylight received annually. The colors in
Figure 20 show much light the corridor received from the sun, with red being the highest and blue being the lowest. Certain parts of the corridor received sufficient daylight, compared to surroundings. Therefore, the screen would be designed to improve the visual performance of the corridor and the conditions influenced by the high solar radiation received.
5. Screen Design
In addition to these results, a screen was designed for implementation at the University of Sharjah, being the “cultural capital” of the United Arab Emirates, with architectural identity leaning more towards oriental and Islamic designs to create an aesthetically pleasing addition and to blend in with the existing architecture.
The following section discusses design philosophy and how Rhinoceros 3D and Grasshopper were utilized to achieve the desired model, as well as the analysis of the generated patterns’ thermal and visual performance according to environmental specifications.
5.1. Phase 1: Screen Design Concept
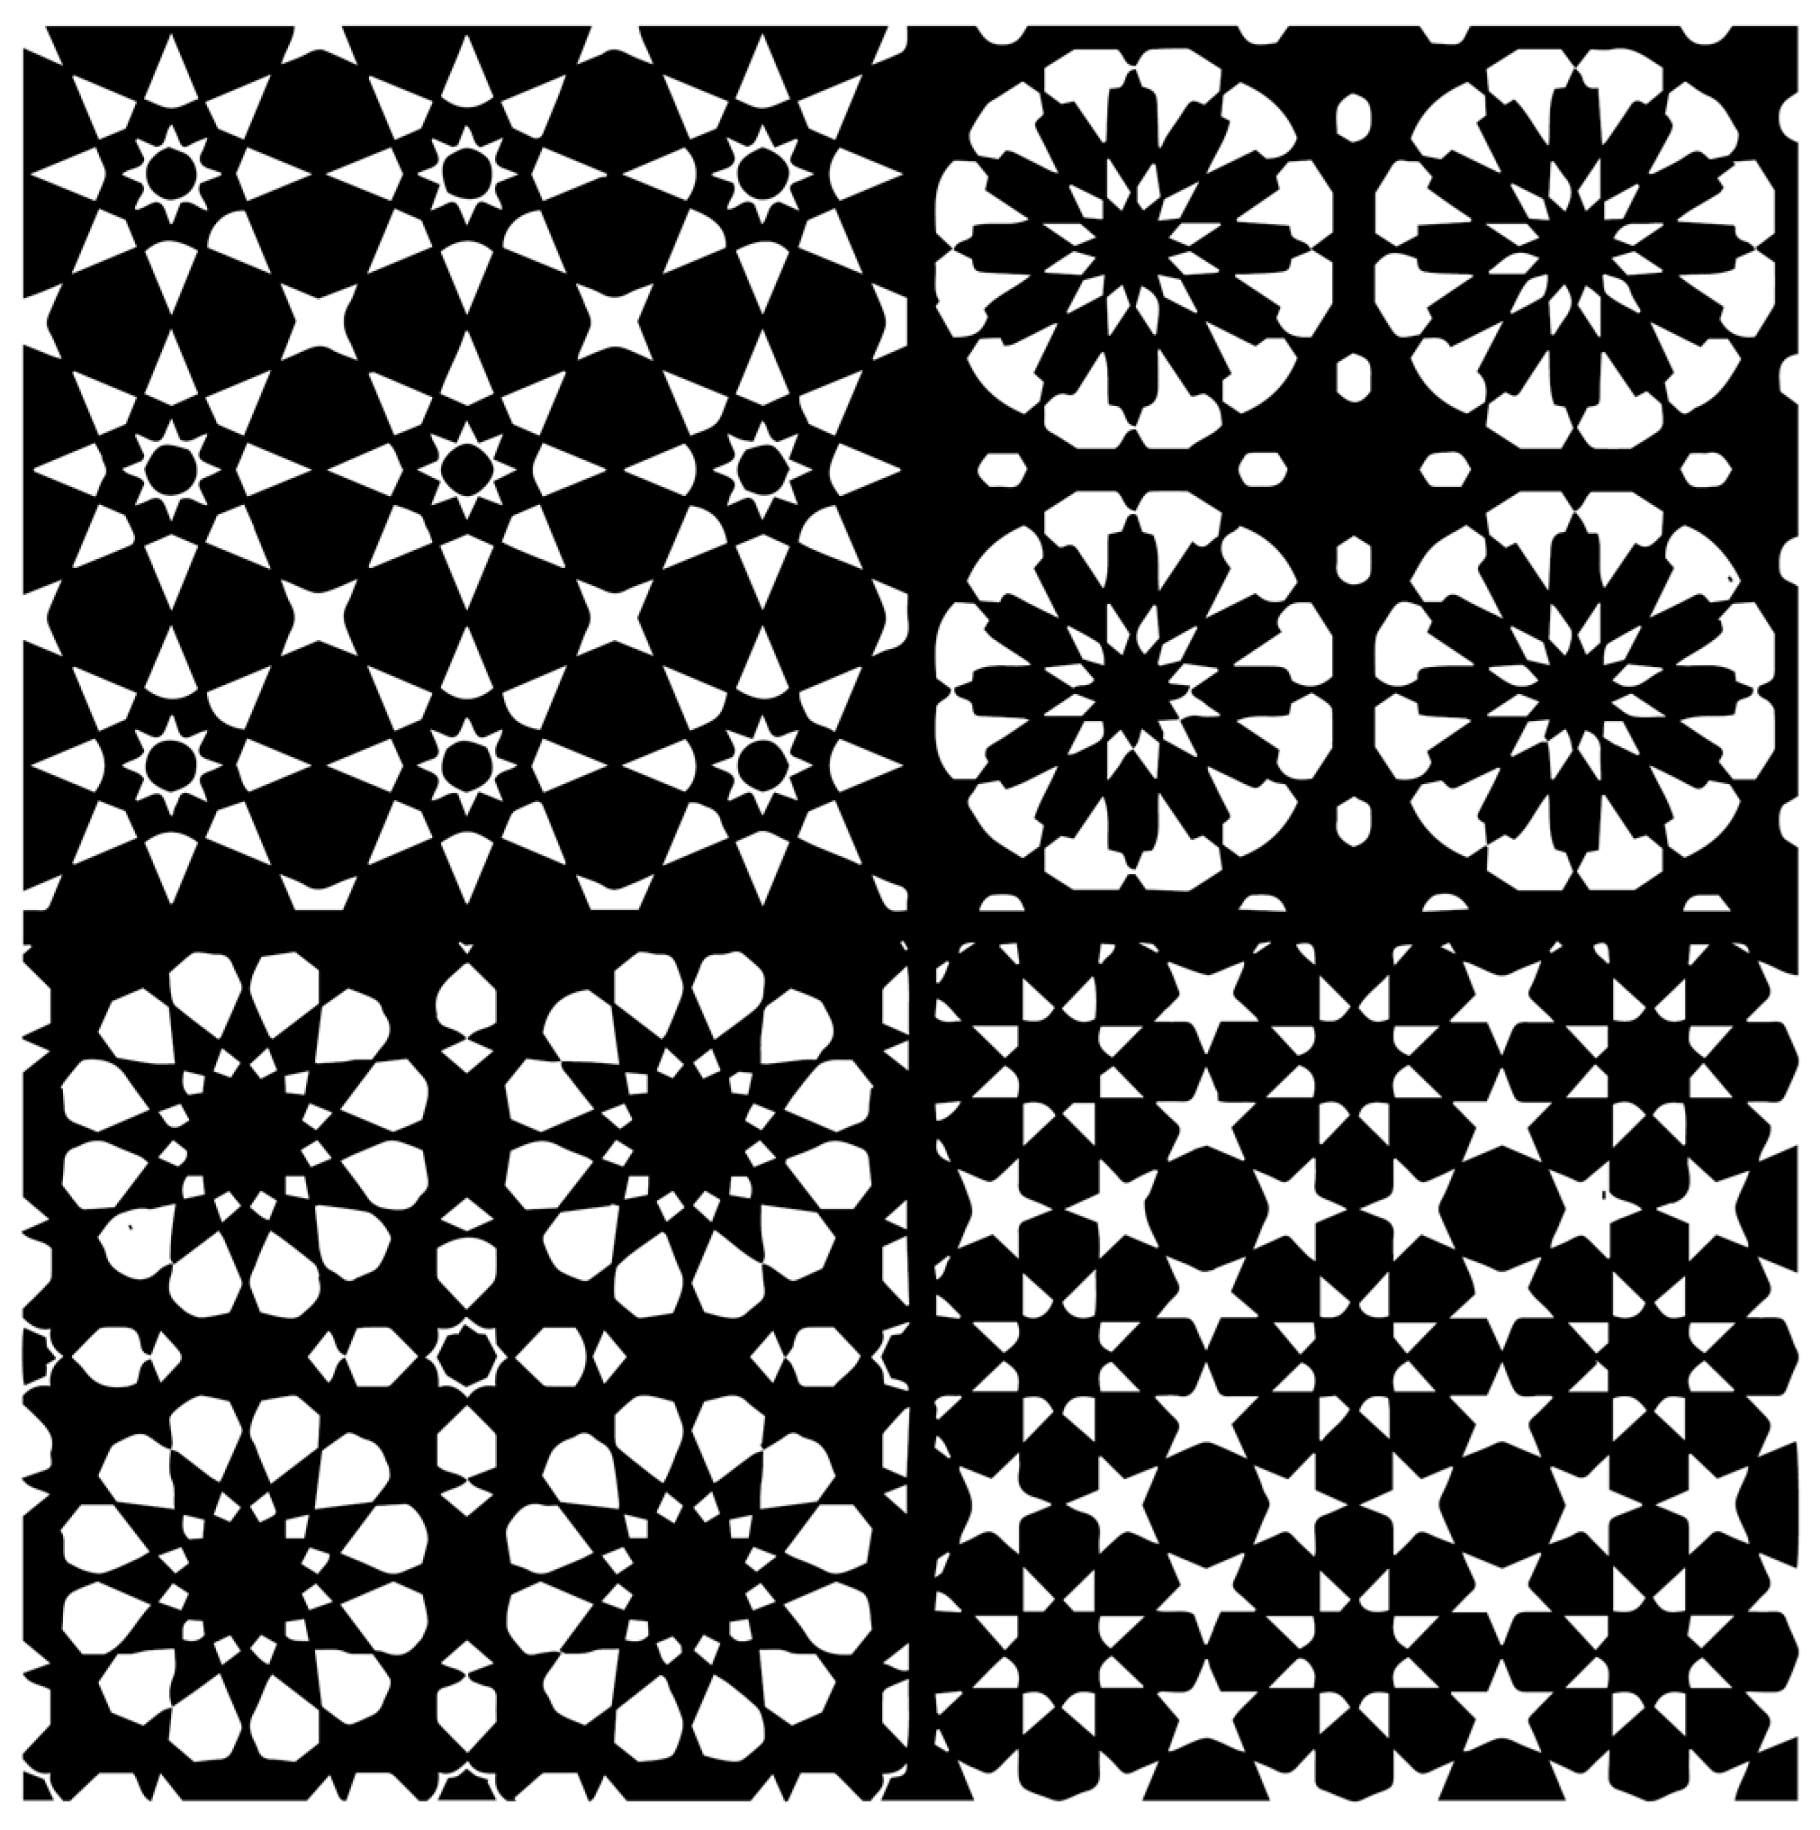
Geometric patterns are a significant characteristic of Islamic architecture typically found in countries such as Spain, Iran, Morocco, and Turkey. These ornate patterns, as shown in
Figure 21, can be defined as triangular-based polygons that often occur as star shapes and are often engraved on building facades or assembled from latticework and terracotta tiles. This style is referred to as “zellij” [
18].
There is no historical evidence as to how these patterns were designed. Given that Islamic scholars had mastered mathematics and had an exceptional understanding of geometry, these patterns may be formulaic in design. With technological advancements and programs dedicated to mathematical formulation, it was practical to utilize these resources to generate further formulas developed by the Islamic scholars to provide the desired ornate star-shaped geometric patterns [
18].
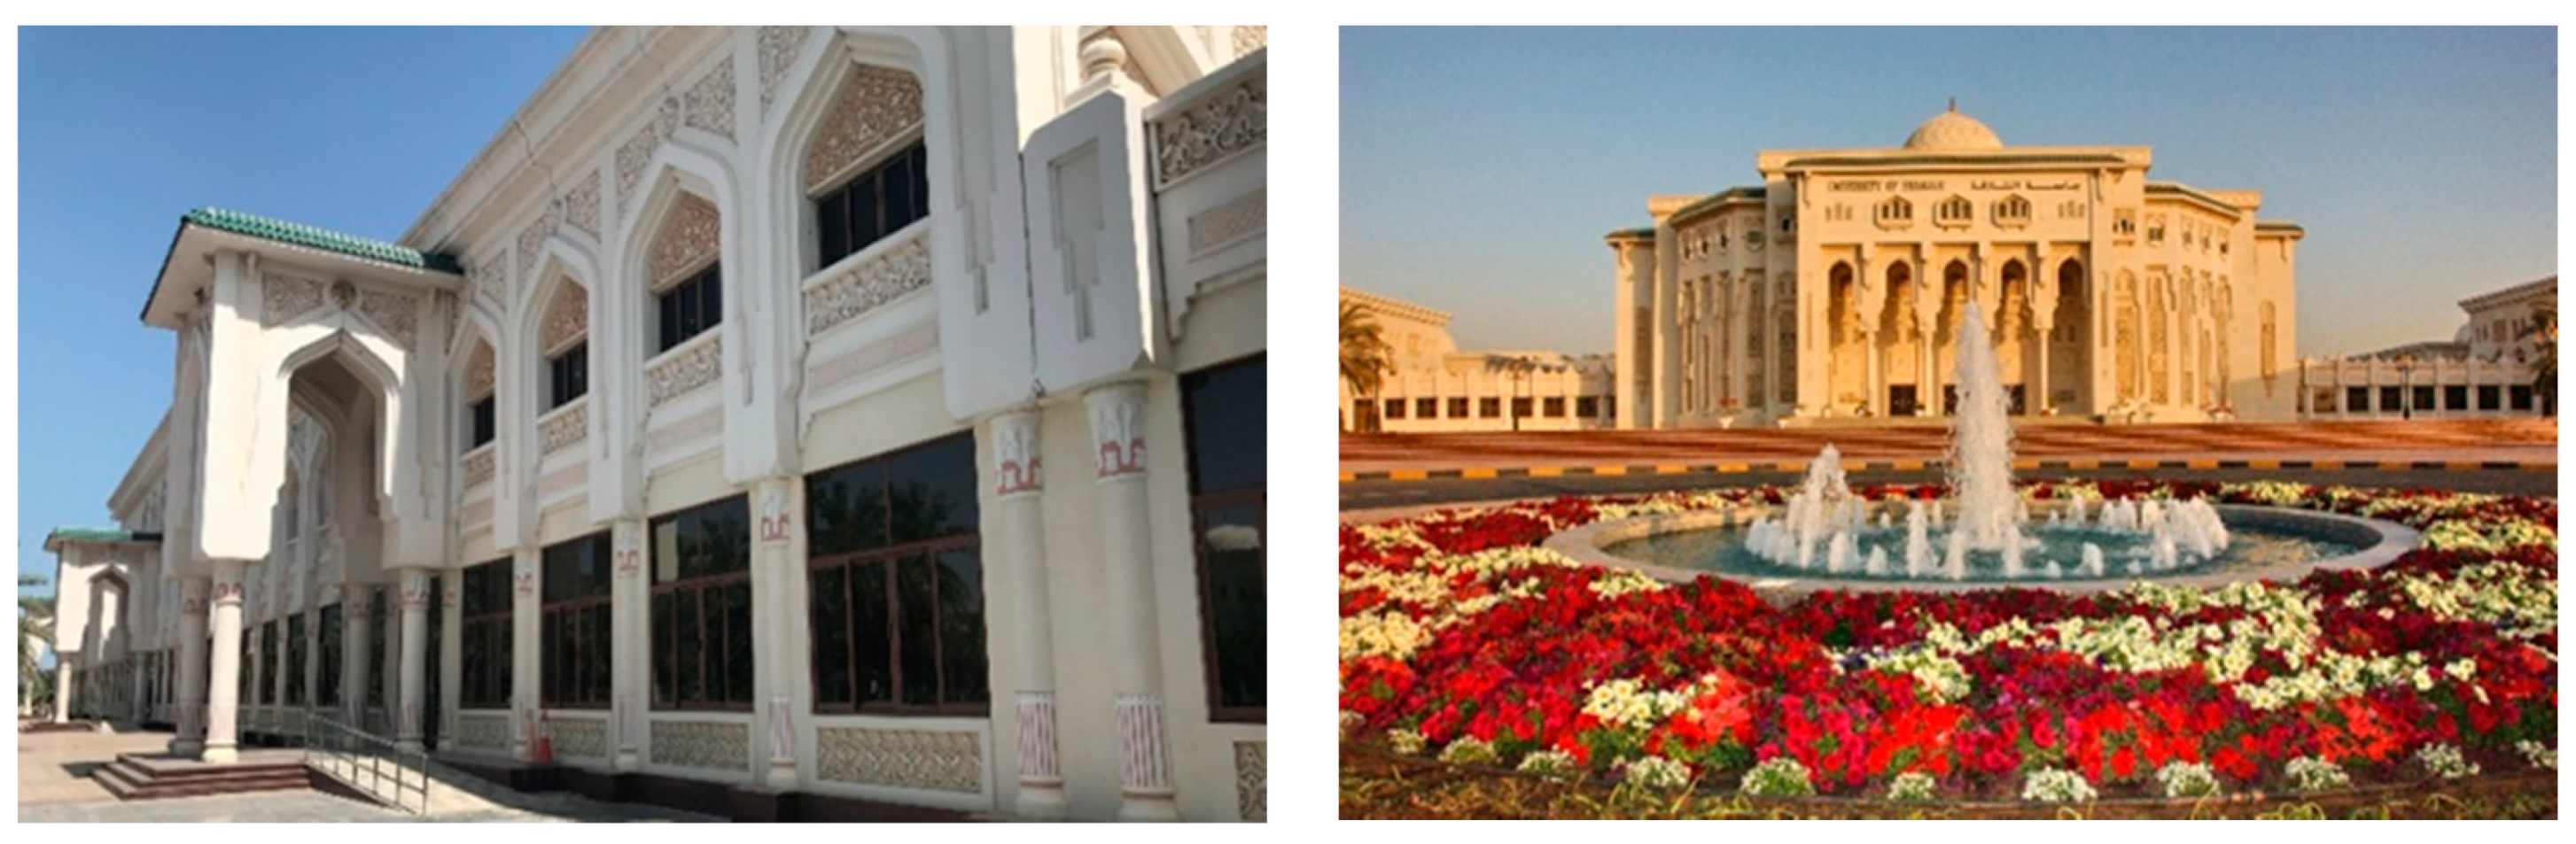
The University of Sharjah employs arcs, domes, and geometric patterns as part of its design scheme, as shown in
Figure 22. These geometric patterns are typically found as engravings on walls, shading screens covering windows, or as outdoor shading elements [
19]. This categorization sets clear benchmarks for the design approach and concept when designing the shading screen.
The basic shape of the pattern was chosen to match the current design and appearance of the university building. The script was designed in Grasshopper as a parametric design with the chosen pattern that would maintain daylighting performance in this corridor. In order to achieve sufficient comfort levels, these patterns were designed in varying shapes, sizes, and distributions according to the basic understanding of thermal sciences.
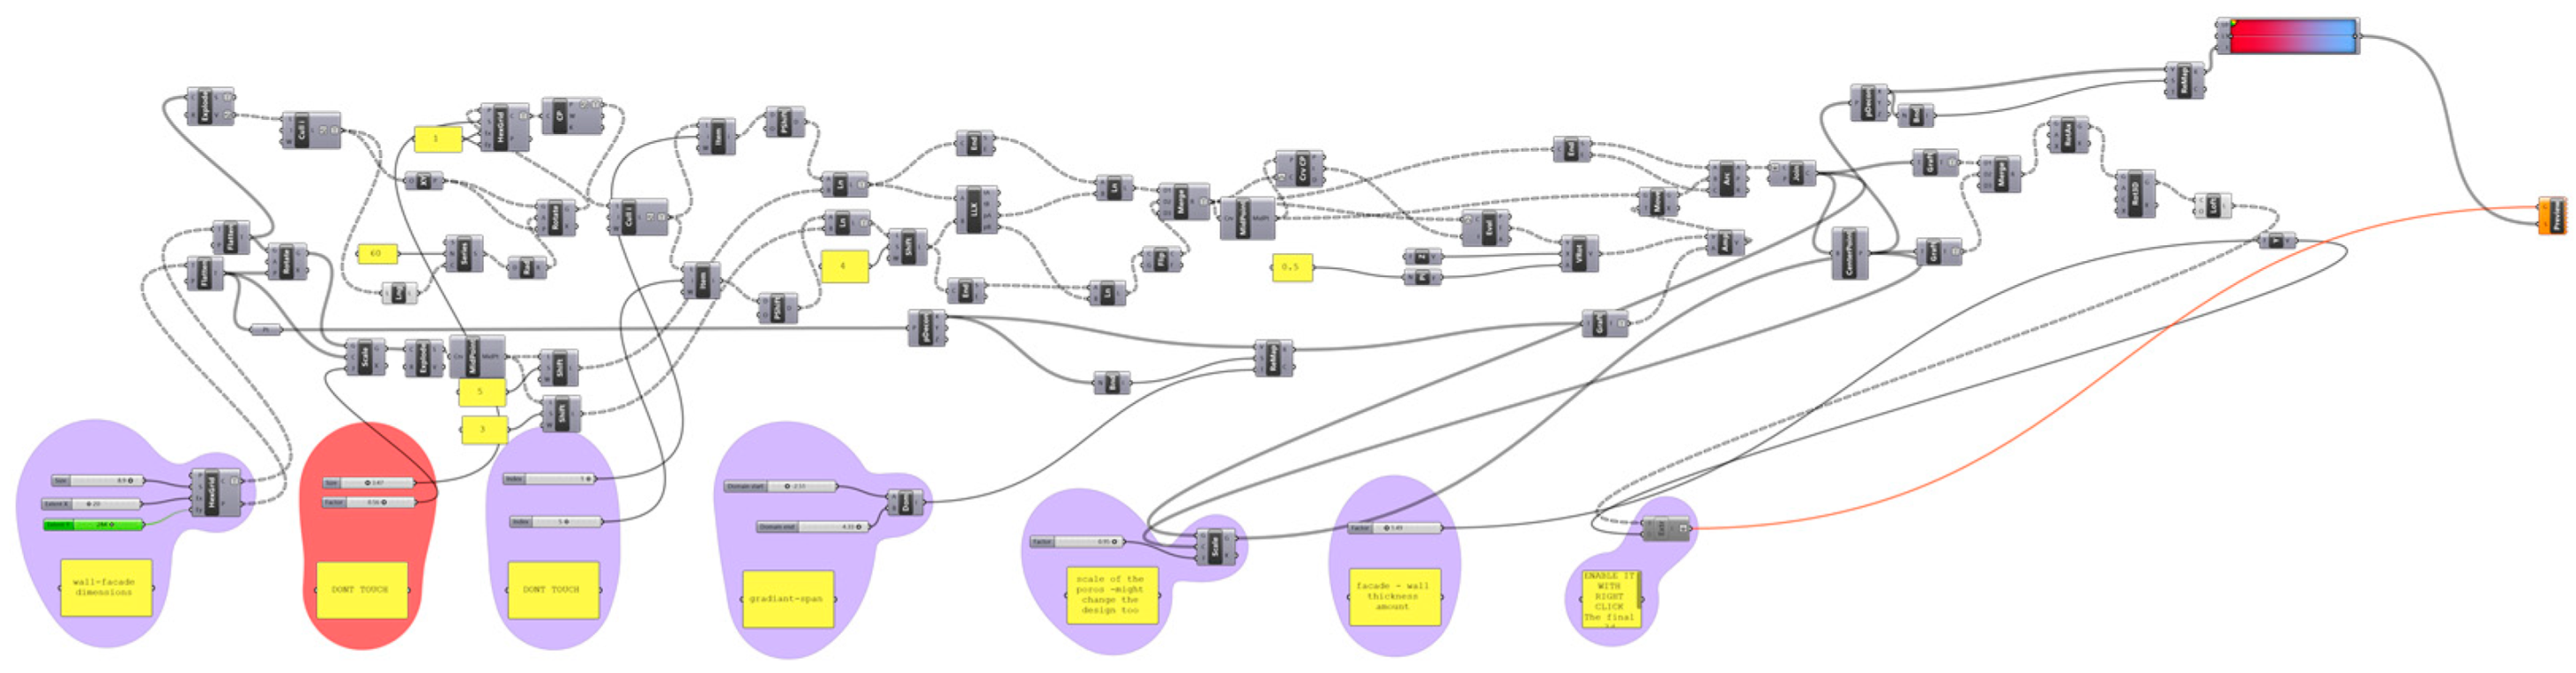
The script shown in
Figure 23 can generate an infinite number of alternatives based on the same basic shape of the main pattern. This shape was differentiated based on two parameters. The first was the porous percentage to be detailed in phase 2. The second parameter was the gradient range that would control the porous arrangement in the pattern to be detailed in phase 3.
5.2. Phase 2: Generating Performative Patterns of the Façade Design
A code set was written to generate different pattern typologies that had various porous sizes and followed a vertical gradient.
Figure 24 shows the codes, as written on Grasshopper, where specific parameters were input, creating different design options. The first parameter required the façade’s height and length. The second parameter controlled the gradient span, which determined the number of times the porous size transitioned and reoccurred. The second parameter influenced the porous size scale, which was influenced by the gradient span. These factors resulted in a change of the porous size vertically along the screen. Lastly, a thickness was an input factor for screen depth depending on the material used, which allowed for accurate assumptions when analyzing the pattern’s energy performance.
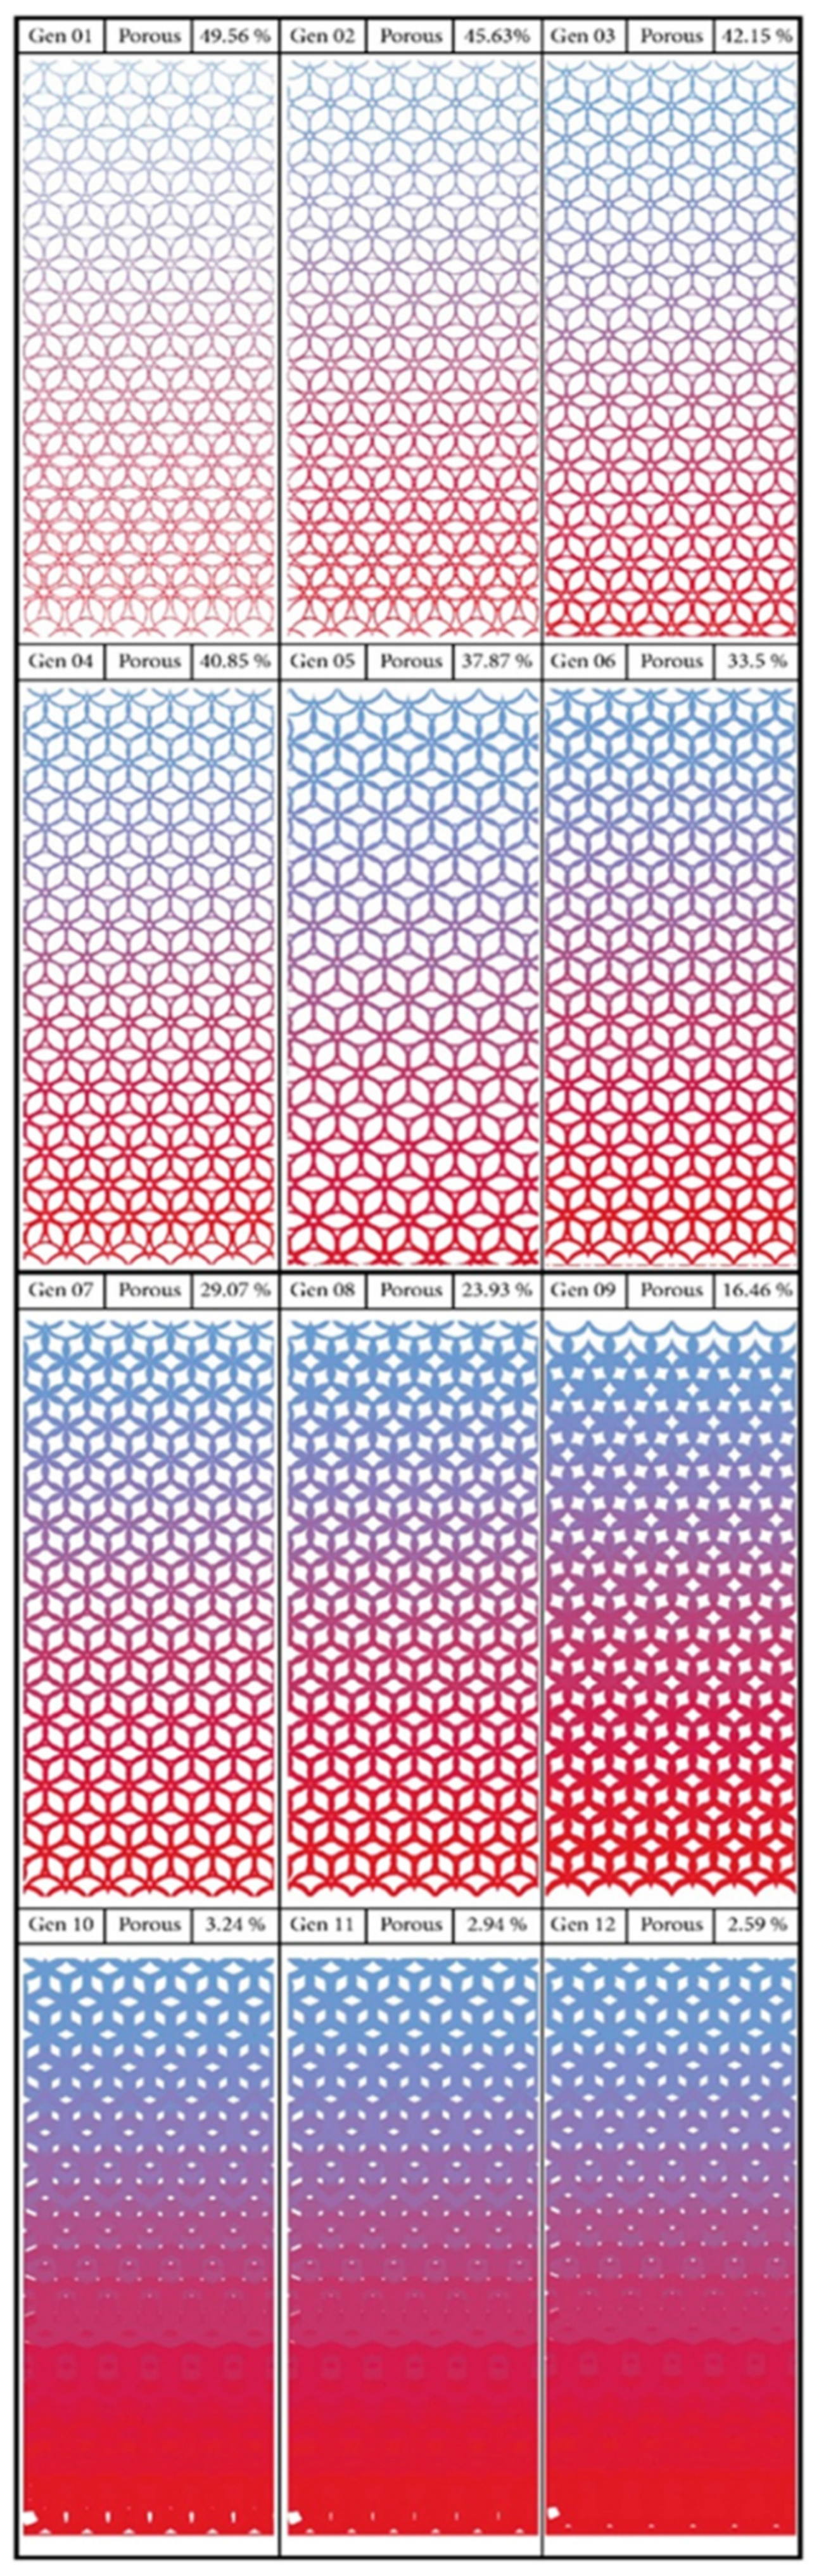
Twelve pattern generations, divided into three similar sections, were created based on a porous percentage from approximately 49.6% to 2.6%, according to the shape of the corridor. Only one section was tested to reduce the computational time and effort of modeling and simulation.
5.3. Phase 3: Analyzing the Performance of Generated Patterns
The third phase was focused on the environmental performance of the generated screen and to analyze its influence on the visual and environmental conditions of the corridor.
For comparison, and to ensure optimal environmental performance, the corridor and its surroundings were modeled in Rhinoceros 3D. The initial environmental performance of the corridor was then assessed through the environmental specification codes, as shown in
Figure 25.
Based on the annual sun path diagram, we concluded that the screen should consider the solar radiation exposure of the corridor during the peak summer months of June to August. The wind rose diagram demonstrated that the temperatures rose in May, while the wind speed decreased, peaking in June to August. The screen was designed to utilize the prevailing winds during the summer months.
The Rhinoceros 3D model was defined in the Grasshopper code to run the solar radiation analysis regarding the pattern-dependent parameters.
In this phase, the current generations of the pattern were assessed based on the two indicators, daylight and solar radiation, to optimize the corridor’s performance concerning visual and solar radiation and thermal comfort.
5.3.1. Daylight Analysis
Daylighting performance analysis was based on the useful daylight illumination (UDLI) indicator, which referred to the percentage of time during the active occupancy hours that the test point received daylight illumination. As per a previous classification [
20], the illuminance in the study was classified as the following:
Daylight illuminance below 100 lux (i.e., E < 100 lux) was considered inadequate as either the only lighting source or as a remarkable contribution to artificial lighting.
Daylight illuminance between 100 and 500 lux (i.e., 100 < E < 500 lux) was considered as efficient lighting levels that may still require additional artificial lighting sources.
Daylight illuminance between 500 and 2000 lux (i.e., 500 < E < 2000 lux) was perceived as either advisable or at least acceptable.
Daylight illuminance of more than 2000 lux (i.e., E > 2000 lux) was considered as causing both visual and thermal discomfort.
The illuminance levels between 100 and 2000 lux could be merged into one layer as acceptable and advisable illuminance levels to be utilized in the space.
The main advantage of this indicator was the division into three layers. The first layer was UDLI < 100 lux. This layer was below the required illumination levels, which needed to be minimized; however, its effect could be eliminated by providing artificial lighting. The second layer was UDLI = 100–2000 lux. The second layer was the target for the daylighting analysis, which needed to be maximized to optimize the visual comfort in the corridor. The third layer was UDLI > 2000 lux. The third layer was the required illumination level, which increased the glare levels and needed to be minimized, and it was the most critical part as it could not be maintained in the same generation.
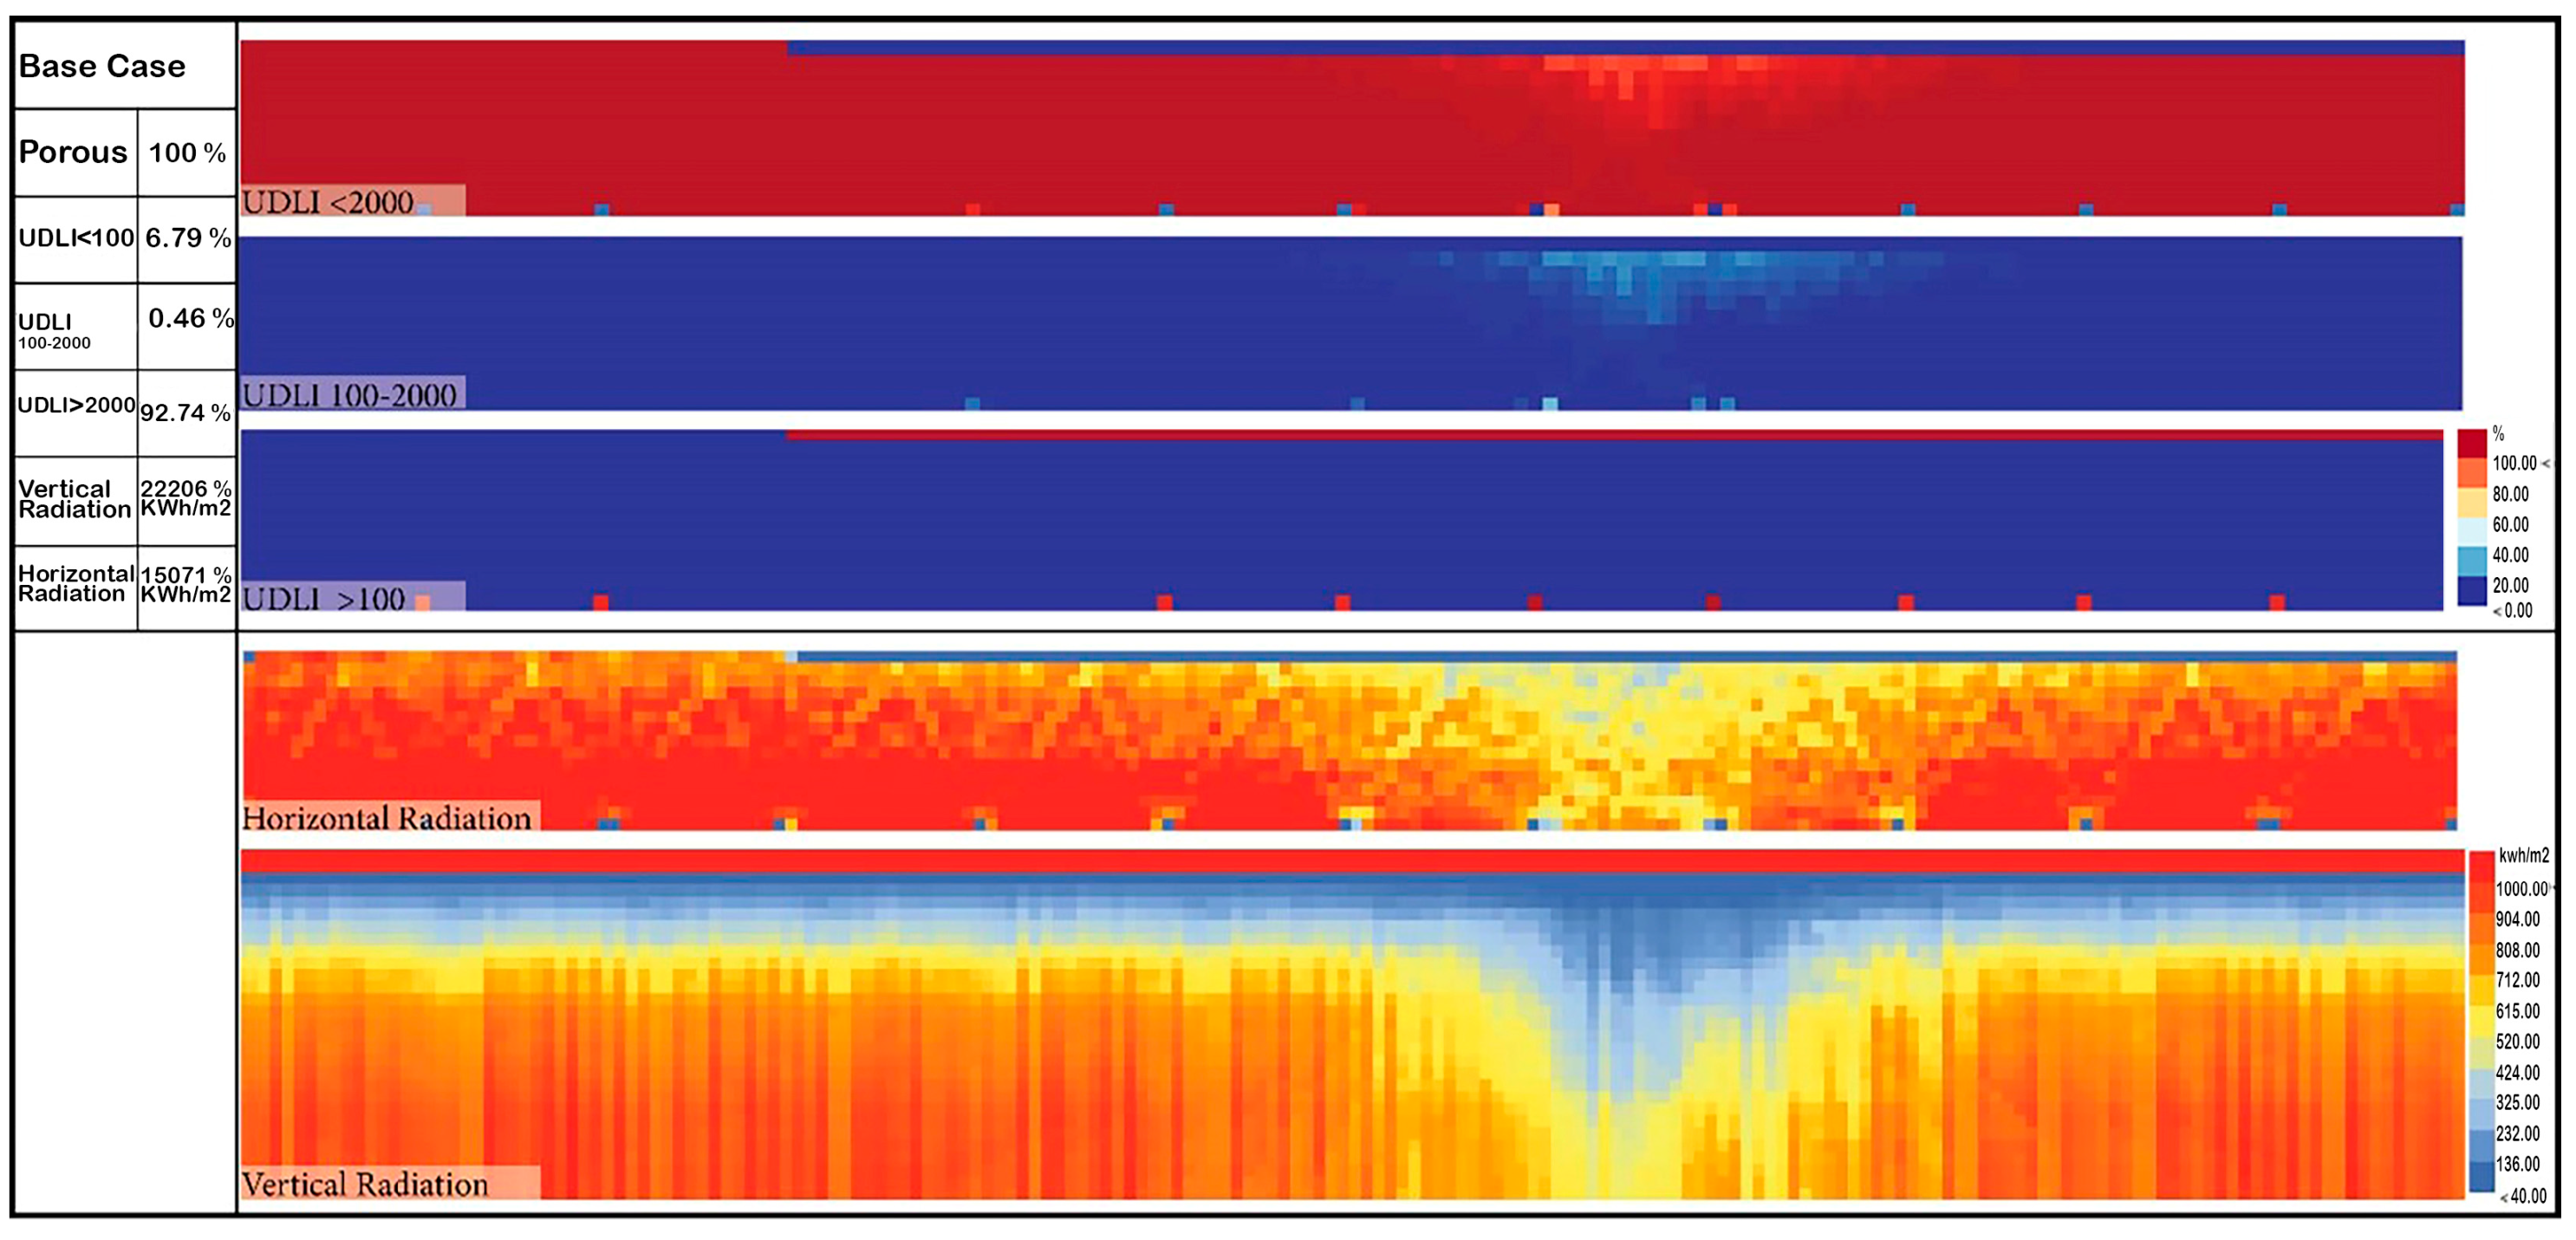
Daylighting Analysis for the Current Status
By conducting the daylighting simulation for the current condition of the corridor, we found that the useful daylight illumination levels were very low. As seen in
Figure 25, UDLI 100–2000 lux was only 0.46% while UDLI > 2000 lux was 92.74%, and UDLI < 100 lux was only 6.79%. That indicated that the corridor occupants would experience an uncomfortable glare until later in the day, when the lighting levels had to maintained using artificial sources. This result showed that the corridor could be enhanced with shading devices that could reduce the potential glare without increasing the insufficient daylight levels. When the designed patterns were tested, there was no way to minimize UDLI < 100 lux below 6.79% except with material reflection or artificial lighting.
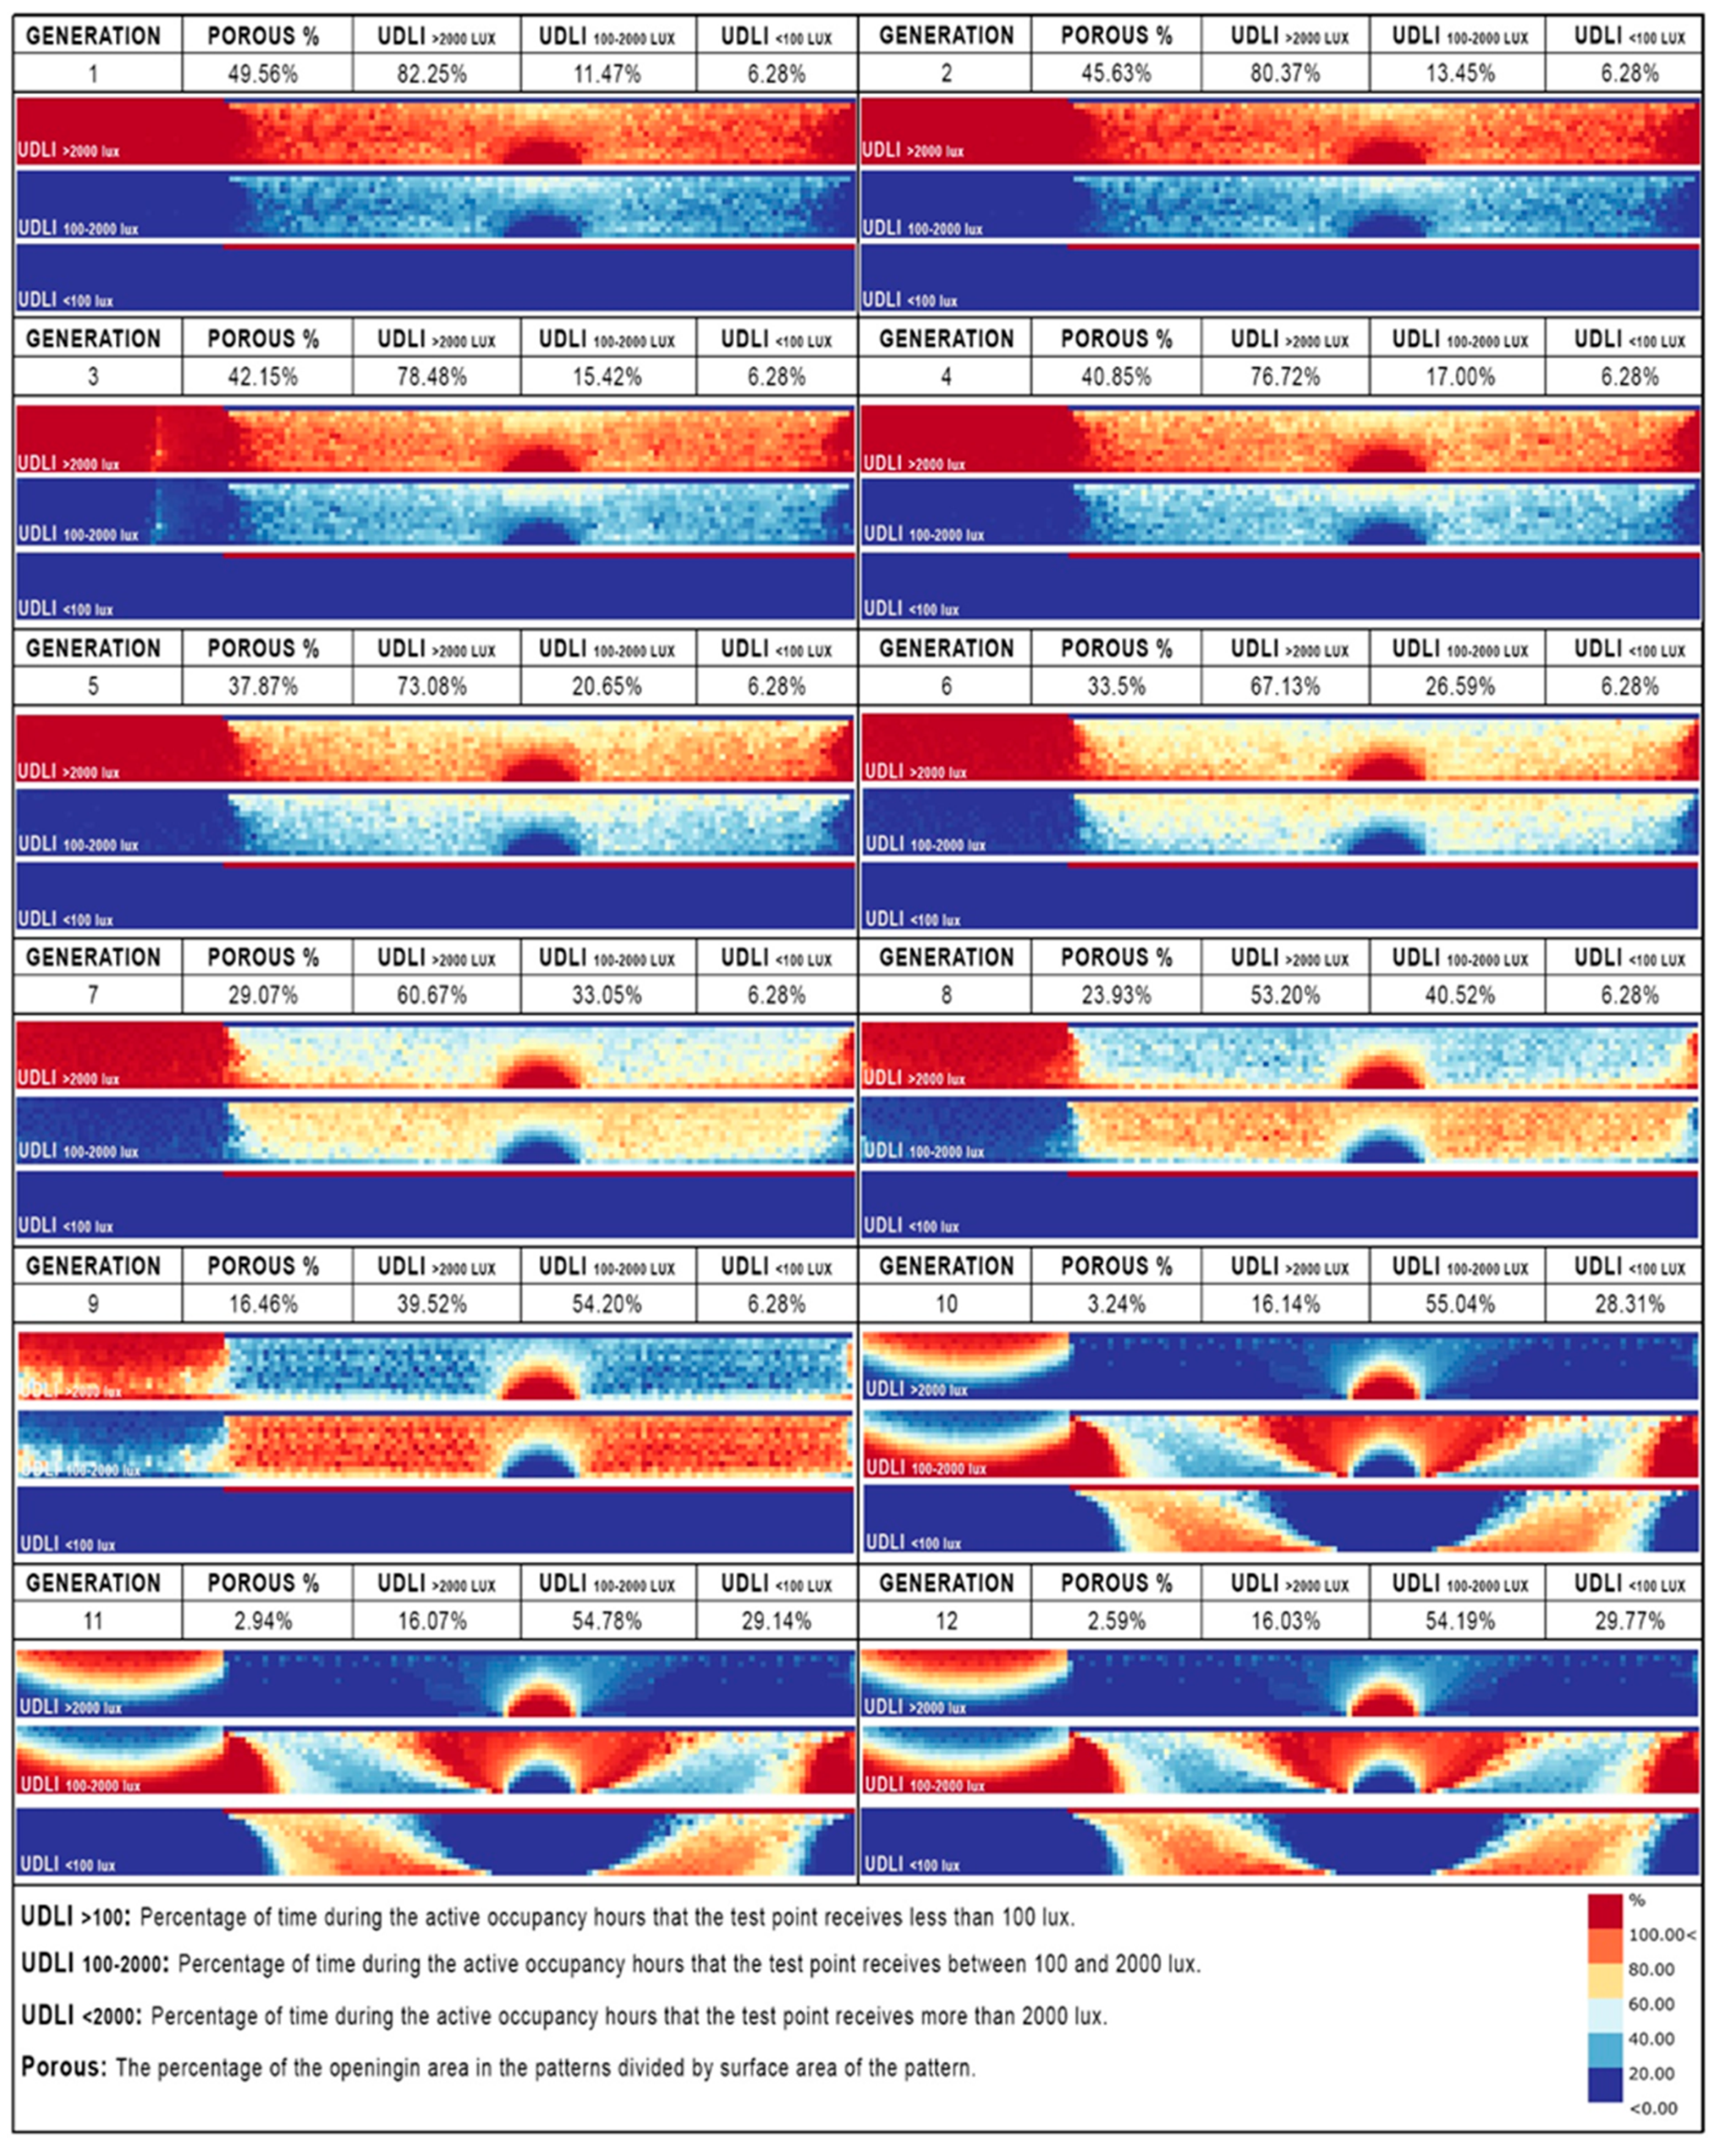
Daylighting Analysis for Pattern Generation
The generated pattern number 1, as shown in
Figure 26, had a porous percentage of 49.57% and showed some improvement at the UDLI (100–2000) levels, compared to the current evaluation of the corridor. UDLI (100–2000) was increased from 11% to 11.47%, UDLI (<100) value was the same by 6.28%, but UDLI (>2000) was reduced by 10% to reach 82.25%.
Generation numbers 2–9 listed in
Table 1 revealed that the porous percentage was reduced gradually from 45.63% to 16.46%. This reduction caused a gradual optimization in
from 13.45% in generation 2 to 54.2% in generation 9. Meanwhile, the
maintained the same value in all generations by 6.28%, while
continuously decreased from 80.37% in generation 2 until it reached 39.52% in generation 9.
In generation 10, the porous percentage was 3.24%, which affected the (55.04%), the peak value in all the generated patterns, while it had a major increase on , which reached 28.31%. The was reduced to 16.14%.
In generations 11 and 12, the porous percentages had lower values of 2.94% and 2.54%, respectively. The was gradually reduced to 54.78% and 54.19%, respectively. While continued to decrease, the continued to increase, each reaching 29.14% and 29.77%, respectively.
5.3.2. Solar Radiation Analysis
In this analysis, two types of radiation analysis were considered. All patterns were assessed based on the radiation exposure of the corridor flooring. Afterward, the vertical radiation was estimated using a vertical test plan located in the corridor center. The horizontal and vertical radiation served as indicators for the thermal comfort of the corridor resulting from radiation. The less radiation received on the horizontal and vertical tested surfaces, the more assured the thermal comfort would be. It was considered thermally comfortable if the humidity and wind speed factors were fixed.
Radiation Analysis for the Current Status
The radiation analysis shown in
Figure 26 indicated high levels of radiation exposure both horizontally and vertically. The horizontal radiation exposure was 15,071 kWh/m
2, while the vertical radiation was 22,206 kWh/m
2. These values suggested that shading devices were needed to disrupt the high rate of radiation exposure, which negatively affected thermal comfort in the corridor.
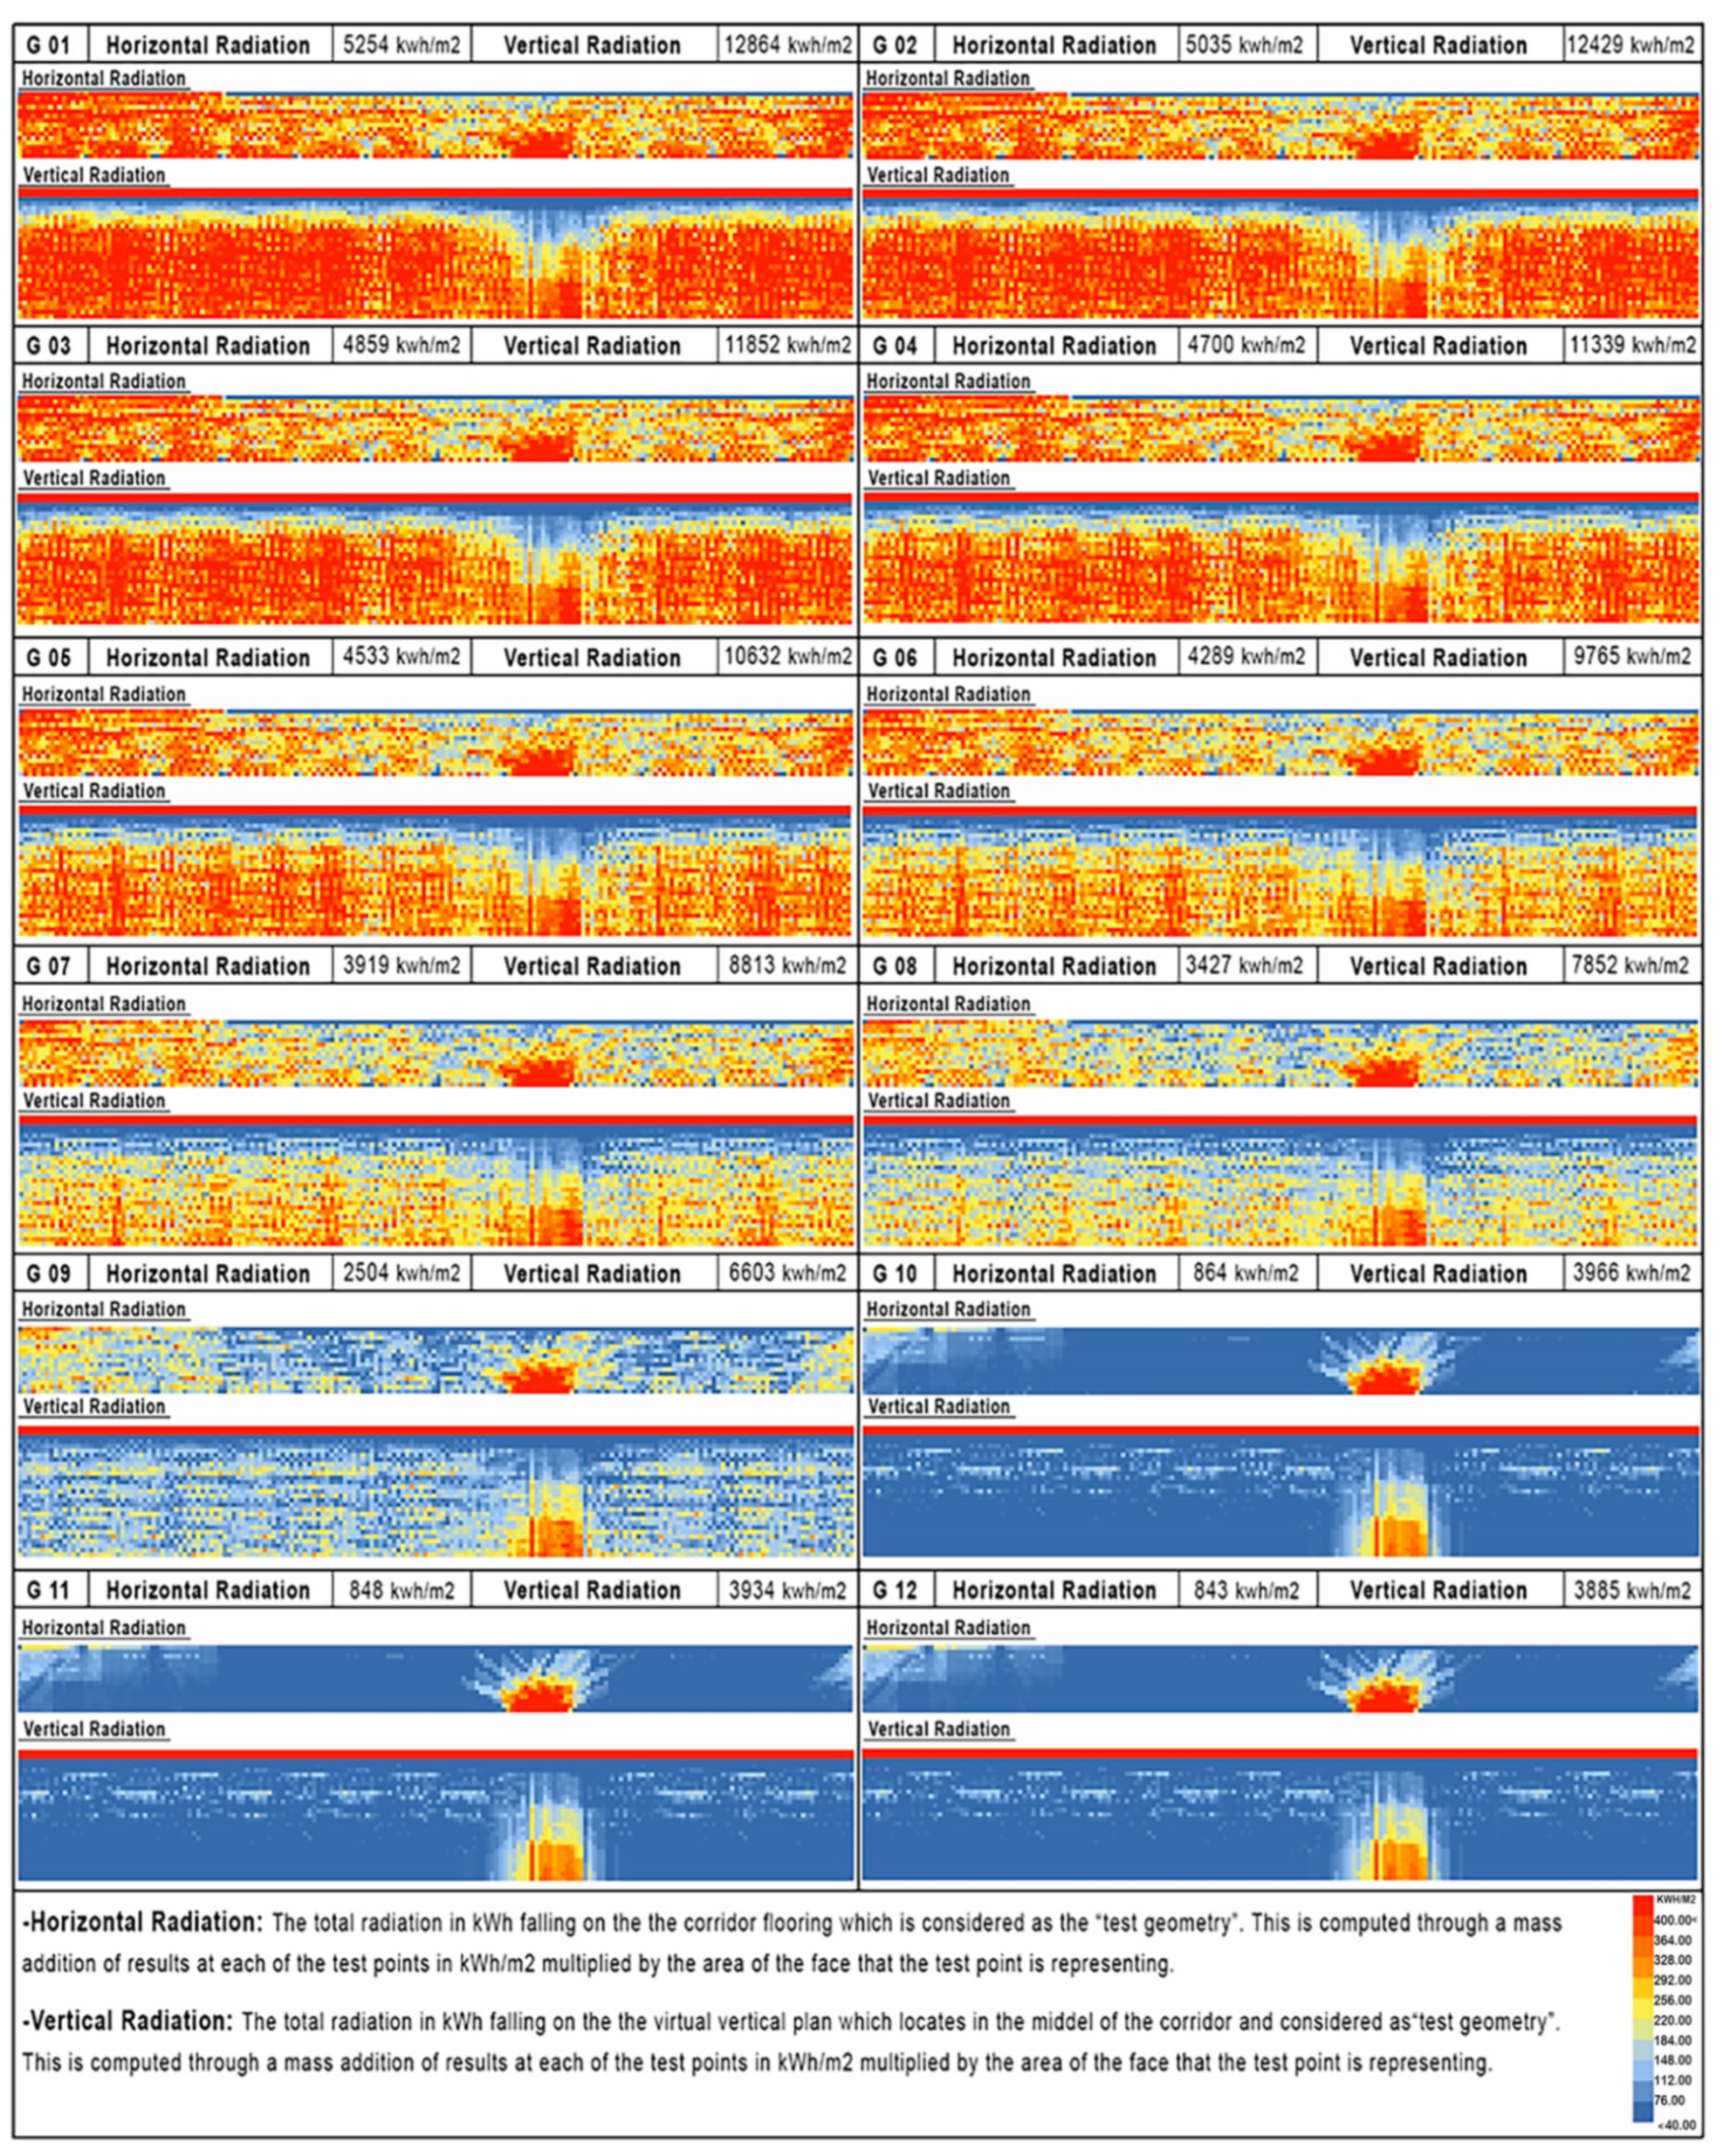
Radiation Analysis of the Pattern Generations
Generated pattern 1, as shown in
Figure 27, was installed in the corridor, which reduced the horizontal radiation exposure, where the horizontal radiation showed a sharp decrease to 5254 kWh/m
2. Similarly, the vertical radiation also received less radiation and decreased to 12,864 kWh/m
2Patterns 2–9 showed a gradual reduction in horizontal and vertical radiation values, as seen in
Table 2. The horizontal radiation in pattern 2 was 5035 kWh/m
2, and gradually decreased to 2504 kWh/m
2 in pattern 9. Similarly, the vertical radiation was 12,429 kWh/m
2 in pattern 2, and then declined until reaching 6603 kWh/m
2 in pattern 9. Afterward, a significant drop in pattern 10 showed that the horizontal and vertical radiation exposure levels were 864 kWh/m
2 and 3960 kWh/m
2, respectively.
In patterns 11 and 12, there were no significant achievements in the radiation results; horizontal radiation was 848 kWh/m2 and 843 kWh/m2, but the vertical radiation was 3934 kWh/m2 and 3885 kWh/m2, respectively.
5.3.3. Porous Gradient Parameter
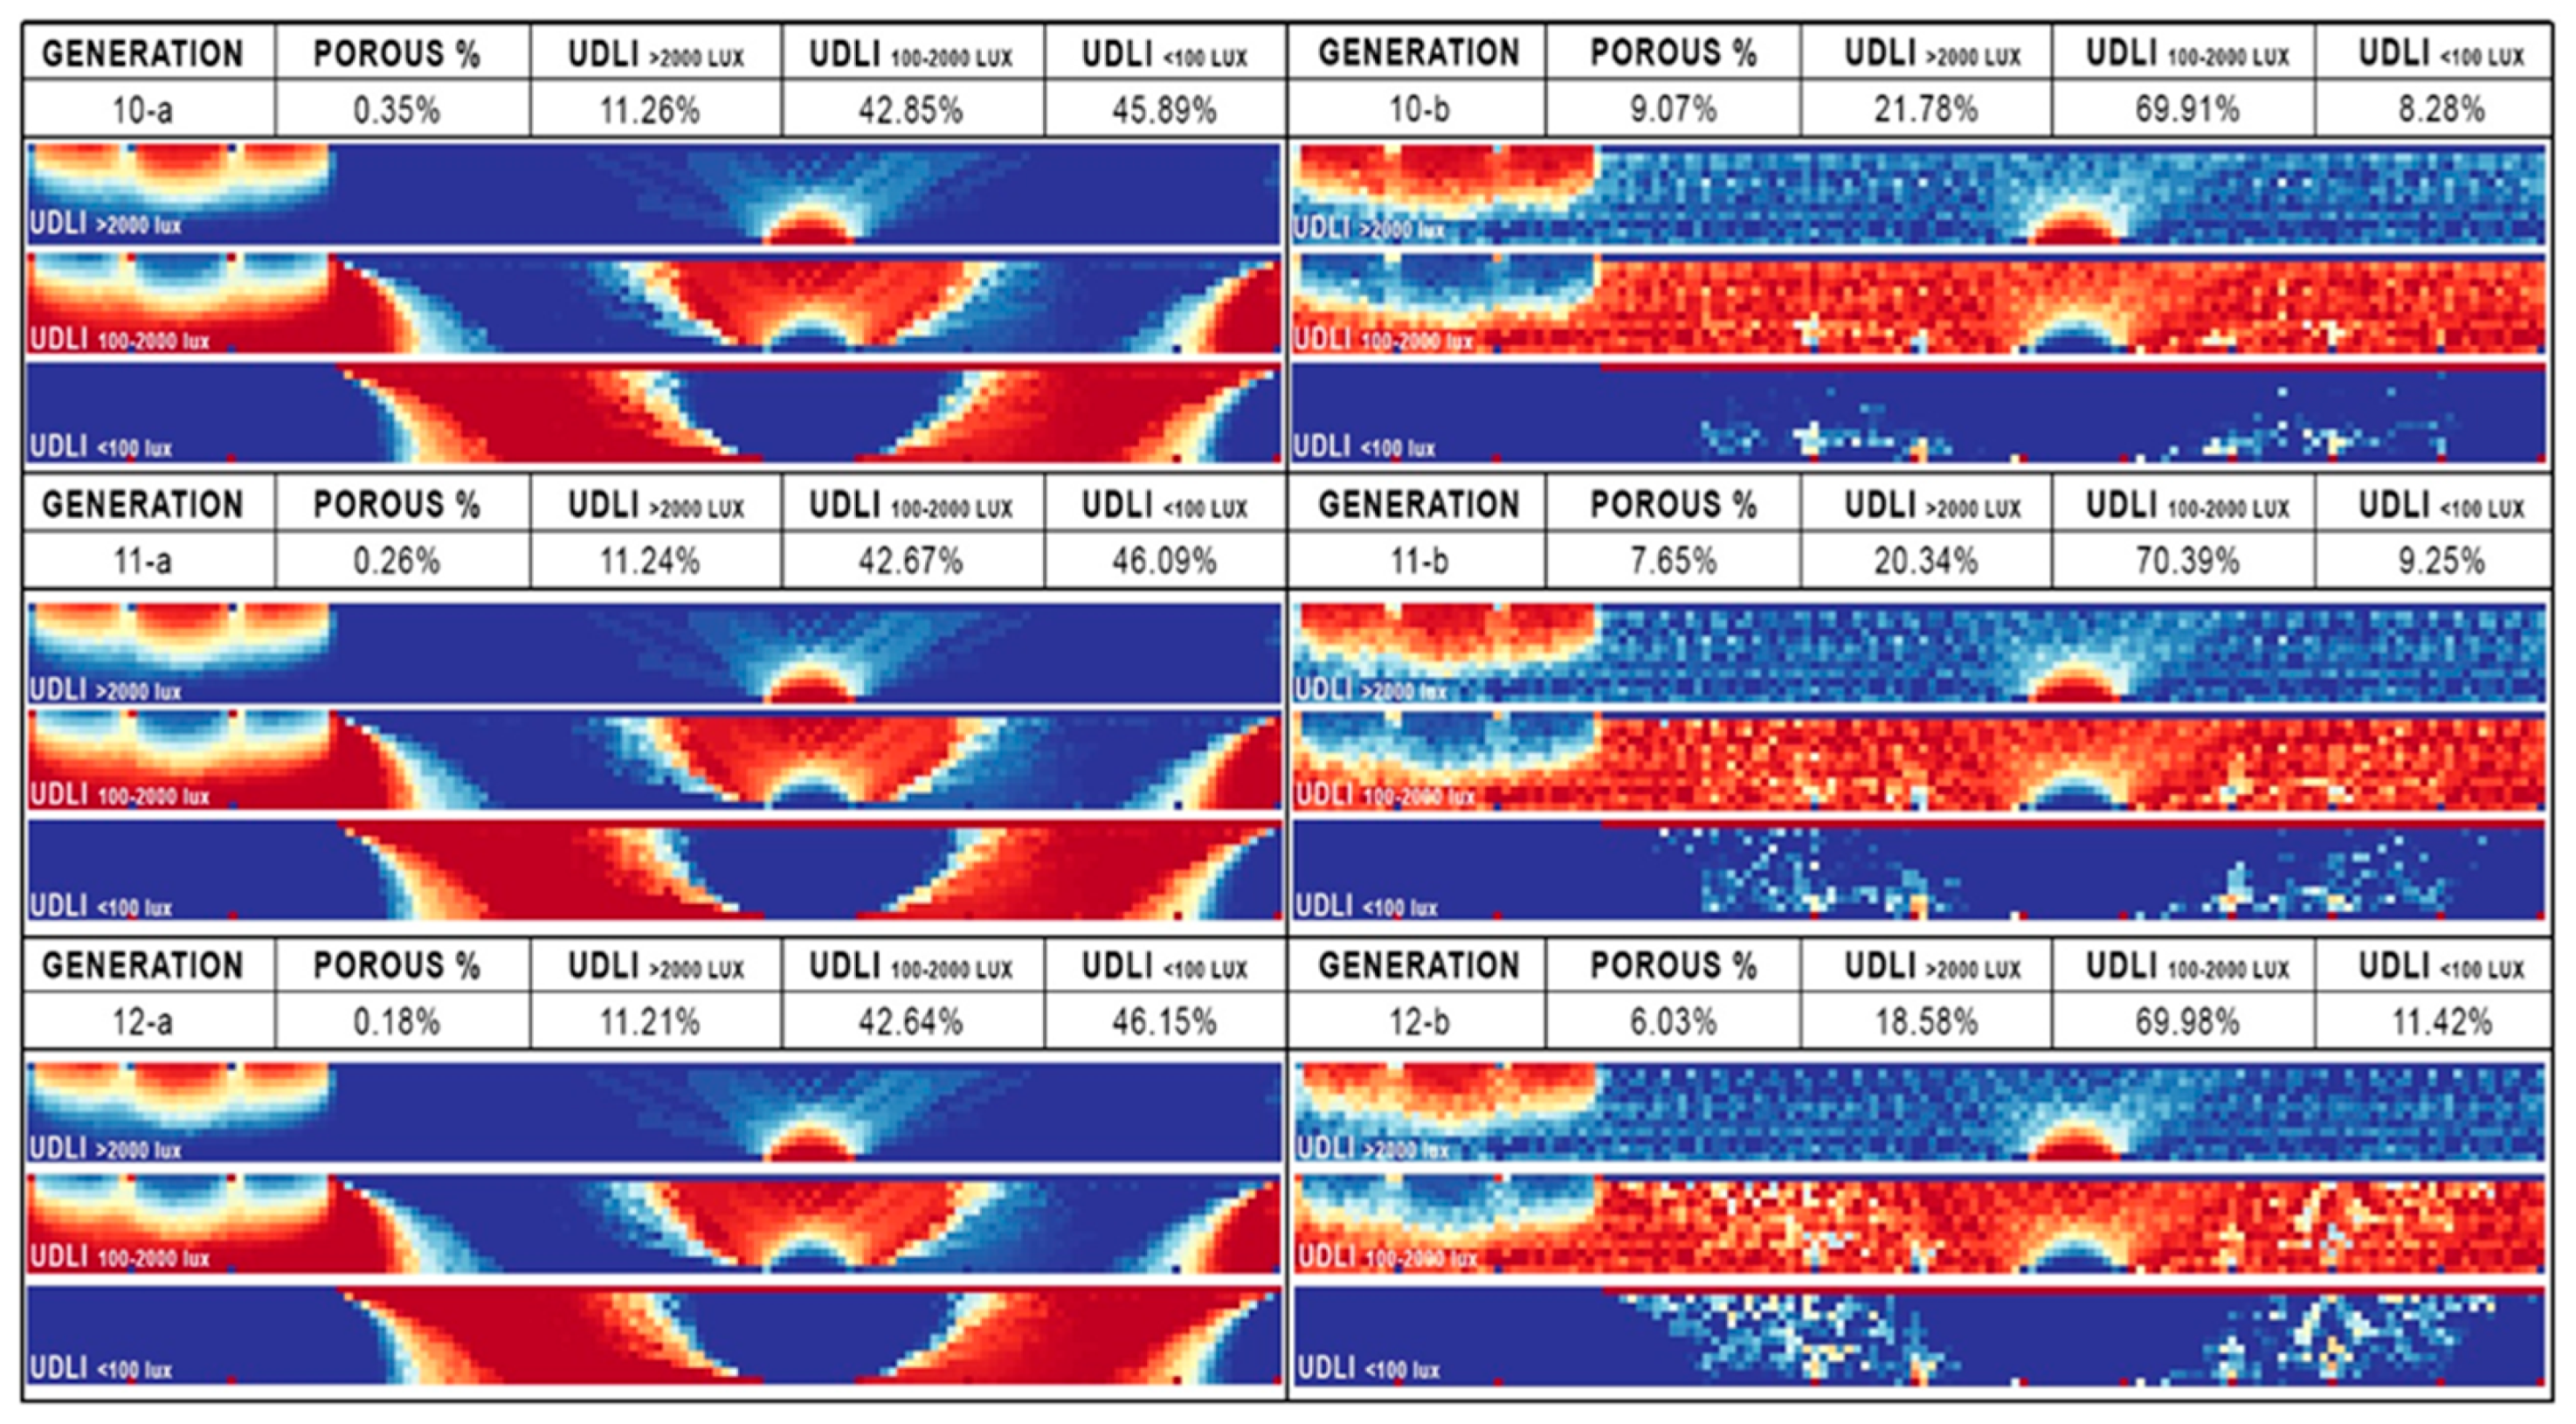
As an outcome of the previous analysis and results, different alternatives were ranked to obtain the best generation. Patterns 10, 11, and 12 were found to have the best UDLI results. At the same time, the three options received a low radiation rate in the horizontal and vertical analysis. The computational process was used to change the porous gradient and test it for all options. The porous gradient for the three top-ranked patterns was changed to examine the extent of the enhancement in the alternatives’ performances. Two different patterns were generated from each one of these three patterns and classified as two versions, “a” and “b”, with different porous gradients.
All versions were assessed for their performance in daylighting and radiation, as shown in
Figure 28. Versions of “a”, shown on the left side of the figure, scored lower results of approximately 42% in
, while versions of “b”, on the right side, showed remarkable achievements in the daylighting performance, exceeding an 18% improvement and reaching around 70% in the
.
The daylighting values of the three “b” alternatives were similar as they varied between 18.6% and 21.8% for
and between 8.3% and 11.4% for
. They achieved values between 69.9% and 70.4% for
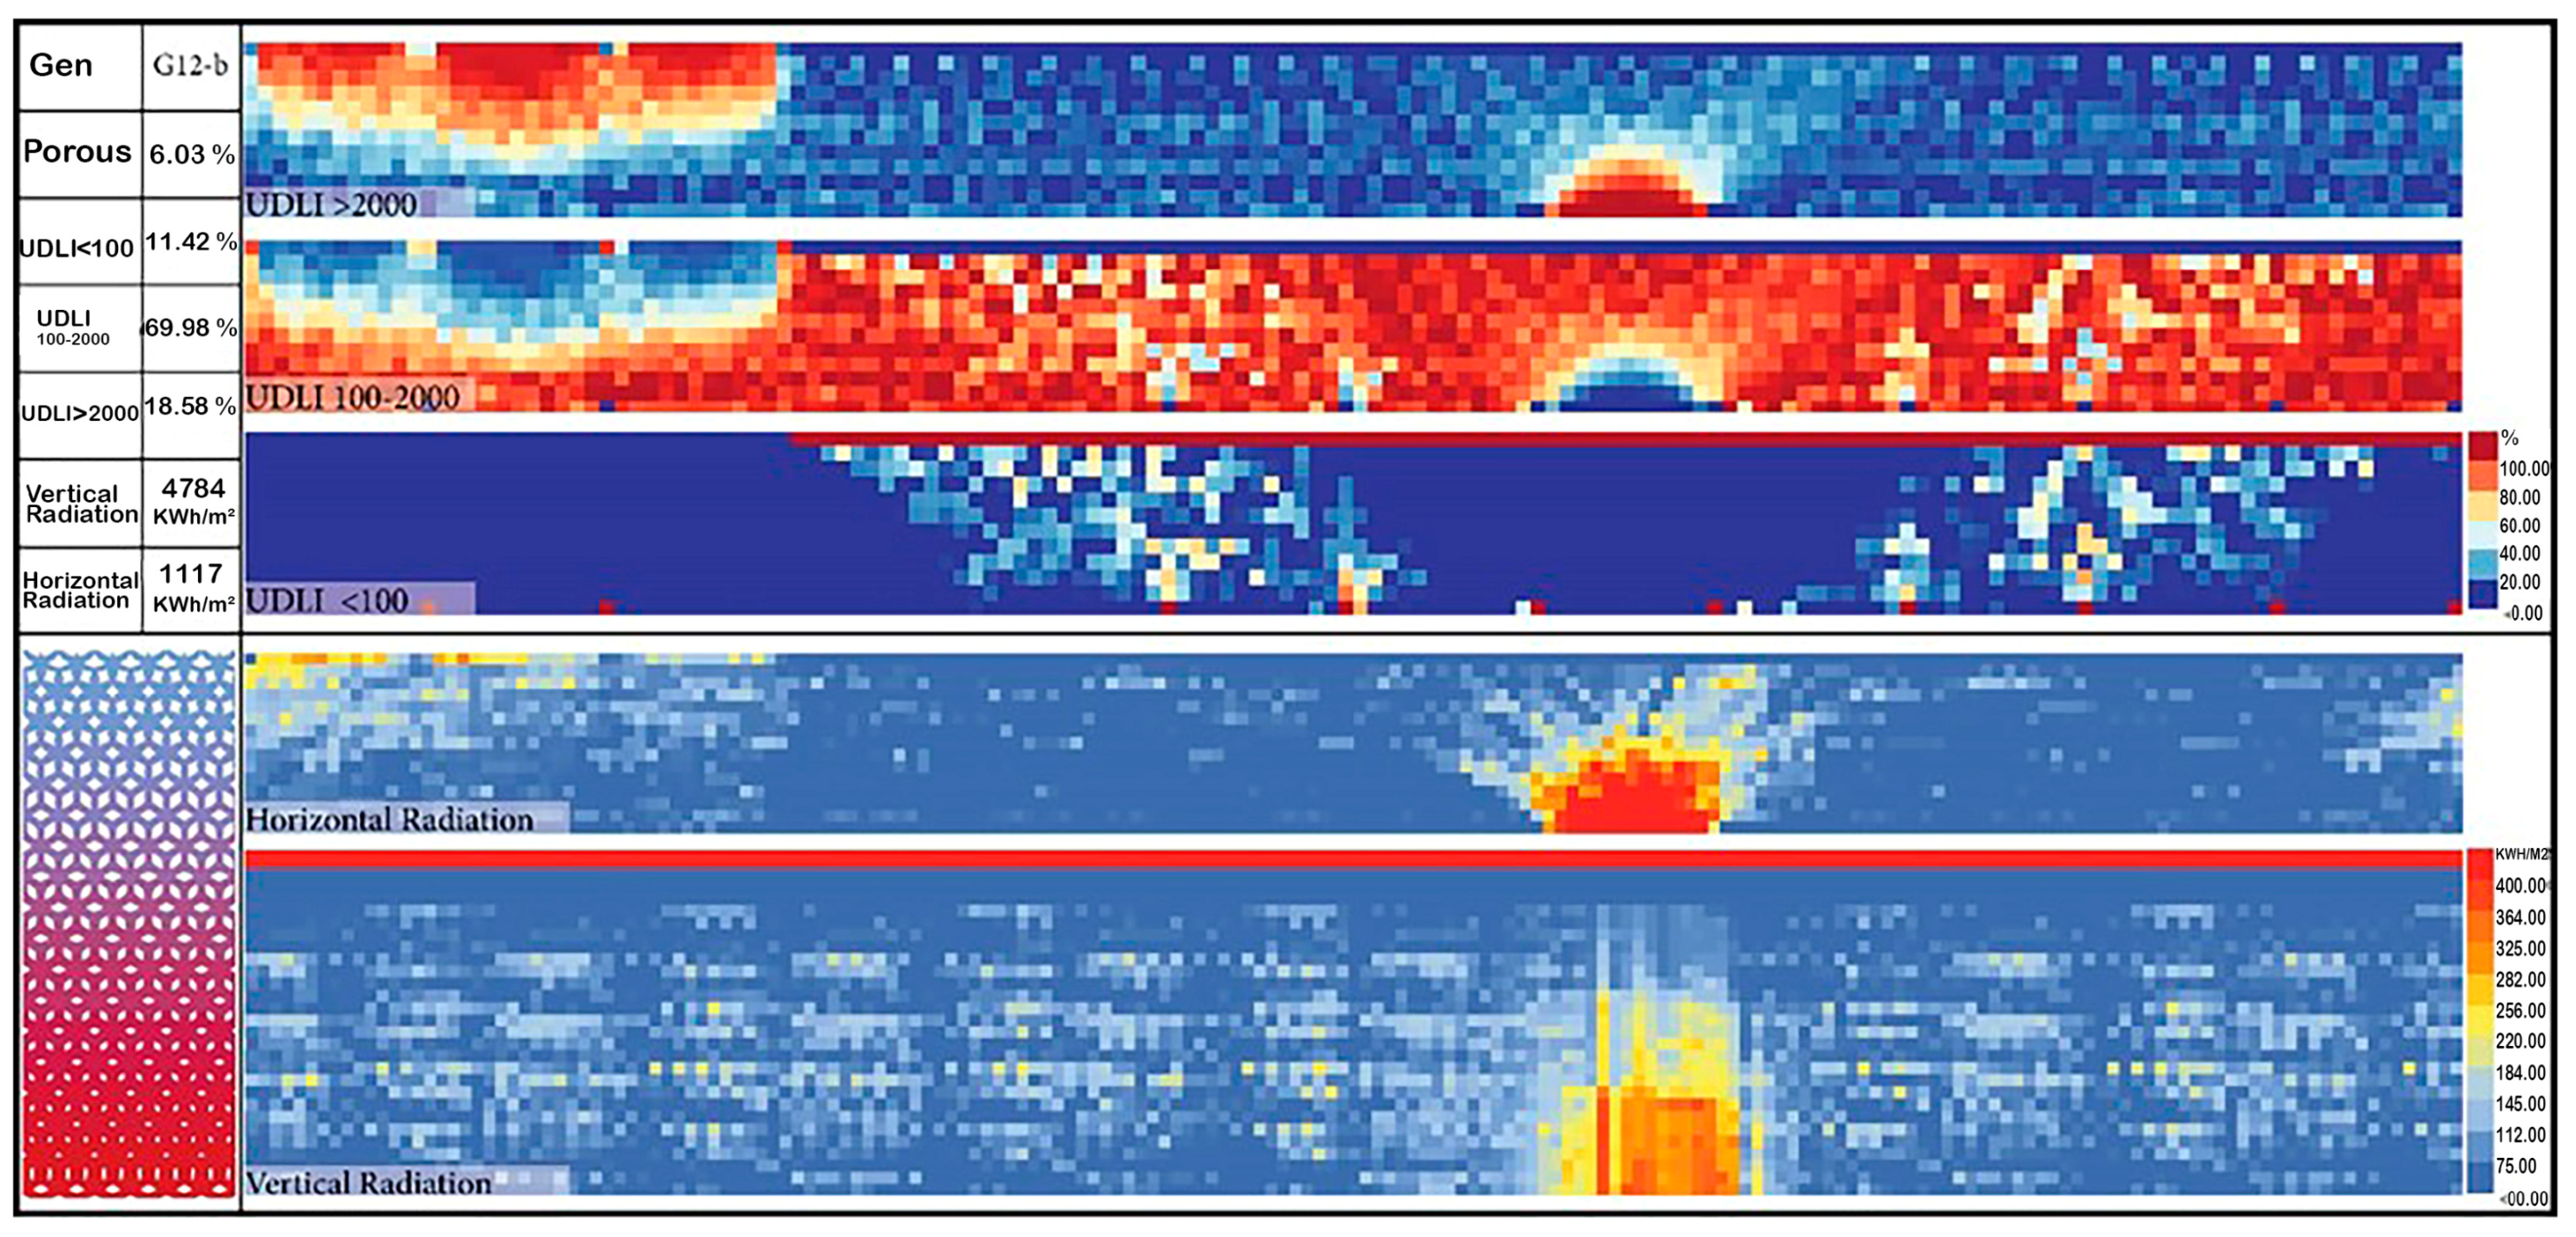
. Generation 12-b was considered as the optimum performance for daylighting and radiation together, as shown in
Figure 29. However, the
of pattern 12-b was lower than 11-b by 0.5%, and the potential glare value of pattern 12-b was smaller by 1%. In addition, the vertical and horizontal radiation values were smaller than pattern 11-b by 356 kWh/m
2 and 49 kWh/m
2, respectively.
6. Results and Discussion
Environmental specification simulations were conducted using the Ladybug tool, a plug-in for Grasshopper, in which the weather of the United Arab Emirates was studied to provide an estimation of the modeled corridor’s performance. This section discusses significant findings regarding the influence of the generated patterns on the corridor performance, in which the screens demonstrated a wide range of results that improved, stabilized, and exacerbated the corridor’s visual and environmental conditions.
The baseline corridor performance was assessed and compared to the performance of all trial screens. These screens were designed following an Islamic traditional geometric pattern, reflecting the design scheme of the University of Sharjah. Specific parameters were coded and analyzed using the Ladybug tool to provide an estimation of the screens’ performance and impact on the chosen corridor’s visual, solar radiation, and daylight conditions.
Particular environmental parameters, such as the sun path and wind rose diagrams, were evaluated to demonstrate the peak summer months where the solar heat gain would be at its peak, and the wind speed would be the lowest. This allowed us to define the study period according to the harshest conditions in an effort to design a screen model that would account for the most crucial period in the year.
The Ladybug tool analyzed the screens’ performance in terms of solar radiation analysis diagrams, and estimated solar heat gain and produced shadow study diagrams. The diagrams obtained through Grasshopper’s plug-in Ladybug, and further illustrated in Rhinoceros 3D, showcased the potential influence of the screen on the corridor’s performance. Assessment of the solar radiation performance of the screen occurred during two phases. The first phase consisted of changing the porous size of the pattern and generated in 12 different patterns. These patterns were assessed for daylighting and radiation performance to identify the best three patterns. In the second phase, the porous gradient of these three patterns was adjusted to study the performance when changing the gradients.
Furthermore, a significant improvement in was found, as compared to the current status of the corridor, with an increase in excess of 54% being reported, while there was a significant decrease in vertical and horizontal radiation exposure.
In phase 2, there was a reasonable increase in the by more than 18%, as compared to the first phase. In addition, there was an effective reduction in the potential glare at , which minimized the potential glare by more than 9%.
7. Conclusions
An Islamic geometric patterned screen that matched the design scheme of the University of Sharjah was designed and modeled to improve the visual and thermal conditions of a selected corridor on campus. The parametric design of the screen generated several alternatives. The first phase of the study involved generating 12 different design options based on the change in porous size percentage for all screen designs. Daylighting and radiation analysis were simulated to classify the generations and to choose the best three. The top three alternatives were gen10, gen11, and gen12, with values of 55.04%, 54.78%, and 54.19%, respectively, and horizontal radiation exposures of 864 kWh/m2, 848 kWh/m2, and 843 kWh/m2, respectively. In the second phase, each of the three chosen patterns generated two different patterns based on the different porous gradients. All the generated patterns were simulated and classified to identify the optimum screen design, which was gen12-b. This showed a significant development in daylighting performance, as the increased by 69.52% compared to the current design of the corridor and showed a significant reduction in radiation values as the horizontal radiation was minimized by 13,954 kWh/m2. This research showed that the generated screens 10-b, 11-b, and 12-b were potentially successful and reliable.
The same approach could be generalized in the other corridors in the UoS and in many different screen designs for corridors with similar climates and functions.
8. Future Studies
The appropriate selection of screen materials for the fabrication process could be studied further, particularly in terms of thickness, strength, and thermal properties. In addition, virtual reality and mixed-reality techniques aided by artificial intelligence software and strategies could be applied for optimum screen design, and as an important part of the digital fabrication process.


