1. Introduction
Housing is a basic amenity that provides shelter for human beings. However, there is an ongoing housing deficit in developed and developing countries [
1]. In the UK, the annual housing deficit was estimated to be 340,000 in 2022 [
2], while that of the US was about 3.8 million [
1]. On average, the housing deficit increases by 28% in Hong Kong yearly. In the case of a developing country, Nigeria, the deficit was estimated to be 700,000 per year [
3]. One of the ways to solve this problem is to adopt a fast, economical and reliable method [
4]. Hence, prefabrication or off-site manufacturing (OSM) and modularization have proven to exhibit these characteristics [
5,
6]. OSM has the tendency to reduce construction time and cost by 50% and 30%, respectively [
7,
8]. Ajayi et al. [
9] reported that many countries have adopted OSM to increase their housing supply. For instance, 80% of detached houses in Sweden use the prefabrication method, while 50% of apartments in the Netherlands are made of prefabricated modules [
10].
The off-site construction includes also typical construction activities, such as clearing, earthwork operations, foundation work, construction of the building core and shear walls, and finishing works. In order to speed up and improve the construction process, these typical construction activities need to be optimized. For instance, [
11] demonstrated that optimization of earthwork operations reduced the construction duration by 55%. However, the focus of this study is to improve the installation process of modules in off-site construction.
Off-site construction or off-site manufacturing (OSM) has been identified as the way forward for enhancing productivity in the construction industry. This is mainly due to its efficient manufacturing process. OSM has been gaining ground for the past decades in many countries. For instance, the UK has adopted OSM as the way forward since 1999, following its recommendation by the Egan Report [
12]. The same effort has been noticed in the US, as the US National Research Council stated that OSM is a key method to be adopted for its companies to remain relevant and competitive in the industry [
13]. In the same vein, Singapore adopted OSM in the 1980s and increased its efforts to adopt the method of Design for Manufacturing and Assembly (DfMA) in 2014 [
4,
13]. Furthermore, HK has embraced and adopted MiC to mitigate its housing problems. The HK government has proposed building 20,080 houses yearly [
14], which can be achieved effectively by embracing a modern and fast construction method, such as MiC.
It should be noted that modular integrated construction (MiC) is a subset of OSM. According to the Modular Building Institute, founded in 1983, MiC is defined as “a process in which a building is constructed off-site, under controlled plant conditions, using the same materials and designing to the same codes and standards” [
15]. Following this definition, different building components can be manufactured in a controlled facility and assembled on-site to reflect identical designs and specifications. MiC is becoming more popular as a sustainable alternative to conventional construction methods due to its numerous advantages, including waste reduction, quality building components, reduction in project time, improved safety, and others [
16,
17]. Evidence shows that MiC reduces about 90% of on-site activities, thereby increasing construction productivity [
17,
18]. The assurance of high-quality building within a short period is often a deciding factor for adopting MiC, especially for projects with a limited duration [
19].
Figure 1 shows the phases involved in traditional and modular integrated construction. According to the figure, the traditional construction consists of four general phases, while that of MiC is five. The first three phases are common to the two construction methods. Usually, the construction documents and the schematic design of the building will be prepared by the architects and engineers, which will be submitted for approval before the contractors embark on on-site development. Unlike the traditional method, the development of sites (i.e., foundation work) can be carried out simultaneously with the prefabrication of modules in MiC projects, thereby resulting in a shorter completion time. The dotted line on the last element of “modular construction” shows the ability of MiC projects to have a shorter completion time compared to traditional construction. MiC has proved to be more effective than traditional construction methods in terms of social, environmental, and economic performance by 21%, 52%, and 60%, respectively [
20]. Another reason why MiC is becoming more popular among developers is its potential to produce a rapid return on investment. Thus, paying attention to all phases involved is essential, from prefabrication to on-site crane assembly [
21].
It should be noted that the construction process is associated with various uncertainties and constraints, which can result in interruptions during the project implementation. Additionally, the crane is the most expensive equipment and resource used during the on-site installation of modular units [
22]. Due to this, the demand for the tower crane exceeds its supply. Hence, the proper planning of the crane utilization must be carried out before the commencement of a construction project, as poor planning can lead to delays and additional costs during project implementation [
23]. An excellent way to solve this problem is to model the process via computer simulation, which can enumerate the effect of various uncertainties, such as weather conditions, on the model’s output. This model will assist construction managers in making an effective plan for the project execution based on the different possible conditions at any given time. According to Rashid et al. [
24], “Simulation modeling is the process of creating and analyzing a virtual model of a real-world process to predict and forecast its performance”.
Various researchers have adopted simulation techniques to improve the productivity of MiC processes from the manufacturing stages of the modules or building components till they get assembled on-site [
15,
21,
25,
26]. Most of the previous research efforts center on the prefabrication stage and the use of mobile cranes for the installation process. None of these studies considers the impact of job and management conditions on the productivity of the installation process and identifies the significant installation resources that lead to higher productivity. The job conditions include surface and weather conditions, work dimensions, topography, and specification requirements for work methods. Skills, motivation of the workers, training, and maintenance of the equipment (i.e., crane and truck) are part of the management conditions considered in this study. These conditions are pragmatic as they represent reducing factors for the productivity of a construction process.
Therefore, the motivation for this study is to fill the existing gap in this domain. This study contributes to the existing knowledge in the MiC installation process by (1) predicting the number of modules that can be installed per day (i.e., productivity), considering the effect of job, management, and other related conditions using a discrete-event simulation (DES) model; (2) conducting a sensitivity analysis using design of experiment (DOE) to reveal the significant installation resources and their interactions on multiple performance measures, including productivity; and (3) developing a multiple linear regression model, showing the relationship between the productivity of MiC installation process and resources employed in the process. The developed simulation model can tackle the uncertainty associated with construction activities by defining the duration of each activity as a stochastic variable. This helps the model to be highly representative of the real-world situation. Furthermore, the regression model would help construction practitioners to estimate the productivity of module installation based on the number of assigned resources. This would help in making better resource planning decisions during the planning and construction phases.
3. Literature Review
Some of the previous studies investigated the use of simulation techniques to model the production activities of modules’ fabrication in the factory. In contrast, others concentrated on the on-site installation process of MiC.
Table 1 summarizes the previous studies relating to the two aspects. The table shows that some studies explicitly aim to estimate the daily output of the construction activities, while others do not (as shown in the “output per day” column of
Table 1). In addition, the table shows the simulation type, crane type, and category of building employed in the studies. DES attempts to represent a real-life system by breaking it into a sequence of logically related activities [
27]. Each activity will assign a logical time and resource(s).
Darwish et al. [
28] assessed the practical improvement to the production line of semi-automated wall panels manufactured in a modular facility. This was acheived by simulating the production processes using a DES model of Simphony.NET simulation software. According to the model’s output, the production of one panel takes only 64 min, which was supported by the available historical data (i.e., 70 min). Three scenarios were developed to identify the minimum resource combination that yields the maximum output. The best scenario shows that 42 panels could be produced per day. Similarly, Rashid et al. [
24] developed a DES model to simulate the workflow process in a modular factory and employed the genetic algorithm (GA) to optimize the number of construction workers needed at various workstations resulting in a minimum makespan. The results of their model indicated that the total duration of the whole process could be reduced by 15% using the same number of construction workers used before applying the optimized solution. Furthermore, Afifi et al. [
26] used a discrete and continuous simulation technique to examine the productivity of a prefabricated module in a controlled facility. They found that the simulation model was able to identify the stations with fewer value-adding activities and thus be able to reduce the makespan of the prefabrication process.
Mohsen et al. [
29] developed a simulation model to mimic the installation process of modules on-site. Regarding the assembling of the modules, various scenarios were proposed. The scenario that favors the nature of the site in terms of space availability was adopted. As expected, the authors noted that the crane was identified as the key resource in the installation process. Furthermore, the on-site installation of modules was simulated via the Simphony.NET software [
25]. One unique attribute of the model was the incorporation of the weather conditions into the simulation with the aid of the Markov Chain. In another study, Goh and Goh [
13] combined lean principles with computer simulation to model the on-site installation of modular construction, often regarded as prefabricated prefinished volumetric construction (PPVC) in Singapore. A base model was developed using DES in ARENA software and value stream mapping (VSM) was added to identify the non-value-adding processes. These processes were tackled by integrating lean principles, such as the internet-based E-Kanban system for minimizing and optimizing cycle time and deliveries, respectively; the use of robotics to eliminate manual labor; and total quality management for reducing the occurrence of defects in the final model. The final model showed a decrease in the duration of the project by 81.27% compared to the initial base model. The utilization of the resources also increased by 17.91%.
Similarly, Moghadam et al. [
21] developed a post-simulation visualization model (PSV) to enhance the planning and scheduling of modular integrated construction. In developing the PSV model, Simphony.NET was employed to simulate the installation process of modular units. At the same time, 3D studio max was used for the visualization part. A scaffolding crew was added as part of the resources for the model, which is not included in other similar models. The model was applied to a construction site where 950 modules were to be installed in a 34-story building. The model’s output showed that 16 modules could be installed per day for the first 20 floors, while 15 and 14 modules could be installed per day for the 21st–29th floor and the 30th–34th floor, respectively. A similar study was conducted by Al-Hussein et al. [
22], who developed an integrated system that included simulation modeling and the 3D visualization of tower crane operations. Three-dimensional visualization helps construction practitioners to visualize simulated operations easily and is used to optimize construction schedules. Furthermore, a simulation model was developed by Mohamed [
30] to examine the productivity of tower cranes in the MiC installation process. Seven scenarios were tested and the best one was determined based on the project duration and cost.
Furthermore, previous studies have employed multiple regression analyses in the construction industry. Regression analysis shows the relationship between a dependent variable and independent variables. Renault et al. [
31] employed regression analysis to disprove the hypothesis or perception that demographics are related to how construction managers handle risk management projects (RMPs). Teixeira et al. [
32] developed a regression model to understand the relationship between waste generated on a construction site and the attributes of the construction site, such as the number of floors, floor size, and site layout. The value of the coefficient of determination and ANOVA were used to validate their model. Yang and Qiu [
33] established a regression equation between factors affecting construction cost and the actual construction cost. Their regression model shows a higher Pearson correlation coefficient than that obtained by the traditional prediction algorithm in the literature. In a similar study, regression analysis was employed to determine a relationship between 14 independent variables affecting the retrofit net construction cost (RNCC). Based on the analysis, seven variables were found to be significant for predicting the RNCC. In comparison, the other seven variables were discarded [
34]. Moreover, a multi-linear regression model was developed to predict the compressive strength of cement-grouted sand. The independent variables employed to develop the model include the percentage of polymer content in the grout, different fine aggregate sizes, and the curing age [
35]. These previous studies typify that regression analysis could be employed to predict the values of a dependent variable based on a certain number of independent variables.
Following the review of the previous studies, it can be seen that only [
25] considered the detailed movement of the crane while developing the simulation model, while none of the studies incorporated the impact of job and management conditions on the productivity of the MiC installation process. Additionally, the literature lacks a systematic approach to reveal the significant installation resources and their effects on installation productivity. Furthermore, the relationship between the output and inputs of their models is unknown. A DES model is required to estimate this output, the development of which might represent a barrier for construction practitioners to get its full benefit. Therefore, this study aims to fill these gaps. This study approximates the complexity of construction simulation models of module installation and provides practitioners with a simple and easy-to-use regression model to help them make better resource planning decisions while considering the complexities and uncertainty of module installation. It provides better insights into the relationship between resources invested in construction activities and their productivity.
Table 1.
Summary of previous studies relating to MiC prefabrication and on-site installation.
Table 1.
Summary of previous studies relating to MiC prefabrication and on-site installation.
| Authors | Methodology | Simulation Type | Crane Type | Building Category | Output Per Day |
|---|
| [28] | Simulation + Lean approach | DES | NA | NA | 42 panels |
| [29] | Simulation | DES | Mobile | Low-rise building | 12 modules |
| [25] | Simulation | DES | Mobile | Low-rise building | 6 modules |
| [24] | Simulation + Genetic Algorithm | DES | NA | Low-rise building | - |
| [13] | Simulation + Lean principles | DES | Mobile and Gantry | Low-rise and Medium-rise building | - |
| [26] | Simulation | DES + Continuous | NA | NA | - |
| [21] | Simulation + Visualization | DES | Tower | High-rise | 14–16 modules |
| [22] | Simulation + Visualization | DES | Tower | Medium-rise | - |
| [30] | Simulation | DES | Tower | High-rise | 11 modules |
4. DES Model Development
This section discusses the DES model development, its detailed description, data collection, and implementation. Furthermore, this section discusses the verification and validation of the DES model, including its associated sensitivity analysis. Various DES platforms are available in academia and industry. One of the first popularly-used DES software specialized for construction applications was the one developed by Halpin in 1973, CYCLONE (Cyclic operation networks) [
36]. Other simulation software includes but is not limited to “AnyLogic”, “Simphony.NET”, “ARENA”, and “EZStrobe” [
21,
29]. Previous studies have widely used these software programs to model various construction applications [
26,
36,
37]. AnyLogic simulation software is the most recent among them. It was chosen for this research because of its higher flexibility and integration of multiple simulation methods (e.g., agent-based modeling and system dynamics) into one environment. It allows the user to model real-life construction processes by allocating resources and durations to each task. Additionally, the software allows its users to perform sensitivity analysis efficiently to identify the resources sensitive to changes by monitoring the output of such a model.
4.1. Model Description
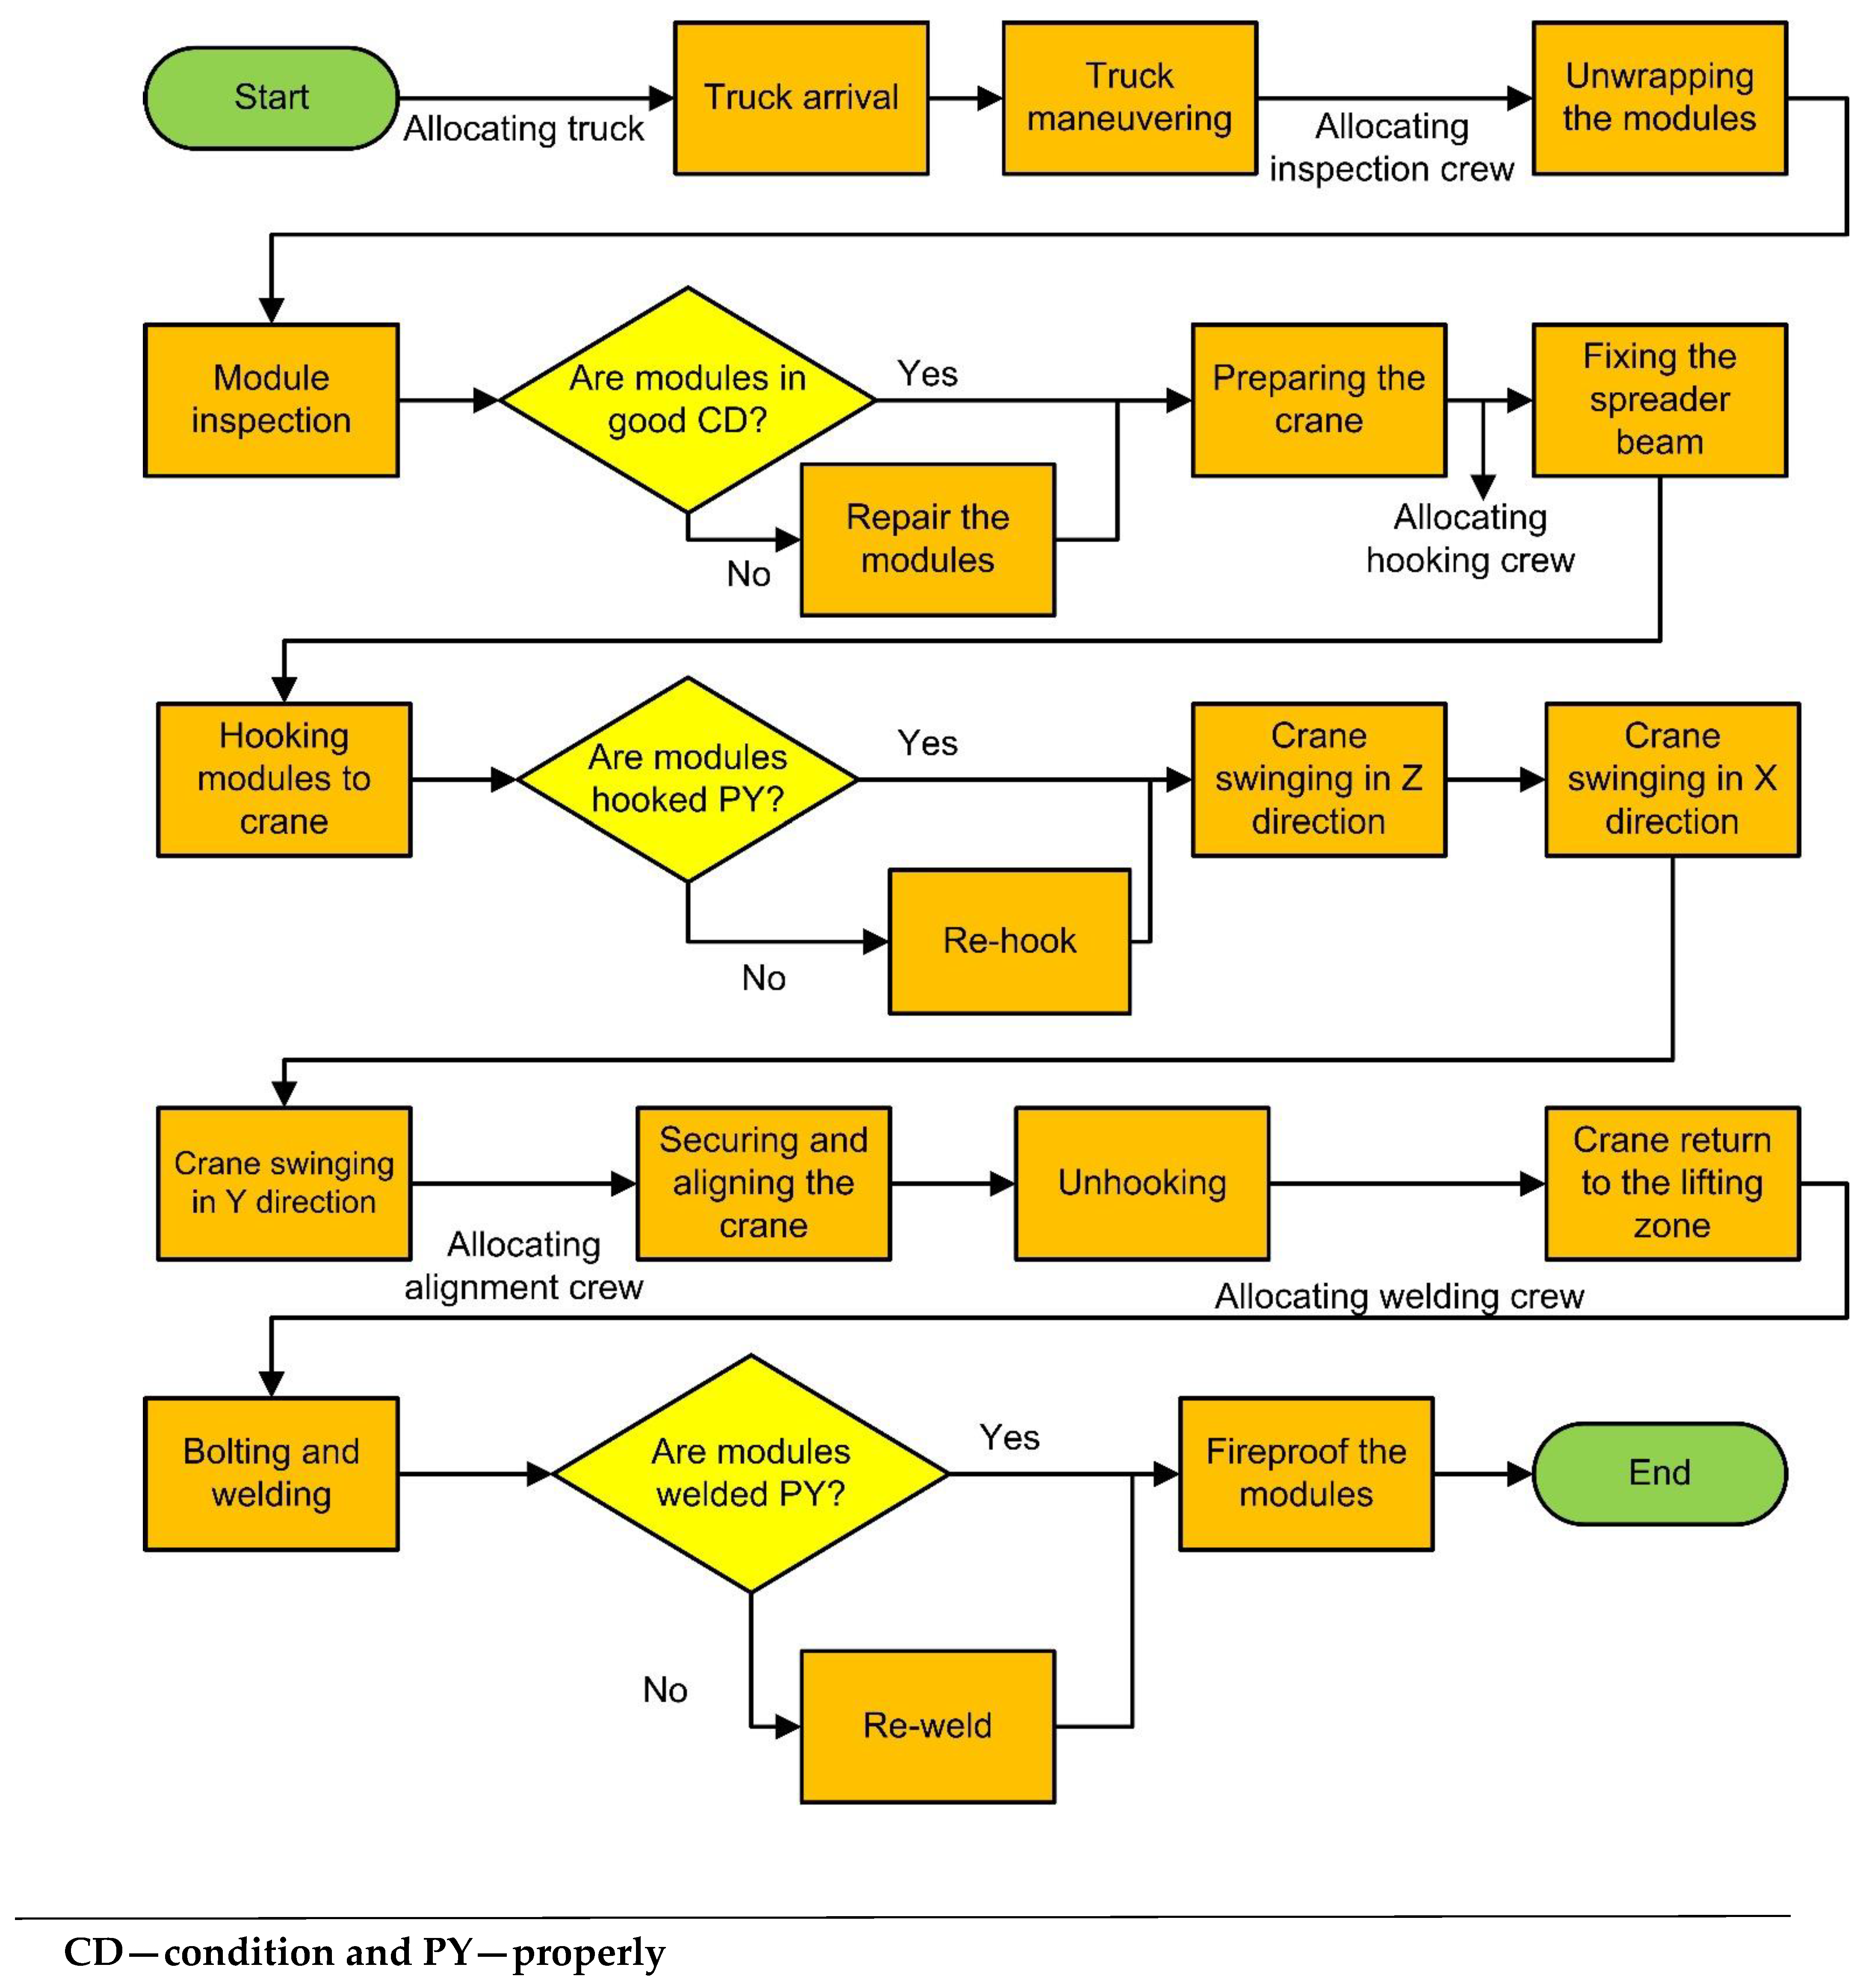
As indicated earlier, a DES model was developed. This model considers the relationship between specific processes, their allocated resources, and the uncertainty associated with the processes’ durations. It should be noted that the model is only concerned with the activities involved in the on-site installation of MiC and does not involve other activities relating to the prefabrication stage of the modules. As modeled in the simulation software; the sequence of events involved in the installation process and their allocated resources are presented in
Figure 3 and explained in detail in the following paragraphs.
The installation process starts with the arrival of trucks on the site (see
Figure 3). After the trucks maneuver to a designated place on the site, the inspection crew unwraps the modules and assesses them. If the modules are in a good state, they are moved to the next stage—the lifting zone; otherwise, they will be repaired. The chances of repairing the modules depend on damages associated with the manufacturing process, improper storage, and transportation to the site. This effect was modeled as a percentage of repair in the simulation software. It was set as a changeable parameter, allowing users to determine the value based on their specific situations. The hooking crew then fix the spreader beam to the lifting block of the tower crane. Spreader beams are used when large-size modules are to be carried [
13].
Subsequently, the hooking crew attaches the modules to the tower crane, and careful inspection is performed before the lifting process. The crane is not allowed to swing until the hooking process is properly carried out. It should be noted that the hoisting time of the crane is a function of the travel distance and the speed of the tower crane. Unlike many previous studies, the tower crane movement is detailed in this study to comprise vertical, trolly, and rotational movements (i.e., the cran swings in Z, X, and Y directions). These were modeled as changeable parameters to allow for flexibility based on the user’s specific conditions. After the crane delivers the module to the desired location, the alignment crew ensures that the module is aligned correctly.
Subsequently, the module is unhooked, and the crane is allowed to swing back to the lifting zone. While the swinging occurs, the welding crew simultaneously performs bolting and welding on the module. The module gets fireproofed after proper inspection of the welding process. It should be noted that the developed model is quite different from other models available in the literature, as it considers the probability of having a rework task (which is practicable) for each of the activities. This rework will prolong the cycle time of the entire process. Furthermore, another essential aspect of the model is incorporating job and management conditions.
The job and management conditions presented in the study of Nunnally [
38] were adapted to suit the case of this study’s simulation model. The job conditions include surface and weather conditions, work dimensions, topography, and specification requirements for work methods. Skills, the motivations of the workers, training, and equipment maintenance (i.e., crane and truck) are part of the management conditions. These conditions represent reducing factors for the productivity of a construction process. These conditions are interpreted as excellent, good, fair, or poor. They are numerically represented by some values based on practical experiments [
38]. For instance, if the job condition is good and the management condition is fair, the productivity of such a construction process will be multiplied by 0.71. This indicates that productivity will be reduced by 29% based on the job and management conditions [
38].
The model allows the contractor responsible for the installation process to choose the descriptive conditions (i.e., excellent, good, fair, or poor) relating to the job and management condition before running the model. The model will automatically assign the appropriate value to the simulation time.
4.2. Data Collection
The data used for the development of the simulation model was collected from the published literature that assessed the real-life construction activities and confirmed by experts working on MiC projects [
16,
21,
25,
30]. These data are categorized into four parts: duration of each activity, number of workers in a crew, numerical values to quantify the job and management conditions, and the cost of various resources. Through observations on site, previous studies have quantified the duration for each activity involved in the MiC installation process. These durations handle the uncertainty associated with each activity by representing them in the form of a triangular distribution [
16]. A triangular distribution is defined by the minimum value, the maximum value, and the most likely value (i.e., mode) of a sample data. For instance, from our database, the minimum and maximum duration for truck maneuvering on-site are 6 and 10 min, respectively. However, the most likely duration is 8 min, as it is the mode of the sample data. The crews involved in the installation process include the inspection crew, the hooking crew, the alignment crew, and the welding crew. The number of workers required for a module installation for each crew is referred to as crew size. The durations for the installation activities and crew sizes are highlighted in
Table 2. As indicated earlier, the job and management conditions specified in the study of [
38] are presented in
Table 3. The table shows the numerical values associated with a particular job and management condition. For instance, if the job condition is good and the management condition is excellent, the productivity of such a construction process will be 78% of an ideal condition. In addition, data related to the cost of each resource were collected and listed in
Table 4 [
39]. Unlike other models, the indirect cost associated with the MiC installation process is added to the calculation of the total project costs.
4.3. Model Implementation
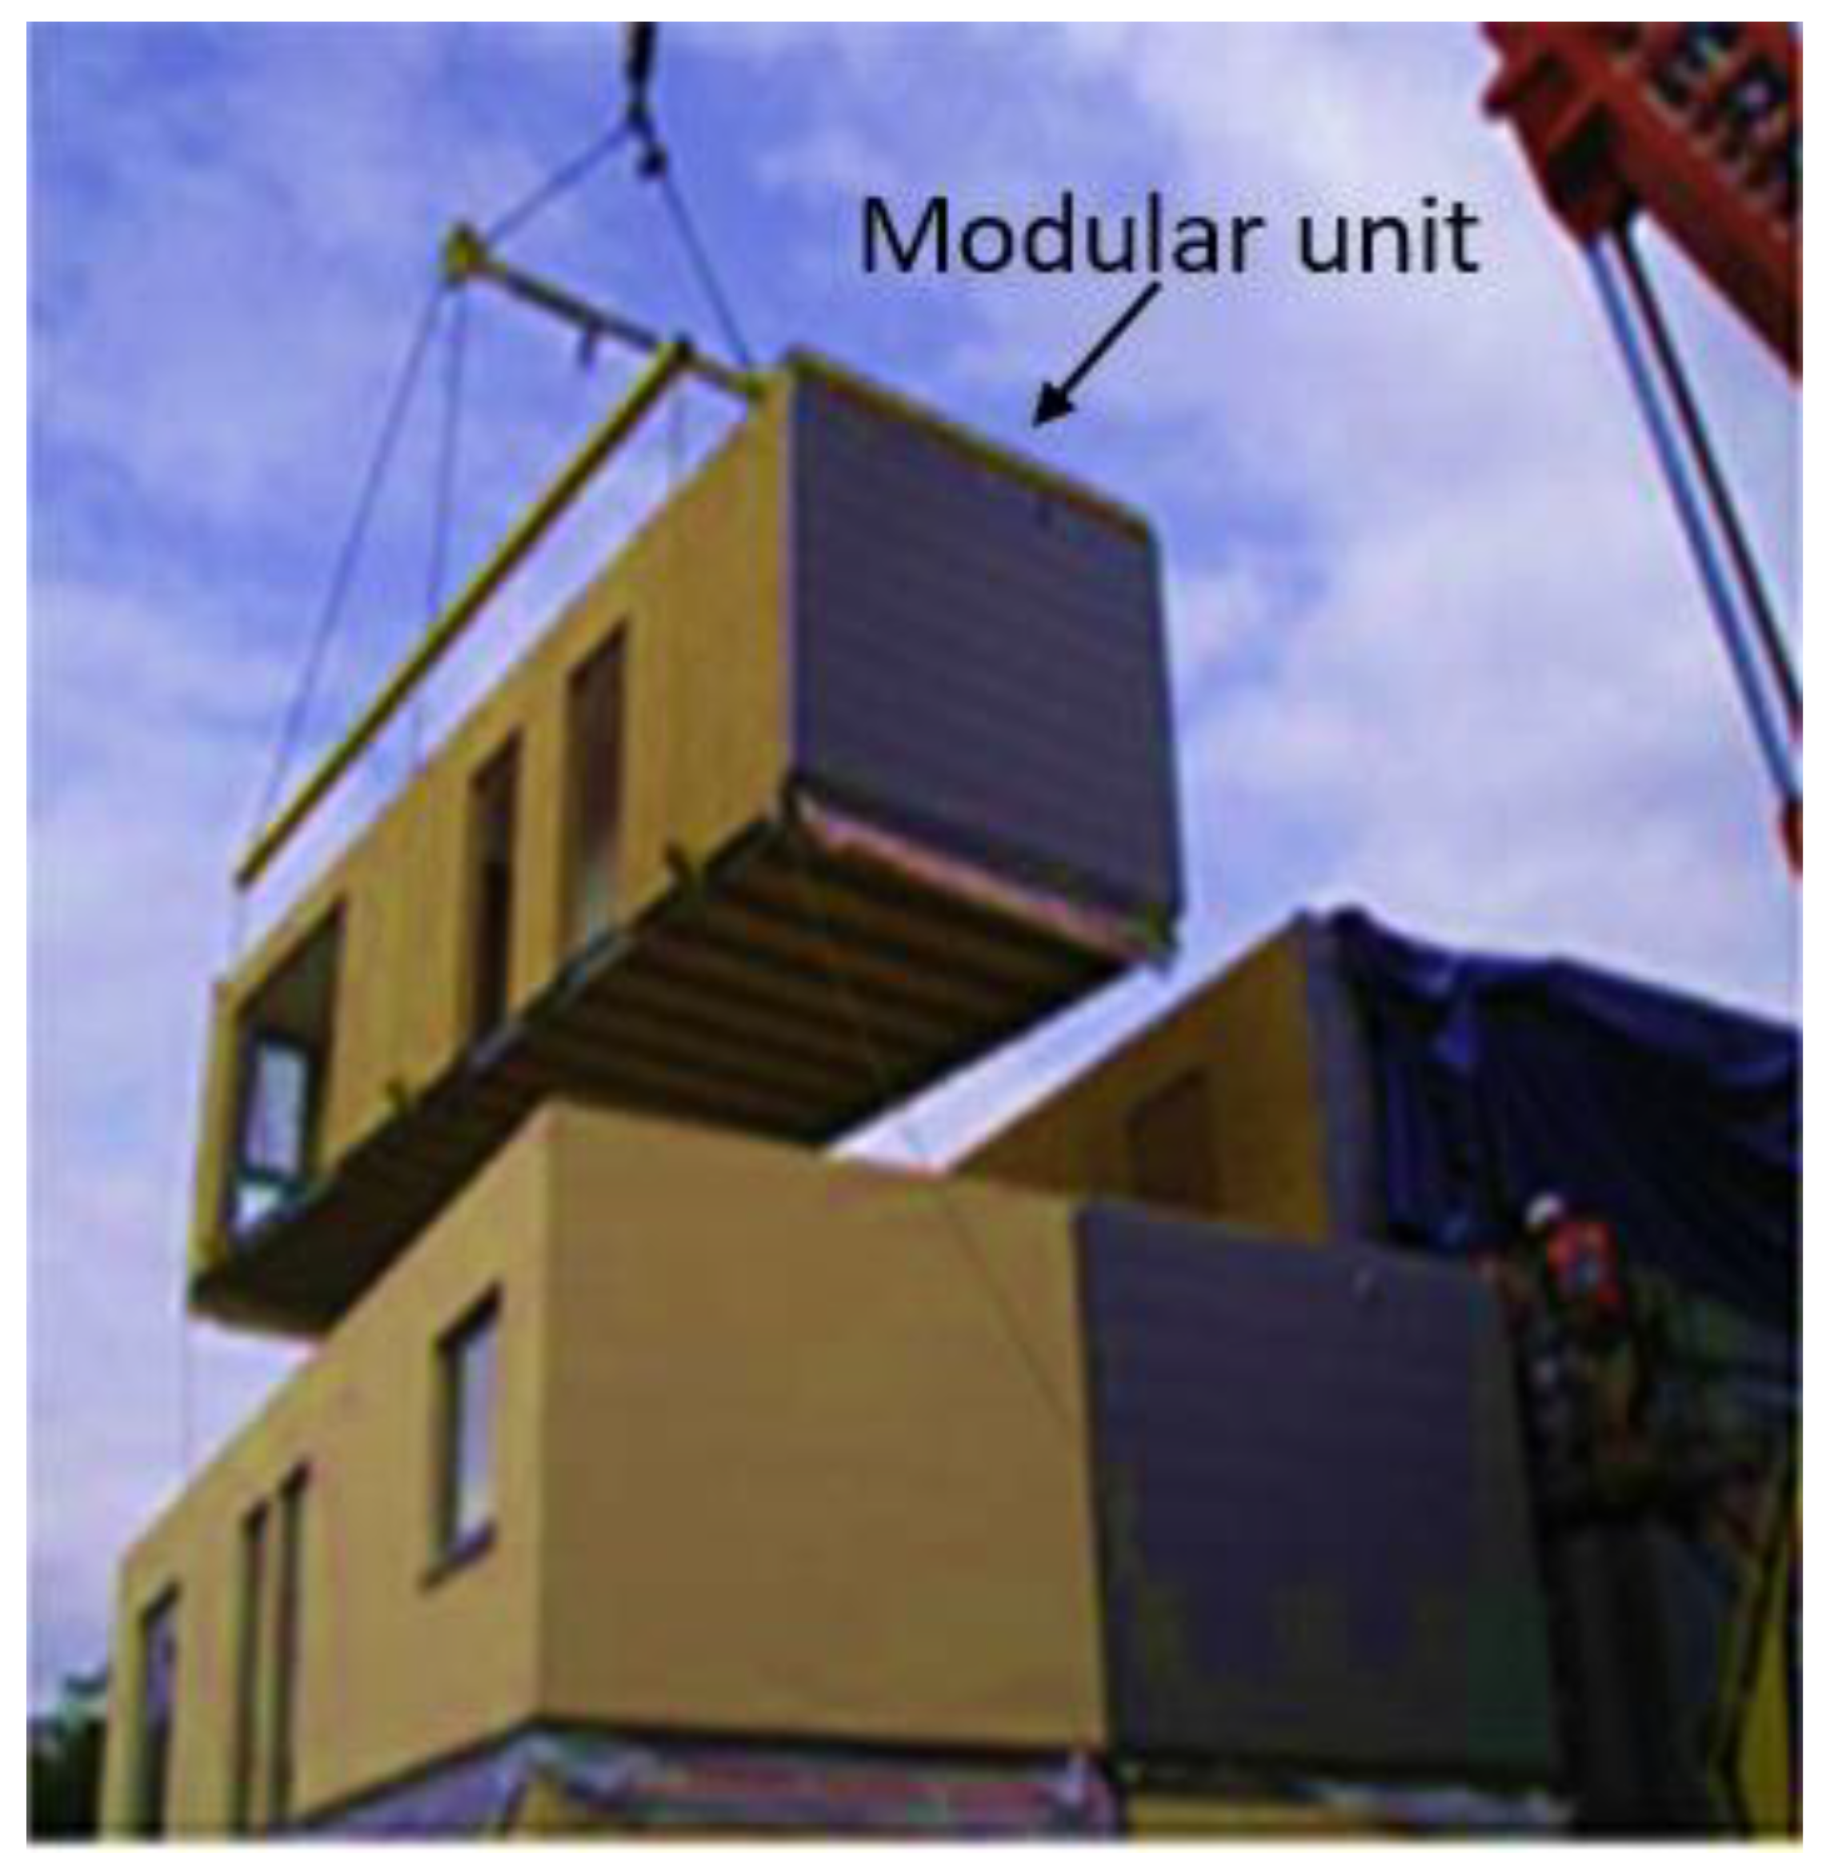
The developed model was applied to a case study in Hong Kong. The case study is a high-rise building comprising 35 stories. The dimension of each module is 3.6 m by 9 m, weighing 12.5 tons. The total number of modules to be installed for the project is 525, with each floor accommodating 15 modules. A typical example of the module is shown in
Figure 4. The DES model developed with the AnyLogic software is shown in
Figure 5. As shown in the figure, the durations of the tasks, resources, and costs were set as changeable parameters to allow the model user to change them to whatever values that suit their specific construction process. It should be noted that
Figure 5 is the AnyLogic Simulation implementation of
Figure 3, which was explained in
Section 4.1.
The main outputs of the model are productivity (i.e., the number of modules installed per day), the total cost of the project, and the project duration in working days. Additionally, the software automatically displays the percentage utilization of every resource whenever the model is being run, contributing to the model’s output. The equations for calculating the project durations in working days, the productivity, and the total cost are given in Equations (1)–(5). When all the resources were set to one, and the job and management conditions were evaluated as “excellent,” the productivity, the project duration, and the project costs were seven modules per day, 80 days, and HKD 1,301,910, respectively. The effect of the incorporated factors on job and management conditions was also assessed to examine their impacts on the model’s outputs. For instance, when the job condition was “good” and the management condition was “fair,” the productivity, the project duration, and the project costs were 5.5 modules per day, 95 days, and HKD 1,542,600, respectively. However, when the job condition was “poor”, and the management condition was “fair”, the productivity, the project duration, and the project costs were 4.5 modules per day, 117 days, and HKD 1,914,574, respectively. These results show that the job and management conditions incorporated values are reasonable. One would expect a poor site condition to yield lesser productivity and take more duration for project completion than a site with relatively good conditions. Hence, it is important to assess MiC installation productivity based on the true conditions of the site to avoid overestimating or underestimating the productivity, which may mislead construction practitioners in their resource planning process.
where
is the total duration of the project in working days. The working hour per day was assumed to be 8 h.
where
represents the number of installed modules per day,
is the total number of modules to be assembled for the whole project, and
is the total duration of the project in days
where
is the total project costs and
represents the total direct cost, while
refers to the total indirect cost.
where
is the number of allocated resources of type
,
is the given hourly rate of each resource
as highlighted in
Table 4, and
is the time of the utilization of each resource
where
is the hourly indirect cost, as given in
Table 5.
4.4. Verification and Validation
After developing the DES model, it was verified and validated. Verification refers to the process of ensuring that the built model reflects the overall idea behind its development [
13]. Various approaches for verifying a simulation model were presented by [
41]. One of them is to examine its outputs for practicality by varying its input parameters. In other words, this is referred to as sensitivity analysis, which was performed and explained in detail in
Section 4.5. The sensitivity analysis yielded good results and ensured the correctness of the developed model. Another approach that was employed for the verification was to examine the construction activities developed in the simulation model to determine if they were initiated and proceeded chronologically in the desired sequence [
42]. This verification approach was accomplished using the animation feature in the AnyLogic software.
On the other hand, validation refers to the process of ensuring that the developed model is a representation of the real-world system. Validating the model assumption(s) and comparing the model’s outputs with a similar related study have been used as validation approaches [
13]. The assumptions relating to a simulation model can be categorized into two: data and structural assumptions. This study assumes that the data used for developing the simulation model are correct and valid. They were taken from different sources yet with similar values. In terms of the structural assumption, it was assumed that the modular units are continuously supplied to the site. This assumption was validated, as the utilization of the trucks was between 99–100% for all the tested scenarios. This shows that the modular units are continuously delivered to the site and always awaiting the truck to perform the maneuvering task to the desired location. Furthermore, the model was validated by comparing its output with that of a previous study. The study of Moghadam et al. [
21] investigated the use of tower cranes in the MiC installation process and found the installation rate to be 14–16 modules per day based on the most feasible (i.e., best scenario) technical conditions. The present study achieved 13 modules per day. The 1–3 difference in the number of modules installed per day (comparing this study with that of Moghadam et al. [
21]) resulted from incorporating job and management conditions in this study. These results proved the validation of the model, as the outputs of the two studies are comparable with reasonable justification, as illustrated above.
4.5. Sensitivity Analysis
Sensitivity analysis refers to the process of examining the changes to the output(s) of a model by varying its input parameter(s). The design of experiments (DOE) is a systematic approach to conducting a sensitivity analysis by deliberately changing the controllable input parameters and analyzing their impact on the model outputs to: (1) identify the controllable parameters that have a statistically significant effect on the outputs, and (2) determine whether there are interactions between parameters that have statistically significant effects on outputs. DOE starts by identifying dependent variables. The dependent variables are the model outputs (i.e., project duration, productivity, and project costs, derived in
Section 4.3). Then, independent variables and their range values are identified using information collected in
Section 4.2. These variables are the number of different installation crews, tower cranes, and trucks. Each variable has a range between “1” and “3”. These values are case-dependent (i.e., based on the project size and the site layout). After that, a full factorial experiment design is selected to ensure that: (1) none of the main effects is aliased with other main effects, (2) none of the main effects is aliased with any of the two-factor interactions, and (3) no two-factor interactions are aliased with other two-factor interactions. Hence, the selected design was able to provide a unique and accurate interpretation of results.
Table 5 shows 64 (
) experiments of the selected design for the six identified input parameters. Next, the DES model is used to evaluate the model outputs of each experiment. Finally, a series of univariate analysis of variance (ANOVA) tests are conducted to identify the significant parameters and their interactions on each of the model outputs.
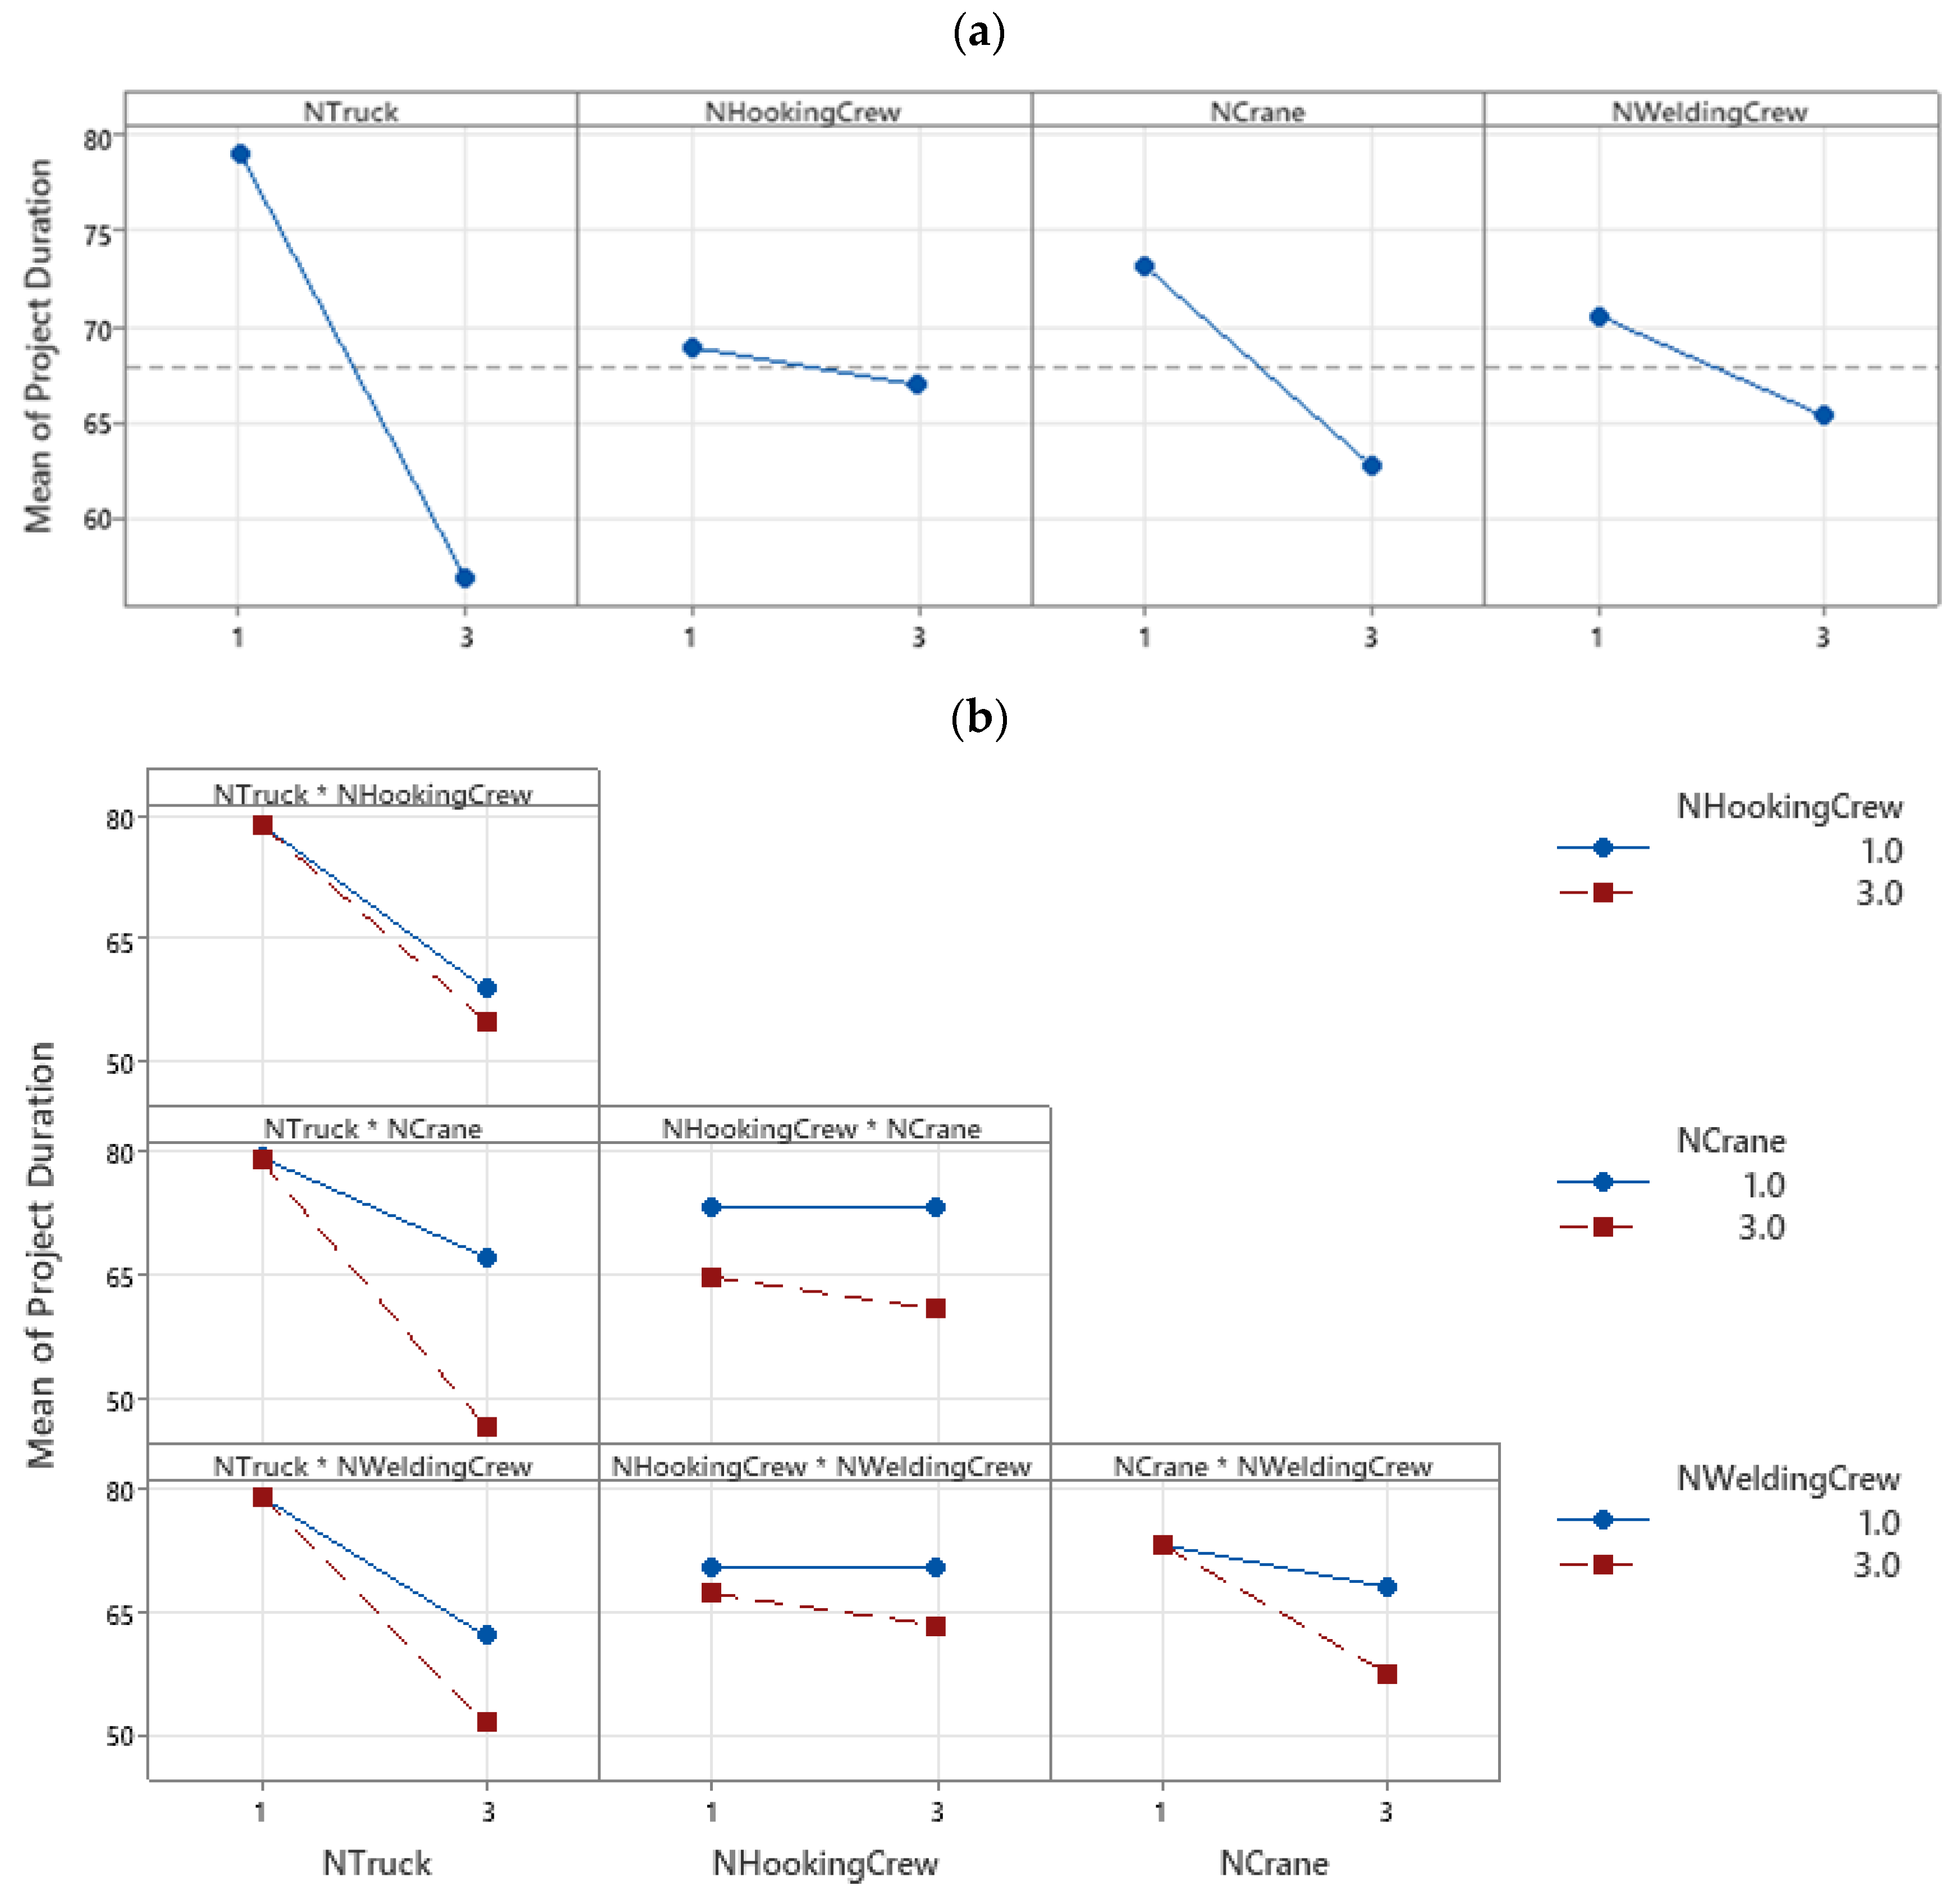
Figure 6 shows the input parameters that significantly impact the project duration and their interactions. These parameters are as follows: number of trucks (with
), number of hooking crews (with
), number of cranes (with
), and number of welding crews (with
).
Figure 6a indicates that increasing the number of these resources would reduce the project duration. This finding matches the results of previous models [
16,
43].
Figure 6b shows a number of significant interactions between these parameters. These interactions are between the number of trucks and hooking crews (with
), the number of trucks and tower cranes (with
), the number of hooking crews and tower cranes (with
), the number of trucks and welding crews (with
), and the number of tower cranes and welding crews (with
). Potential reasons for the significance of the number of trucks, hooking crews, and tower cranes and their interactions on the project duration are: (1) The number of trucks represents the inflow of modules to the site. If this inflow is reduced, the daily number of installed modules decreases, leading to an increase in the project duration [
16,
44]. (2) The hooking crews are responsible for a number of hooking activities that require a non-negligible time and high consideration due to safety precautions. (3) Tower cranes are the centerpiece of construction equipment on site that have a significant impact on the project duration [
21,
45]. (4) The significant interactions between these parameters can be attributed to the fact that these resources are responsible for a number of sequential activities at the beginning of the installation process. Hence, any disruption at this stage could prolong the project duration. The significance of the number of welding crews is attributed to the relatively long time of welding-related activities. These activities are at the end of the installation process. Hence, the significant interactions between the welding crews and the other resources at the beginning of the installation process could be due to the need to strike a balance between the time required to finish the activities at the start and end of the installation process to avoid any bottlenecks in the system that could prolong the project duration.
Figure 7 shows the significant parameters (
Figure 7a) and their interactions (
Figure 7b) on productivity. Expectedly, the results are similar to that of the project duration since both have an inverse relationship (refer to Equation (2)).
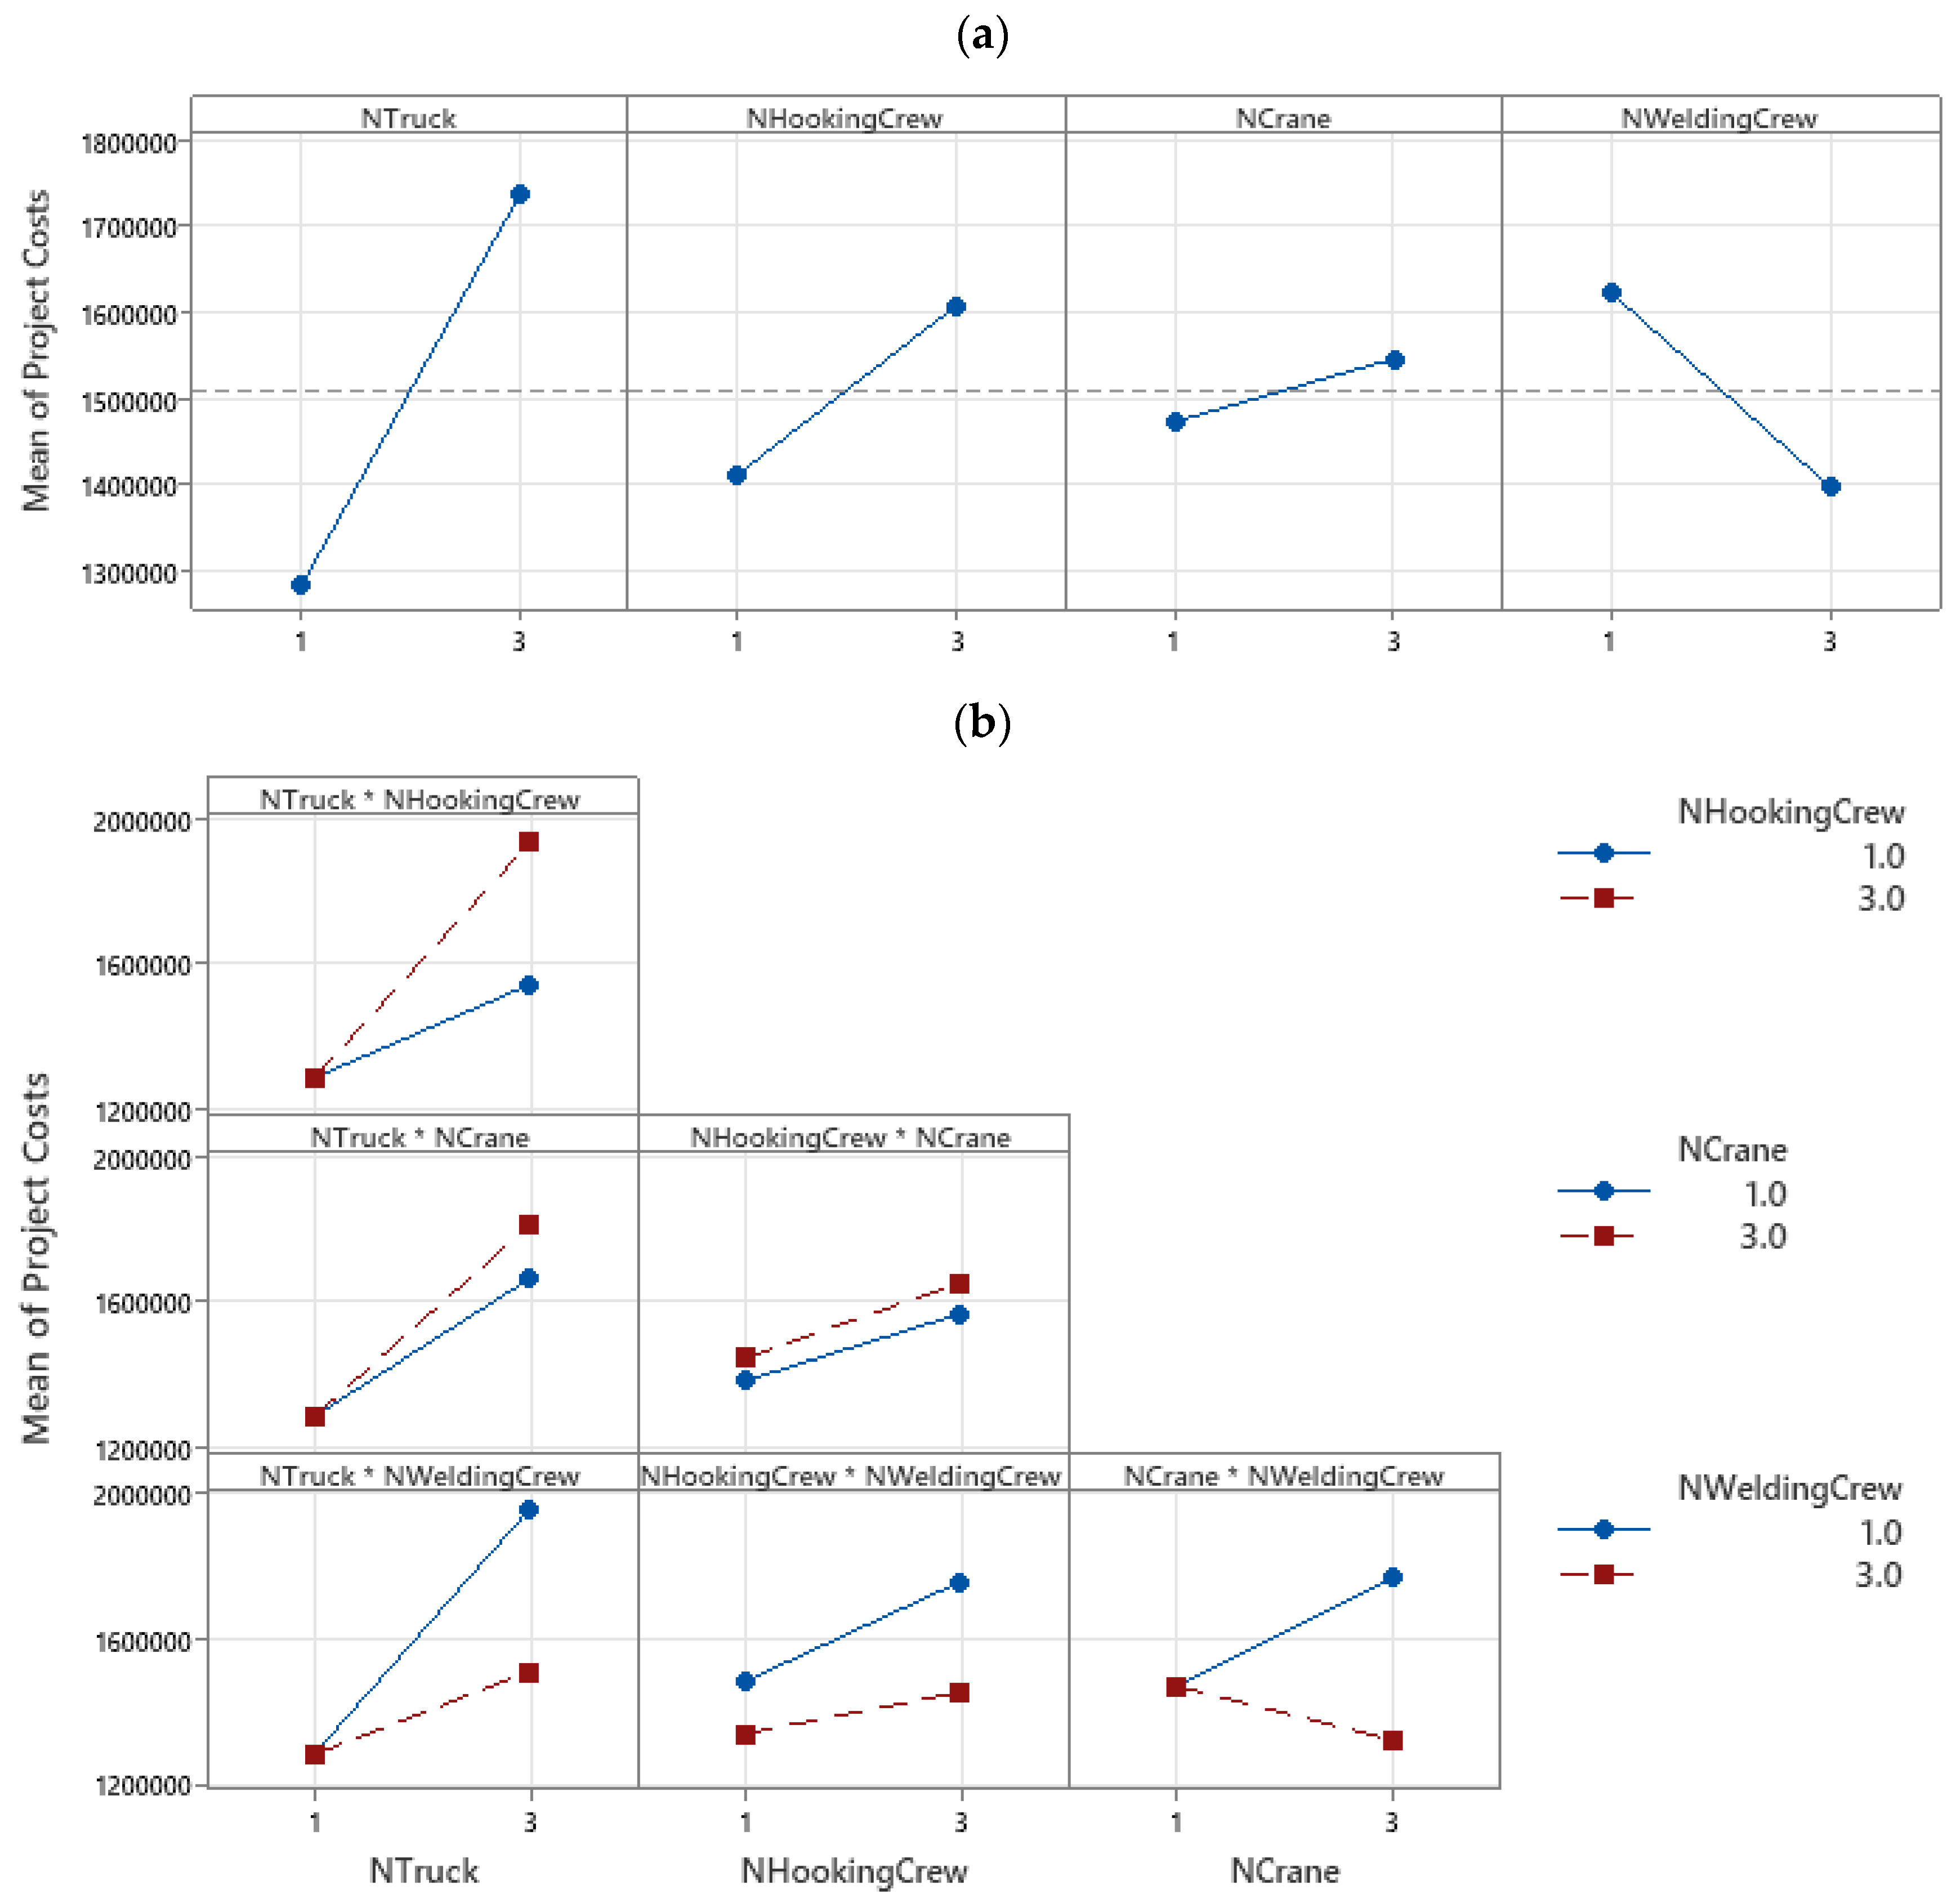
Figure 8 shows the main effects (
Figure 8a) and interaction effect (
Figure 8b) plots for a number of parameters on project costs. As shown in
Figure 8a, these parameters are as follows: number of trucks (with
), number of hooking crews (with
), number of cranes (with
), and number of welding crews (with
). In
Figure 8b, the significant interactions are between the following: the number of trucks and hooking crews (with
), the number of trucks and tower cranes (with
), the number of trucks and welding crews (with
), the number of tower cranes and welding crews (with
), and the number of hooking and welding crews (with
). This figure shows that reducing the number of trucks, hooking crews, and cranes could reduce project costs. This result matches with findings from the literature [
45,
46]. On the other hand, the analysis recommends increasing the number of welding crews to reduce project costs. This finding could be attributed to the fact that welding crews are responsible for a number of sequential activities at the end of the installation process. Hence, increasing the number of these expensive crews would reduce their average utilization and their daily working hours, leading to a reduction in their direct costs and the project’s indirect cost, according to Equations (3)–(5).
6. Conclusions
Modularization, a subset of off-site construction, is a modern approach in the construction industry that has gained momentum over the last few decades. Previous studies assessed the productivity of the MiC installation process. However, most previous studies did not capture the pertinent details of the installation process, such as the crane movement, the possibility of rework, and subjective factors influencing productivity. In addition to the lack of a mathematical model representing the association between allocated resources and MiC installation process in the literature, little attention has been paid to high-rise buildings. Therefore, this study was conducted to fill these gaps and contribute to the existing scholarly literature. A discrete event simulation model was developed to mimic the installation process of a typical MiC project. The model incorporated factors relating to the job (i.e., work dimensions, weather, etc.) and management (i.e., skills and worker’s motivation) conditions, as these are lacking in previous studies. These conditions are pragmatic as they represent reducing factors for the productivity of a construction process. The developed model was applied to a case study in Hong Kong, where a 35-story MiC building is to be constructed. The total number of modules to be installed is 525, with each floor accommodating 15 modules. The model was verified by changing the input variables to ensure logical output was obtained several times. Comparing the result of the model with a related study and confirming the model’s assumptions form the basis of the model’s validation. Then, a sensitivity analysis was conducted using a full factorial DOE to identify the significant installation resources and their effects on the project duration, productivity, and total costs. The DOE analysis indicates that the numbers of trucks, tower cranes, hooking crews, and welding crews have a significant effect on project duration, productivity, and total costs. Increasing the number of these resources would reduce the project duration and increase the installation productivity. In addition, increasing their numbers would increase project costs, except for welding crews, since reducing their numbers would increase the project’s indirect costs. Furthermore, a linear regression model was developed to establish the relationship between the productivity of the MiC process and the associated construction resources for such a process. The regression model is verified by conventional statistical measurements, which indicate the model’s ability in predicting the productivity of the MiC installation process.
As with every other study, this study has some limitations. Although the DES model incorporated some pragmatic factors that influence the productivity of the MiC installation process, other factors, such as the learning curve effect, overtime, and the crew’s experience, can be added to the model using system dynamics approach. In addition, the model’s output can be easily visualized by integrating the simulation software with visualization software, such as 3D Studio Max. Futhermore, future studies can leverage on machine learning approaches to develop the regression model.


