1. Introduction
Wide beams are defined by their cross-section aspect ratio in which the width is larger than the depth, and typically also larger than the column dimensions. Their use as an alternative to conventional deep beams in reinforced concrete (RC) frames is quite widespread in seismic regions of the Mediterranean area [
1,
2,
3,
4,
5]. Traditionally, seismic codes have imposed severe restrictions on the use of wide-beam frames (WBF), such as limitations to their use in high seismicity areas or reduction in behaviour factor (
q) [
6,
7,
8]. However, most of current codes dispense similar treatment to WBF as to deep-beam frames (DBF), except for some geometric and mechanical limitations regarding beam–column connections, mainly the ratio between the beam width and the column dimensions. These restrictions have been demonstrated to guarantee proper local performance, as observed in several experimental and analytical tests of wide beam–column sub-assemblages [
9,
10,
11,
12,
13,
14,
15,
16,
17,
18,
19].
In [
7,
8], it is shown that WBF may provide similar seismic global performances to DBF when both are designed according to modern performance-based seismic codes such as Eurocode 8 part 1 (EC8-1) [
20]. Despite lower local ductility of WB with respect to DB, WBFs show higher effective stiffness and deformation capacity, thanks especially to code provisions regarding the damage limitation limit state. There are some other mechanical benefits of WBF with respect to DBF: higher shear span in first-storey columns, higher ultimate chord rotation of beams, and lower deformability of joints.
Nevertheless, the similar treatment of WBF and DBF in current codes requires an accurate estimation of inelastic deformations of WB under cyclic loads, because the overall performance of the whole structure relies on their member ductility, among other characteristics concerning capacity design. For this aim, some performance-based seismic codes such as the American ASCE-SEI/41-06 (ASCE in the following) [
21] or the European Eurocode 8 part 3 (EC8-3) [
22] provide different expressions for yielding and ultimate chord rotation capacity of members. The model of EC8-3 is based on a continuous work developed in [
23,
24,
25,
26]. These formulations are obtained as a regression of experimental results contained in an increasing database up to 1540 tests. However, only 37 of those elements are WB, so it is not clear whether those formulations can appropriately fit those elements.
The scope of this paper is to evaluate the reliability of the current deformation model adopted by EC8-3 regarding wide beams. Firstly, a comparative numerical analysis of curvatures and chord rotations of a parametric set of eight couples of WB and DB was carried out, in which both current European and American approaches were used in order to understand the different cross-sectional behaviours and the corresponding inelastic member performances. Then, the experimental results of the database on the basis of the EC8-3 approach were disaggregated into DB and WB, and current formulations were applied separately in order to find whether experimental-to-predicted ratios are biased or not for both groups. Finally, some corrections for the current formulations are proposed in order to reduce the bias and thus increase the robustness of the model against cross-sectional shape variations.
2. Numerical Comparison of Deformations of Wide and Deep Beams
Inelastic flexural deformation of members is typically characterised by chord rotation θ at yielding and ultimate deformation (θy and θu, respectively). Macroscopic value θ is related to local variables, i.e., cross-section curvatures at yielding and ultimate deformation (ϕy and ϕu, respectively), through shear span (LV) and plastic hinge length (Lpl). In all the following, bw and hb are cross-section width and height, respectively; cn, concrete cover; d, effective depth; d′, distance from extreme fibres to the axe of reinforcement; z, internal lever arm; x, neutral axis depth; dbL and dbt, mean diameter of longitudinal and transverse reinforcement, respectively; As1 and As2, tensioned and compressed reinforcement areas, respectively; ω, ω′, and ωtot, bottom, top, and total mechanical reinforcement ratio, respectively; ρw, transverse reinforcement ratio; fc, resistance of concrete; fy and fu, yielding and ultimate steel strength, respectively; and My and Mu, yielding and ultimate bending moment, respectively. For any parameter A, ratios between values corresponding to WB and DB are indicated as AW/D (rather than using the heavier notation AWB/ADB).
In general, the elastic stiffness of WB is lower than for DB due to
hb,W/D ≤ 1, although
bw,W/D ≥ 1; thus, post-cracked deformability may also be expected to be higher for WB than for DB. In terms of curvature ductility μ
ϕ, traditionally WBs are considered to provide lower values than DBs [
4,
27], i.e., ϕ
u,W/B ≤ ϕ
y,WB. This statement is based on generic considerations: when
hb is reduced, higher
As1 is required; thus, a large, compressed concrete area is needed in order to satisfy equilibrium, which sometimes can be only attained by means of higher
x, likely causing higher ϕ
y and lower ϕ
u, and thus lower μ
ϕ. However, such an argument does not take into account that
bw,W/D can be quite large, nor that sections designed as high ductility class (DCH) perform as confined ones. On the other hand, it is difficult to find explicit and systematic comparative analyses in the literature for WB and DB regarding θ instead of ϕ. In fact, code provisions guarantee enough member (chord rotation) ductility μ
θ by implicitly regulating μ
ϕ, without any consideration regarding
Lpl depending on the cross-sectional aspect ratio.
In
Appendix A, preliminary generic considerations aimed at estimating cross-sectional and member ductilities for DB and WB designed in DCH are carried out, taking into account the previous conditions. In that scenario, cross-sectional behaviour can be interpreted as shown in
Figure 1: thanks to the confinement, similar ductilities are expected for both types, which is a different conclusion than what is found in the literature. The main reason is that ultimate deformation is ruled by the tensioned steel rather than the failure of compressed concrete; thus, both yielding and ultimate curvature ratios are rather inversely proportional to the depth ratios of the beams.
On the other hand, aimed at an estimation of μ
θ,W/D, two main code-based procedures for obtaining θ can be considered: EC8-3 and ASCE. EC8-3 proposes explicit formulations for θ
y and θ
u. θ
y expression (Equation (1)) depends mainly on ϕ
y, being
av a zero-one parameter for pre-yielding shear concrete cracking. For θ
u, two approaches are proposed: one with a more fundamental basis (Equation (2)), depending on constant ϕ
pl = ϕ
u − ϕ
y alongside
Lpl (calculated as in Equation (3)), and two pure empirical expressions, the first one explicitly for θ
u (Equation (4)) and a second one furnishing values of θ
pl, which is not considered in this work. α is the confinement effectiveness factor, ω
w the transverse mechanical reinforcement ratio, and ρ
d the diagonal reinforcement ratio. Only formulations for members without lap-splices in reinforcement are considered, as lap-splices are recommended to be placed outside critical regions for beams designed for high ductility [
28].
Concerning the argument of which type of approach is more suitable, pure empirical or more fundamental, two considerations must be made. Firstly, inelastic behaviour of RC members is a complex phenomenon which is difficult to model satisfactorily from a pure theoretical point of view [
27]; in fact, in this specific case empirical model is intended to provide more reliable predictions, showing higher robustness to the variability of single parameters [
26,
29]. Secondly, and more importantly, is it worth noting that the more fundamental approach is not a pure fundamental one. It adopts an apparent theoretical framework (Equation (2)) but then adds a yielding contribution which contains pure empirical factors to a plastic contribution which depends on a plastic hinge length whose calculation is also purely empirical (Equation (3)). Hence, it is actually another empirical expression.
Conversely, in the ASCE procedure, θ
y (shown in Equation (5) only for flexural deformation) is obtained indirectly as
My/
Ksec (
Ksec being the secant-to-yielding member stiffness, obtained as a constant fraction of gross uncracked one taking into account also shear contribution). θ
u is obtained as θ
y + θ
pl, where the plastic contribution θ
pl = θ
u − θ
y is picked from
Table 1, being
st the stirrup spacing,
Vs the stirrup shear strength contribution,
Vpl the maximum shear corresponding to the attainment of moment resistances, and ρ
bal the reinforcement ratio for balanced strain conditions.
As shown in
Appendix A, fundamental and experimental approaches return different member ductilities for WB and DB. According to the fundamental one, rather similar ductilities to those corresponding to curvatures are expected, while the experimental method furnishes lower ductilities for WB.
If results of the empirical approach are interpreted similarly to the fundamental approach, i.e., as the consequence of plastic curvatures alongside plastic hinge length, it is possible to obtain equivalent implicit values of
Lpl,eq,W/D ≈ θ
u,W/D/ϕ
u,W/D, again neglecting yielding deformations with respect to ultimate ones. It results in values of 1/(
bw,W/D·
dW/D1.35) for unconfined beams and
dW/D0.65 for confined ones, which means that WB may show shorter
Lpl,eq than DB for confined sections but higher values in the unconfined case, which is contrary to the trend observed in most of the expressions proposed for plastic hinge length [
23,
26,
27].
The ASCE method may provide different values than EC8-3, as it is not based on curvatures. θy,W/D only depends on gross stiffness, which may return large differences between WB and DB. On the other hand, θpl for design in DCH may be rather similar in all the cases, as it depends mainly on the stirrup arrangements; however, provided values are independent of geometry, so it may not be possible to predict corresponding ratios for θu and μθ.
Hence, within the limitations of these preliminary simplified considerations, in general, WBs designed in DCH are expected to provide similar curvature ductilities but chord rotation ductilities lower than or similar to DBs. It is worth noting that such relationships seem to depend mainly on cross-section dimensions.
Aimed at a proper assessment of those preliminary conclusions, a systematic analysis is required. In this section, the set of eight couples of WB and DB already used in [
7] is adopted, aimed at a comparative numerical analysis of deformations, but in this case, the contribution of confinement is considered alternatively as null and complete. The actual comparison between DB and WB is based on both magnitudes ϕ and θ, and the corresponding ductilities (μ
ϕ and μ
θ) are also obtained. The characteristics of the set of beams are presented in
Table 2, assuming
LV = 2.5 m,
cn = 20 mm,
dbL = 14 mm,
dbt = 8 mm,
fc = 33 MPa, and
fy = 630 MPa.
Five parameters are assumed: (i) class (DB or WB); (ii) cross-sectional aspect ratio (
hb/
bw) for each class (types A and B, providing higher or lower
My, respectively); (iii) ω′/ω = 1 or 1.5, which in most cases satisfy the requirements of EC8 for DCH; (iv) ω
tot (high and low, which makes top and bottom reinforcement, respectively, correspond to code’s upper and lower limit when ω′/ω = 1.5); and (v) effectiveness of transverse reinforcement on confinement (yes or no). DB and WB show similar
My for each case, and the high reinforcement case provides approximately three times the flexural strength provided by low reinforcement. Stirrup arrangements satisfy the requirements for DCH of EC8 and also the limitations provided by Eurocode 2 (EC2) [
30] regarding the number of transverse legs.
2.1. Curvatures
Full moment–curvature (M-ϕ) relations are obtained through a fibre model for all the cases. Eurocode-based strain–stress models are assumed. For concrete, an EC2 parabolic envelope and confinement model proposed in EC8 are adopted. For steel, a bilinear envelope with hardening is considered, with values of fu/fy and ultimate strain εsu according to those suggested in EC2 for steel type B.
Results for confined cases with asymmetric longitudinal reinforcement are shown in
Figure 2. Post-elastic hardening of reinforcement causes that in most cases,
Mu >
My. In almost all the cases, there is spalling of concrete cover before the attainment of ε
su in the tension reinforcement, causing an instantaneous slight drop of
M. Hence, ϕ
uof WB reaches larger values than DB, as predicted. It is worth noting that the increment in secant-to-yielding stiffness for high-reinforced sections with respect to low-reinforced ones is rather similar to such an increment in total reinforcement.
In most cases, simplified assumptions made in the preliminary considerations (pre-emptive yielding of steel, concrete and steel failure in unconfined and confined sections, respectively, quasi-linear behaviour of concrete until ϕ
y, negligible values of
x with respect to
d, similar top reinforcement stresses at ϕ
y, etc.) are confirmed, and estimated values of ϕ and μ
ϕ are predicted with error lower than 10%. In
Figure 3, one of the couple DB-WB is studied in detail. It corresponds to a case in which WB presents approximately half the depth and double the width of DB; thus, the cross-sectional area is rather similar. The results confirm the predictions: WB shows double ϕ
y, similar ϕ
u,unconf, and more than double ϕ
u,unconf compared to DB.
Results for all the cases are shown in
Figure 4, in which mean ratios between WB and DB are indicated as W/B in the bottom of the graphics. In general, more satisfactory values are obtained for asymmetric reinforced sections in positive bending than in the rest. For unconfined cases, high-reinforced sections show much poorer performances in terms of μ
ϕ than low-reinforced sections (almost half values), while for confined sections, the bias is much lower.
It is worth noting that provisions of EC2 regarding the distribution of stirrup legs within the width of the section causes quite a higher contribution of confinement in WB rather than in DB: in terms of μϕ, DB is multiplied by 1.5 on average, while for WB, the factor is almost 3.0. Even in the cases of asymmetric high-reinforced WB to negative bending, which does not satisfy DCH provisions on longitudinal reinforcement, high confinement causes similar values of μϕ than in the rest of the cases.
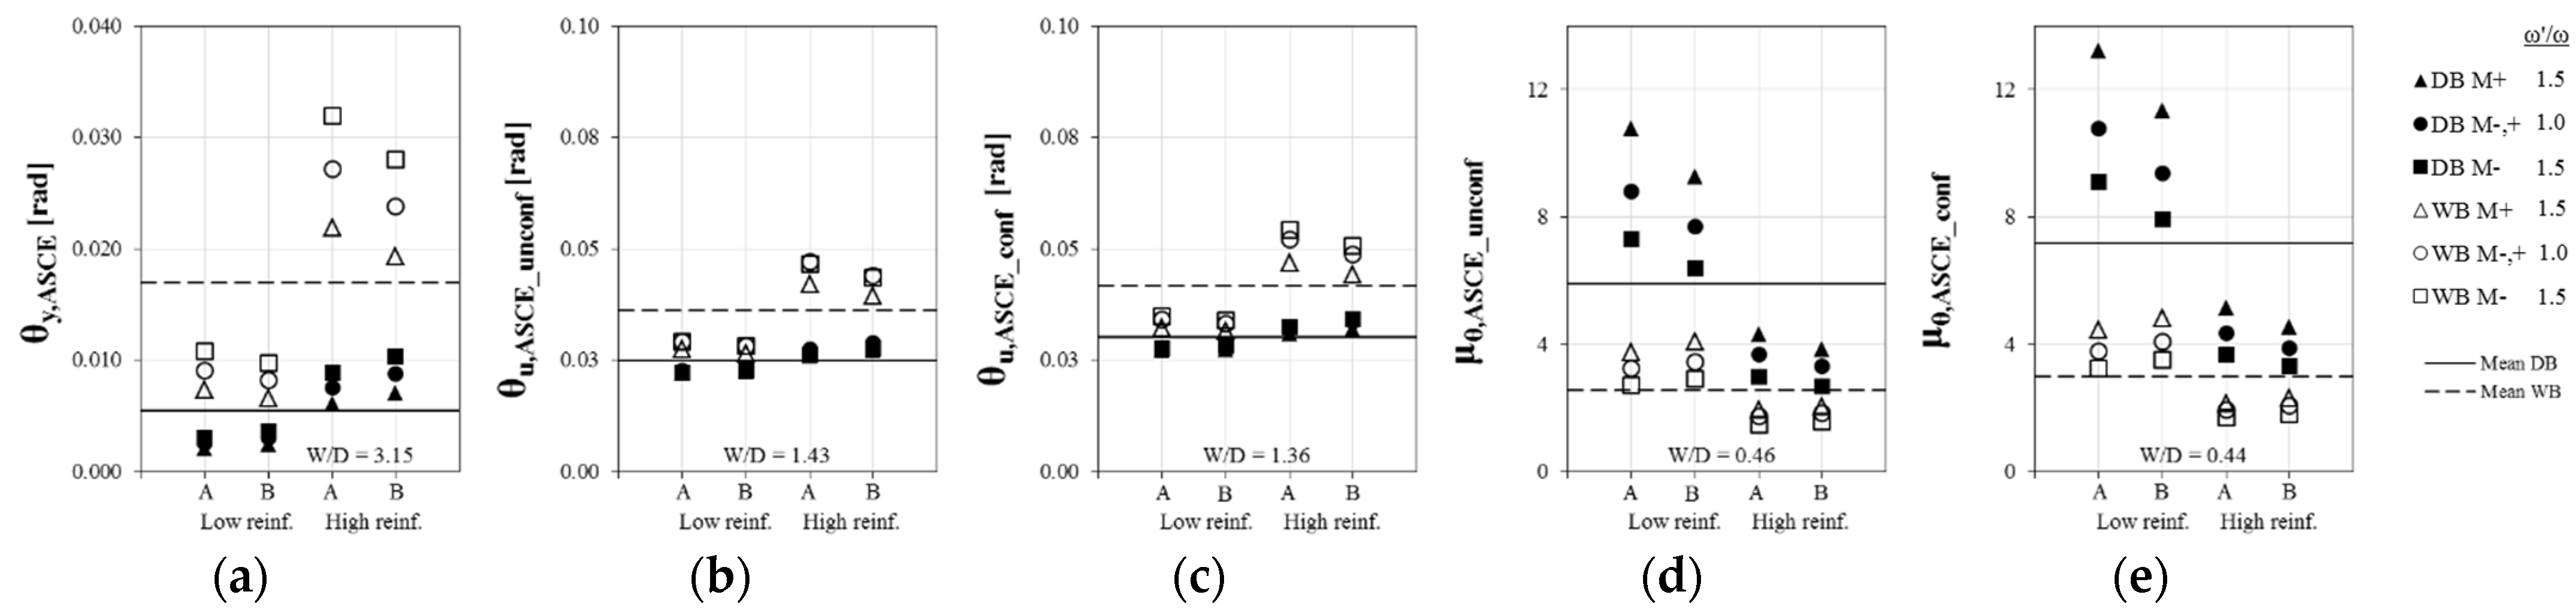
2.2. Chord Rotations
EC8-3 and ASCE procedures are carried out for all the cases. Regarding the first approach, θ
y(
Figure 5a) shows a similar relative distribution of values to ϕ
y, although θ
y,W/D is 15% lower than ϕ
y,W/D on average due to the different shear contribution at yielding, independent of curvature. Mean secant-to-yielding stiffness values are on average 9% and 23% of the uncracked gross stiffness for low- and high-reinforced DB, respectively, and 15% and 38% for WB, respectively, due to the higher reinforcement ratios in WB than in DB. The mean global value is 21%, consistently with [
23].
In
Figure 5b,c, θ
u values for unconfined and confined cases, respectively, obtained following the EC8-3 fundamental approach, are shown.
Lpl of WB is 0.86 times that of DB, on average. This is exactly the ratio between mean values of θ
u,W/D/ϕ
u,W/D for confined beams (see
Figure 4c and
Figure 5c); however, for unconfined beams, still larger θ
u values for WB rather than for DB are shown, notwithstanding the lower
Lpl for WB, because in this case, large yielding deformations are not negligible with respect to ultimate ones. Consequently, μ
θ is 40% lower for WB rather than for DB for the unconfined section, while similar ductilities are expected for confined beams (see
Figure 5d and
Figure 5e, respectively).
Figure 6a,b corresponds to θ
u for unconfined and confined cases, respectively, obtained following the EC8-3 empirical approach. The relative positive influence of confinement on WB is quite lower than for the fundamental approach: the mean increment in θ
u is only 16% instead of 125%. For unconfined beams, notwithstanding the similar ϕ
u for WB and DB, higher values of θ
u are observed for WB rather than for DB; in fact, the implicit equivalent plastic hinge length is 32% higher for WB, on average. Instead, for confined cases, mean
Lpl,eq,W/D = 0.62, which is more consistent with explicit values within the fundamental approach. The lower influence of confinement on WB causes that, even on confined beams, μ
θ is 25% lower for WB than for DB.
Finally, in
Figure 7b,c, θ
uvalues for unconfined and confined beams, respectively, corresponding to the ASCE approach, are presented. Values of θ
y (
Figure 7a) correspond by definition to a constant degradation of 30% from the uncracked gross stiffness; thus, much larger differences between high- and low-reinforced sections are observed. Values are much lower (about half times) than in both EC8-3 approaches for confined cases, because within this method, increment due to confinement is very low. The differences in θ
u between the different cases are only due to the contribution of θ
y, because values of θ
pl are rather constant for all the beams. It is worth noting that similar mean ratios between θ
u,W/D for confined sections are obtained with ASCE and EC8-3 empirical approaches: about 1.37. According to the ASCE approach, WB shows less than half the μ
θ of DB (see
Figure 7d,e).
3. Disaggregation of Experimental Database
Affirming the reliability of the results obtained in the previous section requires the EC8-3 method to be appropriate, aimed at predicting deformations of WB. In this section, those formulations are assessed at this scope.
The EC8-3 approach has almost fully adopted the formulations corresponding to members under cyclic loading, with proper seismic design and with potential slippage of longitudinal bars, proposed in [
25,
26] for deformations at yielding and ultimate, respectively. All those expressions are obtained as a regression of experimental results contained in a large database of about 1540 tests [
24]; for more detailed information on the composition of the database, see
Appendix B.
The current paper only considers beams with a full rectangular cross-section and ribbed bars, with neither lap-splices nor precompression or retrofitting, whose failure is governed by uniaxial flexure. Hence, 277 DB and 37 WB are selected. Regarding wide cross-sections, only 5% of the total amount of specimens are tested in the parallel direction to the cross-section axe of minimum stiffness (members oriented as “wide” sections). Hence, the reliability of the models based on such databases for this minority might be under discussion.
For this aim, the model by Biskinis and Fardis [
25,
26]—B&F in the following—and also the preliminary one by Panagiotakos and Fardis [
23]—P&F in the following—are applied separately to the sub-databases of DB and WB, in order to obtained disaggregated values of experimental-to-predicted ratios and thus assess the possible bias of results within the two groups. The ASCE model is also employed in order to compare the accuracy regarding WB and DB, although it is actually regressed from another database [
31]. The results of the disaggregated application of deformation models should be carefully considered considering that the sub-database of WB is quite reduced and also unbalanced regarding the previous items.
All the graphics presented in the following show (i) the median value—which is intended to be more representative than the mean in the case of large dispersion [
23]—of single experimental-to-predicted ratios, which is indicated as “Median exp/pred” and which corresponds to the slope of the plotted thick line; (ii) the 16th and 84th percentiles (associated with standard deviation in a normal distribution), corresponding to the slope of the dashed lines; and (iii) the coefficient of variation (CoV).. It is also indicated in each case which half of the graphic corresponds to conservative results (i.e., when formulations provide overestimation at yielding and underestimation at ultimate deformation).
3.1. Curvatures
Stress–strain models are similar to those adopted in the original approach (see
Appendix B). Experimental and predicted ϕ
y (through the fibre model) are compared in
Figure 8a,b for DB and WB, respectively. In both cases, adequate fitting is shown, although the fibre model slightly underestimates values. Rather similar trends are obtained if the simplified procedures in [
23,
25] are performed.
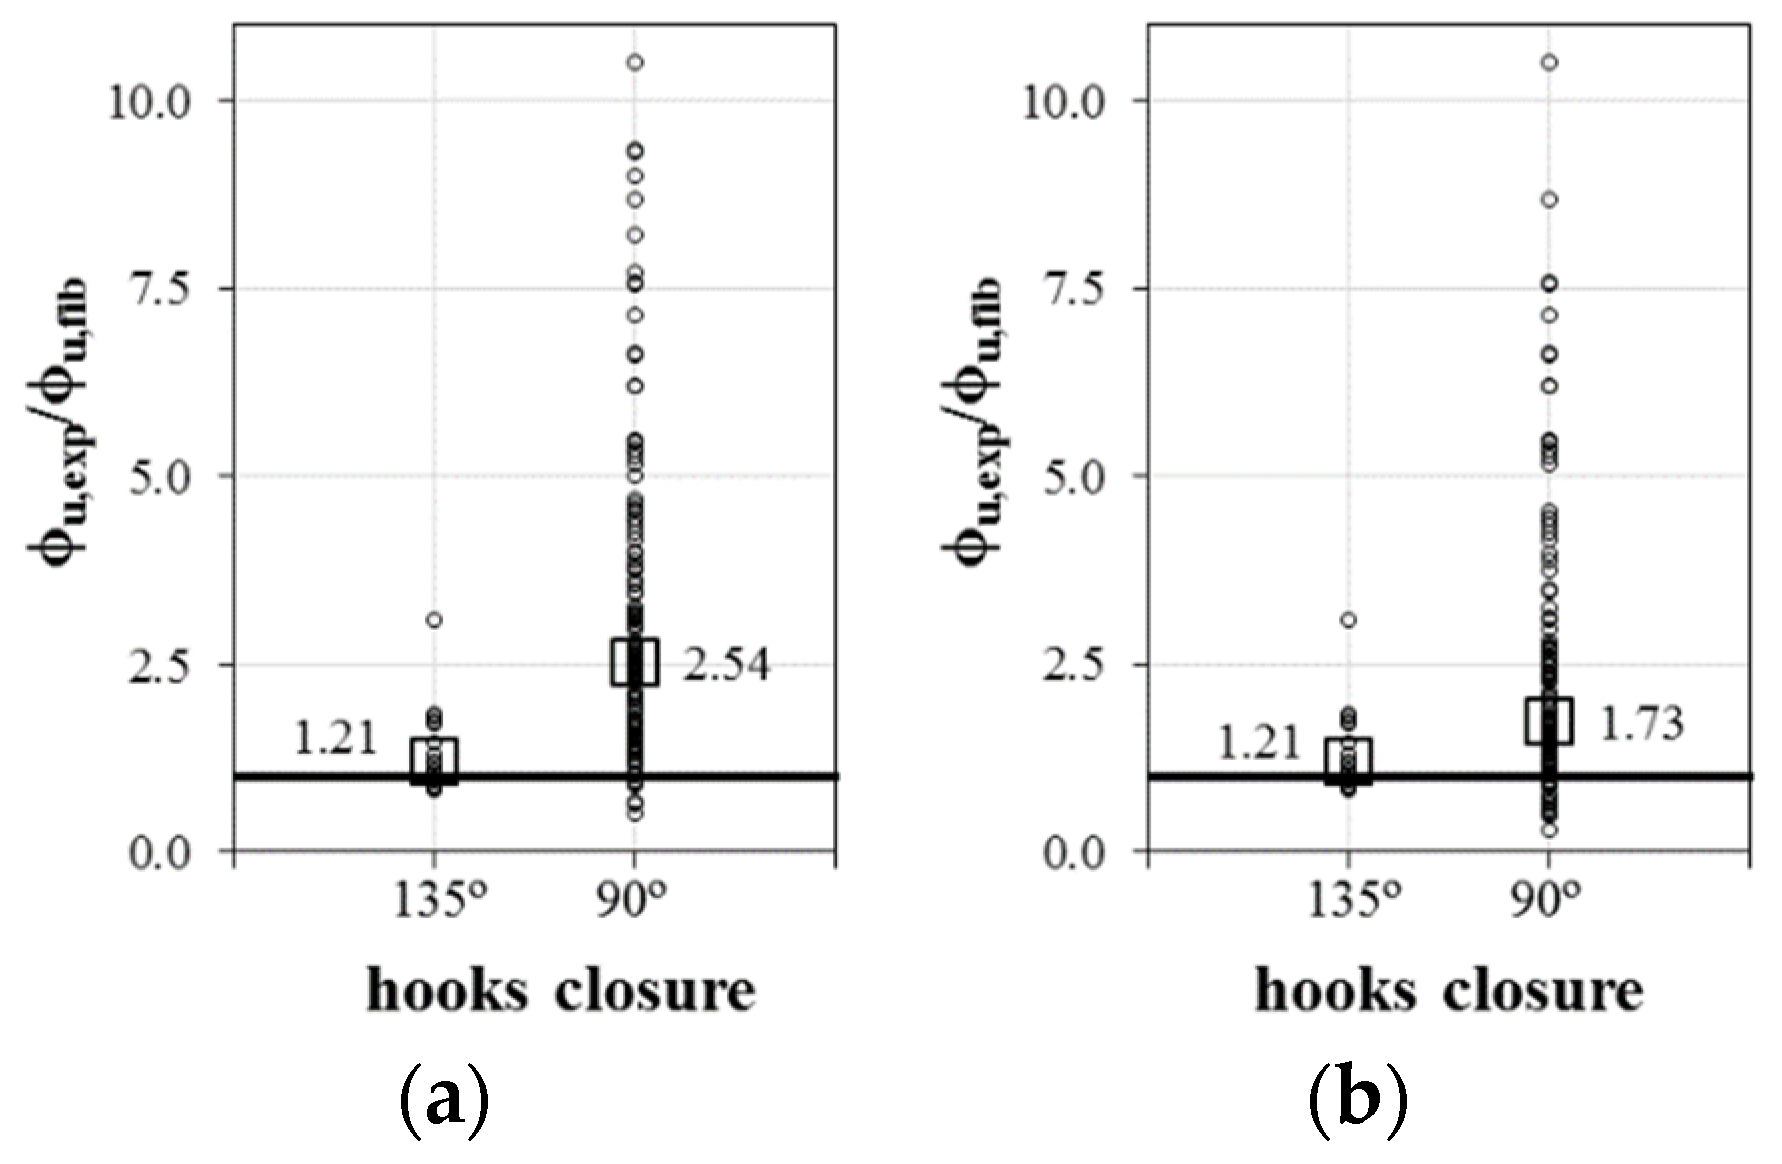
Conversely, quite poorer fitting is shown for ϕ
u. If stirrups with 90° closed hooks are assumed to not provide any confinement at all, corresponding beams show large underestimation of ϕ
u than the rest (see
Figure 9a). In fact, this assumption is intended to be feasible for design purposes, given that it furnishes conservative results. However, the real influence of hooks on stress–strain models is not clearly quantified; a modification of Mander’s confinement model for columns with 90° closed hooks is proposed in [
32]. If full confinement is assumed for beams with 90° closed hooks in which some confinement would be expected if 135° closed hooks were used (i.e., in beams with α > 0), the error reduces largely (see
Figure 9b), even when only 56 out of 277 beams belong to this group. Regarding the application of fundamental approaches for the estimation of θ
u (based on ϕ values), the last assumption is adopted herein. For empirical approaches, it is not relevant because the influence of confinement is significantly lower (see
Section 1) and also because, in the particular case of the present database, beams with 90° closed hooks show lower density of stirrups, thus providing low values of α.
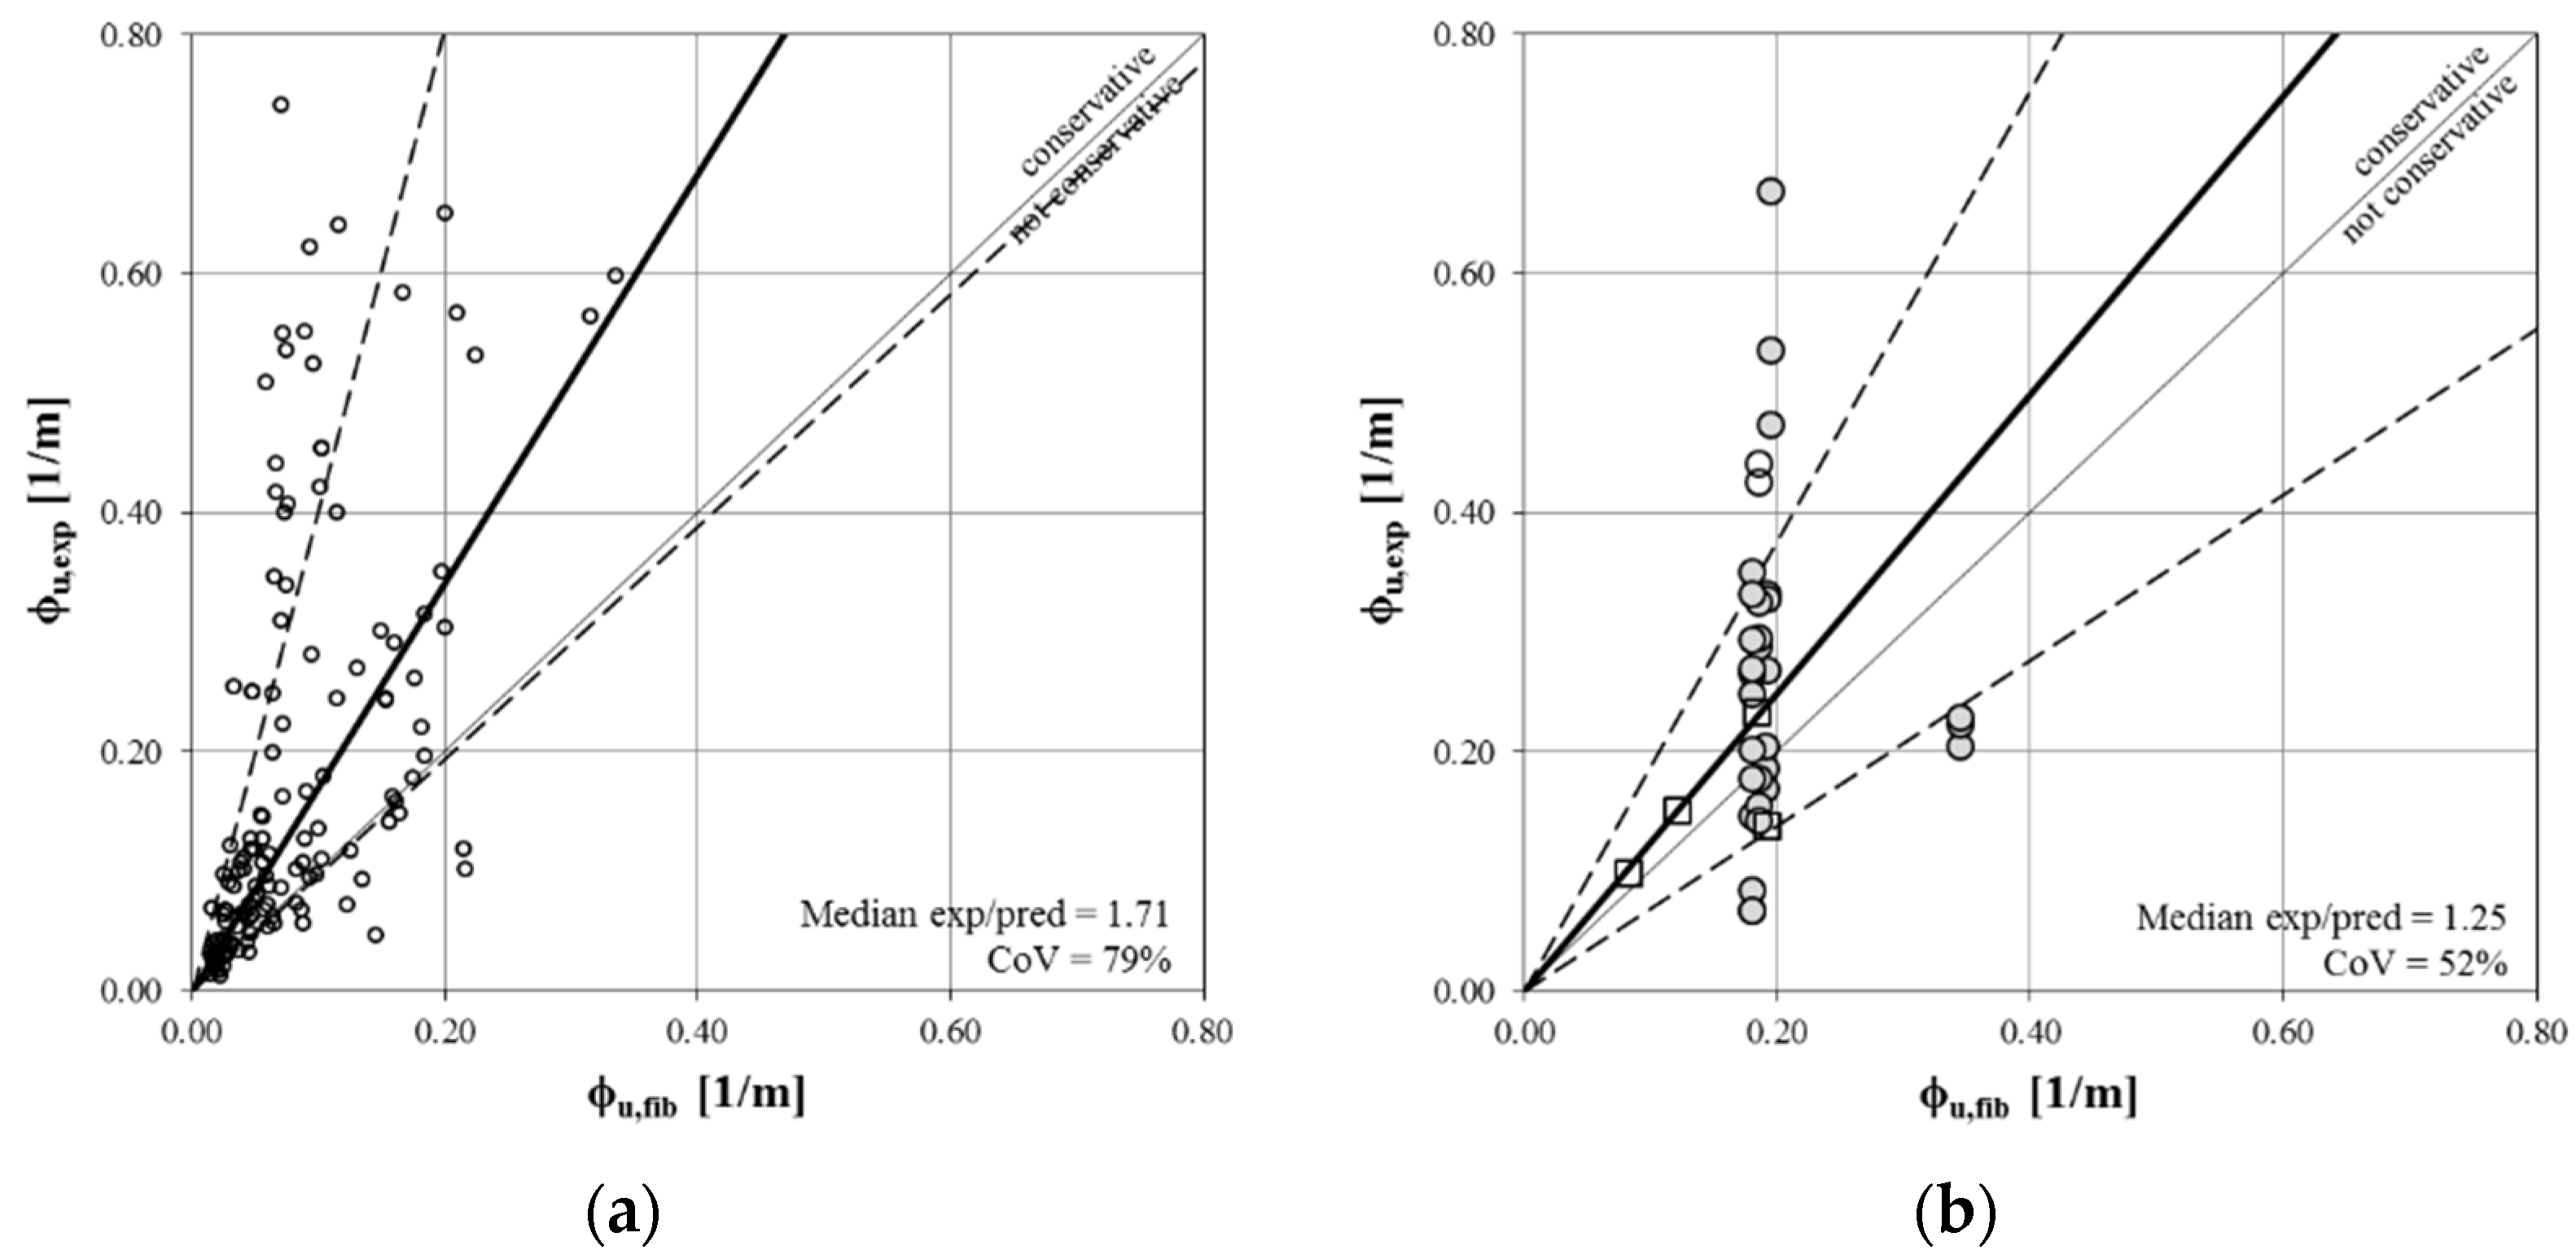
In
Figure 10, experimental and predicted ϕ
u are compared. High underestimation and very large dispersion of results are shown especially for DB. It is worth noting that the adopted confinement model has been obtained as a regression of the whole original database, including columns. It should be necessary to apply the same procedure to the columns belonging to the database in order to know whether the generalised bias in beams is balanced by columns or not. In the last case, the difference of results may rely on the different approach on curvature calculation, even when similar models are adopted. It emphasises the higher sensitivity of fundamental procedures for θ with respect to empirical ones regarding steel type or seismic detailing.
3.2. Chord Rotations
Regarding θ, different formulations proposed in [
23,
25,
26] are applied separately to the disaggregated sub-databases DB and WB. In Equations C1 to C8 of
Appendix B, all the expressions are presented in a homogenised form. In the following, subscripts “
emp” and “
fun” denote empirical and fundamental approaches, respectively. Formulations from ASCE (Equation (5) and
Table 1) are also performed.
Median values and dispersion magnitudes of all the cases are shown in
Table 3. As expected, ASCE formulations show much poorer fitting than the rest, as they largely underestimate chord rotations. Both P&F and B&F approaches slightly underestimate θ
y both for DB and WB, which is not conservative; conversely, they underestimate θ
u for DB (which is conservative) and overestimate θ
u for WB (not conservative). Empirical approaches show better fitting than fundamental ones: in the first case, median experimental-to-predicted ratios are always within ± 20% with respect to perfect fitting, while in the second case, it can reach 100%, due to the high uncertainty regarding the calculation of curvatures.
In general, the P&F model shows better fitting than B&F, as the original database from which it comes out as a regression is more similar to the sub-databases used herein (e.g., it does not include sections different from rectangular shape). However, the present work focuses mainly on B&F because it is the basis of current EC8-3 formulations. Except for the fundamental approach, dispersion levels in all the cases are rather similar to those observed in the original works.
In
Figure 11, experimental and predicted θ
y for the B&F model are compared. Larger underestimation but lower dispersion is shown for WB rather than for DB. The median experimental-to-predicted ratio for all the beams (DB + WB) is 1.11 if WB values are weighted in order to provide a similar contribution to the median despite their lower number of tests, or 1.08 otherwise. No particular bias is shown for the different sub-groups (i.e., steel class, type of loading, possibility of slippage, or hook closure angle).
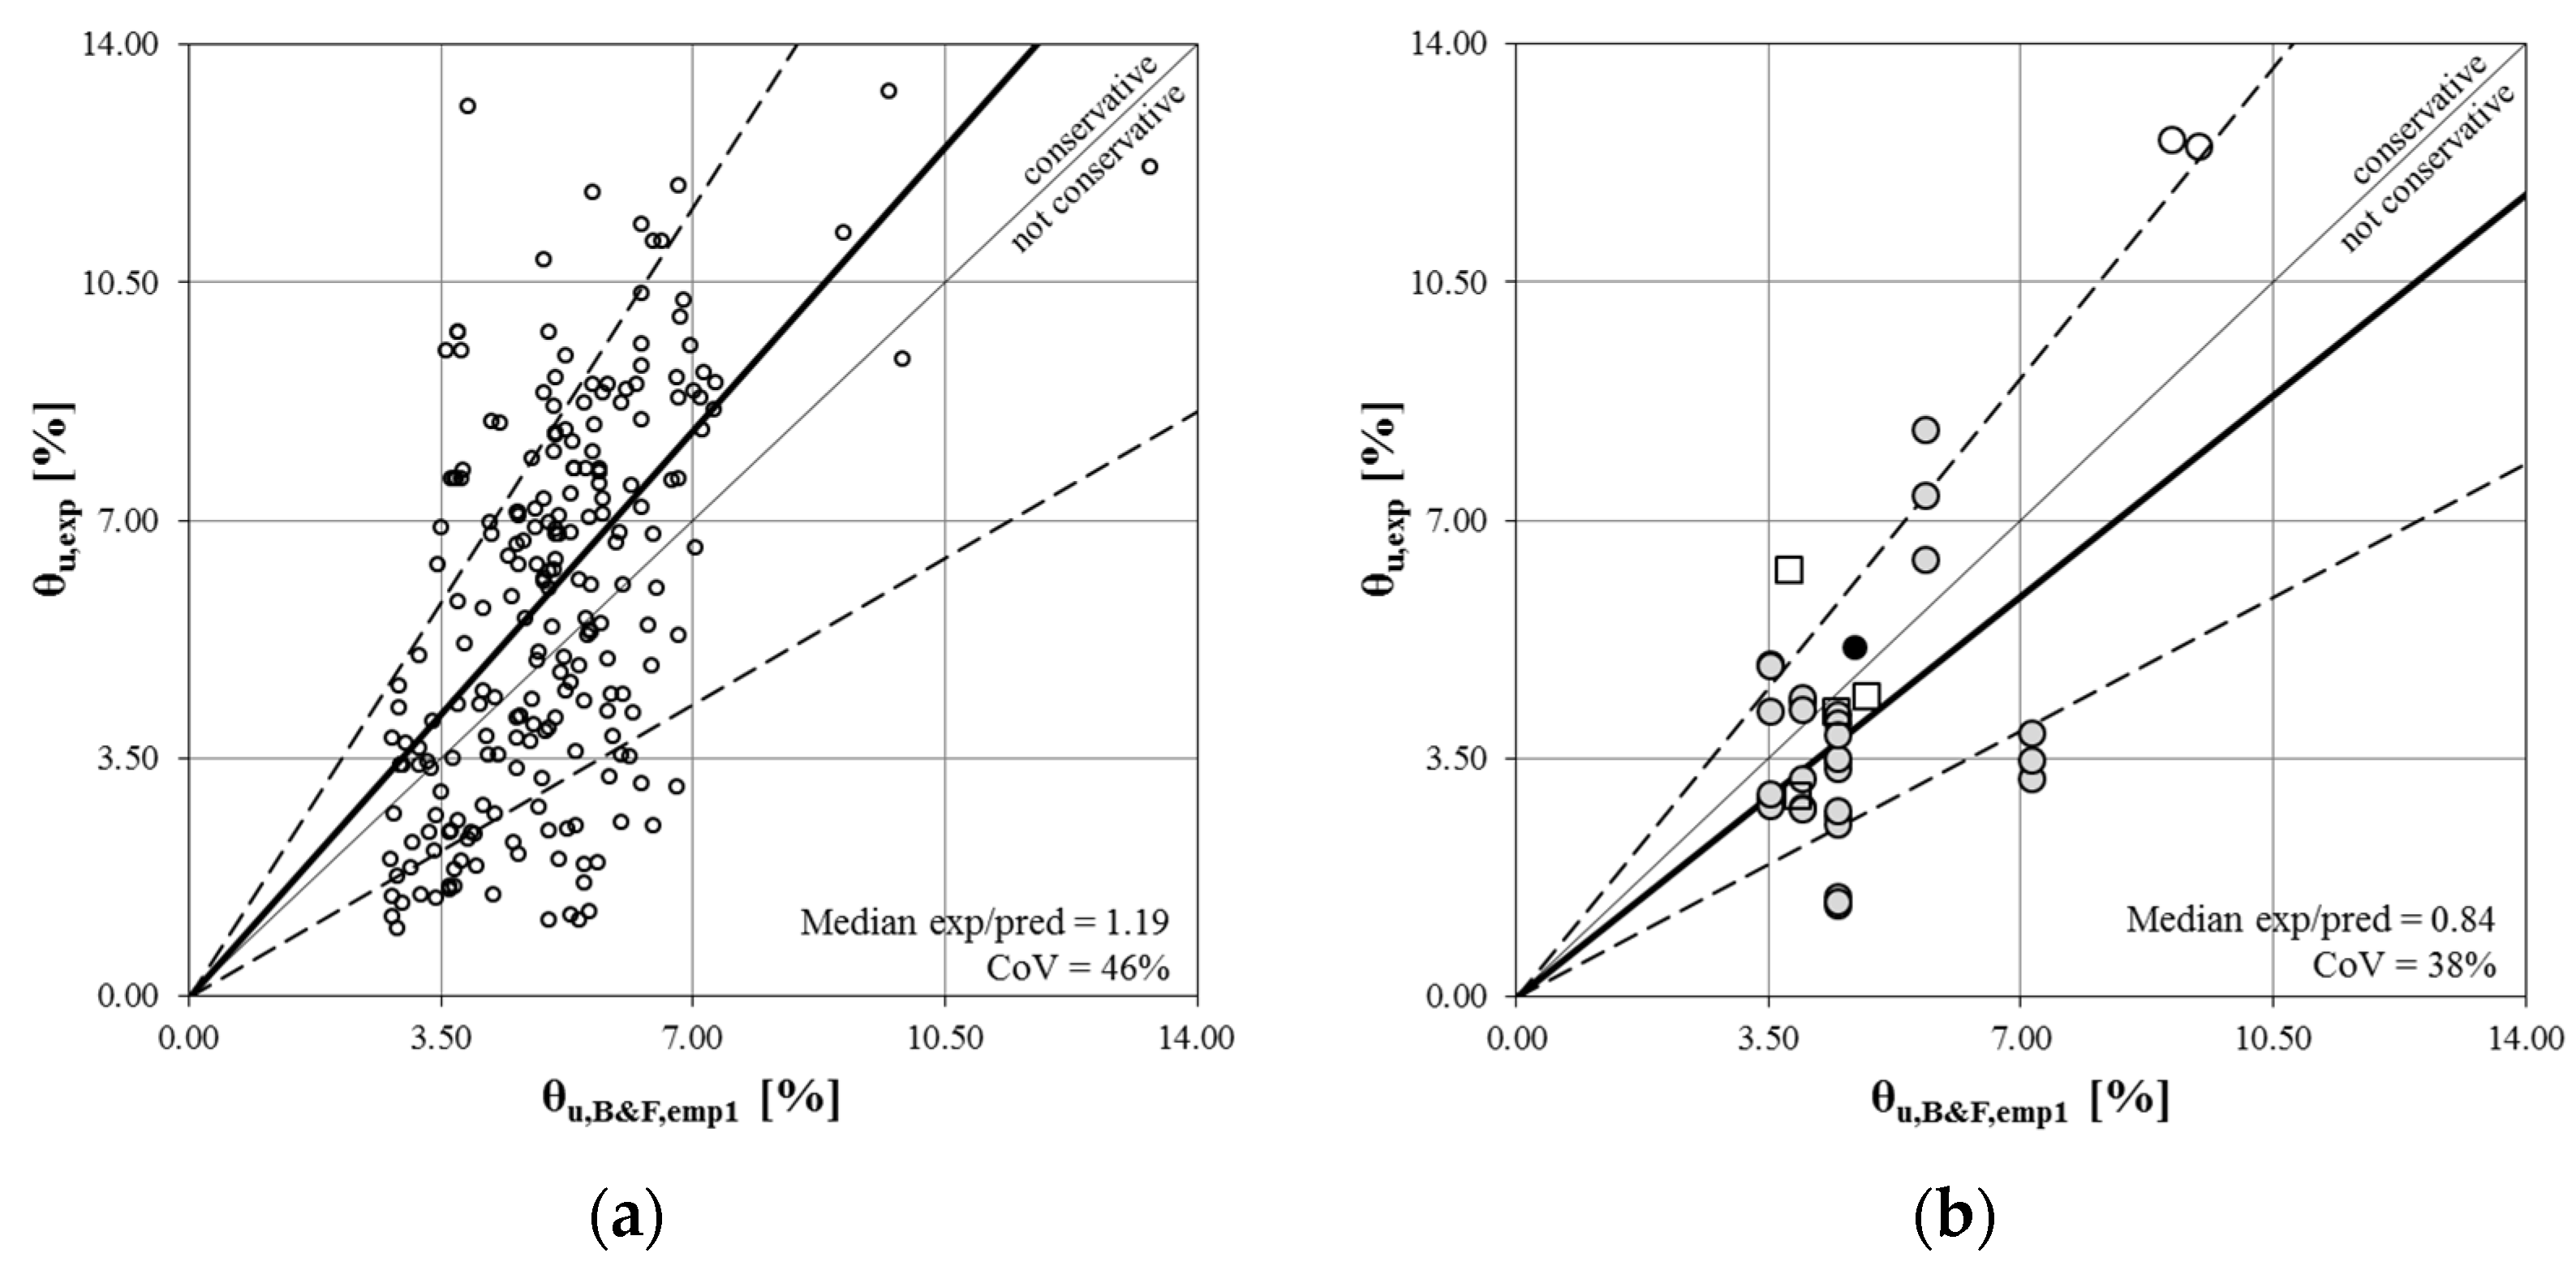
Regarding θ
u, in
Figure 12, experimental and predicted values for the B&F first empirical model are compared. Almost exactly symmetric bias is shown for DB and WB: median experimental-to-predicted ratios for both cases are inverse (1.19 for DB and 0.84 for WB); better fitting is shown by P&F’s second model (1.00 and 0.95, respectively). If both sub-databases are merged, weighted median values of 0.94 are obtained, which is not conservative. It is worth noting that the bias is more important for the sub-groups that likely represent current seismic-designed buildings: hot-rolled ductile steel, cyclic loading, slippage of longitudinal reinforcement, and seismic detailing of stirrup hooks (see
Figure 13). In fact, EC8-3 assumes by default the formulations corresponding to cyclic loading and slippage.
The B&F’s fundamental approach (see
Figure 14) shows rather similar underestimation of θ
u for WB (median values of 0.88), but the overestimation for DB is huge (2.06), even when curvatures corresponding to perfect confinement also for 90° closed hooks are assumed. This may suggest that values of
Lpl are highly underestimated for DB and overestimated for WB, even when they are higher for DB rather than for WB as they increase with
hb. Conversely to the empirical approach, experimental-to-predicted ratios do not show significant bias when disaggregated for the different sub-groups (i.e., loading, steel, etc.). For the merge of sub-databases, a weighted median ratio of 1.16 is shown.
Undoubtedly, the reliability of the results obtained in this section may be under discussion, considering the limited number of tests belonging to sub-database WB and also the reduced variability of cases. However, in almost all the cases, the median experimental-to-predicted ratios for the merge of both sub-databases DB and WB are roughly near to 1.0, which means that those few results of WB provide a kind of balance to DB ones, whose reliability is higher. Additionally, lower bias is observed for WB than for DB.
4. Proposal of Corrected Expressions
In the previous section, the application of formulations on the basis of the current procedure in EC8-3 separately to DB and WB shows that experimental θu is lower than that predicted for WB and higher than that predicted for DB, while experimental θy is slightly higher than that predicted mainly for WB.
In this section, some corrections for the formulations of [
25,
26] are proposed, in order to reduce the bias and thus increase the robustness of the deformation model against cross-sectional shape variations. This proposal should be understood purely as an available simple alternative for the assessment of buildings with WB, or to be used for compared analysis of WB and DB, for instance. The current approach in EC8-3 makes no explicit distinction between columns and beams aimed at the estimation of θ. Hence, any alternative set of formulations able to account for the cross-sectional aspect ratio should also be checked for columns, which is not possible to be carried out with the existing database because cross-sectional orientation is always similar in most cases.
The proposals are intended as slight modifications within the framework of the formulations, which is not altered. In some cases, independent contribution factors are added, while in other cases, new parameters are placed within other contributions. In all the cases, corrections are carried out only on the part of the body of formulations which is purely empirical, aimed at best-fitting.
However, some premises according to previous results could be followed aimed at the definition of the correction parameters. Firstly, they must refer to the geometry of the section (
hb and/or
bw), which are also responsible for different performances of DB and WB regarding curvatures (see
Section 1). In order to be consistent with the disaggregation of the original database that allowed determining the bias (see
Section 2), maybe the most feasible factor to be used would be the cross-sectional aspect ratio (
hb/
bw), which is on the basis of the definition of DB and WB consistent with a “corner” value of 1.0. Still, all the expressions already contain terms depending on
hb; thus, different attempts aimed at avoiding such duplicity are carried out.
Regarding θ
u, the influence of aspect ratio can be intended as being divided into two contributions, as it influences both ϕ and
Lpl (see
Section 1). The fundamental approach already takes into account the important influence on ϕ; thus, any further influence of aspect ratio should concern only
Lpl, in such a way that it increases for DB and decreases for WB. Conversely, in an empirical approach, both implicit contributions of aspect ratio on ϕ and
Lpl are concentrated mainly in the factor
hb−0.35 and to a lesser extent on the confinement factor 25
α·ωw; the latter is not modified in the proposal.
Firstly, the form of the expressions is chosen. Four different forms for the corrected empirical formulations for θ
u are proposed; they are shown in Equations (6)–(9), in which parameters
C1 and
C2 are defined in each formula for best fitting, i.e., experimental-to-predicted ratio equal to 1.0 and the lowest dispersion. Aimed at easing the awareness of the differences between formulations, some of their members are condensed with respect to the original expression in Equation (A22) (see
Appendix B):
a =
ast[1 −
aold·
acy(1 + 0.25
apl)/6](1 − 0.43
acy)(1 +
asl/2);
kα = 25
α·ωw;
kρ = 1.25
100ρd;
kω = (max{0.01;ω}/max{0.01;ω′}·
fc)
0.225.
The first proposal is to multiply the original formulation by a power of aspect ratio (Equation (6)), which increases θ
u of DB and decreases θ
u of WB. In order to avoid the duplicity of terms depending on
hb, a second option, based on a factor only depending on
bw, is proposed (Equation (7)). However, this option needs to be given a “corner” value for
bw in order to define the threshold for the increase or decrease in θ
u, which is actually kind of a definition of DB and WB regarding only
bw, being in some cases insufficient. On the other hand, the third and fourth options are essentially based on the combined influence of
hb and
bw on relative ultimate curvatures (see
Section 1). In the third option (Equation (8)), the original denominator
hb is replaced by the geometric mean of
hb and
bw (in order to keep the dimensionless character of the shear span). In the fourth option (Equation (9)), a similar approach is proposed, but more importance is given to
hb.
Regarding the fundamental approach for θ
u, corrections should be performed on the value of
Lpl (Equation (A25), see
Appendix B). The theoretical relation between
Lpl and cross-sectional geometry (
hb and
bw) is not clearly defined in the literature. The expression proposed in [
27] considers
Lpl as a constant ratio (8%) of
LV plus an increment due to slippage, thus independent of the cross-sectional geometry. In [
23], a similar form of the expression is assumed. Conversely, in [
26], a term depending on
hb is added, whose weight may be comparable to that of
LV. In any of those approaches
bw is proposed as a relevant variable.
Two options for modifying Equation (A25) are proposed, in order to obtain larger values for DB and shorter ones for WB. Parameters C
1 to C
4 are analogously defined in each formula for best fitting with experimental data. In the first one (Equation (10)),
hb is multiplied by the aspect ratio; conversely, in the second proposal (Equation (11)), the higher difference between DB and WB is intended to be reached by emphasising the relative contribution of
hb at the expense of the term dependent on
LV, without any contribution of
bw. However, several attempts aimed at conducting an optimisation of the last expression show values of
C3 =
C4 = 0 and still very large dispersion. Hence, only the first option (Equation (10)) is developed.
Finally, a proposal for a correction of the formulation for θ
y (Equation (12)) is also made. Only the shear contribution (last term) should be modified. Analogously to Equation (8),
hb is replaced by the geometric mean of
hb and
bw.
Proposed parameters for all the formulations are shown in
Table 4. Rather satisfactory solutions are found when compared to
Table 3: similar dispersion levels to the original formulations are shown, except for the corrected fundamental approach (Equation (10)). Perfect fitting is shown for corrected θ
y (see
Figure 15) and for the second option of corrected θ
u (see
Figure 16). In the rest of the expressions, the bias of results is rather symmetric and much more reduced than in the original ones: mean ratios are approximately within ±5% with respect to perfect fitting, except for the fourth option for corrected θ
u in DB (+14%).
Regarding bias corresponding to different disaggregations of sub-databases (steel type, slippage, loading type, and hook closure; see
Table 5), corrected θ
y values show quite good balance, in accordance with the reduced global CoV. The first two proposals for corrected empirical θ
u also show rather good balance, but quite large bias is shown by the third and fourth proposals and especially by the fundamental approach, whose reliability is actually lower.
Finally, some of those proposals are applied to the set of DB and WB analysed in
Section 1 (see
Table 2), in order to obtain more realistic values of deformations and thus a more representative comparison of ductilities between both types. In most cases, it is possible to apply the same corrections, previously proposed for expressions in [
25,
26], to the EC8-3 formulations (Equations (1) and (4)), because they correspond to a particular case of those ones. The last is not possible only for the fundamental approach, given that the two approaches show different confinement models, different contributions of fixed-end rotation at ultimate deformation, and also different expressions of
Lpl. Hence, the final proposal of corrected expressions for EC8-3 is presented in Equation (13) for θ
y and Equations (14) and (15) for θ
u, since they show better fitting than the rest.
The results are shown in
Figure 17 for Equations (13) and (14). Equation (15) causes a reduction in values also for DB, given that those beams have
bw = 300 mm, which is common for this kind of beam but higher than the “corner value” of 262 mm. In fact, such a value is obtained for best fitting with the sub-database of DB, which contains a high number of scaled specimens (255 out of 272 with
bw < 262 mm). This is not an issue for the original expressions and for the rest of the proposed corrected formulations, in which cross-section geometry measures are always rated to
LV. Hence, Equation (14) may be more robust than Equation (15).
Mean θ
u (
Figure 17a,b) shows an increase of 13% for DB and a decrease of 12% for WB, which are slightly lower than the bias of median experimental-to-predicted ratios for the corresponding sub-databases (+19% for DB and −16% for WB, see
Table 3 and
Figure 12). These modifications result in rather similar θ
u values for WB and DB for both confined and unconfined cases (θ
u,W/D,unconf = 0.96 and θ
u,W/D,conf = 1.08, on average). On the other hand, equivalent implicit
Lpl according to these values becomes always lower for WB than for DB (
Lpl,et,W/D = 0.95 and 0.45 for unconfined and confined sections, respectively), which is consistent with the explicit expression of
Lpl in the fundamental approach.
Consequently, according to the corrected model, even lower local ductilities are expected for WB than for DB (μ
θ,W/D = 0.53 and 0.59 for unconfined and confined cases instead of 0.67 and 0.75, respectively; see
Figure 17c,d).
Nevertheless, it cannot be the cause of the imposition of lower behaviour factors (
q) for WBF in past codes, because even the original deformation models are more recent than those prescriptions. Moreover, such a lack of local ductility of WB with respect to DB should not become a reason for any further prescription in current seismic codes regarding a limit of
q for wide-beam frames (WBF). In fact, the local ductility of beams appears to be only one of the parameters governing the global capacity of WBF when the damage limitation limit state is the most critical condition of design, as in most EC8-designed buildings [
7,
8]. First of all, local ductility of columns is able to balance the global ductility of the frame; the rest of the modern code’s provisions result in favourable design results for WBF rather than for DBF (e.g., larger
LV of first storey columns or higher stiffness of joints).


