Article

The Effect of Microbiologically Induced Concrete Corrosion in Sewer on the Bearing Capacity of Reinforced Concrete Pipes: Full-Scale Experimental Investigation

1
National Center for Materials Service Safety, University of Science and Technology Beijing (USTB), Beijing 100083, China
2
School of Environmental, Civil, Agricultural and Mechanical Engineering, College of Engineering, University of Georgia, Athens, GA 30602, USA
*
Author to whom correspondence should be addressed.
Buildings 2022, 12(11), 1996; https://doi.org/10.3390/buildings12111996
Submission received: 21 October 2022 / Revised: 4 November 2022 / Accepted: 9 November 2022 / Published: 16 November 2022
(This article belongs to the Topic Pipeline and Underground Space Technology)

Abstract

:
The main part of sewer pipelines is commonly made up of precast reinforced concrete pipes (RCPs). However, they often suffer from microbiologically induced concrete corrosion (MICC), which has made them less durable than expected. In this study, three-edge bearing tests (TEBT) are performed on full-scale RCPs with preset wall losses to determine how MICC influences their bearing performance. For this purpose, several bearing indices such as D-load, peak load, ultimate load, ring deflection, ring stiffness, and failure energy are presented or specified to characterize the load-carrying capacity, stiffness, and toughness of these RCPs. It is found that crown concrete corrosion hardly changes the mechanical behavior of the first elastic zone of RCPs, so that D-load is not affected, but it shortens the crack propagation zone significantly, leading to a reduction in ultimate and peak loads. Furthermore, RCPs’ ring stiffness and toughness are negatively correlated to thickness of wall loss, while the transverse deformability of the ring cross-section is positively correlated with it. Additionally, it was found that crown corrosion affects the ultimate load of different sizes of RCP in different ways. The 2000 mm RCP is affected the most, with a 50 percent reduction in ultimate load. The 1000 mm RCP follows, with a 36 percent reduction, and the 1500 mm RCP has a reduction of less than 20 percent. This research contributes to comprehending the degradation of in-service sewage pipes, hence informing decision making on sewer maintenance and rehabilitation.

Graphical Abstract

1. Introduction

Reinforced concrete pipes (RCPs) are precast pipes made of concrete and steel cages, which are widely used for transporting fluids such as drainage effluents, sewage, and sometimes oil or gas [1,2]. When utilized as a structure for sewage systems, they are prone to suffer from microbiologically induced concrete corrosion (MICC) [3]. This raise worries that the RCPs will not service as reliable as expected. Therefore, this study is being conducted to investigate how MICC of sewer pipes affects their load-bearing capacity.

1.1. Microbiologically Induced Concrete Corrosion in Sewer Pipes

Early studies comprised many investigations into the durability of concrete in sewer pipes. In the late nineteenth century, Olmstead et al. discovered a sewer with a white paste covering the interior surface in Los Angeles, which was the first recorded instance of MICC [4]. This initiated more than a century of research on cementitious material corrosion in sewer systems. For the first part of the twentieth century, the corrosive medium was thought to be chemical sulfuric acid produced by the oxidation of hydrogen sulfide, until Parker et al. introduced the microbiological mechanism of biological sulfuric acid formation [5,6]. To mimic microbiological corrosion behavior in sewage systems, long-term performance test methods for sewage pipes, such as sulfuric acid immersion [7,8], microbial breeding chambers [9], demonstration plants [10], and in situ exposure experiments [11], were carried out. These studies, which were done on standard cement or concrete samples, have enabled us to learn more about the corrosion behavior of concrete materials in sewage systems.
Concrete corrosion in municipal sewers is a loss of assets caused by microorganisms, which is distinguished by the feature that the protective layer of concrete above the sewage level deteriorates into a soft, white, pulp-like substance that virtually loses its strength [4,6]. This involves a complex sulfur cycle uniquely present in unfilled gravity sewers. This phenomenon is known as microbiologically induced concrete corrosion (MICC).
It was found that MICC in the sewer system occurs mainly in the concrete pipe wall located in the gas phase. The most severe corrosion usually occurs in the crown of the pipe and in the area near the effluent level, whereas there is almost no corrosion below the water level [10,12,13]. This is due to the fact that the effluent level separates the sewer into an anaerobic and aerobic ecosystem [14]. The sulfate-reducing bacteria (SRB) that thrived in the submerged biofilm converts sulfate in effluent to aqueous sulfide, which spills over and is adsorbed on the concrete surface above the effluent level. Additionally, sulfur-oxidizing bacteria (SOB) turn the sulfide into sulfuric acid (biogenic H2SO4), which dissolves in the pore water of the concrete to make a highly concentrated acid solution with a pH of less than 2 [15].
According to a model proposed by Islander et al., the colonization process of SOB bacteria on concrete surfaces can be divided into three following stages [16].
  • Stage 1: It is an abiotic process dominantly, in which the pH of the concrete surface is reduced by acidic gases such as carbon dioxide and sulfide.
  • Stage 2: After pH < 9, the concrete surface gradually becomes a habitable place for neutrophilic sulfur oxidizing bacteria (NSOB) and some fungi. Their metabolites will continue to lower the surface pH.
  • Stage 3: After pH < 4, the dominant colony succeeded in acidophilic sulfur oxidizing bacteria (ASOB). In this phase, H2S spilled from effluent is converted to sulfuric acid. Steady concrete corrosion is thus initiated.
More detailed mechanisms and phenomena of MICC in sewer systems can be found in a state-of-the-art review article by Wang et al. [17]. The sulfur cycle process of MICC is illustrated in Figure 1.
After being generated, biological acid dissolves in the water droplets that adhere to the crown; thus, it is not easy to inward diffuse due to gravity. This was demonstrated by the investigations of Kiliswa et al. [18]. When examining a concrete sewer well, they found a thin semi-corroded layer between the corrosion layer and the matrix, the thickness of which was found to be less than 0.5 mm (as shown in Figure 2) [18]. However, this does not mean that biological sulfuric acid produces less depth of corrosion, rather, MICC is destructive for concrete pipes since the inward mobility of microorganisms causes fresh matrix to be attacked on a frequent basis. That is thought to be the crucial distinguishing factor between biogenic sulfuric acid corrosion and the mineral sulfuric acid mimics, whose corrosive layer is thick and usually acts as a passivation cover, slowing down the further attack [18,19]. It is concluded from previous study that the concrete corrosion created products with no strength of gypsum slurry, and the semi-corrosion layer of less than 1 mm may be almost insignificant.

1.2. Literature Review on the Effect of MICC on Sewer Pipe Structure

Some researchers have recently focused on the influence of concrete corrosion on pipe structural performance for the purpose of life prediction or condition assessment of sewage pipelines. To investigate the mechanical features of the corrosive pipe under static load, Fang et al. stacked static loads on buried full-size pipes whose wall were manually chipped away. They then employed the finite element method to compare the mechanical responses of pipes that were set up with varied corrosion depths, corrosion widths, load magnitudes, and overburden depths [20]. Furthermore, the dynamic response of these concrete pipes with simulated corrosion was investigated in a multi-field coupled environment considering fluid [21]. In other work, plain concrete pipes with a 400 mm inner diameter were divided into 300 mm-long segments before being subjected to a three-edge bearing test (TEBT), whereby the effect of various corrosion widths, loading rates, and corrosion locations on pipe mechanical response were analyzed in terms of concrete surface strain [22]. Zamanian et al. developed a finite element model of a corroded concrete conduit in a buried setting using the ANSYS platform, which mimics the corrosion of sewage pipelines by evenly reducing a layer of concrete wall. The finite element model was able to mimic crack development and pipe fragmentation as well as the nonlinear behavior of the concrete, soil, and pipe–soil interactions [23]. Lumies and Scheperboer et al. analyzed the structural response and damage processes of circular and egg-shaped plain concrete sewer pipes, focusing on the influence of (bio)chemical attack on their mechanical characteristics, using a combined experimental-numerical method. Their experimental study was conducted under biaxial loading conditions. The built finite element model was able to simulate cracks, and the numerical and actual findings were in excellent agreement [24,25]. All these studies improved our knowledge of how corrosion affects the stress–strain properties of sewer pipes. However, how the corrosion loss at crown concrete affects the exact bearing capacity (that is designed bearing capacity) of pipes is rarely investigated.

1.3. Characterization Approach of the Bearing Capacity of Sewer Pipes

There are two approaches (direct and indirect) used to assess or design the bearing capacity of concrete pipes. With the direct method, a field test, a computer simulation, or a theoretical calculation is used to determine the ground pressure that buried pipes can bear [26,27]. The indirect design method determines the bearing capacity of concrete pipes by a common three-edge bearing test (TEBT). When performing TEBT, a concrete pipe is placed on a base made of two wooden bearing strips and then loaded vertically at the crown along its longitudinal axis. Accordingly, the ultimate load and D-load of the concrete pipe can be calculated, both of which are usually specified to describe the bearing capacity of concrete pipes [28]. The D-load is defined as the load required to result in a 0.01-inch (0.3 mm) crack in a pipe, and the ultimate load (referred to as the Du) is the maximum load a pipe can bear before it fails [29].

1.4. The Present Study’s Contribution and Organization

The contribution of this article is to investigate the changes in the load bearing index and performance of pipe structures caused by microbiologically induced concrete corrosion (MICC), based on the three-edge bearing test (TEBT) that has been widely used in engineering practice. To achieve this, the present study carried out TEBT for three sizes of full-scall RCPs with internal diameters of 1000, 1500, and 2000 mm under various wall losses. Additionally, several indices for describing the bearing capacity of RCPs were determined, including ring deflection, ring stiffness, and ring failure energy, in addition to D-load and Du among others. This article is organized as follows: (1) Section 2 introduces the pipes with pre-set wall loss and their specifications, the three-edge bearing test (TEBT) system and loading scheme, as well as the definition of characterization indices for bearing capacity; (2) Section 3 describes the experimental results and gives analysis and discussion; and (3) Section 4 outlines the main conclusions and recommendations.

2. Specimens, Equipment, and Methods

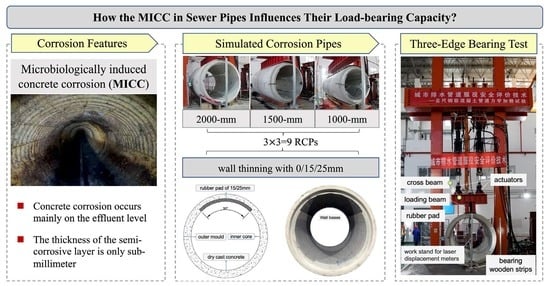
2.1. Fabrication of Simulated Corrosion Pipes

Given the almost complete loss of strength of the corroded layer and the sub-millimeter thickness of the semi-corroded layer, this study ignores the microbial corrosion process and artificially adjusts the thickness of the concrete cover to mimic the pipe after MICC. The concrete cover over a 90° arc at the pipe crowns was thinned by 15 and 25 mm, as shown in Figure 3, on the assumption that the concrete above the effluent level (maximum design effluent fill of 75% in China) is uniformly corroded. Indeed, according to a study of the sewer network in Phoenix, USA, uniform corrosion is a common and typical phenomenon [30].
The simulated defective reinforced concrete pipes (RCPs) were supplied by a major supplier of concrete productions in Beijing, China. They were manufactured using the same mandrel compaction procedure as normal pipes, where the corroded area was achieved by applying a neoprene pad with a thickness of 15 or 25 mm to the inner core. These RCPs were dry cast, and the concrete is designed to be C50 grade.
The process described above is applied to pipes with internal diameters of 1000, 1500, and 2000 mm, which are commonly used for municipal trunk sewer lines. For comparison, the unaltered pipes were tested together, so there are a total of nine specimens were used in this study, with three 0/15/25 mm corrosion losses for each size of pipe. The specifications of these pipes are given in Table 1.

2.2. Three Edge Bearing Test System

A three-edge bearing test (TEBT) system was built utilizing the mechanical test system (MTS) of the National Center for Materials Service Safety (NCMS) at the University of Science and Technology Beijing, China. Two actuators were employed to perform loading in a displacement-controlled mode to avoid bias side roll. Each actuator can provide a maximum force of 500 kN. The loading force is transmitted to the pipe specimen through a crossbeam and a longitudinal beam. Flexible contact between the crown of the RCP and the loading beam is implemented by a 30 mm rubber mat. The bottom of the pipe is supported on a pair of wooden bearing strips with chamfered corners, which are bolted to limit the separation from one another. Figure 4 gives a schematic and physical view.

2.3. Loading and Monitoring

2.3.1. Loading Procedures

This study loaded sewer pipes in accordance with the Chinese standard “Test Methods for Concrete and Reinforced Concrete Sewer Pipes” (GB/T-16752-2017) [31]. To avoid bias side roll, a displacement-controlled loading mode was employed instead of a force-control mode required in the standard. The primary differences between the GB/T-16752 and the ASTM C-497 are as follows [28]: (1) the GB/T-16752 calls for stepped loading, where each level of load is kept at the same level for a certain length of time before moving up to the next level. The ASTM C-497 requires loading at a constant rate up to 75% of the specified design strength, after that the rate of loading should be reduced to 1/3 of the maximum uniform rate. (2) The tested load given in the GB/T-16752 is expressed by linear load in Newtons per meter of length (kN/m), while it is measured by strength in newtons per linear meter of pipe per millimeter of diameter (N/mm/mm) in ASTM C-497.
Figure 5 depicts the loading procedures. Before commencing the test, preloading was performed by loading up to 50 kN and then unloading. After three rounds of preloading, the standard loading was carried out. The loading rate was set as 0.01 mm/s. The graded loading was done to make it easier to see and illustrate the cracks. Initially, 25 kN was increased for each step, and the load was held for 1 min for each step, until a crack width of 0.3 mm and a length of at least 30 cm appeared, at which point the matching load was recognized as the D-load. After determining the D-load, a load of around 30 kN per level was applied until failure, with each level held for three minutes. If the crack occurred while the load was being applied, the previous level was used. If the crack occurred while the load was being held, the current level was used.

2.3.2. Displacement Monitoring Method

The crown and invert (as shown in Figure 6) of the pipe are usually the first to crack, where abrupt cracking deformations may affect the orientation of the traditional contact gauge. Therefore, contactless laser displacement meters were used for this measurement. Due to the bottom bearing strips also deform after loading, the vertical radial deformation of the pipe must be obtained by subtracting the displacement of the invert from that of the crown, that is Δ y2 Δ y1. These laser displacement gauges are mounted on a work stand (as shown in Figure 4b).
The horizontal displacement was monitored by a wire displacement meter, which was achieved by setting a pair of G-clamps at the springline to fix the sensor to the pipe wall. The displacement meters were set up as indicated in Figure 6.

2.4. Bearing Capacity Characterization

2.4.1. D-Load, Peak Load and Ultimate Load

The D-load is the design load of a pipe obtained from a three-edge bearing test (TEBT), defined as the load corresponding to a 0.01-inch (0.3 mm) crack [28]. Peak load is defined as the load corresponding to the end of the linear relationship between the load and deformation of pipe, which occurs slightly before the ultimate load, and is denoted as D-peak [32]. The ultimate load, also referred to as Du, is defined as the maximum load that the pipe can withstand, after which the pipe will lose its load carrying capacity.
In a previous study, it was found that the D-load corresponding to a 0.3 mm crack is in good consistency with the load corresponding to the end of the first elastic zone (as shown in Figure 7). Therefore, the D-load, D-peak and Du can all be obtained according to force-deformation curve from a TEBT, or sometimes a force-time curve can also be used if the displacement-controlled loading mode is performed.
Figure 7 and Figure 8 are only illustrations and not a loading result from any one pipe, which is shown here to illustrate the general characteristics of the force-displacement curve for reinforced concrete pipes. As shown in Figure 7, the force–deflection curve obtained from the TEBT test for RCPs can be divided into four stages.
In stage I, the load is transformed into strain potentials of concrete. Concrete plays a predominant role in bearing the load at this stage. Because the distortion of the pipe at this point is relatively small and may be fully recovered if unloaded, it is referred to as the elastic zone. In stage II, as the deformation increases, the pipe begins to crack, and the reinforcement cage of the pipe is engaged in resisting load and progressively replaces the dominating role of concrete, which leads to a decreasing trend in the slope of the curve. Although the reinforcement in some regions with significant bending moments has begun to deform plastically, the whole pipe is still dominated by elastic deformation. Therefore, this stage may be approximated as the quasi-elastic zone. It is also termed as the crack propagation zone because concrete cracking occurs mostly in this stage. In stage III, the bond between the reinforcement and the concrete is ruptured, and the reinforcement located around the maximum bending moment is subjected to the load solely. With increasing load, more and more steel bars yield. After the load reaches a threshold (i.e., Du), the ring deformation rate accelerates, resulting in the rapid reduction in load. During the last phase of unloading, the bars that are still being deformed elastically release potential energy. This causes some of the deformation to recover.
It is worth noting that the above stages are roughly divided according to the dominant features; however, as the RCP structure will be constantly adjusted to the state of force with the deformation, the deformation that occurs in the yielding phase is not completely irrecoverable.

2.4.2. The Failure Energy

The energy consumed to load the pipe to rupture is defined as the failure energy in this study, which serves as a proxy for the toughness of the RCP. A high failure energy indicates that the pipe has a high ability to absorb energy and therefore is tough. It can be obtained from the area of the force–deflection curve before the ultimate load (as shown in Figure 8).

2.4.3. Ring Deflection and Ring Stiffness

Ring deflection is defined as the ratio of change in the vertical diameter to the designed diameter, which is presented for evaluating the ductility of reinforced concrete pipes. It can be calculated by Δ d / d 0 (as shown in Figure 9). The ring stiffness is defined to describe the resistance of the pipe to deflection, which can be calculated based on the ratio of force to deflection, F/ Δ d [33]. In the crack propagation zone, the ring stiffness can still be obtained by F/ Δ d , but it gradually decreases. When experiencing an ultimate condition, the ring stiffness is zero.

3. Results and Discussions

3.1. Loading Behavior

The investigation of the force curves, vertical deformation, and horizontal deformation traits of RCPs throughout their loading process is the main topic of this section. The collected load signal is a fluctuating value as a result of the vibration of the loading machine affected by hydraulic oil pumping, and such a value would seem odd when plotting the force-displacement curve. Therefore, the force and deflection curves were plotted in a single graph here with the loading time as the horizontal coordinate. Given that the loading mode in this paper is displacement control, it is believed that the method for determining the D-Load, peak load (D-peak), and ultimate load (Du) according to the characteristics of the force–displacement curve also applies to the force–time curve.
Figure 10 illustrates the displacement against load as a function of time for a concrete pipe having an internal diameter of 1000 mm. Figure 10a–c show the pipe treated with no wall loss, 15 mm of thinning, and 25 mm of thinning at the crown area, respectively. The elastic zone, crack propagation zone, and ultimate load zone are segregated and distinguished by three colors in accordance with variations in the slopes of force–time curves. As shown in Figure 10a, two inflection points can be identified from the force–time curve of the RCP, whereby the loading behavior of the concrete pipe could be divided into three stages, namely, the elastic zone, crack propagation zone, and yield zone. According to the characteristics of the force evolution curve, the loads corresponding to the 0.3–mm crack, peak state, and ultimate condition are 98.15, 249.68, and 262.20 kN/m, respectively. In the elastic zone of the 1000–mm pipe without wall loss, the vertical displacement increases continuously with increasing loads, while the horizontal displacement hardly changes. After extending the elastic zone, the vertical deformation keeps the original growth trend, and the increasing rate of the horizontal deformation is almost uniform with it. At the ultimate load zone, the deformation in both directions increases rapidly.
The development trend of the force and the displacement for 1000 mm pipes with 15 mm and 25 mm of wall losses (as illustrated in Figure 10b,c, respectively) are similar to the unaltered pipe. The D-load, D-peak, and Du values for the concrete pipe with a 15 mm crown wall loss are 89.56, 190.40, and 198.87 kN/m, respectively, according to the force development curve. Similarly, the same loads are 98.65, 170.03, and 167.74 kN/m for the pipe with a 25 mm crown wall loss. The D-load of a pipe with a 25 mm wall loss is even higher than that of a 15 mm wall loss, which is an unusual phenomenon. This may be because the effect of crown wall losses on the D-load of the pipe is too light to be beyond the error (could be from measurement or product production). The load corresponding to the ultimate condition is sometimes found to be less than the D-peak.
Under the same loading scheme, the concrete pipe with wall loss has a shorter loading period than the one without thinning. However, the pipe thinned by 15 mm is shorter than the elastic period of the pipe thinned by 25 mm, which shows that the influence of wall loss on the elastic zone of a concrete pipe may be no more than the inaccuracies induced by the testing procedure or specimen preparation. It is also observed that the duration of the crack propagation zone is reduced with the wall losses, which reveals that the effect of crown wall loss on concrete pipe performance is mainly reflected in the inelastic deformation stages.
Figure 11 shows the force and displacement evolution curves of 1500–mm concrete pipes with different wall losses. The growth trend of force and displacement for each pipe still follows the pattern of 1000–mm pipes. For the untinned 1500–mm pipe, the loads corresponding to 0.3–mm crack, peak state, and ultimate state are identified as 96.26, 212.83, and 224.36 kN/m, respectively. For the 1500–mm pipe with 15–mm wall loss, they are 98.91, 173.78, and 186.38 kN/m, respectively. For the 1500–mm pipe with 25–mm wall loss, they are 97.94, 215.59, and 179.12 kN/m, respectively. When figures in Figure 11a–c are compared, it is revealed that the loss of crown wall has a less obvious influence on the testing time required for failure of 1500–mm pipes. Furthermore, the pipe with a 25–mm wall loss seems to be more tolerant to loading than the pipe with a 15 mm–wall loss. Such results do not match what is reasonably expected, this may be attributed to the error arising from the discrepancy caused by the pipe production or experimental control.
Figure 12 depicts the development of force and displacement vs. time for 2000–mm concrete pipes. The growth tendency of curves for each pipe continues to follow the previously described pattern. As a result, the loads for D-load, D-peak, and Du for untreated 2000 mm pipe are determined as 100.37, 230.17, and 249.98 kN/m, respectively. Similarly, the D-load, D-peak, and Du for 2000–mm pipe with 15–mm wall loss are 106.99, 148.54, and 137.29 kN/m, respectively, and that for 2000–mm pipe with 25–mm wall loss are 89.28, 125.29, and 129.43 kN/m, respectively. It can be seen from figures a, b, and c in Figure 12, the thinning of the crown wall greatly shortens the whole damage process for RCPs with an inner diameter of 2000 mm, which occurs mostly in the crack propagation zone.

3.2. Bearing Capacity

3.2.1. Comparison of the D-Load, Peak Load and Ultimate Load

Figure 13 compares D-load, D-peak, and Du for three sizes of concrete pipes with varying wall losses, whereby the effect of crown wall loss on bearing capacity of reinforced concrete pipe (RCP) is analyzed. The horizontal coordinate in Figure 13a indicates tested pipes, which are designated according to the diameter-wall loss rule for each pipe, and the bearing capacity indices, including D-load, peak load, and ultimate load, are represented by symbols. Figure 13b depicts the rate of change of these indices, which are determined by dividing the deviation of measured loads across pipes with and without wall loss by the tested load of the unaltered pipe. The colored symbol represents the change rate of bearing indices. A positive value shows that the bearing capacity of a concrete pipe increases as the crown wall loss; a negative value indicates that such a bearing index falls as the crown wall thins.
There was no significant change in D-load after 15−mm and 25−mm wall thinning for 1000–mm concrete pipes, as shown in Figure 13a, but both D-peak and Du exhibited a substantial decay, showing a non-linear progressive decreasing tendency. Like the 1000–mm pipe, the load-bearing capacity of 2000–mm pipe changes in the same way as the thickness of the crown wall thins. This also demonstrates the previous explanation that crown concrete corrosion has a slight influence on the first elastic zone of RCPs but a significant effect on the second elastic zone (i.e., crack propagation zone). The D-load in 1500–mm RCPs hardly changed after 15–mm and 25–mm pipe wall losses. However, the 1500–mm pipe with a 25–mm concrete loss at the crown wall even has a higher peak and ultimate load than that with a 15–mm loss. Such a result might be attributed to errors arising from the pipe manufacturing or test control, but somehow which can indicate that the loading behavior of 1500–mm RCP is not significantly affected by the corrosion of concrete in the crown.
As shown in Figure 13b, the change rate of D-load swings above and below the zero-scale line and seldom surpasses ± 0.1. This demonstrates that concrete loss at pipe crown has less influence on the D-load of the concrete pipe, which may be explained by the fact that the crown concrete of the concrete pipe is mostly subjected to tensile strain during the elastic zone. The Du of the 1000–mm and 2000–mm concrete pipes decreases as the wall loss increases. Regarding the 2000–mm pipe, the ultimate load reduction corresponding to 15–mm and 25–mm wall losses are approximately 40% and 50%, respectively. The loss rate of Du for 1000–mm concrete pipes after wall losses of 15 mm and 25 mm is 24% and 36%, respectively. The 25–mm wall loss appears to have less influence on the ultimate load and peak load of the 1500–mm pipe, but the 15–mm wall loss causes them to drop more, even though the attenuation rate does not surpass 20%. This shows that concrete corrosion at the crown has a larger effect on the ultimate load bearing capacity of the 2000 mm pipe than the 1000–mm pipe, but it has a relatively low effect on the 1500–mm pipes. It might be explained by the differential in reaction to wall loss for different sizes of concrete pipes, which are more vulnerable for large and small diameter RCPs and less susceptible for medium-sized RCPs. Of course, it might also be attributable to the discrete specimens utilized in the test or errors caused by the tests performed.

3.2.2. Ring Stiffness

Ring stiffness is defined as the slope of the force-deflection curve in the elastic phase. In this paper, it is calculated to evaluate the effect of wall loss on ring stiffness by comparing the slope of concrete pipe with wall loss or not. According to the study above, crown wall loss has less impact on the mechanical behavior of concrete pipes in the elastic zone I. To obtain the mean of ring stiffness, this section takes the derivatives of the force-deflection curves in both the elastic zone and quasi-elastic zone.
The mean value of the ring stiffness for each pipe and its 95% confidence interval (CI) are calculated for comparative analysis of the effect of crown corrosion on the ring stiffness of pipes. The 95 percent confidence interval (CI) of the mean is the range found from the same sample with either an upper or lower number [34]. It is constructed here to show how much difference there is in ring stiffness between untreated pipes and wall-thinned pipes. The width of CI is related to the size of the sample and the degree of variation of individuals in the sample. The same number of samples is obtained in this paper, so it can well reflect the degree of dispersion between samples.
This paper calculated the mean ring stiffness and its 95% CI using the OriginLab 2020. As shown in Figure 14, these values for different sizes of pipes are distinguished by different background colors. As indicated in the picture, the ring stiffness of the untreated concrete pipe is larger than the wall-thinned pipe for all pipe sizes, implying that crown corrosion reduces the ring stiffness of the concrete pipe. The 15–mm and 25–mm wall losses generate an overlap in CI for both 1000–mm and 1500–mm pipes, showing that such a variation in wall loss has no significant effect on ring stiffness for these two types of RCPs. For 2000–mm pipes, however, wall loss is linked to ring stiffness loss in a positive way, and there is no overlap in CI for different treated pipes. This shows that crown corrosion has a huge negative effect on 2000–mm RCP.

3.2.3. Failure Energy

The effect of wall loss on pipe toughness could be assessed by comparing the magnitude of the failure energy of those pipes with and without wall loss. The histogram in Figure 15 depicts the failure energy of these tested pipes, which represents the energy required per unit length of the pipe ring. As shown in the diagram, the failure energy of the RCP is positively connected with the diameter of the concrete pipe. Untreated pipes have a failure energy rating that corresponds to their diameter ranking of 2000 > 1500 > 1000 mm. The failure energy of all pipes is reduced after 15−mm and 25−mm wall losses, and the greater the wall loss, the more noticeable the reduction, indicating that crown corrosion of RCP has a significant effect on its toughness.

4. Conclusions

Microbiologically induced concrete corrosion (MICC) is the most common structural defect in sewer systems. To understand how crown concrete corrosion of sewer pipes affects its structural carrying capacity, this study presets wall losses in the crown of 1000−mm, 1500−mm, and 2000−mm reinforced concrete pipes (RCPs) to mimic MICC. Then, they were put through a three-edge bearing test (TEBT) to compare the bearing capacity before and after wall losses in terms of D-load, peak load, ultimate load, ring deflection, ring stiffness, and failure energy. The main conclusions of this work are as follows:
(1) The loss of the crown wall has less significant effect on the RCPs’ behavior in the elastic zone I, but it shortens the crack expansion stage by a lot. This can be explained by that the concrete in the crown is mainly subjected to tensile stresses in the elastic phase, so its loss has no significant effect on the pipe bearing capacity.
(2) Crown wall losses have less effect on the D-load of all the RCPs, which is also attributed to the crown concrete mainly bearing tensile strain. Nevertheless, the peak load and ultimate load of these RCPs were positively correlated with crown corrosion thickness. Among them, the 2000−mm RCP was the most affected, and its ultimate load dropped by 40% and 50%, respectively, when the crown corrosion depth was 15 mm and 25 mm. The 1000−mm RCP came in second, with a 24% drop in ultimate load after 15 mm of wall loss and a 36% drop after 25 mm of wall loss. After wall loss, the ultimate load on a 1500 mm RCP goes down by less than 20%, and there is no clear correlation between its wall losses and ultimate load.
(3) For a comparative analysis of how crown corrosion affects the ring stiffness of pipes, the mean value of each pipe’s ring stiffness and its 95% confidence interval (CI) are calculated. The results show that crown concrete corrosion hurts the ring stiffness of RCPs, and the 2000 mm RCP is affected the most.
(4) The failure energy of an RCP is defined as the integral area of the force-displacement curve before its ultimate state, which shows how much energy is needed to damage it. It is used as a characterization of the toughness of RCPs in this study. The results show that crown concrete corrosion significantly reduces the toughness of RCPs.
This study provides limited test data, and more experimental and finite element simulation work that aims at linking the material corrosion of sewer pipes with their structural bearing capacity should be conducted in the future. According to the correlation between corrosion losses and structural bearing capacity, the remaining bearing capacity of the in-service sewer could be predicted based on the corrosion depth detected by a pipe penetrating radar [2] or predicted by a corrosion prediction model [35,36,37]. Such results can be used for condition assessment, life prediction, and risk evaluation of sewerage, further suggesting the manager make right decisions on inspection and rehabilitation.

Author Contributions

Y.W.: Conceptualization, Methodology, Visualization, Data curation, Writing—Original draft preparation, Revieing and editing. P.L. and H.L.: testing works. W.W. and Y.G.: Validation. L.W.: Supervision and Revision. All authors have read and agreed to the published version of the manuscript.

Funding

This research is part of the project on Service Safety Evaluation of Urban Drainage Pipes, which is funded by the Beijing Major Science and Technology Project, No. Z191100008019002. It is also funded by the State Key Laboratory of Silicate Materials for Architectures (Wuhan University of Technology), No. SYSJJ2022-05.

Data Availability Statement

All data supporting the findings of this study can be obtained from the corresponding author.

Acknowledgments

We appreciate the place and equipment provided by the National Center for Materials Service Safety at the University of Science and Technology in Beijing, China.

Conflicts of Interest

The authors declare that they do not have any commercial or associative interest that represents a conflict of interest in connection with the work submitted.

References

  1. Parande, A.K.; Ramsamy, P.L.; Ethirajan, S.; Rao, C.R.K.; Palanisamy, N. Deterioration of reinforced concrete in sewer environments. In Proceedings of the Institution of Civil Engineers-Municipal Engineer; Thomas Telford Ltd.: London, UK, 2006. [Google Scholar] [CrossRef]
  2. Wang, Y.; Li, P.; Li, J. The monitoring approaches and non-destructive testing technologies for sewer pipelines. Water Sci. Technol. 2022, 85, 3107–3121. [Google Scholar] [CrossRef]
  3. Wu, M.; Wang, T.; Wu, K.; Kan, L. Microbiologically induced corrosion of concrete in sewer structures: A review of the mechanisms and phenomena. Constr. Build. Mater. 2020, 239, 117813. [Google Scholar] [CrossRef]
  4. Olmstead, W.; Hamlin, H. Converting portions of the Los Angeles outfall sewer into a septic tank. Eng. News 1900, 44, 317–318. [Google Scholar]
  5. Parker, C. The Corrosion of Concrete: 1. The Isolation of A Species of Bacterium Associated with The Corrosion of Concrete Exposed to Atmospheres Containing Hydrogen Sulphide. Aust. J. Exp. Biol. Med. Sci. 1945, 23, 81–90. [Google Scholar] [CrossRef]
  6. Parker, C. The function of Thiobacillus concretivorus (nov. spec.) in the corrosion of concrete exposed to atmospheres containing hydrogen sulphide. Aust. J. Exp. Biol. Med. Sci. 1945, 23, 91–98. [Google Scholar] [CrossRef]
  7. De Belie, N.; Monteny, J.; Beeldens, A.; Vincke, E.; Van Gemert, D.; Verstraete, W. Experimental research and prediction of the effect of chemical and biogenic sulfuric acid on different types of commercially produced concrete sewer pipes. Cem. Concr. Res. 2004, 34, 2223–2236. [Google Scholar] [CrossRef]
  8. Ehrich, S.; Helard, L.; Letourneux, R.; Willocq, J.; Bock, E. Biogenic and Chemical Sulfuric Acid Corrosion of Mortars. J. Mater. Civ. Eng. 1999, 11, 340–344. [Google Scholar] [CrossRef]
  9. Sand, W. Importance of Hydrogen Sulfide, Thiosulfate, and Methylmercaptan for Growth of Thiobacilli during Simulation of Concrete Corrosion. Appl. Environ. Microbiol. 1987, 53, 1645–1648. [Google Scholar] [CrossRef] [Green Version]
  10. Mori, T.; Nonaka, T.; Tazaki, K.; Koga, M.; Hikosaka, Y.; Noda, S. Interactions of nutrients, moisture and pH on microbial corrosion of concrete sewer pipes. Water Res. 1992, 26, 29–37. [Google Scholar] [CrossRef]
  11. Wells, T.; Melchers, R. An observation-based model for corrosion of concrete sewers under aggressive conditions. Cem. Concr. Res. 2014, 61, 1–10. [Google Scholar] [CrossRef]
  12. O’Connell, M.; McNally, C.; Richardson, M.G. Biochemical attack on concrete in wastewater applications: A state of the art review. Cem. Concr. Compos. 2010, 32, 479–485. [Google Scholar] [CrossRef]
  13. Mori, T.; Koga, M.; Hikosaka, Y.; Nonaka, T.; Mishina, F.; Sakai, Y.; Koizumi, J.-I. Microbial Corrosion of Concrete Sewer Pipes, H2S Production from Sediments and Determination of Corrosion Rate. Water Sci. Technol. 1991, 23, 1275–1282. [Google Scholar] [CrossRef]
  14. Zuo, Z.; Ren, D.; Qiao, L.; Li, H.; Huang, X.; Liu, Y. Rapid dynamic quantification of sulfide generation flux in spatially heterogeneous sediments of gravity sewers. Water Res. 2021, 203, 117494. [Google Scholar] [CrossRef] [PubMed]
  15. Grengg, C.; Mittermayr, F.; Ukrainczyk, N.; Koraimann, G.; Kienesberger, S.; Dietzel, M. Advances in concrete materials for sewer systems affected by microbial induced concrete corrosion: A review. Water Res. 2018, 134, 341–352. [Google Scholar] [CrossRef]
  16. Islander, R.L.; Devinny, J.S.; Mansfeld, F.; Postyn, A.; Shih, H. Microbial Ecology of Crown Corrosion in Sewers. J. Environ. Eng. 1991, 117, 751–770. [Google Scholar] [CrossRef]
  17. Wang, Y.; Li, P.; Wang, L. The Testing Methods and Prediction Models for Concrete Corrosion in Sewer Pipelines: A State-of-the-Art Review. J. Test. Eval. 2022, 50, 20210702. [Google Scholar] [CrossRef]
  18. Kiliswa, M.W.; Scrivener, K.L.; Alexander, M.G. The corrosion rate and microstructure of Portland cement and calcium aluminate cement-based concrete mixtures in outfall sewers: A comparative study. Cem. Concr. Res. 2019, 124, 105818. [Google Scholar] [CrossRef]
  19. Kong, L.; Lu, H.; Fu, S.; Zhang, G. Effect of corrosion layer on the deterioration of concrete in gravity sewers. Constr. Build. Mater. 2021, 272, 121663. [Google Scholar] [CrossRef]
  20. Fang, H.; Yang, K.; Du, X.; Li, B.; Zhang, X.; Tan, P. Experimental and numerical study on mechanical analysis of buried corroded concrete pipes under static traffic loads. Appl. Sci. 2019, 9, 5002. [Google Scholar] [CrossRef] [Green Version]
  21. Li, B.; Fang, H.; He, H.; Yang, K.; Chen, C.; Wang, F. Numerical simulation and full-scale test on dynamic response of corroded concrete pipelines under Multi-field coupling. Constr. Build. Mater. 2019, 200, 368–386. [Google Scholar] [CrossRef]
  22. Fang, H.; Yang, K.; Du, X.; Li, B.; Zhang, X.; Tan, P. Experimental study on the mechanical properties of corroded concrete pipes subjected to diametral compression. Constr. Build. Mater. 2020, 261, 120576. [Google Scholar] [CrossRef]
  23. Zamanian, S.; Hur, J.; Shafieezadeh, A. A high-fidelity computational investigation of buried concrete sewer pipes exposed to truckloads and corrosion deterioration. Eng. Struct. 2020, 221, 111043. [Google Scholar] [CrossRef]
  24. Scheperboer, I.C.; Luimes, R.A.; Suiker, A.S.J.; Bosco, E.; Clemens, F.H.L.R. Experimental-numerical study on the structural failure of concrete sewer pipes. Tunn. Undergr. Space Technol. 2021, 116, 104075. [Google Scholar] [CrossRef]
  25. Luimes, R.A.; Scheperboer, I.C.; Suiker, A.S.J.; Bosco, E.; Clemens, F.H.L.R. Effect of biochemical attack on the mechanical performance of used concrete sewer pipes. Constr. Build. Mater. 2022, 346, 128390. [Google Scholar] [CrossRef]
  26. Lay, G.R.; Brachman, R.W.I. Full-scale physical testing of a buried reinforced concrete pipe under axle load. Can. Geotech. J. 2014, 51, 394–408. [Google Scholar] [CrossRef]
  27. Xu, M.; Shen, D.; Rakitin, B. The longitudinal response of buried large-diameter reinforced concrete pipeline with gasketed bell-and-spigot joints subjected to traffic loading. Tunn. Undergr. Space Technol. 2017, 64, 117–132. [Google Scholar] [CrossRef]
  28. ASTM C497-20e1; Standard Test Methods for Concrete Pipe, Concrete Box Sections, Manhole Sections, or Tile. ASTM International: West Conshohocken, PA, USA, 2020. [CrossRef]
  29. Wong, L.S.; Nehdi, M.L. Critical Analysis of International Precast Concrete Pipe Standards. Infrastructures 2018, 3, 18. [Google Scholar] [CrossRef] [Green Version]
  30. Ablin, R.L.; Kinshella, P. Dude, Where’s My Pipe-Accelerated Corrosion Rate Threatens Phoenix Sewers. In Proceedings of the Pipeline Division Specialty Congress 2004, San Diego, CA, USA, 1–4 August 2004. [Google Scholar] [CrossRef]
  31. GB/T-16752; Test Methods of Concrete and Reinforced Concrete Sewer Pipes. General Administration of Quality Supervision. Inspection and Quarantine of the People’s Republic of China: Beijing, China, 2017.
  32. Younis, A.-A.; Ramadan, A.S.; Wong, L.S.; Nehdi, M.L. New rational test for reinforced-concrete pipe eliminating subjective crack-width criteria. Structures 2020, 28, 2507–2522. [Google Scholar] [CrossRef]
  33. Watkins, R.K. Structural Mechanics of Buried Pipes; CRC Press: Boca, Raton, FL, USA, 1999. [Google Scholar] [CrossRef]
  34. O’Brien, S.F.; Yi, Q.L. How do I interpret a confidence interval? Transfusion 2016, 56, 1680–1683. [Google Scholar] [CrossRef]
  35. Rooyackers, F.A.M.; Bosco, E.; Suiker, A.S.J.; Clemens, F.H.L.R. A chemo-mechanical model for biogenic sulphide corrosion of concrete. Cem. Concr. Res. 2022, 160, 106809. [Google Scholar] [CrossRef]
  36. Jiang, G.; Keller, J.; Bond, P.L.; Yuan, Z. Predicting concrete corrosion of sewers using artificial neural network. Water Res. 2016, 92, 52–60. [Google Scholar] [CrossRef] [PubMed] [Green Version]
  37. Wang, Y.; Li, P.; Guo, Y.; Yang, H.; Ye, Z.; Wang, L. Predicting the Microbiologically Induced Concrete Corrosion in Sewer Based on XGBoost Algorithm. Case Stud. Constr. Mat. 2022, 17, e01649. [Google Scholar] [CrossRef]
Figure 1. Sulfur cycling procedures in wastewater systems inhabited by microbes.
Buildings 12 01996 g001
Figure 2. (a,b) show typical backscattered electron micrographs of concrete containing 16 percent and 23 percent Potland cement that was exposed to biogenic H2SO4 in a live well sewer for 120 months, respectively. (from Kiliswa et al. [18]).
Buildings 12 01996 g002
Figure 3. A prefabricated RCP with simulated uniform corrosion defects. (a). Schematic diagram of section layouts during casting. (b). Photograph of a manufactured pipe with wall losses.
Buildings 12 01996 g003
Figure 4. Three-edge bearing test system built in the NCMS. (a). Elevation schematic of TEBT; (b). Physical test set up of TEBT.
Buildings 12 01996 g004
Figure 5. Process flow diagram for the loading control.
Buildings 12 01996 g005
Figure 6. Schematic of the laser displacement measurement installation position.
Buildings 12 01996 g006
Figure 7. Identification of D-load, D-peak and Du from a force-deflection curve of an RCP.
Buildings 12 01996 g007
Figure 8. Calculating failure energy according to a force-deflection curve of an RCP.
Buildings 12 01996 g008
Figure 9. Schematic diagram of ring deflection of an RCP.
Buildings 12 01996 g009
Figure 10. Evolution of force and displacement of a concrete pipe with inner diameter of 1000 mm when performing a three-edge bearing test, where (ac) represents the pipe without wall loss, with 15-mm, and with 25 mm wall loss, respectively.
Buildings 12 01996 g010
Figure 11. Evolution of force and displacement of a concrete pipe with inner diameter of 1500 mm when performing a three-edge bearing test, where (ac) represents the pipe without wall loss, with 15-mm, and with 25–mm wall loss, respectively.
Buildings 12 01996 g011
Figure 12. Evolution of force and displacement of 2000–mm concrete pipes when performing a three-edge bearing test, where (ac) represent the pipe without wall loss, with 15–mm, and with 25–mm wall loss, respectively.
Buildings 12 01996 g012
Figure 13. Load-bearing capacity of concrete pipes with different diameters and wall losses, where (a) shows the D-load, peak load, and ultimate load of each testing pipe, (b) shows the rate of change in load carrying capacity for each diameter of pipe after a wall loss of 15 and 25 mm in the crown.
Buildings 12 01996 g013
Figure 14. 95% CI for the mean of ring stiffness for concrete pipes.
Buildings 12 01996 g014
Figure 15. Comparison of failure energy of RCPs with 15-mm, 25-mm, and without wall losses.
Buildings 12 01996 g015
Table 1. Specifications of the reinforced concrete pipes in this study.
Inner Diameter (mm)Wall Loss (mm)Wall Thickness (mm)Effective Length (mm)Concrete Cover
(mm)
Steel Cage (mm)
Diameter of Longitudinal BarsDiameter of Circumferential BarsNumbers of Longitudinal BarsSpace of Circumferential Bars
10000/15/2514030003087966.2
1500165861841.6
2000210861849.5
Publisher’s Note: MDPI stays neutral with regard to jurisdictional claims in published maps and institutional affiliations.

