
Experimental Study of Frame-Supported Shear Wall Structure of High-Rise Buildings with Transfer Slab in Metro Depot
Abstract
:1. Introduction
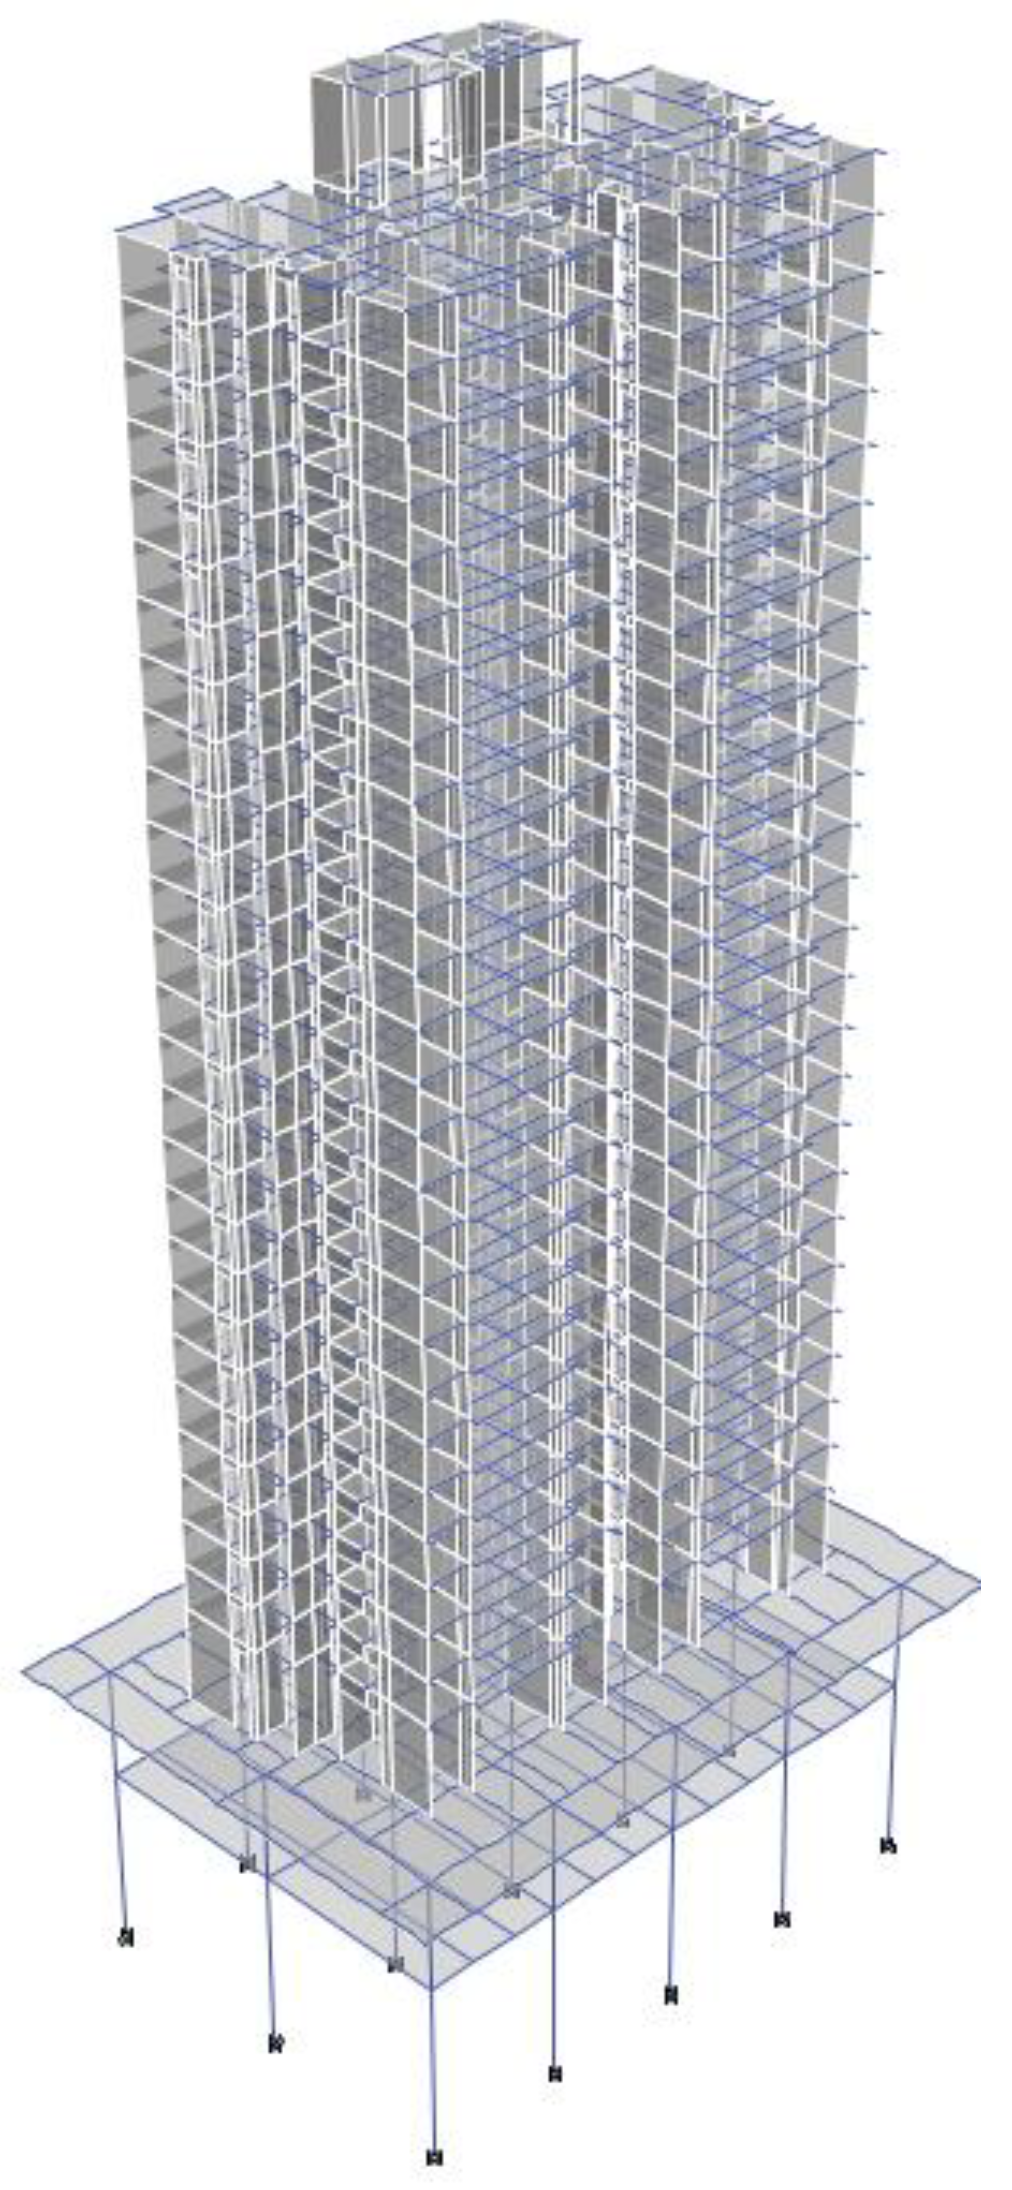
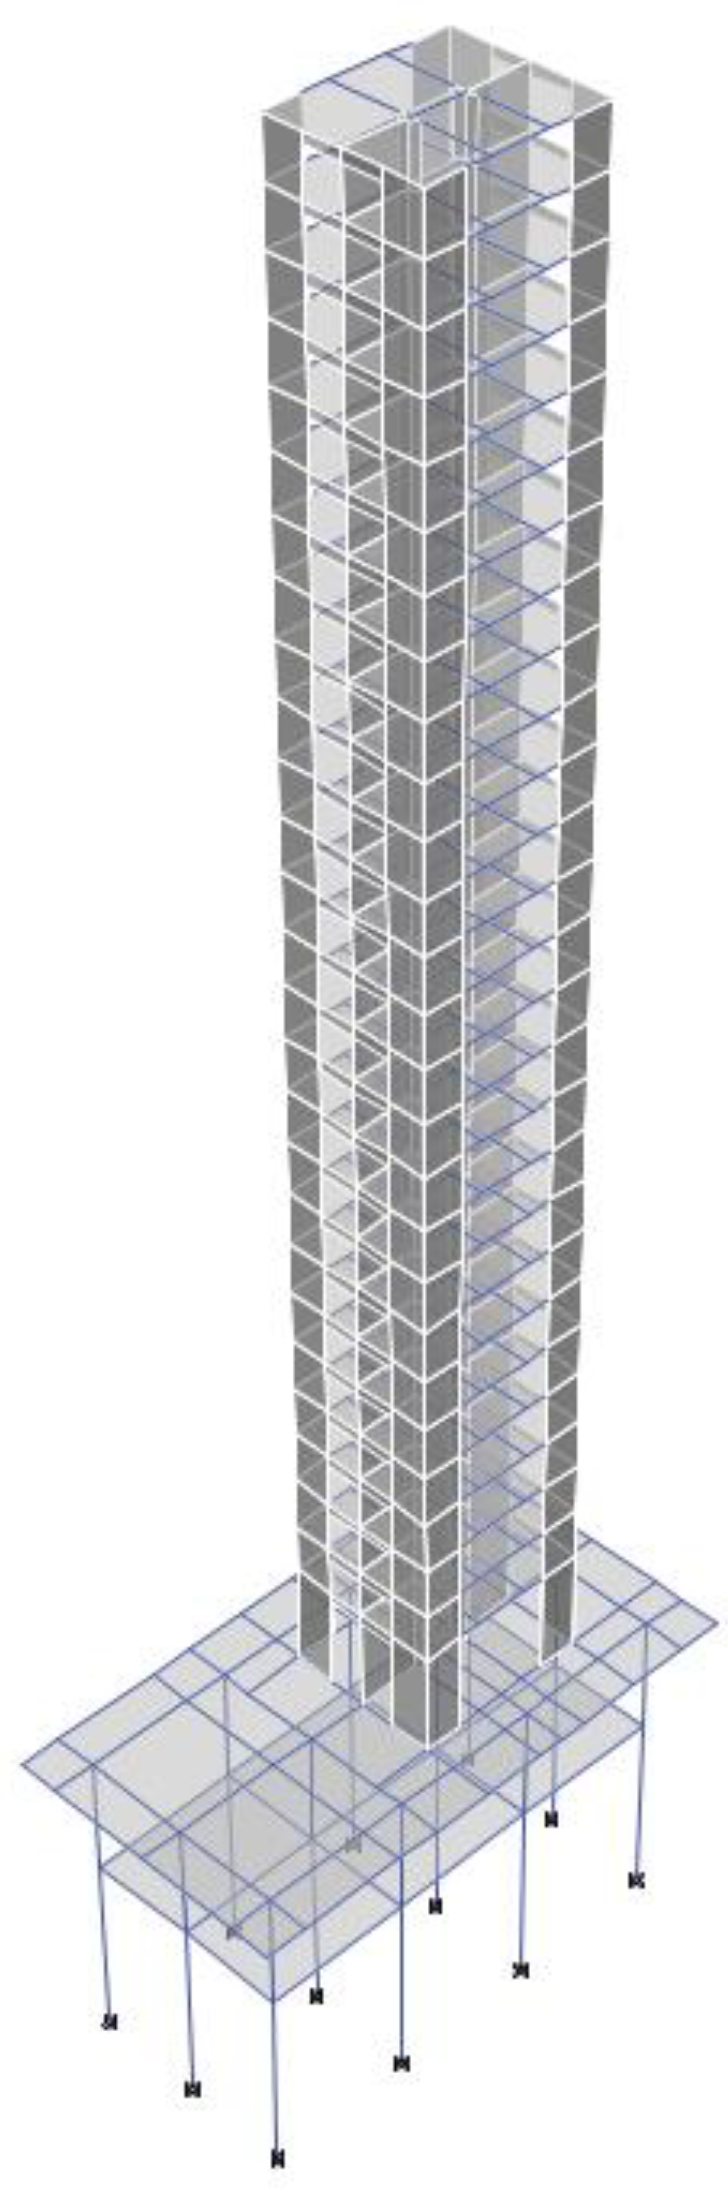
2. Test Overview
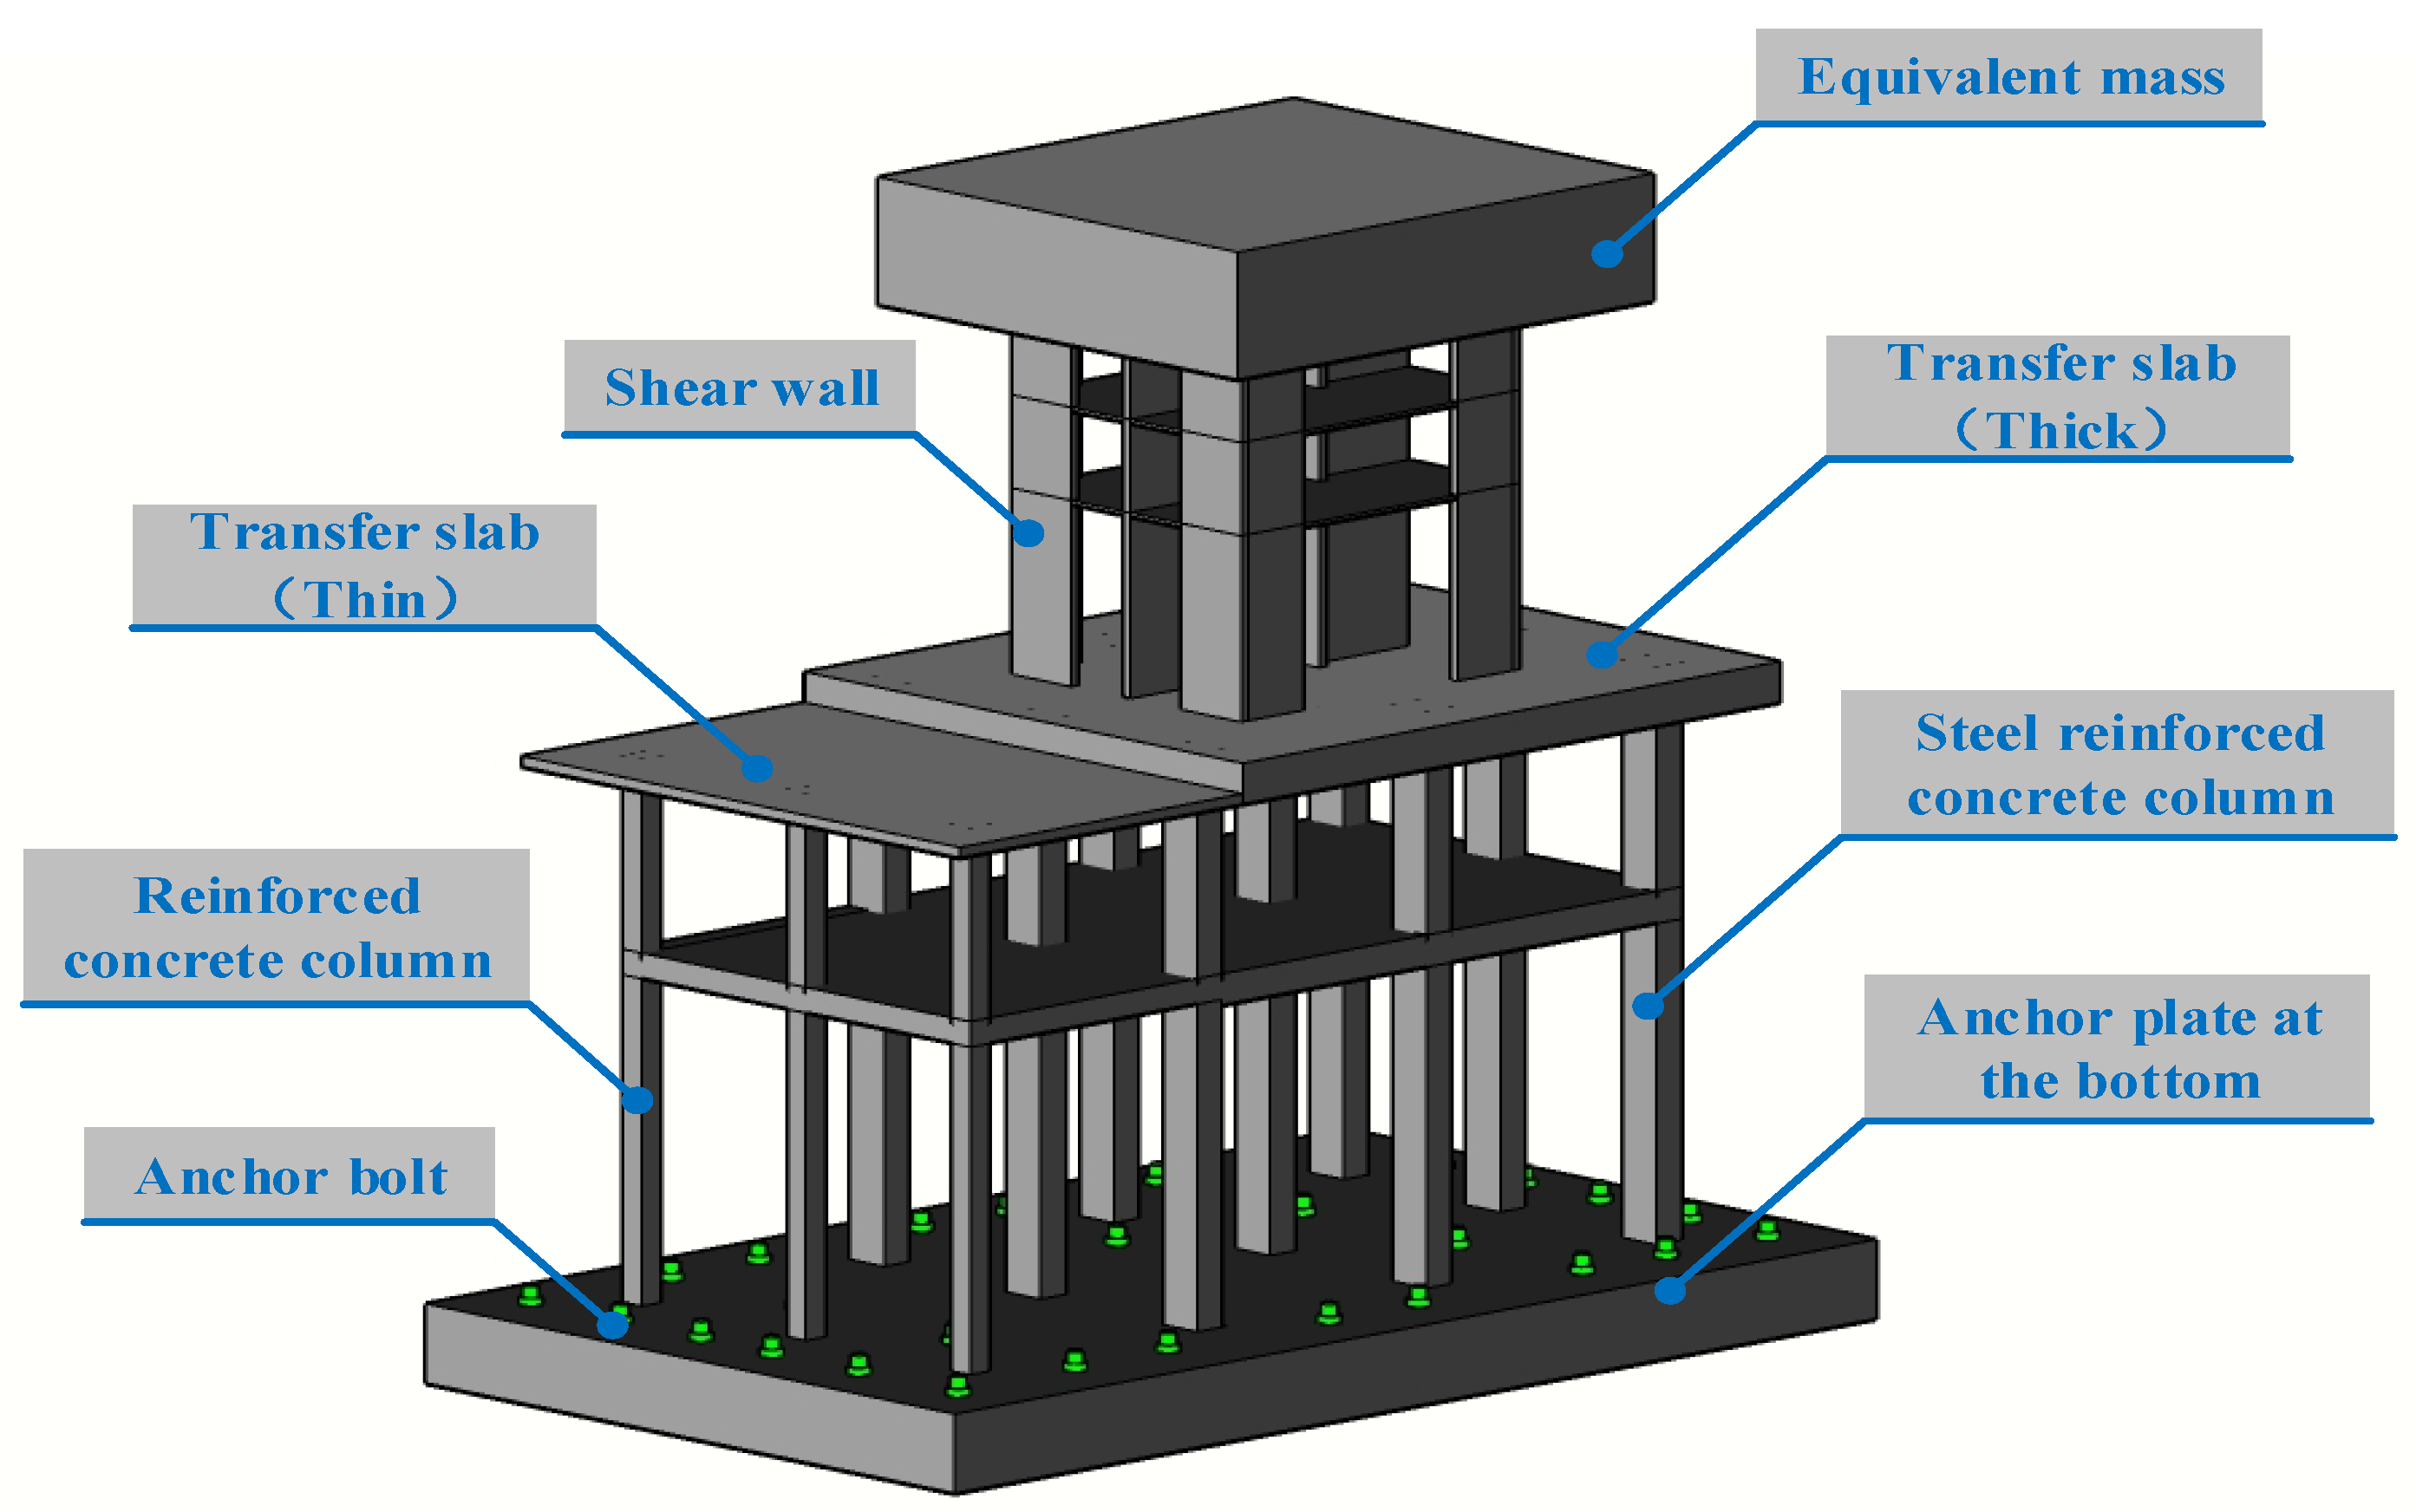
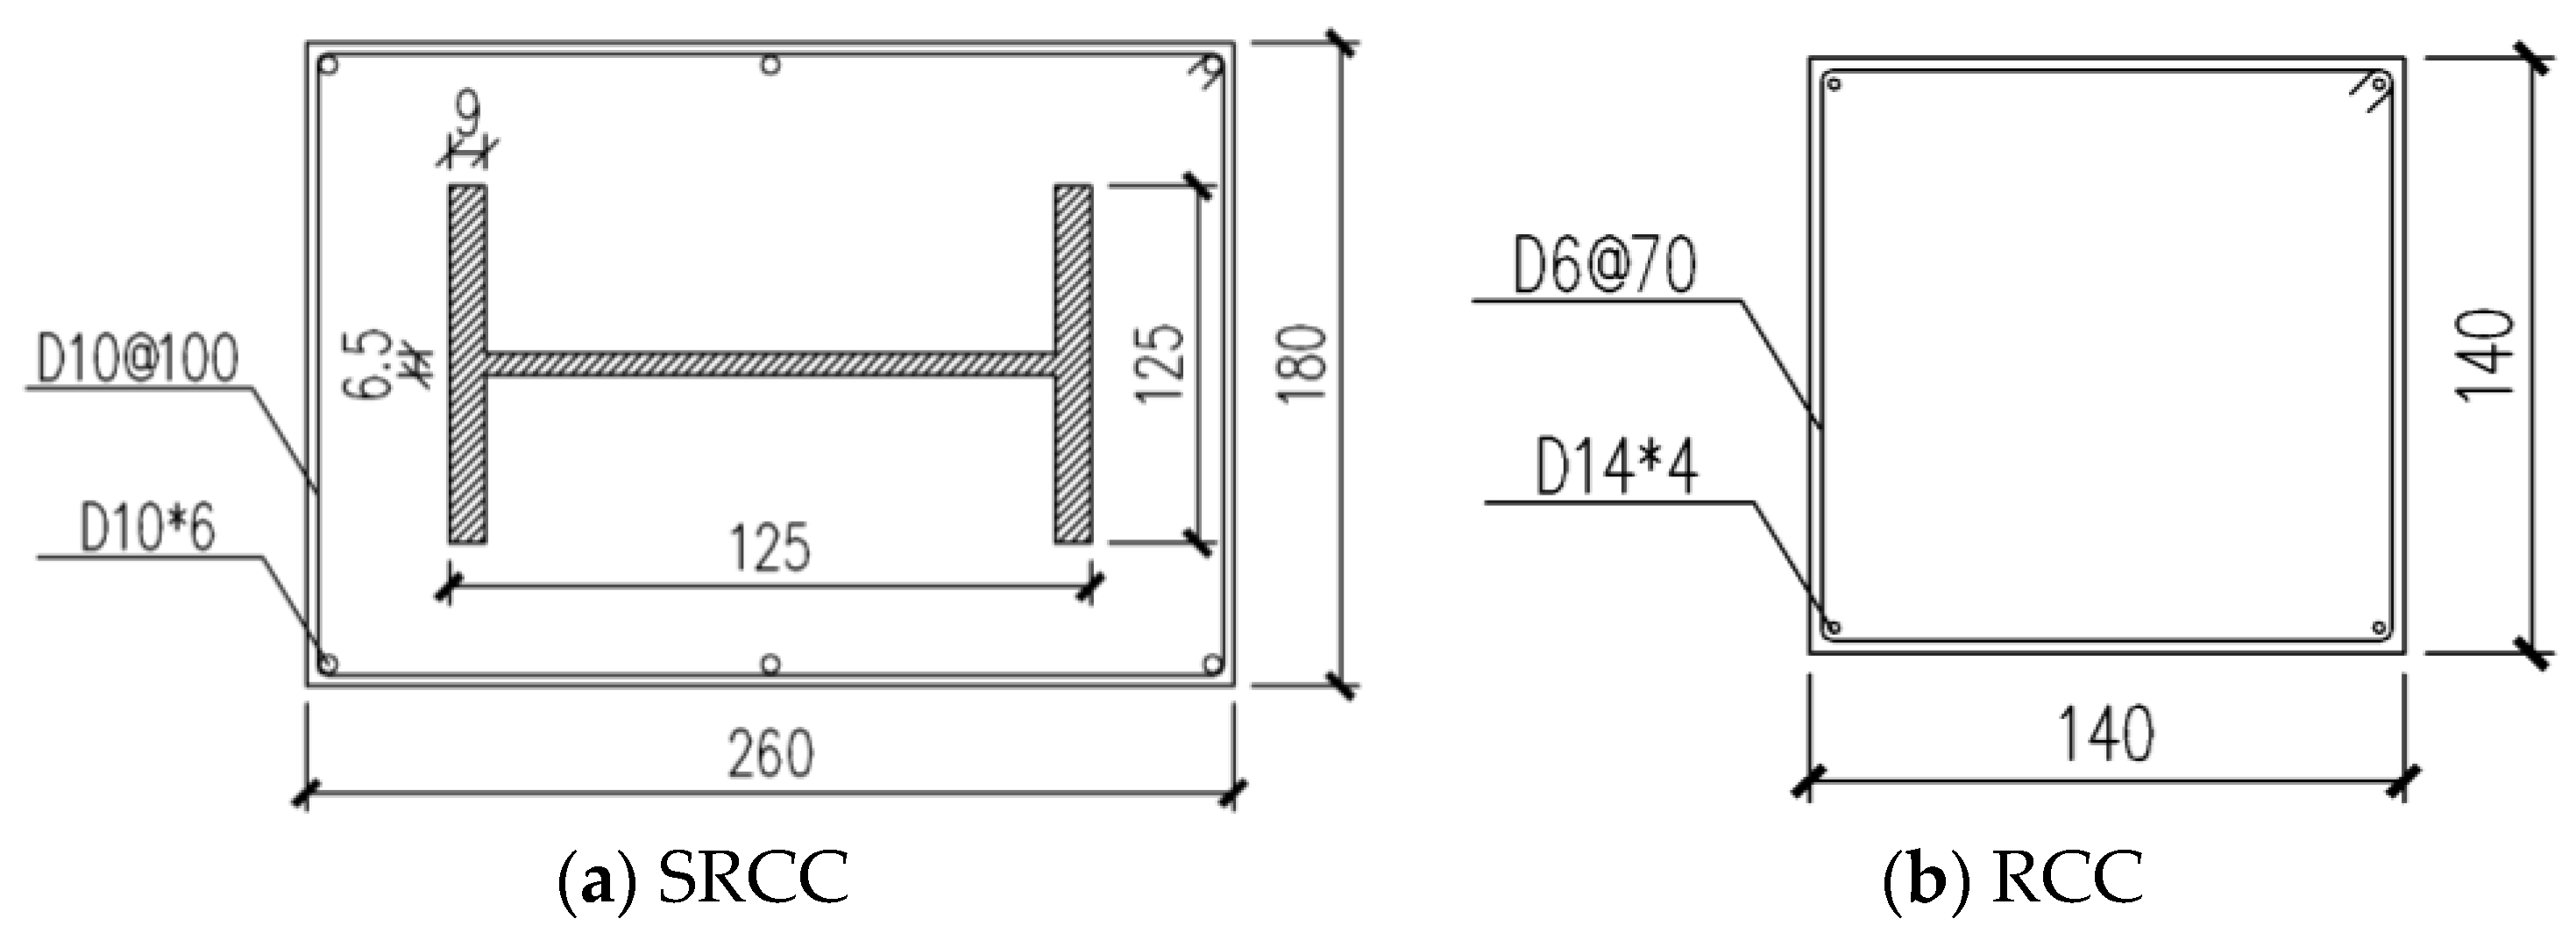
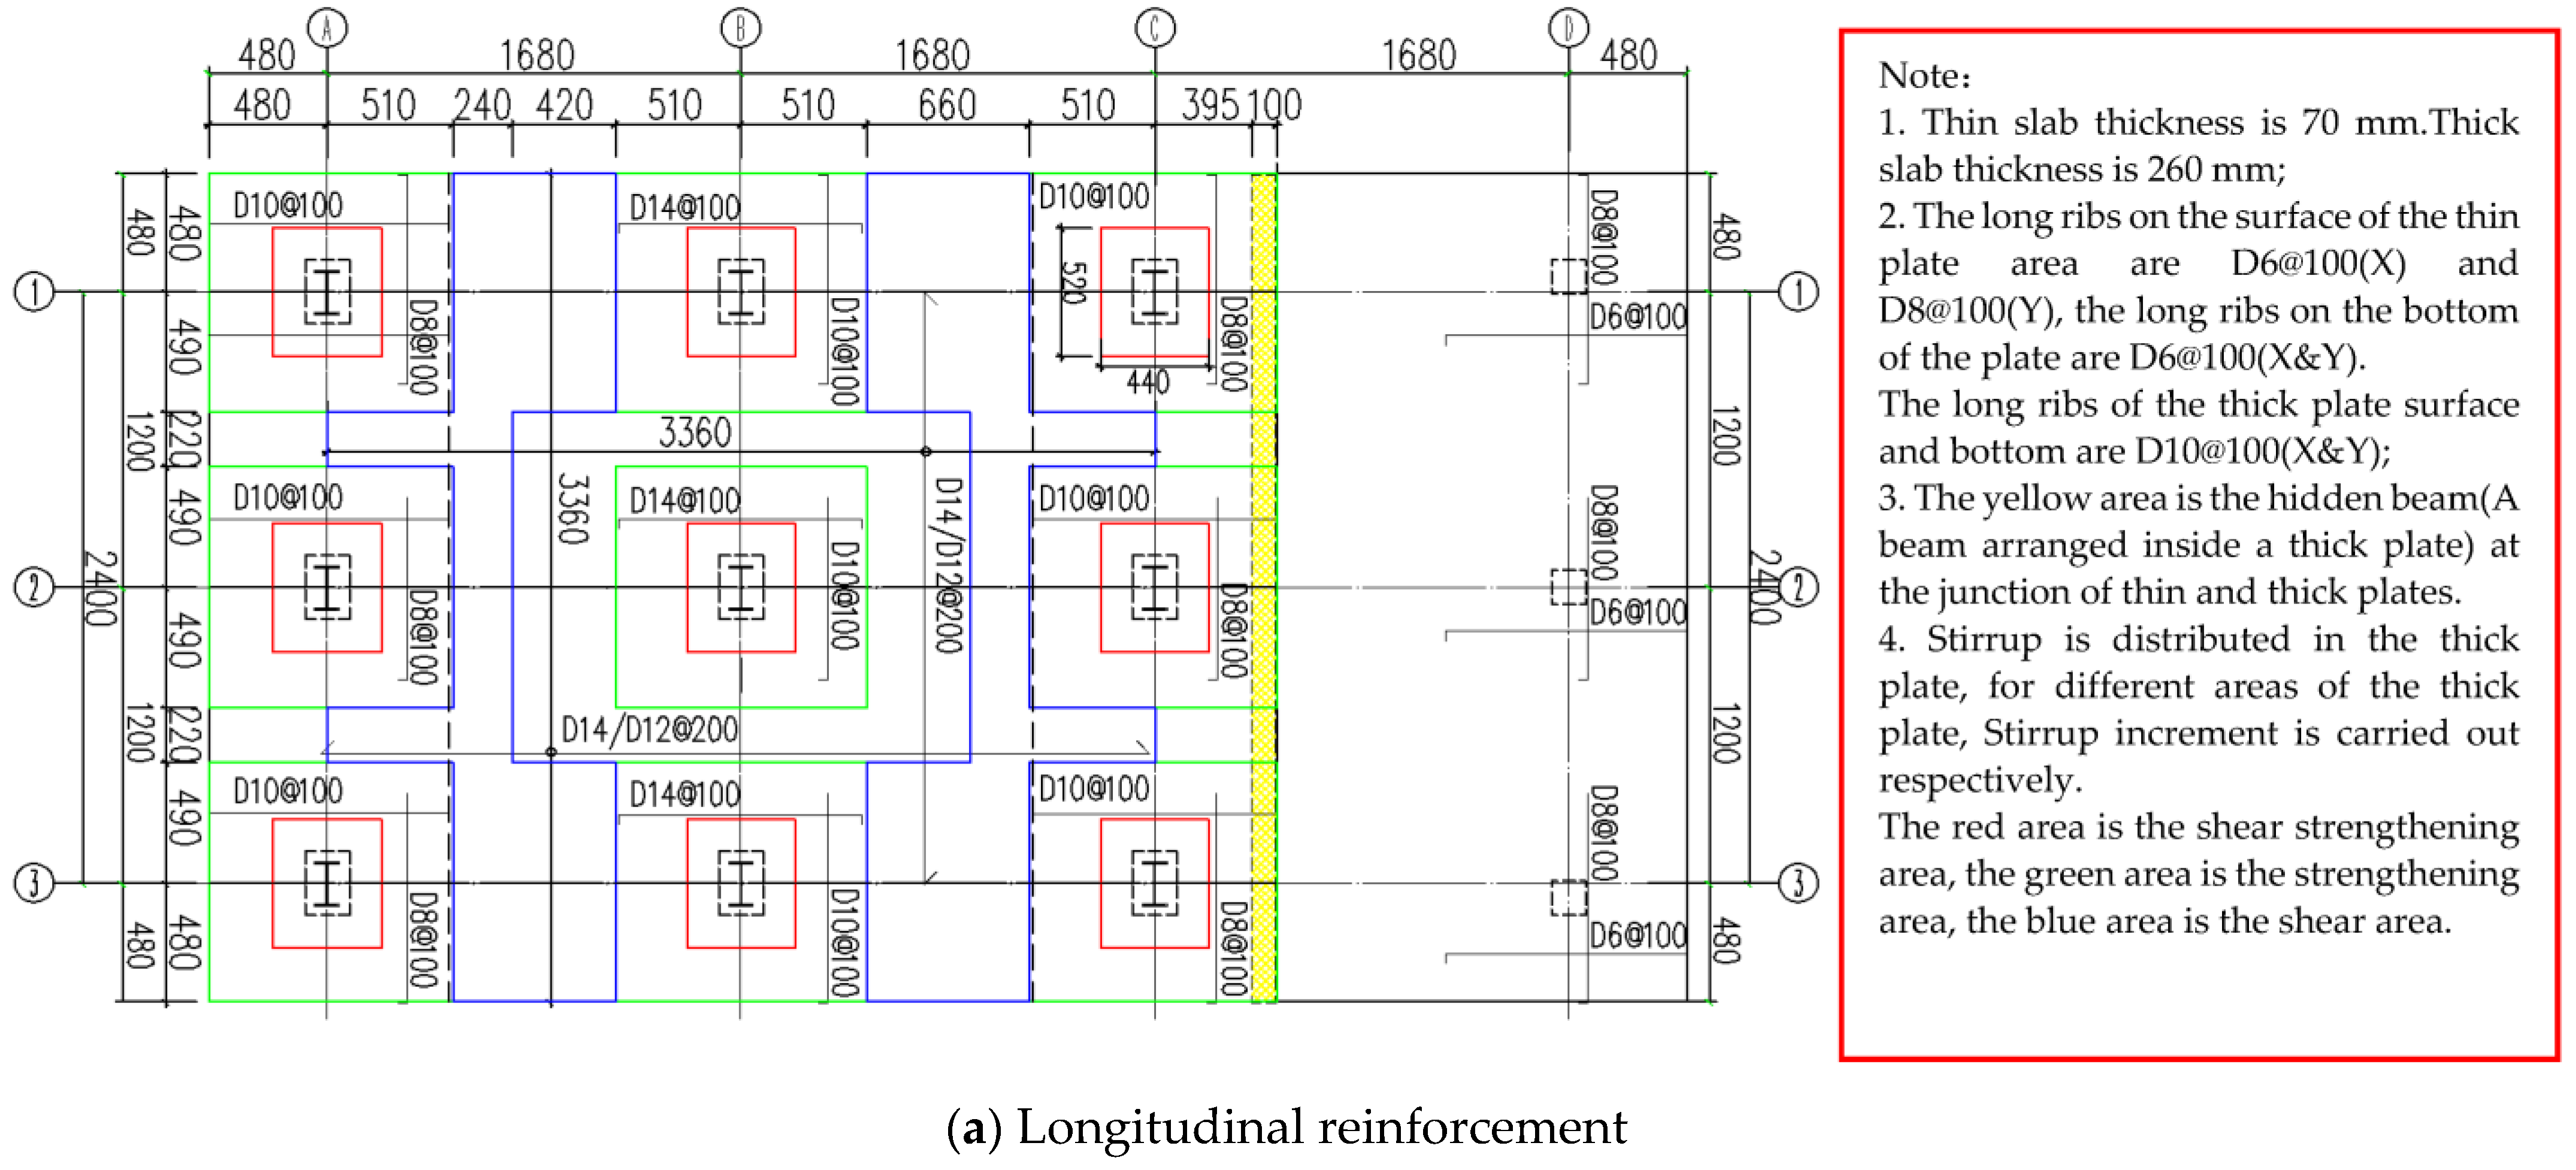
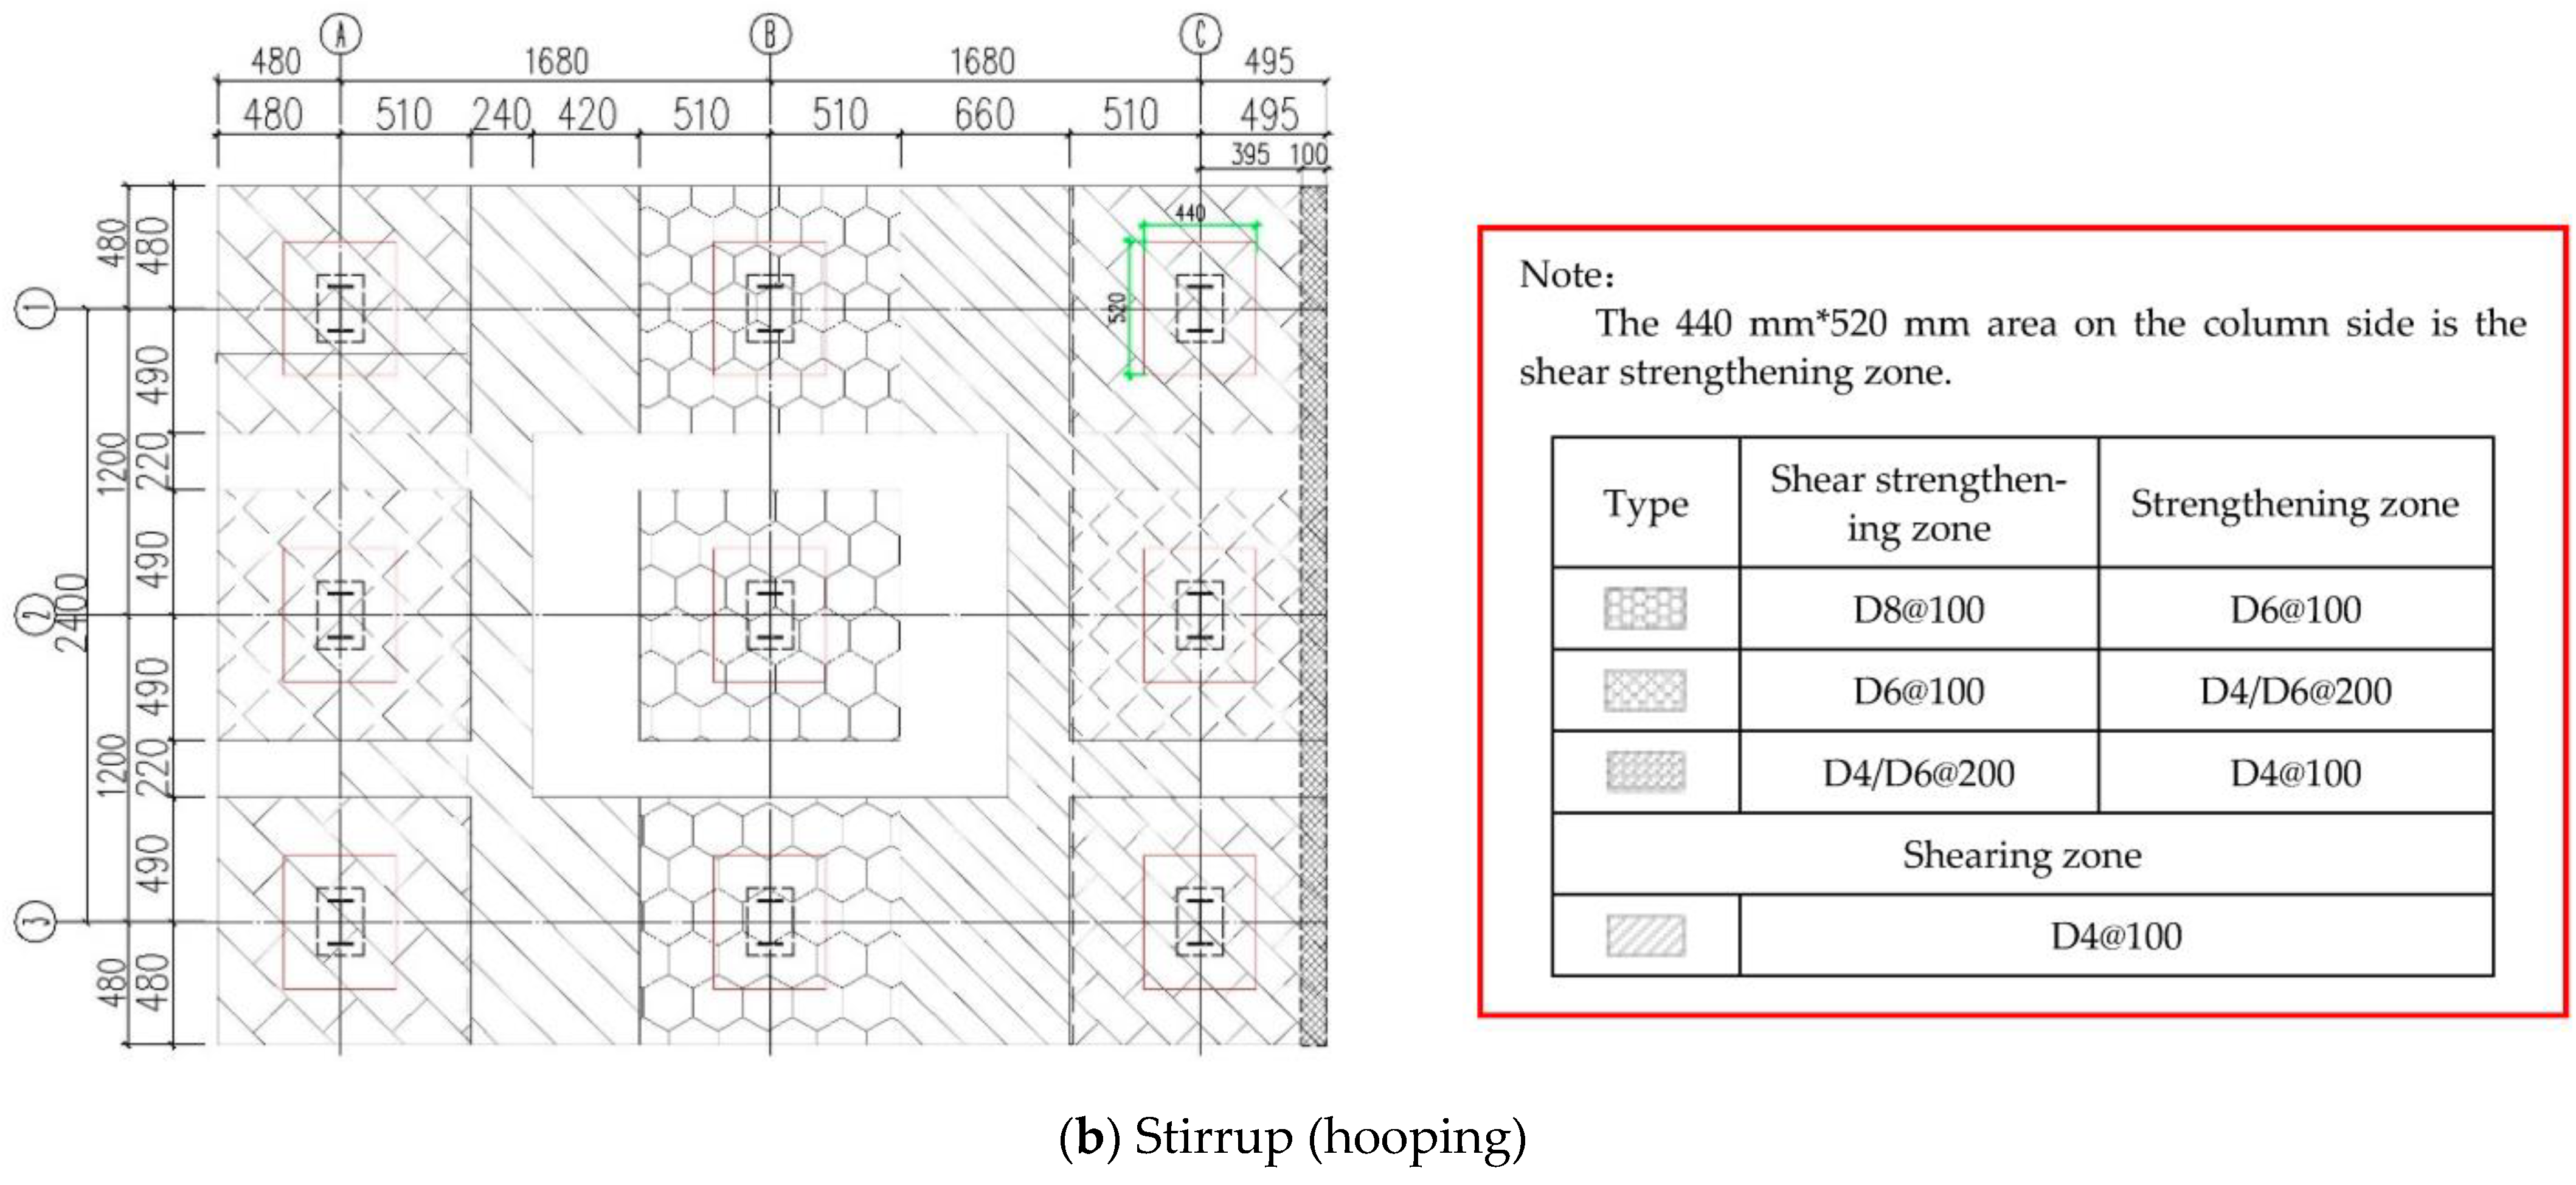
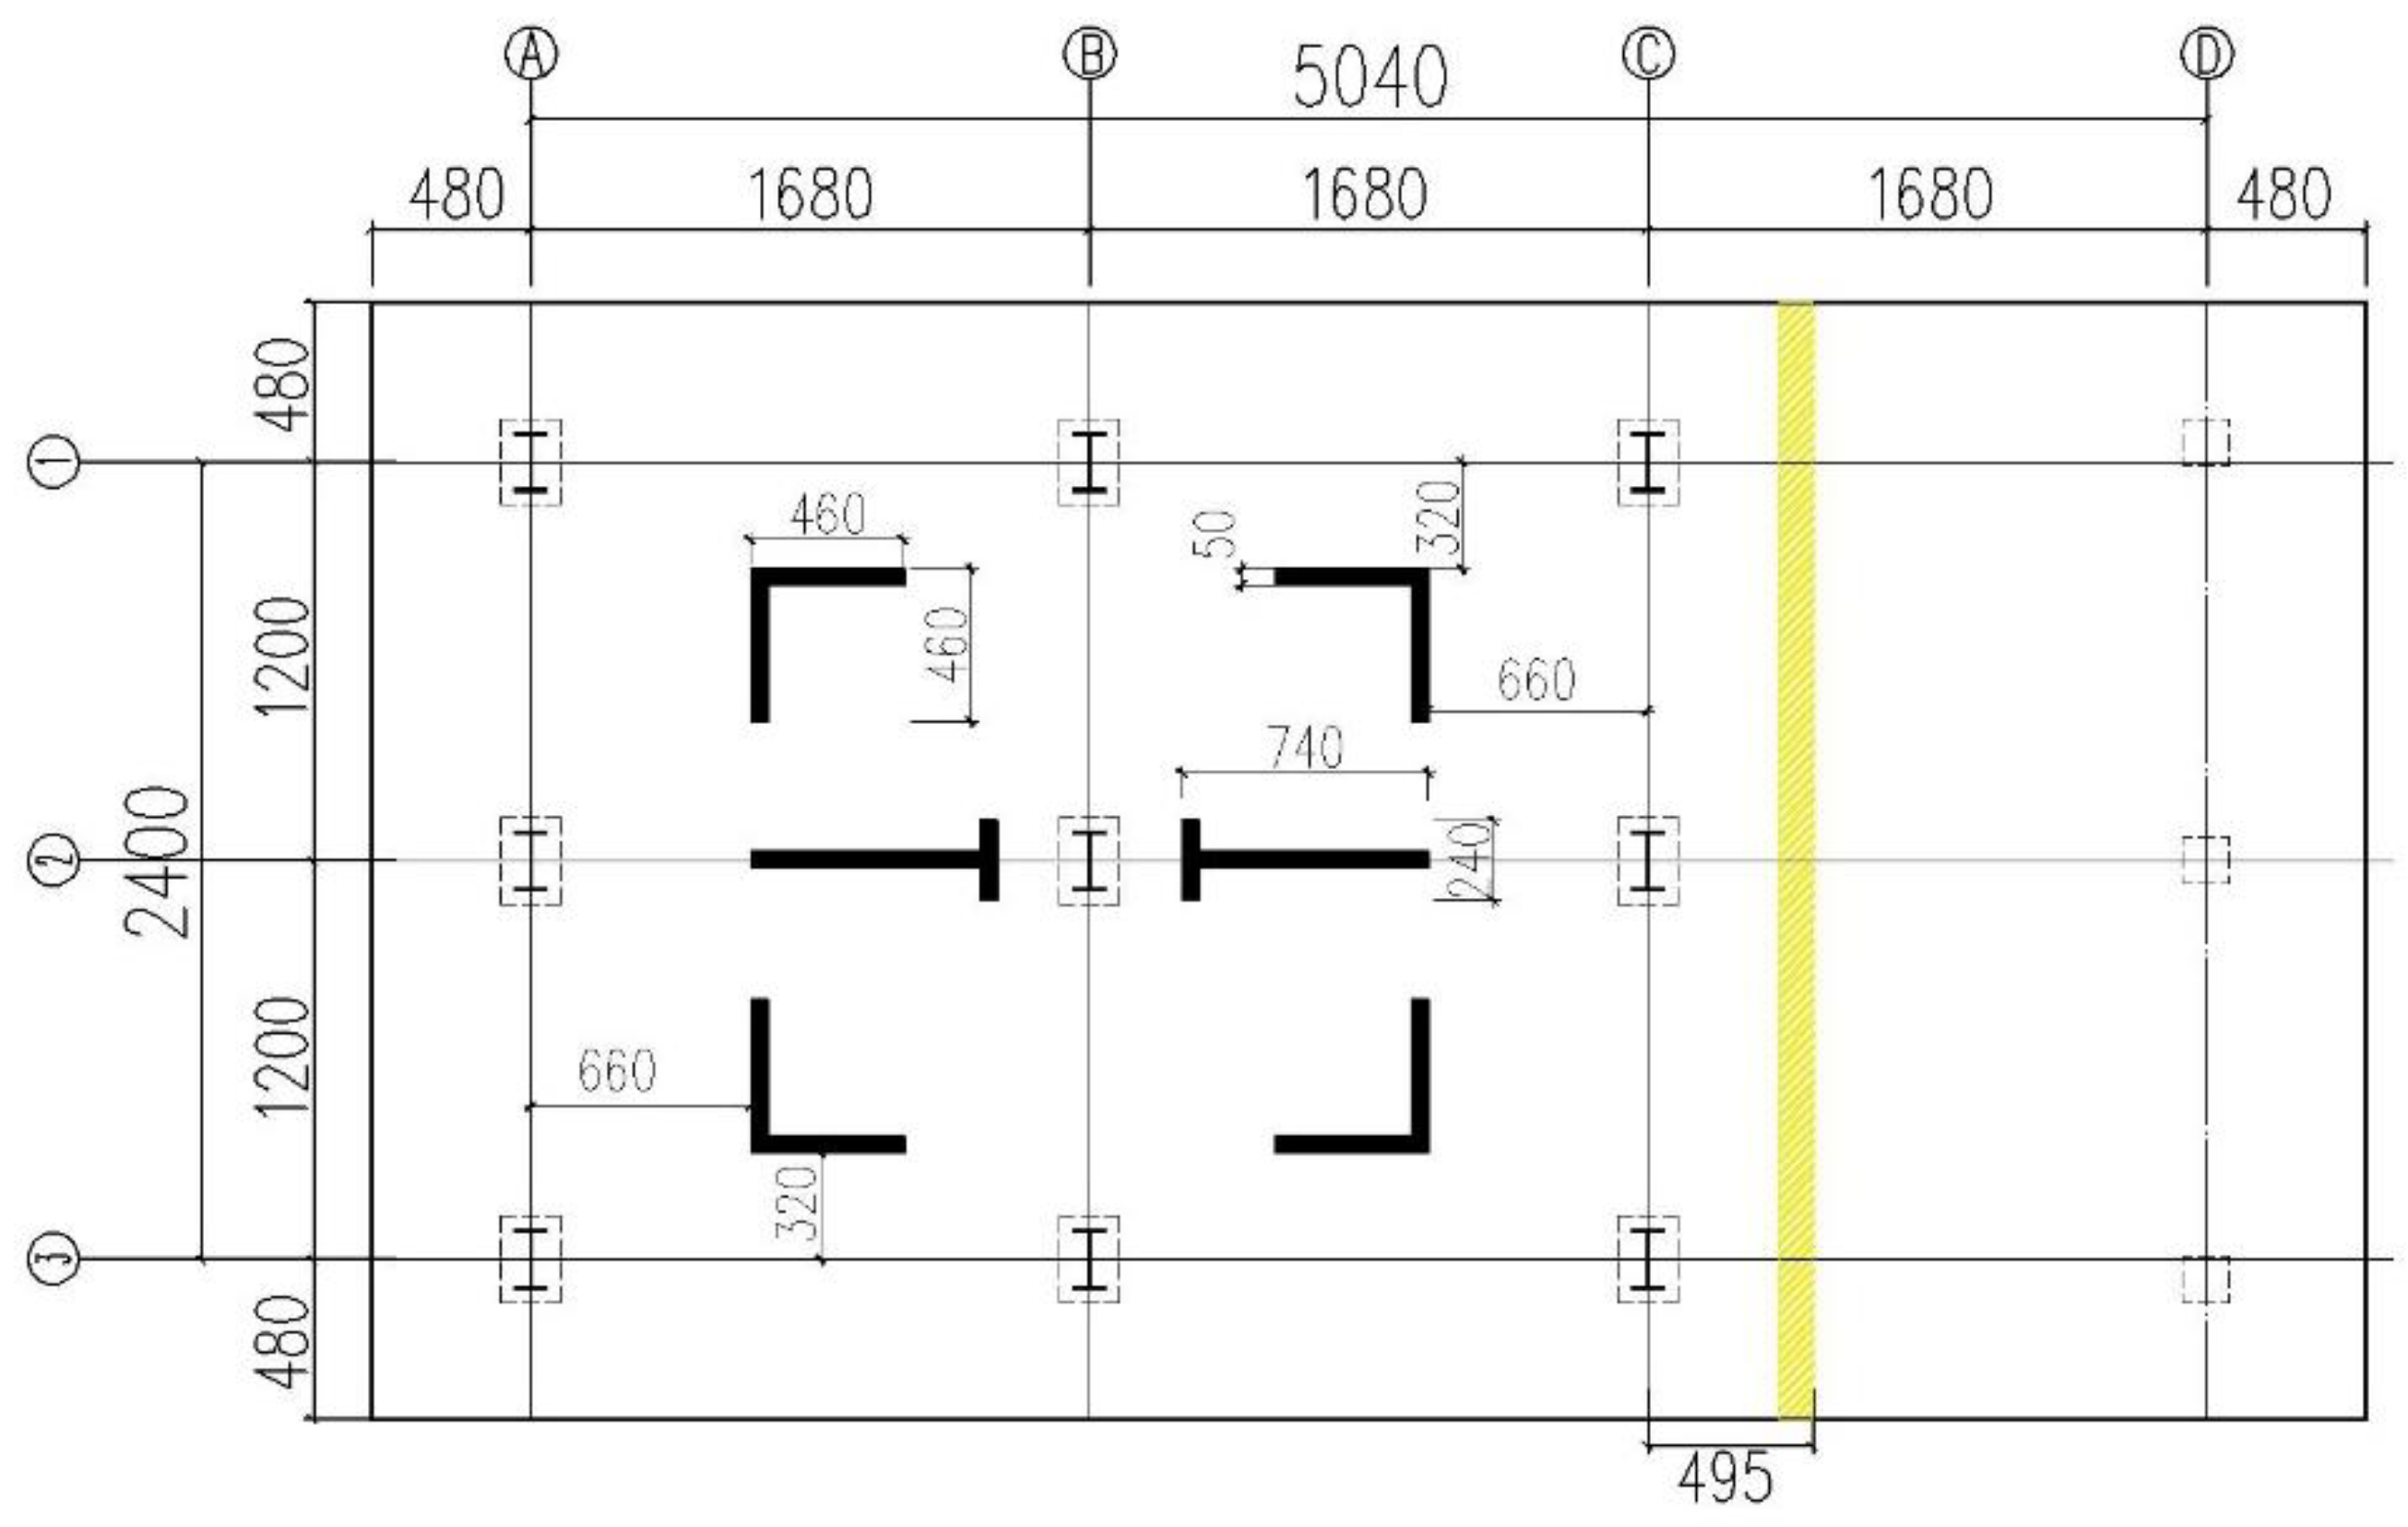
2.1. Specimen Design
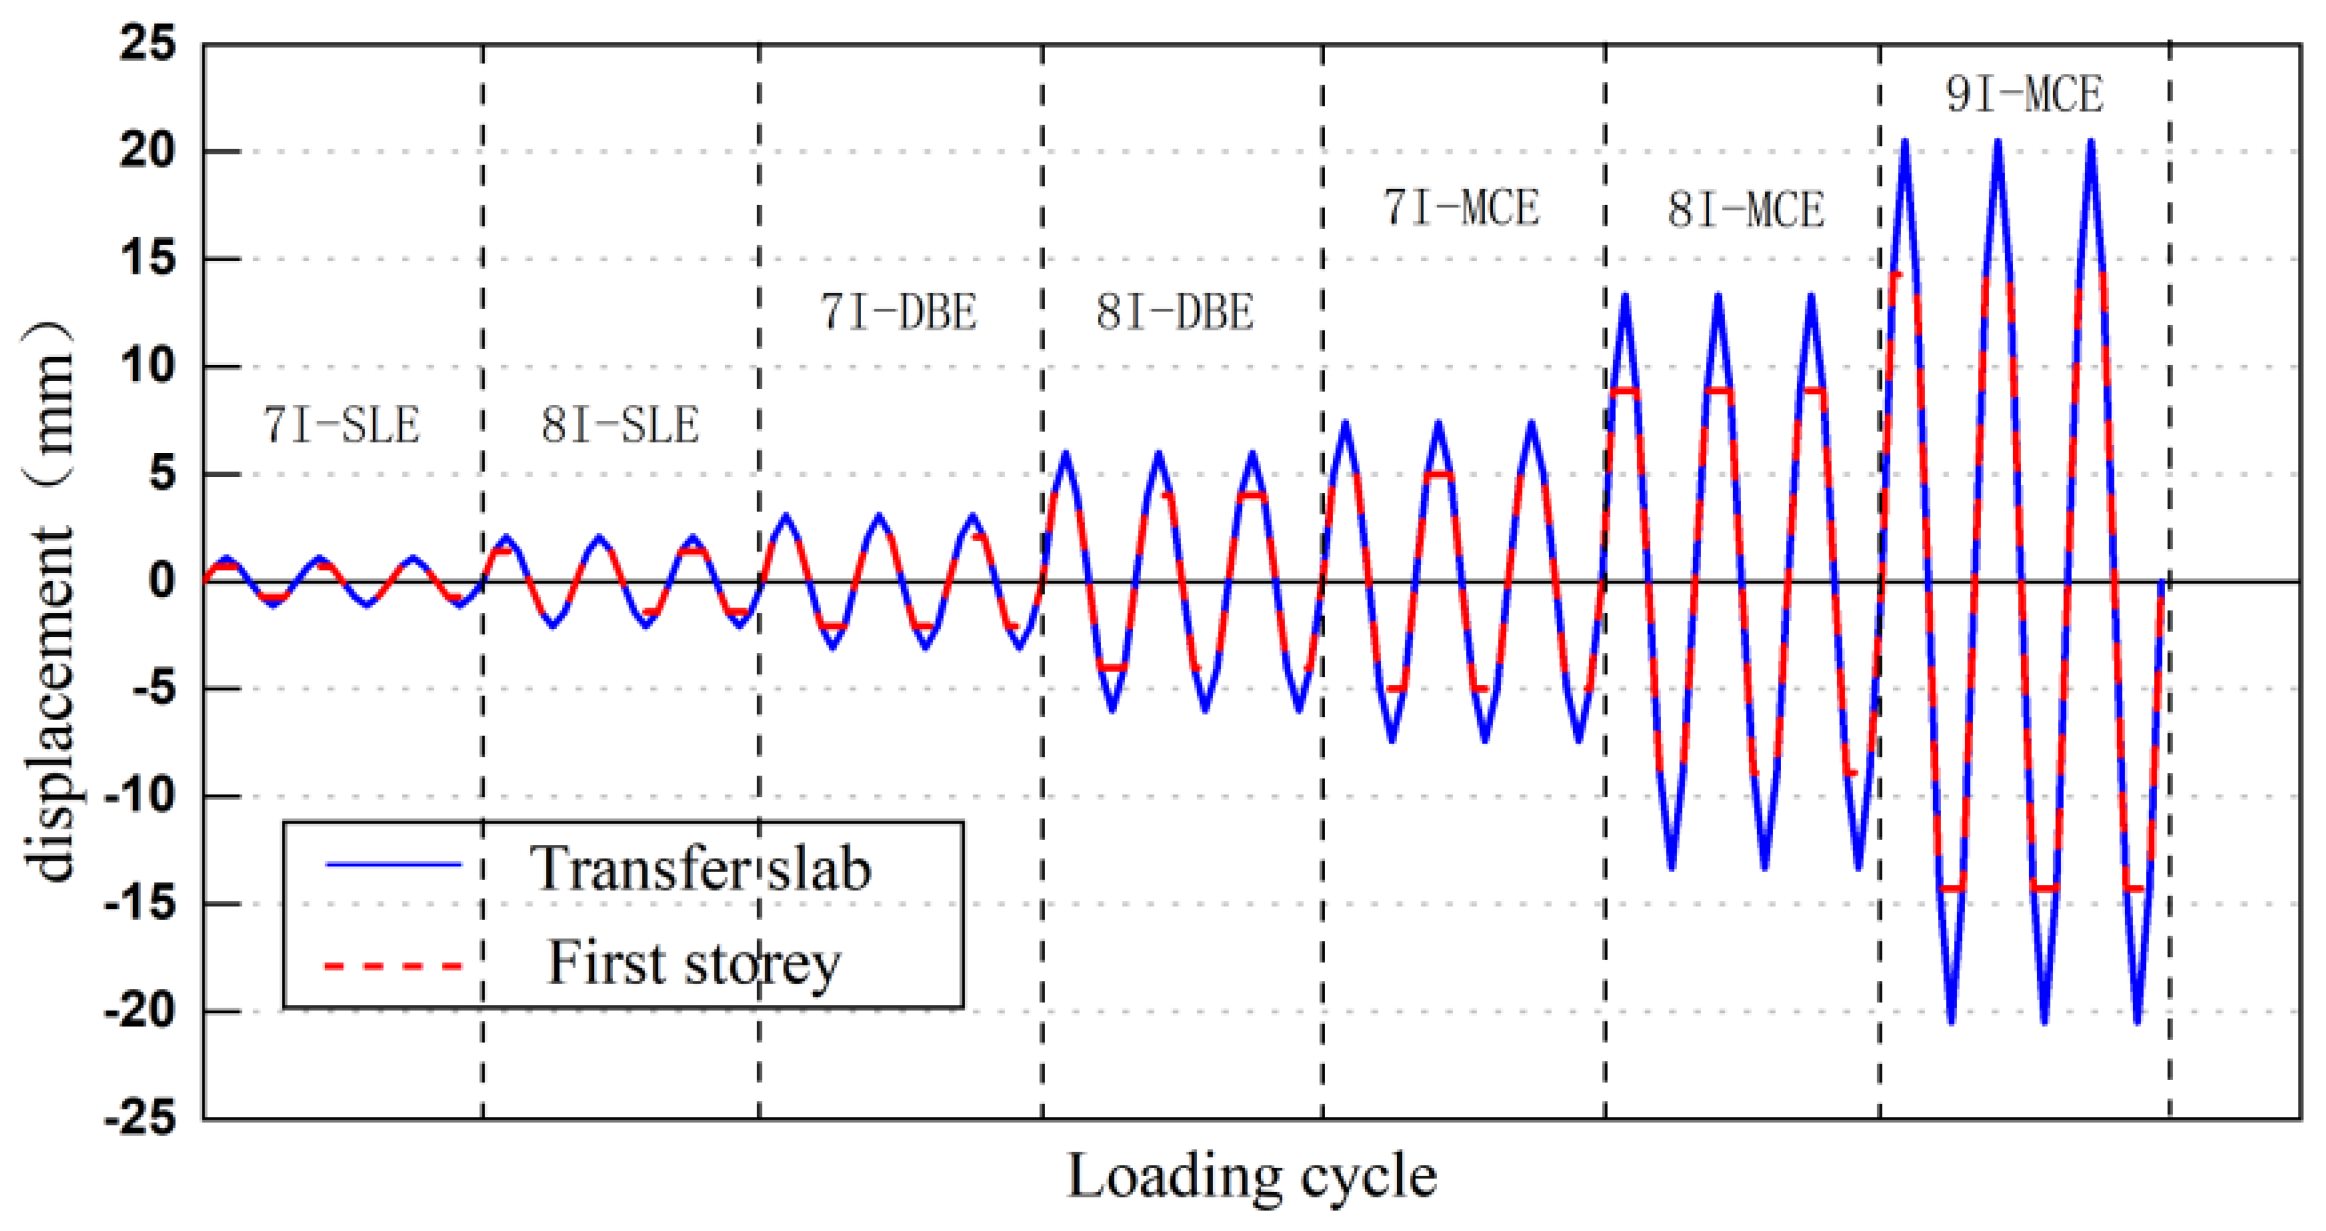
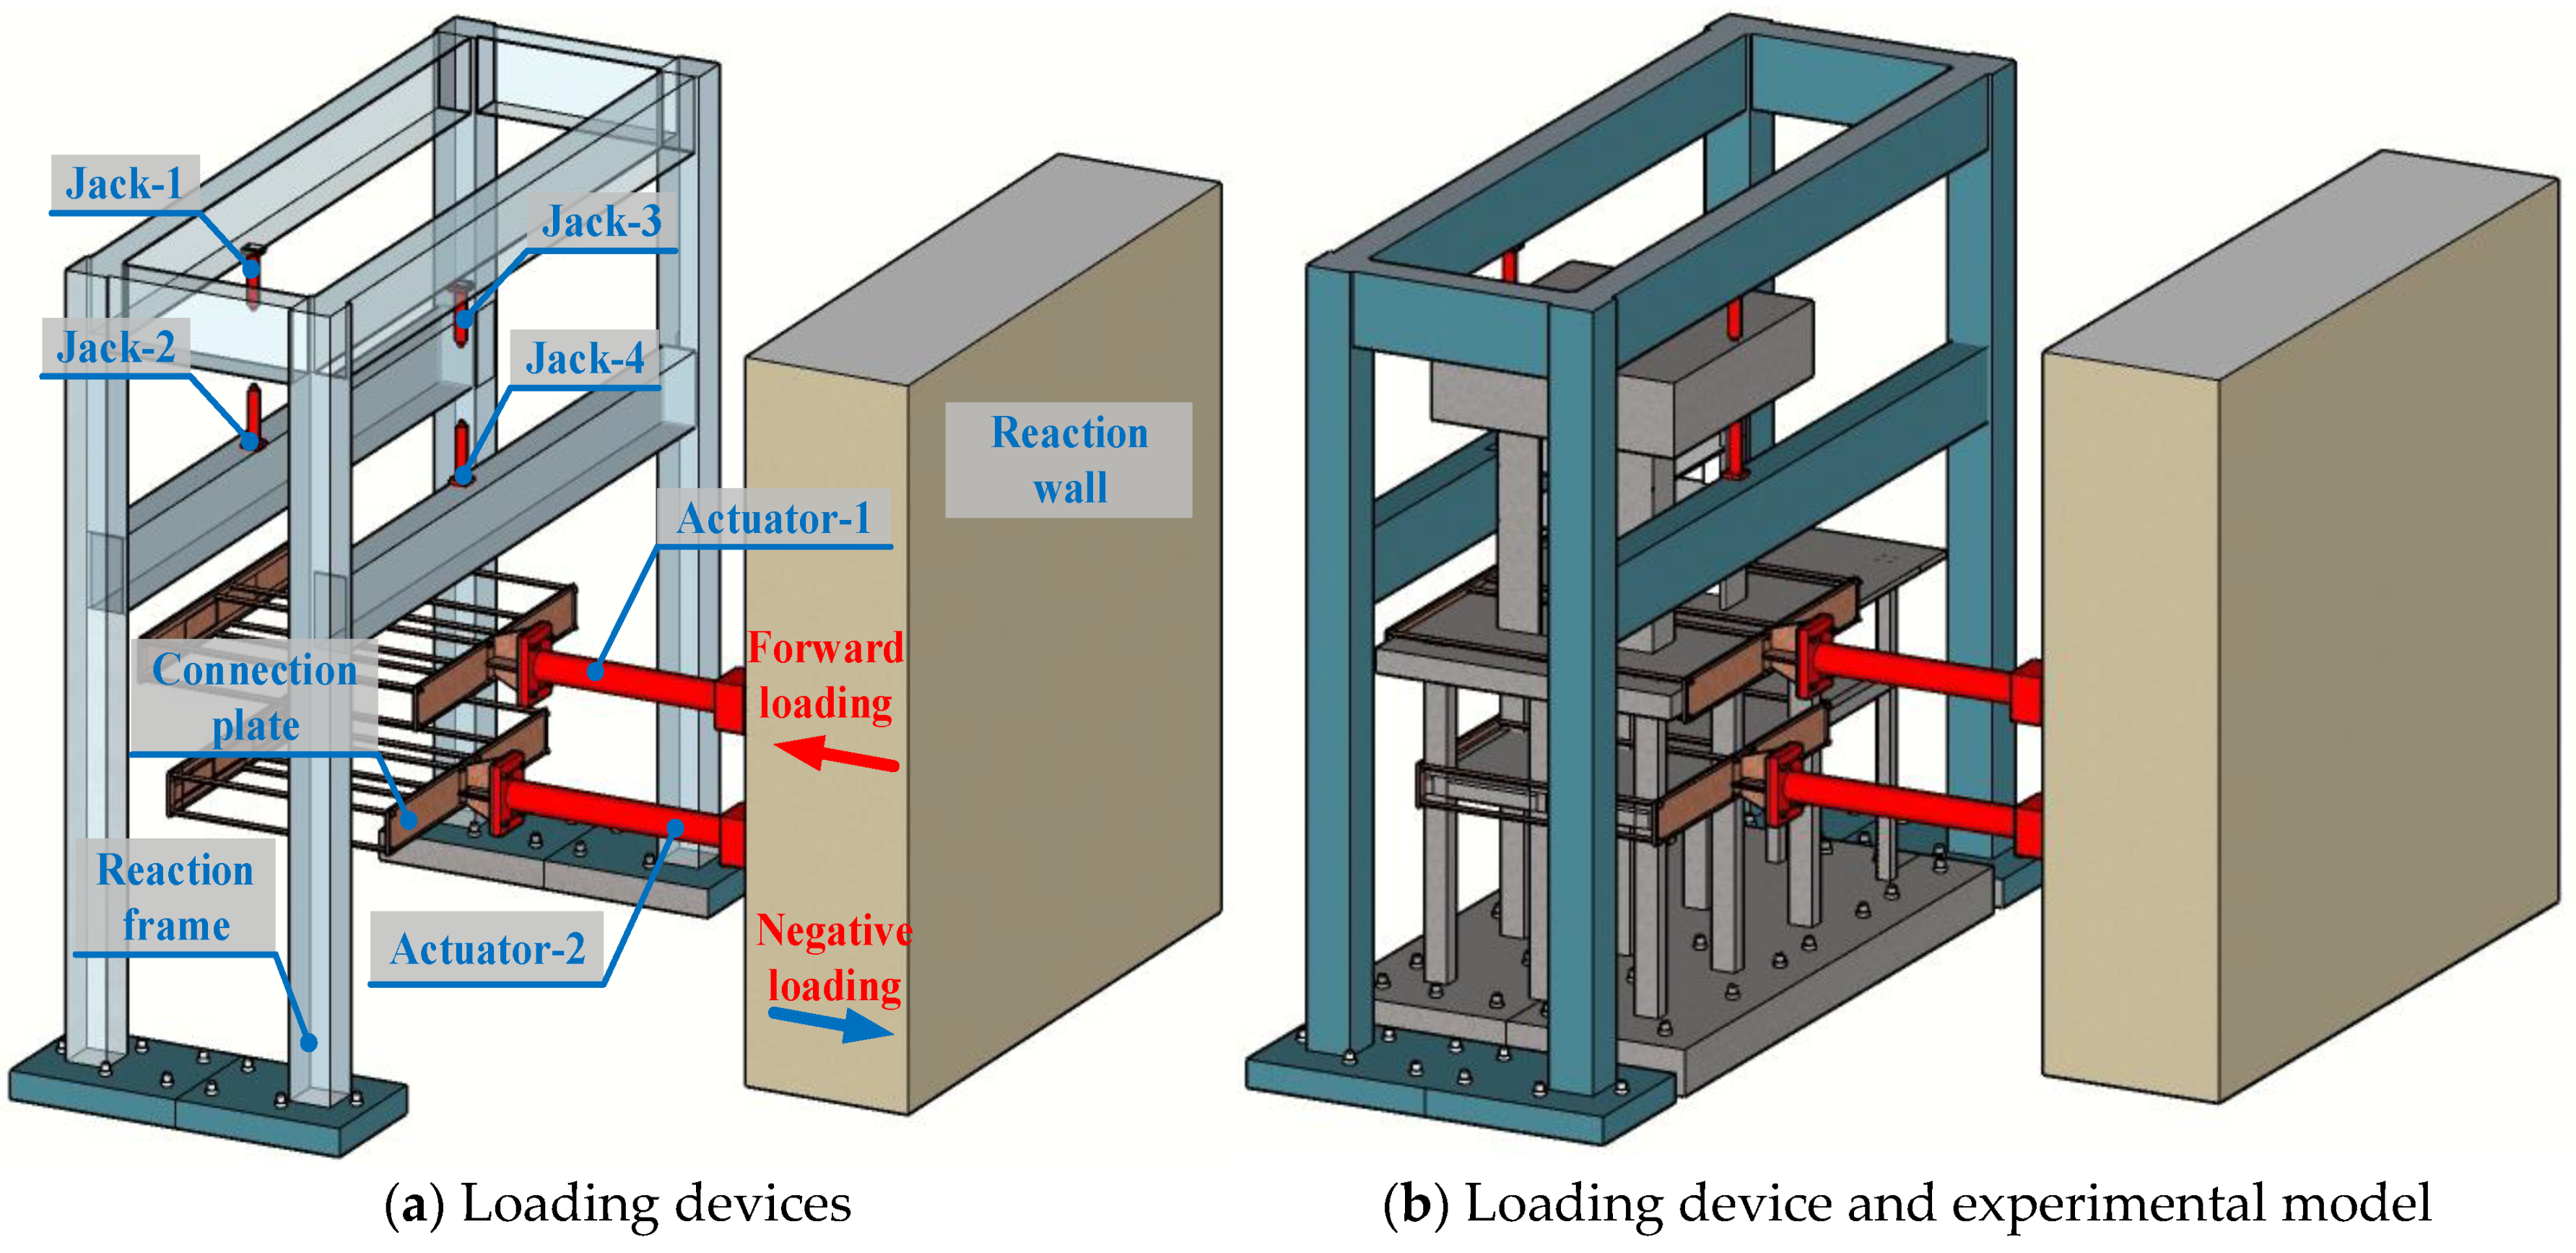
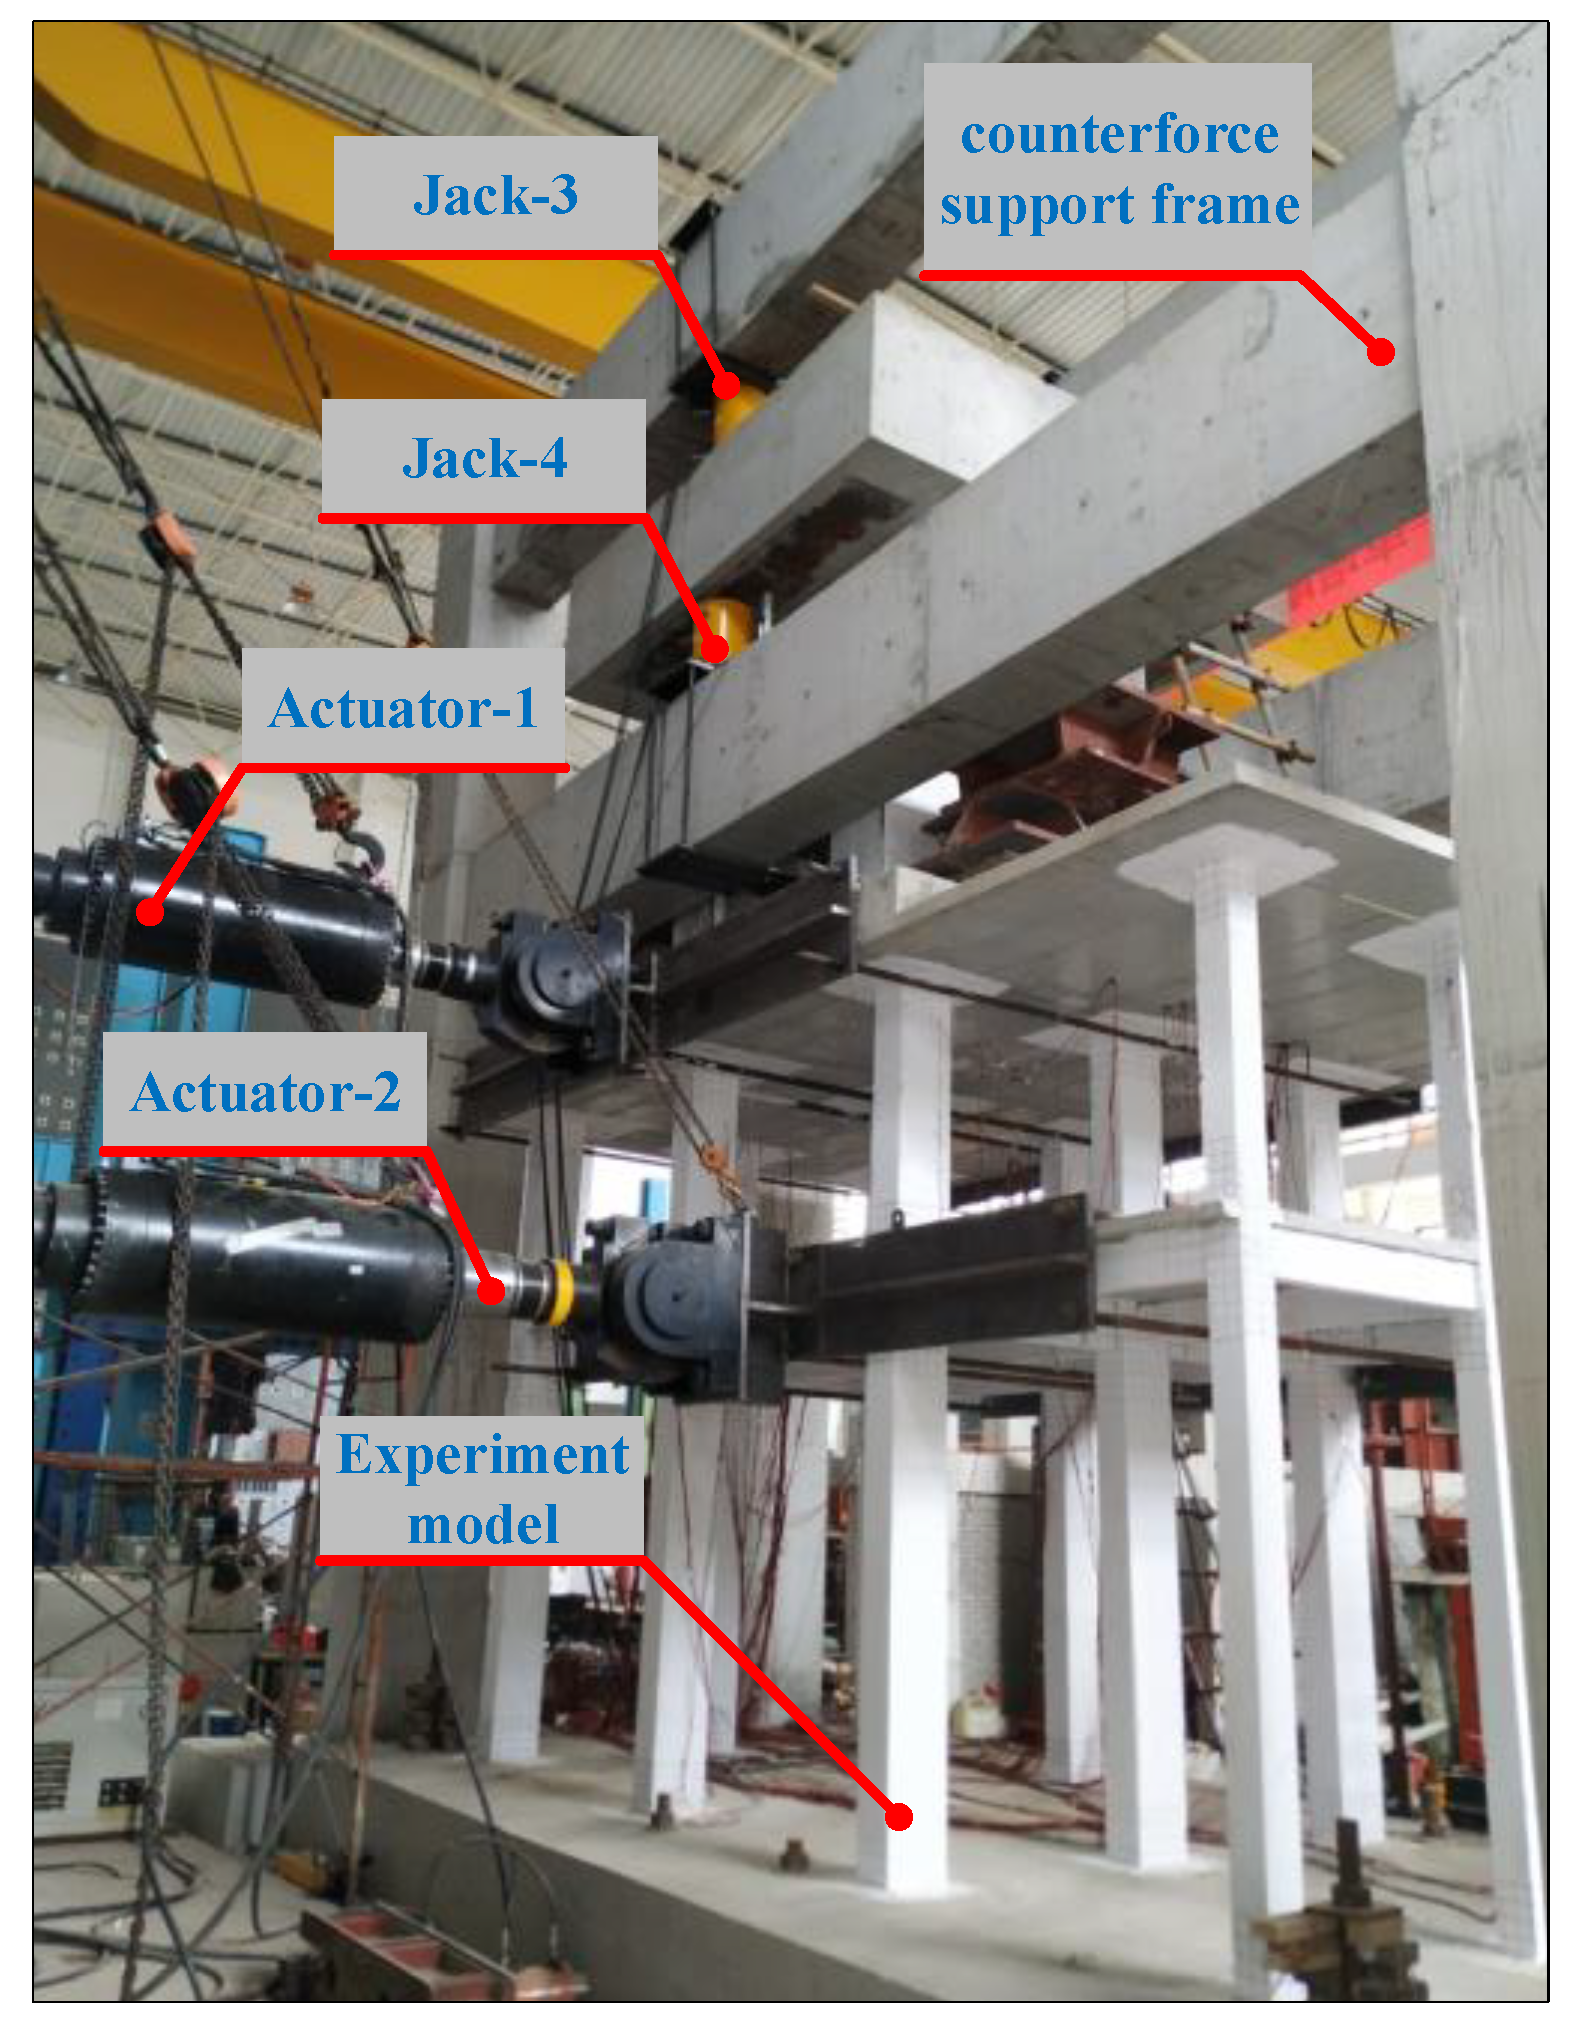
2.2. Loading Programs and Institutions
2.2.1. Vertical Loading
2.2.2. Horizontal Loading
2.2.3. Overturning Moment of Superstructure
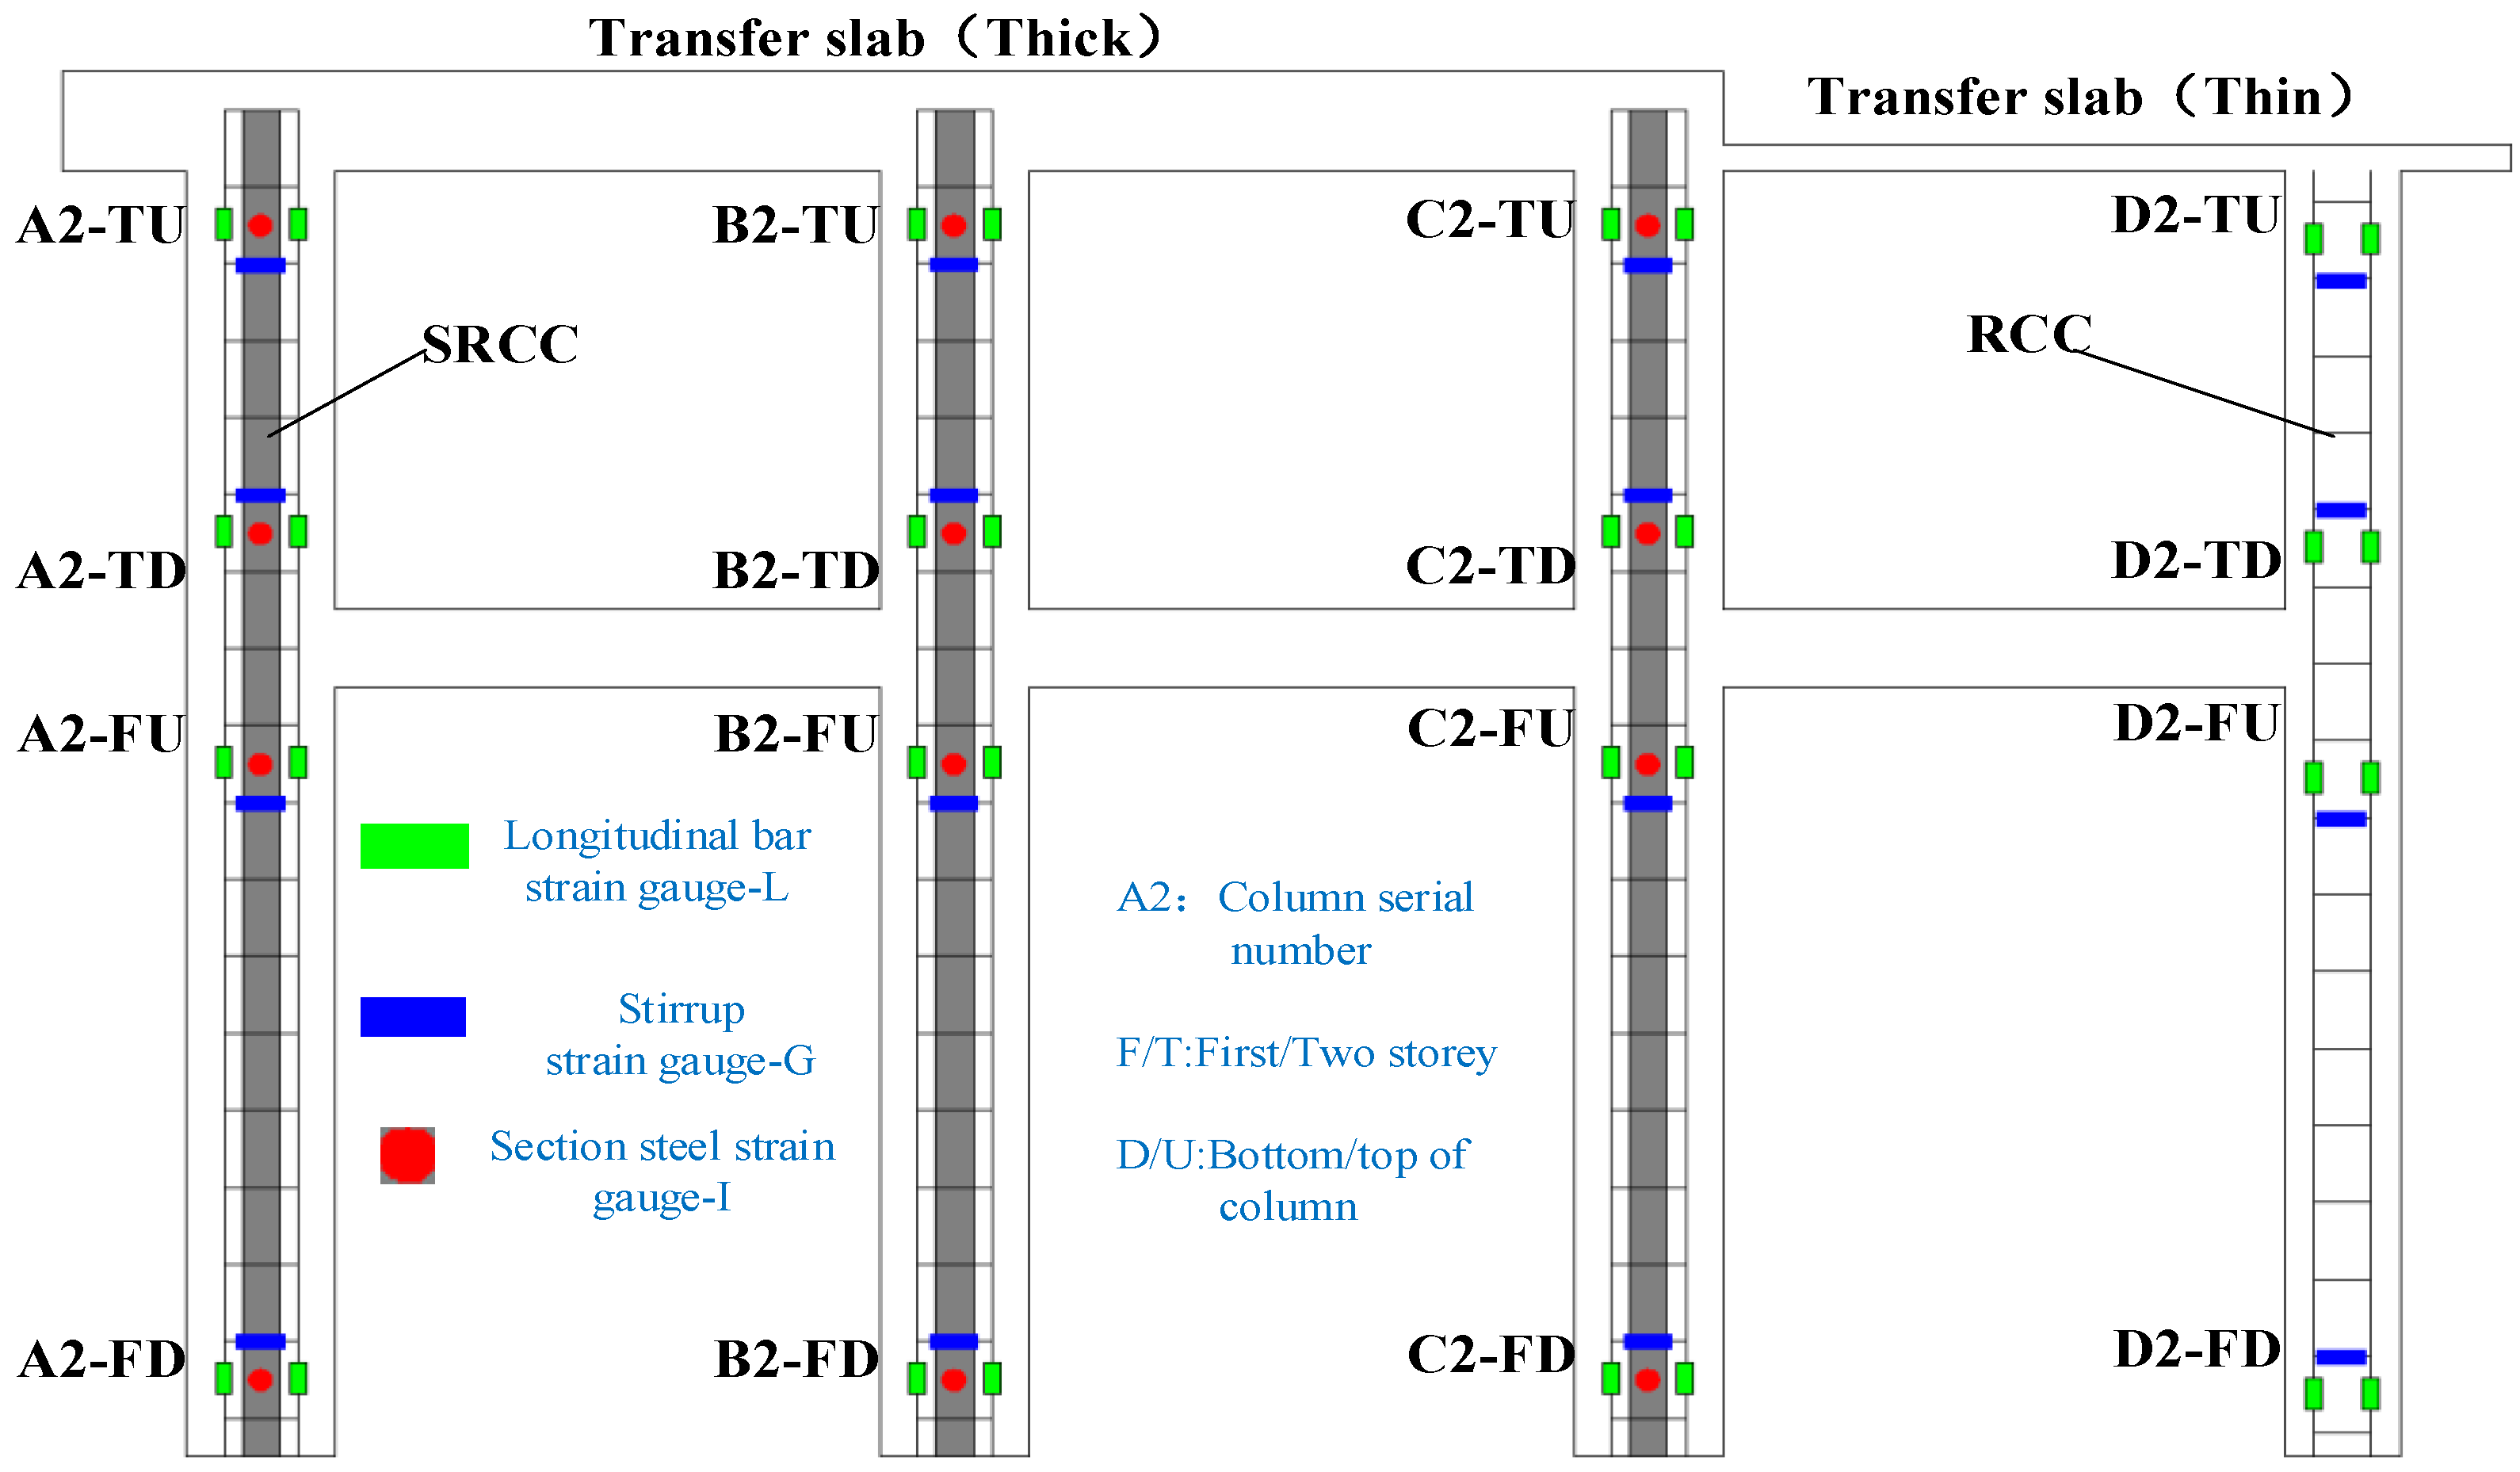
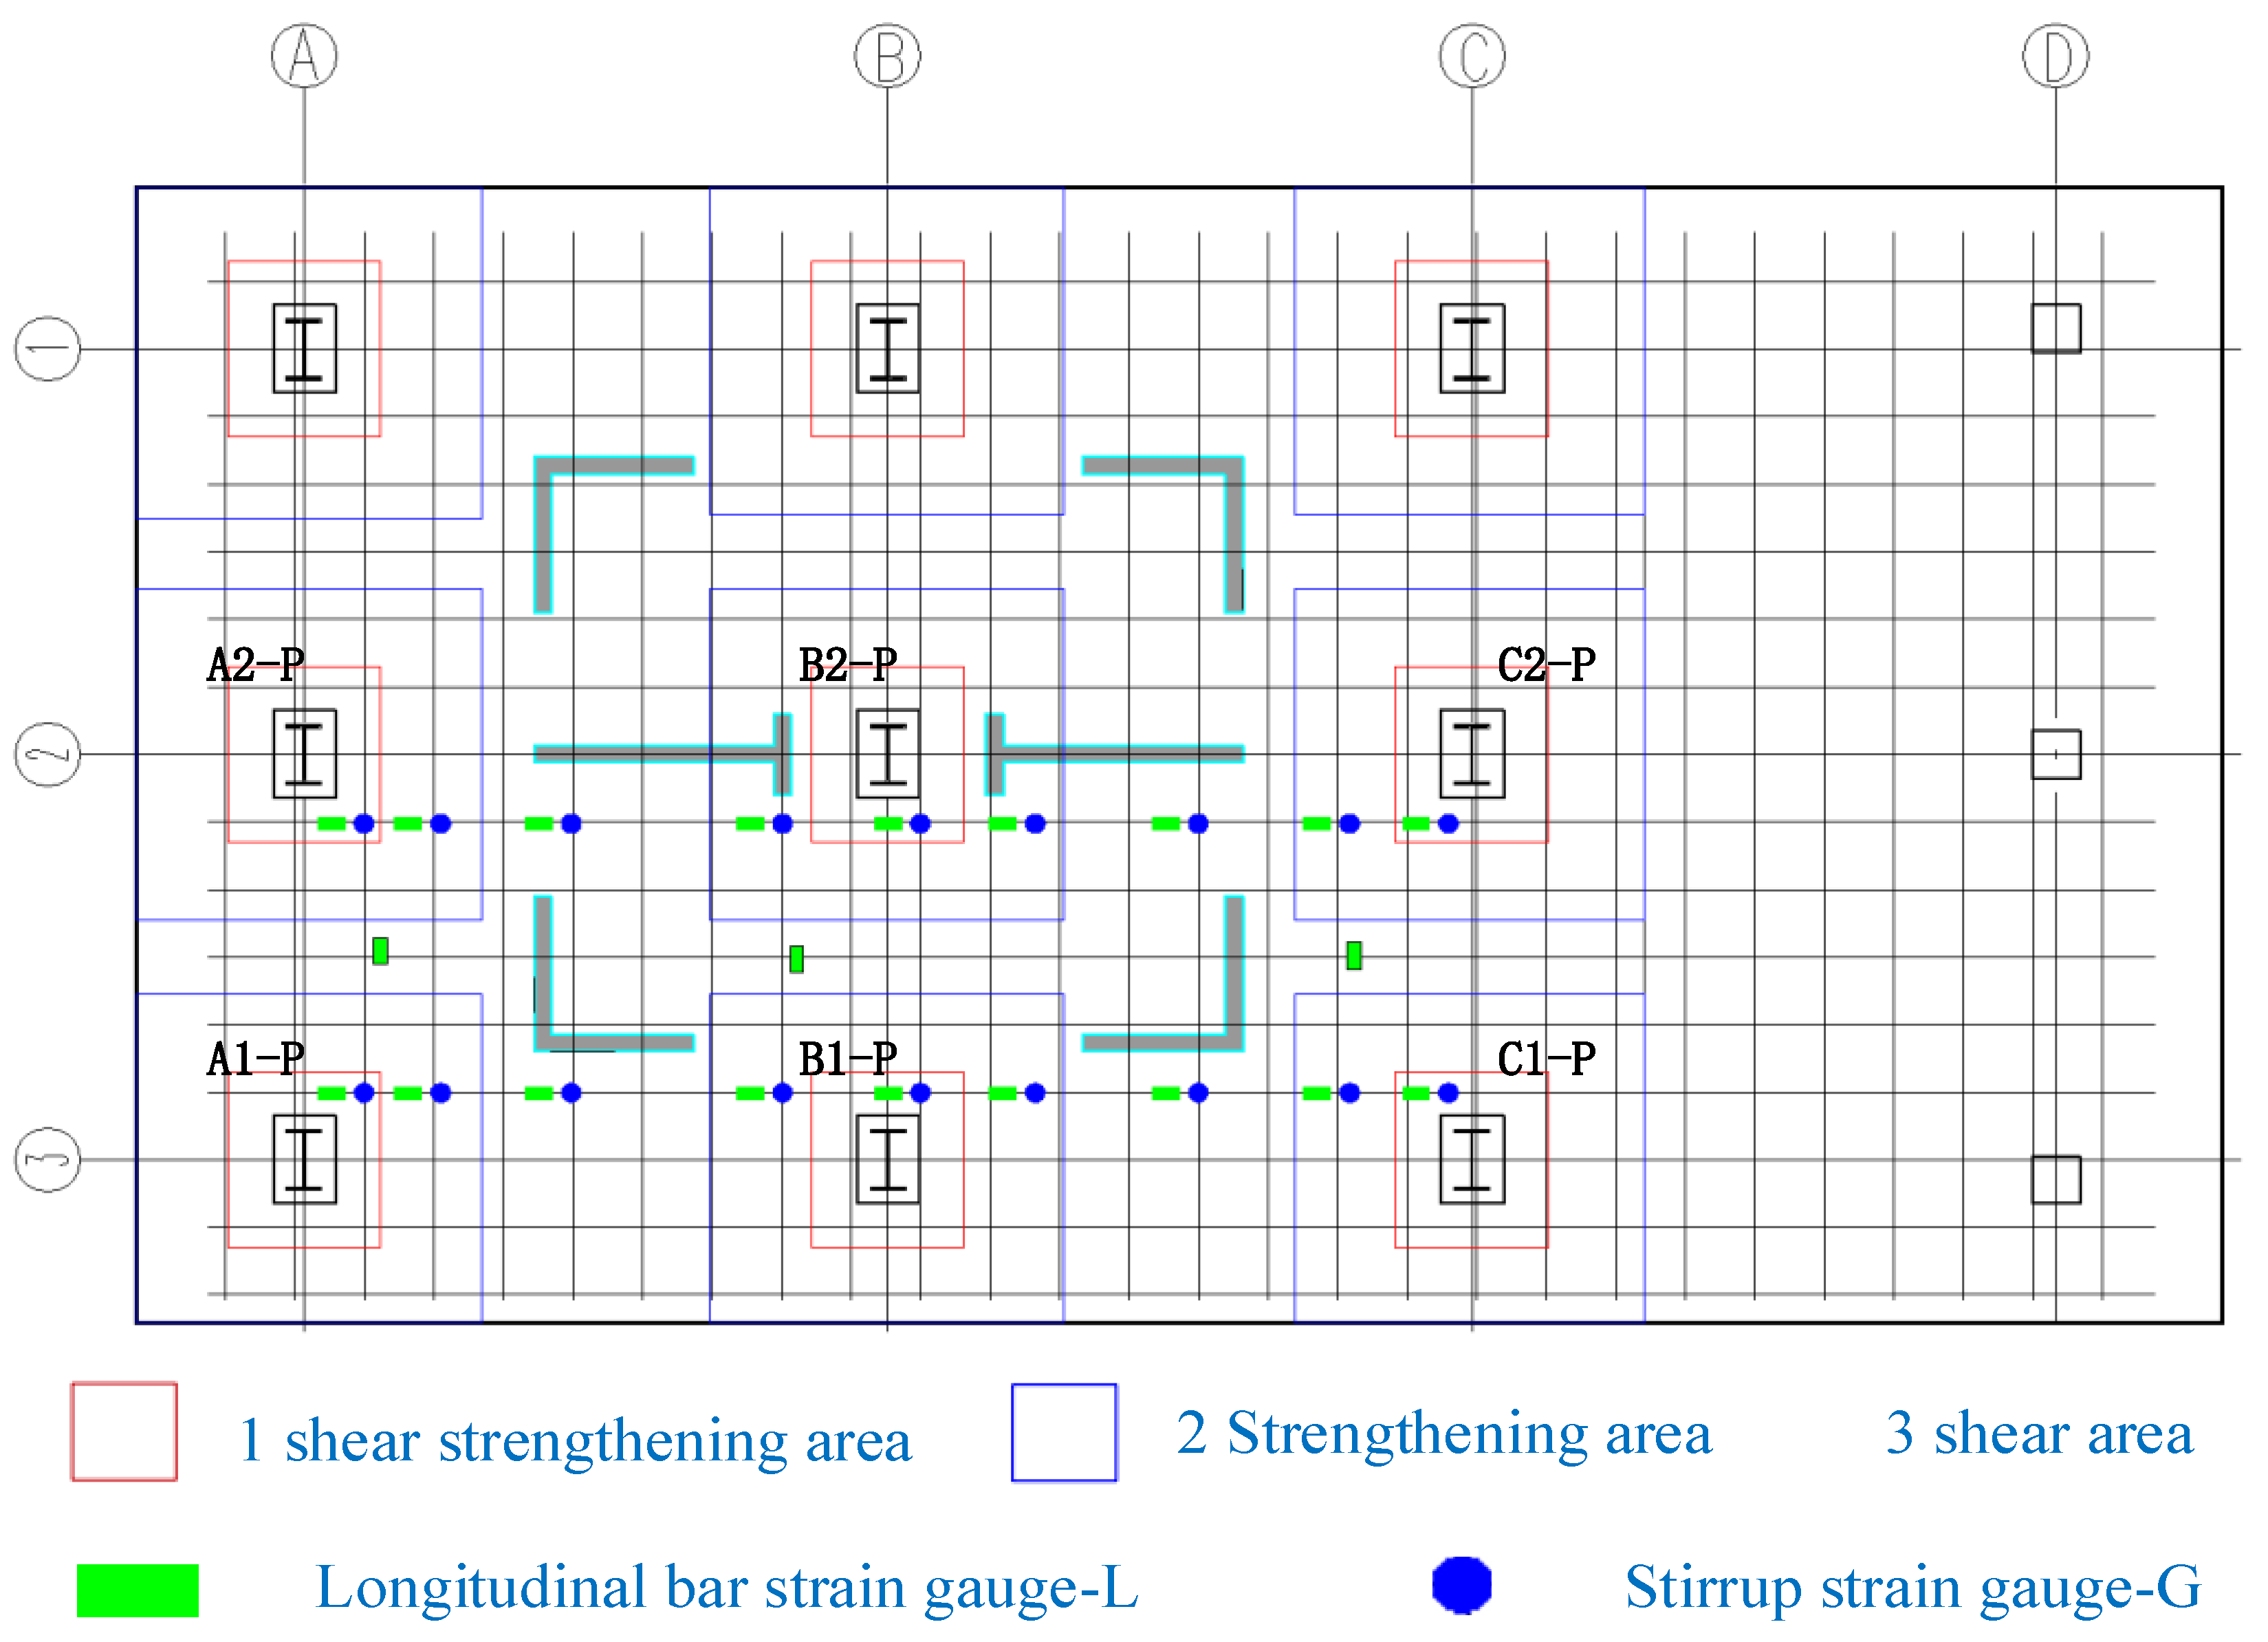
2.3. Collection Strain
3. Experiment Results
4. Component Strain Analysis
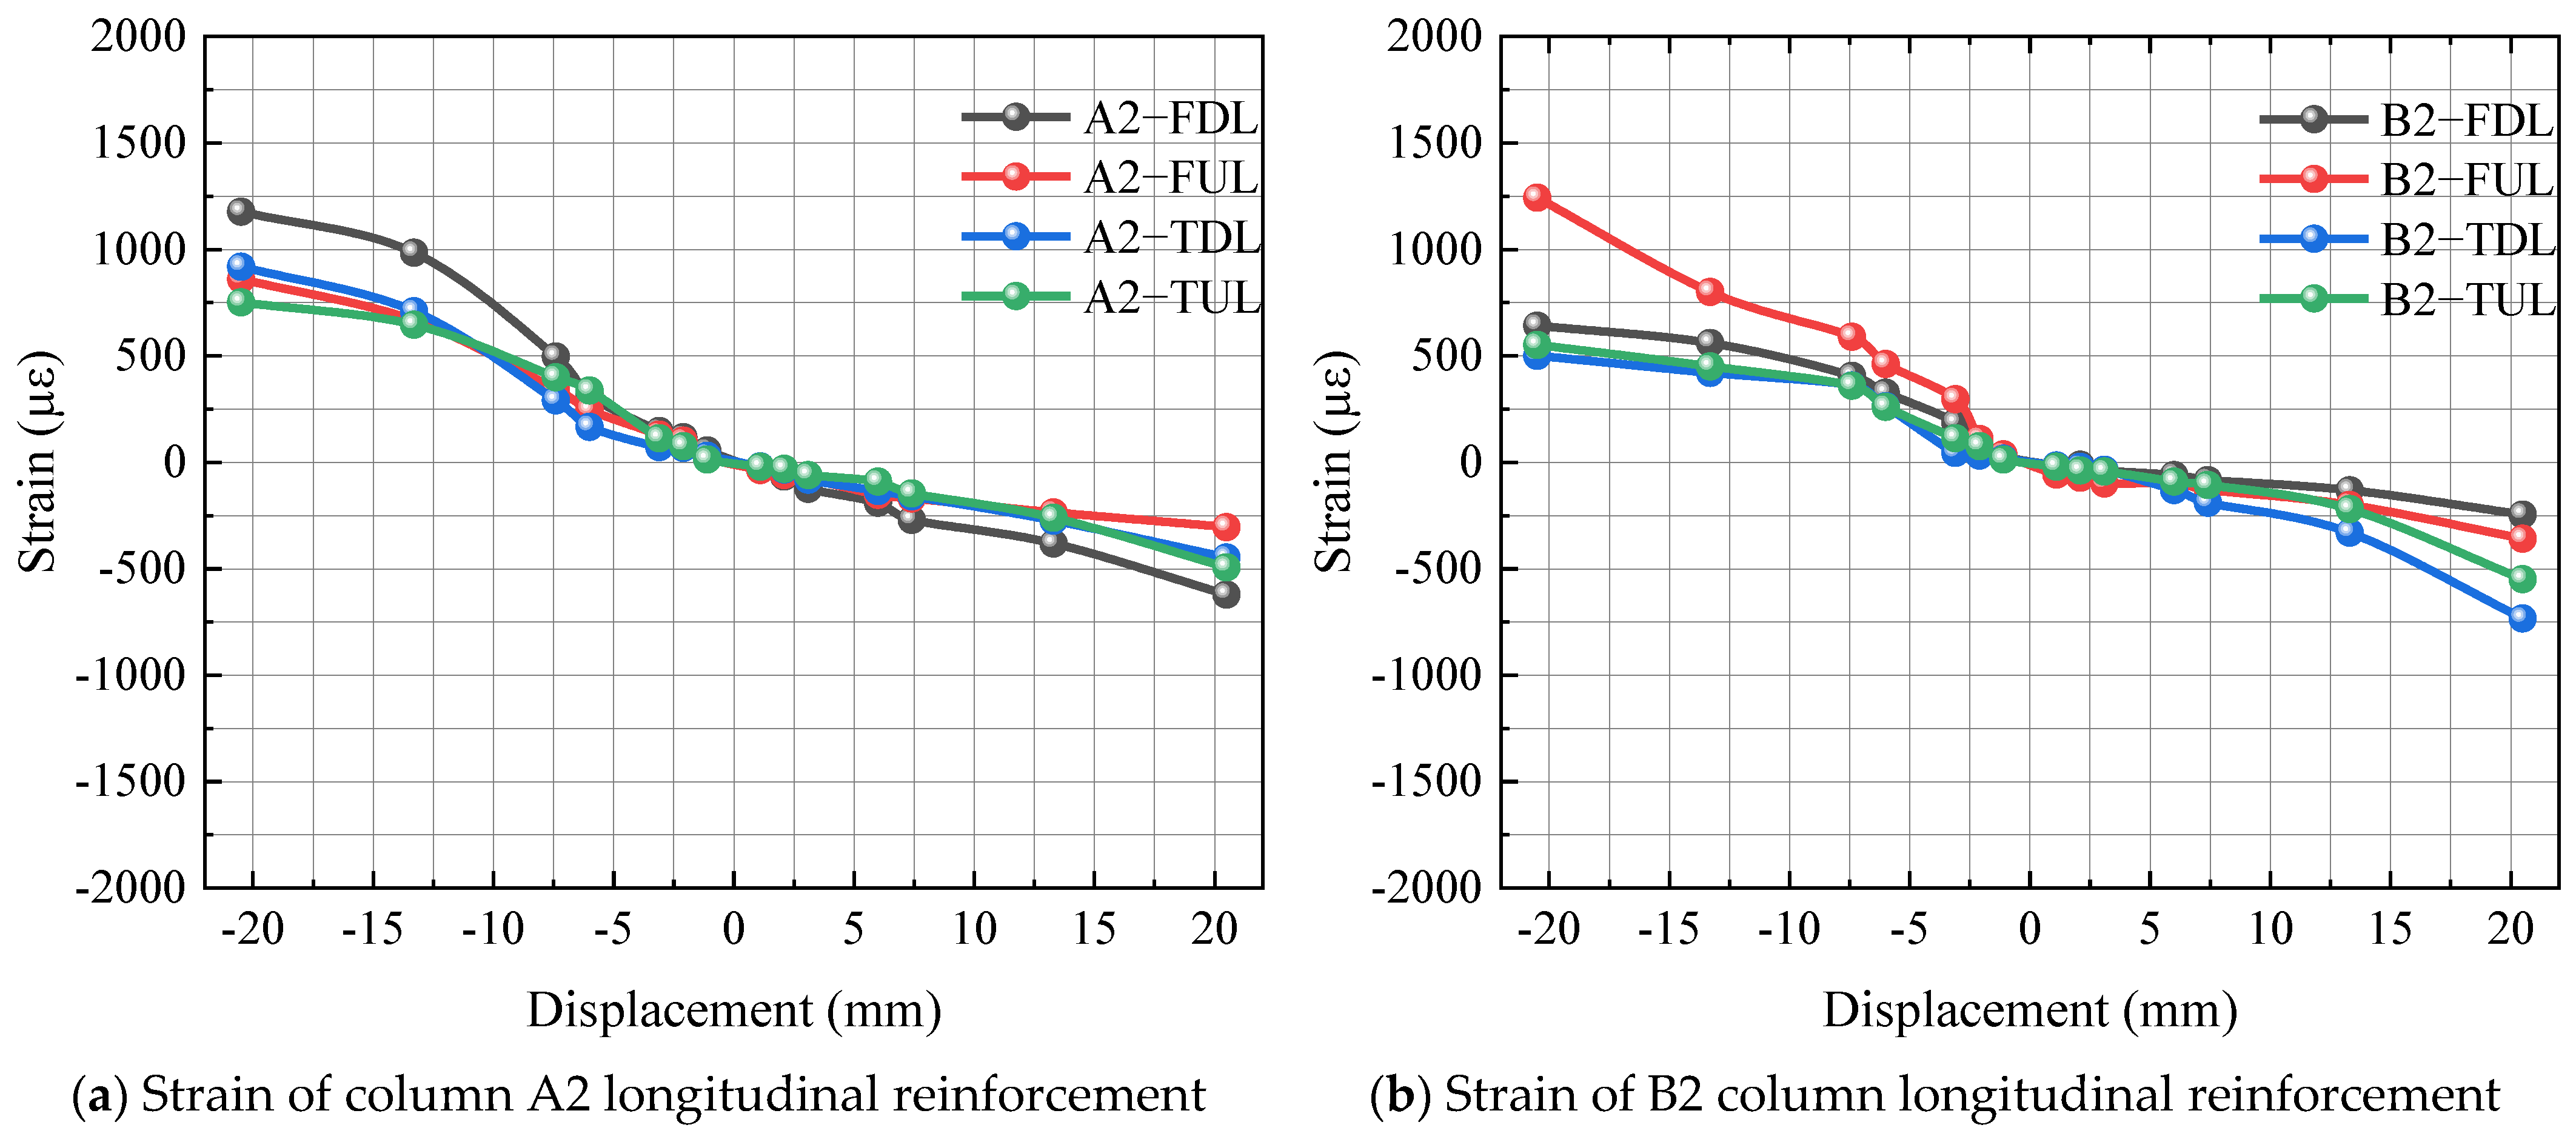
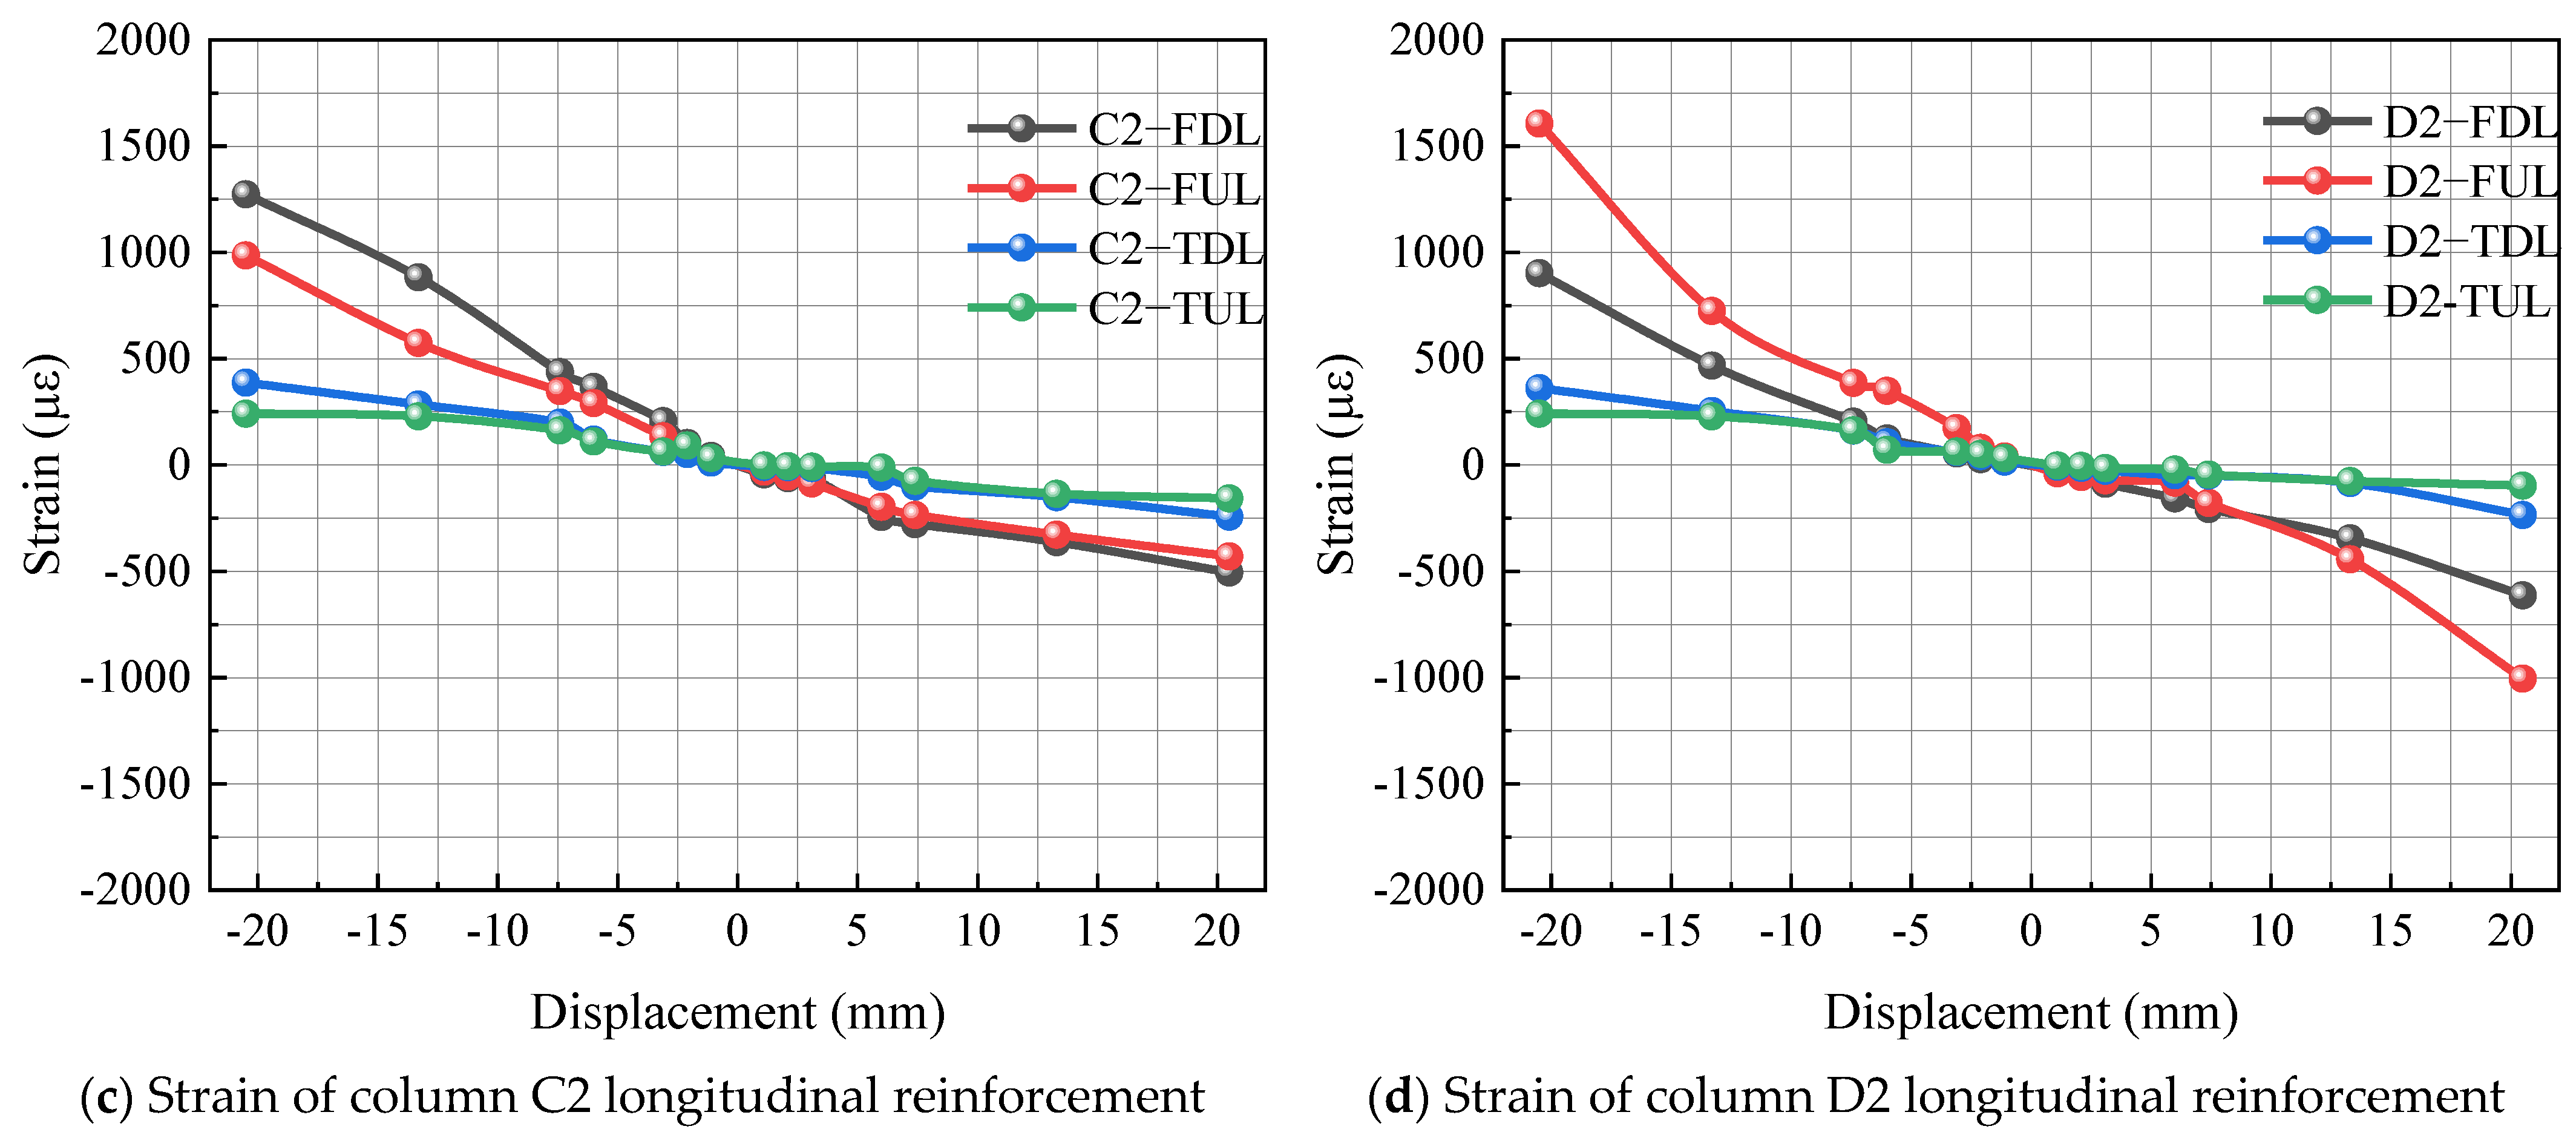
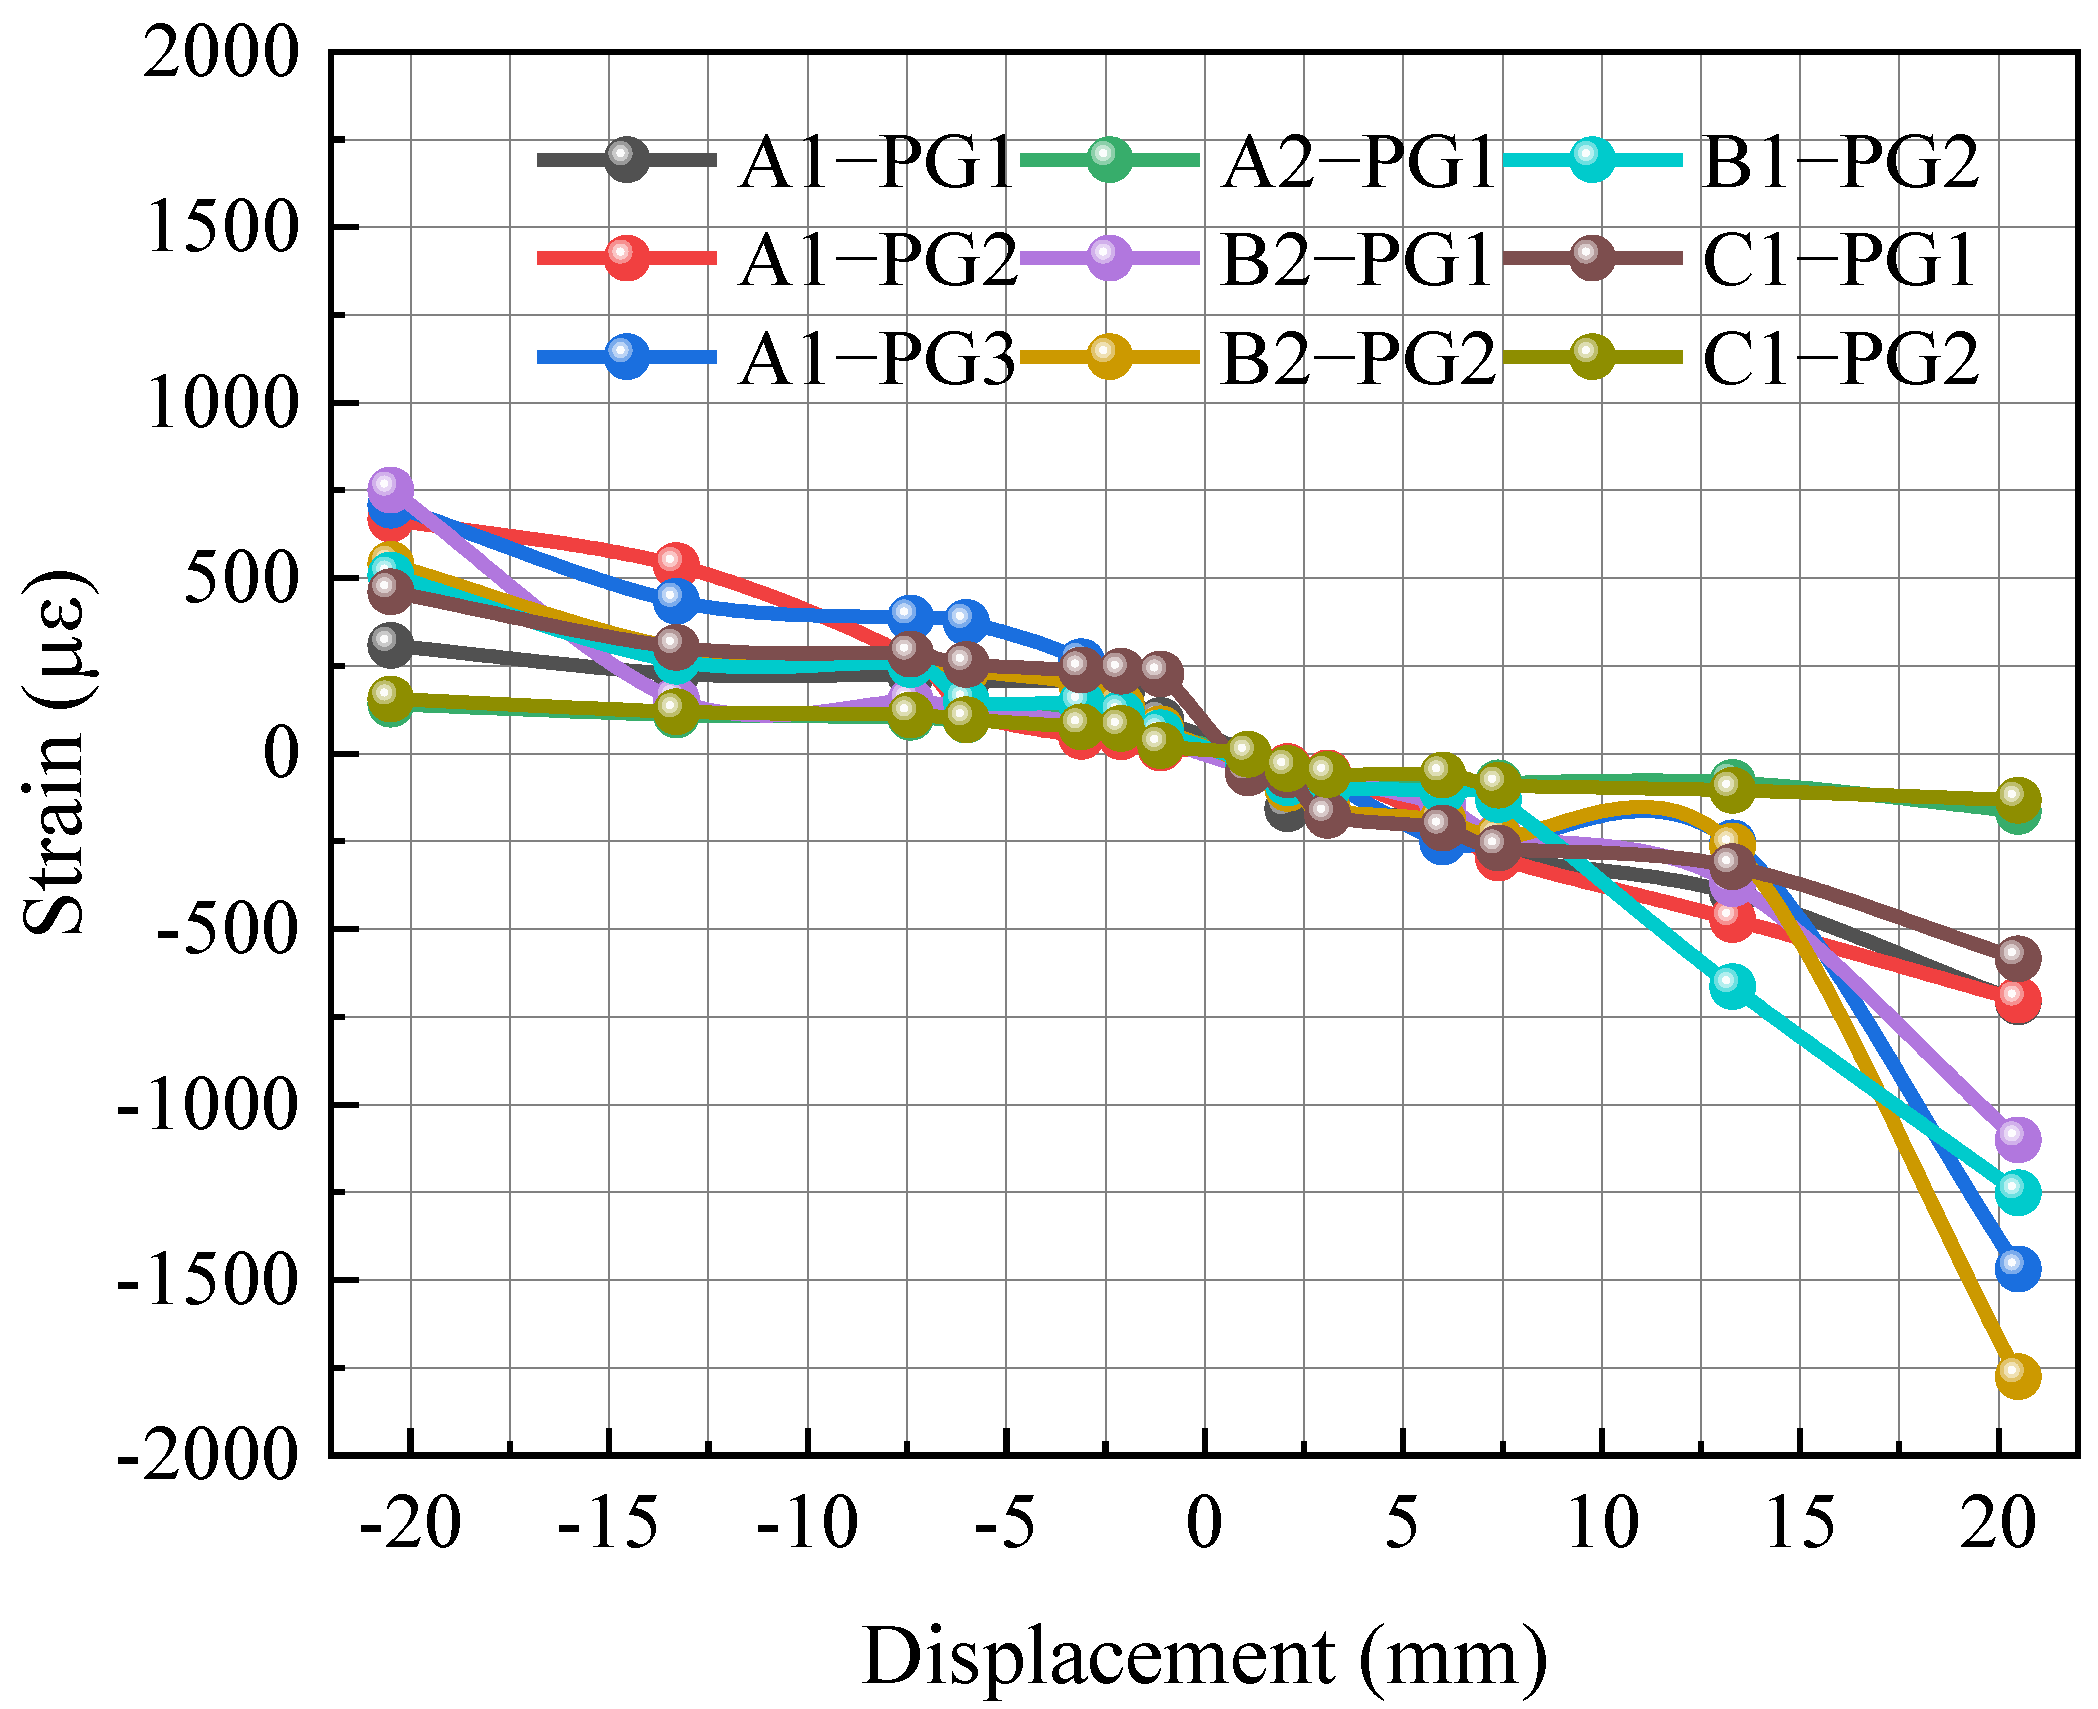
4.1. Strain Analysis of Frame Structure
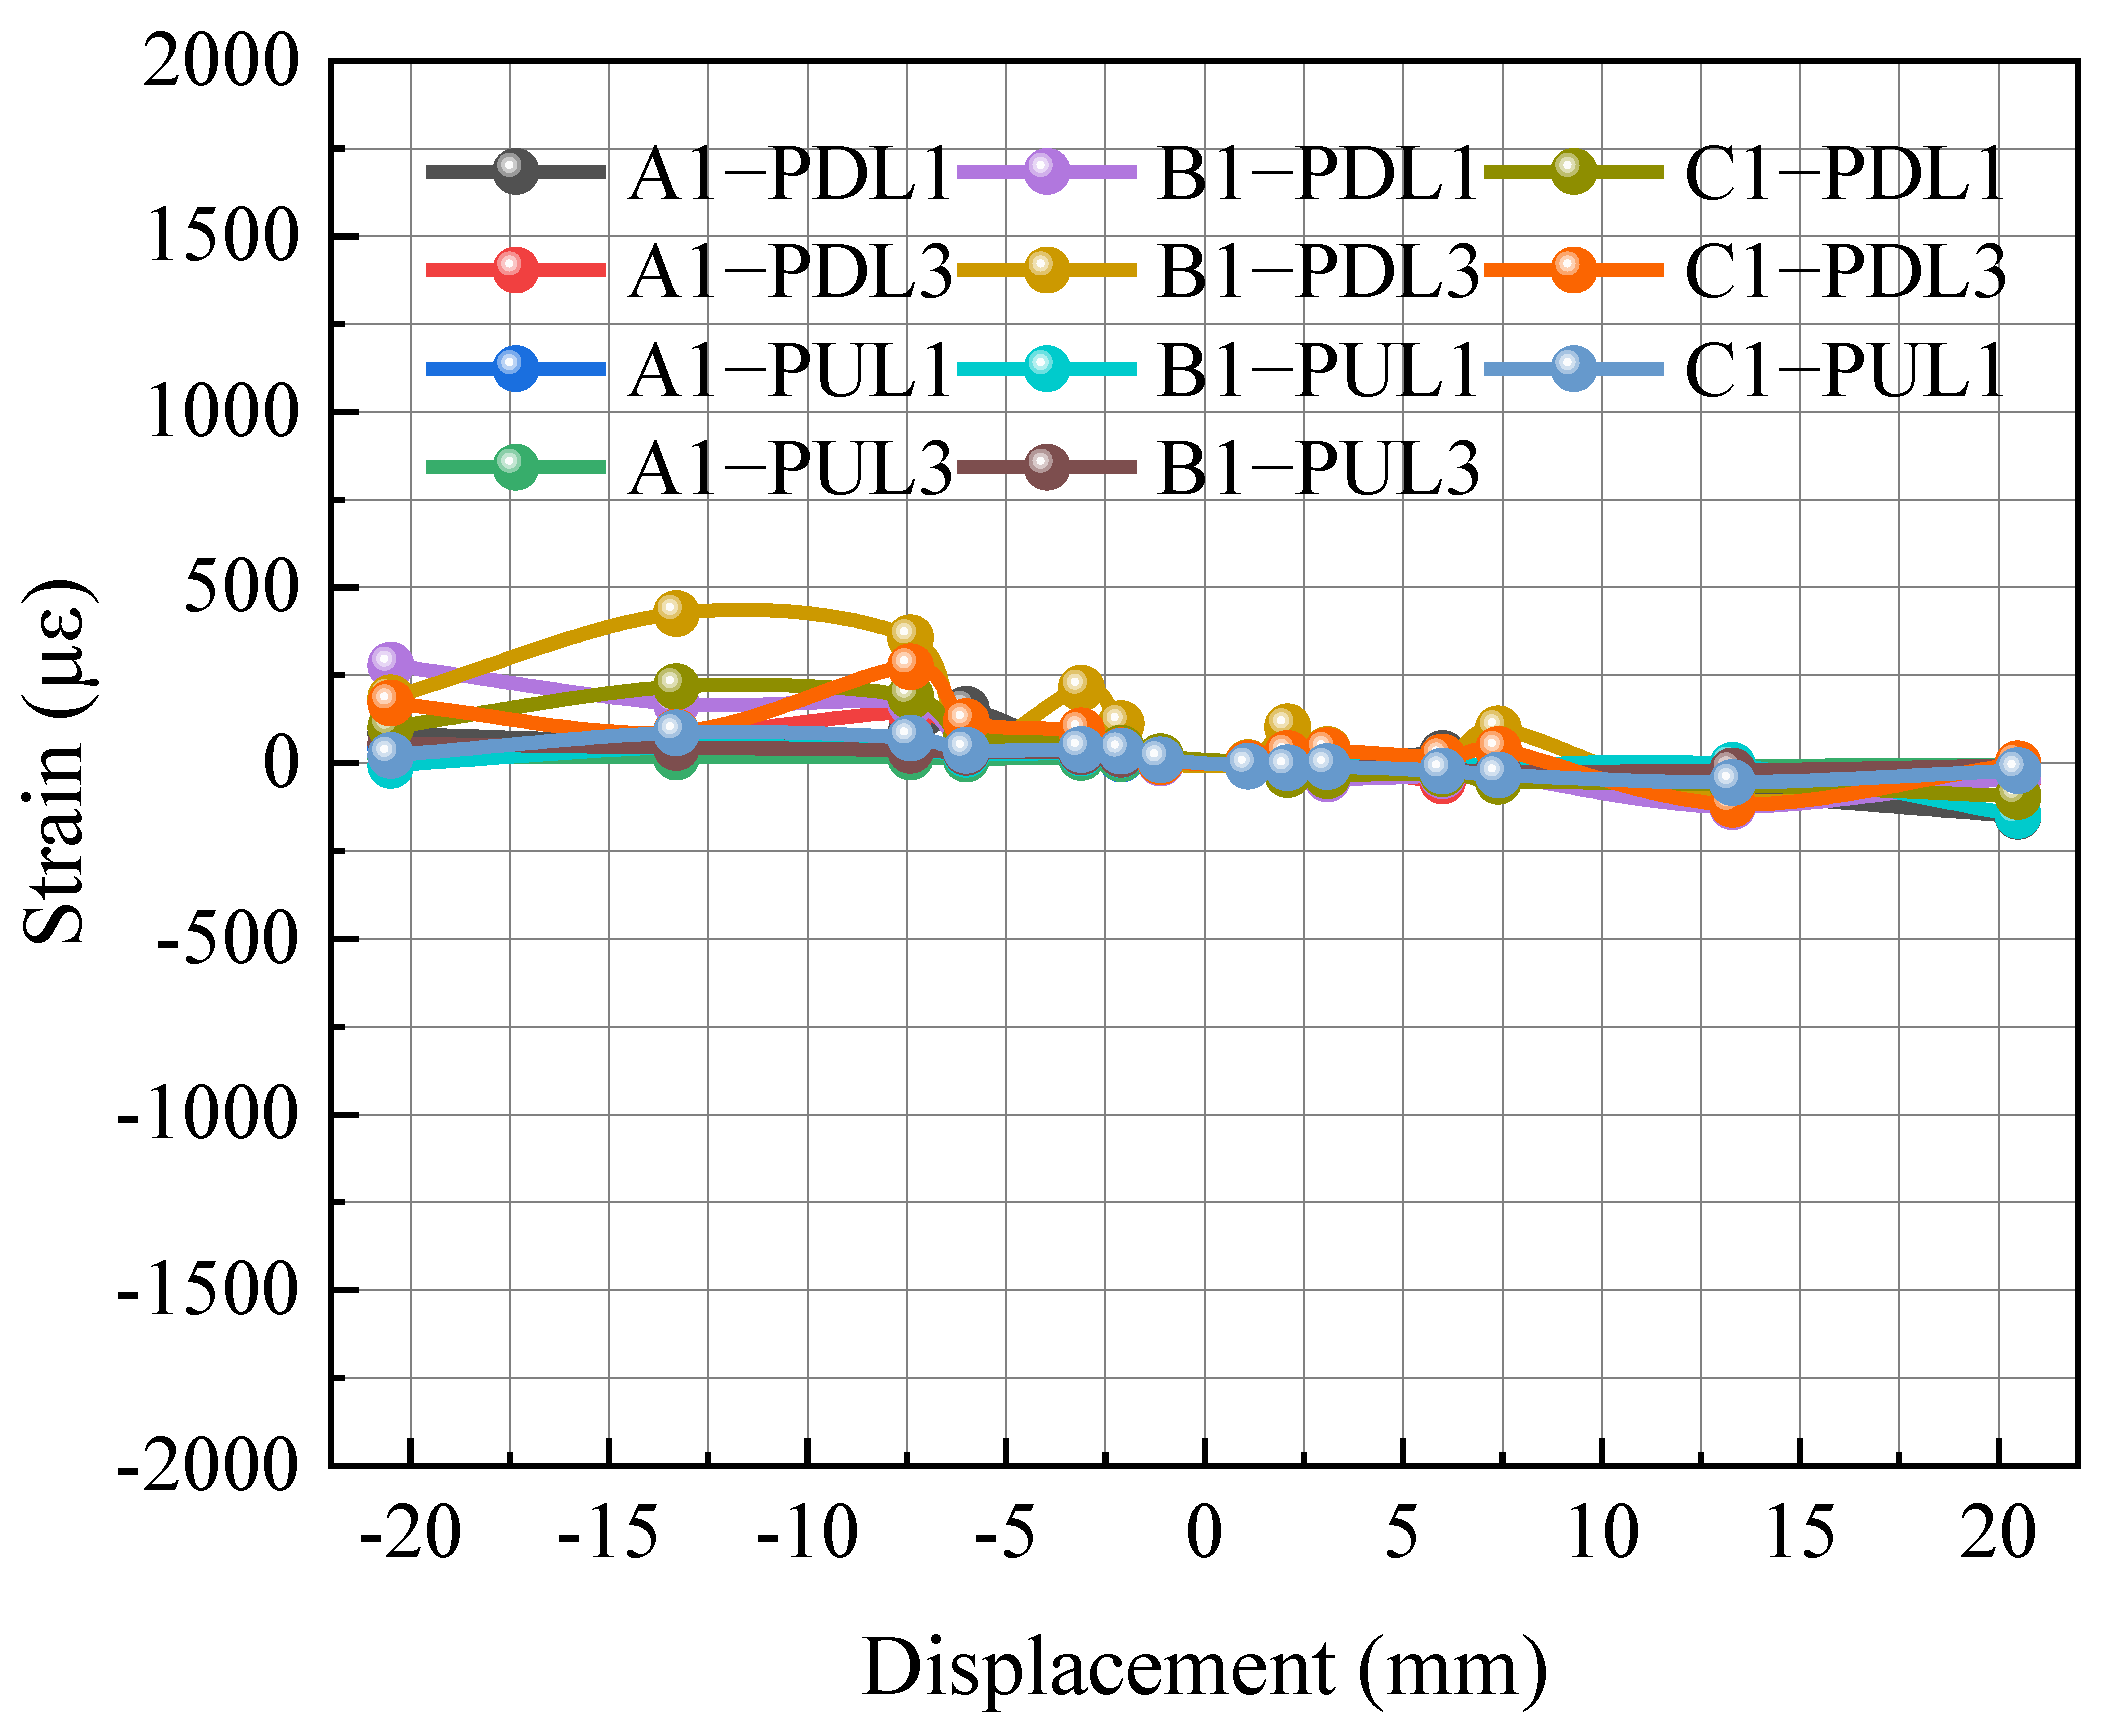
4.2. Strain Analysis of Transfer Slab
5. Experiment Analysis
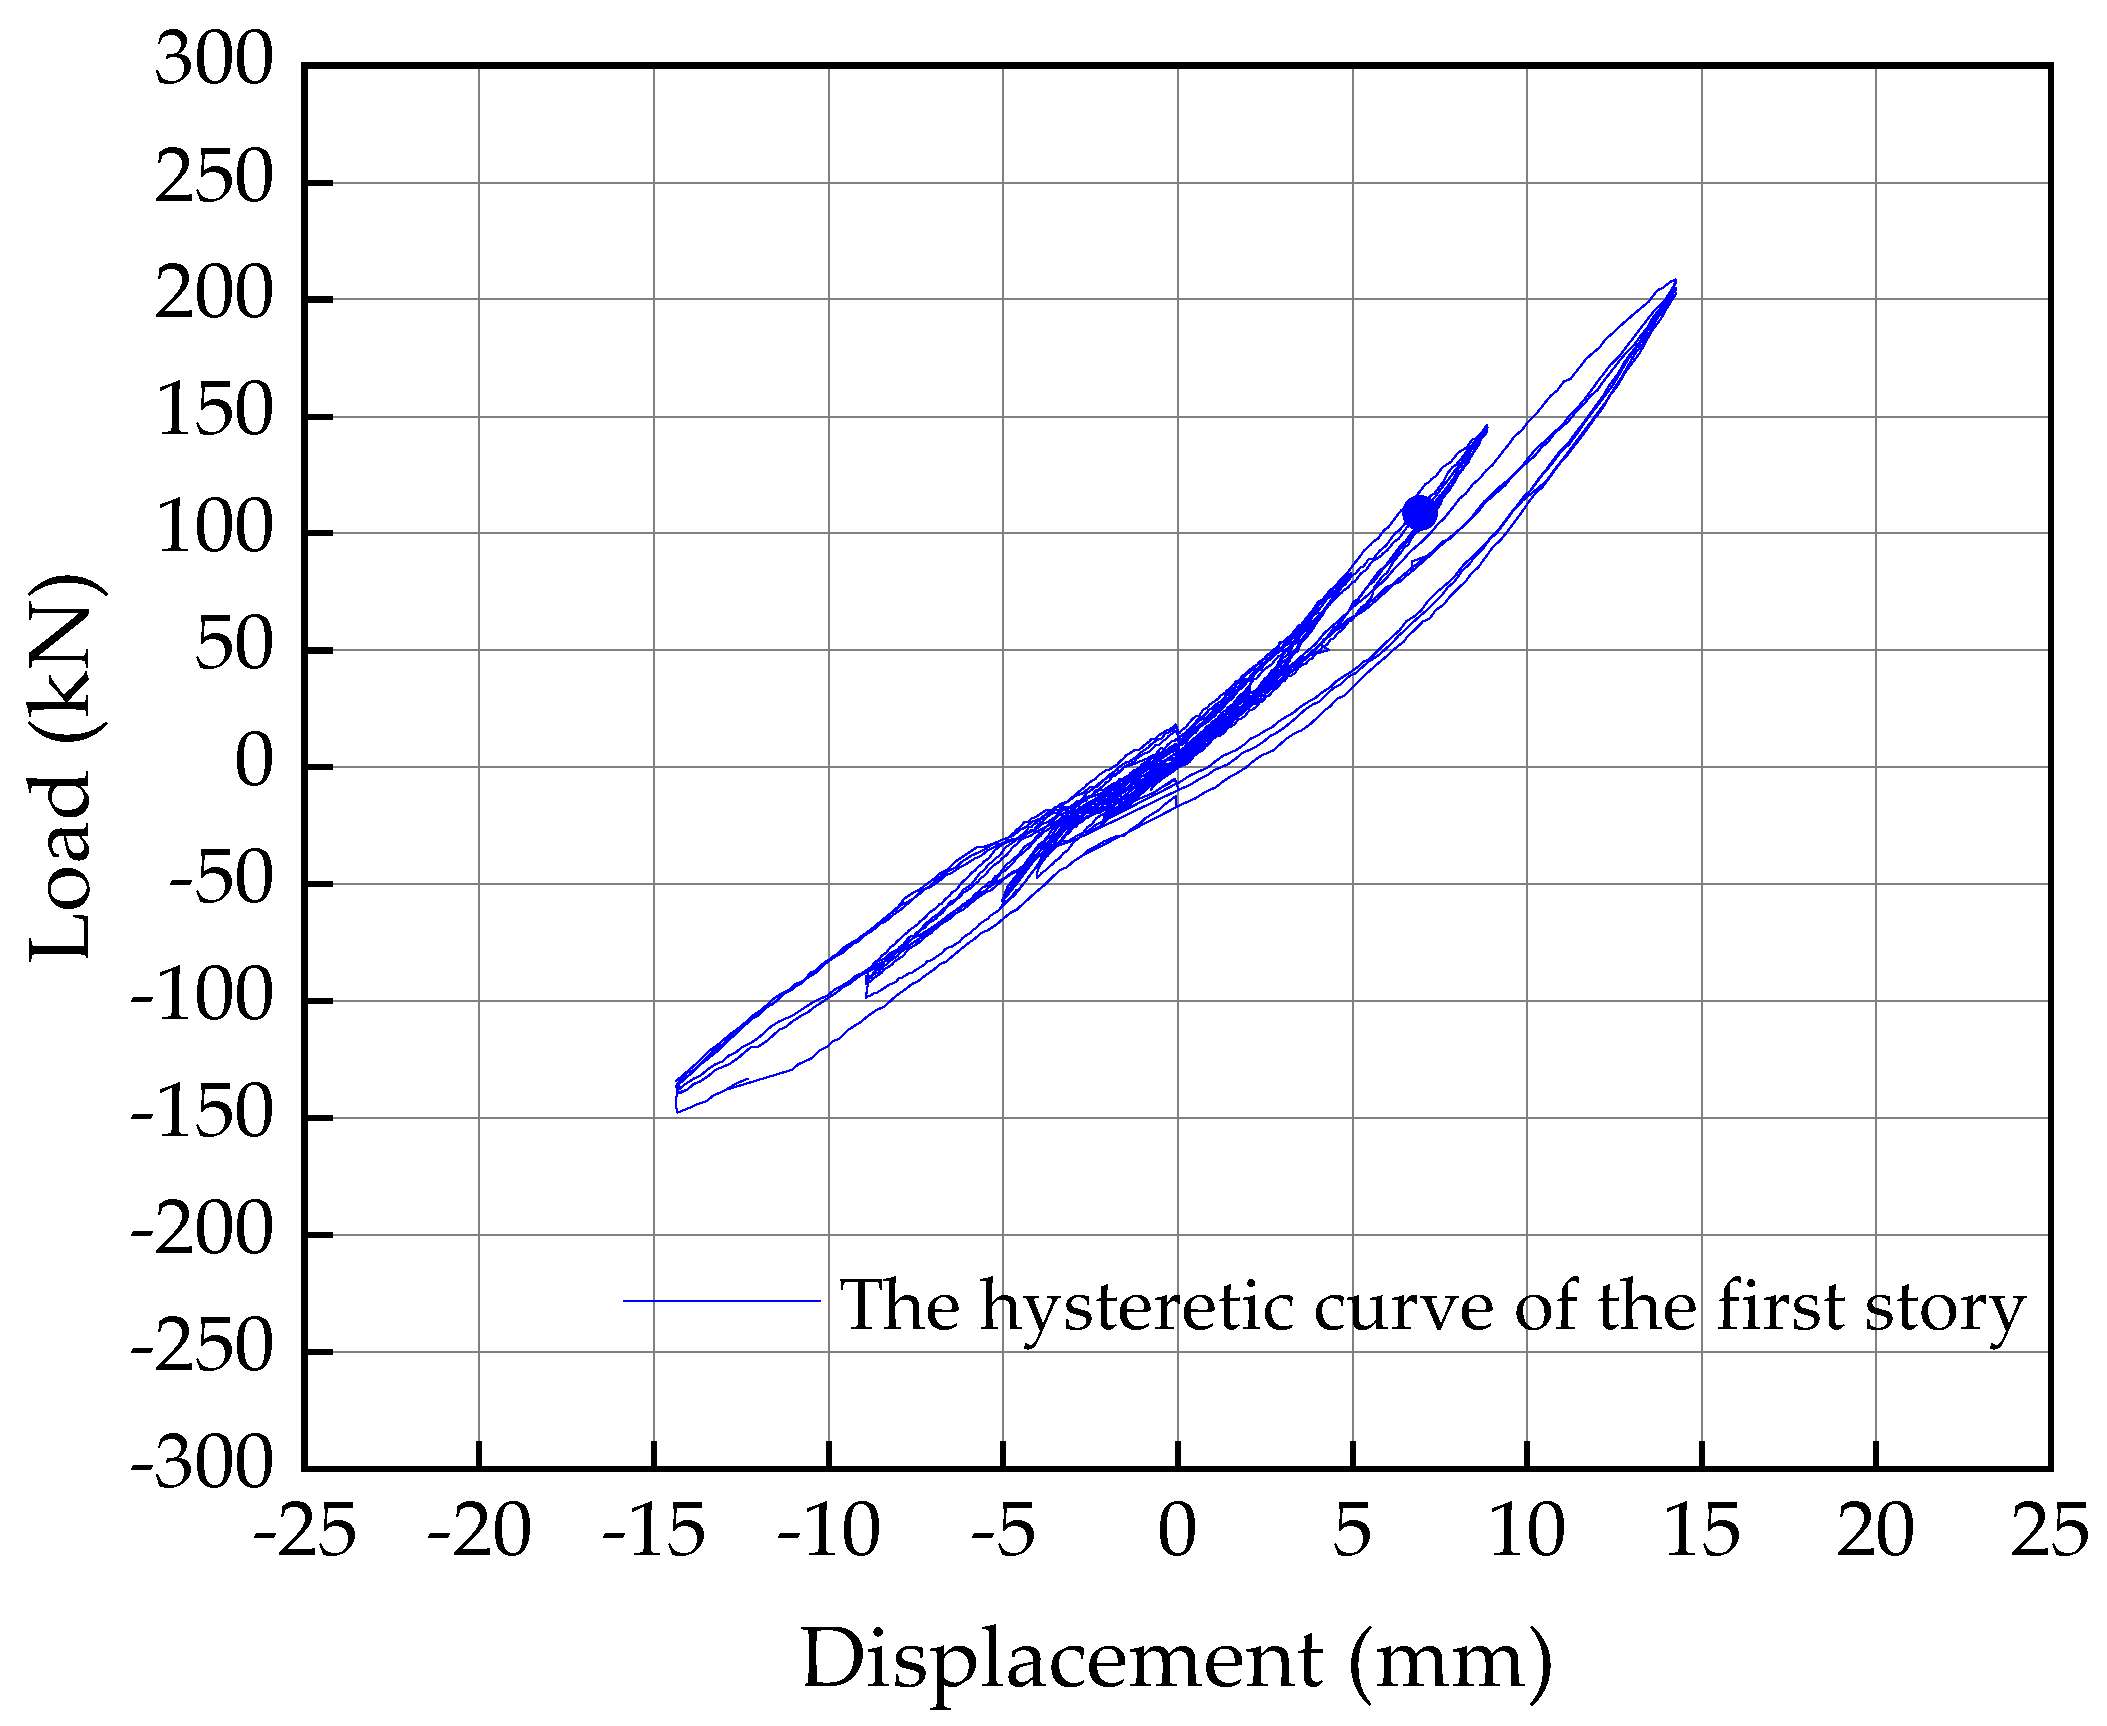
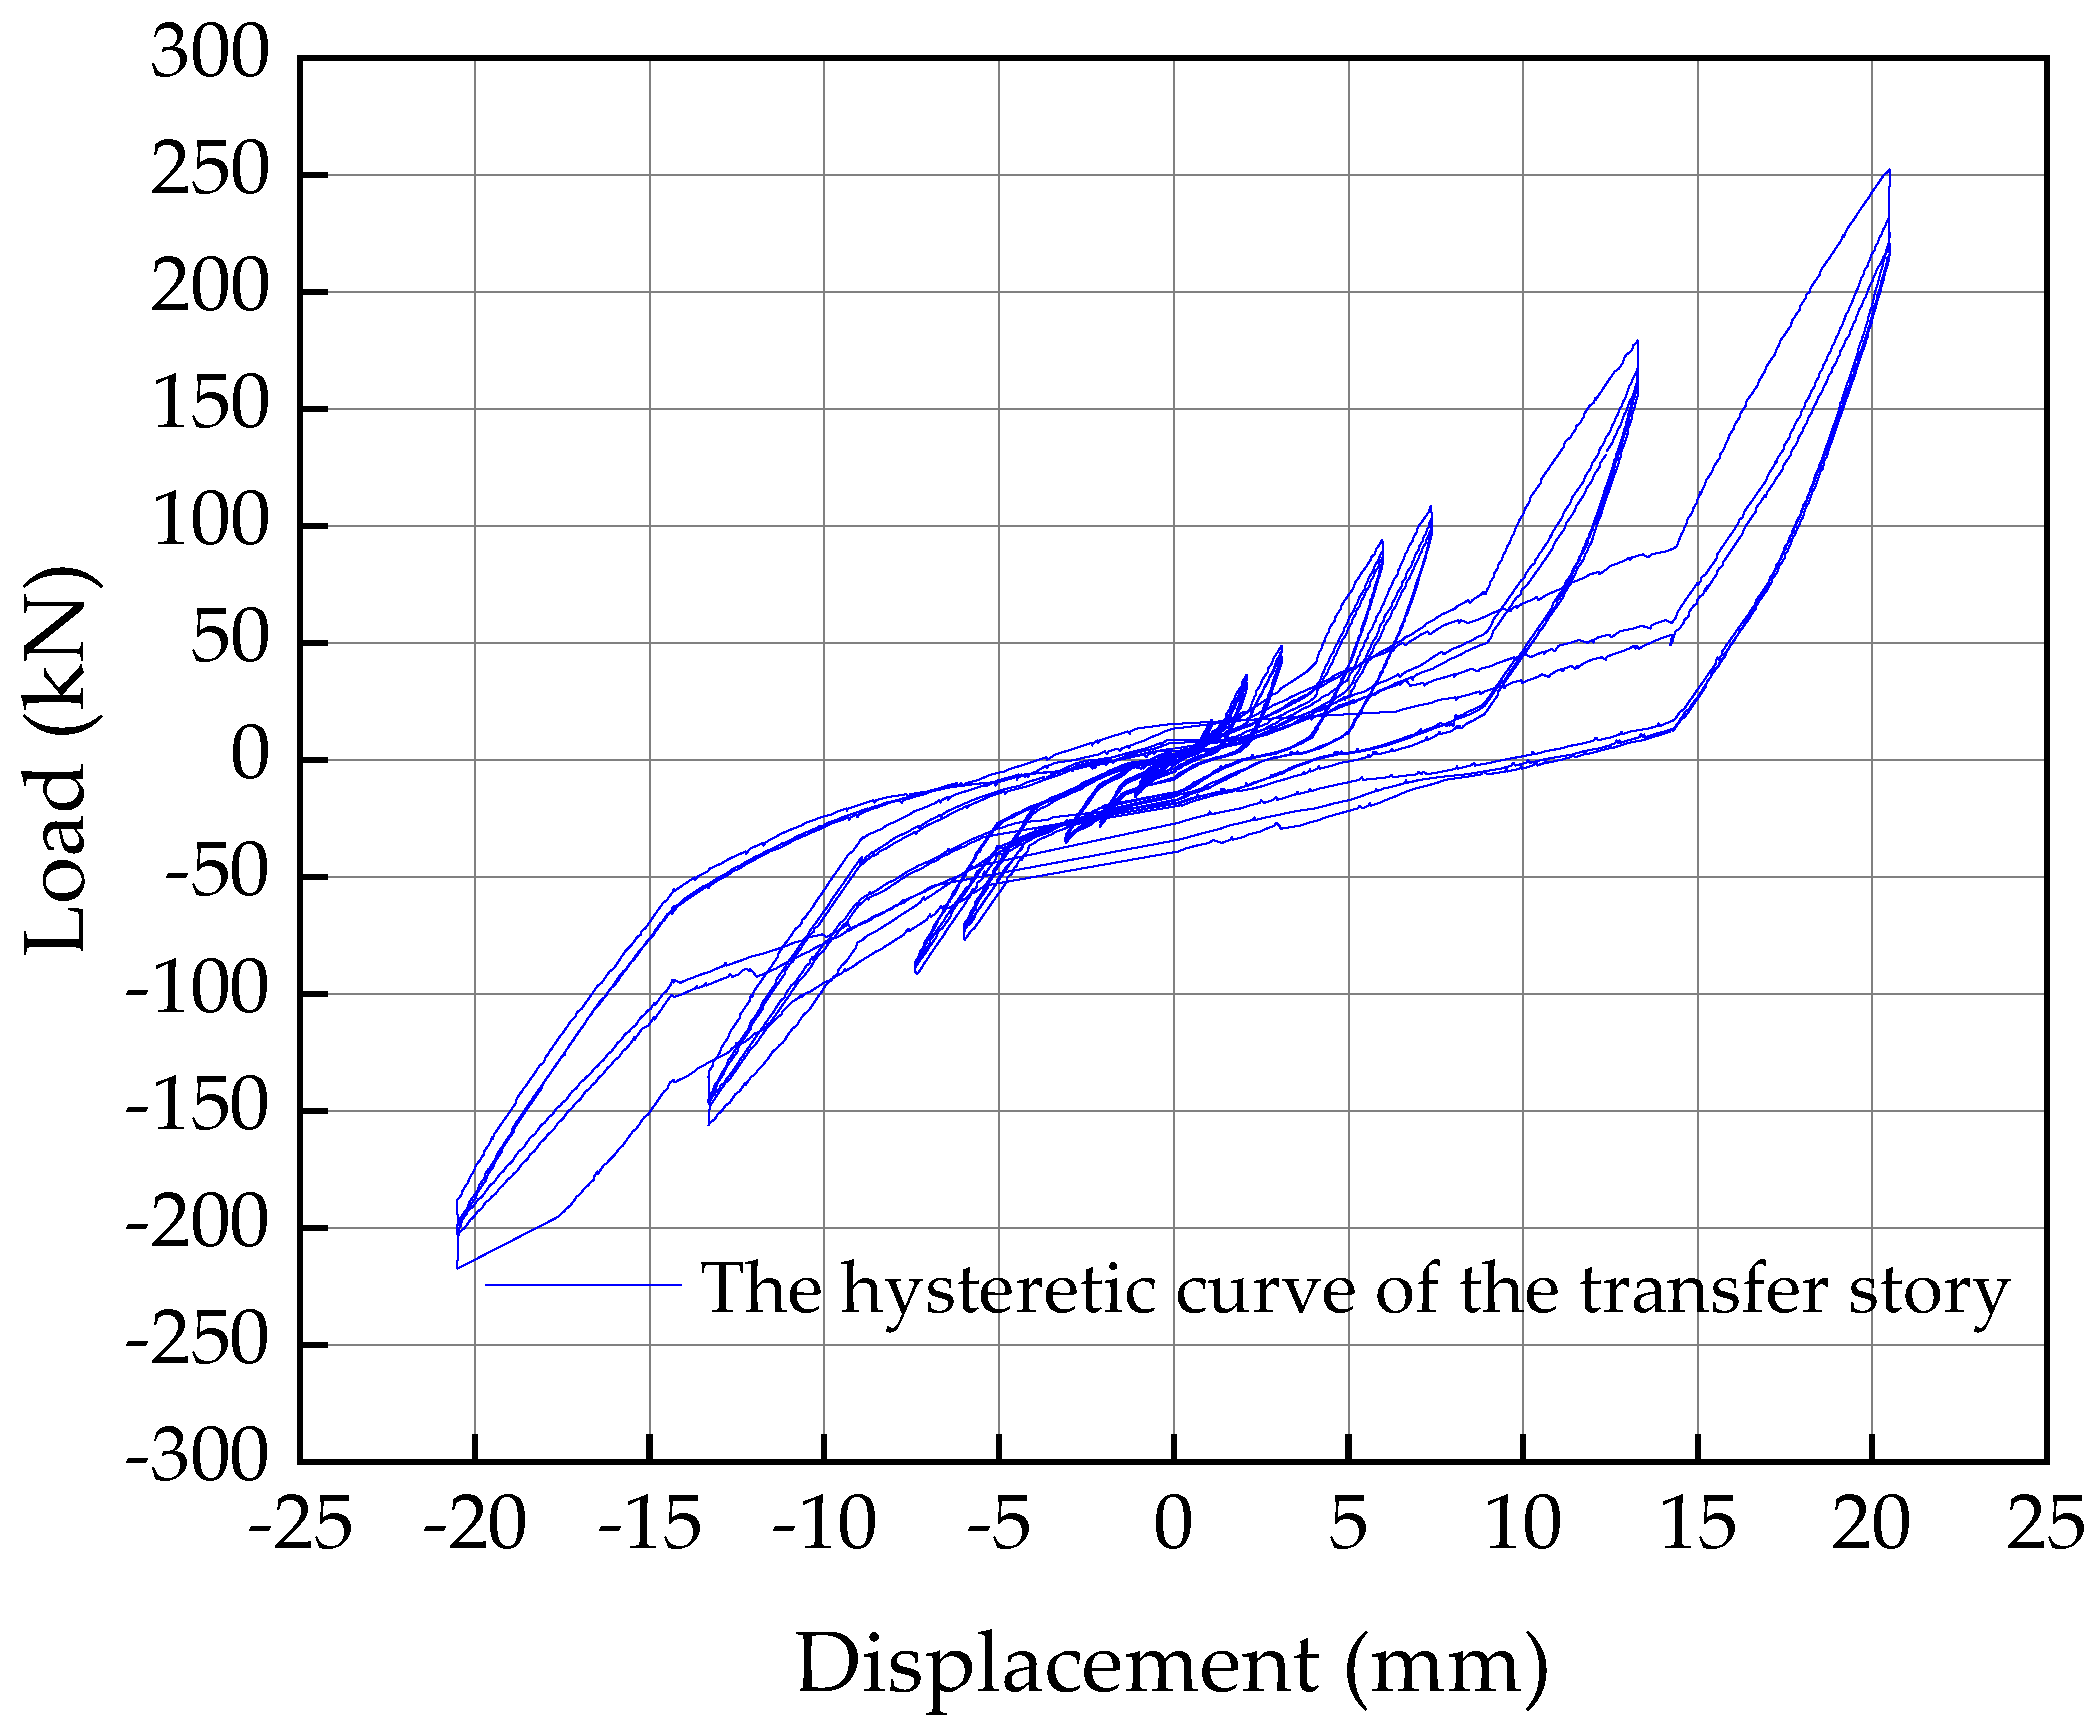
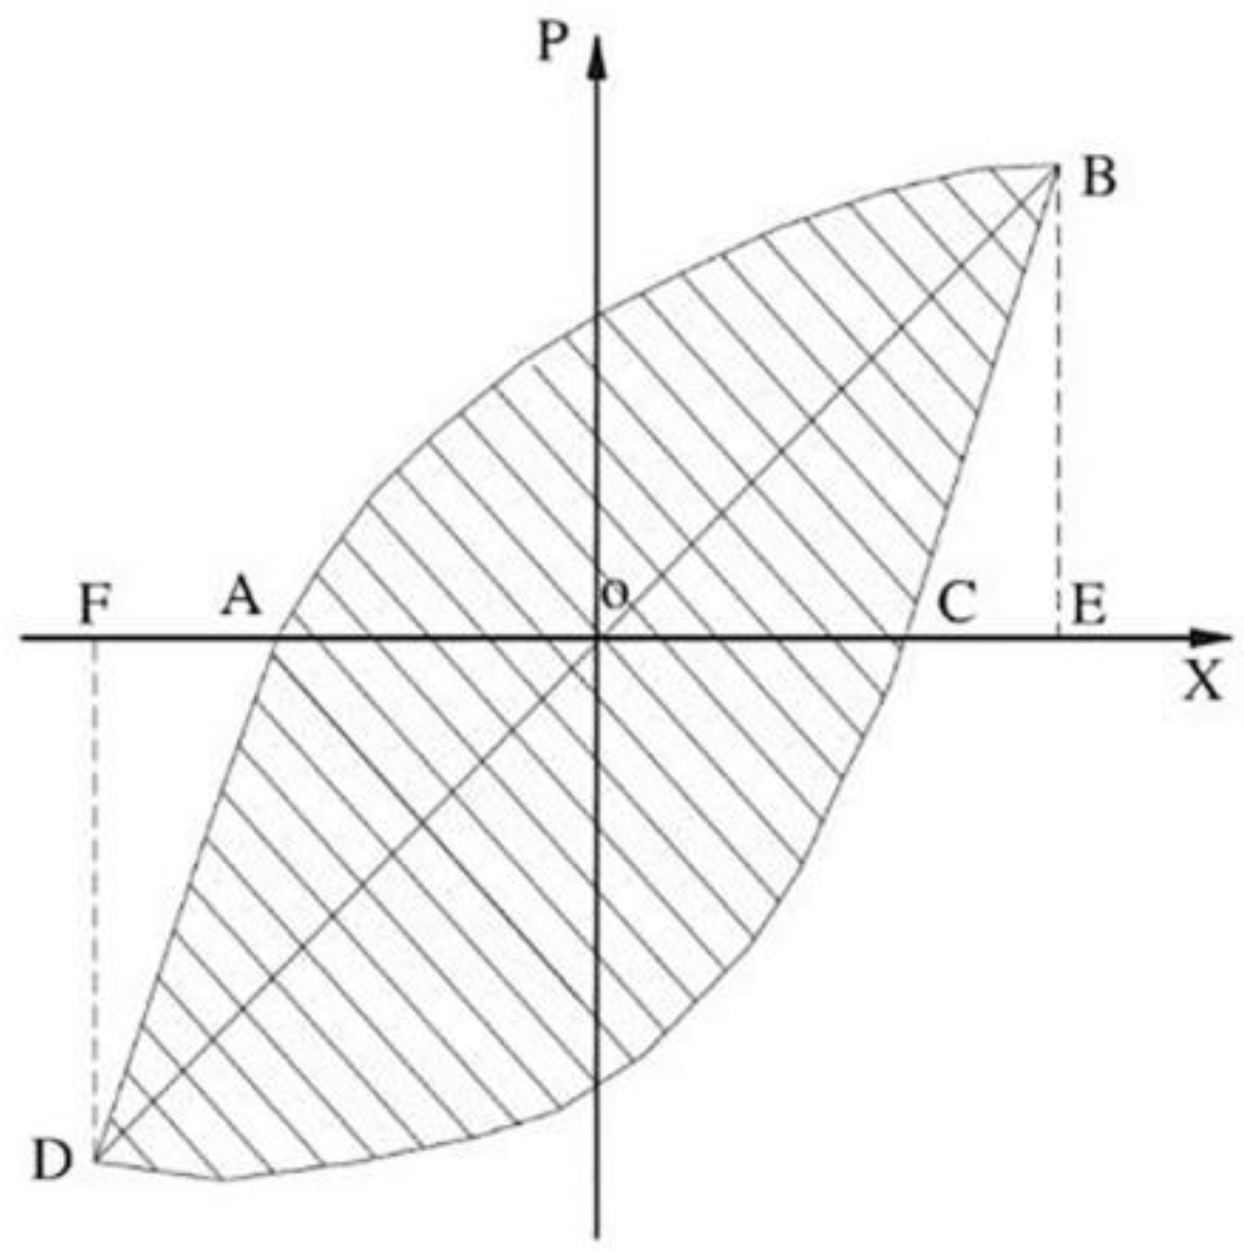
5.1. Hysteretic Performance
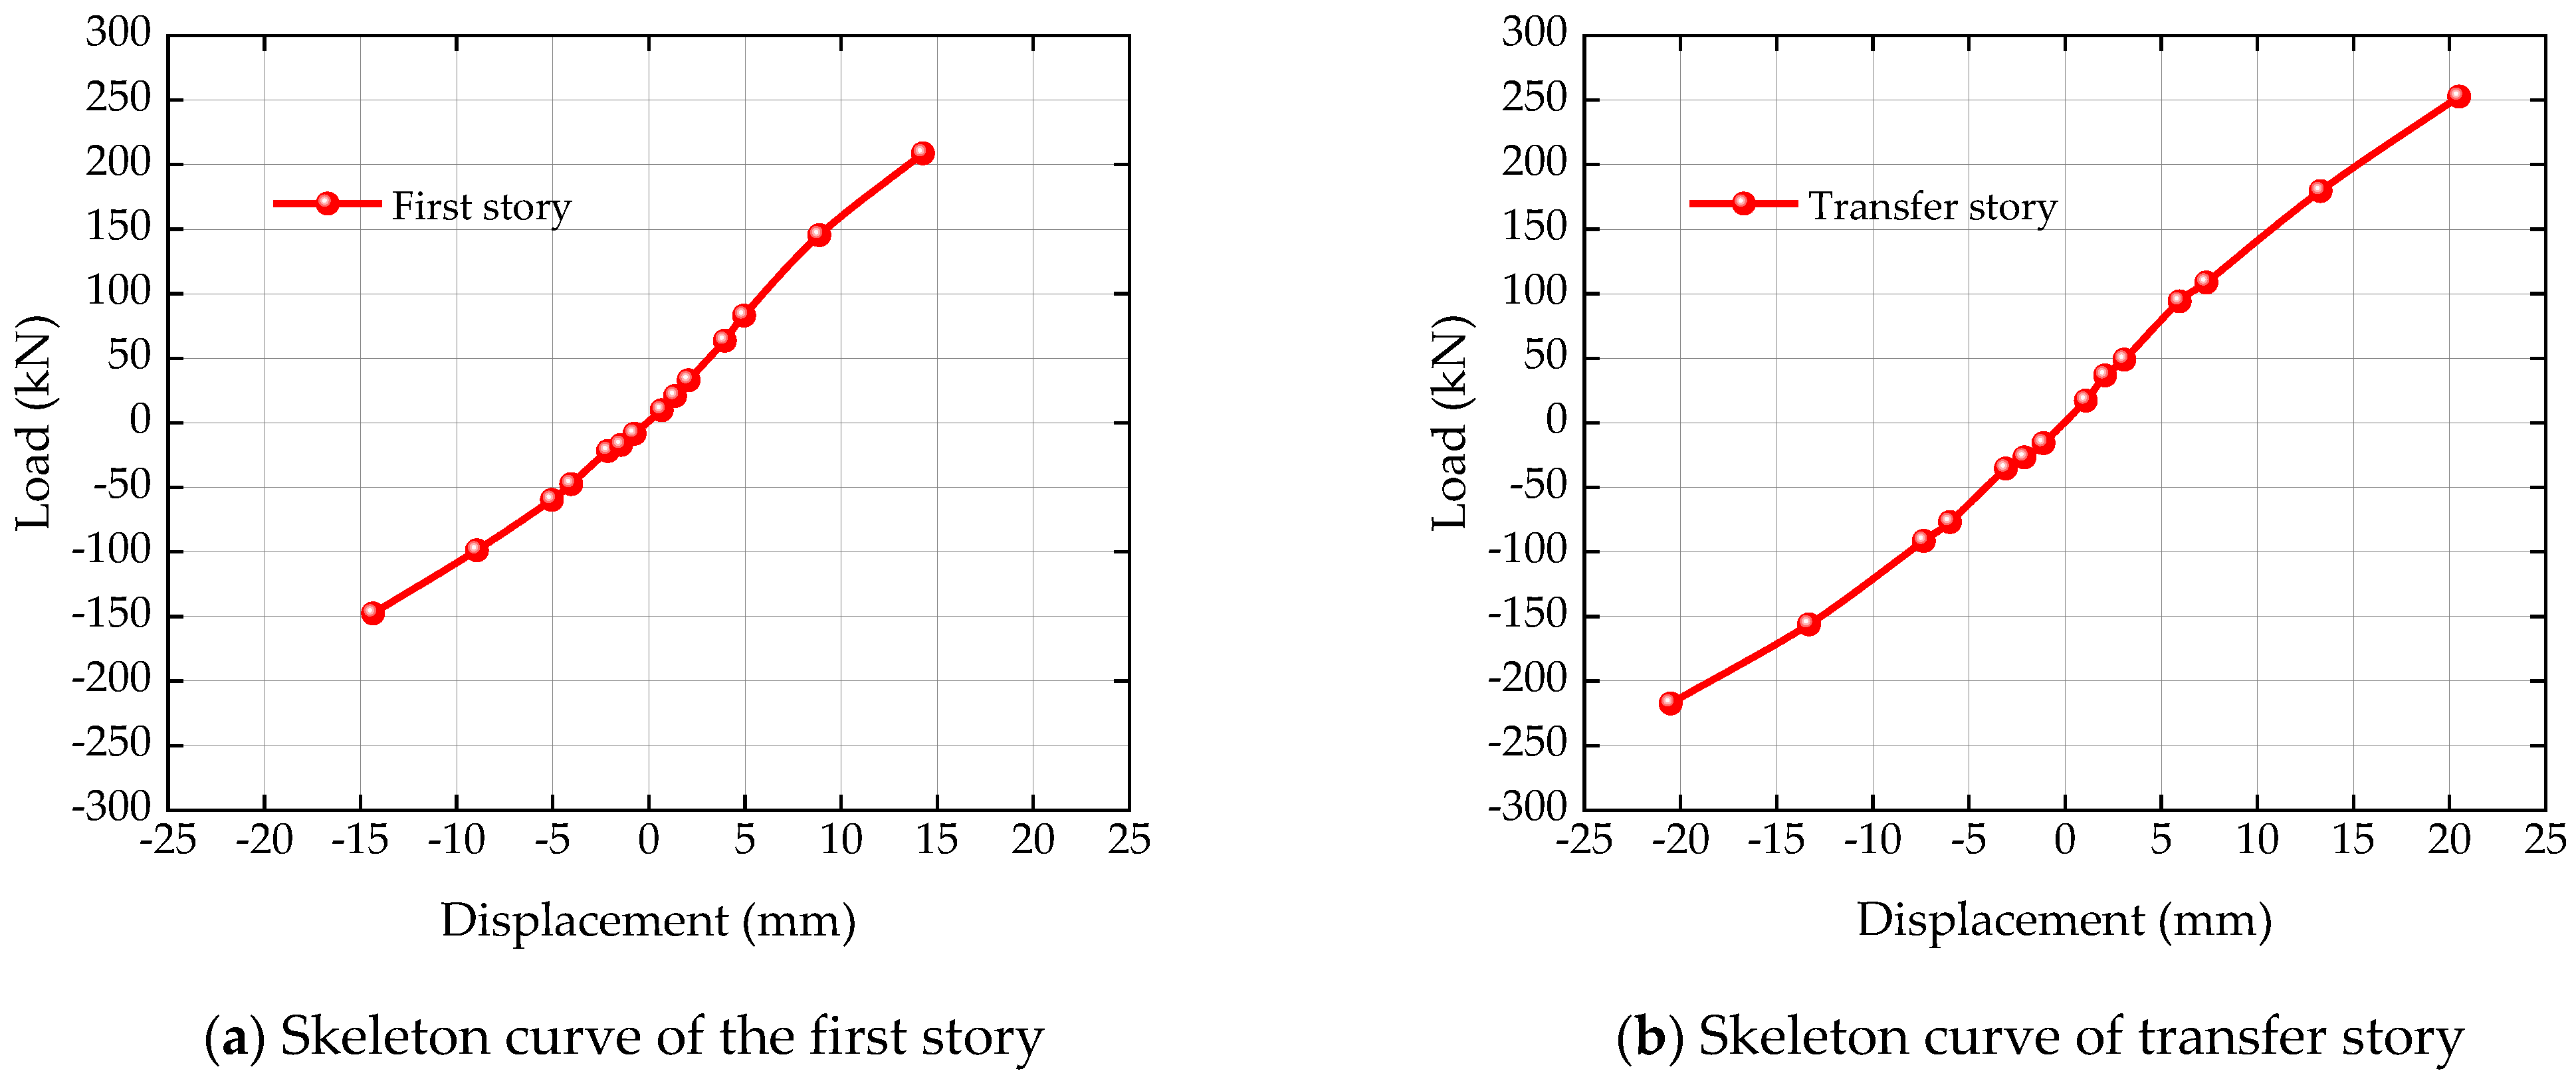
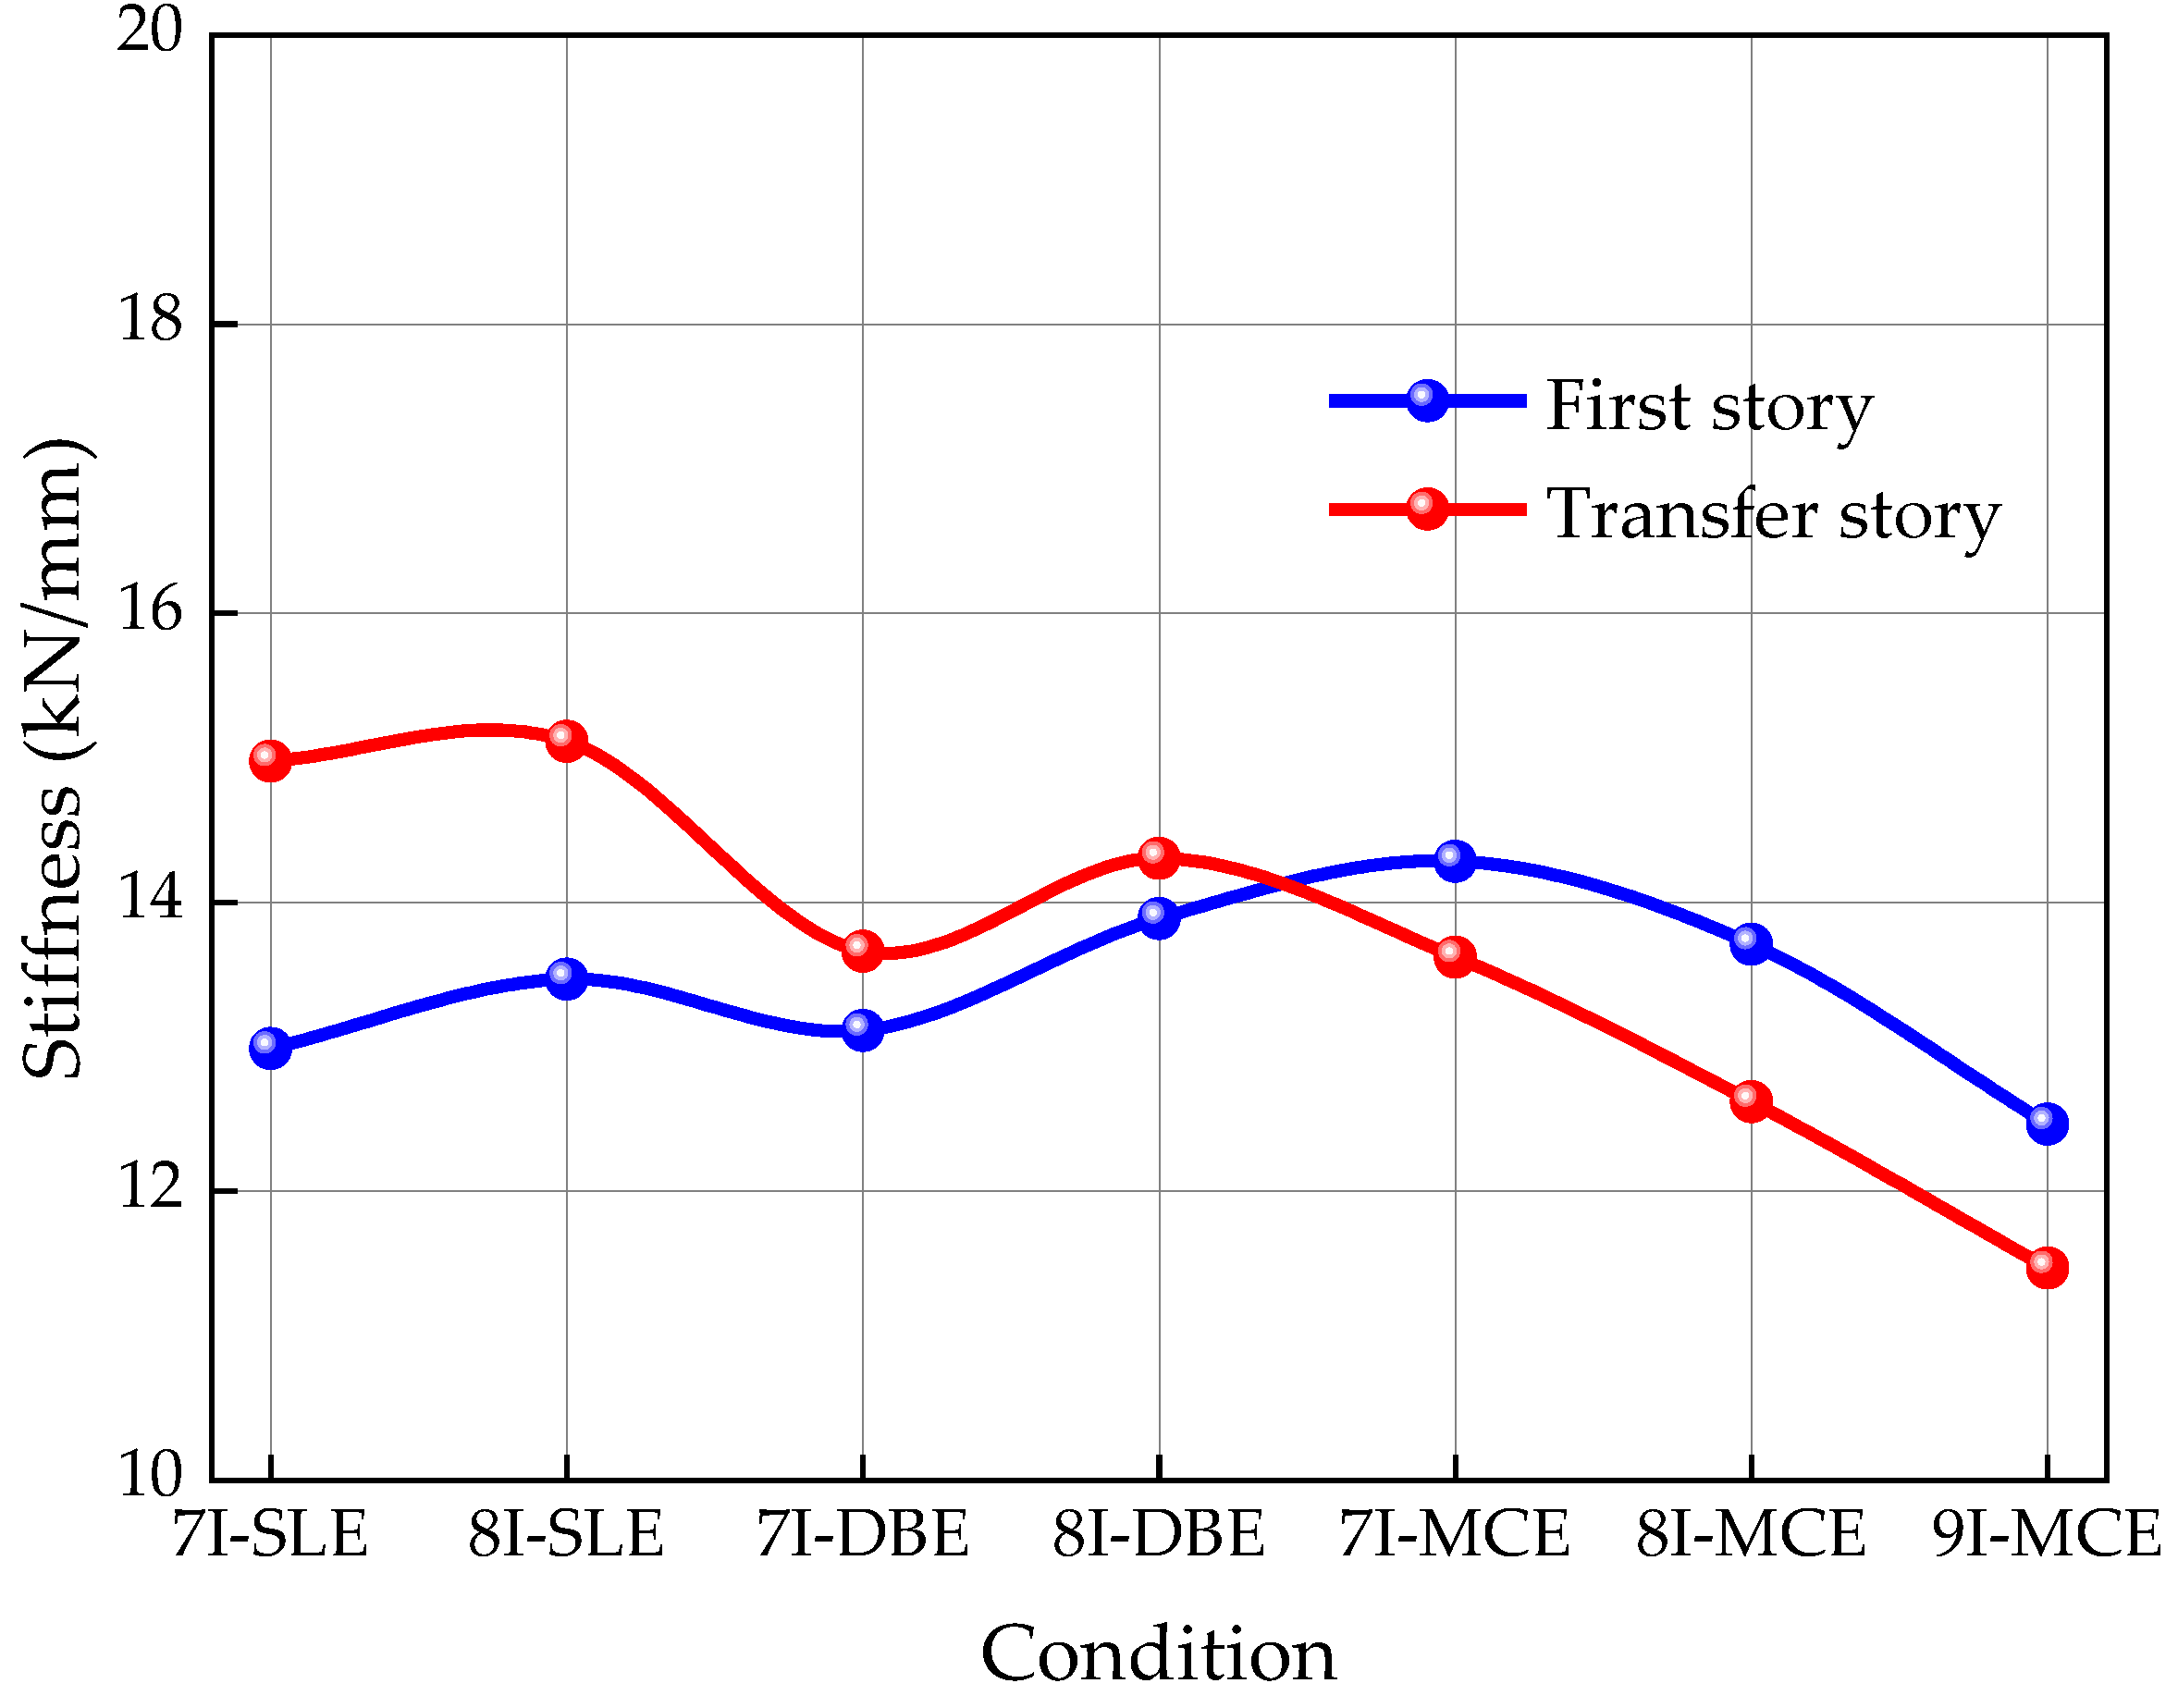
5.2. Skeleton Curve and Secant Stiffness
6. Conclusions
- The structural safety performance meets the seismic requirements of the MCE.
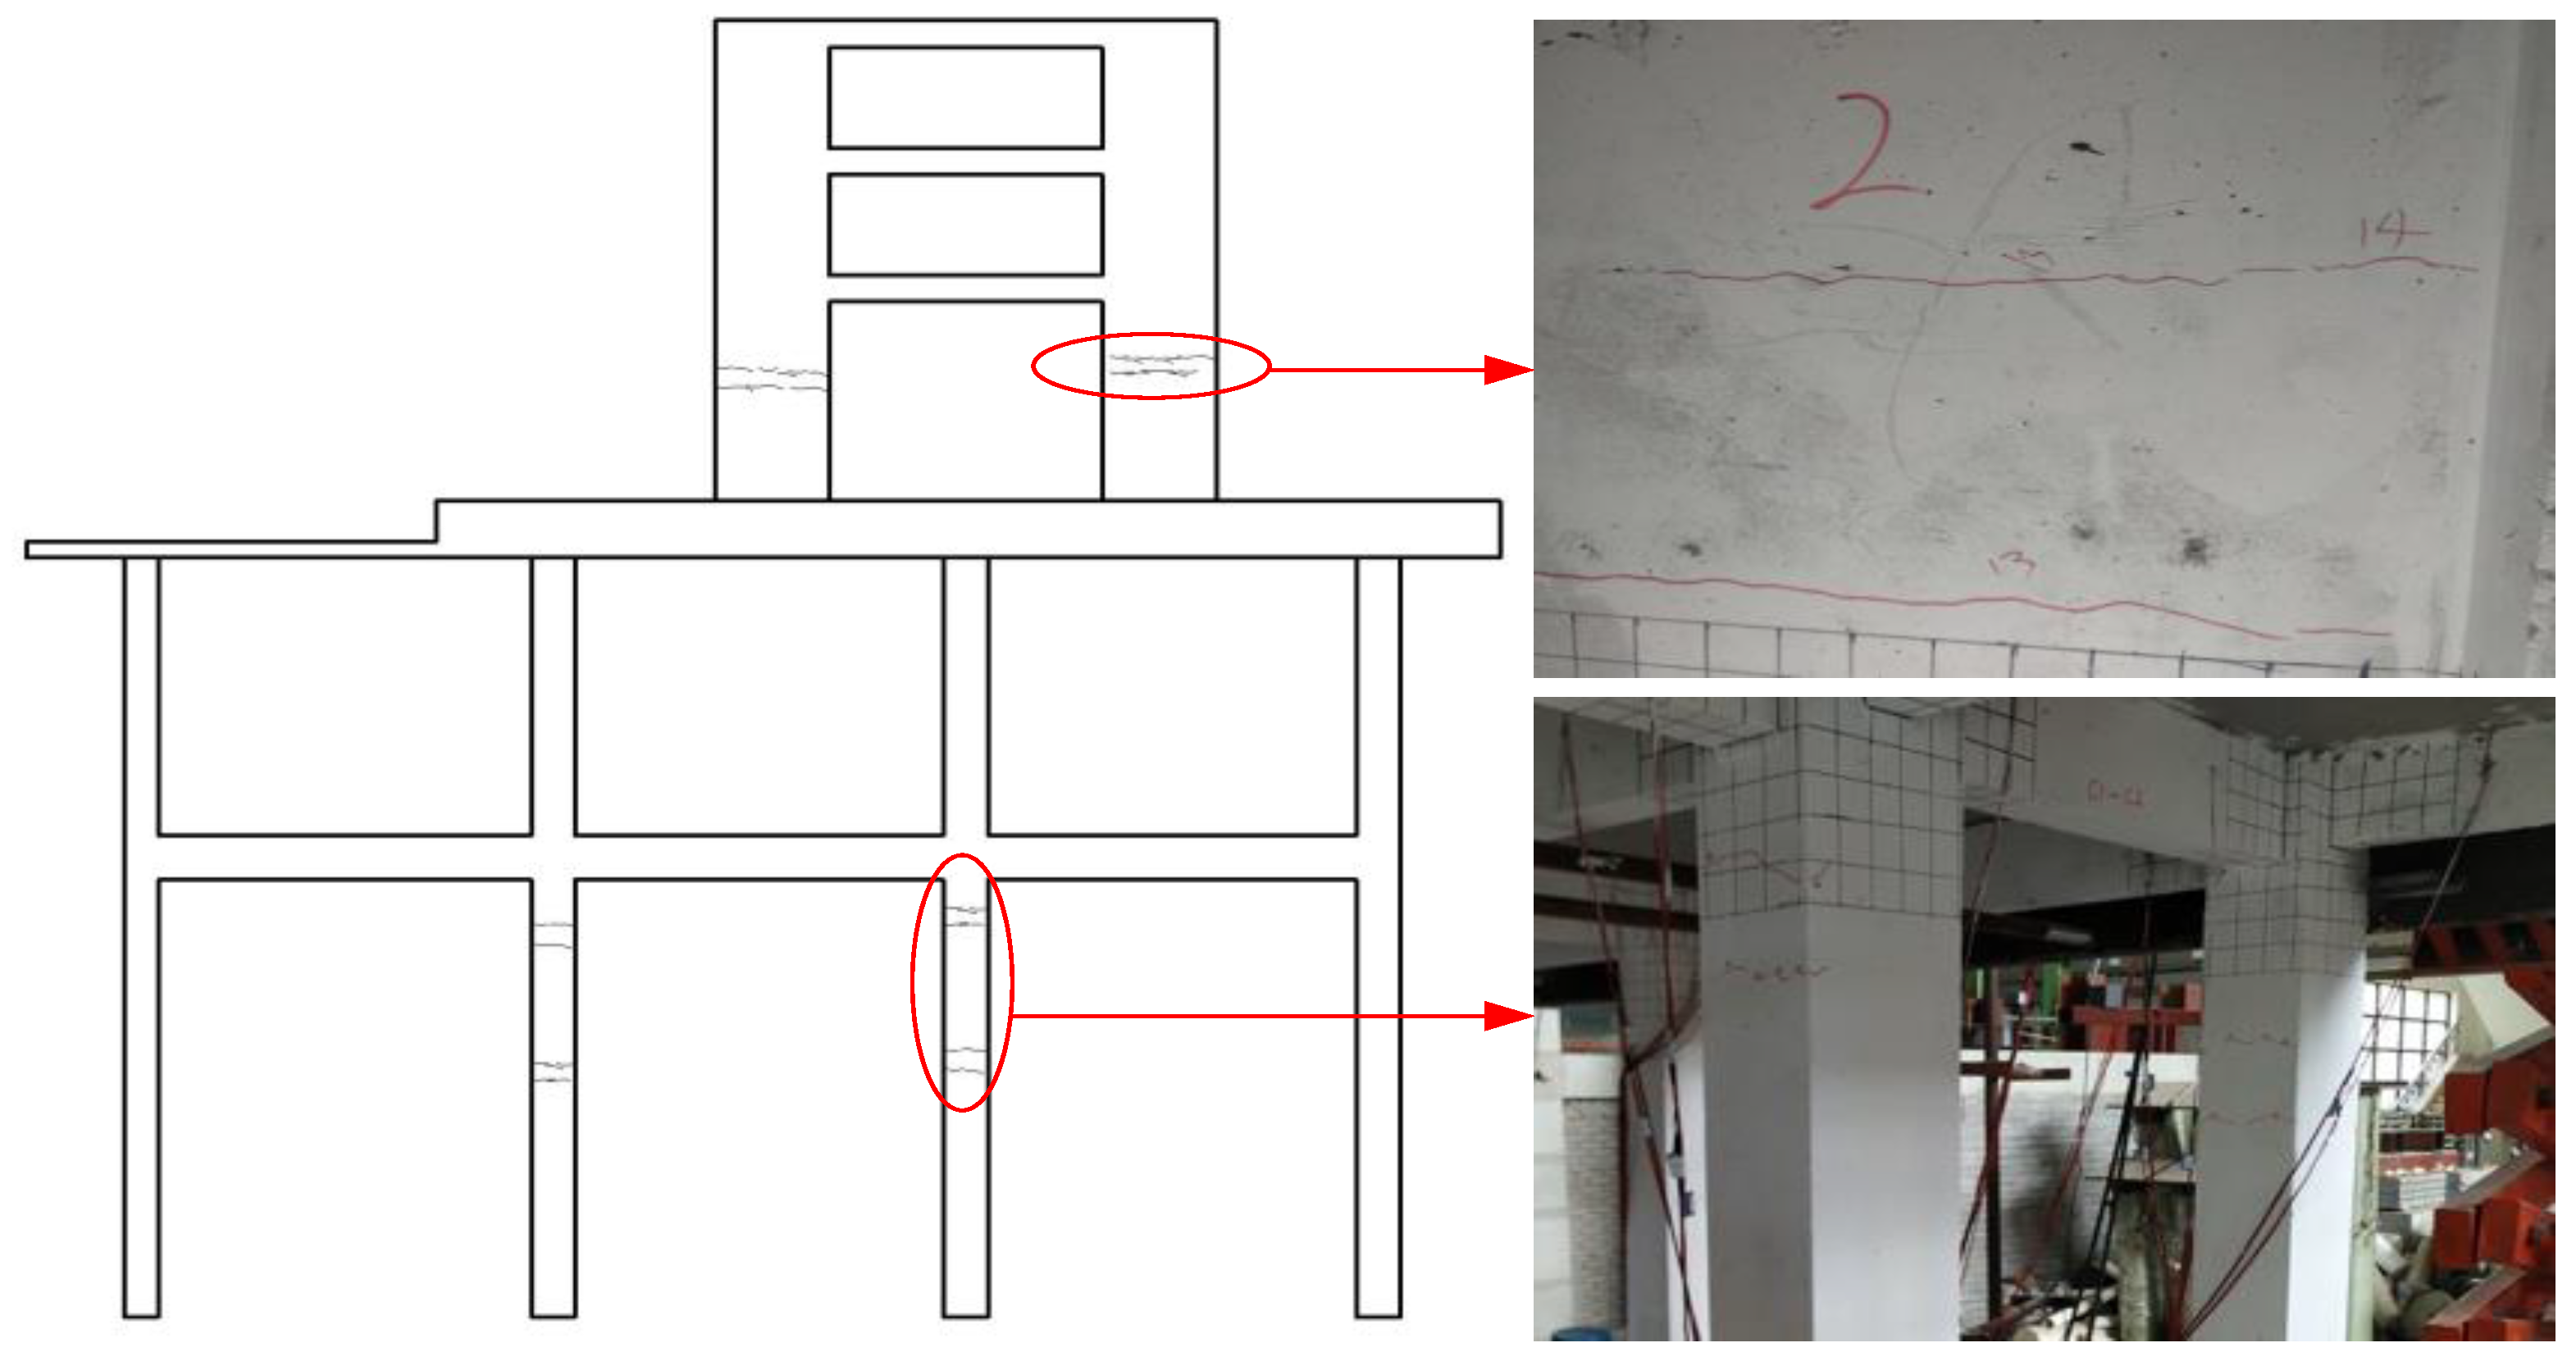
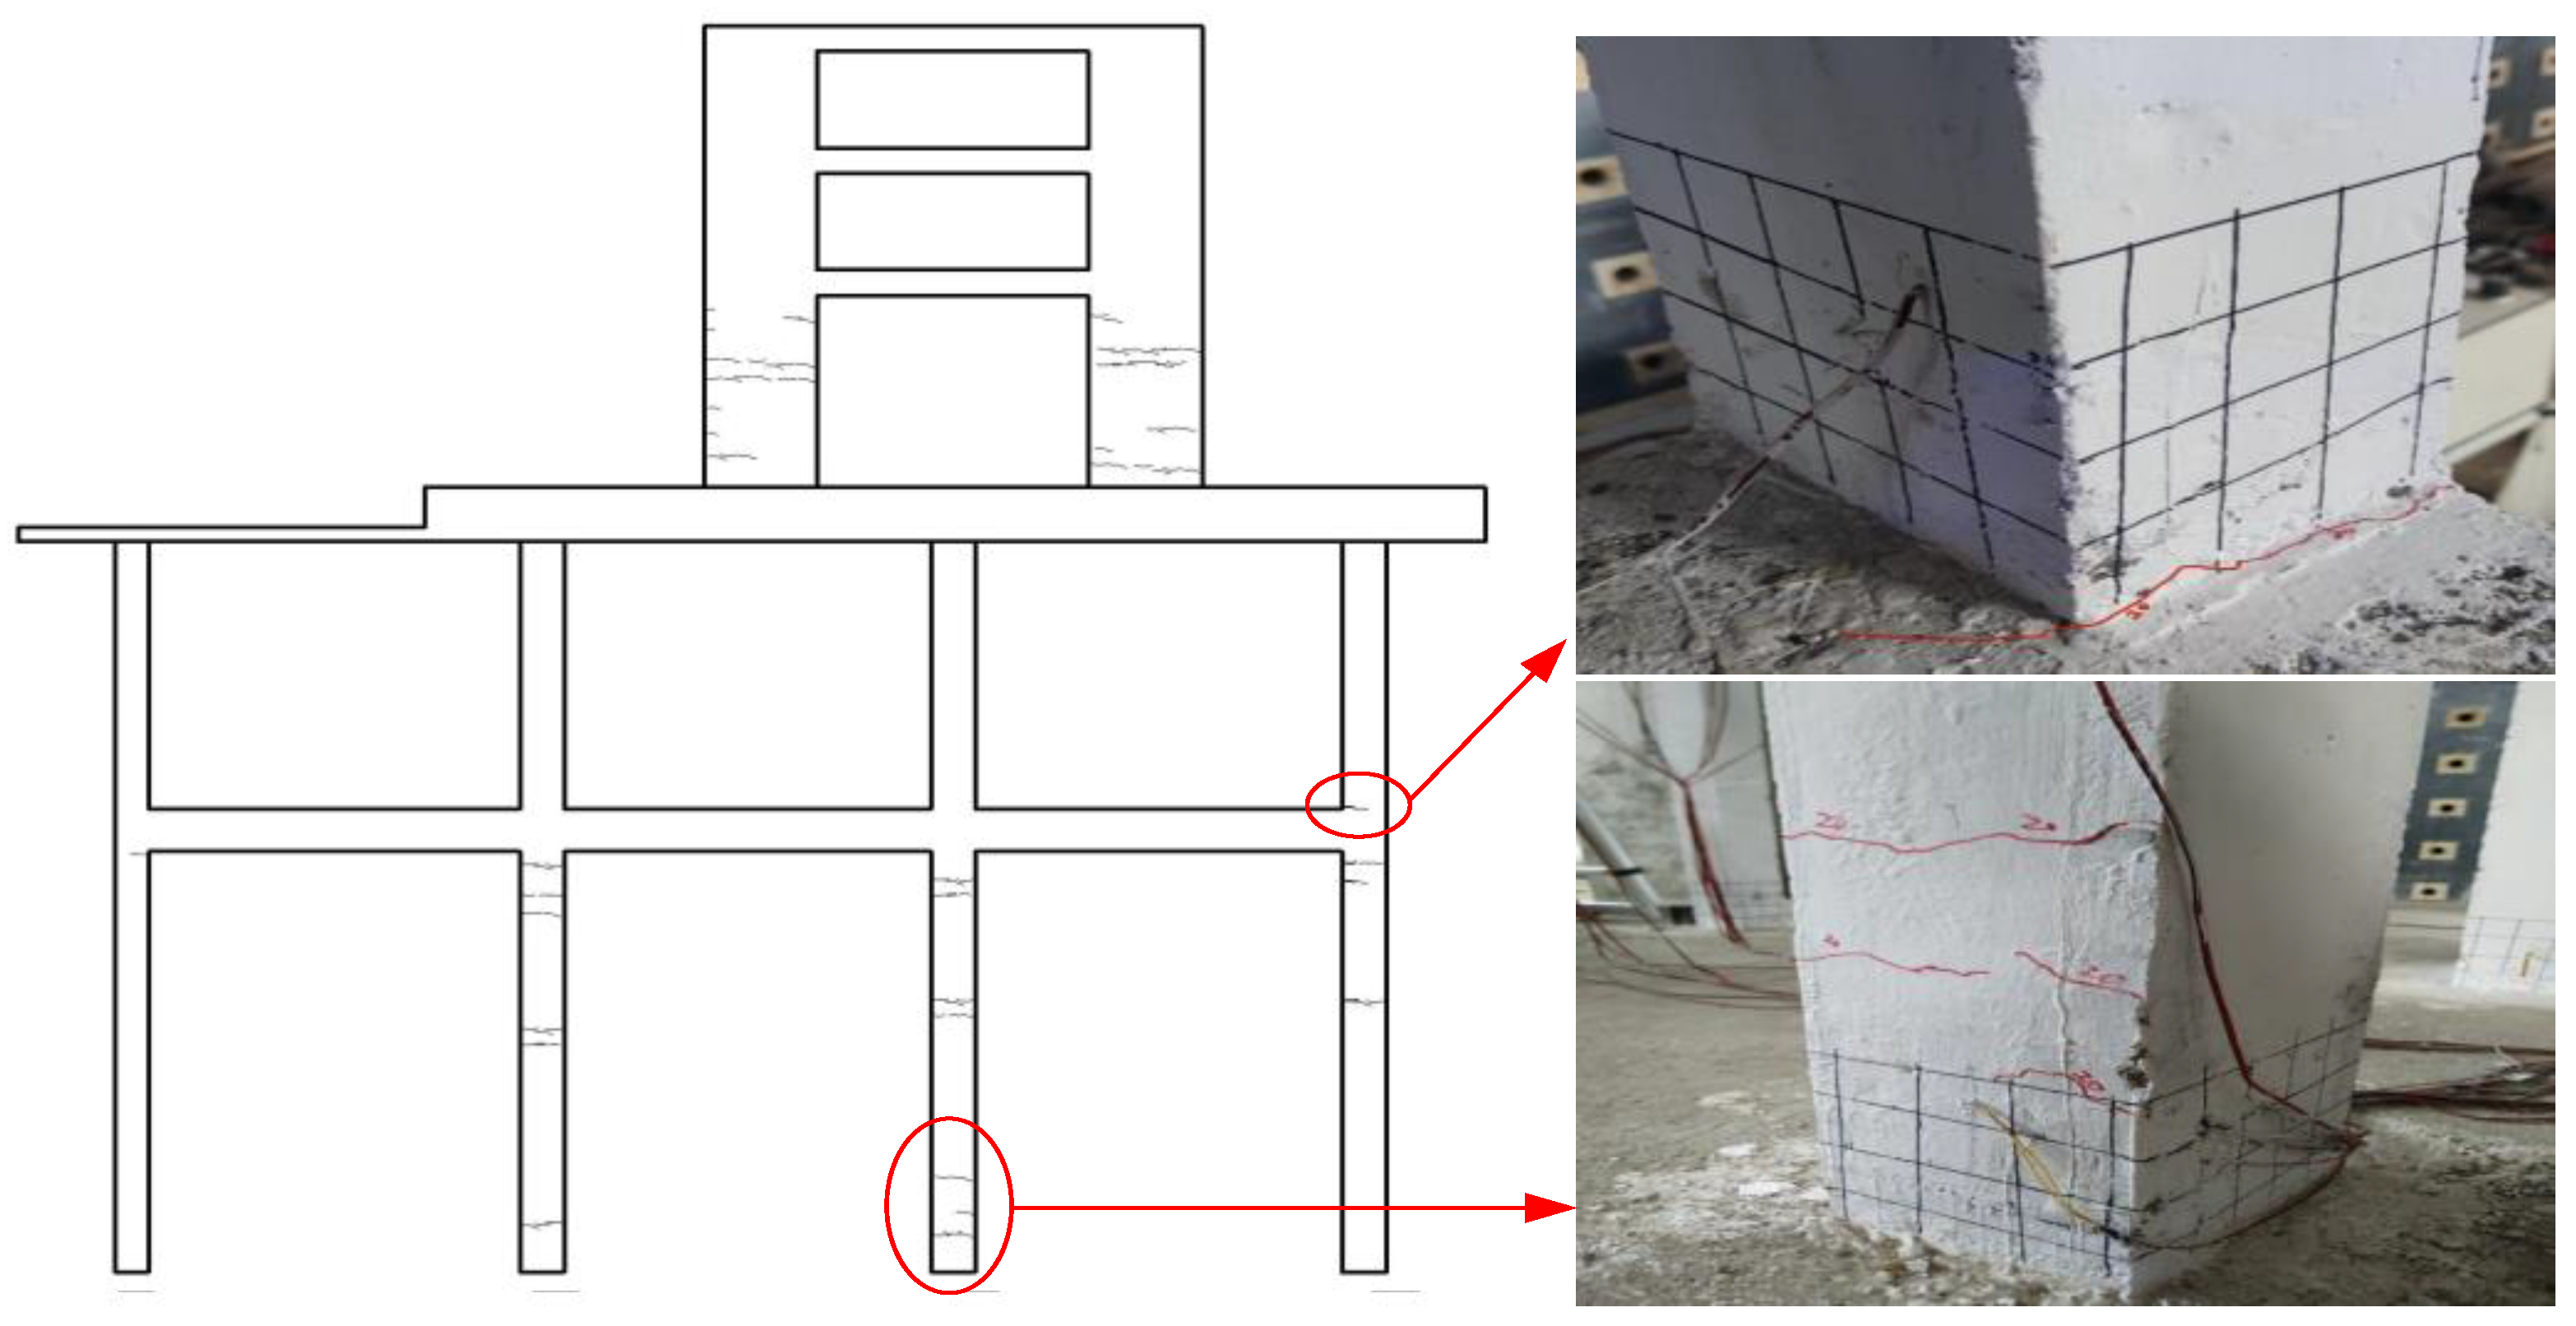
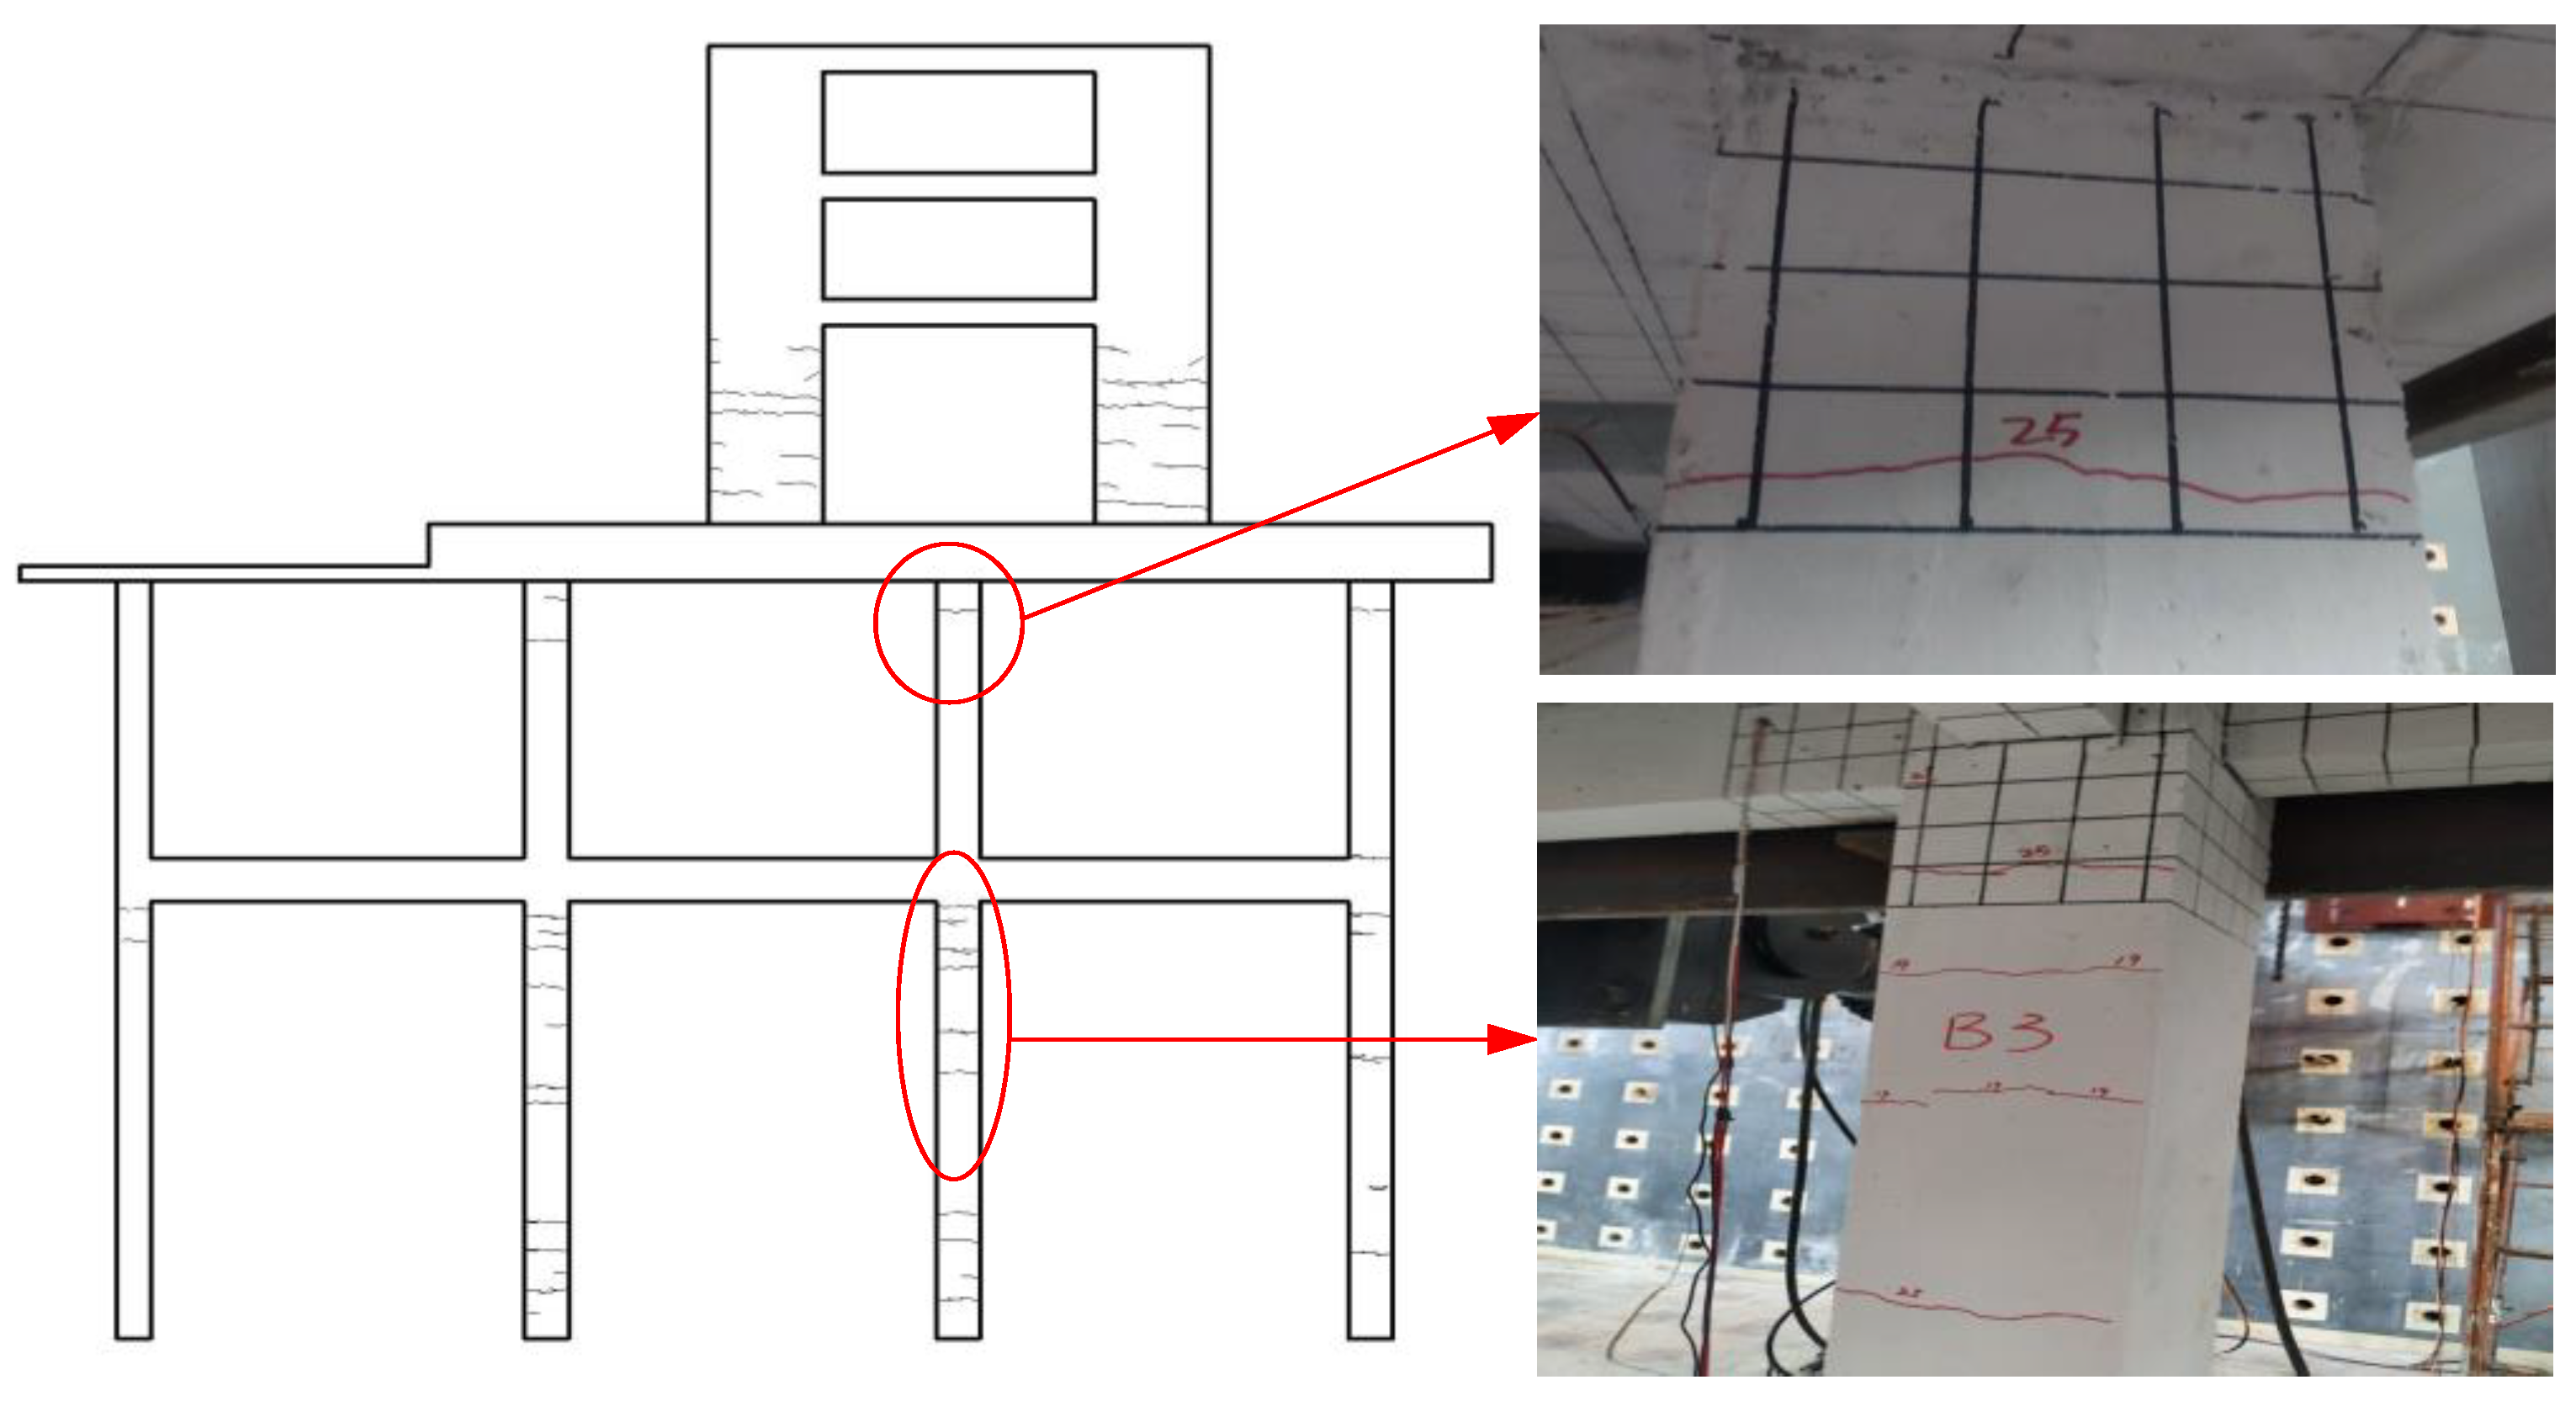
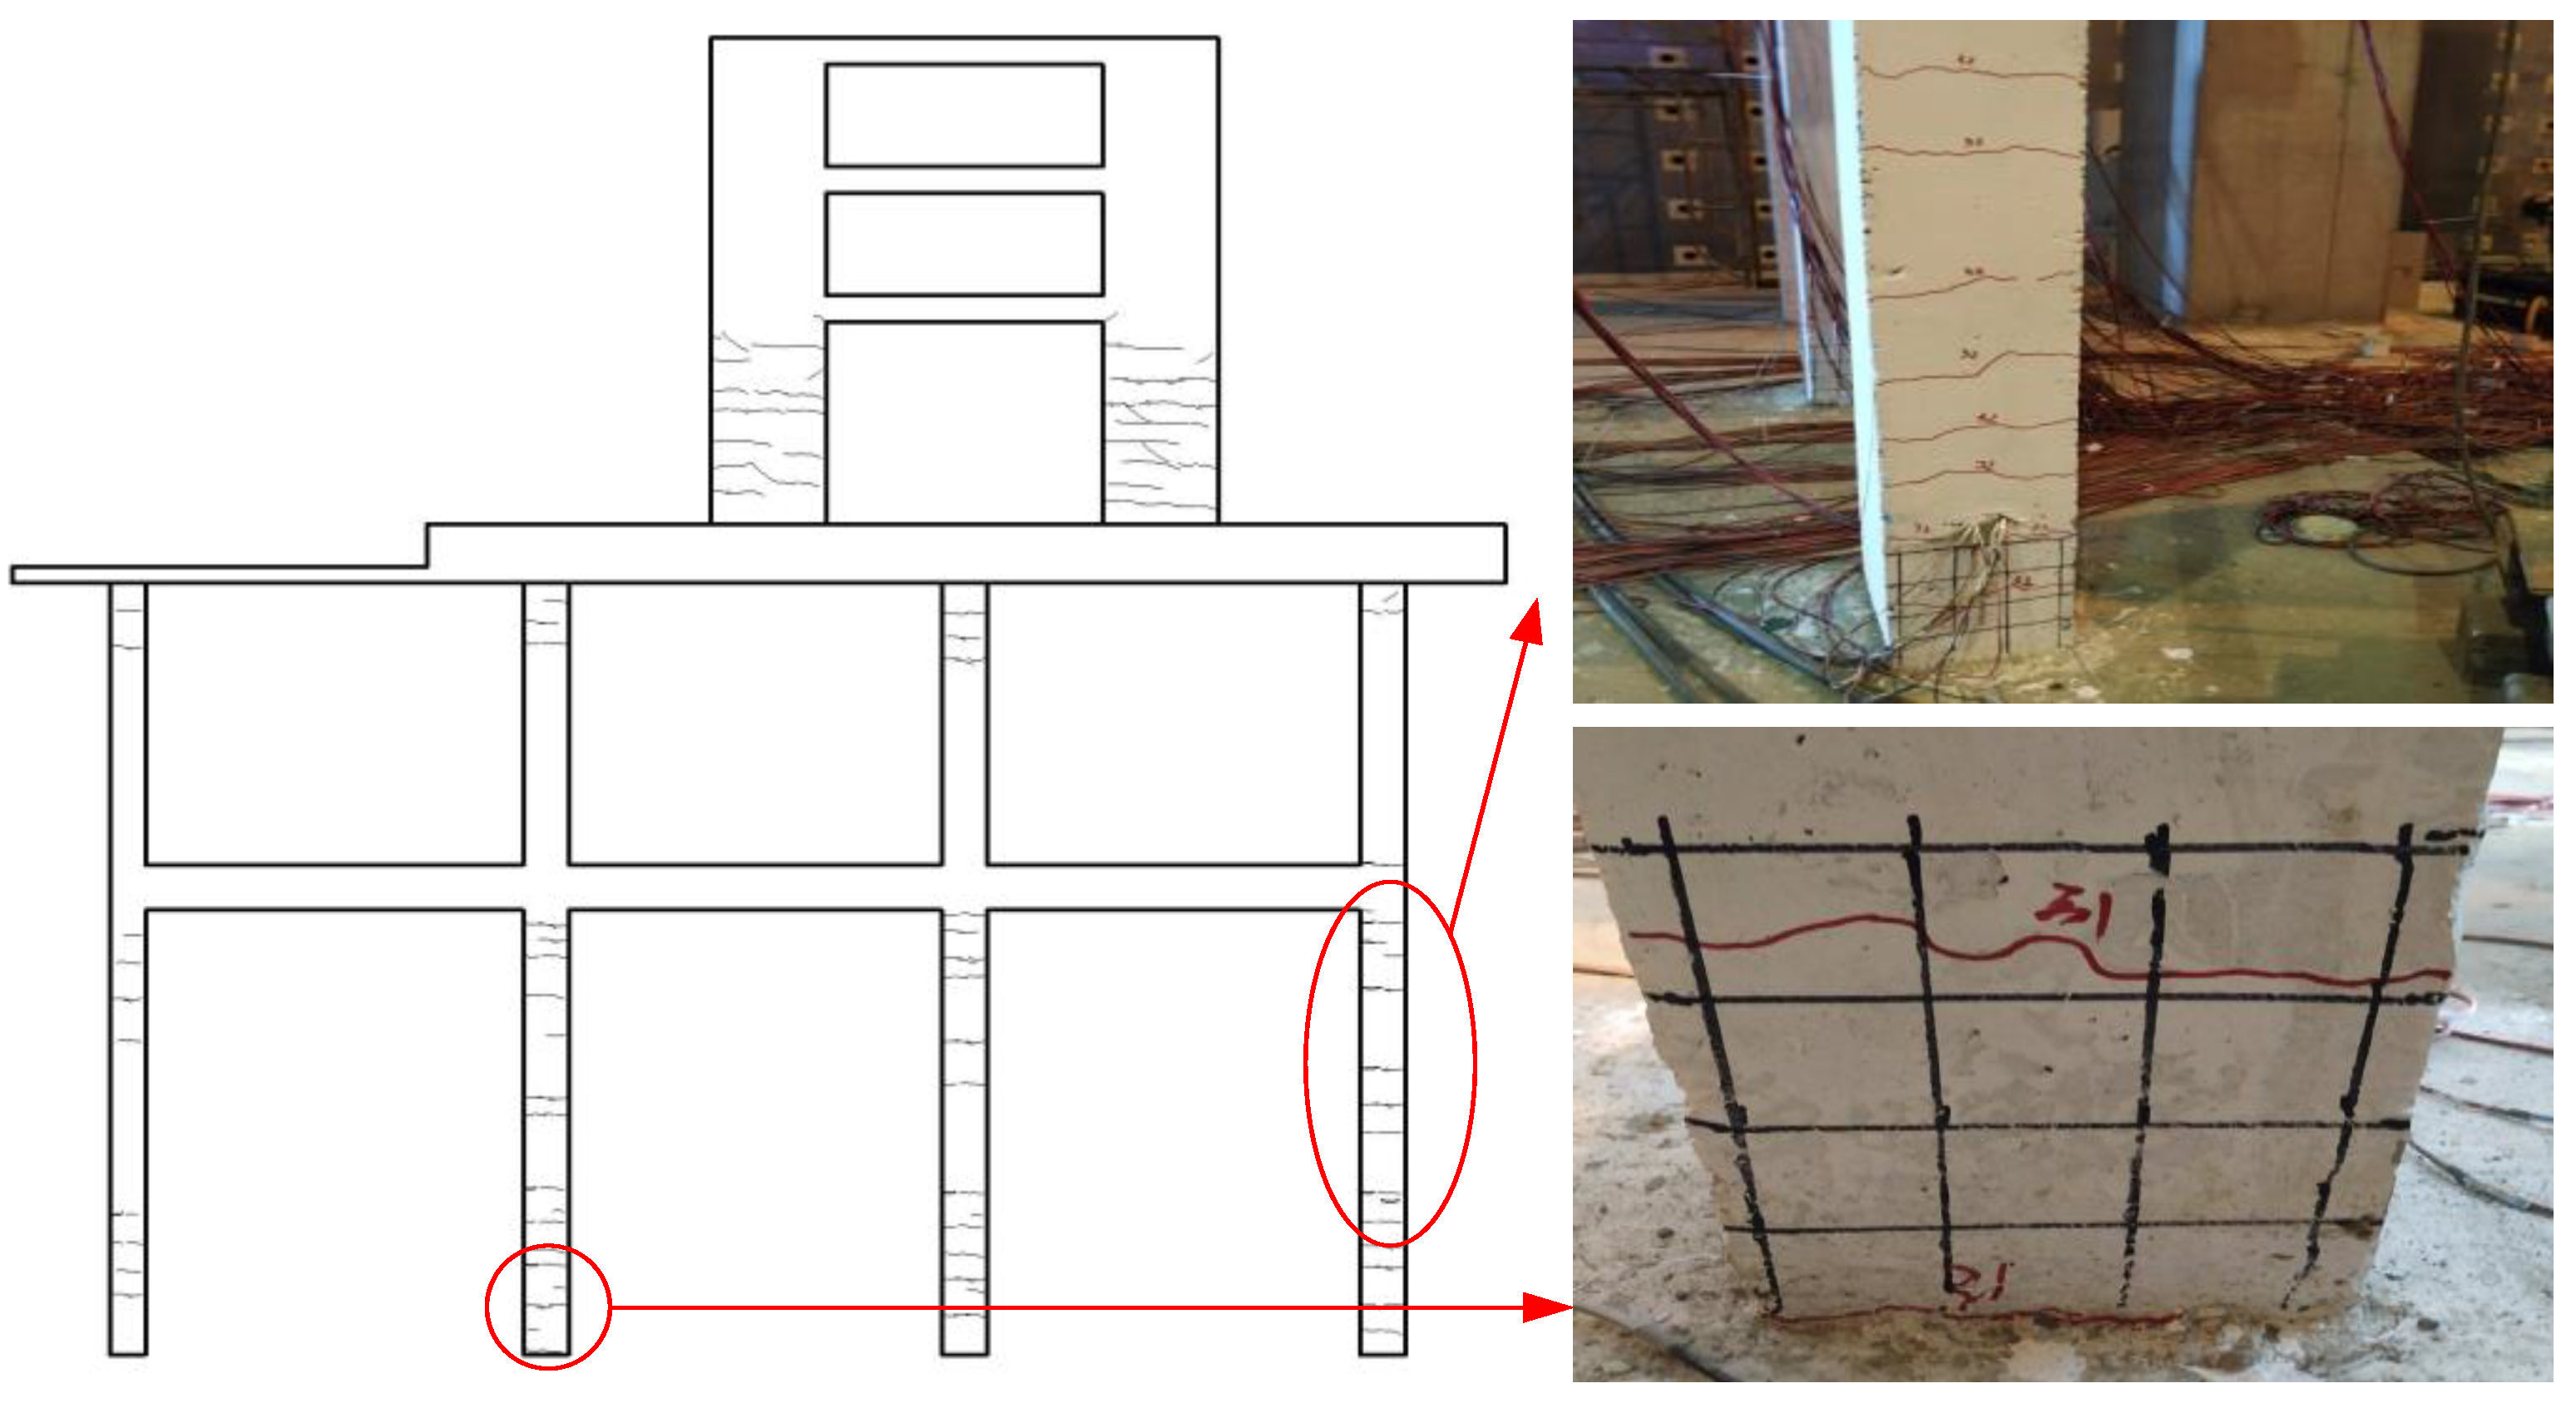
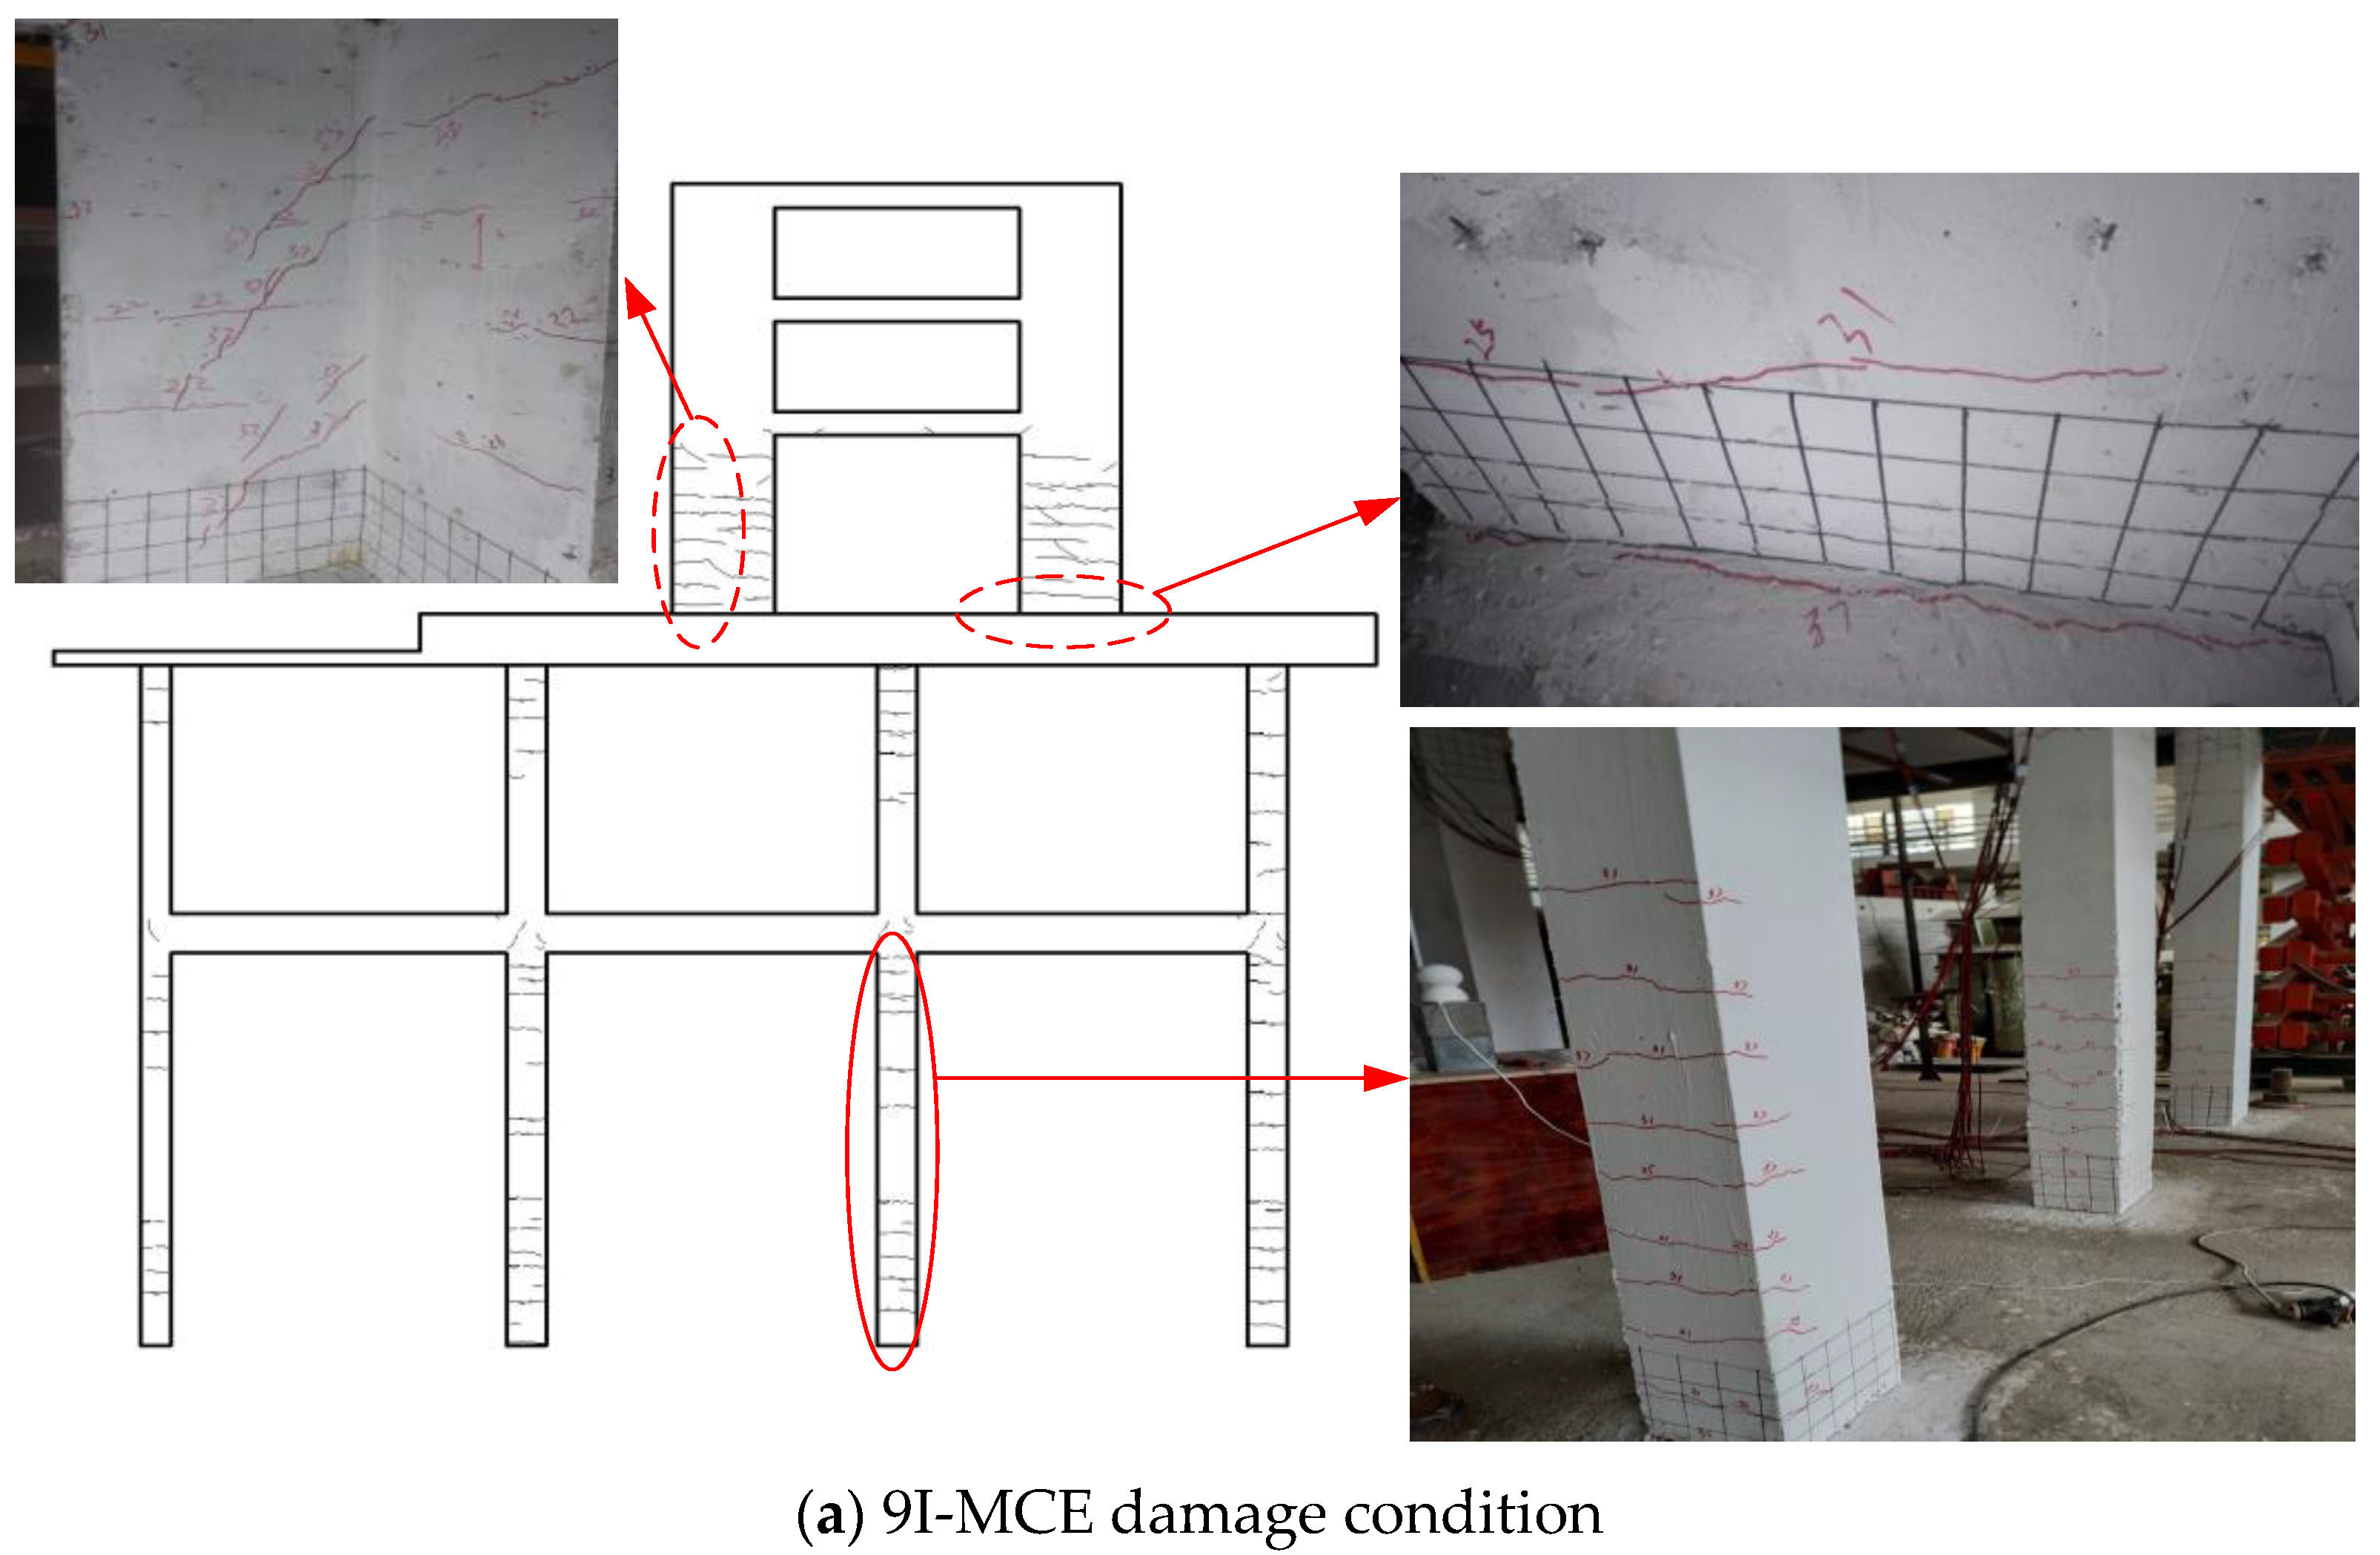
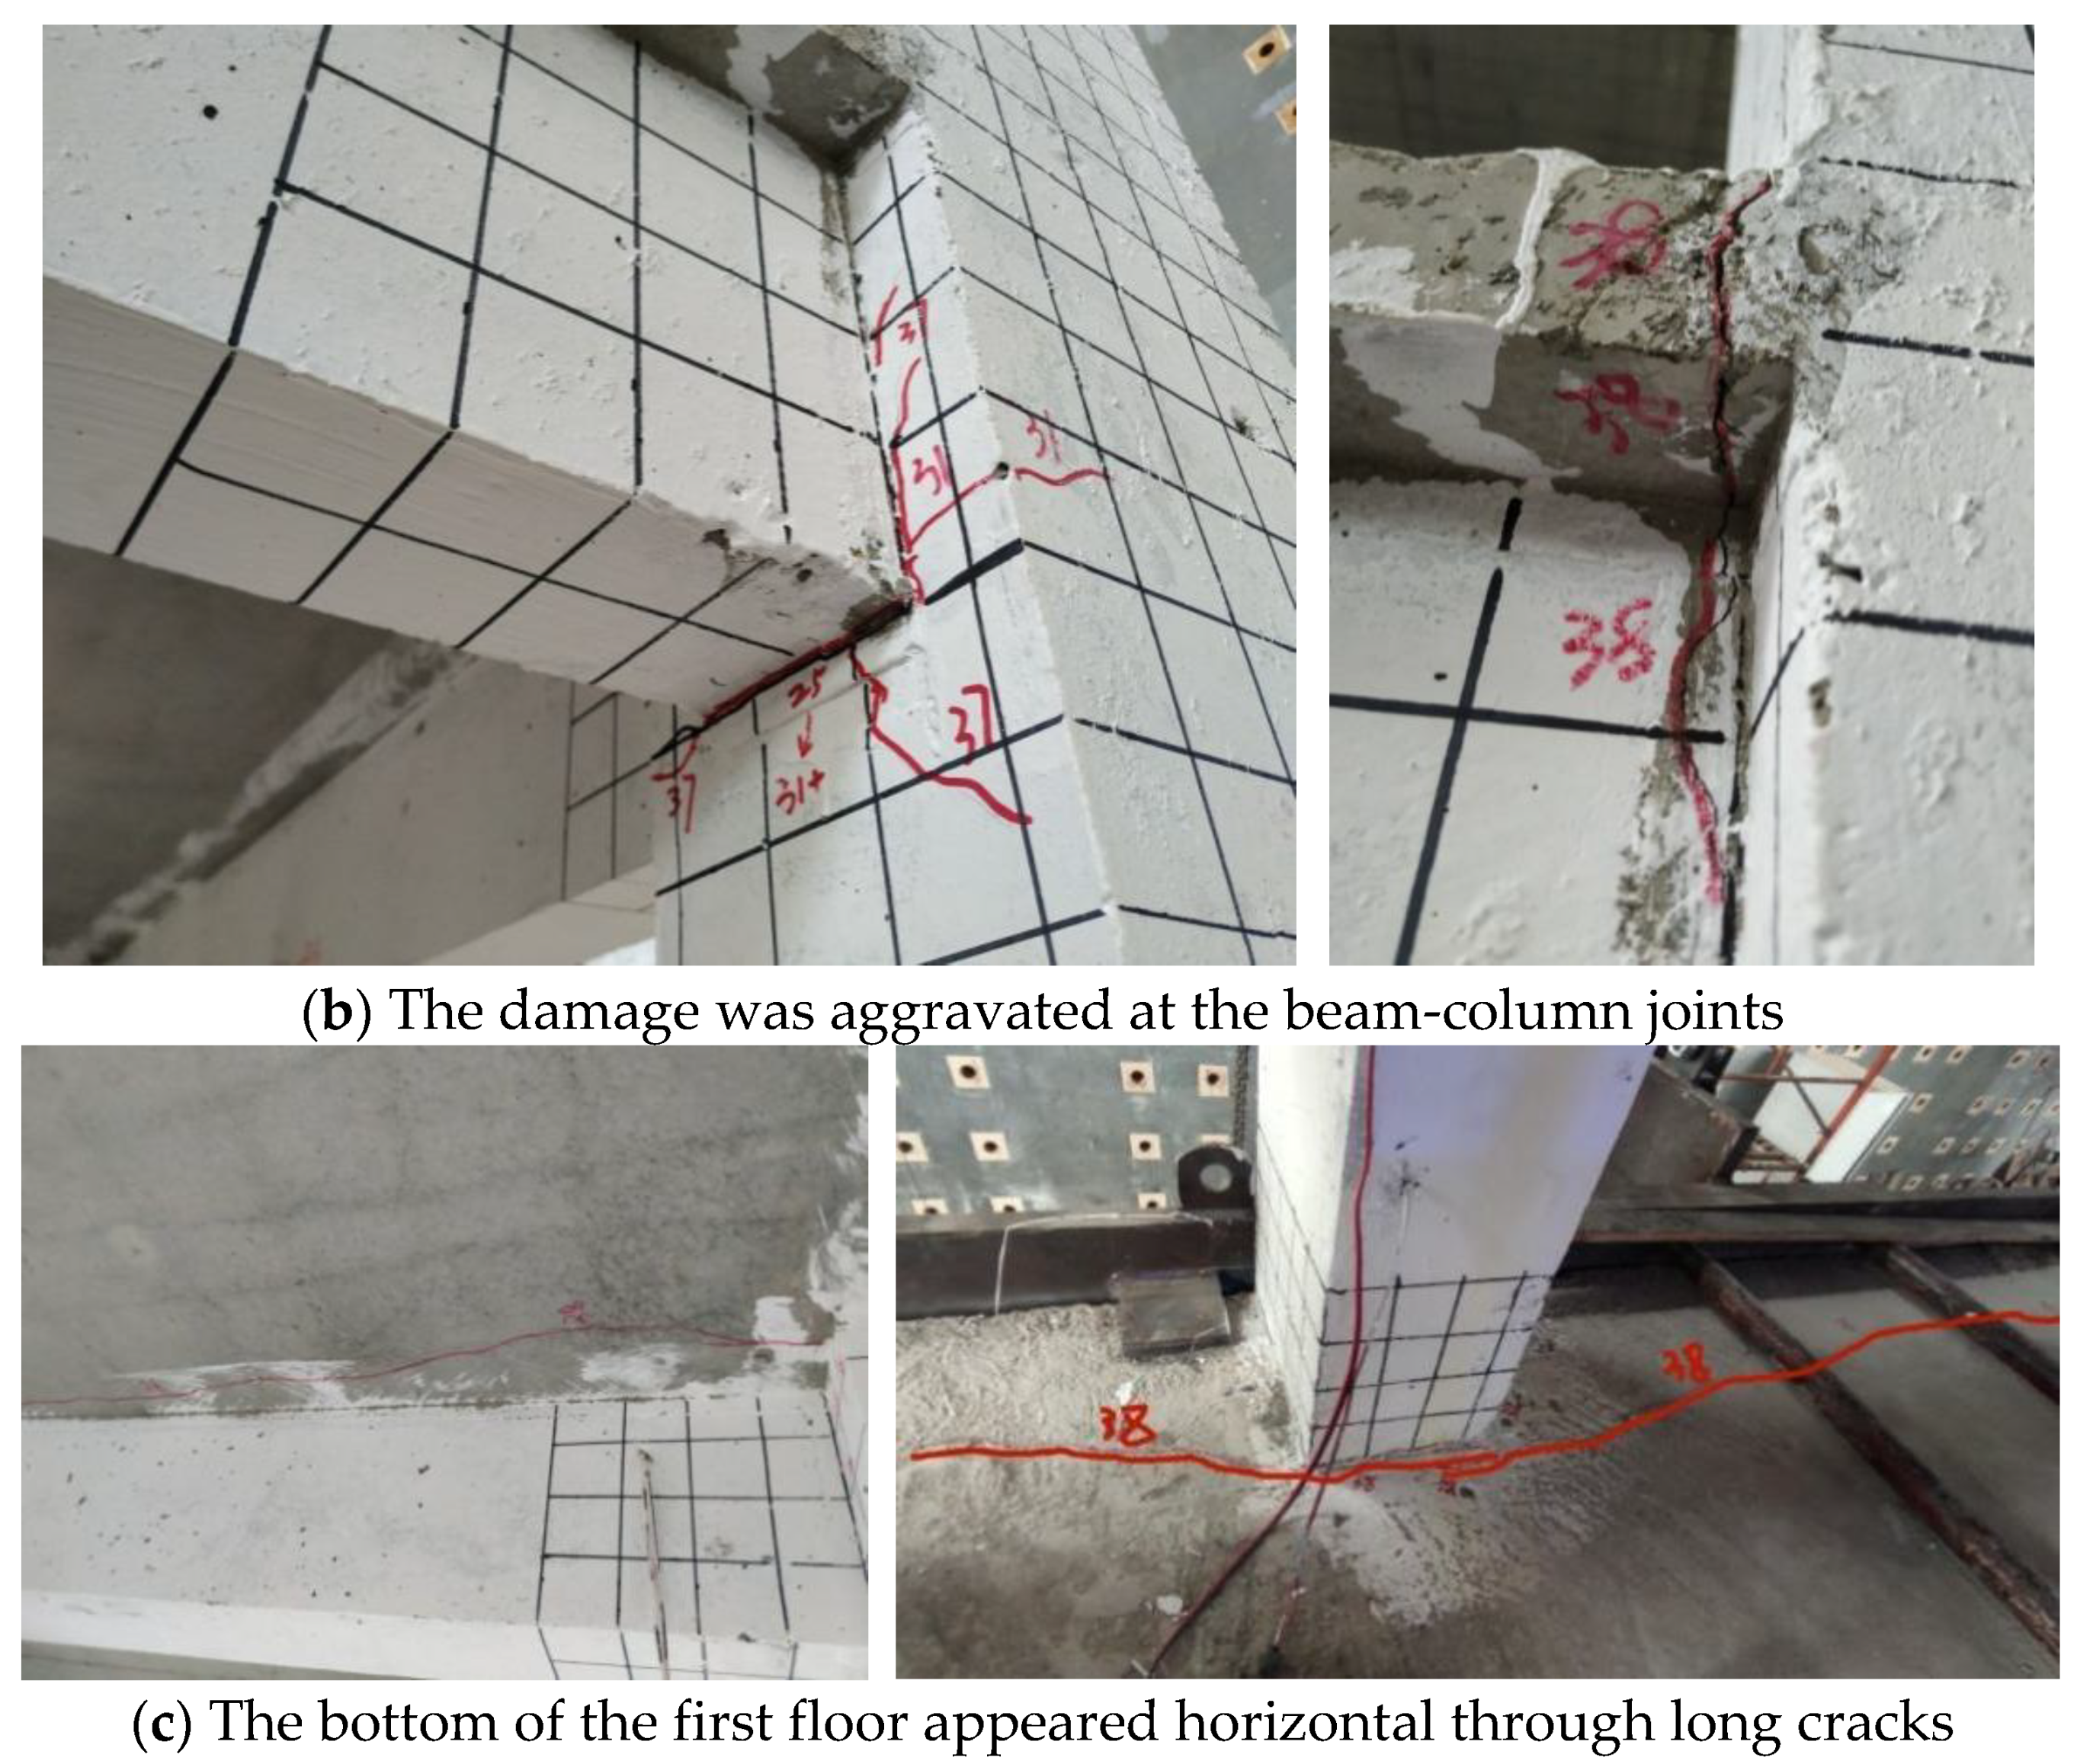
- Under the action of load, the structure forms a reasonable damage mechanism that the members above the transfer story crack first and those below the transfer story crack later.
- The transfer plate is mainly subject to shear deformation, the transfer plate will form shear failure, which should be avoided through reasonable design.
- Because of the huge height difference between the first story and the second story (the subway on the first story), the structure may be adversely affected, so it is necessary to make the yielding floor appear in the bottom strengthening part above the transfer story through reasonable design.
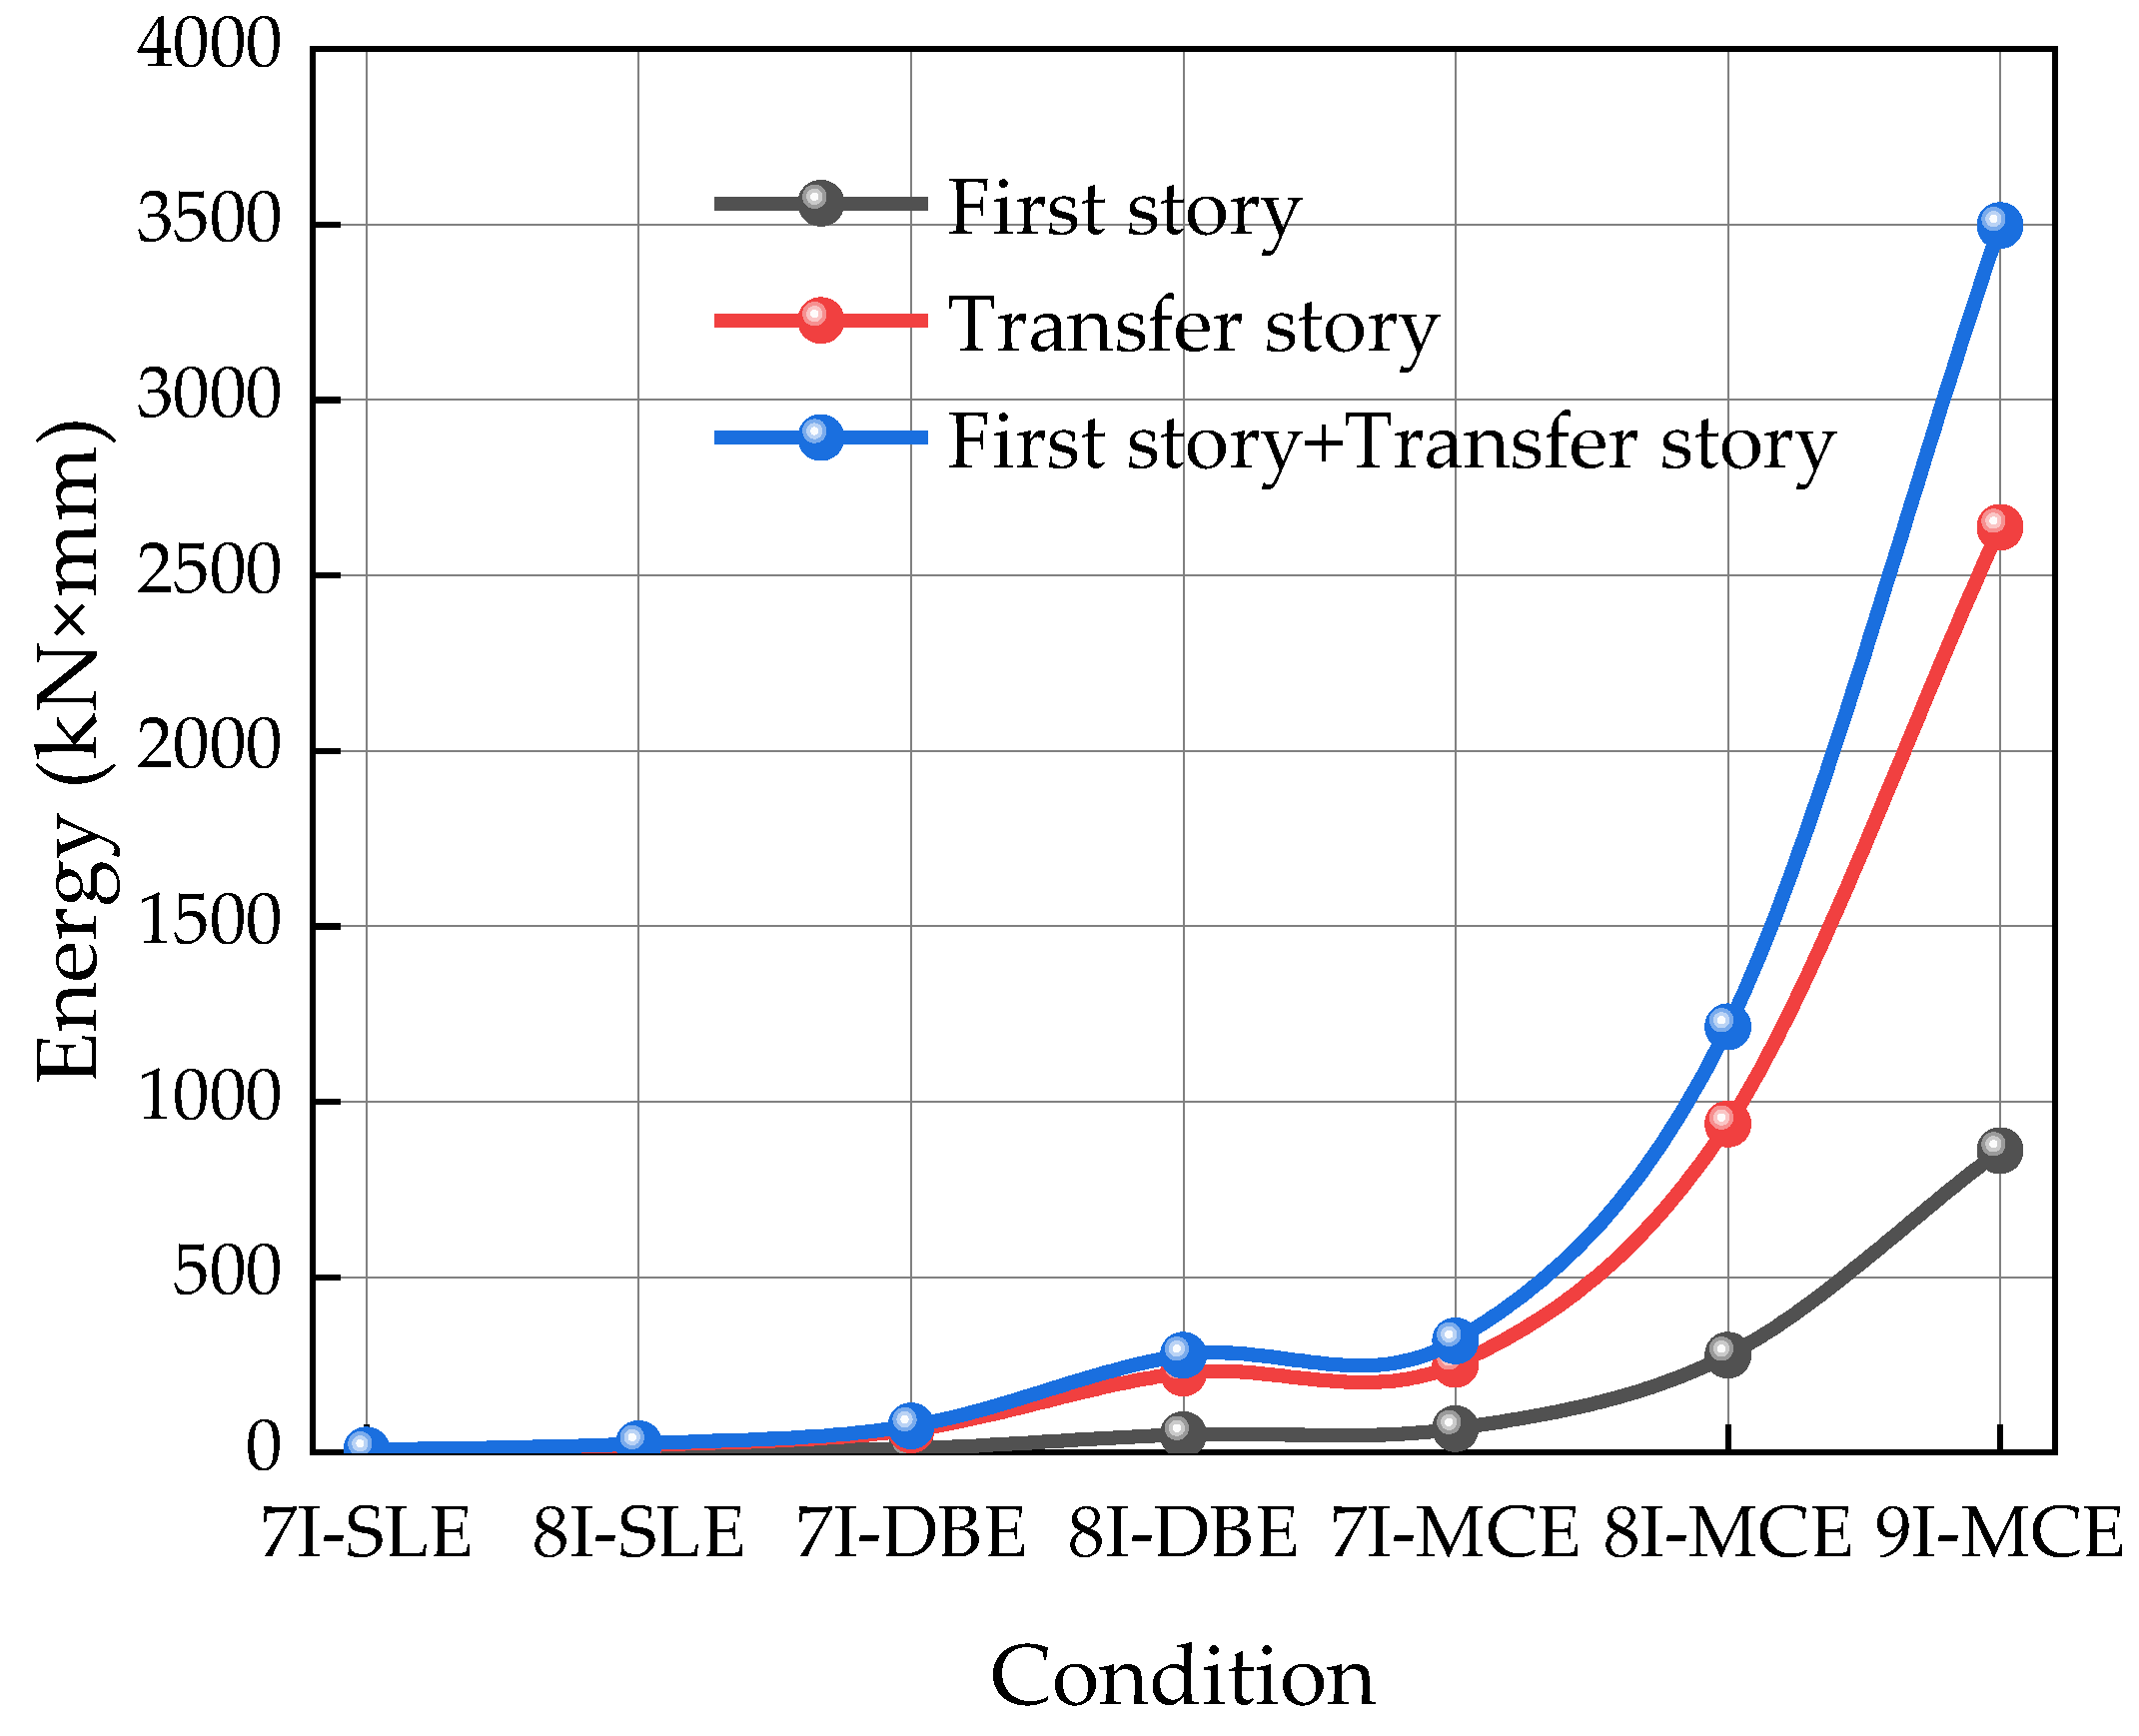
- Under the SLE and DBE conditions, the bottom frame of the structure is mainly subjected to elastic deformation. Under the MCE condition, the bottom frame of the structure produces a lot of damage, consumed energy increases, and stiffness decreases. The load capacity did not decline, which proves that “the performance goal of the bottom frame structure is higher than that of the upper shear wall structure”.
Author Contributions
Funding
Data Availability Statement
Conflicts of Interest
References
- Li, J.H.; Su, R.; Chandler, A.M. Assessment of low-rise building with transfer beam under seismic forces. Eng. Struct. 2003, 25, 1537–1549. [Google Scholar] [CrossRef]
- Zhou, X.; Xu, Y.L. Multi-hazard performance assessment of a transfer-plate high-rise building. Earthq. Eng. Eng. Vib. 2007, 6, 371–382. [Google Scholar] [CrossRef]
- Su, R.; Chandler, A.; Li, J.; Lam, N. Seismic assessment of transfer plate high rise buildings. Struct. Eng. Mech. 2002, 14, 287. [Google Scholar] [CrossRef]
- Kang, S.-M.; Na, S.-J.; Hwang, H.-J.; Kim, S.-I. Punching shear strength improved by upward panel in reinforced concrete transfer slabs. J. Build. Eng. 2022, 46, 103753. [Google Scholar] [CrossRef]
- Kang, S.M.; Na, S.J.; Hwang, H.J. Two-way shear strength of reinforced concrete transfer slab-column connections. Eng. Struct. 2021, 231, 111693. [Google Scholar] [CrossRef]
- Kang, S.M.; Na, S.J.; Hwang, H.J. Punching shear strength of reinforced concrete transfer slab-column connections with shear reinforcement. Eng. Struct. 2021, 243, 112610. [Google Scholar] [CrossRef]
- Lee, H.S.; Ko, D.W. Seismic Response Characteristics of High-RiseRC Wall Buildings Having Different Irregularities in Lower Stories. Steel Constr. 2007, 29, 3149–3167. [Google Scholar]
- Wang, W.; Chen, Y.; Dong, B.; Leon, R.T. Experimental behavior of transfer story connections for high-rise SRC structures under seismic loading. Earthq. Eng. Struct. Dyn. 2010, 40, 961–975. [Google Scholar] [CrossRef]
- Wu, Y.; Nong, X. Research and application of high-rise building structural system on upper part of metro depot. Build. Struct. 2020, 50, 90–95. [Google Scholar] [CrossRef]
- Moehle, J.P. Seismic Response of Vertically Irregular Structures. J. Struct. Eng. 2014, 110, 2002–2014. [Google Scholar] [CrossRef]
- Yoshimura, M. Nonlinear analysis of a reinforced concrete building with a soft first story collapsed by the 1995 Hyogoken-Nanbu earthquake. Cem. Concr. Compos. 1997, 19, 213–221. [Google Scholar] [CrossRef]
- Beigi, H.A.; Sullivan, T.J.; Christopoulos, C.; Calvi, G.M. Factors influencing the repair costs of soft-story RC frame buildings and implications for their seismic retrofit. Eng. Struct. 2015, 101, 233–245. [Google Scholar] [CrossRef]
- Benavent-Climent, A.; Mota-Páez, S. Earthquake retrofitting of R/C frames with soft first story using hysteretic dampers: Energy-based design method and evaluation. Eng. Struct. 2017, 137, 19–32. [Google Scholar] [CrossRef]
- Mazza, F.; Mazza, M.; Vulcano, A. Base-isolation systems for the seismic retrofitting of r.c. framed buildings with soft-storey subjected to near-fault earthquakes. Soil Dyn. Earthq. Eng. 2018, 109, 209–221. [Google Scholar] [CrossRef]
- Giannakouras, P.; Zeris, C. Seismic performance of irregular RC frames designed according to the DDBD approach. Eng. Struct. 2019, 182, 427–445. [Google Scholar] [CrossRef] [Green Version]
- Javadi, P.; Yamakawa, T. Strength and ductility type retrofit of soft-first-story RC frames through the steel-jacketed non-reinforced thick hybrid wall. Eng. Struct. 2019, 186, 255–269. [Google Scholar] [CrossRef]
- Jara, J.M.; Hernández, E.; Olmos, B.A.; Martínez, G. Building damages during the September 19, 2017 earthquake in Mexico City and seismic retrofitting of existing first soft-story buildings—ScienceDirect. Eng. Struct. 2020, 209, 109977. [Google Scholar] [CrossRef]
- Mouhine, M.; Hilali, E. Seismic vulnerability assessment of RC buildings with setback irregularity—ScienceDirect. Ain Shams Eng. J. 2021, 13, 101486. [Google Scholar] [CrossRef]
- Pm, A.; Gpk, B. Reinforced concrete setback frame structure: A seismic analysis—ScienceDirect. Mater. Today Proc. 2021. Withdrawn Article in Press. [Google Scholar] [CrossRef]
- Nasab, M.; Chun, S.; Kim, J. Soil-structure interaction effect on seismic retrofit of a soft first-story structure. Structures 2021, 32, 1553–1564. [Google Scholar] [CrossRef]
- Hareen, C.; Mohan, S.C. Evaluation of seismic torsional response of ductile RC buildings with soft first story. Structures 2021, 29, 1640–1654. [Google Scholar] [CrossRef]
- Jiang, H.; Huang, Y.; He, L.; Huang, T.; Zhang, S. Seismic performance of RC frame-shear wall structures with vertical setback. Structures 2021, 33, 4203–4217. [Google Scholar] [CrossRef]
- Sarkar, P.; Prasad, A.M.; Menon, D. Vertical geometric irregularity in stepped building frames. Eng. Struct. 2010, 32, 2175–2182. [Google Scholar] [CrossRef]
- Lin, J.L.; Tsaur, C.C.; Tsai, K.C. Two-degree-of-freedom modal response history analysis of buildings with specific vertical irregularities. Eng. Struct. 2019, 184, 505–523. [Google Scholar] [CrossRef]
- Stefano, M.D.; Pintucchi, B. A review of research on seismic behaviour of irregular building structures since 2002. Bull. Earthq. Eng. 2008, 6, 285–308. [Google Scholar] [CrossRef] [Green Version]
- Sahoo, D.R.; Rai, D.C. Design and evaluation of seismic strengthening techniques for reinforced concrete frames with soft ground story. Eng. Struct. 2013, 56, 1933–1944. [Google Scholar] [CrossRef]
- Pavel, F.; Carale, G. Seismic assessment for typical soft-storey reinforced concrete structures in Bucharest, Romania. Int. J. Disaster Risk Reduct. 2019, 41, 101332. [Google Scholar] [CrossRef]
- Eom, T.S.; Song, J.W.; Song, J.K.; Kang, G.S.; Yoon, J.K.; Kang, S.M. Punching-shear behavior of slabs with bar truss shear reinforcement on rectangular columns. Eng. Struct. 2017, 134, 390–399. [Google Scholar] [CrossRef]
- Sahoo, S.; Singh, B. Punching shear capacity of recycled-aggregate concrete slab-column connections. J. Build. Eng. 2021, 41, 102430. [Google Scholar] [CrossRef]
- Yuan, B.; Chen, W.; Zhao, J.; Li, L.; Liu, F.; Guo, Y.; Zhang, B. Addition of alkaline solutions and fibers for the reinforcement of kaolinite-containing granite residual soil. Appl. Clay Sci. 2022, 228, 106644. [Google Scholar] [CrossRef]
- Park, H.G.; Choi, K.K. Strength of exterior slab-column connections subjected to unbalanced moments. Eng. Struct. 2007, 29, 1096–1114. [Google Scholar] [CrossRef]
- Zhang, X.; Wu, Y.; Zhai, E.; Ye, P. Coupling analysis of the heat-water dynamics and frozen depth in a seasonally frozen zone. J. Hydrol. 2021, 593, 125603. [Google Scholar] [CrossRef]
- Zhang, X.; Zhai, E.; Wu, Y.; Sun, D.; Lu, Y. Theoretical and Numerical Analyses on Hydro–Thermal–Salt–Mechanical Interaction of Unsaturated Salinized Soil Subjected to Typical Unidirectional Freezing Process. Int. J. Geomech. 2021, 21, 04021104. [Google Scholar] [CrossRef]
- Truong, G.T.; Choi, K.K.; Kim, C.S. Punching shear strength of interior concrete slab-column connections reinforced with FRP flexural and shear reinforcement. J. Build. Eng. 2021, 46, 103692. [Google Scholar] [CrossRef]
- El-Gendy, M.; El-Salakawy, E. Effect of flexural reinforcement type and ratio on the punching behavior of RC slab-column edge connections subjected to reversed-cyclic lateral loads. Eng. Struct. 2019, 200, 109703. [Google Scholar] [CrossRef]
- Kai, Q.; Jsl, A.; Th, B.; Yhw, A.; Xfd, B. Punching shear strength of corroded reinforced concrete slab-column connections. J. Build. Eng. 2021, 45, 103489. [Google Scholar]
- GB 50011-2010; Chinese Ministry of Housing and Urban-Rural Development, Code for Seismic Design of Buildings. China Architecture and Building Press: Beijing, China, 2010.
- DBJ/T 15-151-2019; Guangdong Provincial Department of Housing and Urban-Rural Development, Specification for Performance-Based Seismic Design of Reinforced Concrete Building Structure. China City Press: Beijing, China, 2019.


| Type | Simplified Structure | Experimental Object | |||||
|---|---|---|---|---|---|---|---|
| Story | Story Height (m) | Floor Mass (t) | Story | Story Height (m) | Floor Mass (t) | Counterweight (t) | |
| Shear wall | 5~29 | 2.9 | 120.4 × 25 | 5 | 0.58 | 0.71 | 23.29 |
| Shear wall | 4 | 2.9 | 132.1 | 4 | 0.58 | 0.81 | 0.25 |
| Shear wall | 3 | 5.8 | 181 | 3 | 1.16 | 1.24 | 0.21 |
| Frame column, Transfer slab | 2 | 7 | 2512.2 | 2 | 1.4 | 13.14 | 6.96 |
| Frame structure | 1 | 11 | 834.1 | 1 | 2.2 | 6.5 | 0.17 |
| Physical Quantity | Formula | Similar Relationship |
|---|---|---|
| Size (m) | 1:5 | |
| Density (kg/m3) | 1:1 | |
| Mass (kg) | 1:125 | |
| Reinforcement ratio (%) | 1:1 | |
| Strain | 1:1 | |
| Displacement (mm) | 1:5 | |
| Force (kN) | 1:25 | |
| Bending moment (kN·m) | 1:125 |
| Seismic Response | 7 Intensity 1 | 8 Intensity 1 | 9 Intensity 1 |
|---|---|---|---|
| Service level earthquake | 0.08 | 0.16 | 0.32 |
| Design based earthquake | 0.23 | 0.45 | 0.9 |
| Maximum considered earthquake | 0.50 | 0.90 | 1.4 |
| Loading Regime | Jack Loading Displacement | First Story Actuator Displacement/Force (Inter Floor Displacement Angle) | Transfer Story Actuator Displacement/Force (Inter Floor Displacement Angle) |
|---|---|---|---|
| 1 (Preload-1) | ±0.1 mm | 1 kN | 5 kN |
| 2 (Preload-2) | ±0.15 mm | 2 kN | 10 kN |
| 3 (Preload-3) | ±0.2 mm | 4 kN | 20 kN |
| 4 (7I-SLE) | ±0.265 mm | ±0.7 mm (1/3143) | ±1.1 mm (1/3500) |
| 5 (8I-SLE) | ±0.455 mm | ±1.4 mm (1/1571) | ±2.1 mm (1/2000) |
| 6 (7I-DBE) | ±0.49 mm | ±2.1 mm (1/1048) | ±3.1 mm (1/1400) |
| 7 (8I-DBE) | ±1.16 mm | ±4 mm (1/550) | ±6 mm (1/700) |
| 8 (7I-MCE) | ±1.29 mm | ±5 mm (1/440) | ±7.4 mm (1/583) |
| 9 (8I-MCE) | ±2.345 mm | ±8.9 mm (1/247) | ±13.3 mm (1/318) |
| 10 (9I-MCE) | ±4.589 mm | ±14.3 mm (1/154) | ±20.5 mm (1/226) |
| Loading Conditions | Equivalent Viscous Damping Coefficient of the First Story | Equivalent Viscous Damping Coefficient of the Transfer Story |
|---|---|---|
| 7I-SLE | 2.67% | 5.63% |
| 8I-SLE | 2.85% | 4.85% |
| 7I-DBE | 3.22% | 8.05% |
| 8I-DBE | 3.71% | 7.52% |
| 7I-MCE | 3.01% | 5.60% |
| 8I-MCE | 4.07% | 6.67% |
| 9I-MCE | 5.45% | 9.26% |
Publisher’s Note: MDPI stays neutral with regard to jurisdictional claims in published maps and institutional affiliations. |
© 2022 by the authors. Licensee MDPI, Basel, Switzerland. This article is an open access article distributed under the terms and conditions of the Creative Commons Attribution (CC BY) license (https://creativecommons.org/licenses/by/4.0/).
Share and Cite
Xia, Y.; Li, W.; Liu, W.; Liu, Y.; Xu, X.; Zhang, C. Experimental Study of Frame-Supported Shear Wall Structure of High-Rise Buildings with Transfer Slab in Metro Depot. Buildings 2022, 12, 1940. https://doi.org/10.3390/buildings12111940
Xia Y, Li W, Liu W, Liu Y, Xu X, Zhang C. Experimental Study of Frame-Supported Shear Wall Structure of High-Rise Buildings with Transfer Slab in Metro Depot. Buildings. 2022; 12(11):1940. https://doi.org/10.3390/buildings12111940
Chicago/Turabian StyleXia, Yishu, Wuxiong Li, Weiya Liu, Yanhui Liu, Xin Xu, and Chenyun Zhang. 2022. "Experimental Study of Frame-Supported Shear Wall Structure of High-Rise Buildings with Transfer Slab in Metro Depot" Buildings 12, no. 11: 1940. https://doi.org/10.3390/buildings12111940