Article

Research on Design Framework of Middle School Teaching Building Based on Performance Optimization and Prediction in the Scheme Design Stage

1
School of Architecture and Urban Planning, Nanjing University, Nanjing 210093, China
2
College of Water and Architectural Engineering, Shihezi University, Shihezi 832061, China
3
Department of Architectural Engineering, Ordos Vocational College, Ordos 017000, China
4
Research Center of Engineering Thermophysics, North China Electric Power University, Beijing 102206, China
*
Authors to whom correspondence should be addressed.
Buildings 2022, 12(11), 1897; https://doi.org/10.3390/buildings12111897
Submission received: 7 October 2022 / Revised: 21 October 2022 / Accepted: 31 October 2022 / Published: 5 November 2022

Abstract

:
The good indoor light environment and comfort of the teaching space are very important for students’ physical and mental health. Meanwhile, China advocates energy conservation and emission reduction policies. However, in order to obtain lower building energy consumption, higher thermal comfort, and daylighting, architects use performance simulation software to repeatedly simulate and refine, which is time-consuming and difficult to obtain the best results from three performances. Given this problem, we constructed the design framework in the early stage of the architectural design of the teaching building. In the first stage of the framework, architects optimized the performance objectives of lighting, thermal comfort, and energy consumption, and performed a cluster analysis on the optimized non-dominated solution to provide a reference for the architect. In the second stage of the framework, architects used the data generated in the optimization process to train the BP neural network and use the trained BP neural network to predict the performance of the building. In this paper, we selected Nanjing Donglu Middle School as a case study. The optimization of the building performance was assessed by a genetic algorithm, generating 3000 sets of sample data during the optimization iteration. Then, we analyzed the non-dominated solution of the sample data through the method of cluster analysis and trained the BP neural network with the sample data as a data set. The prediction model with R-values of 0.998 in the training set and test set was obtained by repeatedly debugging the number of neurons in the BP neural network. Finally, five groups of design parameters were randomly selected and brought into the trained BP neural network, and the predictive value was close to the simulated value. The construction of the framework provides design ideas for architects in the early teaching of building design and helps designers to make better decisions.

Graphical Abstract

1. Introduction

In the early stage of architectural design, the optimization and prediction of architectural performance is very important, because the accurate performance of architectural optimization and prediction can give architects timely feedback and direction of design in the early stage of design, and ultimately achieve the goal of reducing time costs and improving design efficiency [1,2]. However, the traditional process of building design is called the post-evaluation paradigm [3], that is, when performance simulation software is used to evaluate the architecture after the design is completed. If it is found that the simulation results do not meet the design requirements in the later stage of designing, it is very time-consuming to modify the whole architectural design.
The IEA annex 30 project divides the architectural design into six consecutive stages, namely, the scheme design stage, preliminary design stage, detailed design stage, construction stage, operation management, and renewal stage [4]. The design stage has a greater impact on building performance and more than 40% of the energy-saving potential comes from the architectural scheme design stage [4]; therefore, the scope of this study is in the scheme design stage.
Among the existing building types, teaching buildings have higher requirements for building performance [5], among which the performance of building lighting, thermal comfort, and energy consumption are particularly important [6]. First of all, good lighting can not only reduce students’ fatigue and myopia in the learning process but also help students improve their social skills and learning attention, alleviate learning pressure, and improve their mood [7,8]. If people study in an environment with poor lighting, it can seriously affect human hormone secretion [9]. Secondly, changes in temperature and humidity in the teaching space have been reported to directly affect the academic performance and attention of students [10]. Overheated teaching spaces can also affect the emotions of students and lead to the emotional indifference of students [11]. Finally, the good thermal comfort of building space is inseparable from energy consumption. According to relevant studies, 80% of energy consumption in buildings is used to satisfy the comfort of users, and building energy consumption accounts for about 20% of the total global energy consumption [12]. With the increasing energy consumption in recent years, an energy-saving design is an important aspect of architectural design; therefore, when designing teaching buildings, architects should not only make the architectural scheme obtain good lighting and thermal comfort but also try to reduce the energy consumption of the building.

2. Related Work

At present, among the methods of building performance optimization, performance-driven design is the more popular. The so-called performance-driven design is based on the characteristics of the site climate and environment and the design function requirements. Starting from the use of architectural functions and the comfort of indoor physical space, the optimization algorithm is used to formulate the performance design decision of architectural form, and the relative optimal solution set for the architectural form is generated based on the computer platform [13]; this is screened by the architect and the relative optimal feasible solution of the design problem is obtained. In the design process guided by performance-driven thinking, the designer is not the decision maker in the direction of architectural form adjustment. The subjective intervention in the process of architectural form design occurs before and after the optimization design process, and the design decision in the optimization process is formulated by the optimization algorithm according to the fitness function of the performance objective.
In the past, there were many cases of performance-driven design, for example, T. Echenagucia et al. [14], based on performance-driven architectural form energy-saving design thinking, with the lowest level of building energy consumption as the design goal, and the application of the genetic optimization algorithm used to expand the layout design of building windows. Based on the idea of performance-driven design, M. Turrin [15] developed the energy-saving design of a long-span roof form by using a genetic algorithm with structure and sunlight as performance-driving forces. In the recent performance-driven design literature, researchers also considered thermal comfort and lighting performance. Kirimtat et al. [16] took the sunshade components of office buildings as variables and the energy consumption and dynamic lighting indicators as optimization objectives. Finally, the optimization results were analyzed according to the Pareto front solution. Delgado et al. [17] took the window–wall ratio of rural tourism buildings as a variable, took the dynamic lighting index and the comfort level of rural tourism buildings as the optimization target, and obtained data to evaluate the energy consumption and comfort level of rural tourism buildings. Yan et al. [1] optimized the solar radiation, the comfort level of the overhead, and the static lighting index of the interior of the office building with multiple objectives and obtained the value of the optimized design variables. The variables he took into account were mainly the design variables at the initial stage of the design, such as the story height and depth based on the performance-driven architectural design thinking.
At present, many scholars have studied the performance design of teaching buildings. Khaoula et al. [5] selected a typical school in dry and hot areas as a research case. Through the comparison of measured and simulated data, it was proved that the simulated data of the simulation software is reliable. Based on the performance-driven architectural design thinking, through the optimization of the energy consumption, thermal comfort, and dynamic lighting indicators of the building model, better envelope structure parameters were calculated. Xu et al. [18] selected Nanjing No. 1 Middle School as a typical case for research and simulated the energy consumption and dynamic lighting indicators of the whole middle school teaching building. They used the simulated data as a data set to train the neural network rapid prediction model and optimized the model using a genetic algorithm. In addition, Zhang [18] used optimization algorithms to optimize the performance of teaching buildings; the building variables included depth, window–wall ratio (WWR), shading type, etc., which significantly reduced the building performance.
Although there are many studies on the performance-driven design of teaching buildings at present, these papers do not explain how architects scientifically screen a large number of dominant solutions after optimization. At the same time, even though architects obtain better performance plans in multi-objective performance optimization at the early stage of the architectural scheme, they will continue to refine the scheme due to other non-performance factors, and will still carry out the repeated simulation. As the current simulation time is relatively time-consuming, fast prediction technology is necessary but the existing teaching-building performance-driven literature has not combined with fast performance prediction technology. To solve the above problems, this research creates a teaching architecture design framework based on building performance optimization, clustering analysis, and fast performance prediction. Taking Nanjing Donglu Middle School as a research case, the author uses a genetic algorithm to optimize the building performance with multiple objectives, performs cluster analysis on the optimization results, and then uses the data generated in the optimization process to train the BP neural network. The trained neural network is then used to predict the performance, so as to help designers make better decisions in the early stage of building design, providing a rapid prediction method for building performance.

3. Methodology

3.1. Overview Workflow

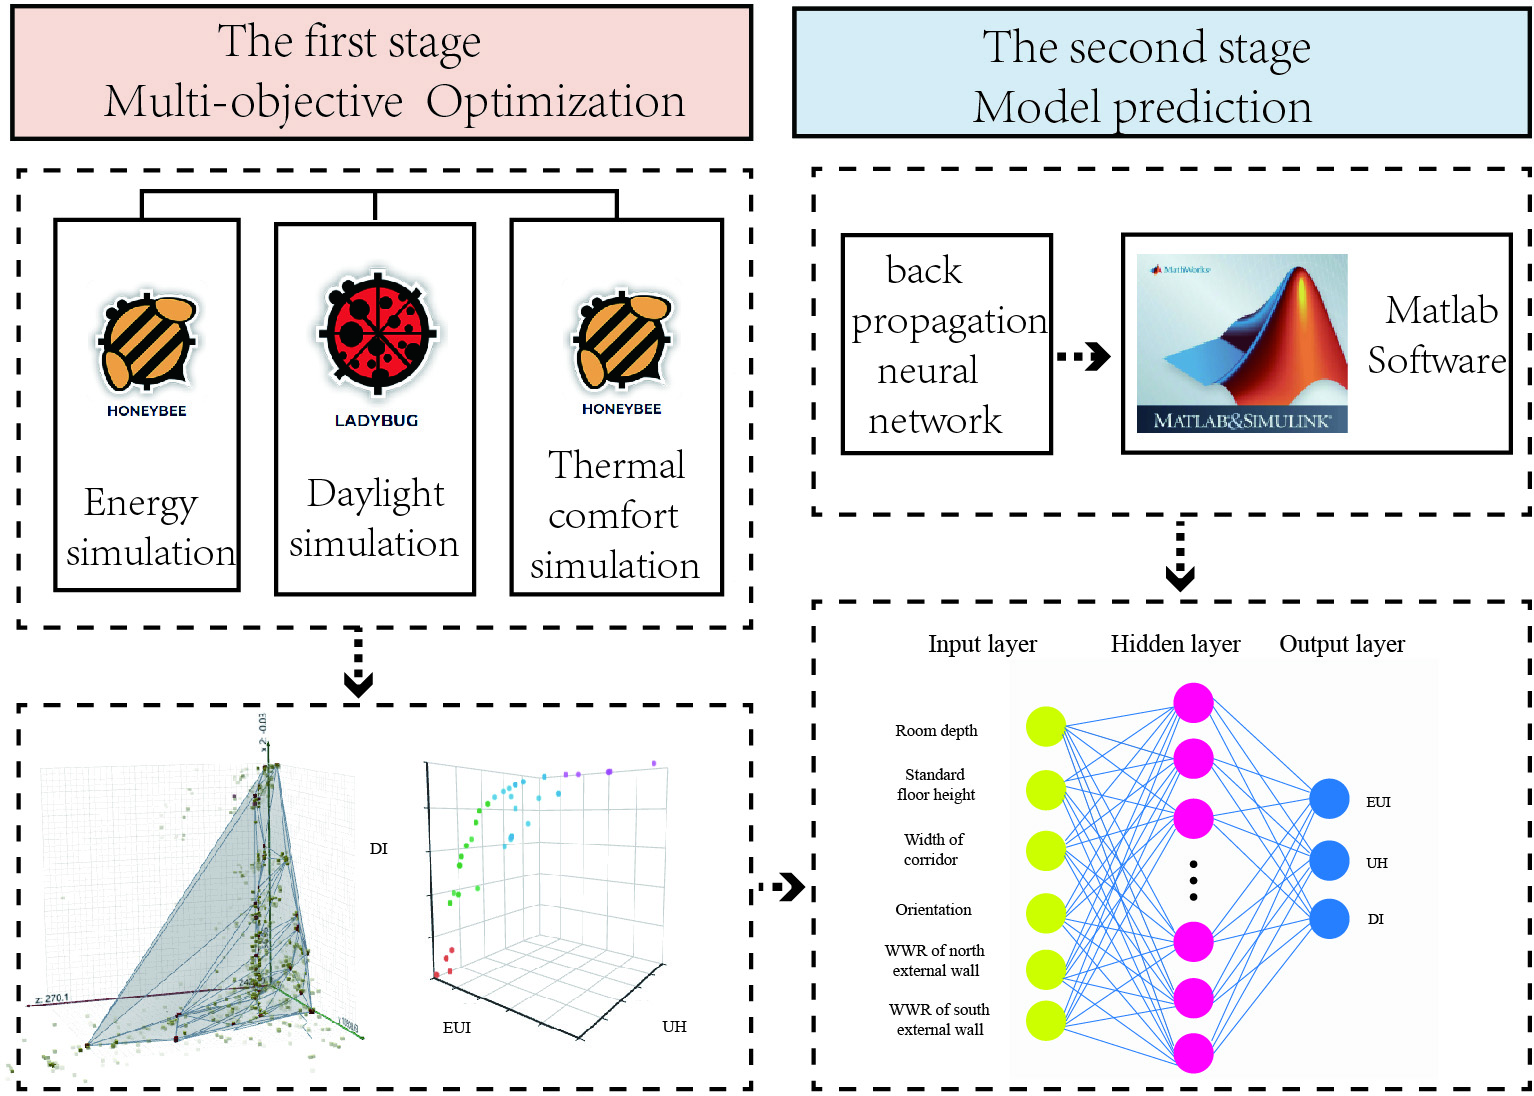
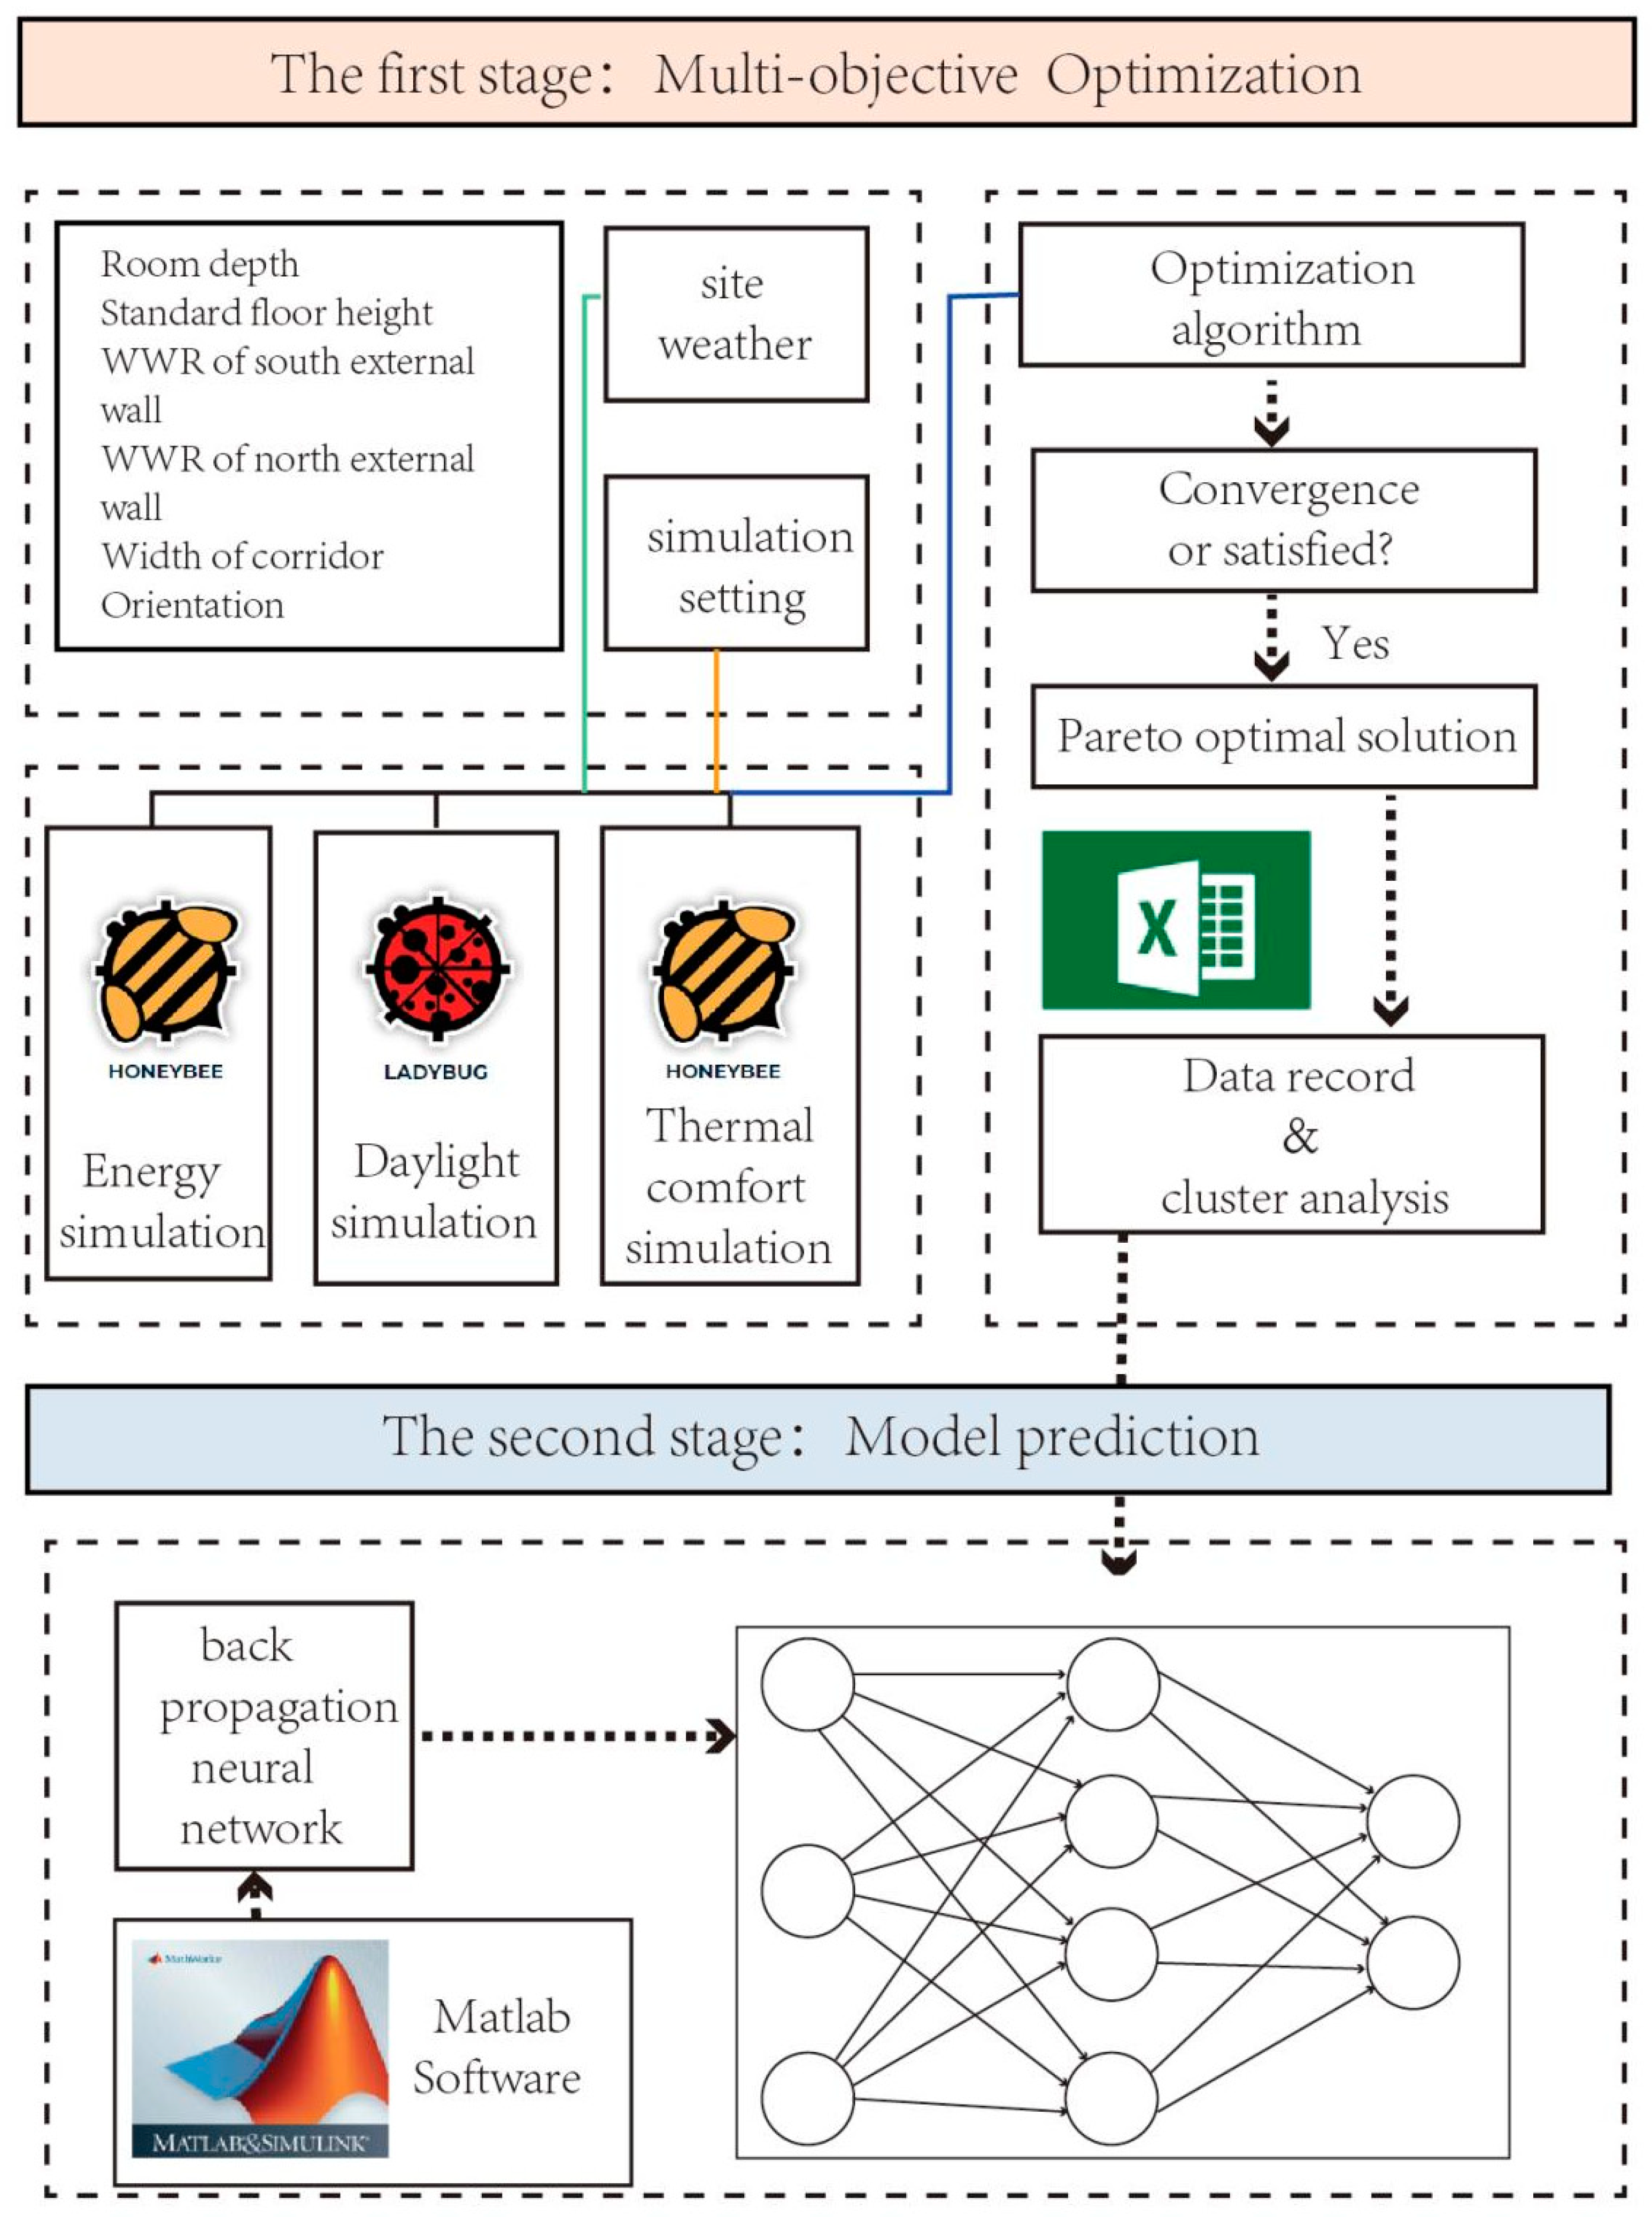
This study constructed a design framework for architects in the conceptual design stage of middle school teaching buildings. As shown in Figure 1, the framework is divided into two stages. The first stage is the building performance optimization stage. Architects first use the Grasshopper platform to establish a parametric model and use the plug-in Ladybug and Honeybee in the platform to simulate the thermal comfort, lighting, and energy consumption of the parametric model. Subsequently, the Octopus plug-in is used to conduct multi-objective optimization with: thermal comfort, lighting, and energy consumption as the optimization objectives; the design elements in the early stage of the design of teaching space as the optimization variables. Architects first sort out the data generated in the optimization process and use the data to train and verify the BP neural network, then the BP neural network is used to predict the architectural performance of the initial teaching space.

3.2. Relevant Tools and Indicators

3.2.1. Building Performance Simulation

In this study, the building performance simulation method was used to calculate the performance design objectives of teaching buildings. Based on OPENSTUDIO software, the energy consumption of buildings was simulated, and the annual heating energy consumption and cooling energy consumption of the teaching space were simulated. In the stage of building performance optimization, the energy consumption optimization index is EUI. The calculation method of EUI is to divide the annual total energy consumption of the building by its total building area.
This paper will use the average voting (PMV) as the evaluation index of thermal comfort because it is a comprehensive evaluation index that takes the basic equation of human thermal balance and the grade of psychophysiological subjective thermal sensation as the starting point, taking into account many relevant factors of human thermal comfort [19]. We will use the EnergyPlus software to simulate the average voting of the building and get the total number of uncomfortable hours (UH) in a year, so as to judge the thermal comfort of the building.
DAYSIM was the simulation software of lighting in this study. At present, the most commonly used indicators for lighting simulation are static evaluation indicators and dynamic evaluation indicators. Static evaluation indicators such as the lighting coefficient are only used to evaluate the lighting quality at a certain time in the room, while the dynamic evaluation indicator is used to evaluate the lighting quality for some time; therefore, the dynamic evaluation indicator is more comprehensive. In this study, the dynamic evaluation indicator of lighting (DI) was used.

3.2.2. Parametric Programming

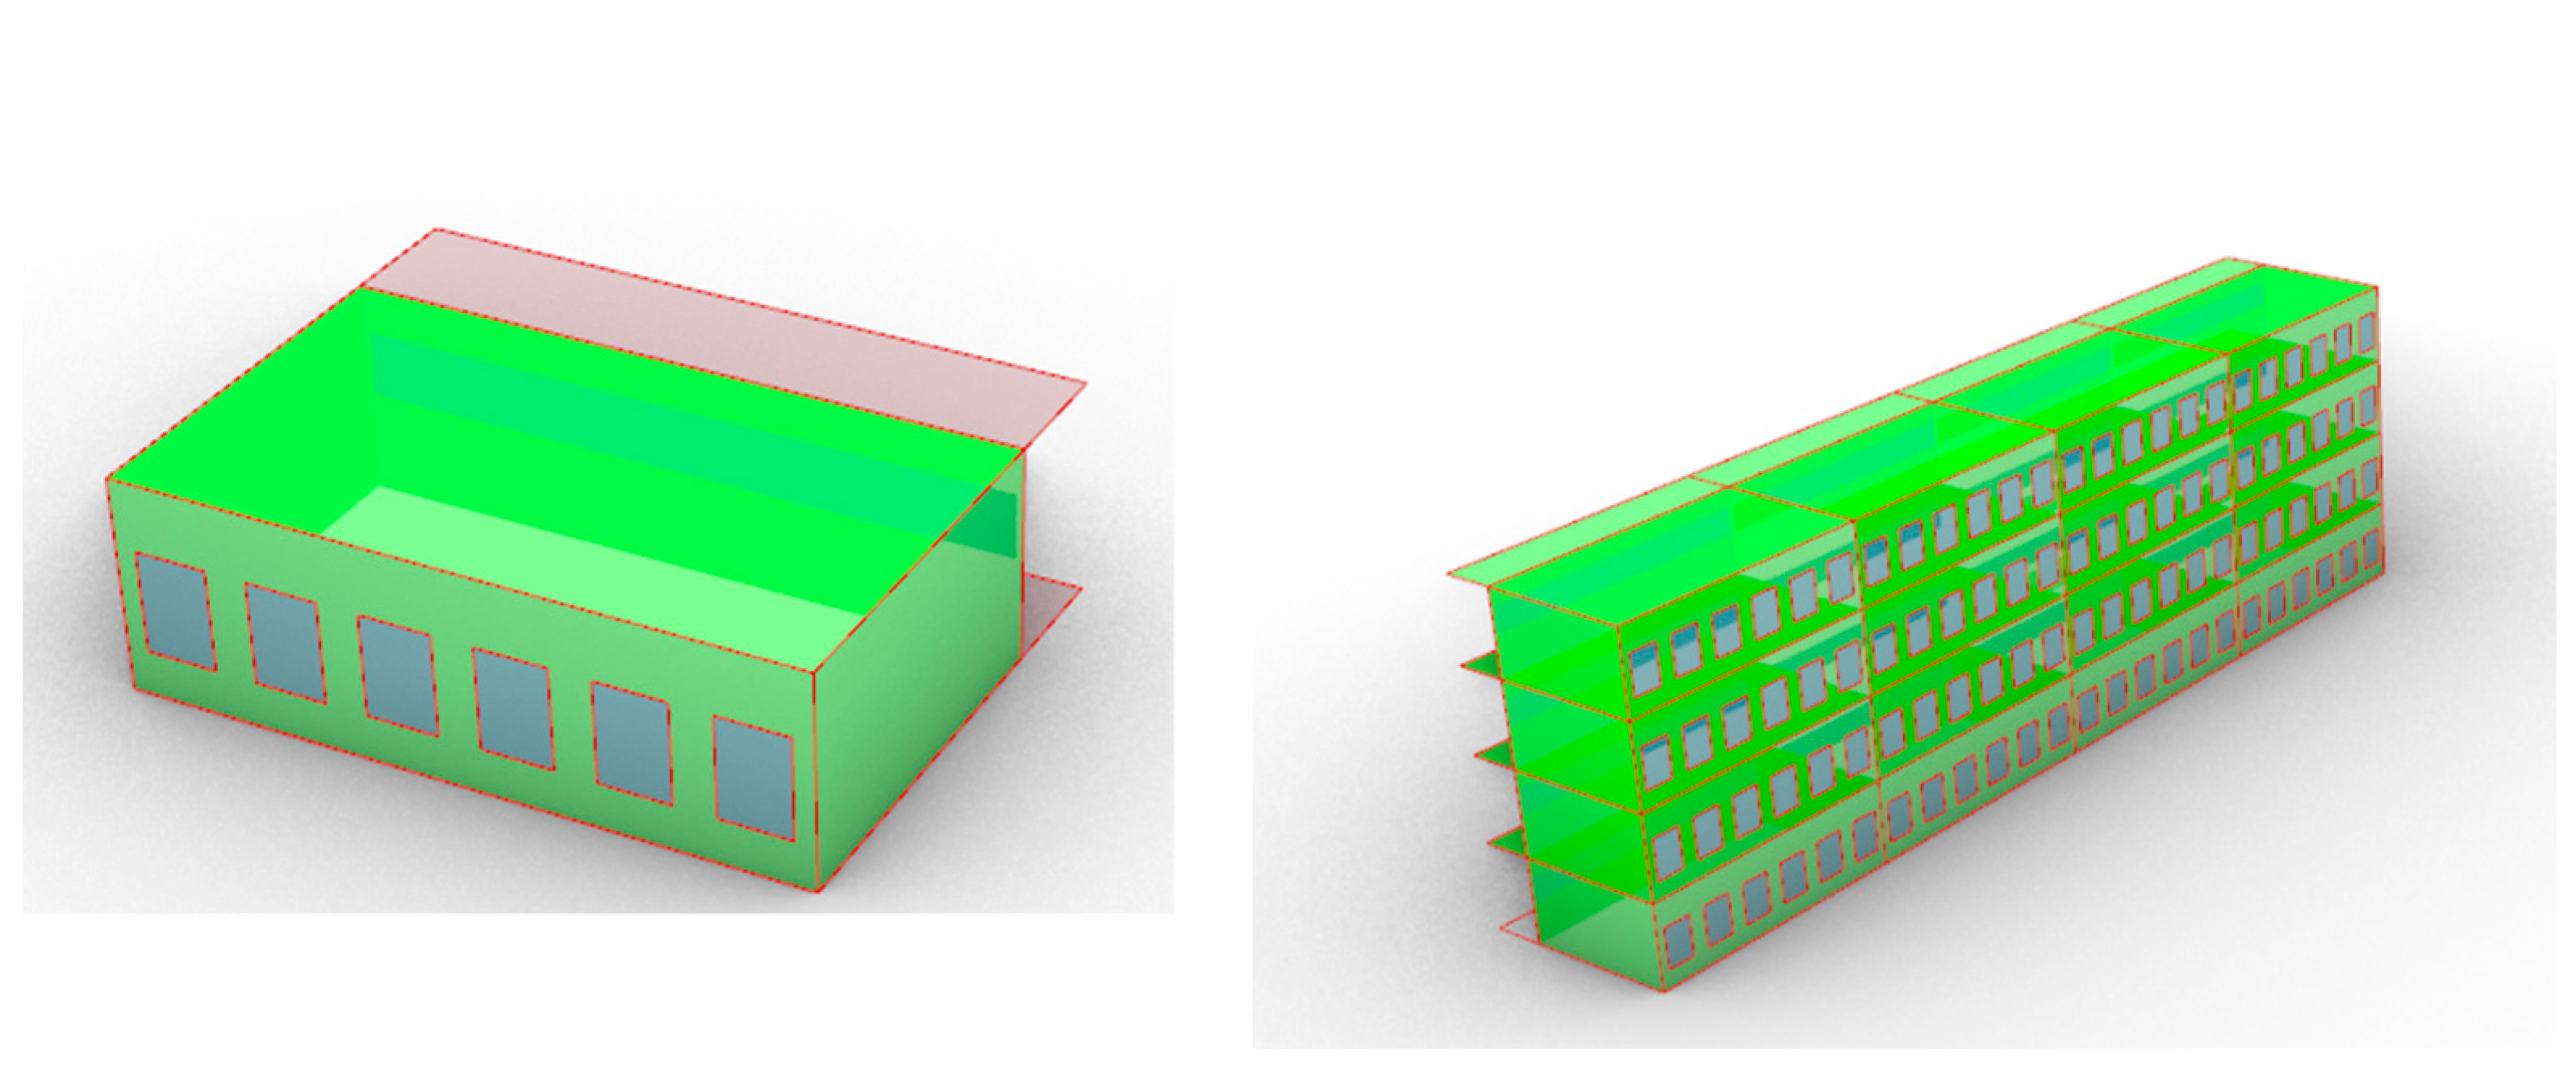
This research was based on the Grasshopper platform, where the seamless interaction of building information, environmental information, and performance information is achieved by the parametric modeling method, which provides necessary technical support for the integration of the building and environmental information, design, and evaluation process.

3.2.3. Genetic Algorithm

As mentioned above, this research will use NSGA-II as the optimization algorithm, and Octopus in the Grasshopper platform is a multi-objective optimization plug-in that combines the Pareto optimality principle and NSGA-II. The plug-in for multi-objective problems provides a wealth of custom optimization parameters options and interactive operation, providing architects with more rapid multi-objective services. So the Octopus plug-in was used to optimize the three objective functions of energy consumption, thermal comfort, and lighting in the Grasshopper platform. In this study, because the Octopus plug-in is the minimum value of the function, the study requires obtaining the maximum value of the lighting index DI; when using the Octopus plug-in to optimize the lighting index, DI should be multiplied by −1.

3.3. Neural Network Modeling

To obtain satisfactory results in terms of building parameters and performance at the early stage of design, architects need to repeatedly simulate the building performance to deliberate on the building scheme. As the simulation software is time-consuming, this study used a back propagation neural network prediction to replace software simulation. Back propagation neural networks are one of the most widely used neural network models at present.
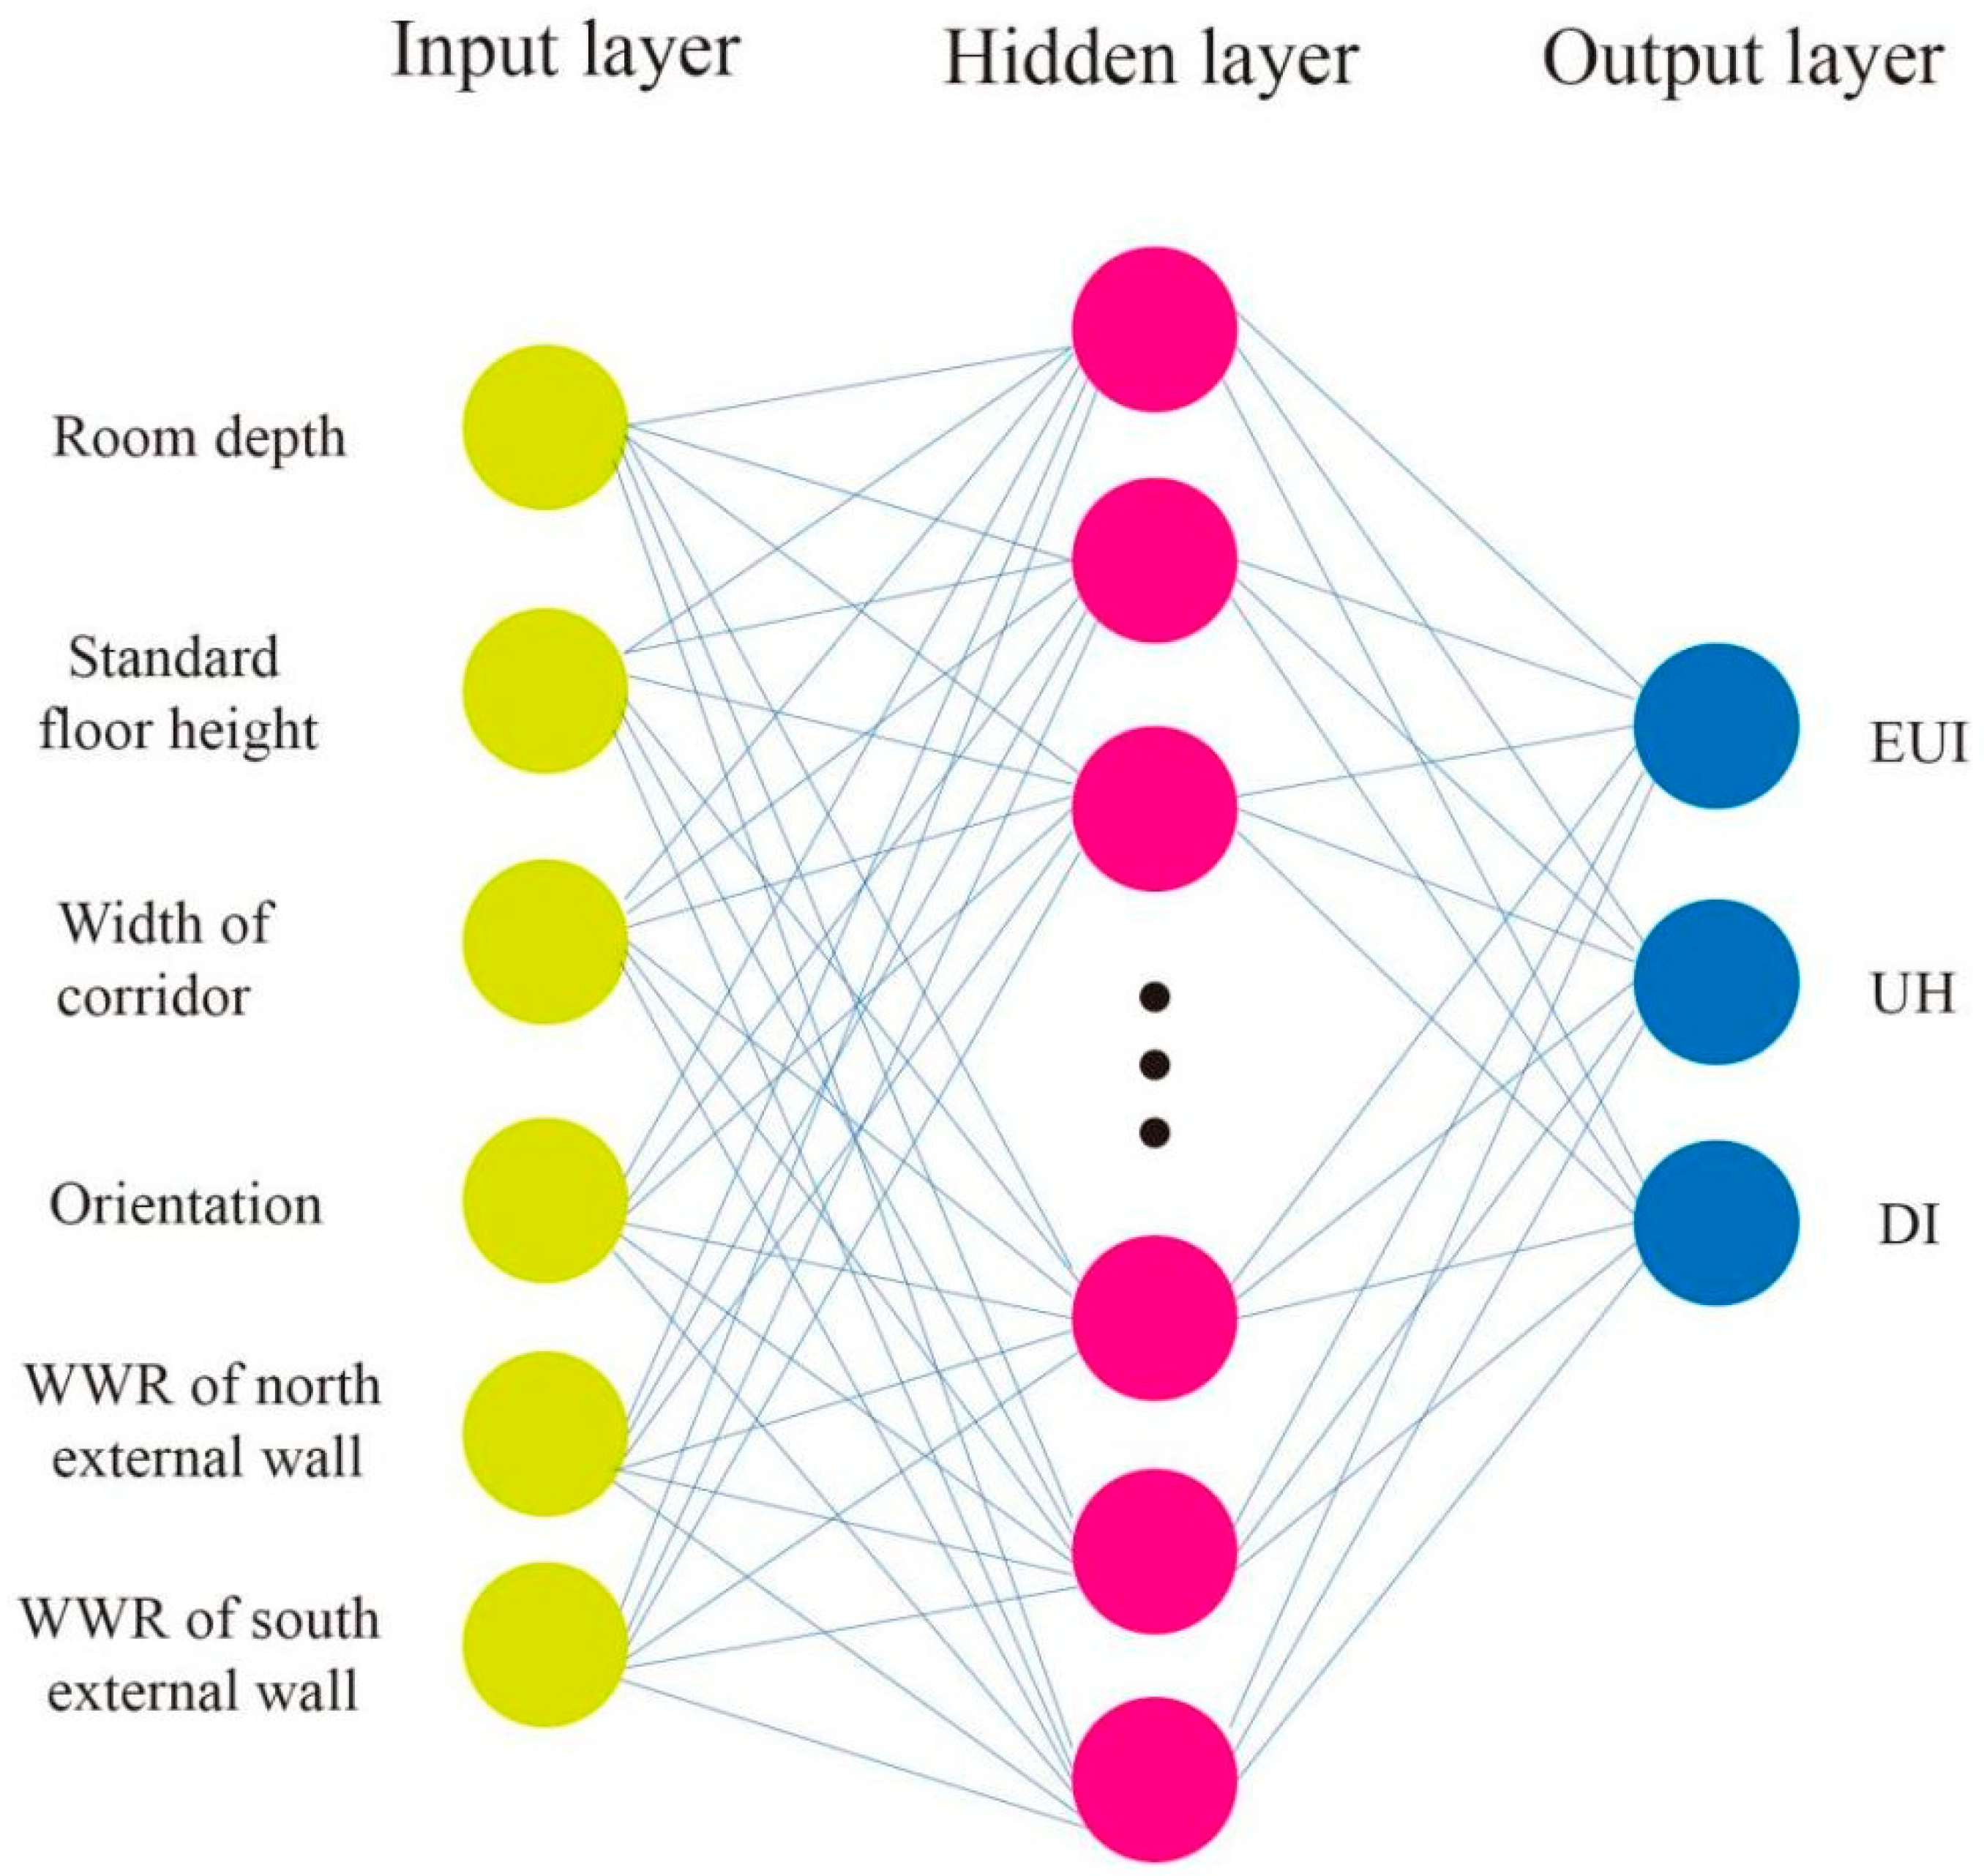
The back propagation (BP) neural network is a concept proposed by scientists led by Rumelhart and McClelland in 1986. It is a multi-layer feedforward neural network trained according to the error back propagation algorithm. The basic idea of the BP algorithm is that the learning process consists of two processes: the forward propagation of signal and the backward propagation of error.
During forward propagation, the sample features are input from the input layer, the signal is processed by each hidden layer, and finally transmitted to the output layer. For the error between the actual output and the expected output of the network, the error signal is back-transmitted from the last layer to obtain the error learning signals of each layer, and then the weights of each layer of neurons are corrected according to the error learning signals. This signal forward propagation, error backpropagation, and then using each layer to adjust the weight of the process are repeated. The process of the continuous adjustment of weights is also the process of network learning and training. This process is carried out until the network output error is reduced to below the preset threshold or exceeds the preset maximum number of training. The hidden layer of the BP neural network can be divided into a single layer or a multi-layer. To save time for architects, this study selects a hidden layer of the BP neural network whose structure is an input layer, a hidden layer, and an output layer. The training of the BP neural network in this study is based on the toolbox of MATLAB, with teaching architectural design variables as input information and building performance design objectives as output data to construct mapping relationships.
Among them, the activation function of the hidden layer adopts the Tansig function, as shown in Equation (1).
f ( x ) = 2 1 + exp ( 2 x ) 1
Select the linear activation function, namely the Purelin function, as the activation function of the output layer to transfer from the hidden layer to the output layer:
f ( x ) = x
In this study, the dataset was divided into a 70% training set, a 15% validation set, and a 15% test set. To improve the training and prediction efficiency, all data should be normalized to the range of 0 to 1. The calculation formula is shown in Equation (3).
y i = x i x m i n x m a x x m i n
where y i is the normalized data, x i is the original data, x m i n is the minimum value of the original data, and x m a x is the maximum value of the original data. After preprocessing all the data used, one of the most important steps is to determine the number of neurons in the hidden layer, which can be calculated by using Formula (4).
N = m + l + a

4. Case Study

4.1. Case Selection

As shown in Figure 2, Nanjing Donglu Middle School is located near Donglu Mountain, close to the Zhongshan Lake in Yongyang Town, Lishui District, Nanjing City, adjacent to 246 Provincial Road. There is convenient transportation and an elegant environment. The campus area of the school is about 30,500 m2 and there is only one teaching building on the whole campus. The architectural design is flexible, so the teaching building is selected as the research case.

4.2. Parametric Modeling and Variable Setting

In the scheme design stage, the architect’s task is to determine the basic architectural features such as the building shape, orientation, WWR, etc., that meet the requirements of the owner and comprehensively consider the climate, external environment, user requirements, etc., to prepare for the subsequent design [14,20]. As the design framework mentioned above is limited to the scheme design stage, we study the depth of the building volume, floor height, window–wall ratio, deflection angle, and the width of the corridor space as design parameters. We parameterized the design parameters of the orientation of the building, the depth of the teaching space, and the height of the floor within the scope of China’s codes, as shown in Table 1.
This study mainly studies the lighting, thermal comfort, energy consumption, and other performances of the teaching unit, and simplifies the model to remove the space unrelated to the teaching unit such as the stairwell. As shown in Figure 3, according to the variables determined above, the Grasshopper is used for parametric modeling.

4.3. Performance Simulation and Optimization Parameter Settings

According to relevant lighting codes in our country: The average illumination value of the classroom desktop shall not be lower than 300l× and not higher than 2000l×. So the good lighting range of the teaching space should be 300l×–2000l×. The height of the lighting simulation is set to 0.75 m in the Ladybug plug-in, and a measuring point is set every 1 m in length and width. The reflectance values of the floor, inner wall, ceiling, and glass in the simulation model are 0.4, 0.65, 0.75, and 0.8, respectively.
In the simulation of energy consumption and thermal comfort, the HVAC system is set to central air-conditioning and the meteorological data of Nanjing (* epw) is imported into the Grasshopper platform. In the teaching space, the opening temperature of the air conditioner is 26 °C in summer and 20 °C in winter. Other parameter settings are shown in Table 2.
In the optimization of genetic algorithms, a smaller population size can accelerate the optimization process but it will reduce population diversity and lead to premature convergence, while a larger population size will reduce the efficiency of the genetic algorithm. In optimization practice, the population size is mostly controlled in the range of 20–100. The crossover rate is a parameter that controls the probability of individual offspring exchanging ’genes’. The cross probability is mostly controlled within the range of 0.40 to 0.99. In summary, the parameter settings of the genetic algorithm are shown in Table 3.

5. Case Result Analysis

5.1. Analysis of Optimization Results

The grey grid of Figure 4 is the non-dominated solution generated after 100 generations of optimization. The concept of non-dominated solutions is: Assuming that any two solutions S1 and S2 are superior to S2 for all objectives, we call S1 dominating S2. If the solution of S1 is not dominated by other solutions, S1 is called a non-dominated solution, also known as the Pareto solution. The set of these non-dominated solutions is called Pareto Front. All solutions located in the Pareto Front are not dominated by solutions outside the Pareto Front (and other solutions within the Pareto Front curve), so these non-dominated solutions have the least target conflict compared with other solutions, which can provide a better choice space for decision-makers. The near-point grids of the non-dominated solution set are shuttle-shaped concave surfaces. The number of non-dominated solutions is relatively large in the middle region and relatively small near the boundary value of each performance target; this indicates that when the value of each target is in the range of values that is biased towards the middle-value position, the number of non-dominated solutions is relatively large, and the relatively optimal architectural form energy-saving design scheme that designers can choose from is also more varied. In the solution space region that is biased towards the performance limit level, the number of non-dominated solutions is less, indicating that to achieve the limit state of a certain architectural performance design target, the relatively optimal architectural form energy-saving design scheme that designers can choose from is less varied.

5.1.1. Non-Dominated Solution Correlation Analysis

Figure 5 presents the Pareto optimal solution results of three goals and their distribution. In the figure, the X-axis represents DI, the Y-axis represents UH, and the Z-axis represents EUI. It can be seen from the figure that the percentage of lighting DI and the annual uncomfortable hours of thermal comfort increase with the increase in energy consumption. The reason may be that lighting quality is closely related to the window–wall ratio. The lighting quality is also improved with the increase in the window–wall ratio, but the increase in the window-to-wall ratio will make summers hotter and winters colder, resulting in an increase in uncomfortable hours. Meanwhile, maintaining a comfortable indoor temperature requires more energy. Therefore, the DI is proportional to EUI and UH.
As shown in Figure 5, in the non-dominated solutions, the value of DI is distributed in the range of 0% to 60%, mainly in the range of 30% to 60%. The value of EUI is distributed in the range of 240 KWh/m2 to 270 KWh/m2, mainly concentrated in 240 KWh/m2 to 250 KWh/m2; the value of UH ranges from 18,700 h to 19,000 h, mainly concentrated in 18,700 h to 18,900 h.
After normalizing the three performance data in the non-dominated solution, it is found that the data distribution range of effective natural lighting DI performance is the widest, followed by the data of building energy consumption, and the data distribution range of thermal uncomfortable hours is the least. This shows that in the process of optimization design, the adjustment of building shape design parameters has an obvious influence on effective natural lighting.

5.1.2. Cluster Analysis of Non-Dominated Solutions

Due to a large number of non-dominated solutions, and through Figure 4 and Figure 5, it can be seen that the data distribution of non-dominated solutions of the three architectural properties is relatively discrete. In order to facilitate architects to select the appropriate architectural scheme in the non-dominated solution, this study used the clustering method for analysis.
To quickly classify 60 groups of non-dominated solutions and extract representative schemes, this study used the K-means clustering algorithm in the sklearn module. Figure 6 shows the analysis of the effect of non-dominated disaggregation. The horizontal axis represents the number of clusters and the vertical axis represents the clustering effect. When the number of clusters ≥ 4, the clustering effect tends to be stable, so the number of clusters is determined as four. Figure 7 shows the spatial map formed after dividing the non-dominated solution into four clusters, while Table 4 shows the centroid in each category, that is, the most representative scheme in each category. The box diagram in Figure 8 shows the distribution of non-dominated solutions for four clusters in a single-objective performance. As shown in Figure 8, the EUI, DH, and DI values of cluster 1 are the lowest, indicating that cluster 1 has the best energy-saving effect and the best comfort in space but the worst lighting effect; the EUI value, DH value, and DI value of cluster 4 are the highest, indicating that cluster 4 has the best lighting effect but the worst energy saving effect and comfort in space. Through the above analysis, it can be seen that the centroid scheme of cluster 1 should be selected if architects prefer the scheme with better energy consumption and thermal comfort performance, the centroid scheme of cluster 4 should be selected if architects prefer the scheme with better lighting performance, and the centroid scheme of cluster 2 or cluster 3 should be selected if three schemes with balanced performance are selected. The centroid scheme of cluster 2 is close to that of cluster 3 in terms of energy consumption and lighting values but the centroid of cluster 2 is significantly better than that of cluster 3 in terms of thermal comfort performance. After comprehensive consideration, we think that the centroid of cluster 3 should be the three schemes with the best performance. The parameters of the centroid 3 scheme are shown in Table 5. As shown in Figure 9, we compare the final scheme obtained after optimization with the original case: the three performance indicators EUI, DI, and UH of the optimized scheme are better than the original scheme, which shows that this method has certain effects on performance optimization and is worth promoting.

5.2. Performance Prediction Analysis

In this chapter, this paper used MATLAB software to train the BP neural network using the data generated in the multi-objective optimization process mentioned above and then used the trained BP neural network to predict building performance.

5.2.1. Correlation Analysis between Design Parameters and Performance Objectives

To understand whether there is a correlation between design variables and building performance objectives, this study used the Pearson product-moment correlation coefficient to analyze them. The number in the block shown in Figure 10 is the correlation coefficient, which represents the correlation between the horizontal and vertical coordinates. The value of the correlation coefficient is between −1 and 1, and the greater the absolute value, the stronger the correlation. The correlation is divided into six levels according to the correlation coefficient value: 0.8–1.0 is highly correlated, 0.6–0.8 is strongly correlated, 0.4–0.6 is moderately correlated, 0.2–0.4 is weakly correlated, and 0.0–0.2 is extremely weakly correlated or unrelated. If the correlation coefficient between a design variable and building performance is 0–0.2, designers should remove the design variable in the later neural network construction. It can be seen from Figure 11 that the design variables X1–X6 have a certain weight relationship with the building performance objectives EUI, UH, and DI, and the above variables are retained in the subsequent BP neural network training.

5.2.2. Performance Prediction

Through the correlation analysis between the design variables and optimization objectives, this study determined the framework of the BP neural network in this design case. As shown in Figure 11, the framework of the BP neural network is composed of one input layer, one hidden layer, and one output layer. The input layer contained six design variables and the output layer contains three performance objectives. Since 3000 sets of data were generated in the multi-objective performance optimization stage, we used them as data sets to train the BP neural network in MATLAB software. By repeatedly adjusting the number of neurons in the neural network, when the number of neurons was 16, the BP neural network model, of the minimum MSE and the maximum R, was obtained.
MSE refers to the expected value of the squared difference between the predictive value and the true value of the parameter, which is usually used to evaluate the similarity between the predicted value and the actual value. The smaller the MSE value, the better the robustness of the model. Figure 12 shows the process of the mean square error gradient descent. The MSE values of the three data sets decreased significantly in the initial stage and tended to be stable with the epoch increases. Finally, when the epoch increased to 180, the MSE values of the validation set tended to be stable, its mean square error reached a low level, and the obtained value was 0.0002731.
The R-value represents the correlation between the predicted output and the target output. The closer the R-value is to 1, the closer the relationship between the prediction and the output data is. The closer the R-value is to 0, the greater the randomness of the relationship between the prediction and the output data is. When adjusting the neural network model, not only the R-value of the training set is required to be as large as possible but also the R-value of the training set and the test set must be close, otherwise there will be overfitting or underfitting. Overfitting and underfitting are two common reasons for the low generalization ability of the model, which are the results of the mismatch between the model learning ability and data complexity. The performance of under-fitting on both the training set and test set is poor, while over-fitting can often better learn the properties of training set data but the performance on the test set is poor.
As shown in Figure 13, the R-values of the training set and the test set are 0.998, and the ideal R-value of the model in the validation set is about 0.997. The R-values of the three are relatively high and close to 1, indicating that the model has a good fitting degree, and there is no over-fitting or under-fitting.
We randomly selected five groups of design variables within the specified range and brought them into the BP neural network model after learning. The five groups of predicted values were compared with the real simulation values. As shown in Table 6, the real value is close to the predicted value.
The test results show that the BP neural network can obtain a set of prediction data in less than 1 s, and the time required to simulate a set of data by simulation software is about 3 min. Therefore, a BP neural network not only predicts the building performance more accurately but also saves time compared with the performance of simulation software, to help designers make better decisions.

6. Conclusions

The main aim of this study is to provide architects with a design framework for building performance optimization and prediction in the scheme design stage of middle school teaching buildings. In the first stage of the framework, architects use a genetic algorithm to conduct multi-objective optimization of building performance and use the clustering method to analyze the optimized non-dominated solution. In the second stage of the framework, architects train the BP neural network with the data generated in the optimization process as the data set.
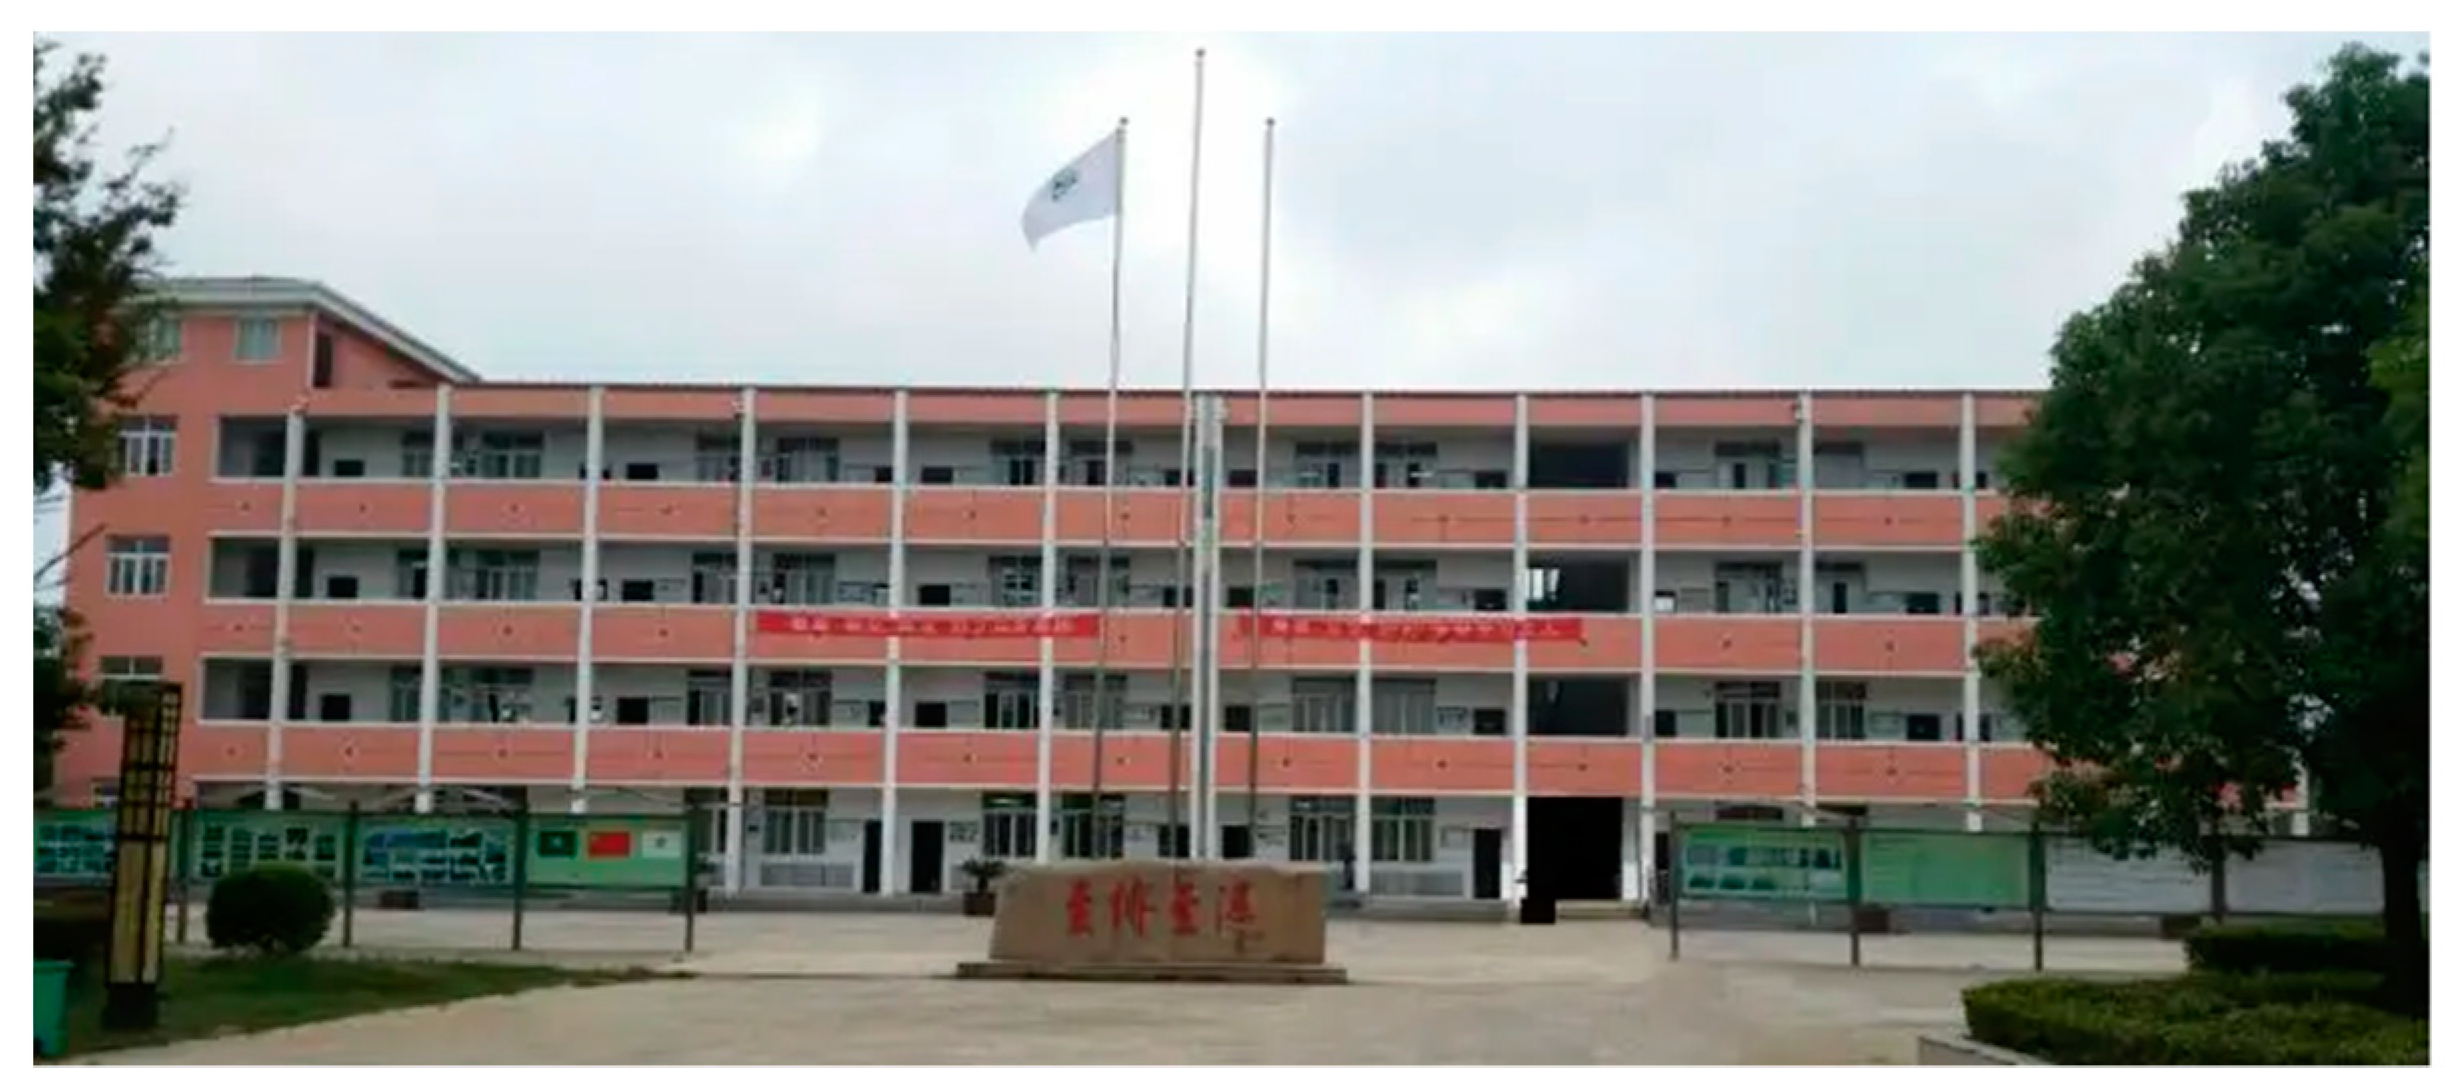
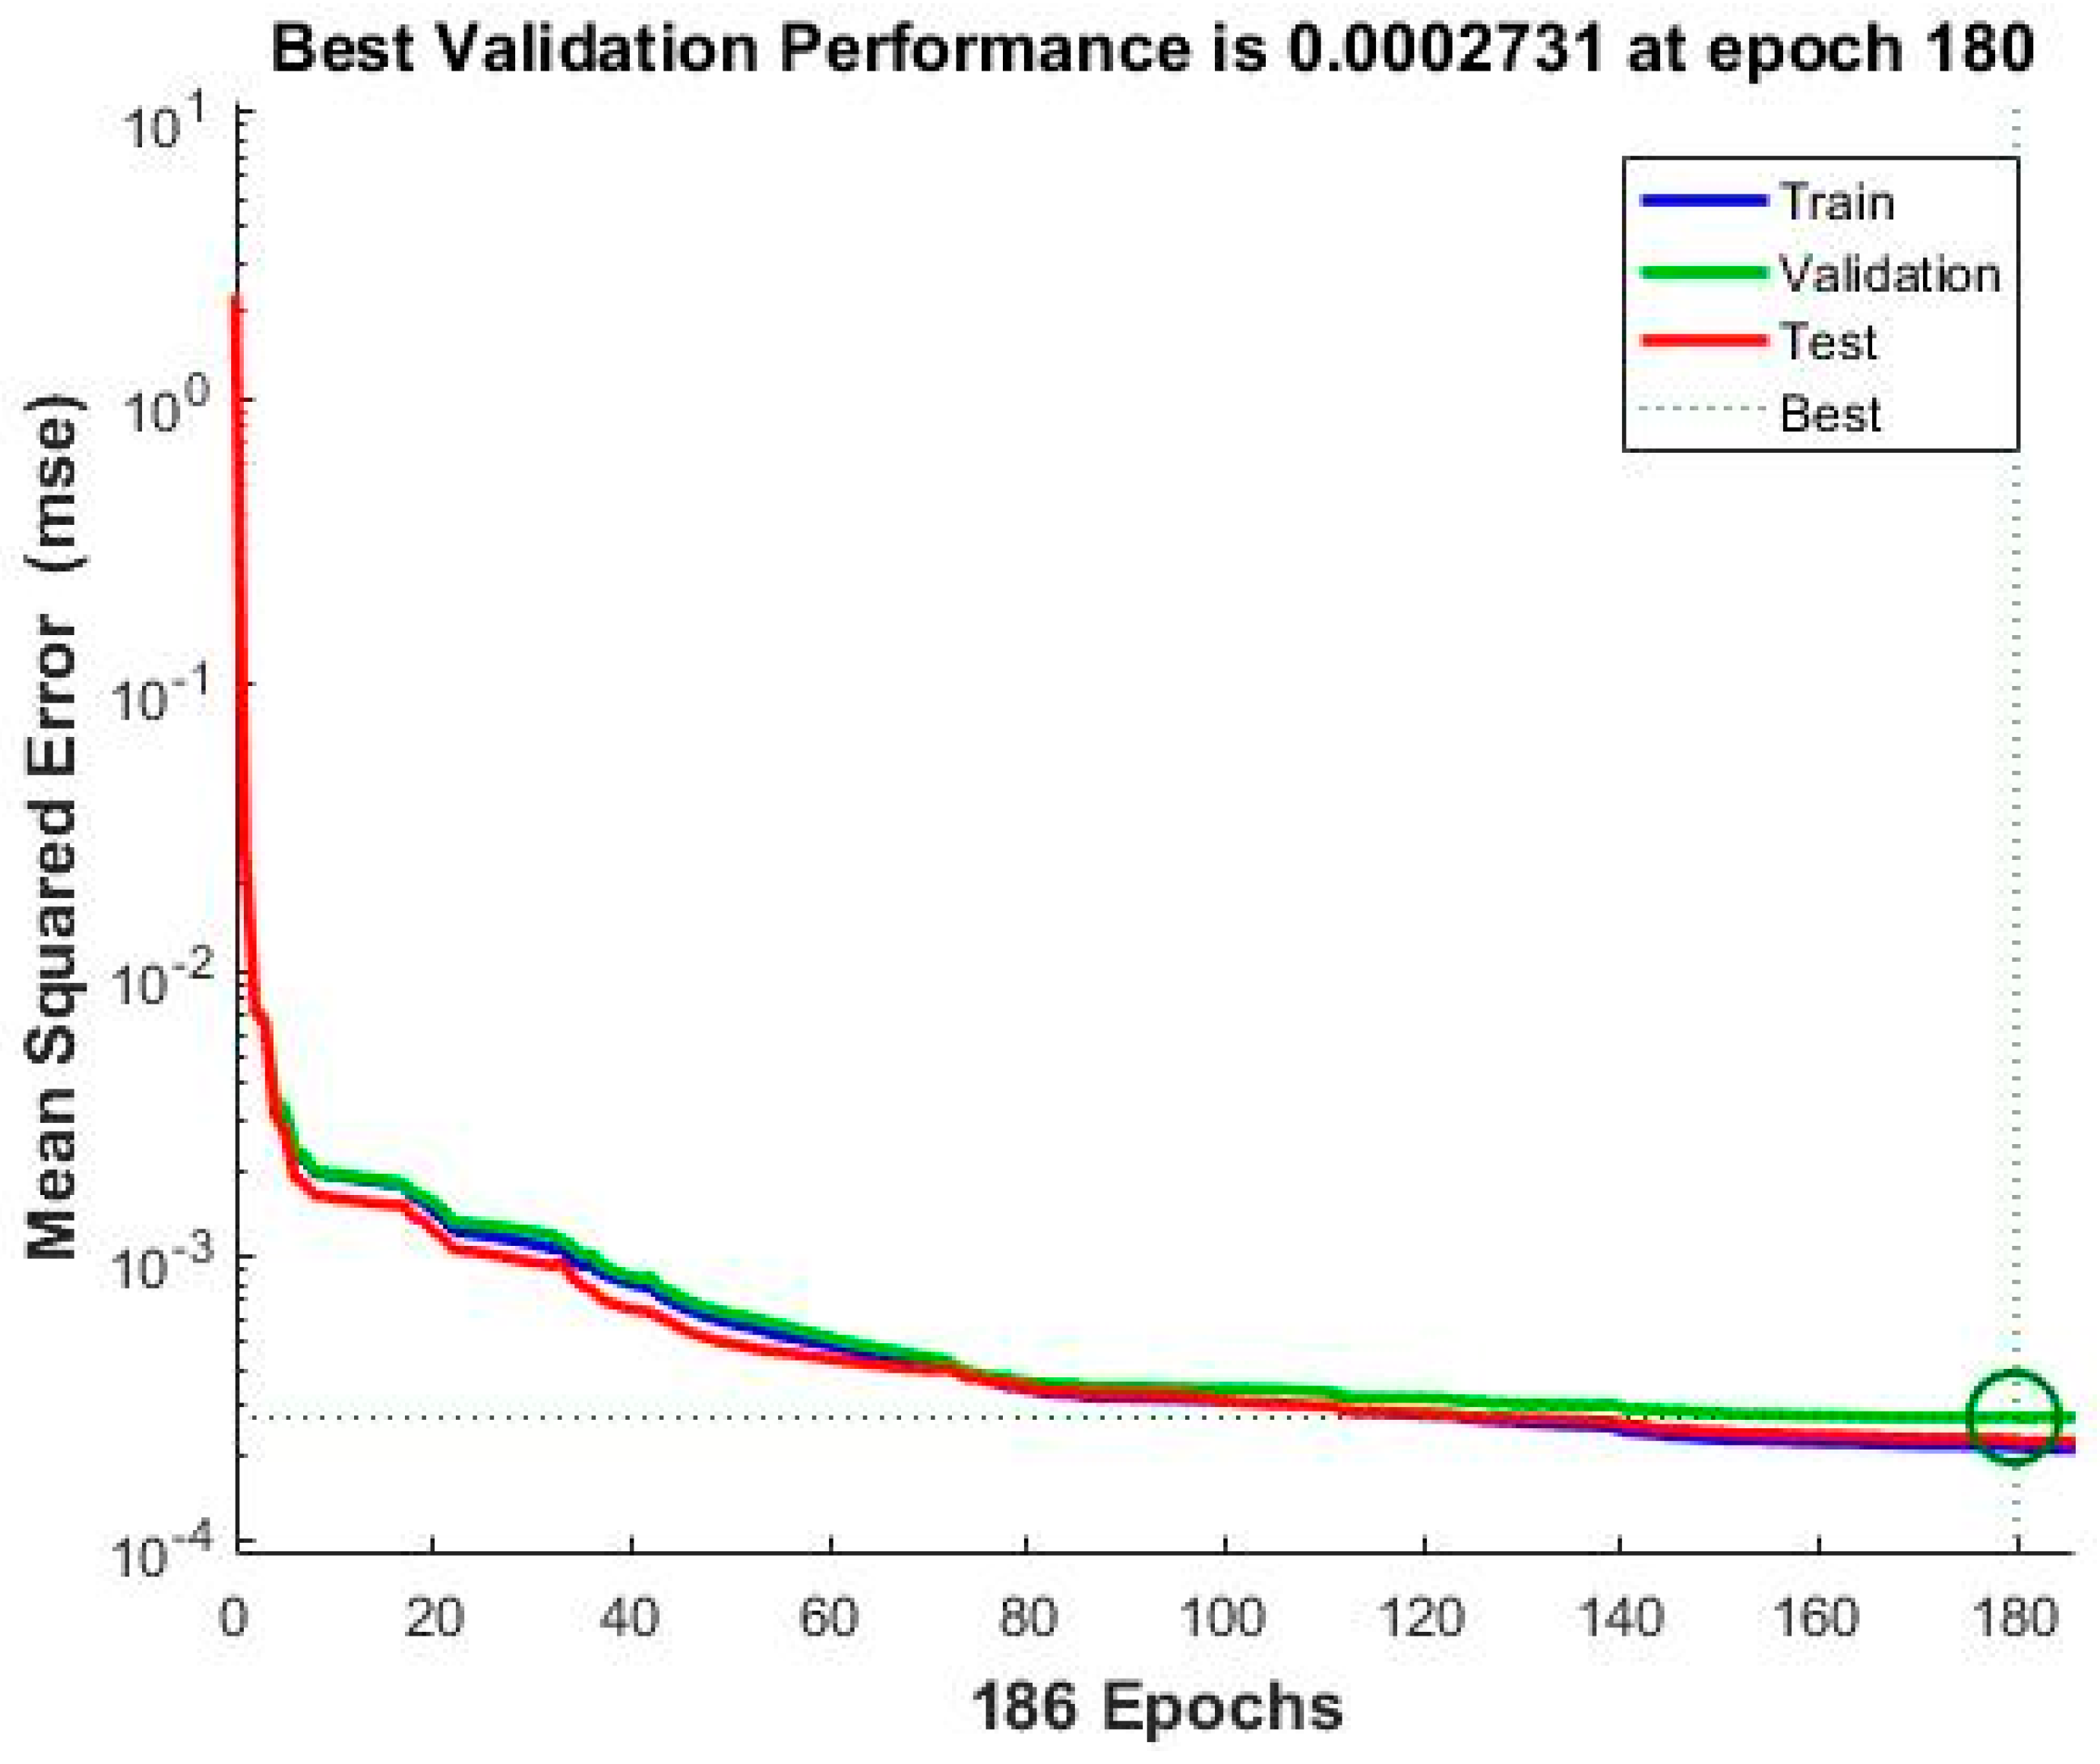
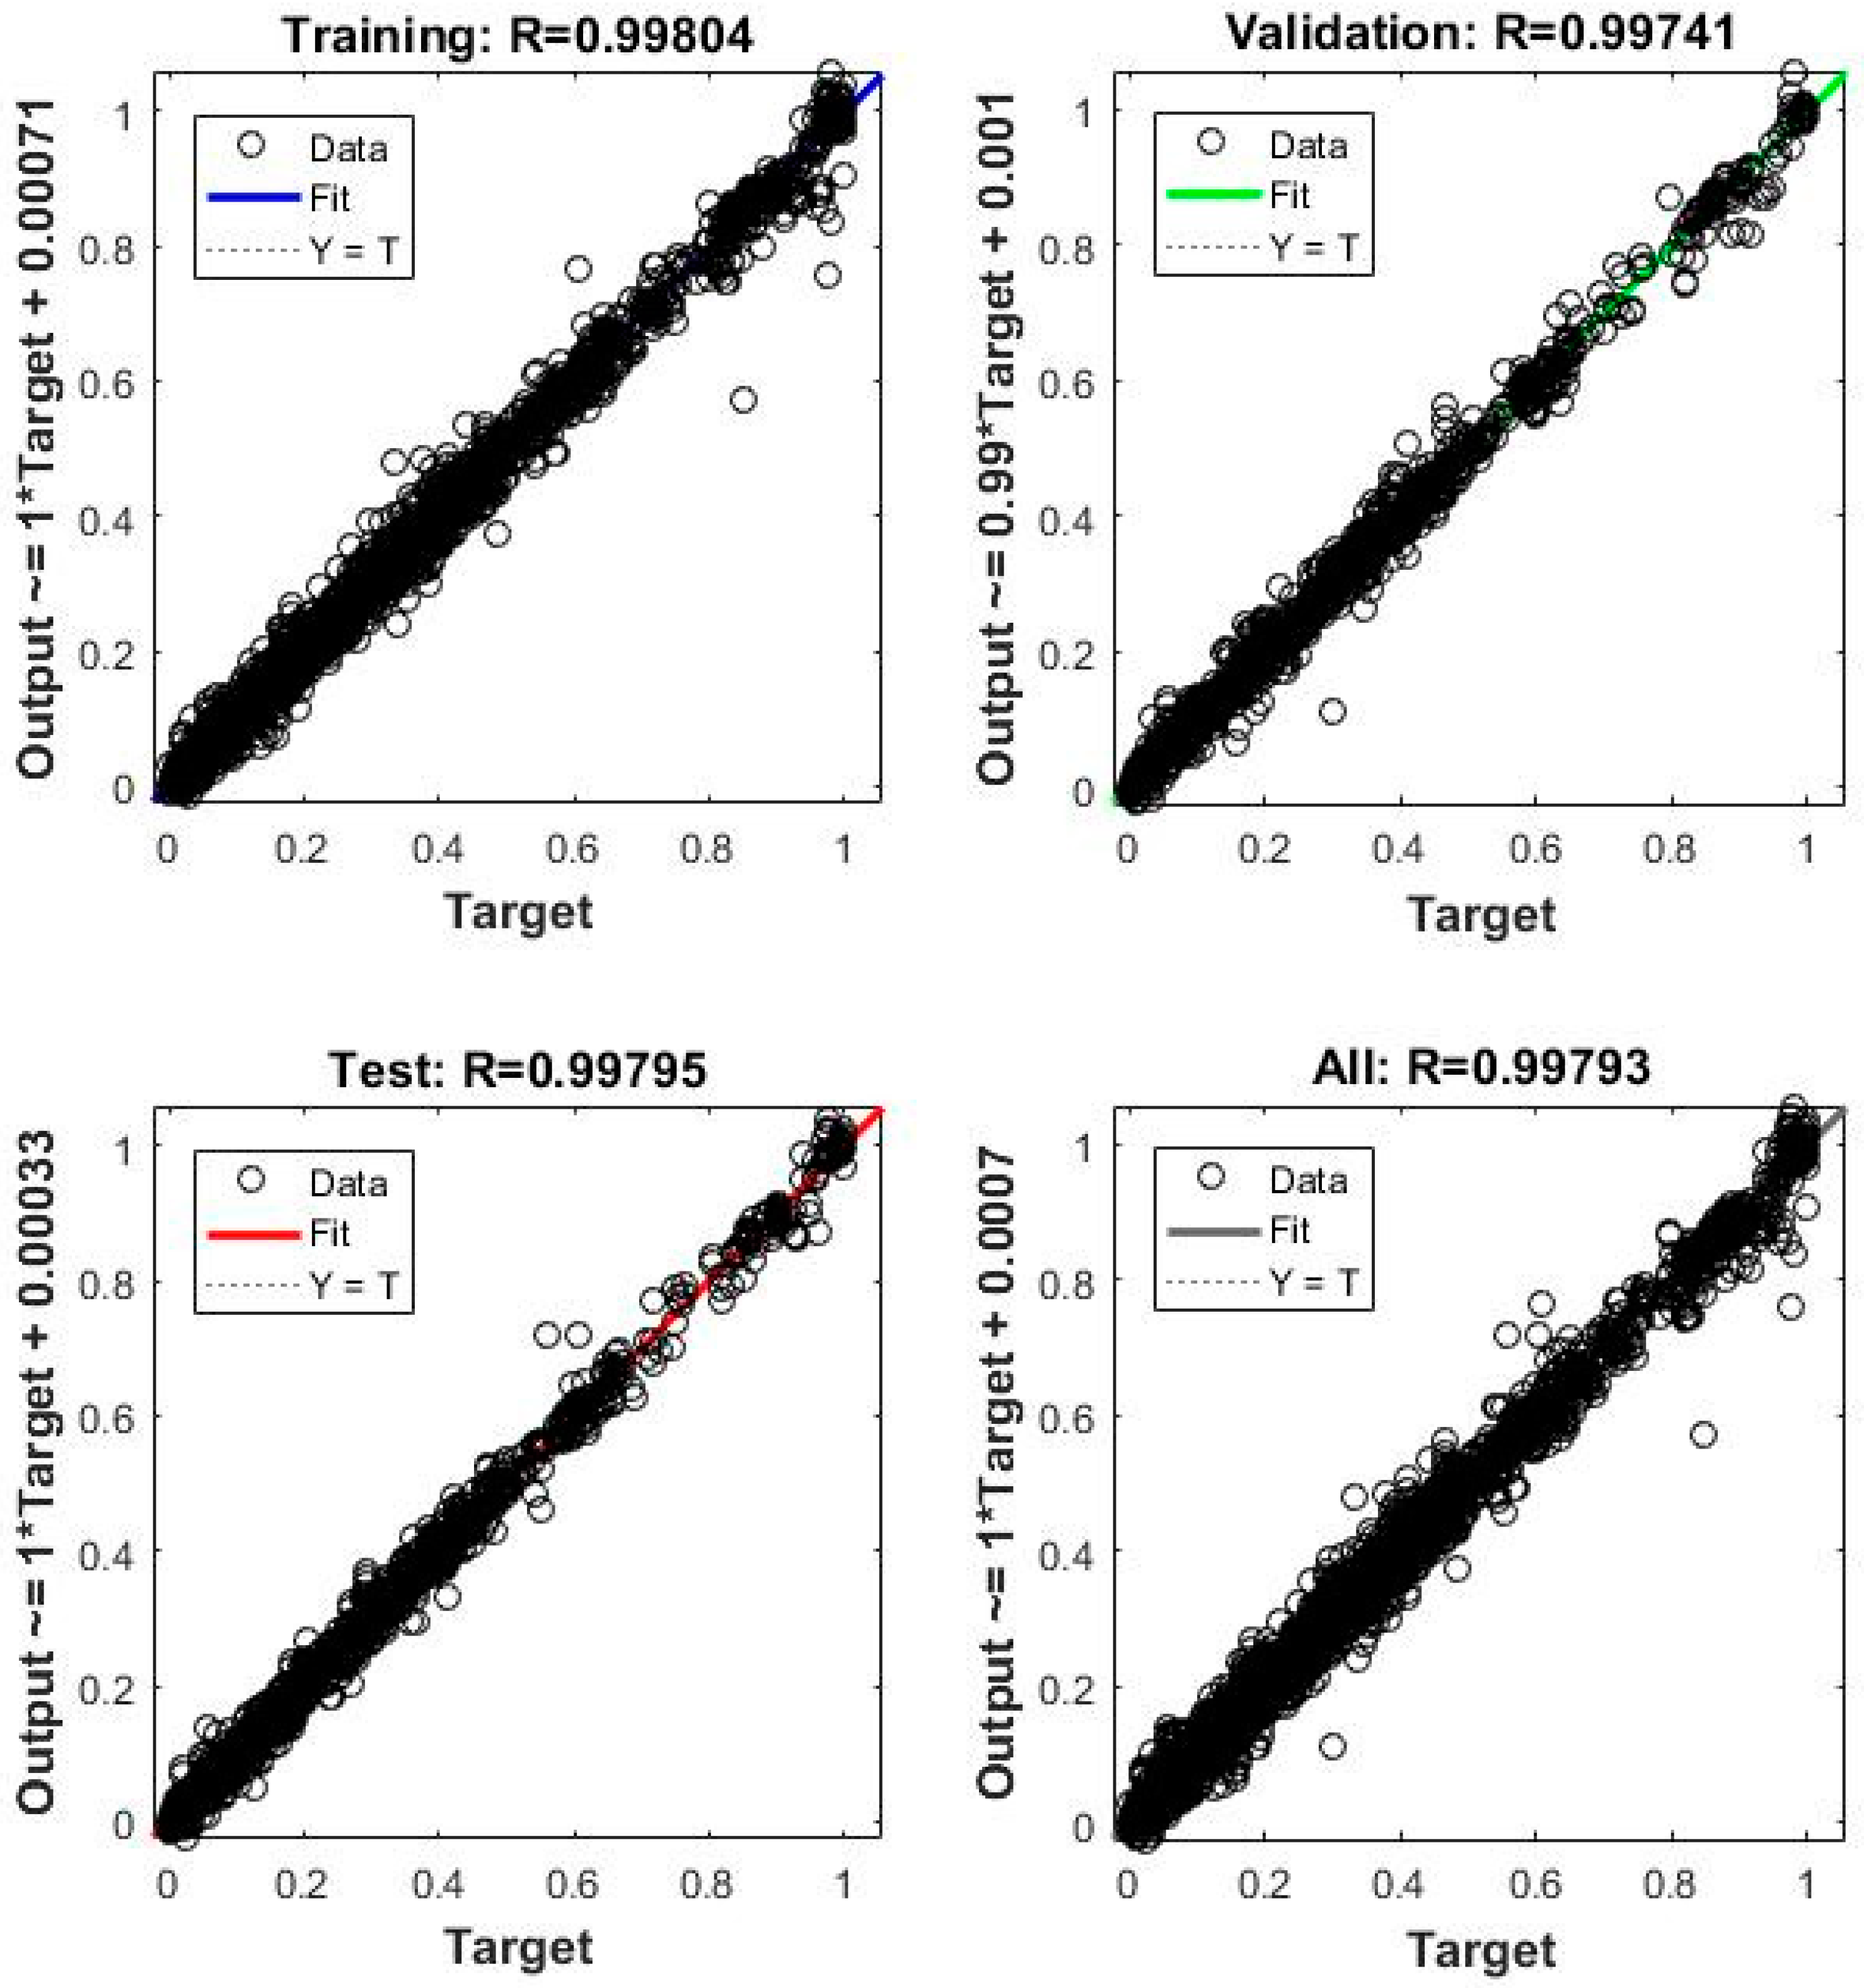
This paper selected Nanjing Donglu Middle School as a case study, through building performance multi-objective optimization and cluster analysis to select the solutions needed by architects. The BP neural network model with the R-value of about 0.998 in the training set and test set was obtained by machine learning. Five groups of design variable data were randomly selected within the specified range and put into the model for verification. The predicted value was close to the simulated value, and it was proved that the BP neural network was more time-saving than the simulation software in predicting the building performance. As previous scholars rarely applied the dynamic evaluation index of lighting and neural network application in the preliminary design of teaching buildings, this study attempts to apply the dynamic evaluation index of lighting and a BP neural network application in the conceptual design of middle school teaching buildings.
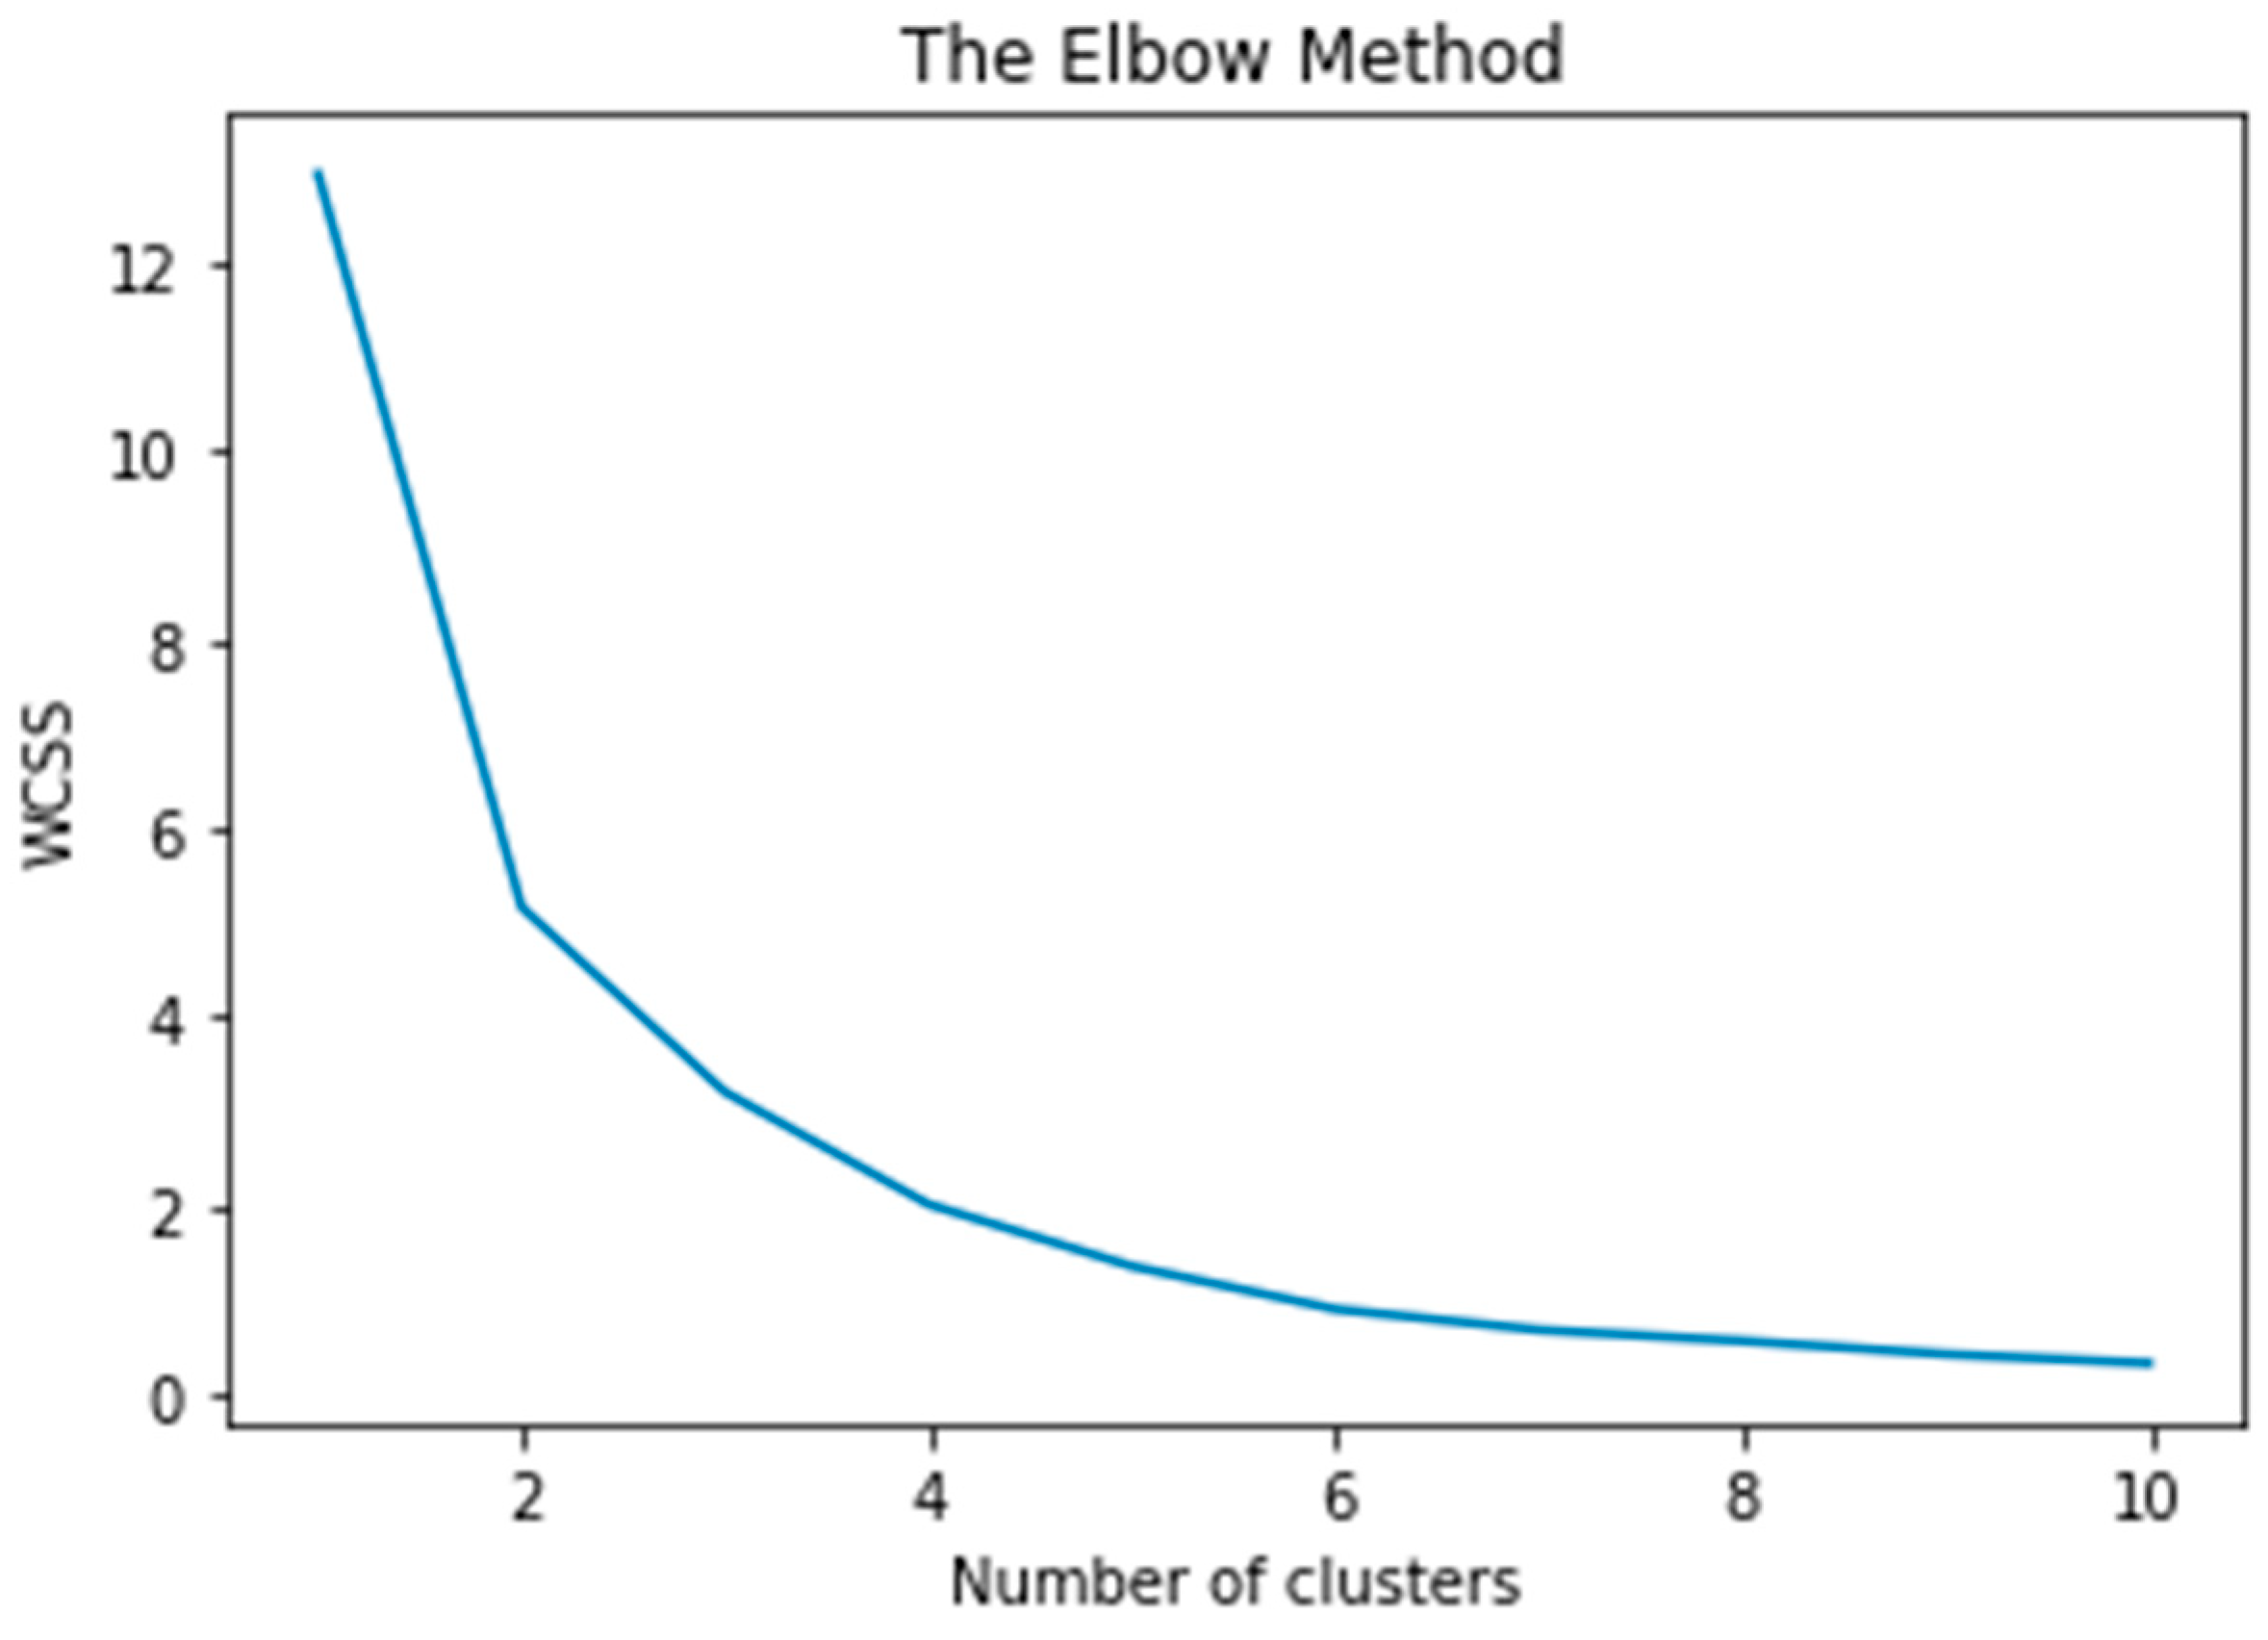
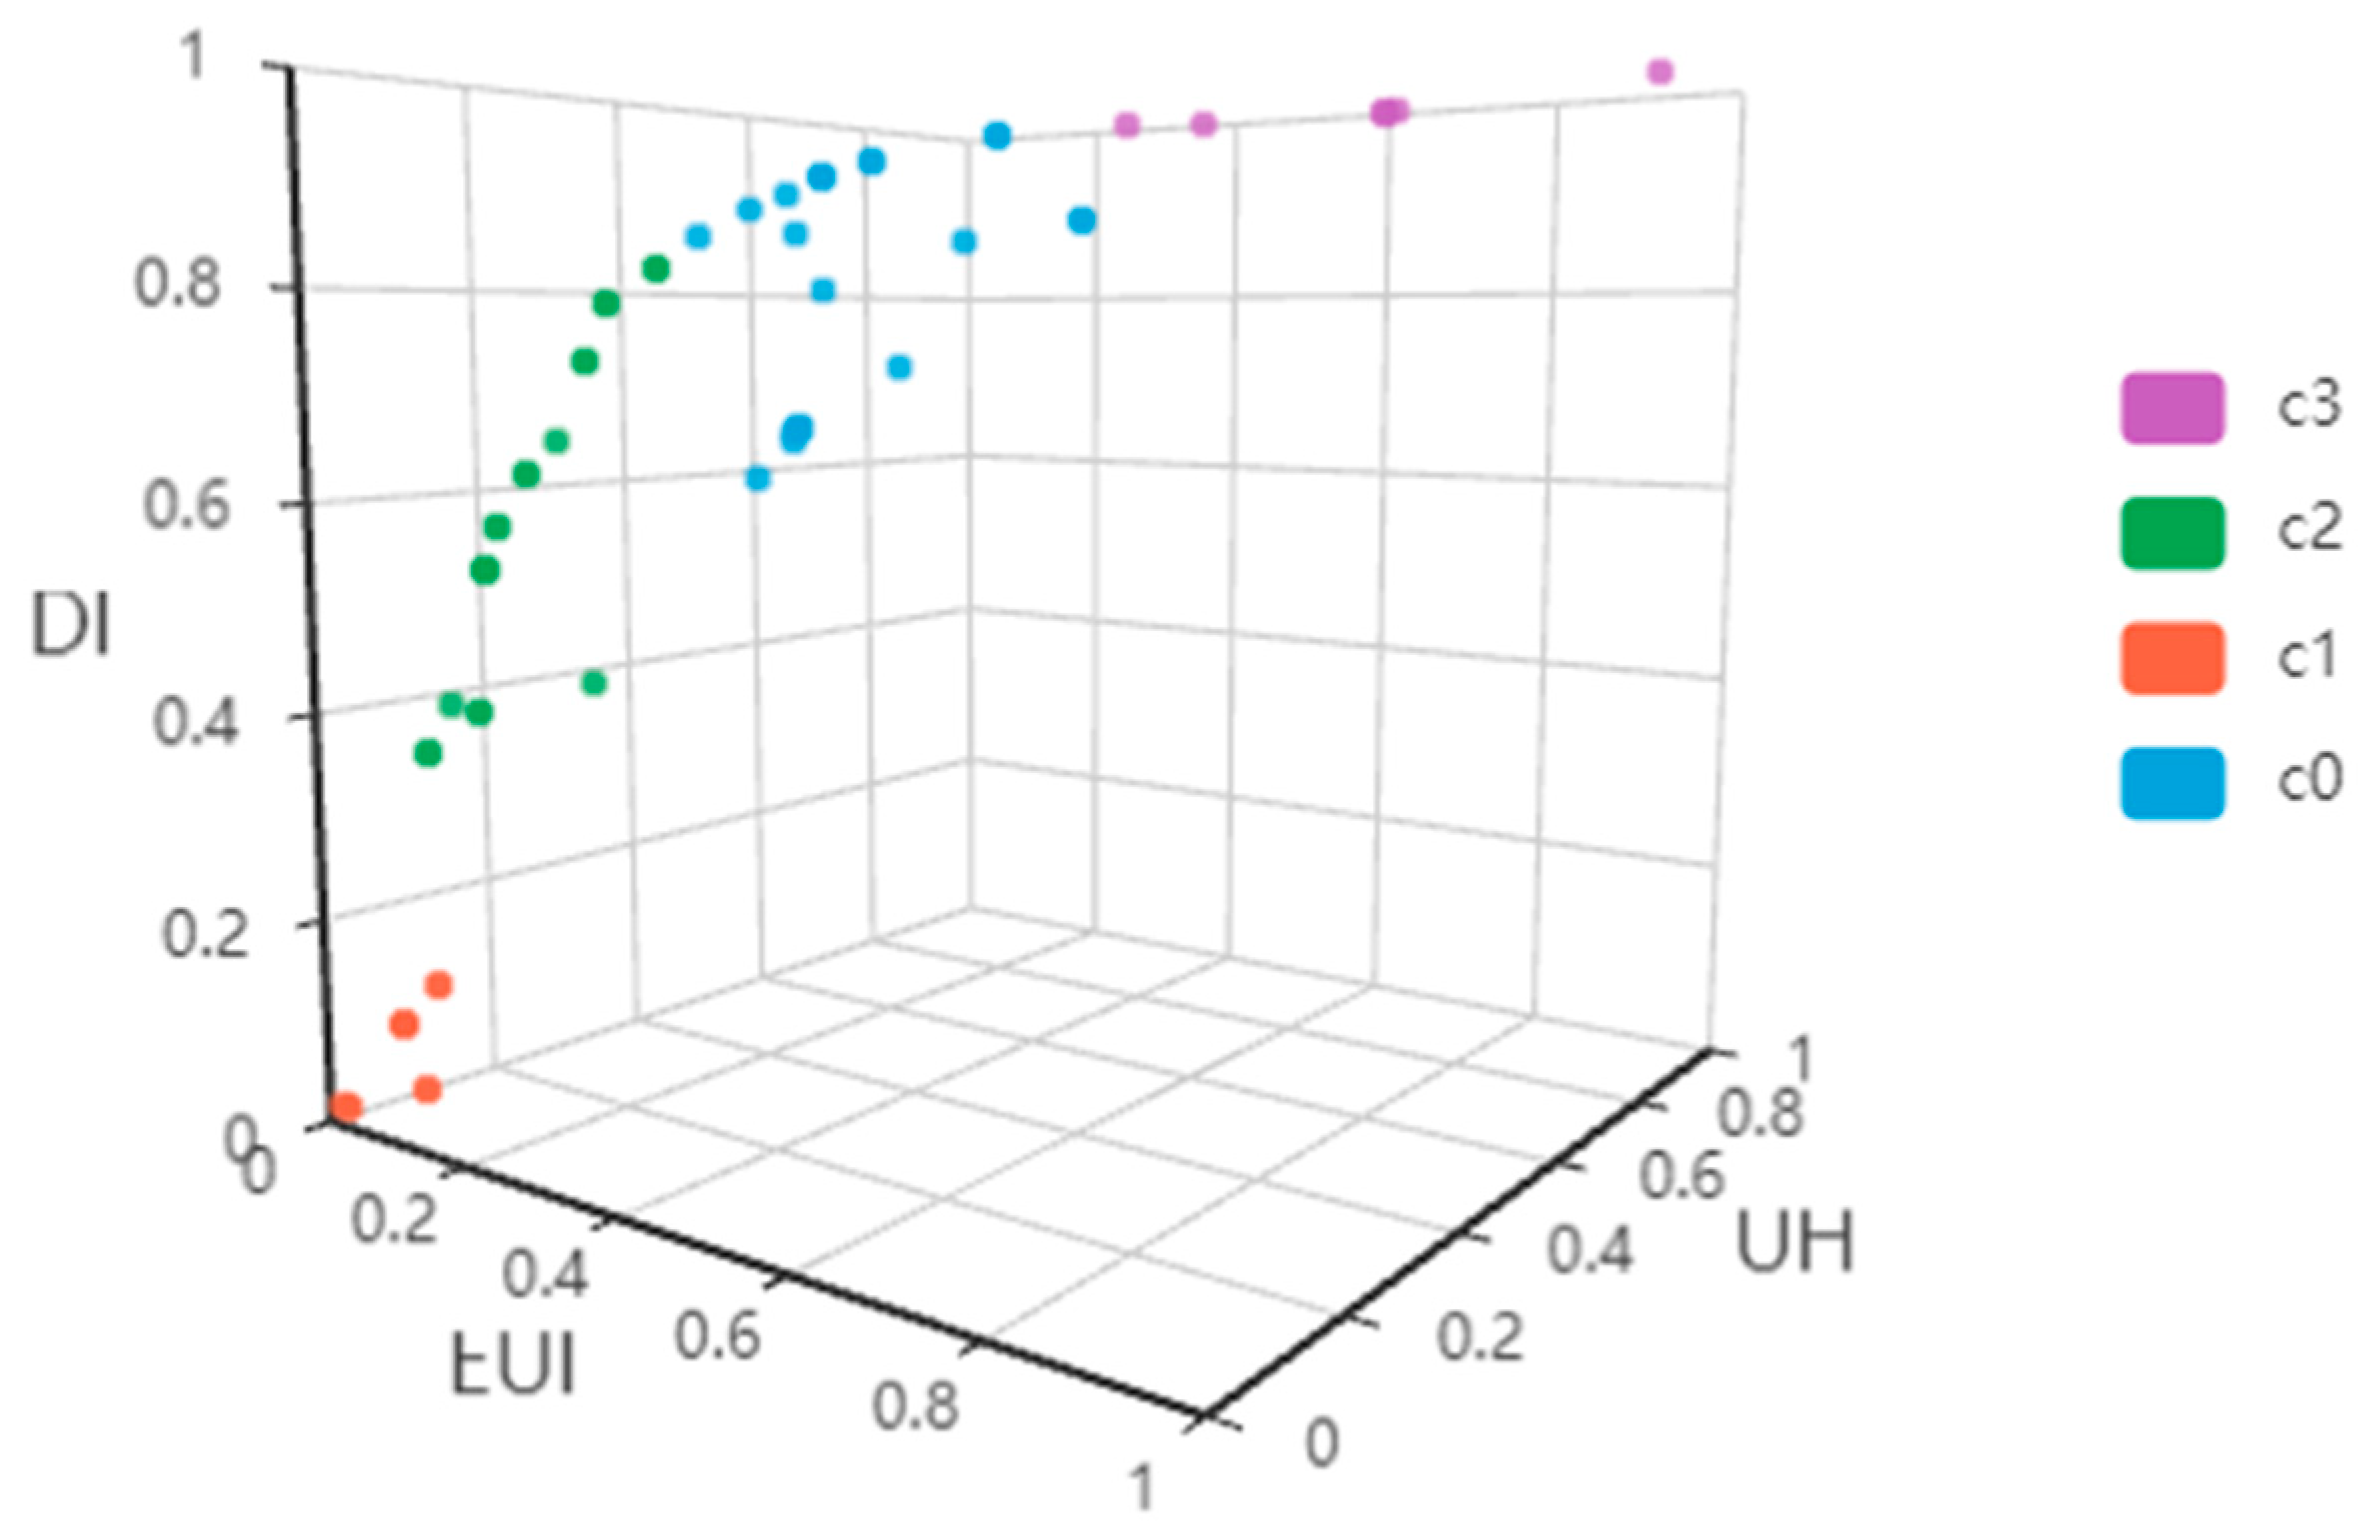
At present, many scholars have studied the performance design of teaching buildings. This study has some progressive significance; however, the previous scholars did not elaborate on how to scientifically select the appropriate scheme when facing a large number of non-dominated solutions when optimizing the architectural performance of teaching buildings. To solve this problem, this study uses a K-means clustering scheme to cluster the non-dominated solutions to help architects efficiently select satisfactory schemes. At the same time, the previous scholars did not consider that after the optimization of the building, the architect may still deliberate on the scheme for other reasons, and will inevitably use simulation software which is time-consuming. To solve this problem, the author uses a neural network with a fast prediction function to replace the simulation software. Finally, we will optimize the performance of teaching buildings, K-means clustering, and neural network performance prediction to form a teaching building design framework.

7. Discussion

There are many limitations to this study. Firstly, there were few optimization objectives for building performance; this study only involved three optimization objectives: energy consumption, thermal comfort, and lighting. In a subsequent study, other performance objectives could be added according to the research needs, such as building heat gain or building outdoor comfort. Secondly, as there were few design variables, the optimization variables of this study are limited to the design parameters involved in the early design and do not consider the building structure, which could be considered in future research.

Author Contributions

Conceptualization, M.W. and S.C.; methodology, G.J.; software, Q.M.; validation, Y.R.; formal analysis, Y.R.; investigation, M.W.; resources, M.W.; data curation, D.C.; writing—original draft preparation, D.C.; writing—review and editing, G.J.; visualization, Y.R.; supervision, Y.R.; project G.J.; funding acquisition, Q.M., All authors have read and agreed to the published version of the manuscript.

Funding

This research was funded by [the Science and Technology Planning Project of Ordos] grant number [No. 2022YY020]; [the Higher Education Scientific Research Project of Inner Mongolia Autonomous Region] grant number [No. NJZY21167]; [the Research Fund of Ordos Vocational College] grant number [No. EJZ2101].

Data Availability Statement

Not applicable.

Acknowledgments

This study was partially supported by the Science and Technology Planning Project of Ordos (No. 2022YY020), the Higher Education Scientific Research Project of Inner Mongolia Autonomous Region (No. NJZY21167), and the Research Fund of Ordos Vocational College (No. EJZ2101).

Conflicts of Interest

The authors declare no conflict of interest.

Nomenclature

HVACHeating, Ventilation and Air Conditioning
GAGenetic Algorithm
NSGA-IINon-dominated Sorting Genetic Algorithm-II
ANNArtificial Neural Networks
BPBack Propagation
EUIEnergy Use Intensity
PMVPredicted Mean Vote
UHUncomfortable Hours
DIThe Dynamic Evaluation Indicator
WWRWindow–Wall Ratio
MSEMean Square Error

References

  1. Yan, H.; Yan, K.; Ji, G. Optimization and prediction in the early design stage of office buildings using genetic and XGBoost algorithms. Build. Environ. 2022, 218, 109081. [Google Scholar] [CrossRef]
  2. Bracht, M.K.; Melo, A.P.; Lamberts, R. A metamodel for building information modeling-building energy modeling integration in early design stage. Autom. Constr. 2021, 121, 103422. [Google Scholar] [CrossRef]
  3. Yuan, P.F.; Song, Y.; Lin, Y.; Beh, H.S.; Chao, Y.; Xiao, T.; Huang, S.; Zheng, J.; Wu, Z. An architectural building cluster morphology generation method to perceive, derive, and form based on cyborg-physical wind tunnel (CPWT). Build. Environ. 2021, 203, 108045. [Google Scholar] [CrossRef]
  4. Ziwei, L. Research on Office Building Energy Performance and Daylight Performance Simulation Optimization Method for Early Design Stage. Ph.D. Thesis, Tsinghua University, Beijing, China, 2018. [Google Scholar]
  5. Lakhdari, K.; Sriti, L.; Painter, B. Parametric optimization of daylight, thermal and energy performance of middle school classrooms, case of hot and dry regions. Build. Environ. 2021, 204, 108173. [Google Scholar] [CrossRef]
  6. Barbhuiya, S.; Barbhuiya, S. Thermal comfort and energy consumption in a UK educational building. Build. Environ. 2013, 68, 1–11. [Google Scholar] [CrossRef]
  7. Edwards, L.; Torcellini, P. Literature Review of the Effects of Natural Light on Building Occupants; US Department of Energy: Washington, DC, USA, 2002.
  8. Zhang, A.; Bokel, R.; van den Dobbelsteen, A.; Sun, Y.; Huang, Q.; Zhang, Q. Optimization of thermal and daylight performance of school buildings based on a multi-objective genetic algorithm in the cold climate of China. Energy Build. 2017, 139, 371–384. [Google Scholar] [CrossRef]
  9. Küller, R.; Lindsten, C. Health and behavior of children in classrooms with and without windows. J. Environ. Psychol. 1992, 12, 305–317. [Google Scholar] [CrossRef]
  10. Zeiler, W.; Boxem, G. Effects of thermal activated building systems in schools on thermal comfort in winter. Build. Environ. 2009, 44, 2308–2317. [Google Scholar] [CrossRef]
  11. Wargocki, P.; Wyon, D.P. The effects of moderately raised classroom temperatures and classroom ventilation rate on the performance of schoolwork by children (RP-1257). HVAC&R Res. 2007, 13, 193–220. [Google Scholar]
  12. Albatayneh, A.; Alterman, D.; Page, A.; Moghtaderi, B. Development of a new metric to characterise the buildings thermal performance in a temperate climate. Energy Sustain. Dev. 2019, 51, 1–12. [Google Scholar] [CrossRef]
  13. Han, Y. Research on the Building Form Digital Energy-Efficient Design for Office Building in Severe Cold Region. Ph.D. Thesis, Harbin Institute of Technology, Harbin, China, 2016. [Google Scholar]
  14. Méndez Echenagucia, T.; Capozzoli, A.; Cascone, Y.; Sassone, M. The early design stage of a building envelope: Multi-objective search through heating, cooling and lighting energy performance analysis. Appl. Energy 2015, 154, 577–591. [Google Scholar] [CrossRef]
  15. Turrin, M.; von Buelow, P.; Kilian, A.; Stouffs, R. Performative skins for passive climatic comfort: A parametric design process. Autom. Constr. 2012, 22, 36–50. [Google Scholar] [CrossRef]
  16. Kirimtat, A.; Krejcar, O.; Ekici, B.; Fatih Tasgetiren, M. Multi-objective energy and daylight optimization of amorphous shading devices in buildings. Sol. Energy 2019, 185, 100–111. [Google Scholar] [CrossRef]
  17. Zhu, L.; Wang, B.; Sun, Y. Multi-objective optimization for energy consumption, daylighting and thermal comfort performance of rural tourism buildings in north China. Build. Environ. 2020, 176, 106841. [Google Scholar] [CrossRef]
  18. Xu, Y.; Zhang, G.; Yan, C.; Wang, G.; Jiang, Y.; Zhao, K. A two-stage multi-objective optimization method for envelope and energy generation systems of primary and secondary school teaching buildings in China. Build. Environ. 2021, 204, 108142. [Google Scholar] [CrossRef]
  19. Yao, R.; Zhang, S.; Du, C.; Schweiker, M.; Hodder, S.; Olesen, B.W.; Toftum, J.; Romana d’Ambrosio, F.; Gebhardt, H.; Zhou, S.; et al. Evolution and performance analysis of adaptive thermal comfort models—A comprehensive literature review. Build. Environ. 2022, 217, 109020. [Google Scholar] [CrossRef]
  20. Turrin, M.; von Buelow, P.; Stouffs, R. Design explorations of performance driven geometry in architectural design using parametric modeling and genetic algorithms. Adv. Eng. Inform. 2011, 25, 656–675. [Google Scholar] [CrossRef]
Figure 1. Two stages of the early design of middle school architecture.
Buildings 12 01897 g001
Figure 2. Donglu Middle School.
Buildings 12 01897 g002
Figure 3. Parametric model of teaching building.
Buildings 12 01897 g003
Figure 4. Non-dominated solutions.
Buildings 12 01897 g004
Figure 5. Histogram and correlation analysis of three optimization goals.
Buildings 12 01897 g005
Figure 6. K-means clustering effect analysis.
Buildings 12 01897 g006
Figure 7. Illustration of the clustering distribution of non-dominated solutions.
Buildings 12 01897 g007
Figure 8. Results of every performance goal in four urban design clusters.
Buildings 12 01897 g008aBuildings 12 01897 g008b
Figure 9. Performance comparison between optimization solution and reference building.
Buildings 12 01897 g009
Figure 10. Correlation analysis between design parameters and performance objectives.
Buildings 12 01897 g010
Figure 11. Framework of BP neural network model.
Buildings 12 01897 g011
Figure 12. The trend of the MSE.
Buildings 12 01897 g012
Figure 13. The regression analysis of the model.
Buildings 12 01897 g013
Table 1. Descriptions and range of optimized design parameters.
VariableUnitRangeDistribution
X1Room depthm[6.3–6.9]Continuous
X2Standard floor heightm[3.2–3.8]Continuous
X3Width of corridorm[1.8–2.3]Continuous
X4Orientation°[−45–45]Continuous
X5WWR of north external wall[0–0.3]Continuous
X6WWR of south external wall[0–0.6]Continuous
Table 2. Parameter settings of energy consumption simulation.
Lighting
Density
per Area
Equipment
Load per Area
Number of Peopleper AreaVentilation
per Person
9 W/m215 W/m20.1 ppl/m20.001 m³/s
Table 3. Settings of the optimization algorithm.
ElitismMutation
Rate
Crossover
Rate
Population
Size
Maximum Generation
0.5000.5000.90030100
Table 4. Clustering result of non-dominated solutions.
ClusterCentroids of Clustering
EUIUHDI
Cluster 10.17020.593560.17827
Cluster 20.0433230.0491210.934711
Cluster 30.1006240.1802030.422064
Cluster 40.6738640.7835460.015952
Table 5. The parameters of the centroid 3 scheme.
VariableUnitValue
Room depthm6.9 Buildings 12 01897 i001
Standard floor heightm3.2
Width of corridorm1.9
Orientation°44
WWR of north external wall0.2
WWR of south external wall0.4
Table 6. Five groups of simulated and real values.
Simulated ValuesPredicted Value
10.320.32
0.600.61
0.030.03
20.190.18
0.340.35
0.210.22
30.570.59
0.390.38
0.090.09
40.560.59
0.390.38
0.090.09
50.710.72
0.650.66
0.070.05
Publisher’s Note: MDPI stays neutral with regard to jurisdictional claims in published maps and institutional affiliations.

