Article

Design Equations for Predicting Stability of Unlined Horseshoe Tunnels in Rock Masses

by
Jintara Lawongkerd
1,
Jim Shiau
2,
Suraparb Keawsawasvong
1,*,
Sorawit Seehavong
1 and
Pitthaya Jamsawang
3
1
Department of Civil Engineering, Thammasat School of Engineering, Thammasat University, Pathumthani 12120, Thailand
2
School of Engineering, University of Southern Queensland, Toowoomba QLD 4350, Australia
3
Soil Engineering Research Center, Department of Civil Engineering, King Mongkut’s University of Technology North Bangkok, Bangkok 10800, Thailand
*
Author to whom correspondence should be addressed.
Buildings 2022, 12(11), 1800; https://doi.org/10.3390/buildings12111800
Submission received: 28 September 2022 / Revised: 21 October 2022 / Accepted: 21 October 2022 / Published: 27 October 2022

Abstract

:
This paper aims to propose new stability equations for the design of shallow, unlined horseshoe tunnels in rock masses. The computational framework of the upper- and lower-bound finite-element limit analysis is used to numerically derive the stability solutions of this problems using the Hoek–Brown failure criterion. Five dimensionless parameters including the width ratio and the cover-depth ratio of the tunnels, as well as the normalized uniaxial compressive strength, the geological strength index, and the yield parameters of the Hoek–Brown rock masses, are considered in the study. Selected failure mechanisms of the horseshoe tunnels in rock masses are presented to portray the effect of all dimensionless parameters. New design equations for stability analyses of horseshoe tunnels are developed using the technique of nonlinear regression analysis and the average bound solutions. The proposed stability equations are highly accurate and can be used with great confidence by practitioners.

1. Introduction

The uses of horseshoe-shaped sections are not uncommon in the construction of tunnels and subways, particularly in mountainous areas where rock excavation is needed. Indeed, the semi-elliptical roof of the horseshoe-shaped tunnel has advantages in distributing the loads through geometrical arches. Furthermore, the semi-circular space above the tunnel is needed for maintenance considerations. To assure safety while employing an open-face classical tunneling technique to construct the unusual horseshoe-shaped tunnel, a thorough stability analysis is thus essential.
Previous studies on the tunnel stability of soils using laboratory and centrifuge experiments were conducted by [1,2,3]. By using an analytical approach of the limit analysis method, Davis et al. [4] proposed analytical solutions for a cohesive-soil, shallow-tunnel problem. Sloan [5] has introduced the finite-element limit-analysis (FELA) approach to conduct the numerical solutions and has applied FELA to analyze the tunnel stability problem with different shapes such as unlined circular tunnels, unlined square and rectangular tunnels, plane strain tunnel headings, 3D headings of tunnels and sinkholes and soil retention stability with openings in subterranean walls, e.g., [6,7,8,9,10,11,12,13,14,15,16,17,18,19,20,21,22,23].
Research on horseshoe-shaped tunnels has not received much attention till the recent investigation on the undrained stability of horseshoe tunnels in undrained clays [24]. Bhattacharya and Sriharsha [25] have recently presented lower-bound solutions for the problem of drained horseshoe tunnels. The effect of spacing between the dual horseshoe tunnels in undrained clay was also investigated by [26,27]. Moreover, there were various analytical investigations on horseshoe tunnel stability, e.g., [28,29,30,31,32].
Regarding rock tunnel excavation, the well-recognized failure criterion to describe the rock behavior is the Hoek–Brown (HB) failure criterion [33]. While determining the shear strength of rock masses, the HB-failure criterion takes into account the nonlinearity of the minor principal (compressive) stress in contrast to the Mohr–Coulomb failure criterion, and therefore better represents the crucial failure aspects of various rock types. By using the combination of the Finite-Element-Limit Analysis (FELA) and the HB model, several previous papers have presented a number of rock-tunnel-stability solutions such as for unlined circular tunnels, unlined square and rectangular tunnels, unlined horseshoe tunnels using the lower-bound method and planar tunnel headings, e.g., [34,35,36,37,38,39,40,41].
It was noted that the problem of horseshoe-shaped tunnels in rock masses has not been extensively investigated with the efficiency tools of both the upper-bound (UB) and lower-bound (LB) methodology of an adaptive-finite-element method. In this paper, stability charts and equations are established from the upper- and lower-bound solutions to handle the stability problem of unlined rock tunnels with horseshoe shapes. However, there are no design equations that enable an evaluation of unlined rock tunnels with horseshoe shapes in the available published literature. The proposed design equations were developed using a nonlinear regression analysis and are useful in practice for geotechnical engineers to assess the stability of traditional open-face tunneling in maintaining tunnel excavation stability.

2. Hoek–Brown (HB) Failure Criterion

The Hoek–Brown failure criterion [42] is employed in this study to produce the stability solutions of unlined horseshoe tunnels. The power law relationship between the major and minor principal stresses is used to describe the formulation of the HB-failure criterion (i.e., σ1 and σ3). Equation (1) gives a mathematical representation of the HB model with the assumption of positive tensile normal stresses (see [42]).
σ 3 = σ 1 + σ c i m b σ 1 σ c i + s a
where σci represents the uniaxial compressive strength. The mathematical expressions for the parameters mb, s, and a span from Equations (2)–(4) (see [42]).
a = 1 2 + 1 6 exp G S I 15 exp 20 3
m b = m i exp G S I 100 28 14 D F
s = exp G S I 100 9 3 D F
According to the preceding equations, the geological strength index (GSI) generally varies in the range of 10 for an exceedingly deficient rock mass up to 100 for an undamaged or intact rock mass. The shear strength of an intact rock mass is associated with the Hoek–Brown yield parameter (mi), which is determined by several factors such as mineral composition and particle size. The disturbance factor or DF parameter indicates the level of disturbance that the explosion and stress relaxation have caused to the rock mass. In general, the DF spans from 0 to 1, with a DF of 0 being the least disturbed or undisturbed in situ rock masses, whereas the highly disturbed in situ rock masses have a DF of 1.

3. Problem Statement

The problem description of an unlined horseshoe tunnel surrounded by rock mass is illustrated in Figure 1. The geometry of the tunnel is separated into two parts: a flat floor underneath the ceiling with dimensions B for the width and D/2 for the height of the vertical walls; and a semi-elliptical tunnel ceiling with a width and height of B and D/2, respectively. The tunnel is positioned with a cover depth of C below the ground surface. The rock mass behavior around the tunnel is represented using the HB criterion and γ also represents the rock unit weight. The rock surface is subject to a uniform surcharge pressure σs while the support pressure inside the rock tunnel is disregarded.
Based on the present analysis, this investigation is focused on rock masses with the assumptions of DF = 0. In the computations in this study, the disturbance factor DF is reduced to zero due to the assumption that the tunneling excavation process causes no appreciable disturbances to the adjacent rock mass. By adopting the dimensionless technique, the six-dimensional input parameters (i.e., B, D, σci, GSI, mi, γ) can be reduced to four dimensionless parameters, which further result in the dimensionless output parameter (σs/σci) of a uniform surcharge σs as indicated by Equation (5).
σ s σ c i = f ( B D , C D , σ c i γ D , m i , G S I )
where C/D denotes the tunnel’s cover-depth ratio and B/D denotes the tunnel’s width ratio. σci/γD denotes the normalized uniaxial compressive strength. σs/σci denotes as the normalized collapse surcharge ratio or the stability factor that is the objective function to be “optimized” using limit analysis theorems and finite element technique. It is also named as the stability factor (σs/σci) in this paper. The parametric variations considered in the present stability analysis are listed as follows.
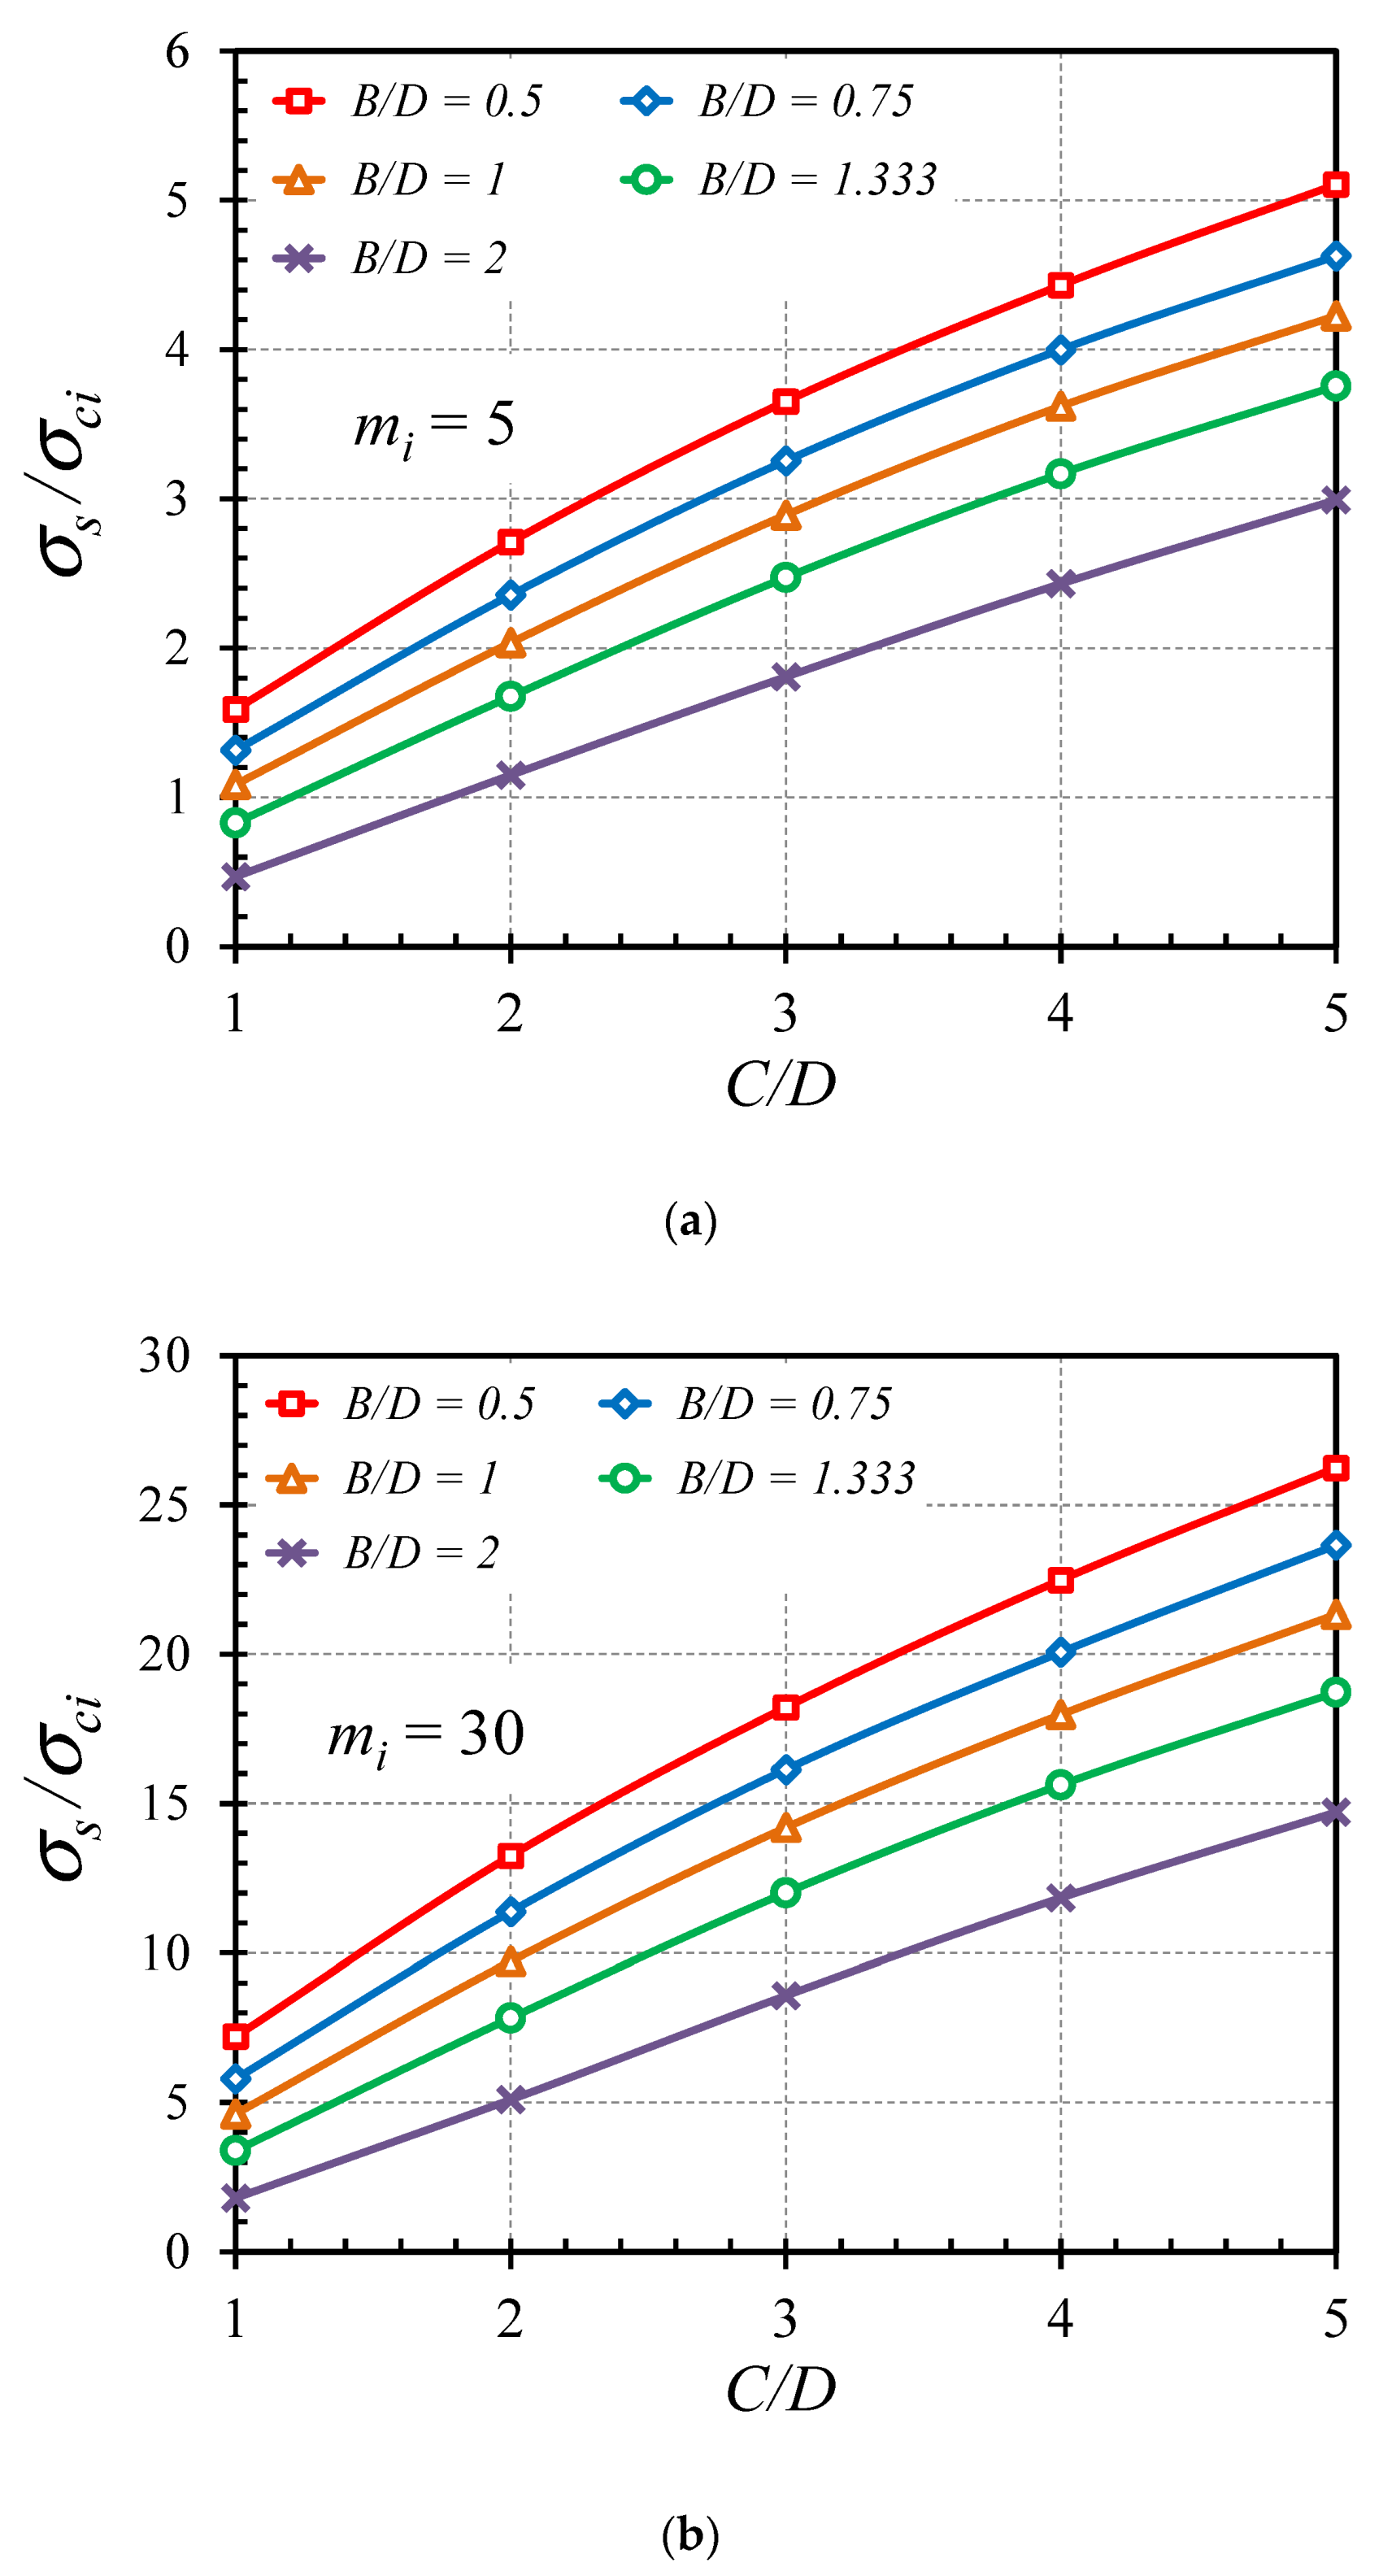
  • The tunnel cover-depth ratio of C/D = 1–5.
  • The tunnel width ratio of B/D = 0.5, 0.75, 1, 1.333, and 2.
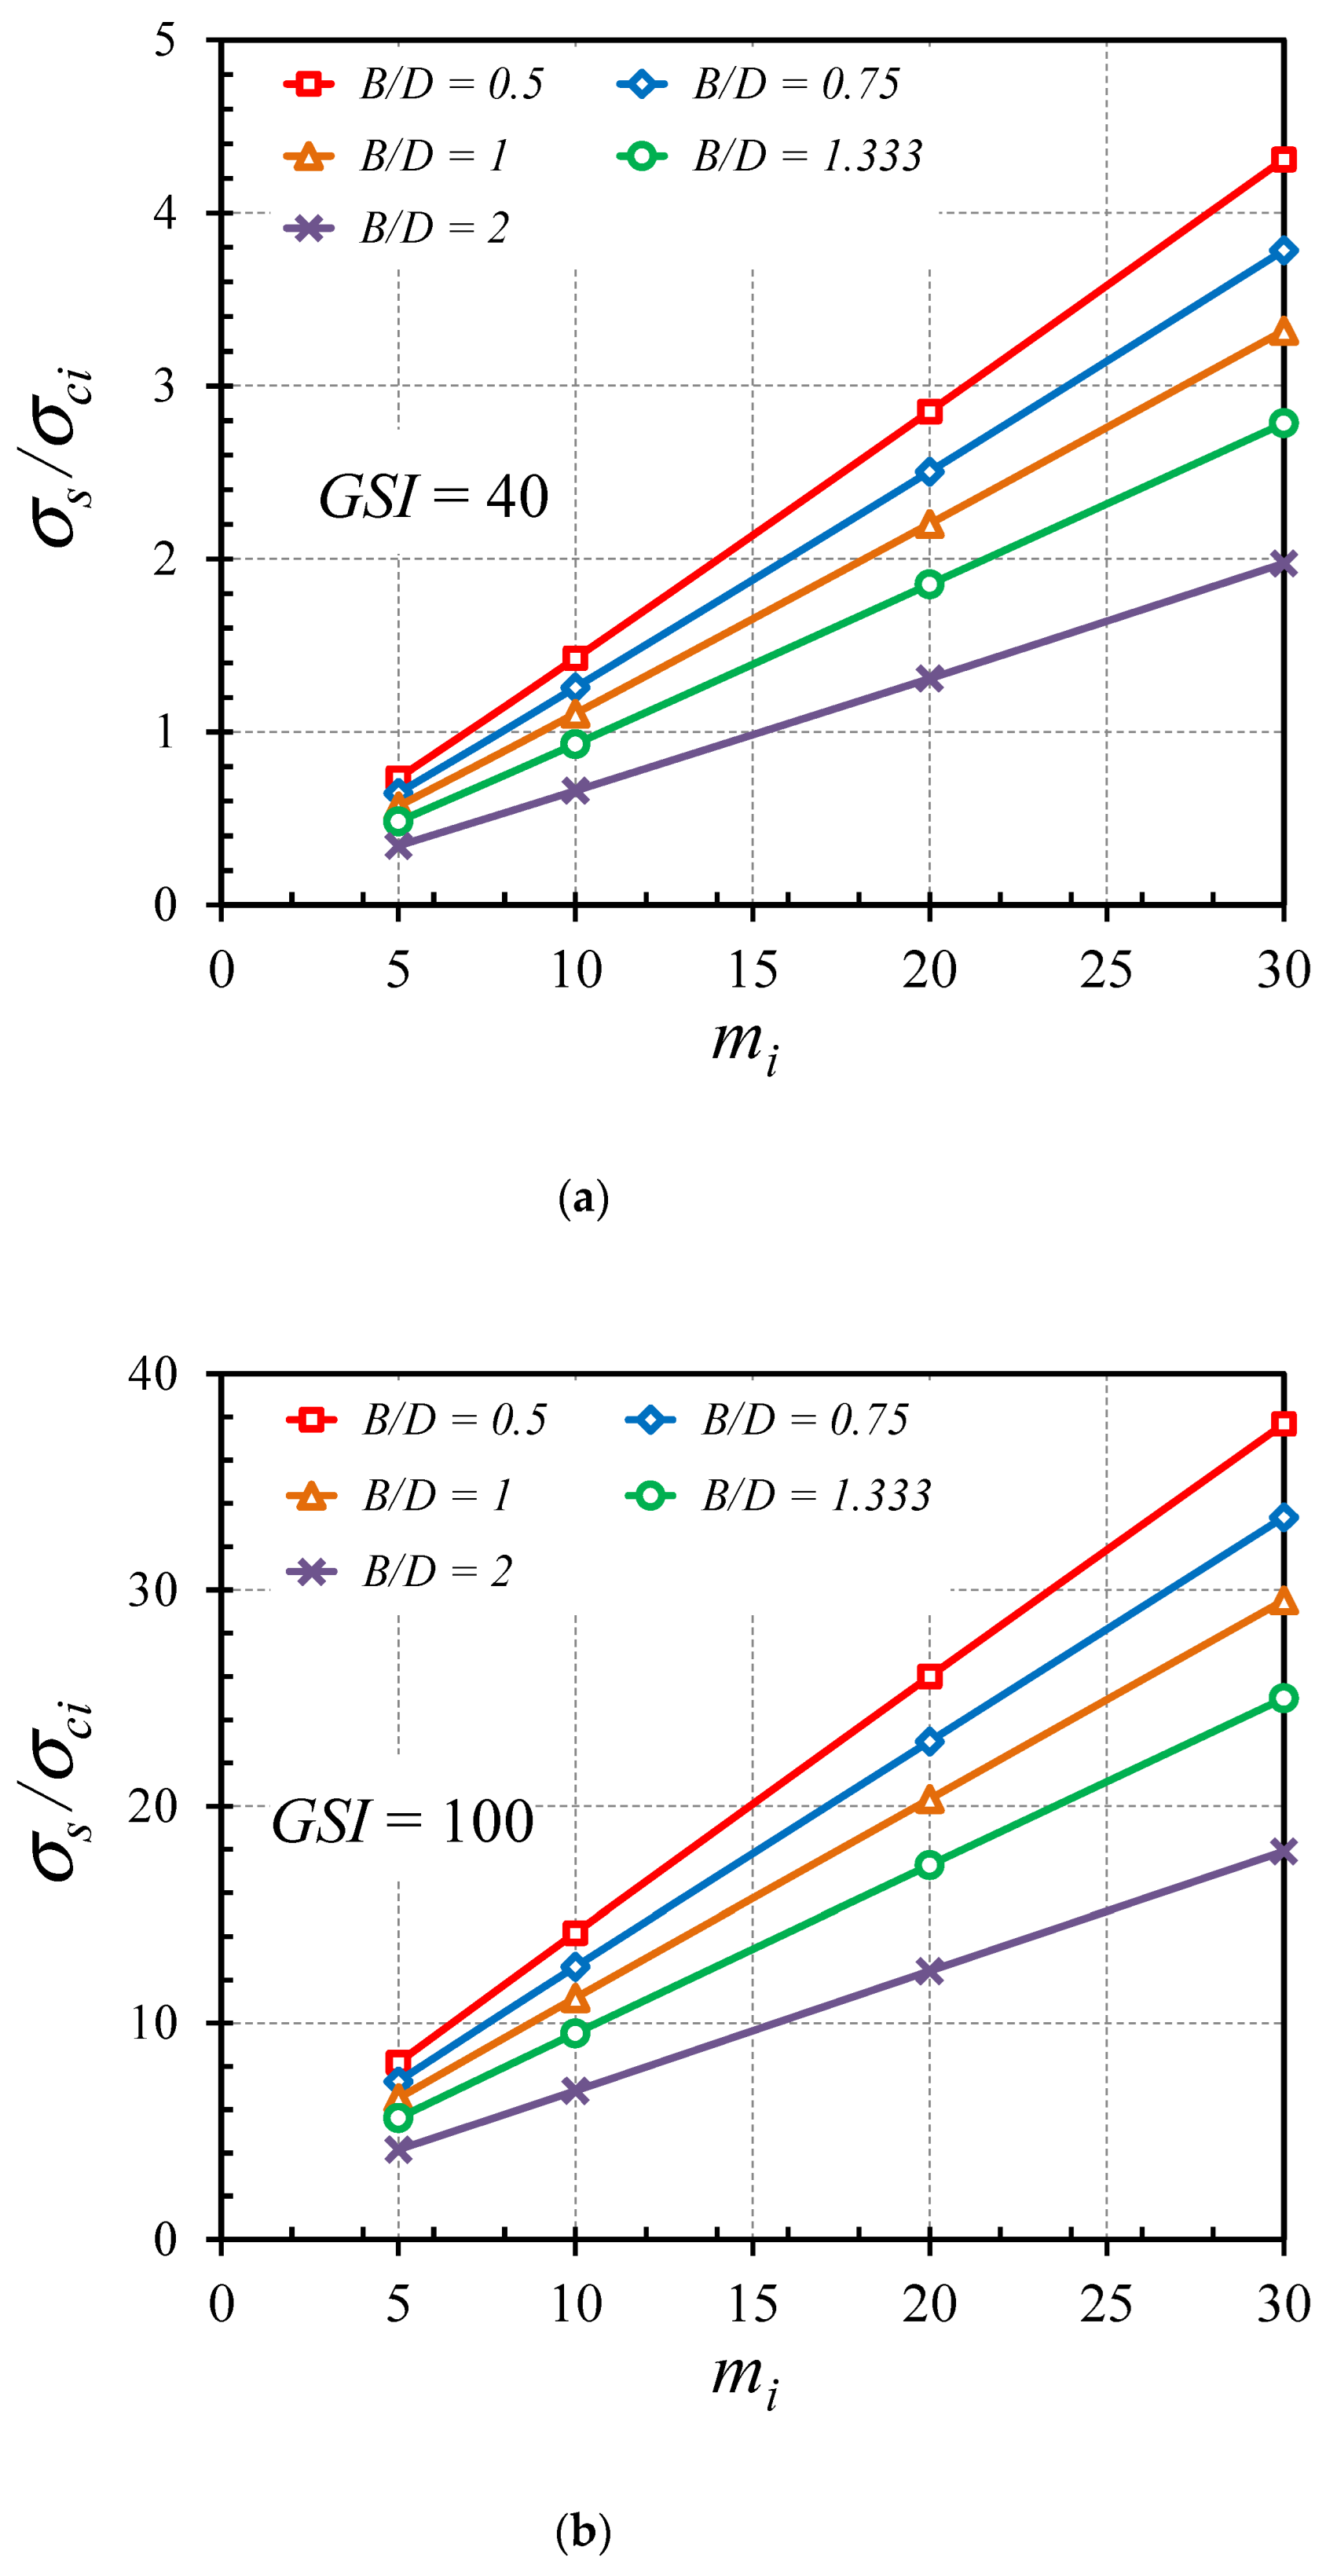
  • The yield parameter mi is set to be mi = 5–30.
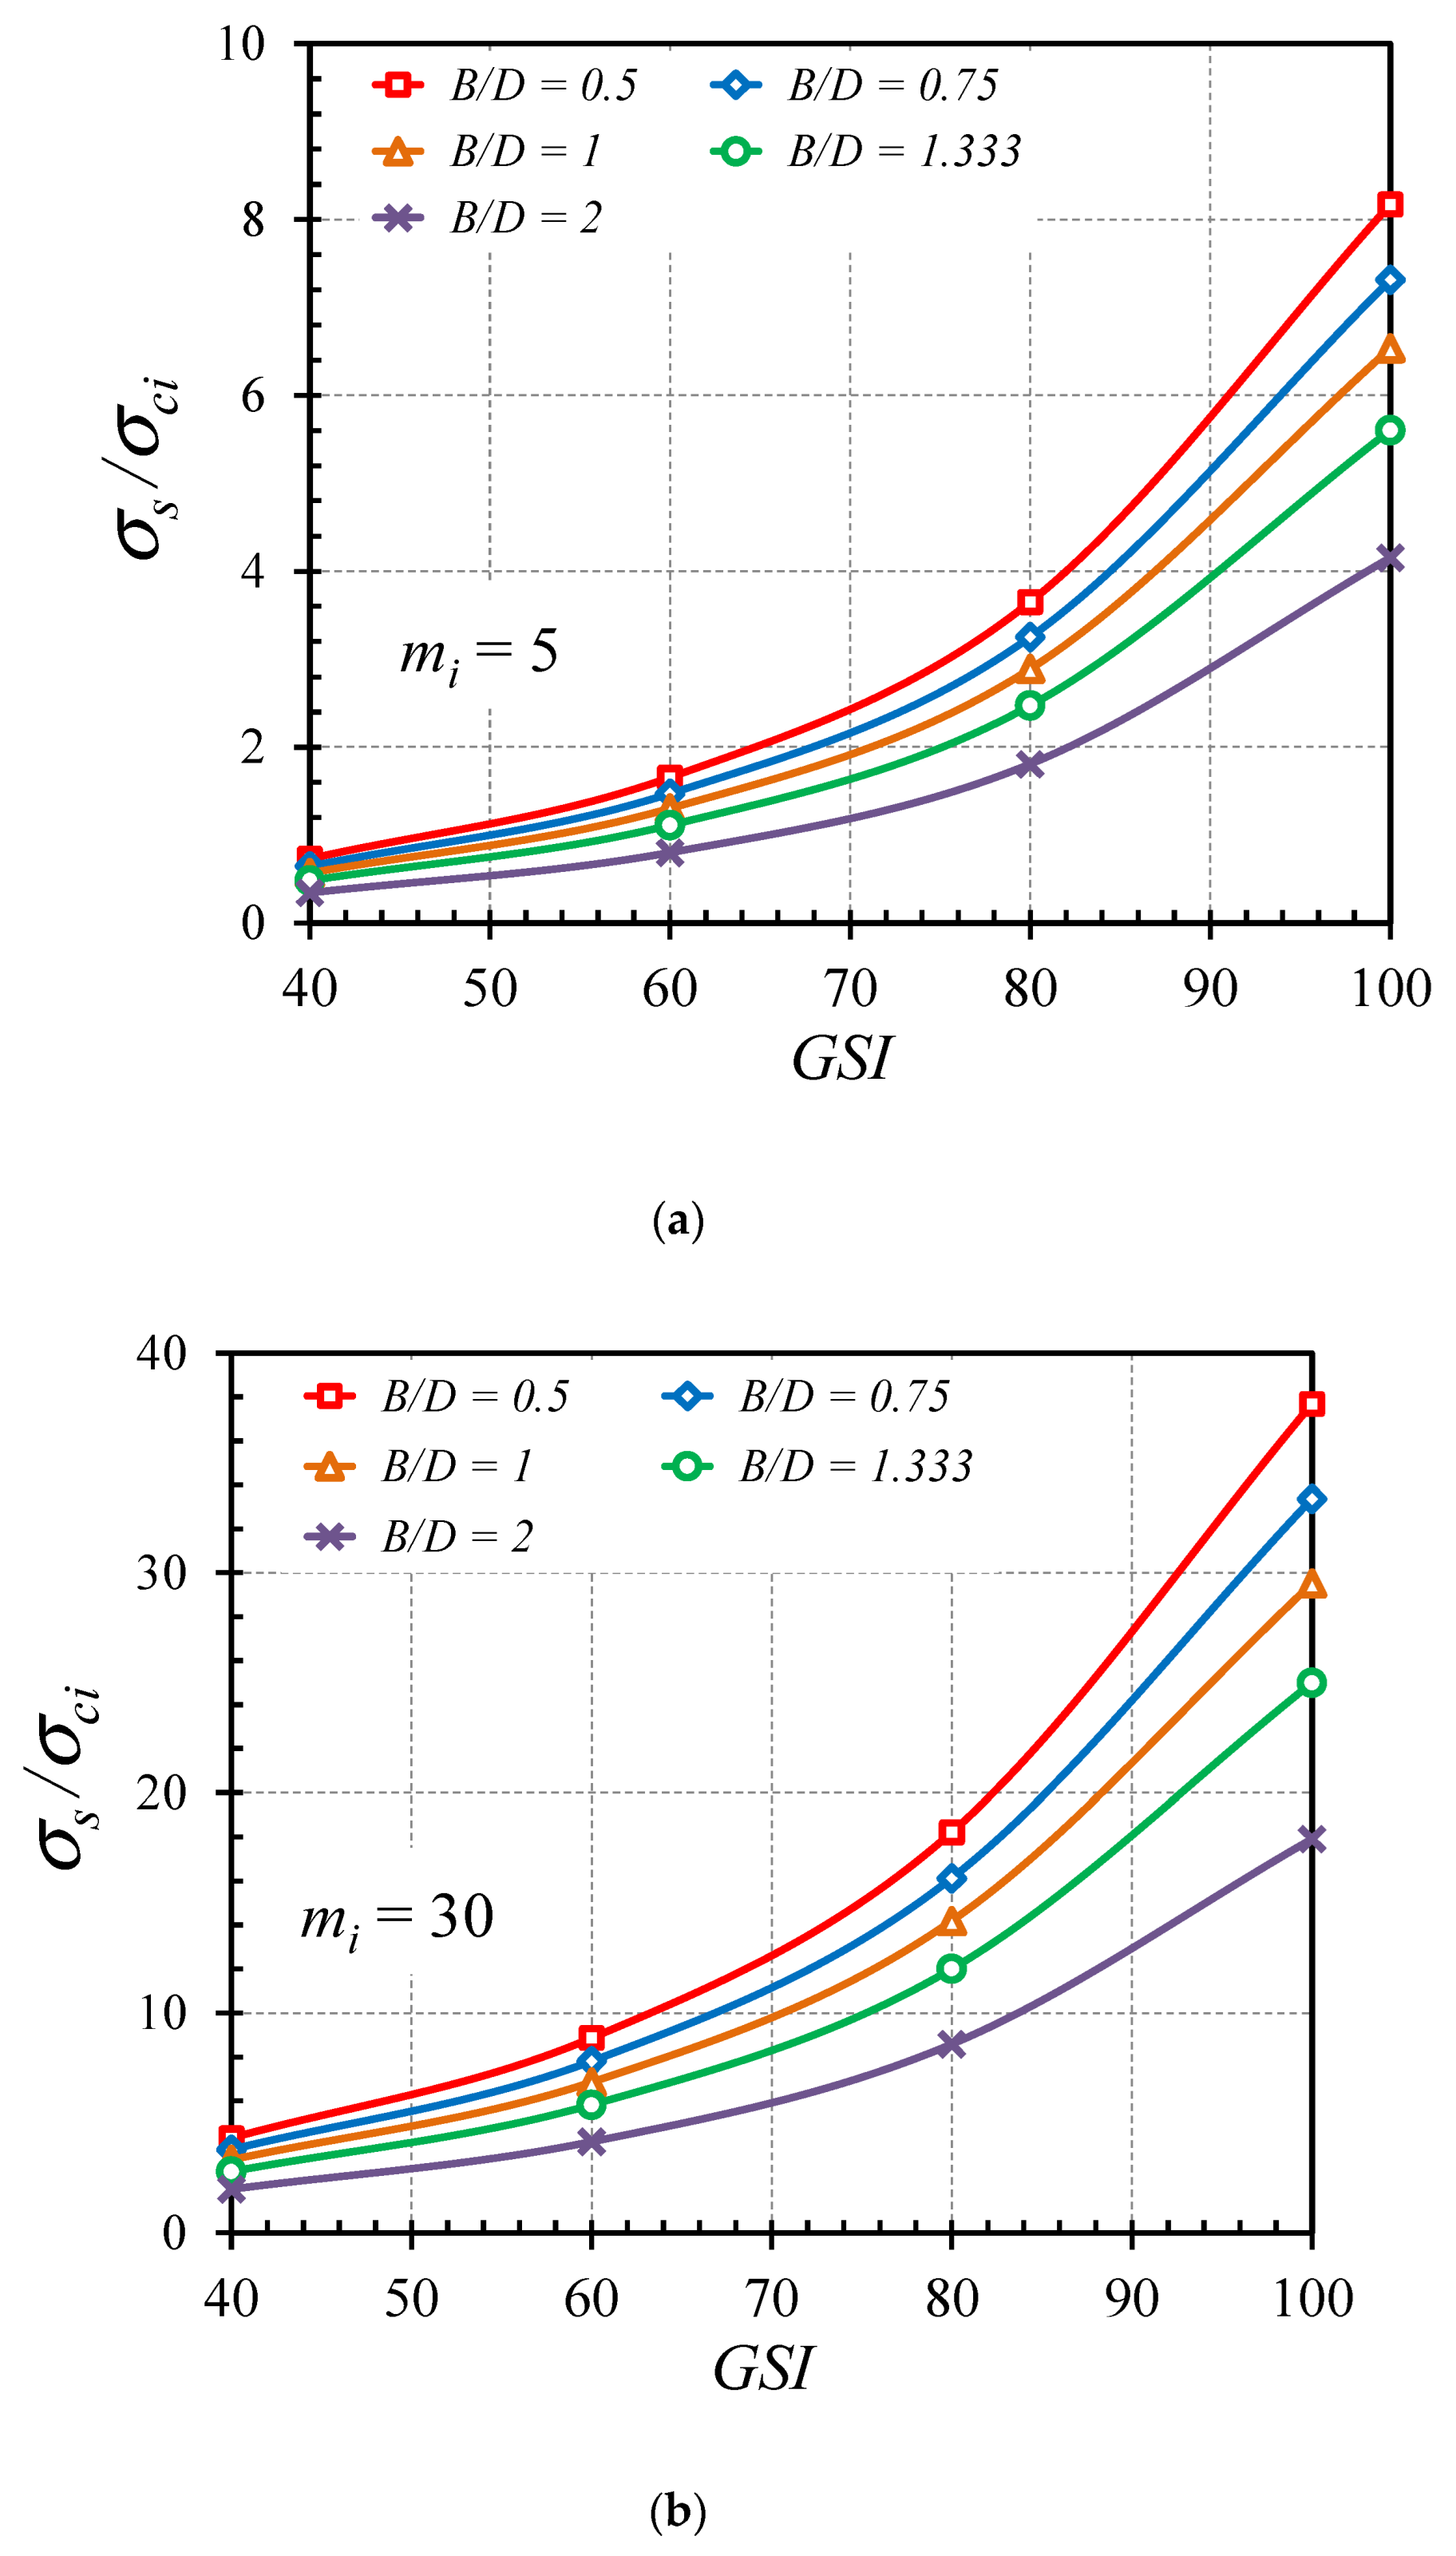
  • The range of the GSI is set to be 40–100.
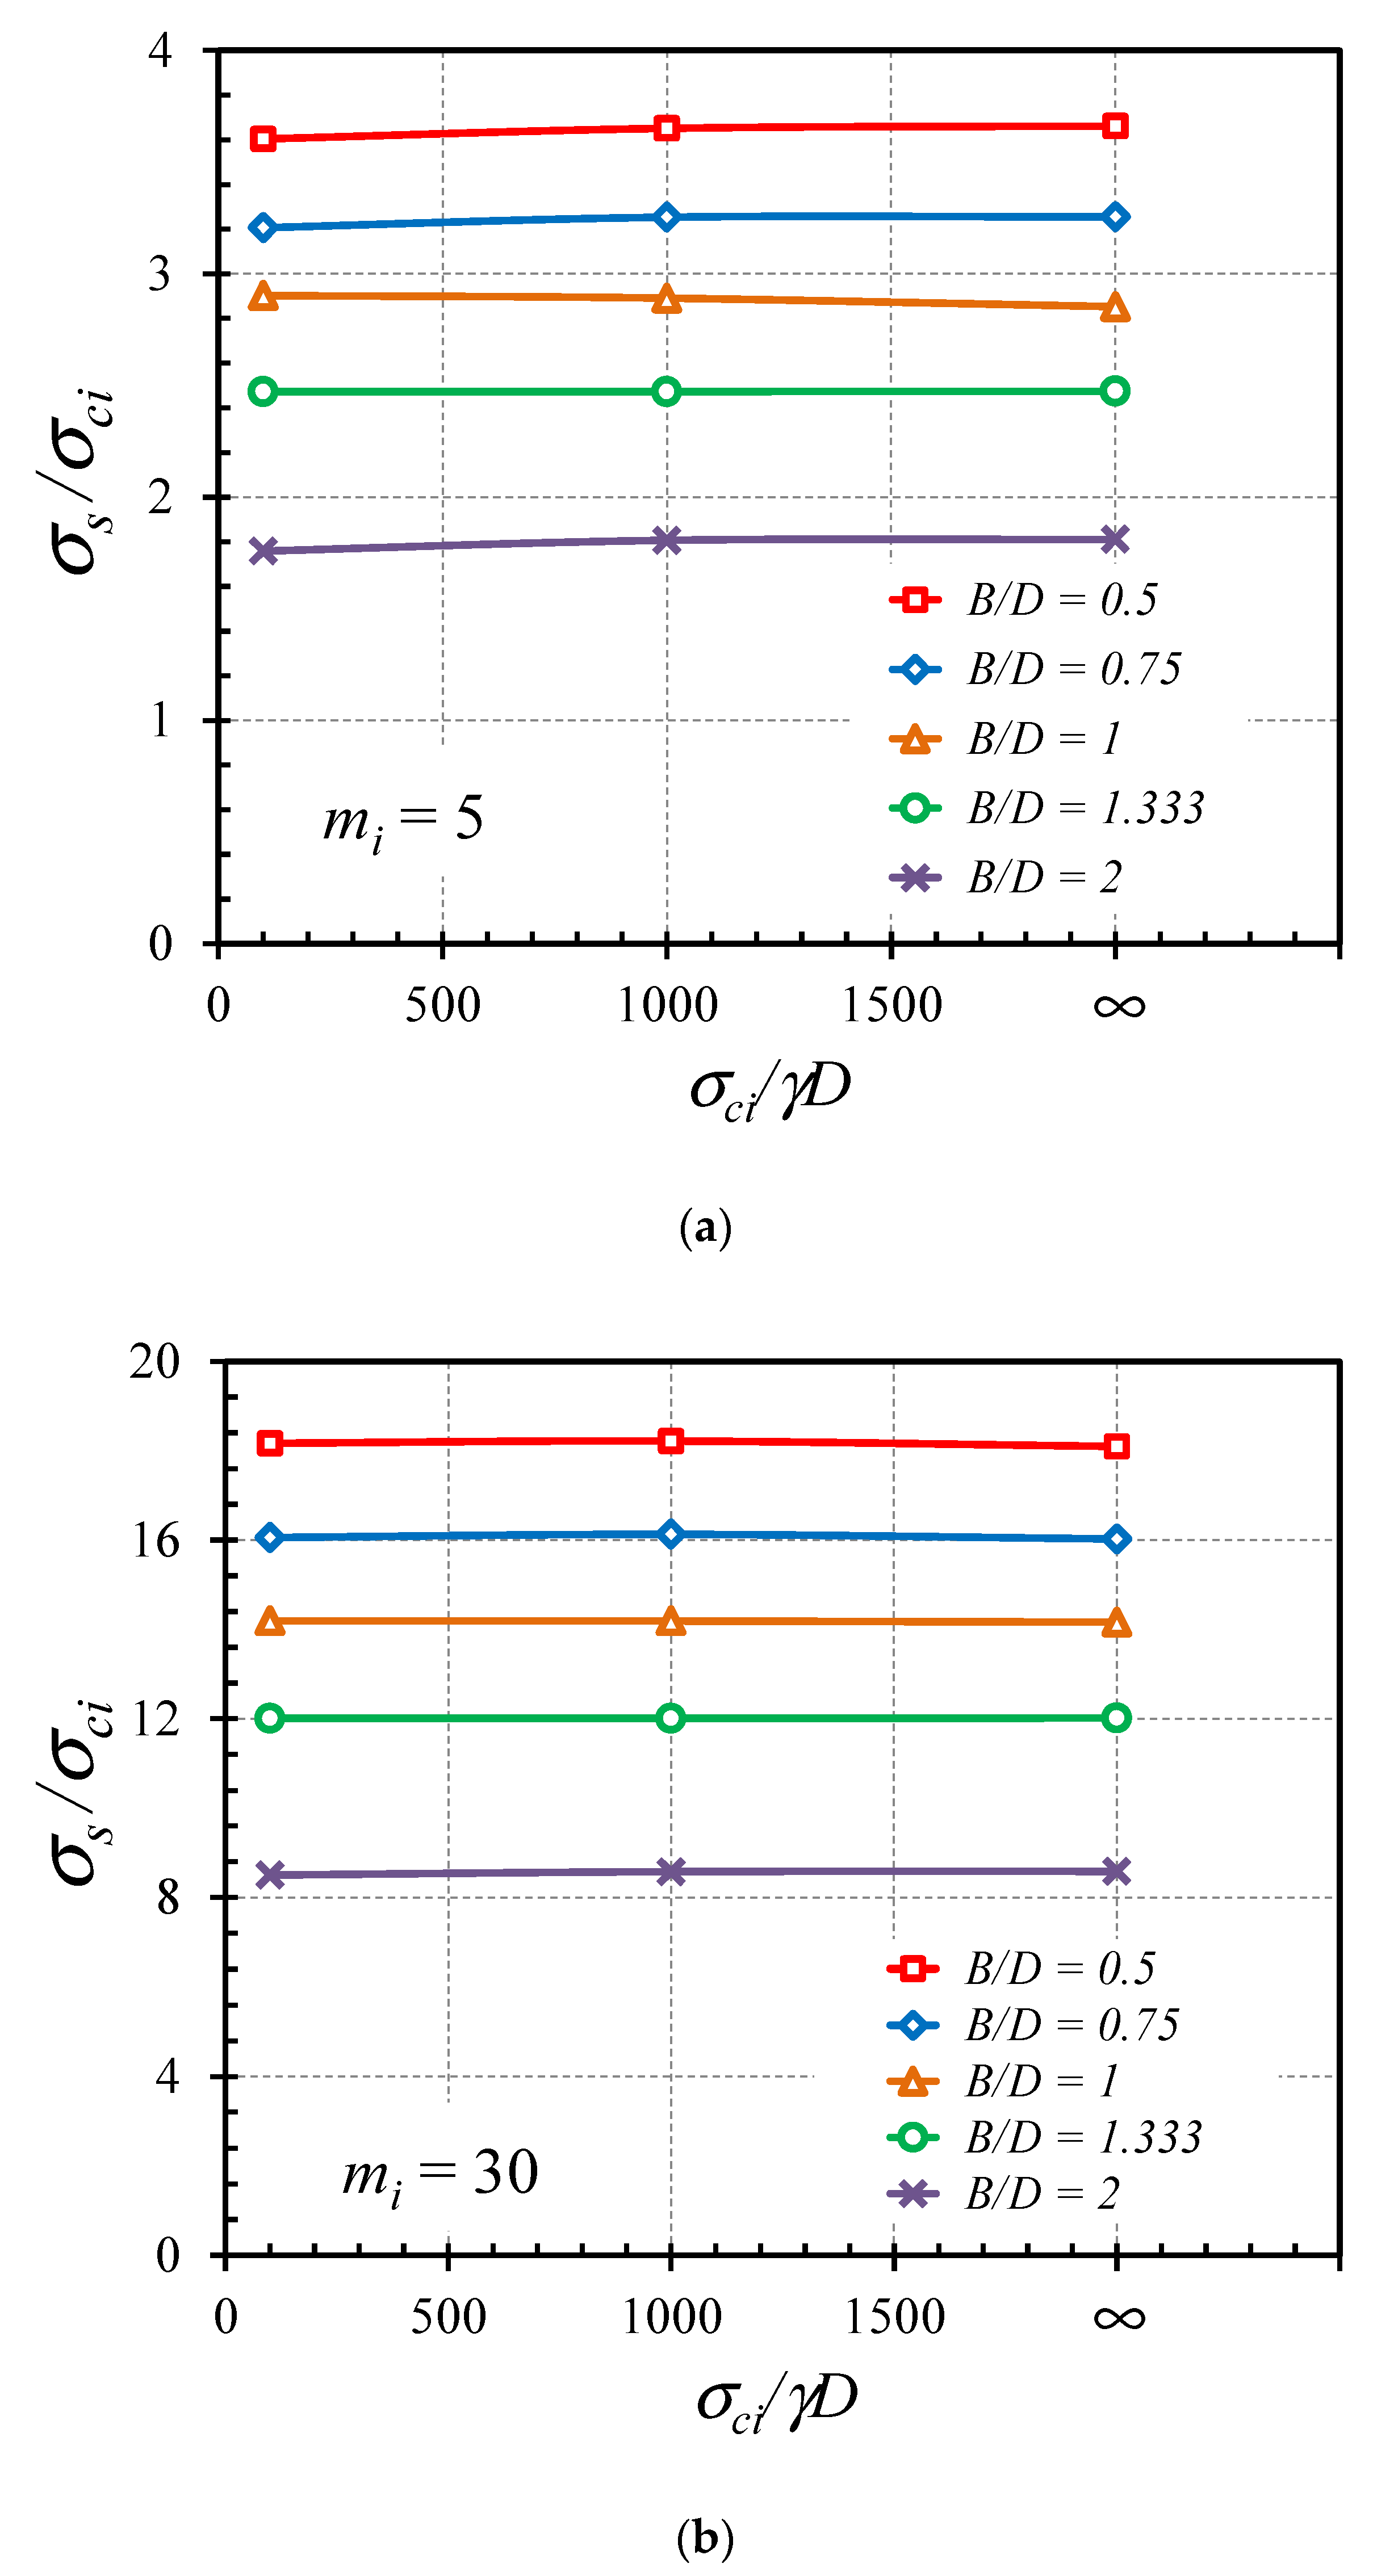
  • The rock’s unit weight is in the range from 22–30 kN/m3 while the uniaxial compressive strength is taken in the range from σci = 0.25–250 MPa for weak to strong rocks. As a result, the dimensionless parameter σci/γD is set to be 100–∞, where the case of σci/γD = ∞ correlates to exceptionally high strength rock masses (σci is quite huge).
Note that the above selected ranges were also employed by several researchers to investigate various forms of rock tunnels stability, e.g., [34,35,36,37,38,39,40,41]. There are five input data attributes related to the tunnel geometry and rock conditions that are summarized in Table 1.

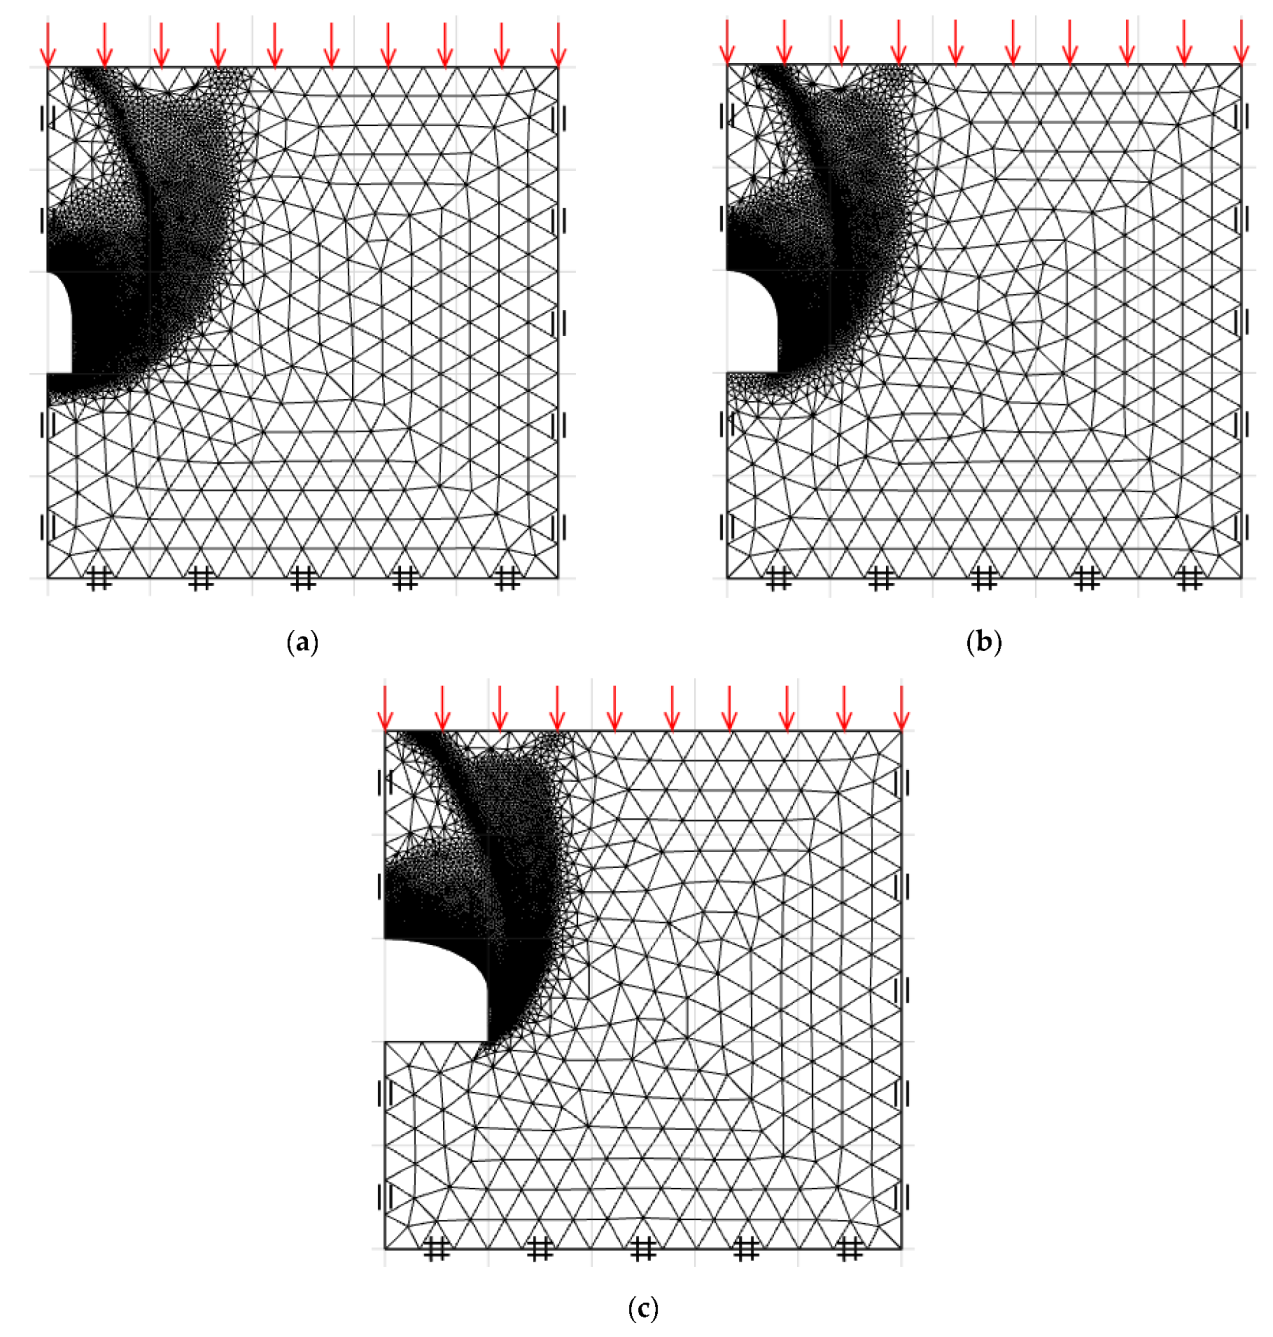
4. Finite-Element-Limit Analysis (FELA)

The plastic bound theorems as well as finite element discretization in conjunction with the mathematical optimization are used for the presented computational limit analysis. The upper bound (UB) and lower-bound (LB) solutions can be used to bracket the rigorous collapse pressure of tunnel problems based on the associated flow rule and an assumption of a rigid plastic material. In order to enhance computational performance, this study mainly utilizes the modern adaptivity meshing approach. The active failure of horseshoe rock tunnels is calculated employing the innovative FELA software OptumG2 [43].
Three numerical models of unlined horseshoe tunnels in rock masses are shown in Figure 2a–c with B/D = 0.5, 1, 2, respectively. The plots are in the cases of C/D = 2. The simulations are performed just using a half of the domain as well as the tunnel’s geometry in all numerical analyses and has no significant effect on the solution. In the FELA analysis, the standard boundary conditions are imposed with the following limitation: the movements at the left and right planes are set to occur only in the vertical direction, while the movements at the bottom plane’s boundary is prohibited to occur in both vertical and horizontal directions The domain size is selected to be large enough in order to prevent the plastic shear zone intersecting the right and bottom boundaries of the domain. The sufficiently large domain can ensure that the calculated bound solutions will not be affected from an insufficient size of the domain. Inside the tunnel, there is not any pressure assigned from the central tube of the tunnel. The uniform surcharge σs is delivered downward to the region of the rock surface and is intended to be optimum at the active collapse event.
According to the UB formulation, the rock mass is discretized into various six-noded triangular elements with the velocity components at all the nodes. The objective function of the UB analysis is to optimize the maximum surcharge (σs). The kinematically admissible displacement field can be found everywhere in the domain as well as at the boundary conditions. The load is calculated from the principle of virtual work based on the compatibility and the flow rule formulations. As a result, the surcharge is related to the problem’s unknown velocities by using the virtual work idea, which compares the rate of work accomplished between external loads to the internal energy dissipation at triangle components.
According to the LB formulation, the rock mass around the tunnel is partitioned by using linear interpolation inside three-nodded triangular elements, each of which nodes is connected to an unknown stress component. By allowing nodes to be specific to each element, stress discontinuities are supplied to the lower-bound mesh at the common edges of the neighboring triangular elements. The objective function in the optimization is to maximize the surcharge (σs) at the surface of the rock. The surcharge can be solved by taking into account the statically permissible stress constraints that employing the equilibrium equations, the stress discontinuities, and the stress boundary conditions. As a result, the problem’s lower bound solution is obtained.
The powerful mesh adaptivity feature had been employed to generate the compact bound solutions [44]. It should be noted that by utilizing this feature, a variety of elements are automatically inserted in the regions that have significant plastic shear strain and where, following the given iterations, the discrepancies between the upper and lower-bound solutions become limited. This study utilized a beginning mesh of 5000 elements with five iterations of mesh adaptivity, which leads to an expanded finalized mesh of 10,000 elements. This setting is applied to all numerical models carried out in this study by following many previous studies, e.g., [45,46,47,48,49,50,51,52,53,54,55,56,57,58]. Note that Sloan [5] stated that the stability analysis using the FELA based on the limit analysis theory requires only the conventional strength parameters such as the undrained shear strength, but does not use the deformation parameters such as Poisson’s ratio and Young’s modulus which are different from the conventional displacement-based FEM. Thus, Poisson’s ratio and Young’s modulus are not considered in this study using FELA. Hence, large deformations of rock tunnels cannot be investigated by using FELA.

5. Results and Discussion

5.1. Verification

Throughout this paper, the numerical results of all parametric studies are provided in terms of average solutions (Ave), which are the mean value from the UB and LB solutions. Note that the upper and lower-bound discrepancies are permissible up to a maximum of 5% for all numerical results presented hereafter in this paper. To verify these Ave solutions, the published LB solutions by Rahaman and Kumar [40] are applied to perform a verification with the current solutions. The instances that were picked to compare in Figure 3 include: C/D = 1–5; B/D = 1; mi = 5; σci/γD = 100 and ∞; GSI = 40, 60, 80, 100. It can be observed that the stability factor σs/σci from the present study has a very good agreement with the previous solution. Therefore, the results that were achieved and reported in the study inspire considerable confidence. A few more parametric studies are further investigated next.

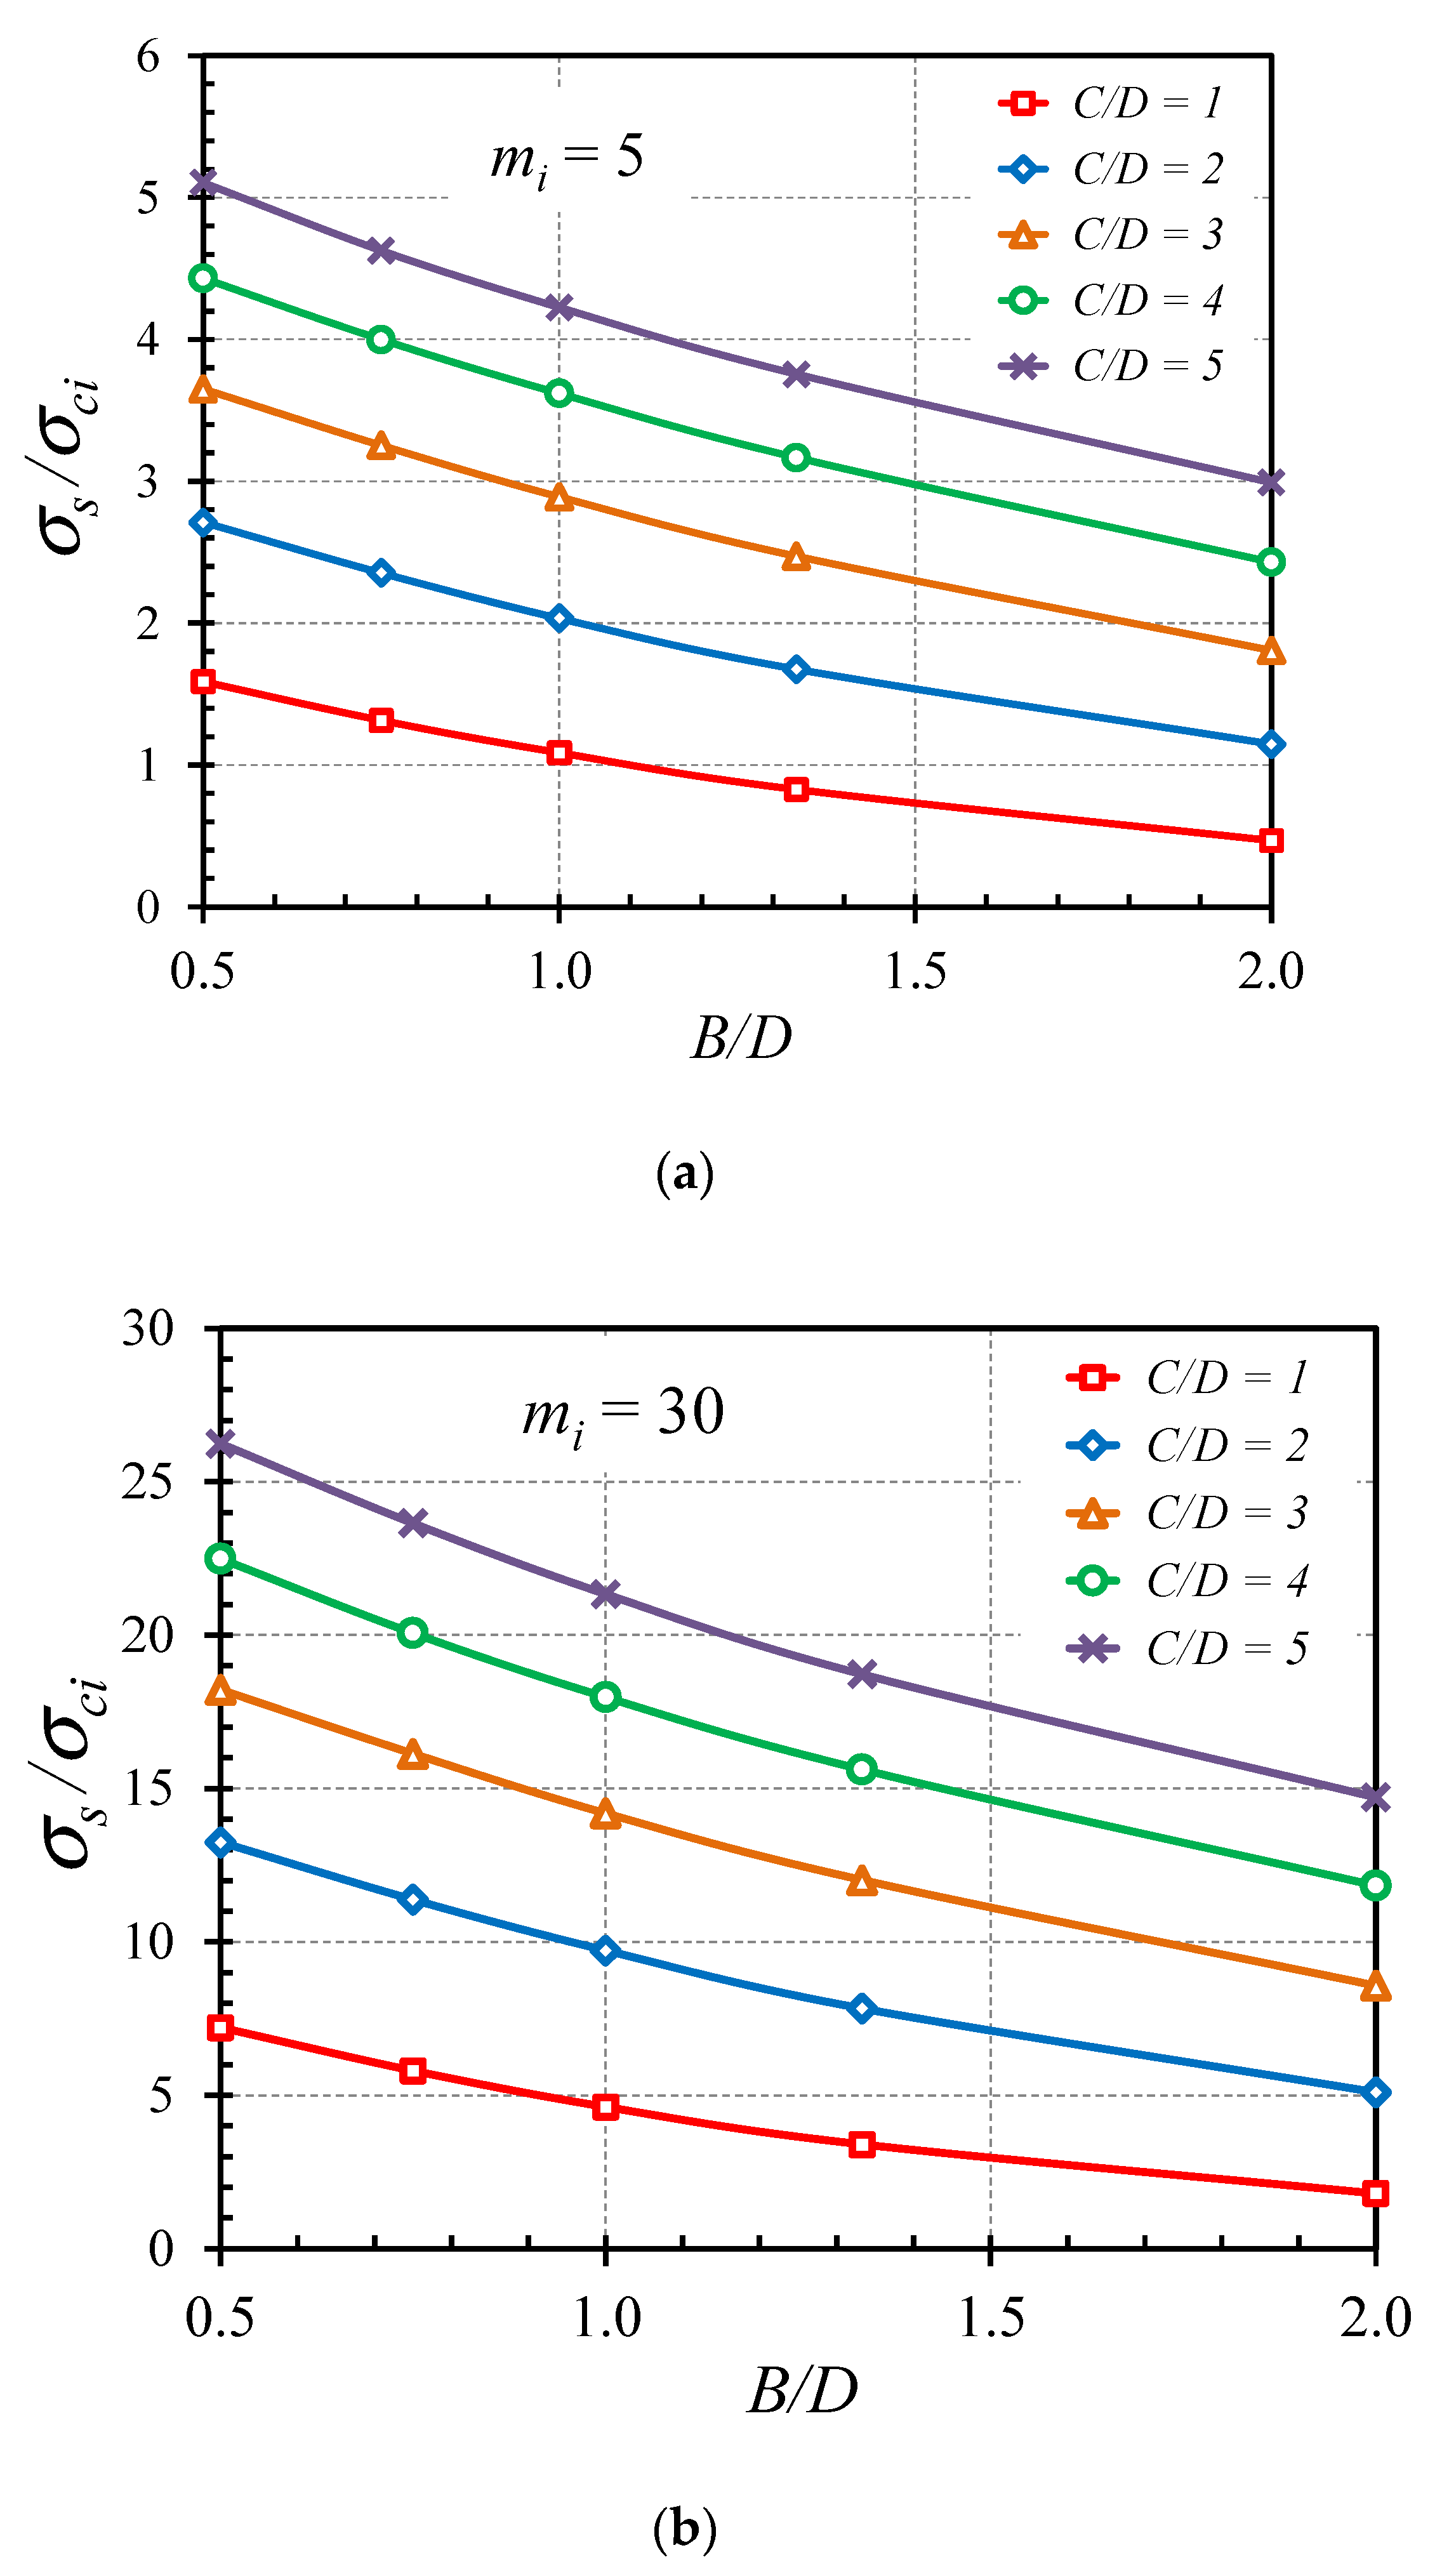
5.2. Parametric Studies

For the stability problem of rock tunnels with a horseshoe shape, this study produces a total of 1200 computed Ave solutions of the normalized failure surcharge σs/σci, which will be used later to develop design equations in the next section. In order to depict the impact of all the input parameters such as B/D, C/D, σci/γD, GSI, and mi that are taken into consideration, the numerical results are also visually given in Figure 4, Figure 5, Figure 6, Figure 7 and Figure 8.
The influence of the GSI on the stability factor σs/σci can be seen Figure 4a,b within the case of mi = 5 and 30. The representing figure is drawn based on the instances of C/D = 3 and σci/γD = 1000. Five selected various width ratios of B/D = 0.5, 0.75, 1, 1.333, and 2 are also plotted in the figures. According to numerical findings, the relationship between the GSI and σs/σci, are formed exponentially, while an increase in the GSI leading to a nonlinear increase in σs/σci for all ranges of B/D. These outcomes may be attributed to the exponential function utilized in the HB-failure-criterion model and represented in Equations (2)–(4). In fact, a high GSI value indicates a rock mass that has not been significantly disturbed, which raises the stability of rock tunnels.
The impact of mi on σs/σci for the GSI = 40 and 100 is shown in Figure 5a,b, respectively. The plots contain five distinct width ratios of B/D = 0.5, 0.75, 1, 1.333, and 2 and are established using the chosen parameters of C/D = 3 and σci/γD = 1000. Based on the obtained results, it is clearly observed that mi directly affects σs/σci in the positive linear variation pattern. For all B/D ranges, a rise in mi leads to a rise in σs/σci. Generally, mi is determined by the mineralogy, composition, and grain size of the intact rock mass in physical aspect.
The impact of σci/γD on σs/σci is shown in Figure 6a,b, since all the data are shown only in a linear horizontal relation, demonstrating that the rise in σci/γD has no impact on the σs/σci values. This finding applies to all B/D, mi and the GSI values. The total rock tunnel stability is seldom affected by the unit weight ratio of σci/γD since, in this study, we defined the value of σci to be very large comparing to that of γD, where the considered range of is σci/γD = 100–∞. However, the cases with σci/γD being less than 100 are beyond the scope of this study. More studies on those cases with small values of σci/γD being less than 100 should be carried out in the future.
The impact of the cover-depth ratio C/D on σs/σci for the cases of (σci/γD = 1000, GSI = 80 and mi = 5 and 30) are shown in Figure 7a,b respectively, in which it is demonstrated that C/D and σs/σci have a nonlinear increasing relationship, while an increase in the C/D value leads to a higher value of the stability factor σs/σci. It may be explained by the typical phenomenon that the deeper the tunnel is, the greater stability can be achieved. Figure 8a,b show the impact of B/D on σs/σci for the cases of (σci/γD = 1000 and GSI = 80 and mi = 5 and 30). It can be understood that the geometrical arching effect would develop with either a rise in C/D or a fall in B/D, which would be advantageous for enhancing the tunnel stability. Numerical results of all C/D values show that when B/D increases, σs/σci also increases non-linearly. Also, a higher B/D ratio yields a lesser value of σs/σci.

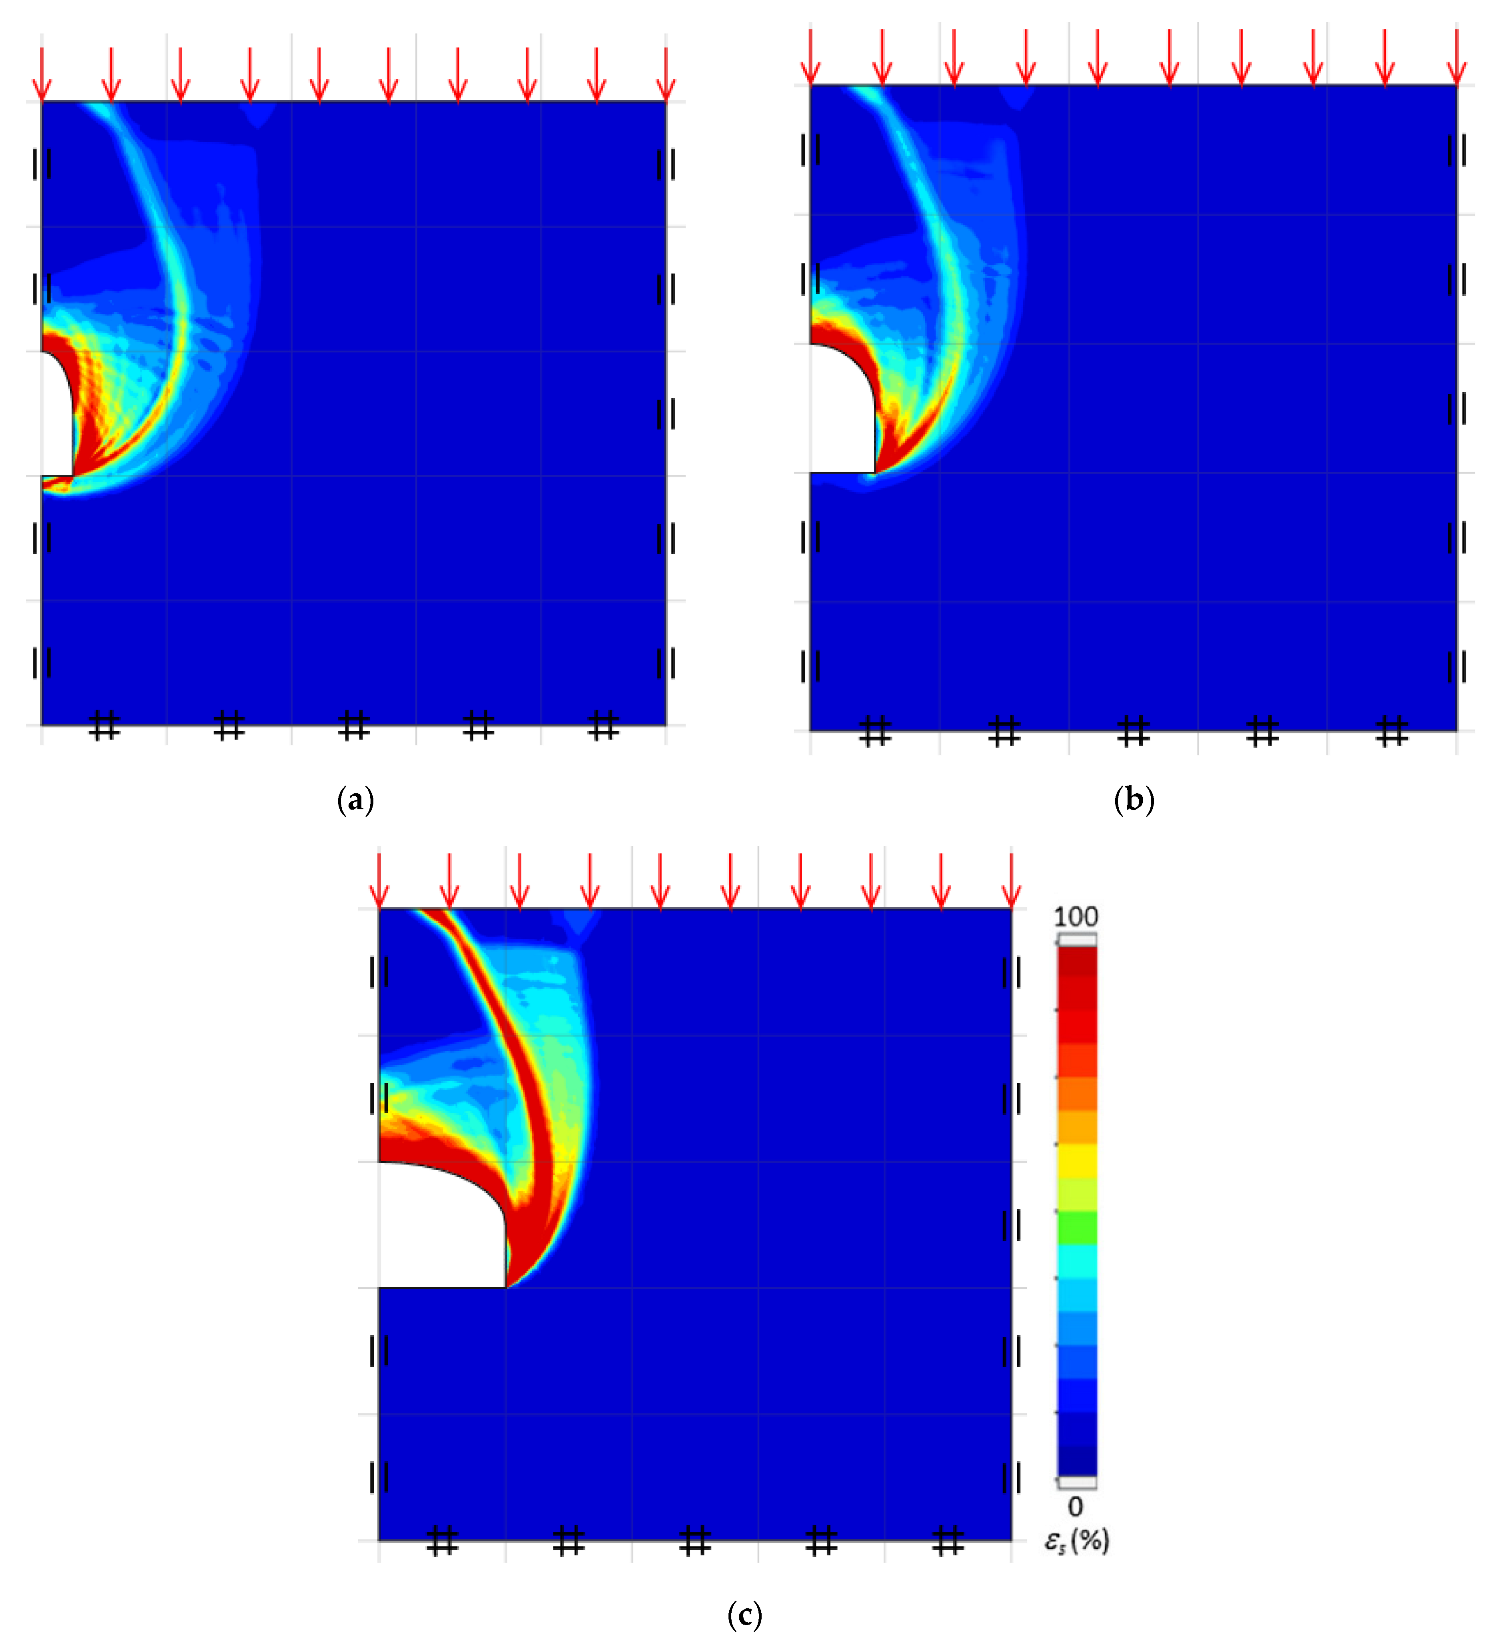
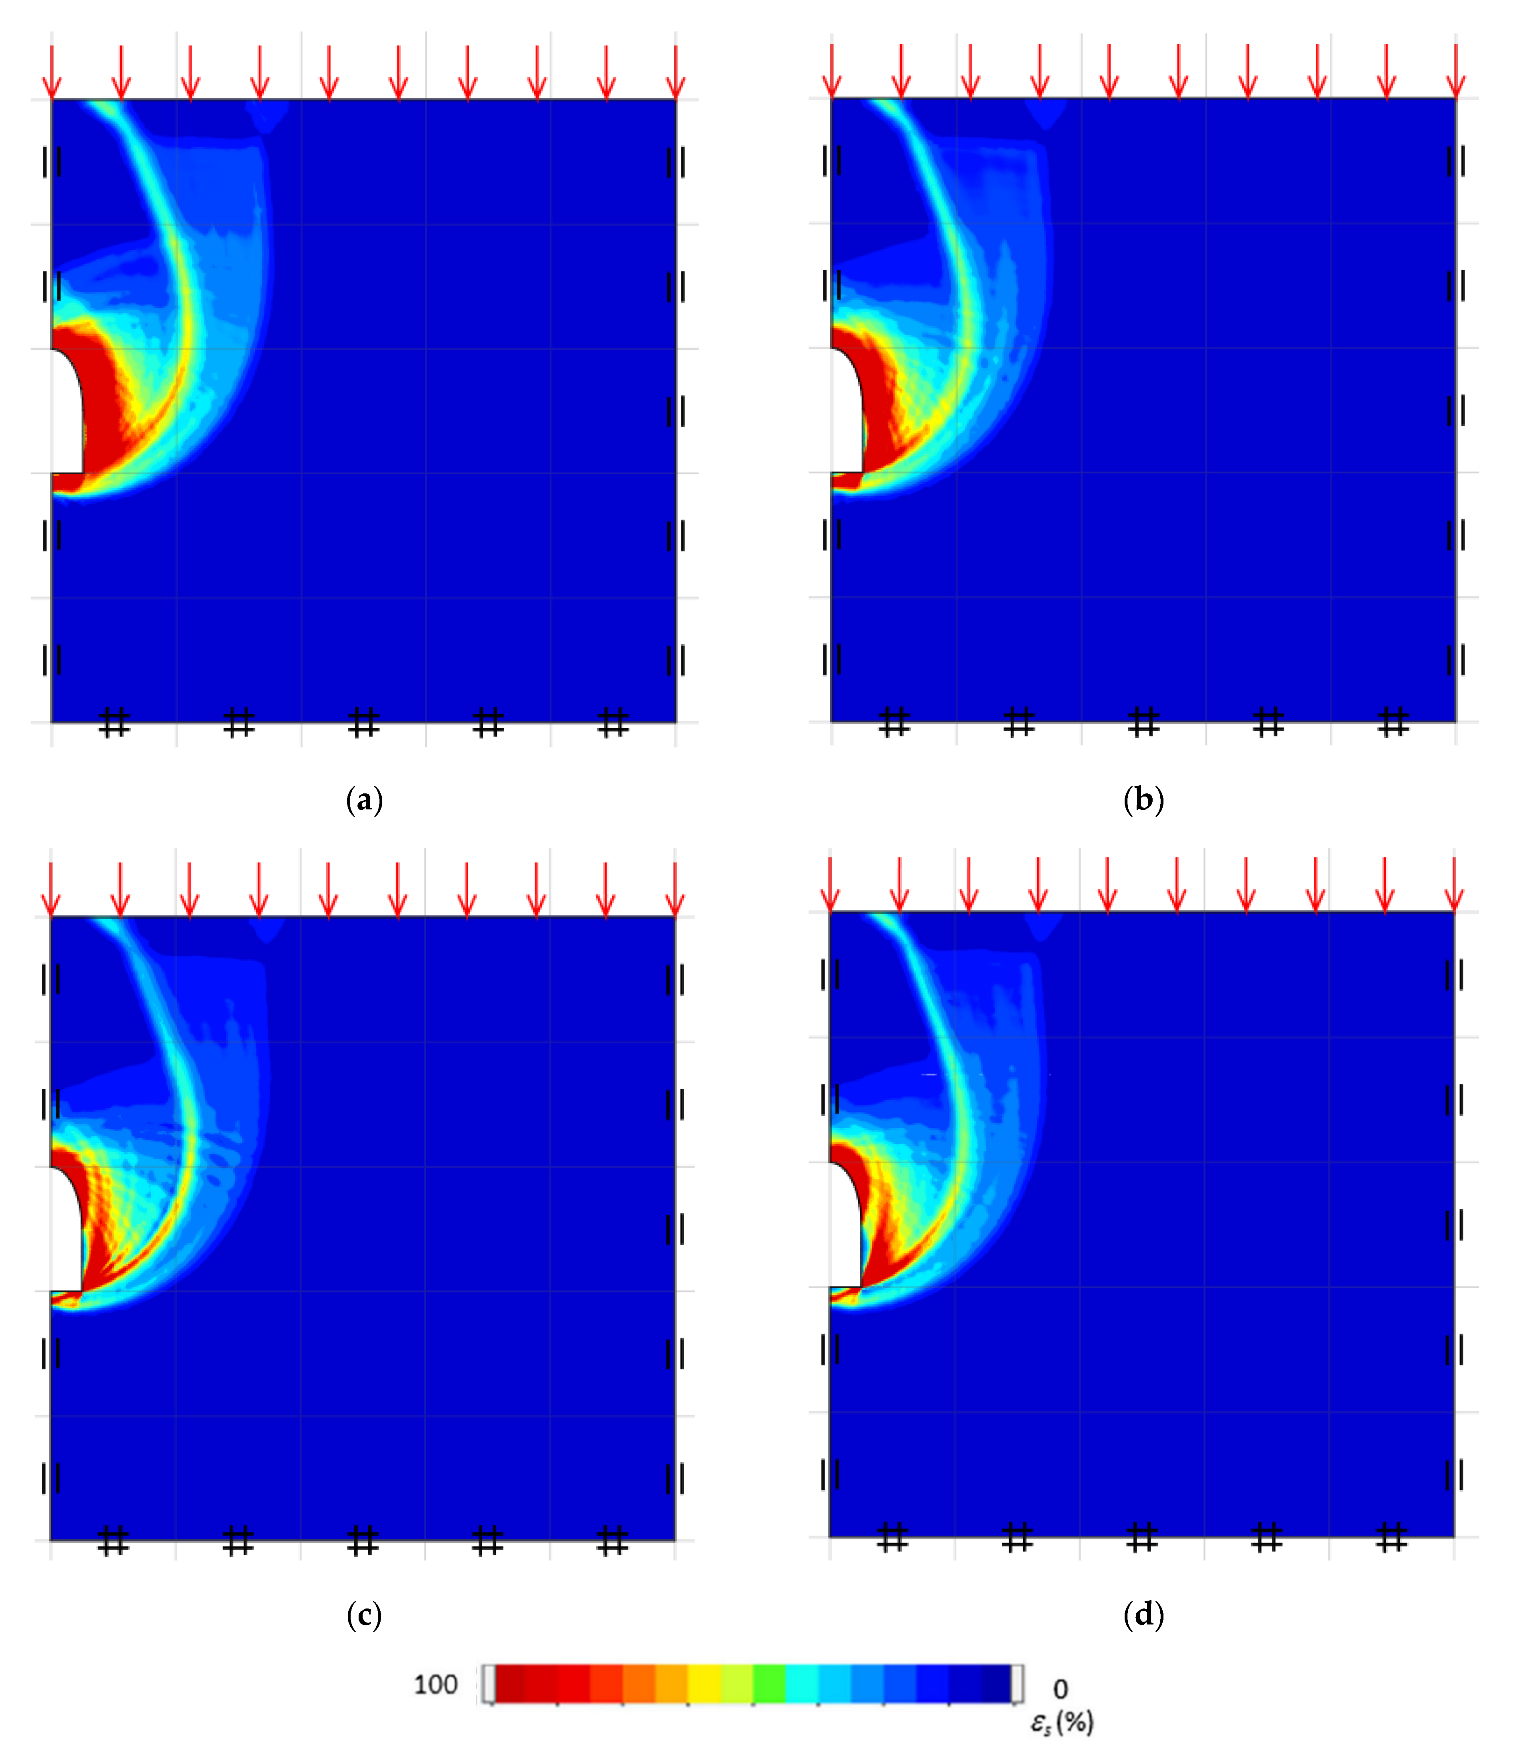
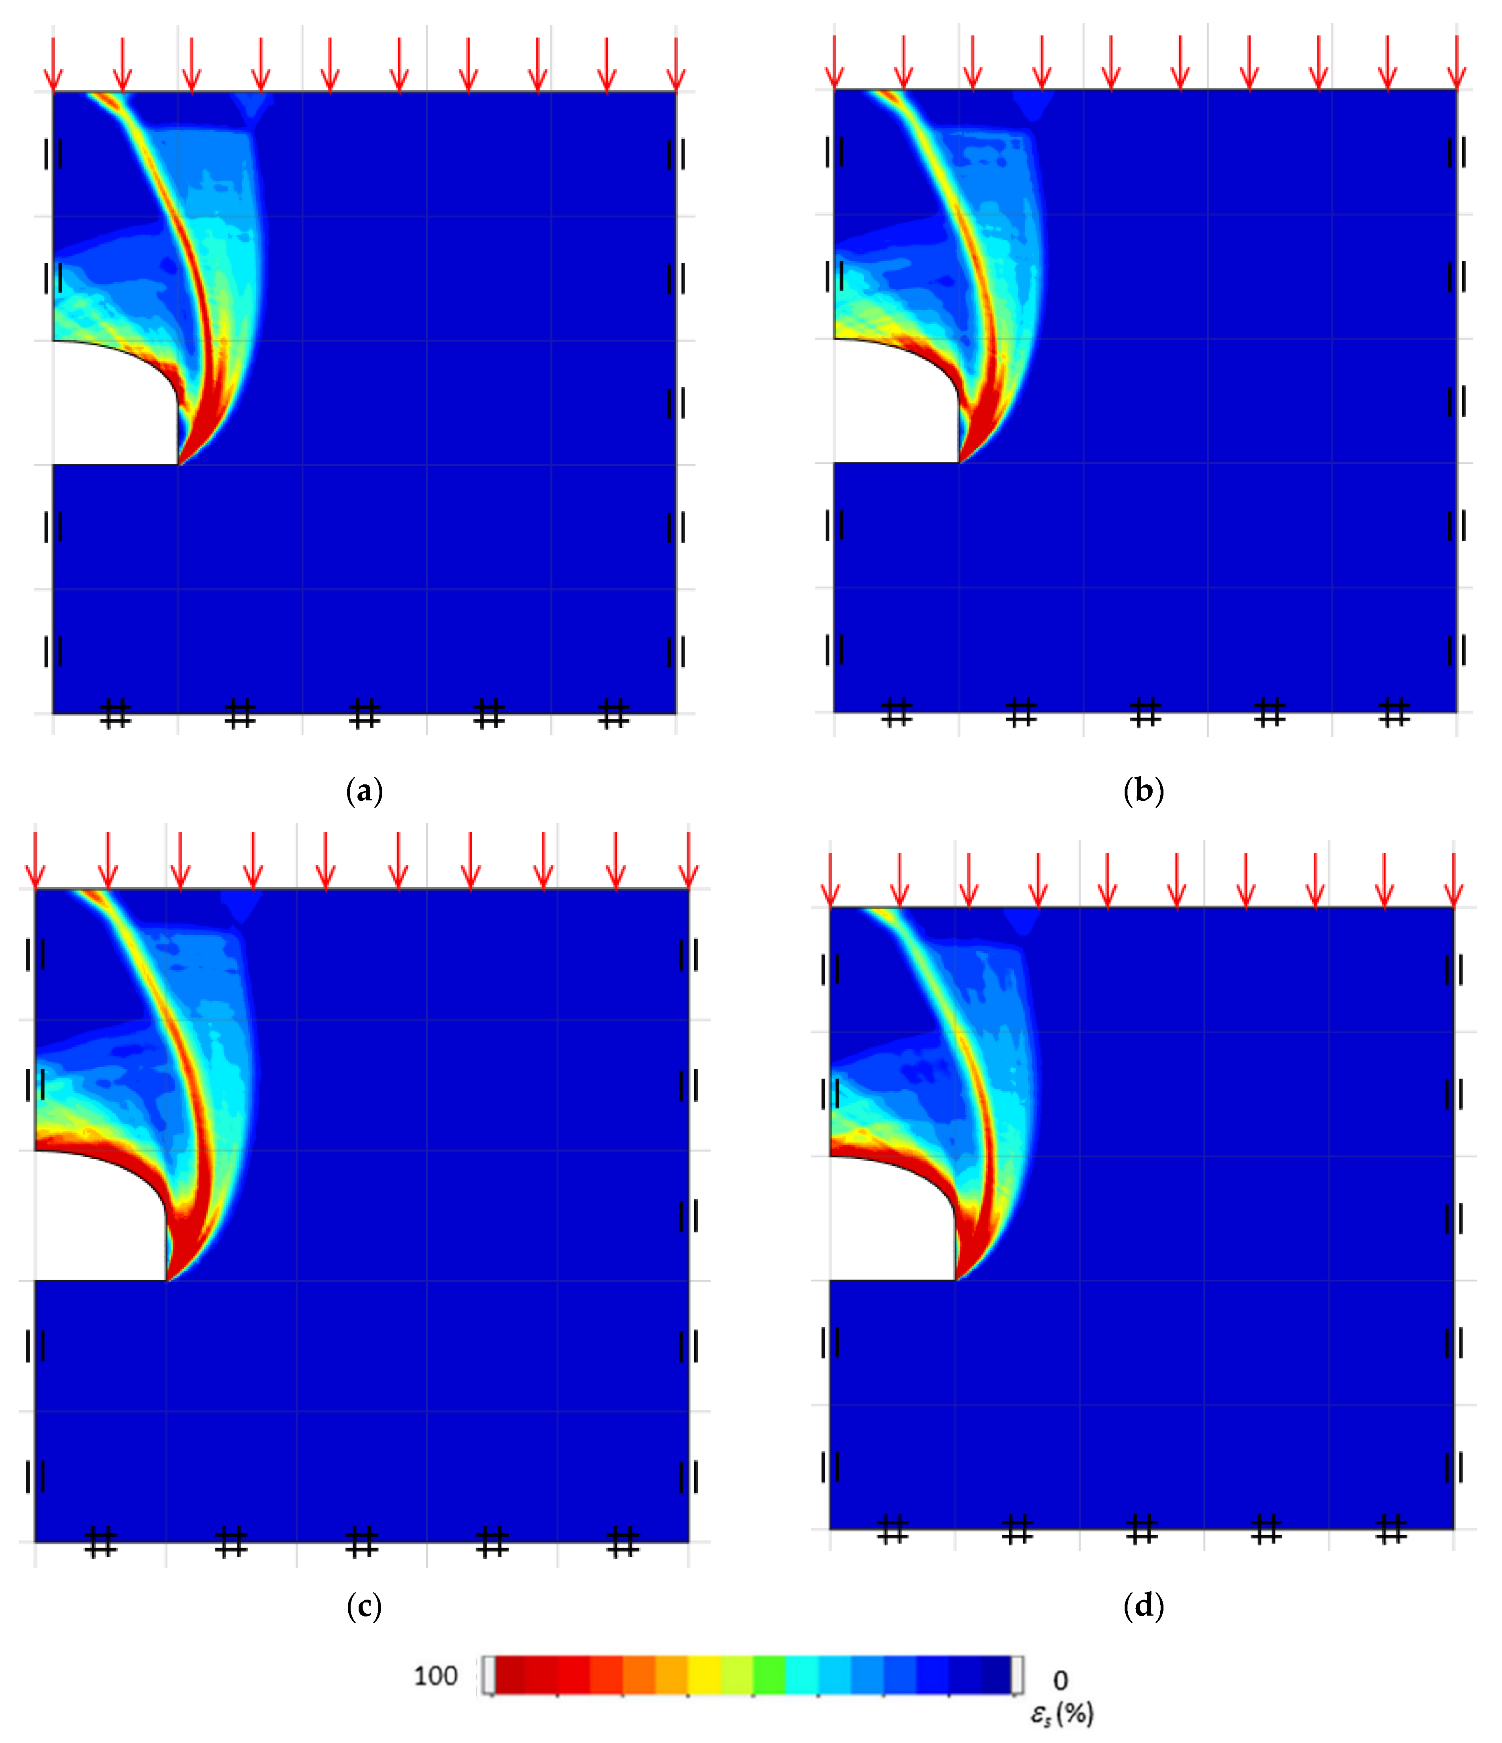
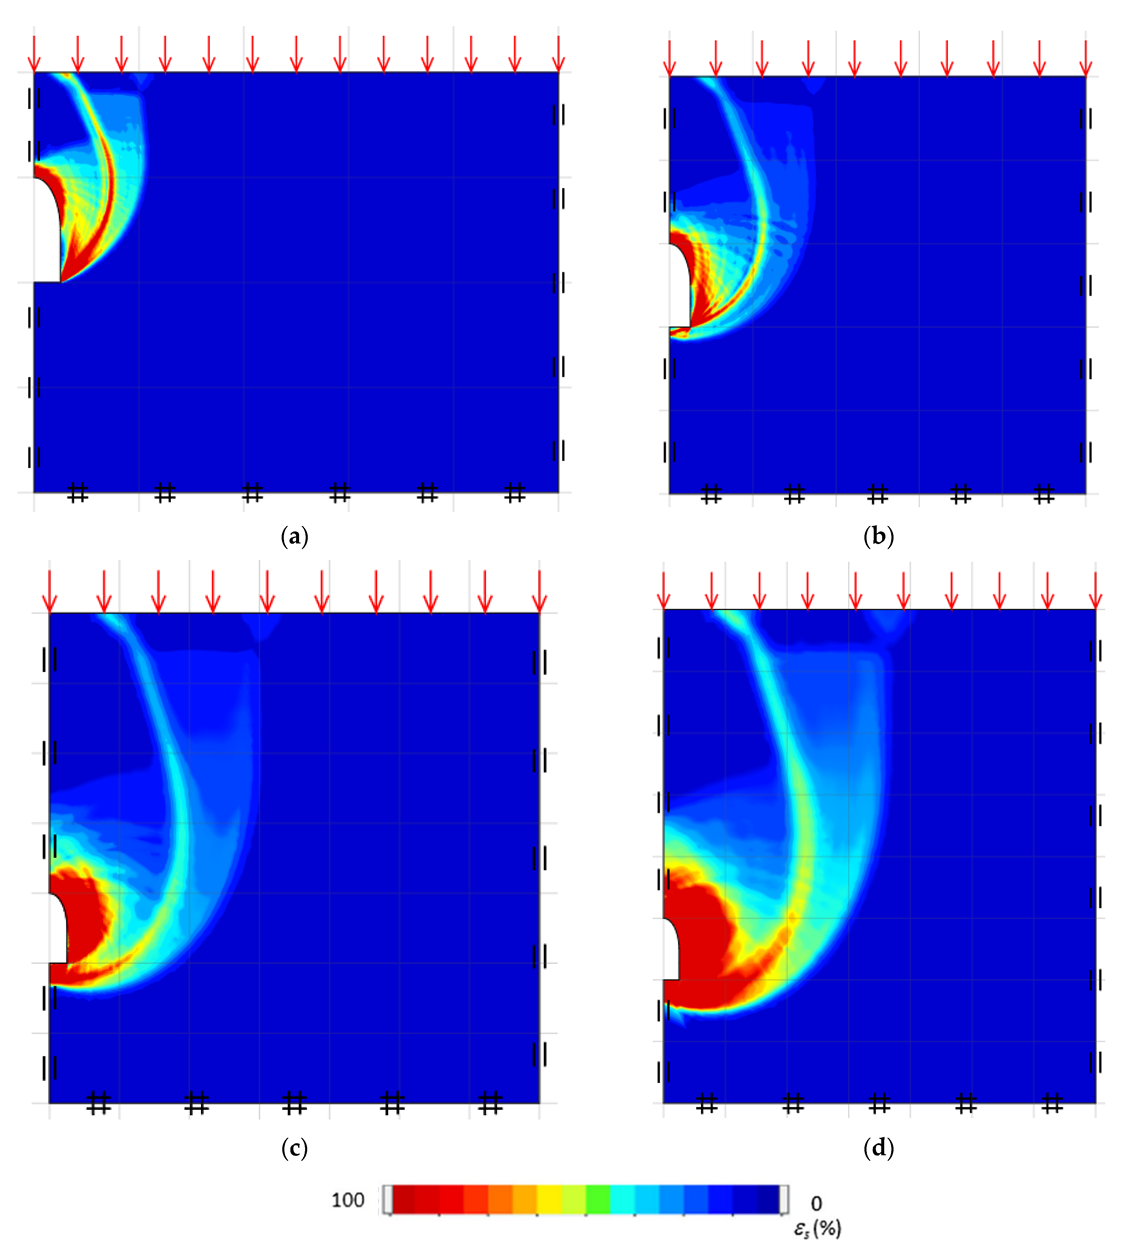
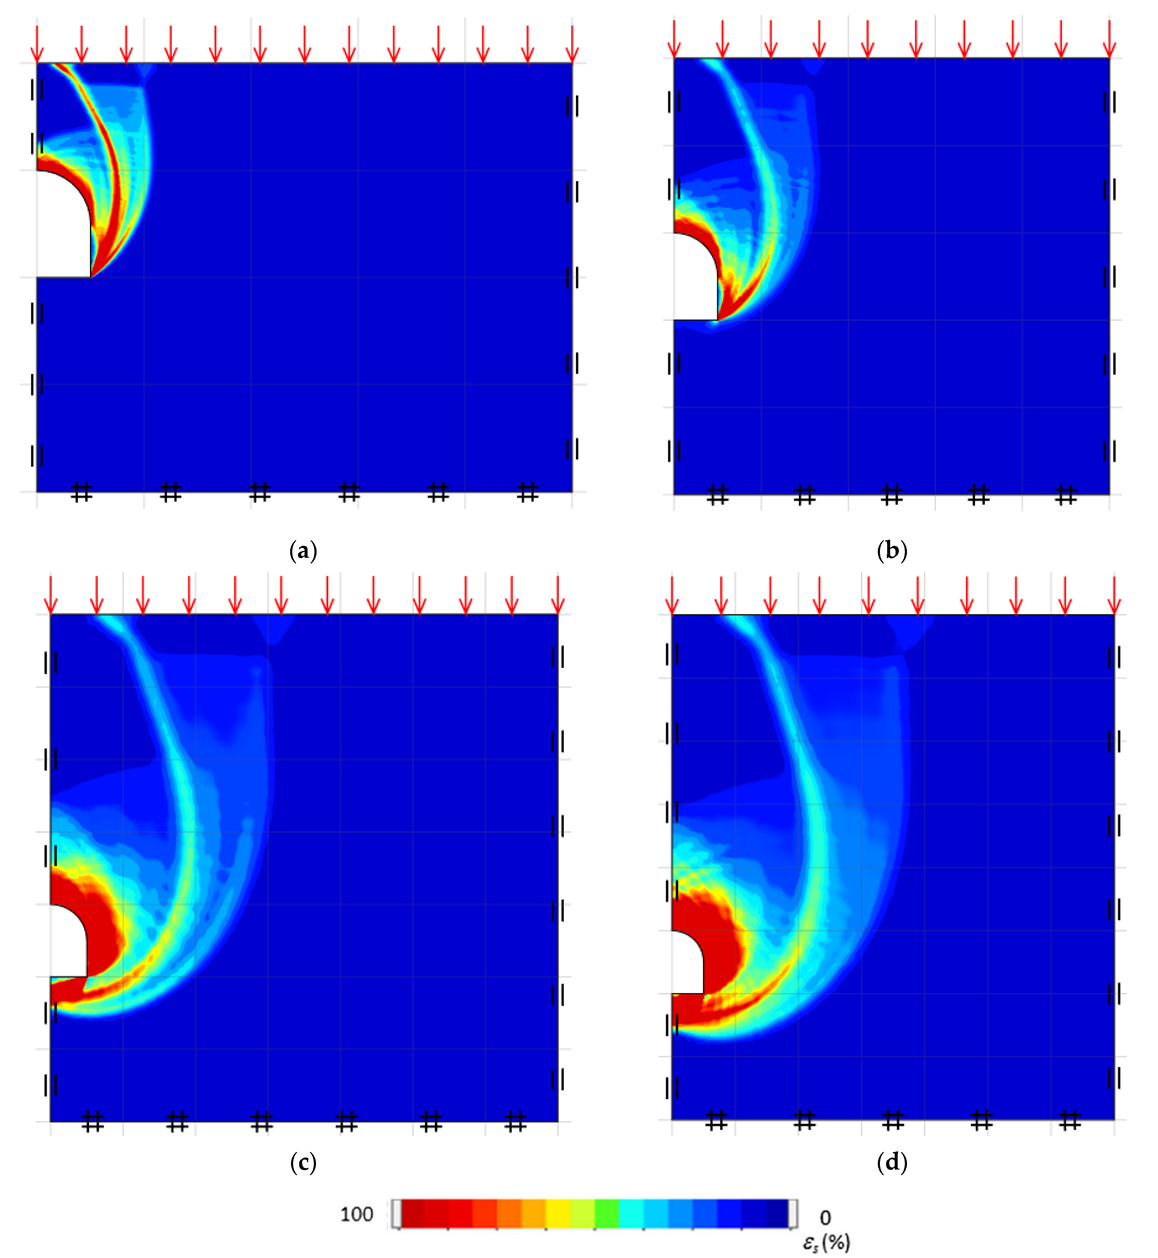
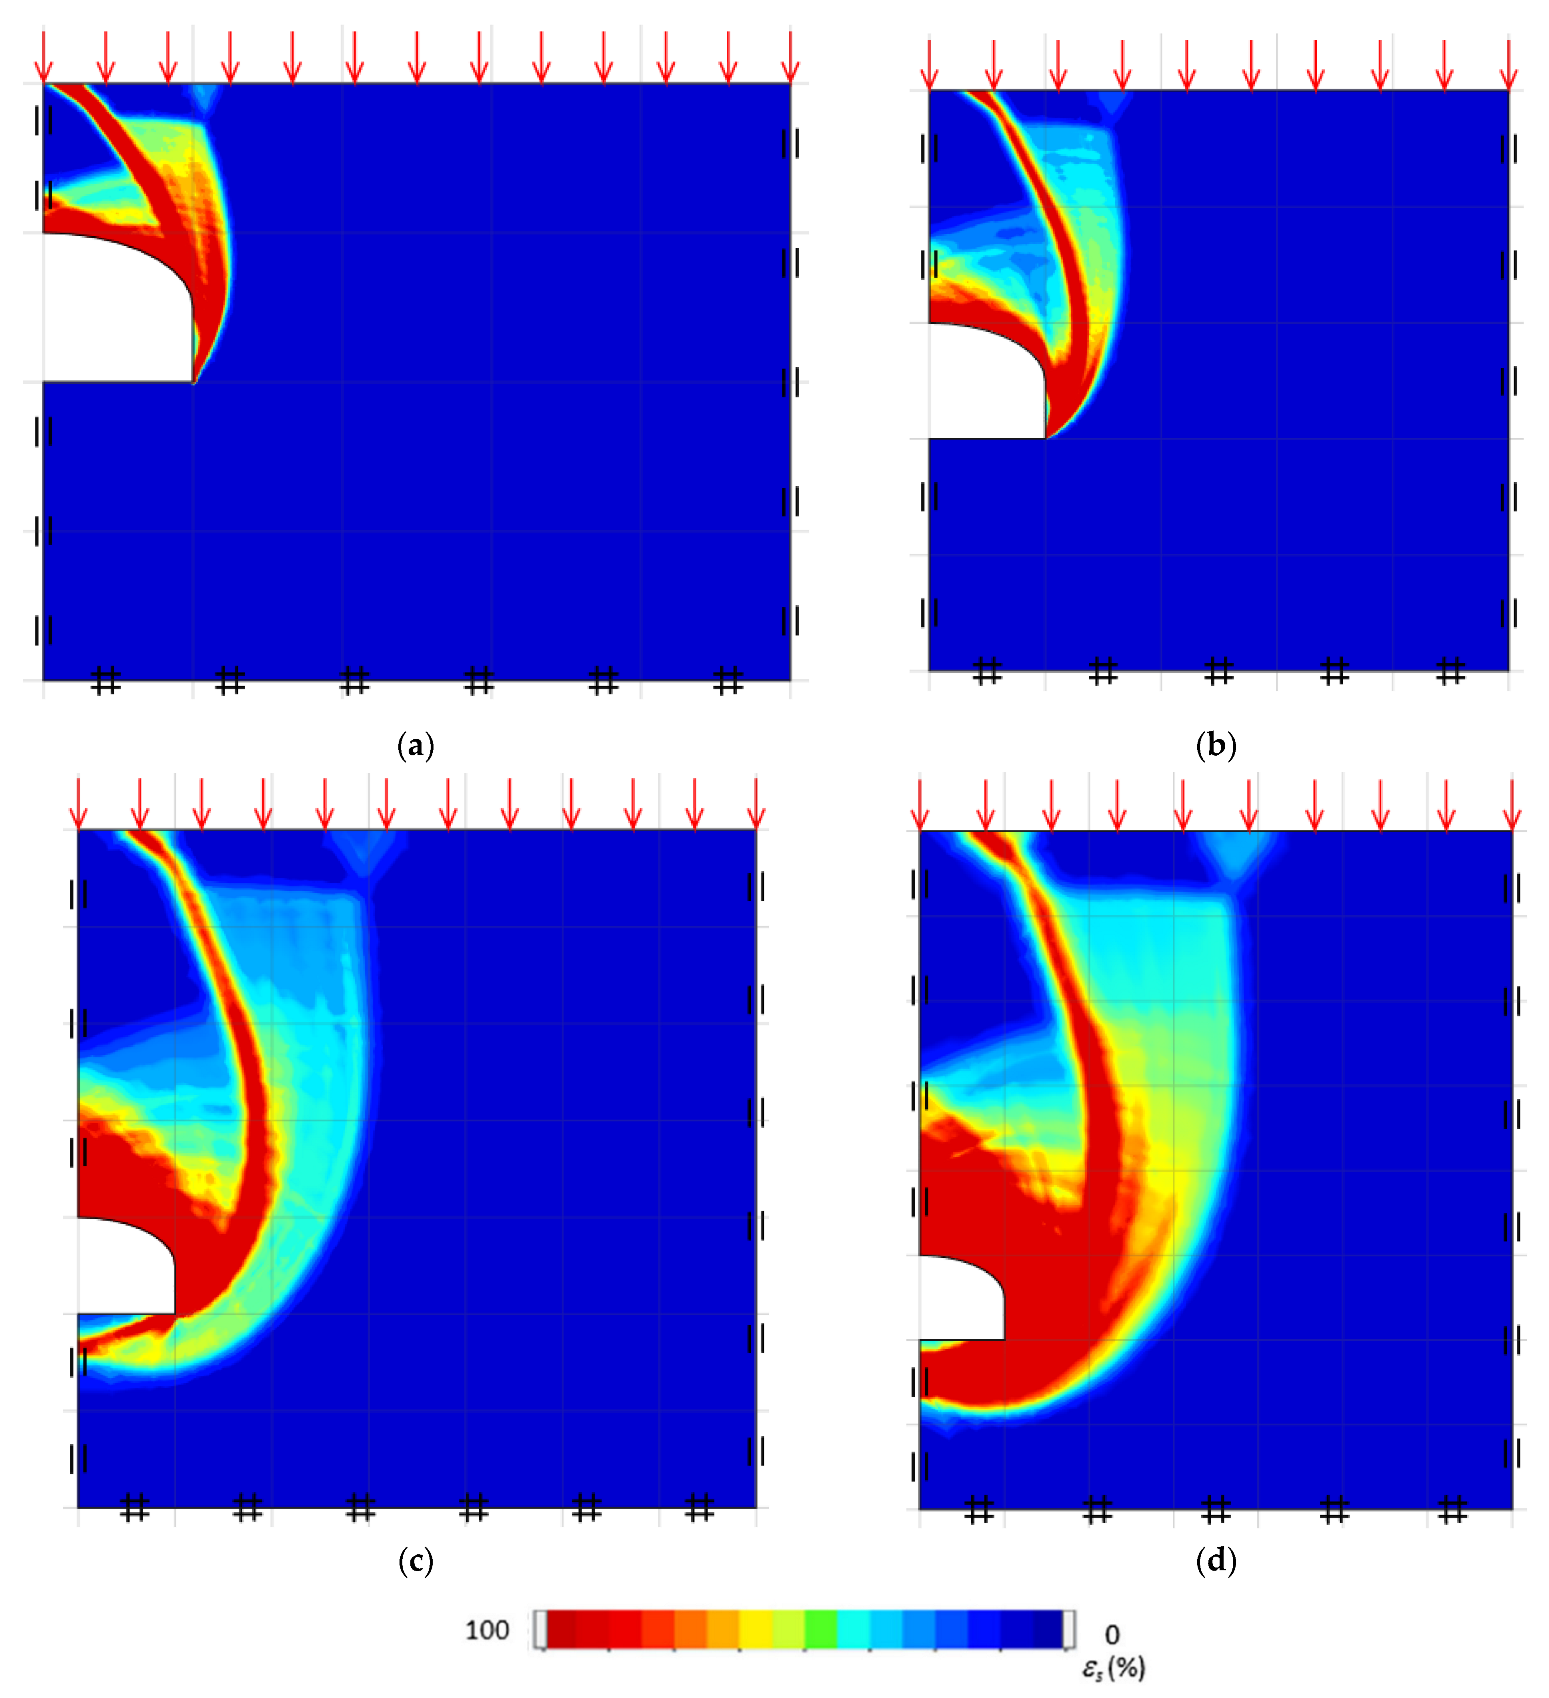
5.3. Failure Mechanisms

The final adaptive meshes using the 5th iteration for the three B/D = 0.5, 1, and 2 are shown in Figure 9, while the plots of the shear dissipations indicating the failure zones of the three B/D are presented Figure 10. These plots are based on the case of (σci/γD = 1000, GSI = 80, and mi = 20). It is interesting to note that either the final adaptive meshes or the shear dissipation plots are adapted to represent the plastic shear zone of the horseshoe tunnels in rock masses. Note that the zones with the adaptive mesh refinement can be used to represent the same zones of the shear dissipation since the patterns of both are in the similar manner. The failure zone frequently displayed an oval form and spans from the tunnel’s base to the rock’s surface. The size of the failure zone around the tunnel is reduced by a greater B/D. The failure zone for the case with B/D = 2.0 extends from the corner point of the tunnel, while the failure zone for the case with B/D = 0.5 extends from below the base of tunnel.
Figure 11 presents the failure mechanisms for the four GSI values while the plots in Figure 12 are for four different mi values. The chosen cases for Figure 11 are (C/D = 2, B/D = 0.5, σci/γD = 1000, mi = 20, and GSI = 40, 60, 80, and 100), whereas Figure 12 shows the cases of (C/D = 2, B/D = 2, σci/γD = 1000, GSI = 80, and mi = 5, 10, 20, 30). From both figures, it can be concluded that the influence of the GSI and mi on the overall failure mechanisms is negligible, given the uniform surcharge pressures at the collapse state. The absolute values of shear dissipation are not significant; hence, they are not shown in the figures.
Figure 13, Figure 14 and Figure 15 show the failure mechanisms that have been affected by the cover-depth ratio for B/D = 0.5, 1, and 2, respectively. Other parameters are fixed as: σci/γD = 1000, GSI = 80, and mi = 20. In general, the failure mechanisms resemble each other under the uniform surcharge effects. It is also important to note the three possible slip planes; one is above the tunnel and the other two spiral upwards to the ground level from the tunnels side. The failure zone spreads further away from the tunnel as C/D is increased.

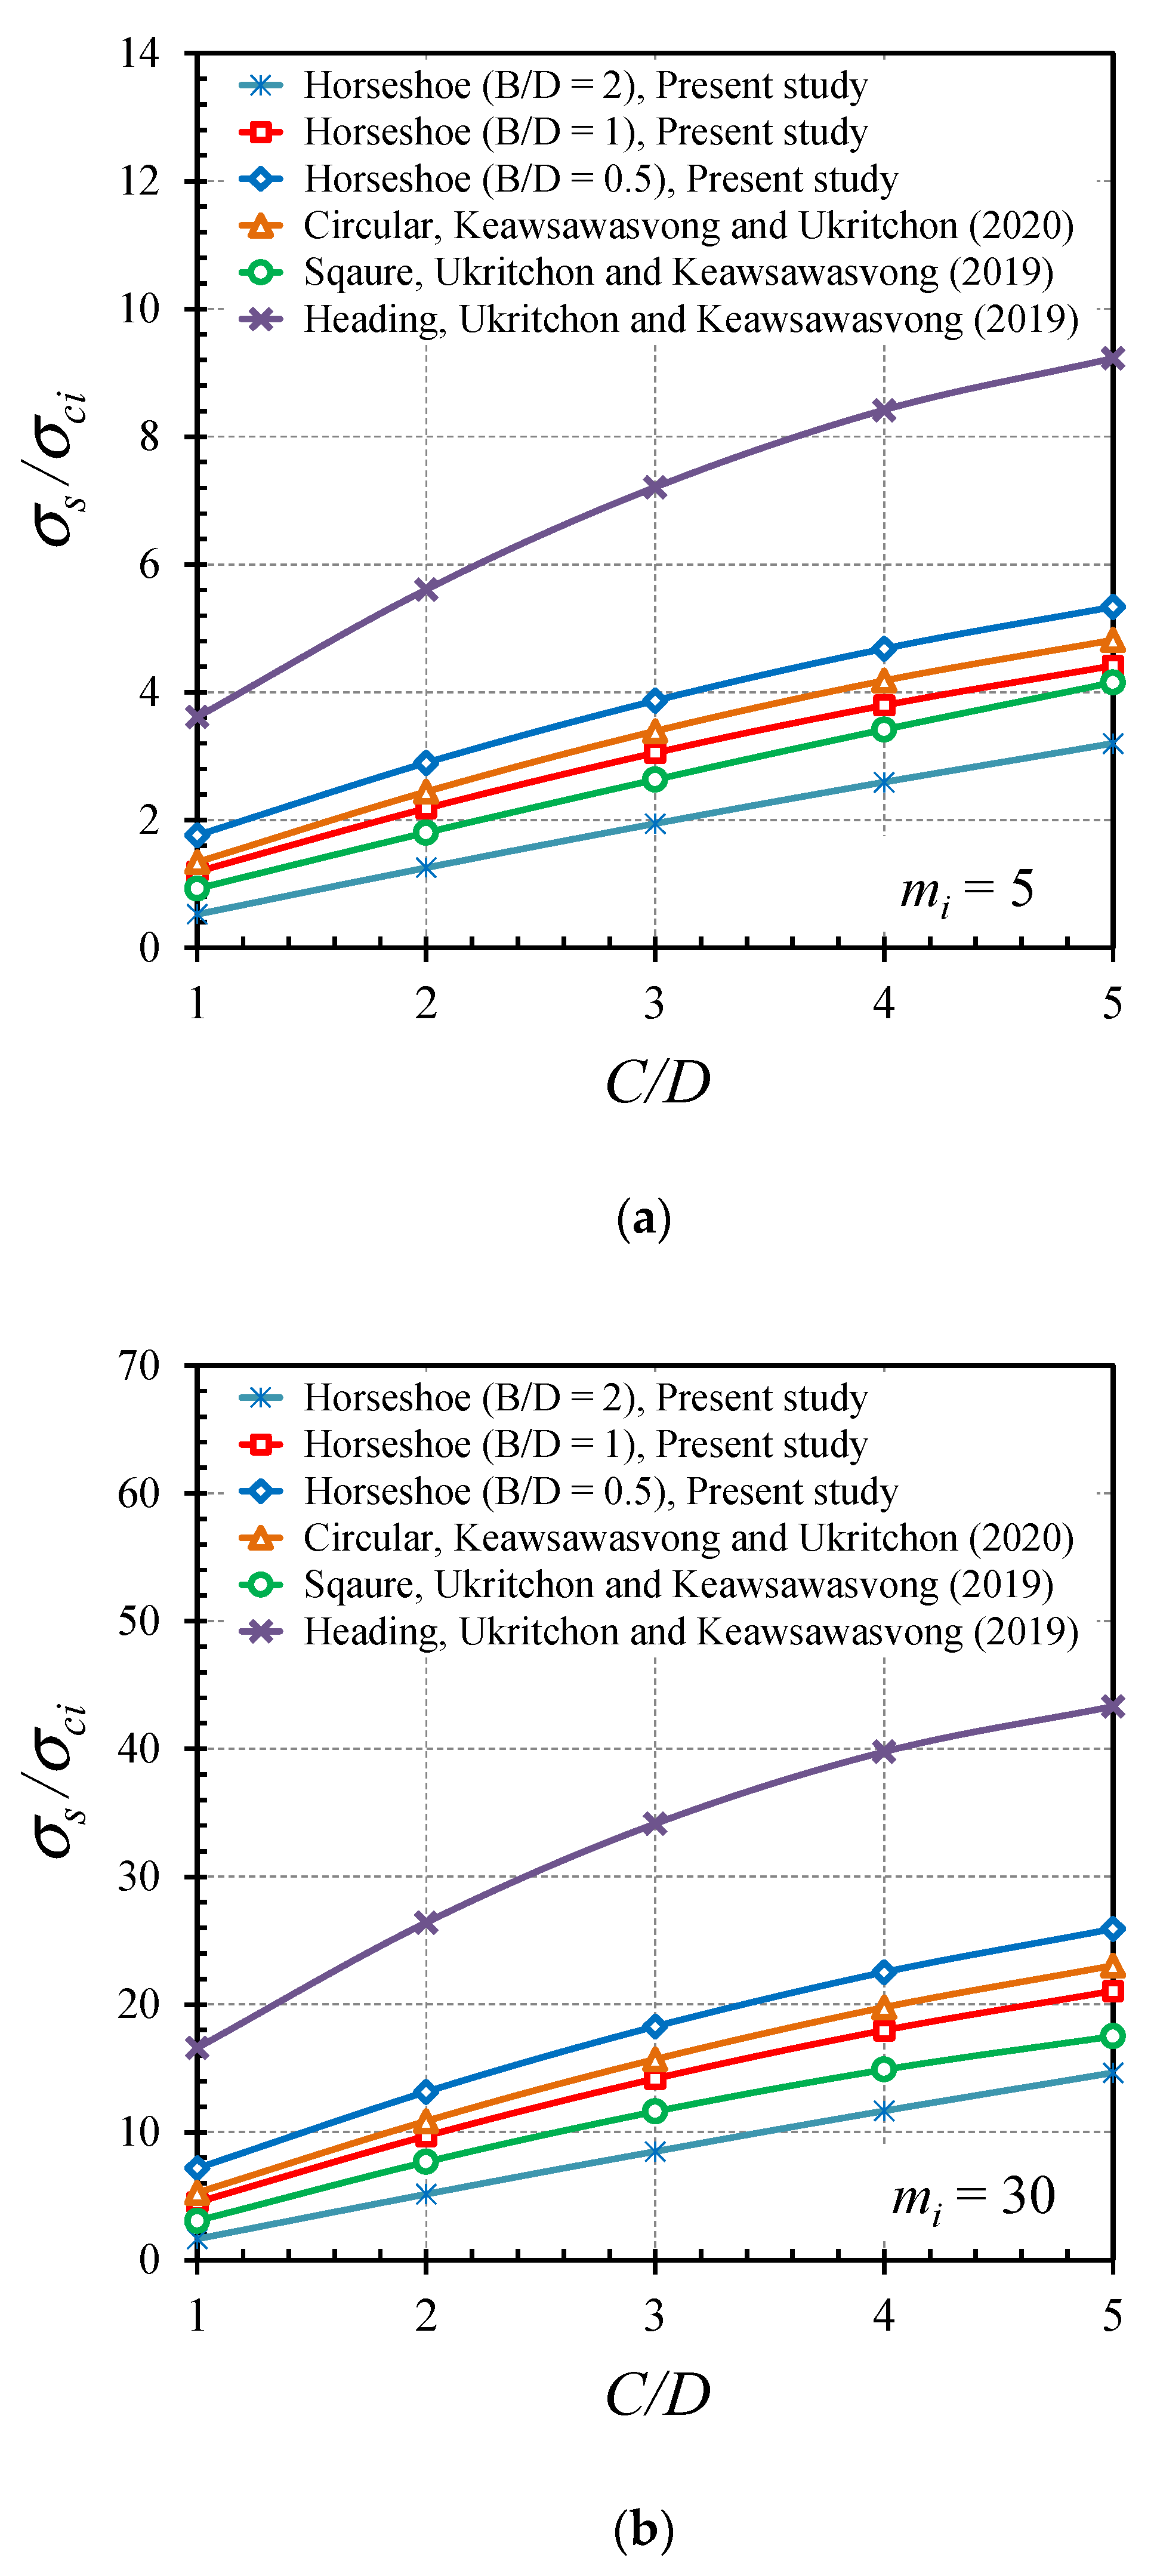
5.4. Comparison among Different Tunnel Shapes

Figure 16 presents a comparison of the stability factors σs/σci among various tunnel forms. Figure 16a,b are related to mi = 5 and mi = 30, respectively. Some published papers for the similar problem are carried out in the comparison including the problems of a plane strain tunnel heading [41], a square tunnel [37], and a circular tunnel [34]. The current horseshoe tunnel problems (B/D = 0.5, 1, and 2) are compared to all of the above studies. According to numerical data in Figure 16, the greatest stability factor σs/σci among the six varied forms is the result of the planar tunnel headings. The lowest stability factor can be founded in the cases of the horseshoe tunnel with a large B/D value (B/D = 2) due to the large unsupported width of the tunnel. This comparison is useful in determining the form of a tunnel. Furthermore, it may be used to validate the current solution since it exhibits the identical pattern as earlier studies.
According to Equation (5) and Figure 4, Figure 5, Figure 6, Figure 7 and Figure 8, σs/σci, the results of the tunnel stability depend on a number of dimensionless parameters, such as B/D, C/D, GSI, mi, and σci/γD. Given that in the current investigation the discrepancies between the calculated UB and LB solutions are under 5%, their average (Ave) values were used to develop the design equations. In order to achieve the mathematical equations, the authors attempted numerous curve-fitting techniques on the Ave solutions. As a result, it can be summarized that extremely strong correlations exists between σs/σci and a linear function of γD/σci, a cubic function of the GSI, a linear function of mi, and a quadratic function of C/D, as expressed as follows:
σ s σ c i = A 1 + A 2 C D + A 3 C D 2
σ s σ c i = B 1 + B 2 G S I + B 3 G S I 2 + B 4 G S I 3
σ s σ c i = E 1 + E 2 m i
σ s σ c i = G 1 + G 2 γ D σ c i
where Ai, Bi, Ei, Gi are coefficients from the curve-fitting method for the different dimensionless parameters.
By combining all expression in Equation (6) in the equations with the best mathematic forms, the design equations for computing σs/σci are developed and expressed in Equations (7a)–(7d):
σ s σ c i = F 1 + F 2 m i F 3 γ D σ c i
F 1 = G S I b 1 + b 2 C D + b 3 C D 2 + G S I 2 c 1 + c 2 C D + c 3 C D 2
F 2 = e 1 + e 2 C D + G S I f 1 + f 2 C D + f 3 C D 2 + G S I 2 g 1 + g 2 C D + G S I 3 d 1 C D
F 3 = a 1 + a 2 C D
where ai, bi, ci, di, ei, fi, and gi in Equations (7a)–(7d) denote the constant coefficients.
The least squares approach is a straightforward method to resolve the seven constant coefficients given in Equation (7) [59] by reducing the squared sum of the deviation in σs/σci between the FELA and the approximate solutions, which can be seen as follows [59]:
M i n i m i z e e r r o r 2 = M i n i m i z e i = 1 n y i f i 2
where yi = Ave FELA solutions
fi = Approximate solutions of σs/σci from Equation (7a)
n = Number of data
The accuracy of the proposed new design equation can be verified using the coefficient of determination, R2 as [59]:
R 2 = 1 S S r e s S S t o t
S S t o t = i = 1 n y i y ¯ 2
S S r e s = i = 1 n y i f i 2
y ¯ = 1 n i = 1 n y i  
Using the aforesaid approach, Table 2 provides all the constants required in the proposed stability equations. For all B/D values, there is a strong correlation between the predictions and the Ave solutions. Note that the coefficient of determination (R2) is 99.98% for all B/D. Note that the value of R2 can be computed from Equation (9) by employing all Ave FELA solutions (yi) and all approximate solutions from Equation (7a) (fi) with the value of n = 1200 cases so that the value of R2 is then obtained. Hence, the proposed design Equation (7) can be used with great confidence in predicting the collapse surcharges σs/σci of shallow unlined horseshoe tunnels in Hoek–Brown rock masses.

5.5. Example

The dimensions of a horseshoe tunnel are defined as B = 6 m horizontally, D = 3 m vertically, and C = 3 m cover depth. The rock mass profile is set by several geotechnical properties including the GSI = 50, mi = 17, σci = 63 MPa, and γ = 22 kN/m3. Figure out the maximum surcharge (σt) that can cause the collapse of the tunnel.
  • Calculate all the values B/D = 6/3 = 2, C/D = 3/3 = 1, and γD/σci = 22*3/63,000 = 0.001.
  • According to B/D = 2, the values of all constant coefficients including a1, a2, b1, b2, b3, c1, c2, c3, d1, e1, e2, f1, f2, f3, g1, and g2 from Table 2 are then obtained.
  • Substitute the values of all the parameters such as C/D, γD/σci, the GSI, mi, and a1 to g2 into Equations 7(a)-7(d); then, σs/σci can be obtained as: σs/σci = 0.353.
  • Calculate σs = 63*0.353 = 22.24 MPa.

6. Conclusions

The objective of this paper is to provide the stability charts and equations for the unlined horseshoe rock tunnel problem based on the Hoek–Brown model. The stability solutions were determined for an extensive range of dimensionless parameters by the finite-element-limit analysis. These may include the width ratio B/D of 0.5–2, and the mi parameter of 5–30 the cover-depth ratio C/D of 1–5, the geological strength index GSI of 40–100 and the normalized uniaxial compressive strength σci/γD of 100-∞. In brief, all of the studies described above come to the following conclusions:
  • The derived upper and lower bound can surround the genuine solutions below 5% of their average values while applying the adaptive meshing approach.
  • The influence of mi and γD/σci on the normalized failure surcharge σs/σci is a linear relationship whereas that of B/D, C/D, and the GSI is a nonlinear relationship.
  • Regarding the failure mechanisms, it was found that the influence of the GSI and mi on the overall failure mechanisms is neglectable. A horseshoe tunnel with a large value of B/D or C/D has a greater failure zone that penetrates extensively and deeply through the rock masses.
  • A comparison of the stability factor σs/σci for various tunnel shapes was also presented in the study. It was found that the greatest stability factor is observed in the instance of the plane strain heading, in descending order with the horseshoe tunnel with B/D = 0.5, the circular tunnel, the horseshoe tunnel with B/D = 1, the square tunnel, and the horseshoe tunnel with B/D = 2.
  • Utilizing the computed average bound solutions, the novel stability equations are established for predicting the stability factor σs/σci. The suggested design equations’ accuracy is demonstrated by their coefficient of determination R2 = 99.98%. These equations can be used with confidence in design practice.

Author Contributions

J.L.: Data curation, Software, Investigation, Methodology, Writing—original draft; J.S.: Methodology, Writing—review & editing, Supervision; S.K.: Methodology, Validation, Writing –original draft; S.S.: Formal analysis, Software, Methodology; P.J.: Writing—review, revising & editing, Project administration, Supervision, Funding acquisition. All authors have read and agreed to the published version of the manuscript.

Funding

This research was funded by the National Science, Research and Innovation Fund (NSRF), and King Mongkut’s University of Technology North Bangkok with Contract no. KMUTNB-FF-65-38.

Data Availability Statement

All data, models, or code that support the findings of this study are available from the corresponding author upon reasonable request.

Conflicts of Interest

The authors declare that they have no known competing financial interests or personal relationships that could have appeared to influence the work reported in this paper.

References

  1. Kirsch, A. Experimental investigation of the face stability of shallow tunnels in sand. Acta Geotech. 2010, 5, 43–62. [Google Scholar] [CrossRef] [Green Version]
  2. Chambon, P.; Corté, J.F. Shallow tunnels in cohesionless soil: Stability of tunnel face. J. Geotech. Eng. 1994, 120, 1148–1165. [Google Scholar] [CrossRef]
  3. Kimura, T.; Mair, R.J. Centrifugal testing of model tunnels in soft clay. In Proceedings of the 10th International Conference on Soil Mechanics and Foundation Engineering, Stockholm, Sweden, 15–19 June 1981; pp. 319–322. [Google Scholar]
  4. Davis, E.H.; Gunn, M.J.; Mair, R.J.; Seneviratine, H.N. The stability of shallow tunnels and underground openings in cohesive material. Géotechnique 1980, 30, 397–416. [Google Scholar] [CrossRef]
  5. Sloan, S.W. Geotechnical stability analysis. Géotechnique 2013, 63, 531–572. [Google Scholar] [CrossRef] [Green Version]
  6. Shiau, J.; Al-Asadi, F. Revisiting Broms and Bennermarks’ original stability number for tunnel headings. Géotechnique Lett. 2018, 8, 310–315. [Google Scholar] [CrossRef] [Green Version]
  7. Wilson, D.W.; Abbo, A.J.; Sloan, S.W.; Lyamin, A.V. Undrained stability of a circular tunnel where the shear strength increases linearly with depth. Can. Geotech. J. 2011, 48, 1328–1342. [Google Scholar] [CrossRef]
  8. Yamamoto, K.; Lyamin, A.V.; Wilson, D.W.; Sloan, S.W.; Abbo, A.J. Stability of a circular tunnel in cohesive-frictional soil subjected to surcharge loading. Comput. Geotech. 2011, 38, 504–514. [Google Scholar] [CrossRef]
  9. Assadi, A.; Sloan, S.W. Undrained stability of shallow square tunnel. J. Geotech. Eng. 1991, 117, 1152–1173. [Google Scholar] [CrossRef]
  10. Sloan, S.W.; Assadi, A. Undrained stability of a square tunnel in a soil whose strength increases linearly with depth. Comput. Geotech. 1991, 12, 321–346. [Google Scholar] [CrossRef]
  11. Ukritchon, B.; Keawsawasvong, S. Undrained stability of unlined square tunnels in clays with linearly increasing anisotropic shear strength. Geotech. Geol. Eng. 2020, 38, 897–915. [Google Scholar] [CrossRef]
  12. Wilson, D.W.; Abbo, A.J.; Sloan, S.W.; Lyamin, A.V. Undrained stability of a square tunnel where the shear strength increases linearly with depth. Comput. Geotech. 2013, 49, 314–325. [Google Scholar] [CrossRef]
  13. Yamamoto, K.; Lyamin, A.V.; Wilson, D.W.; Sloan, S.W.; Abbo, A.J. Stability of a single tunnel in cohesive–frictional soil subjected to surcharge loading. Can. Geotech. J. 2011, 48, 1841–1854. [Google Scholar] [CrossRef]
  14. Augarde, C.E.; Lyamin, A.V.; Sloan, S.W. Stability of an undrained plane strain heading revisited. Comput. Geotech. 2003, 30, 419–430. [Google Scholar] [CrossRef]
  15. Sloan, S.W.; Assadi, A. Undrained stability of a plane strain heading. Can. Geotech. J. 1994, 31, 443–450. [Google Scholar] [CrossRef]
  16. Ukritchon, B.; Keawsawasvong, S. Lower bound solutions for undrained face stability of plane strain tunnel heading in anisotropic and non-homogeneous clays. Comput. Geotech. 2019, 112, 204–217. [Google Scholar] [CrossRef]
  17. Sirimontree, S.; Keawsawasvong, S.; Ngamkhanong, C.; Seehavong, S.; Sangjinda, K.; Jearsiripongkul, T.; Thongchom, C.; Nuaklong, P. Neural network-based prediction model for the stability of unlined elliptical tunnels in cohesive-frictional soils. Building 2022, 12, 444. [Google Scholar] [CrossRef]
  18. Keawsawasvong, S.; Shiau, J. Stability of active trapdoors in axisymmetry. Undergr. Space 2022, 7, 50–57. [Google Scholar] [CrossRef]
  19. Ukritchon, B.; Keawsawasvong, S.; Yingchaloenkitkhajorn, K. Undrained face stability of tunnels in Bangkok Subsoils. Int. J. Geotech. Eng. 2017, 11, 262–277. [Google Scholar] [CrossRef]
  20. Keawsawasvong, S.; Ukritchon, B. Design equation for stability of a circular tunnel in an anisotropic and heterogeneous clay. Undergr. Space 2022, 7, 76–93. [Google Scholar] [CrossRef]
  21. Shiau, J.; Keawsawasvong, S. Producing undrained stability factors for various tunnel shapes. Int. J. Geomech. 2022, 22, 06022017. [Google Scholar] [CrossRef]
  22. Ukritchon, B.; Keawsawasvong, S. Design equations for undrained stability of opening in underground walls. Tunn. Undergr. Space Technol. 2017, 70, 214–220. [Google Scholar] [CrossRef]
  23. Ukritchon, B.; Keawsawasvong, S. Stability of retained soils behind underground walls with an opening using lower bound limit analysis and second-order cone programming. Geotech. Geol. Eng. 2019, 37, 1609–1625. [Google Scholar] [CrossRef]
  24. Wilson, D.W.; Abbo, A.J.; Sloan, S.W. Undrained stability of tall tunnels. In Computer Methods and Recent Advances in Geomechanics; Oka, F., Murakami, A., Uzuoka, R., Kimoto, S., Eds.; CRC Press: Boca Raton, FL, USA, 2014; pp. 447–452. [Google Scholar]
  25. Bhattacharya, P.; Sriharsha, P. Stability of horseshoe tunnel in cohesive-frictional soil. Int. J. Geomech. 2020, 20, 06020021. [Google Scholar] [CrossRef]
  26. Zhang, J.; Feng, T.; Yang, J.; Feng, Y.; Gao, Y. Upper-bound stability analysis of dual unlined horseshoe-shaped tunnels subjected to gravity. Comput. Geotech. 2018, 97, 103–110. [Google Scholar] [CrossRef]
  27. Sun, R.; Yang, J.; Liu, S.; Yang, F. Undrained stability analysis of dual unlined horseshoe-shaped tunnels in non-homogeneous clays using lower bound limit analysis method. Comput. Geotech. 2021, 133, 104057. [Google Scholar] [CrossRef]
  28. Mollon, G.; Dias, D.; Soubra, A.H. Rotational failure mechanisms for the face stability analysis of tunnels driven by a pressurized shield. Int. J. Numer. Anal. Methods Geomech. 2011, 35, 1363–1388. [Google Scholar] [CrossRef] [Green Version]
  29. Zhang, C.; Han, K.; Zhang, D. Face stability analysis of shallow circular tunnels in cohesive-frictional soils. Tunn. Undergr. Space Technol. 2015, 50, 345–357. [Google Scholar] [CrossRef]
  30. Zhang, C.; Li, W.; Zhu, W.; Tan, Z. Face stability analysis of a shallow horseshoe-shaped shield tunnel in clay with a linearly increasing shear strength with depth. Tunn. Undergr. Space Technol. 2020, 97, 103291. [Google Scholar] [CrossRef]
  31. Jearsiripongkul, T.; Keawsawasvong, S.; Banyong, R.; Seehavong, S.; Sangjinda, K.; Thongchom, C.; Chavda, J.; Ngamkhanong, C. Stability evaluations of unlined horseshoe tunnels based on extreme learning neural network. Computation 2022, 10, 81. [Google Scholar] [CrossRef]
  32. Li, W.; Zhang, C.; Zhu, W.; Zhang, D. Upper-bound solutions for the face stability of a non-circular NATM tunnel in clays with a linearly increasing undrained shear strength with depth. Comput. Geotech. 2019, 114, 103136. [Google Scholar] [CrossRef]
  33. Hoek, E.; Brown, E.T. Empirical strength criterion for rock masses. J. Geotech. Eng. Div. 1980, 106, 1013–1035. [Google Scholar] [CrossRef]
  34. Keawsawasvong, S.; Ukritchon, B. Design equation for stability of shallow unlined circular tunnels in Hoek-Brown rock masses. Bull. Eng. Geol. Environ. 2020, 79, 4167–4190. [Google Scholar] [CrossRef]
  35. Zhang, R.; Xiao, Y.; Zhao, M.; Zhao, H. Stability of dual circular tunnels in a rock mass subjected to surcharge loading. Comput. Geotech. 2019, 108, 257–268. [Google Scholar] [CrossRef]
  36. Farhadian, H. A new empirical chart for rockburst analysis in tunnelling: Tunnel rockburst classification (TRC). Int. J. Min. Sci. Technol. 2021, 31, 603–610. [Google Scholar] [CrossRef]
  37. Ukritchon, B.; Keawsawasvong, S. Stability of unlined square tunnels in Hoek-Brown rock masses based on lower bound analysis. Comput. Geotech. 2019, 105, 249–264. [Google Scholar] [CrossRef]
  38. Xiao, Y.; Zhao, M.; Zhang, R.; Zhao, H.; Wu, G. Stability of dual square tunnels in rock masses subjected to surcharge loading. Tunn. Undergr. Space Technol 2019, 92, 103037. [Google Scholar] [CrossRef]
  39. Xiao, Y.; Zhang, R.; Zhao, M.; Jiang, J. Stability of unlined rectangular tunnels in rock masses subjected to surcharge loading. Int. J. Geomech. 2021, 21, 04020233. [Google Scholar] [CrossRef]
  40. Rahaman, O.; Kumar, J. Stability analysis of twin horse-shoe shaped tunnels in rock mass. Tunn. Undergr. Space Technol 2020, 98, 103354. [Google Scholar] [CrossRef]
  41. Ukritchon, B.; Keawsawasvong, S. Lower bound stability analysis of plane strain headings in Hoek-Brown rock masses. Tunn. Undergr. Space Technol. 2019, 84, 99–112. [Google Scholar] [CrossRef]
  42. Hoek, E.; Carranza-Torres, C.; Corkum, B. Hoek–Brown failure criterion—2002 edition. In Proceedings of the 5th North American Rock Mechanics Symposium, Toronto, ON, Canada, 7–10 July 2002. [Google Scholar]
  43. OptumCE. OptumG2. Optum Computational Engineering: Copenhagen, Denmark. 2020. Available online: https://optumce.com/ (accessed on 1 February 2022).
  44. Ciria, H.; Peraire, J.; Bonet, J. Mesh adaptive computation of upper and lower bounds in limit analysis. Int. J. Numer. Methods Eng. 2008, 75, 899–944. [Google Scholar] [CrossRef]
  45. Yodsomjai, W.; Keawsawasvong, S.; Senjuntichai, T. Undrained stability of unsupported conical slopes in anisotropic clays based on Anisotropic Undrained Shear failure criterion. Transp. Infrastruct. Geotechnol. 2021, 8, 557–568. [Google Scholar]
  46. Yodsomjai, W.; Keawsawasvong, S.; Thongchom, C.; Lawongkerd, J. Undrained stability of unsupported conical slopes in two-layered clays. Innov. Infrastruct. Solut. 2021, 6. [Google Scholar] [CrossRef]
  47. Yodsomjai, W.; Keawsawasvong, S.; Likitlersuang, S. Stability of unsupported conical slopes in Hoek-Brown rock masses. Transp. Infrastruct. Geotechnol. 2021, 8, 278–295. [Google Scholar] [CrossRef]
  48. Yodsomjai, W.; Keawsawasvong, S.; Lai, V.Q. Limit analysis solutions for bearing capacity of ring foundations on rocks using Hoek-Brown failure criterion. Int. J. Geosynth. Ground Eng. 2021, 7. [Google Scholar]
  49. Shiau, J.; Al-Asadi, F. Revisiting circular tunnel stability using Broms and Bennermarks’ Original Stability Number. Int. J. Geomech. 2021, 21, 06021009. [Google Scholar]
  50. Shiau, J.; Chudal, B.; Mahalingasivam, K.; Keawsawasvong, S. Pipeline burst-related ground stability in blowout condition. Transp. Geotech. 2021, 29, 100587. [Google Scholar]
  51. Shiau, J.; Keawsawasvong, S.; Lee, J. Three-Dimensional Stability Investigation of Trapdoors in Collapse and Blowout Conditions. Int. J. Geomech. 2022, 22, 04022007. [Google Scholar] [CrossRef]
  52. Keawsawasvong, S.; Thongchom, C.; Likitlersuang, S. Bearing capacity of strip footing on Hoek-Brown rock mass subjected to eccentric and inclined loading. Transp. Infrastruct. Geotechnol. 2021, 8, 189–200. [Google Scholar] [CrossRef]
  53. Keawsawasvong, S.; Yoonirundorn, K.; Senjuntichai, T. Pullout capacity factor for cylindrical suction caissons in anisotropic clays based on Anisotropic Undrained Shear failure criterion. Transp. Infrastruct. Geotechnol. 2021, 8, 629–644. [Google Scholar] [CrossRef]
  54. Keawsawasvong, S.; Lai, V.Q. End bearing capacity factor for annular foundations embedded in clay considering the effect of the adhesion factor. Int. J. Geosynth. Ground Eng. 2021, 7. [Google Scholar]
  55. Keawsawasvong, S.; Ukritchon, B. Undrained stability of a spherical cavity in cohesive soils using finite element limit analysis. J. Rock Mech. Geotech. Eng. 2019, 11, 1274–1285. [Google Scholar] [CrossRef]
  56. Ukritchon, B.; Keawsawasvong, S. Design equations of uplift capacity of circular piles in sands. Appl. Ocean. Res. 2019, 90, 101844. [Google Scholar] [CrossRef]
  57. Ukritchon, B.; Keawsawasvong, S. Unsafe error in conventional shape factor for shallow circular foundations in normally consolidated clays. J. Geotech. Geoenvironmental Eng. 2017, 143, 02817001. [Google Scholar] [CrossRef]
  58. Ukritchon, B.; Keawsawasvong, S. Error in Ito and Matsui’s limit equilibrium solution of lateral force on a row of stabilizing piles. J. Geotech. Geoenvironmental Eng. 2017, 143, 02817004. [Google Scholar] [CrossRef]
  59. Sauer, T. Numerical Analysis, 3rd ed.; Pearson Education Ltd.: London, UK, 2014. [Google Scholar]
Figure 1. Problem description of a horseshoe tunnel.
Buildings 12 01800 g001
Figure 2. A numerical model of horseshoe tunnel: (a) B/D = 0.5, (b) B/D = 1 and (c) B/D = 2.
Buildings 12 01800 g002
Figure 3. Verification of the stability factor σs/σci of horseshoe tunnels with B/D = 1 and mi = 5 between the current study to those available solutions: (a) σci/γD = 100 and (b) σci/γD = ∞.
Buildings 12 01800 g003aBuildings 12 01800 g003b
Figure 4. Impact of GSI on σs/σci of horseshoe tunnels with C/D = 3 and σci/γD = 1000: (a) mi = 5 and (b) mi = 30.
Buildings 12 01800 g004
Figure 5. Impact of mi on σs/σci of horseshoe tunnels with C/D = 3 and σci/γD = 1000: (a) GSI = 40 and (b) GSI = 100.
Buildings 12 01800 g005
Figure 6. Impact of σci/γD on σs/σci of horseshoe tunnels with C/D = 3 and GSI = 80: (a) mi = 5 and (b) mi = 30.
Buildings 12 01800 g006
Figure 7. Impact of C/D on σs/σci of horseshoe tunnels with σci/γD = 1000 and GSI = 80: (a) mi = 5 and (b) mi = 30.
Buildings 12 01800 g007
Figure 8. Impact of B/D on σs/σci of horseshoe tunnels with σci/γD = 1000 and GSI = 80: (a) mi = 5 and (b) mi = 30.
Buildings 12 01800 g008
Figure 9. Final adaptive meshes of horseshoe tunnel: (a) B/D = 0.5, (b) B/D = 1 and (c) B/D = 2 (GSI = 80, C/D = 2, σci/γD = 1000, and mi = 20).
Buildings 12 01800 g009
Figure 10. Shear dissipations of horseshoe tunnel: (a) B/D = 0.5, (b) B/D = 1 and (c) B/D = 2 (GSI = 80, C/D = 2, σci/γD = 1000, and mi = 20).
Buildings 12 01800 g010
Figure 11. Shear dissipations for various GSI: (a) 40, (b) 60, (c) 80 and (d) 100 (C/D = 2, B/D = 0.5, σci/γD = 1000 and mi = 20).
Buildings 12 01800 g011
Figure 12. Shear dissipations for various mi: (a) 5, (b) 10, (c) 20 and (d) 30 (C/D = 2, B/D = 2, σci/γD = 1000 and GSI = 80).
Buildings 12 01800 g012
Figure 13. Shear dissipations of horseshoe tunnel with B/D = 0.5 for the cases of C/D: (a) 1, (b) 2, (c) 4 and (d) 5 (σci/γD = 1000, GSI = 80 and mi = 20).
Buildings 12 01800 g013
Figure 14. Shear dissipations of horseshoe tunnel with B/D = 1 for the cases of C/D: (a) 1, (b) 2, (c) 4 and (d) 5 (σci/γD = 1000, GSI = 80 and mi = 20).
Buildings 12 01800 g014
Figure 15. Shear dissipations of unlined horseshoe tunnel in rock mass with B/D = 2 for the cases of C/D: (a) 1, (b) 2, (c) 4 and (d) 5 (σci/γD = 1000, GSI = 80 and mi = 20).
Buildings 12 01800 g015
Figure 16. Comparison of the stability factors σs/σci for different shapes of tunnels: (a) mi = 5 and (b) mi = 30 (σci/γD = 1000 and GSI = 80 Design equations.
Buildings 12 01800 g016
Table 1. Input parameters.
Input ParametersValues
C/D1, 2, 3, 4, 5
B/D0.5, 0.75, 1, 1.333, 2
GSI40, 60, 80, 100
mi5, 10, 20, 30
σci/γD100, 1000, ∞
Table 2. Optimal value of the constants for the design equation (B/D = 0.5 to 2.0).
Constants B/D
0.500.751.001.332.00
a1−1.1961−0.79530.75070.0739−0.9954
a2−1.0018−1.11901.0521−0.1071−1.6162
b10.02270.02170.01960.01510.4874 × 10−2
b2−0.0325−0.03018−0.0275−0.0216−0.0100
b30.00490.4442 × 10−20.3960 × 10−20.3004 × 10−20.1119 × 10⁻²
c1−0.2074 × 10⁻³−0.2083 × 10⁻³−0.1888 × 10⁻³−0.1413 × 10⁻³−0.0435 × 10⁻³
c20.4371 × 10−30.4092 × 10−30.3700 × 10−30.2950 × 10−30.1562 × 10−3
c3−0.6221 × 10⁻⁴−0.5704 × 10⁻⁴−0.5019 × 10⁻⁴−0.3764 × 10⁻⁴−0.1514 × 10⁻⁴
d11.2130 × 10−61.07167 × 10−69.7466 × 10−78.3863 × 10−70.6487 × 10−6
e10.14210.09840.05750.0173−0.0394
e2−0.1718−0.1431−0.1245−0.0974−0.0633
f1−0.6318 × 10⁻²−0.4631 × 10⁻²−0.3009 × 10⁻²−0.1292 × 10−20.1305 × 10−2
f20.01150.9847 × 10−20.8725 × 10−20.7073 × 10−20.4704 × 10⁻²
f3−0.1756 × 10⁻³−0.1616 × 10⁻³−0.1436 × 10⁻³−0.1104 × 10⁻³−0.0326 × 10⁻³
g10.5601 × 10−40.3712 × 10−40.1968 × 10−40.2055 × 10−50.2130 × 10−4
g2−0.1766 × 10⁻³−0.1522 × 10⁻³−0.1360 × 10⁻³−0.1129 × 10⁻³−0.0822 × 10⁻³
R299.98%99.98%99.98%99.98%99.98%
Publisher’s Note: MDPI stays neutral with regard to jurisdictional claims in published maps and institutional affiliations.

