
Seismic Response of a Liquefiable Site-Underground Structure System

Abstract
:1. Introduction
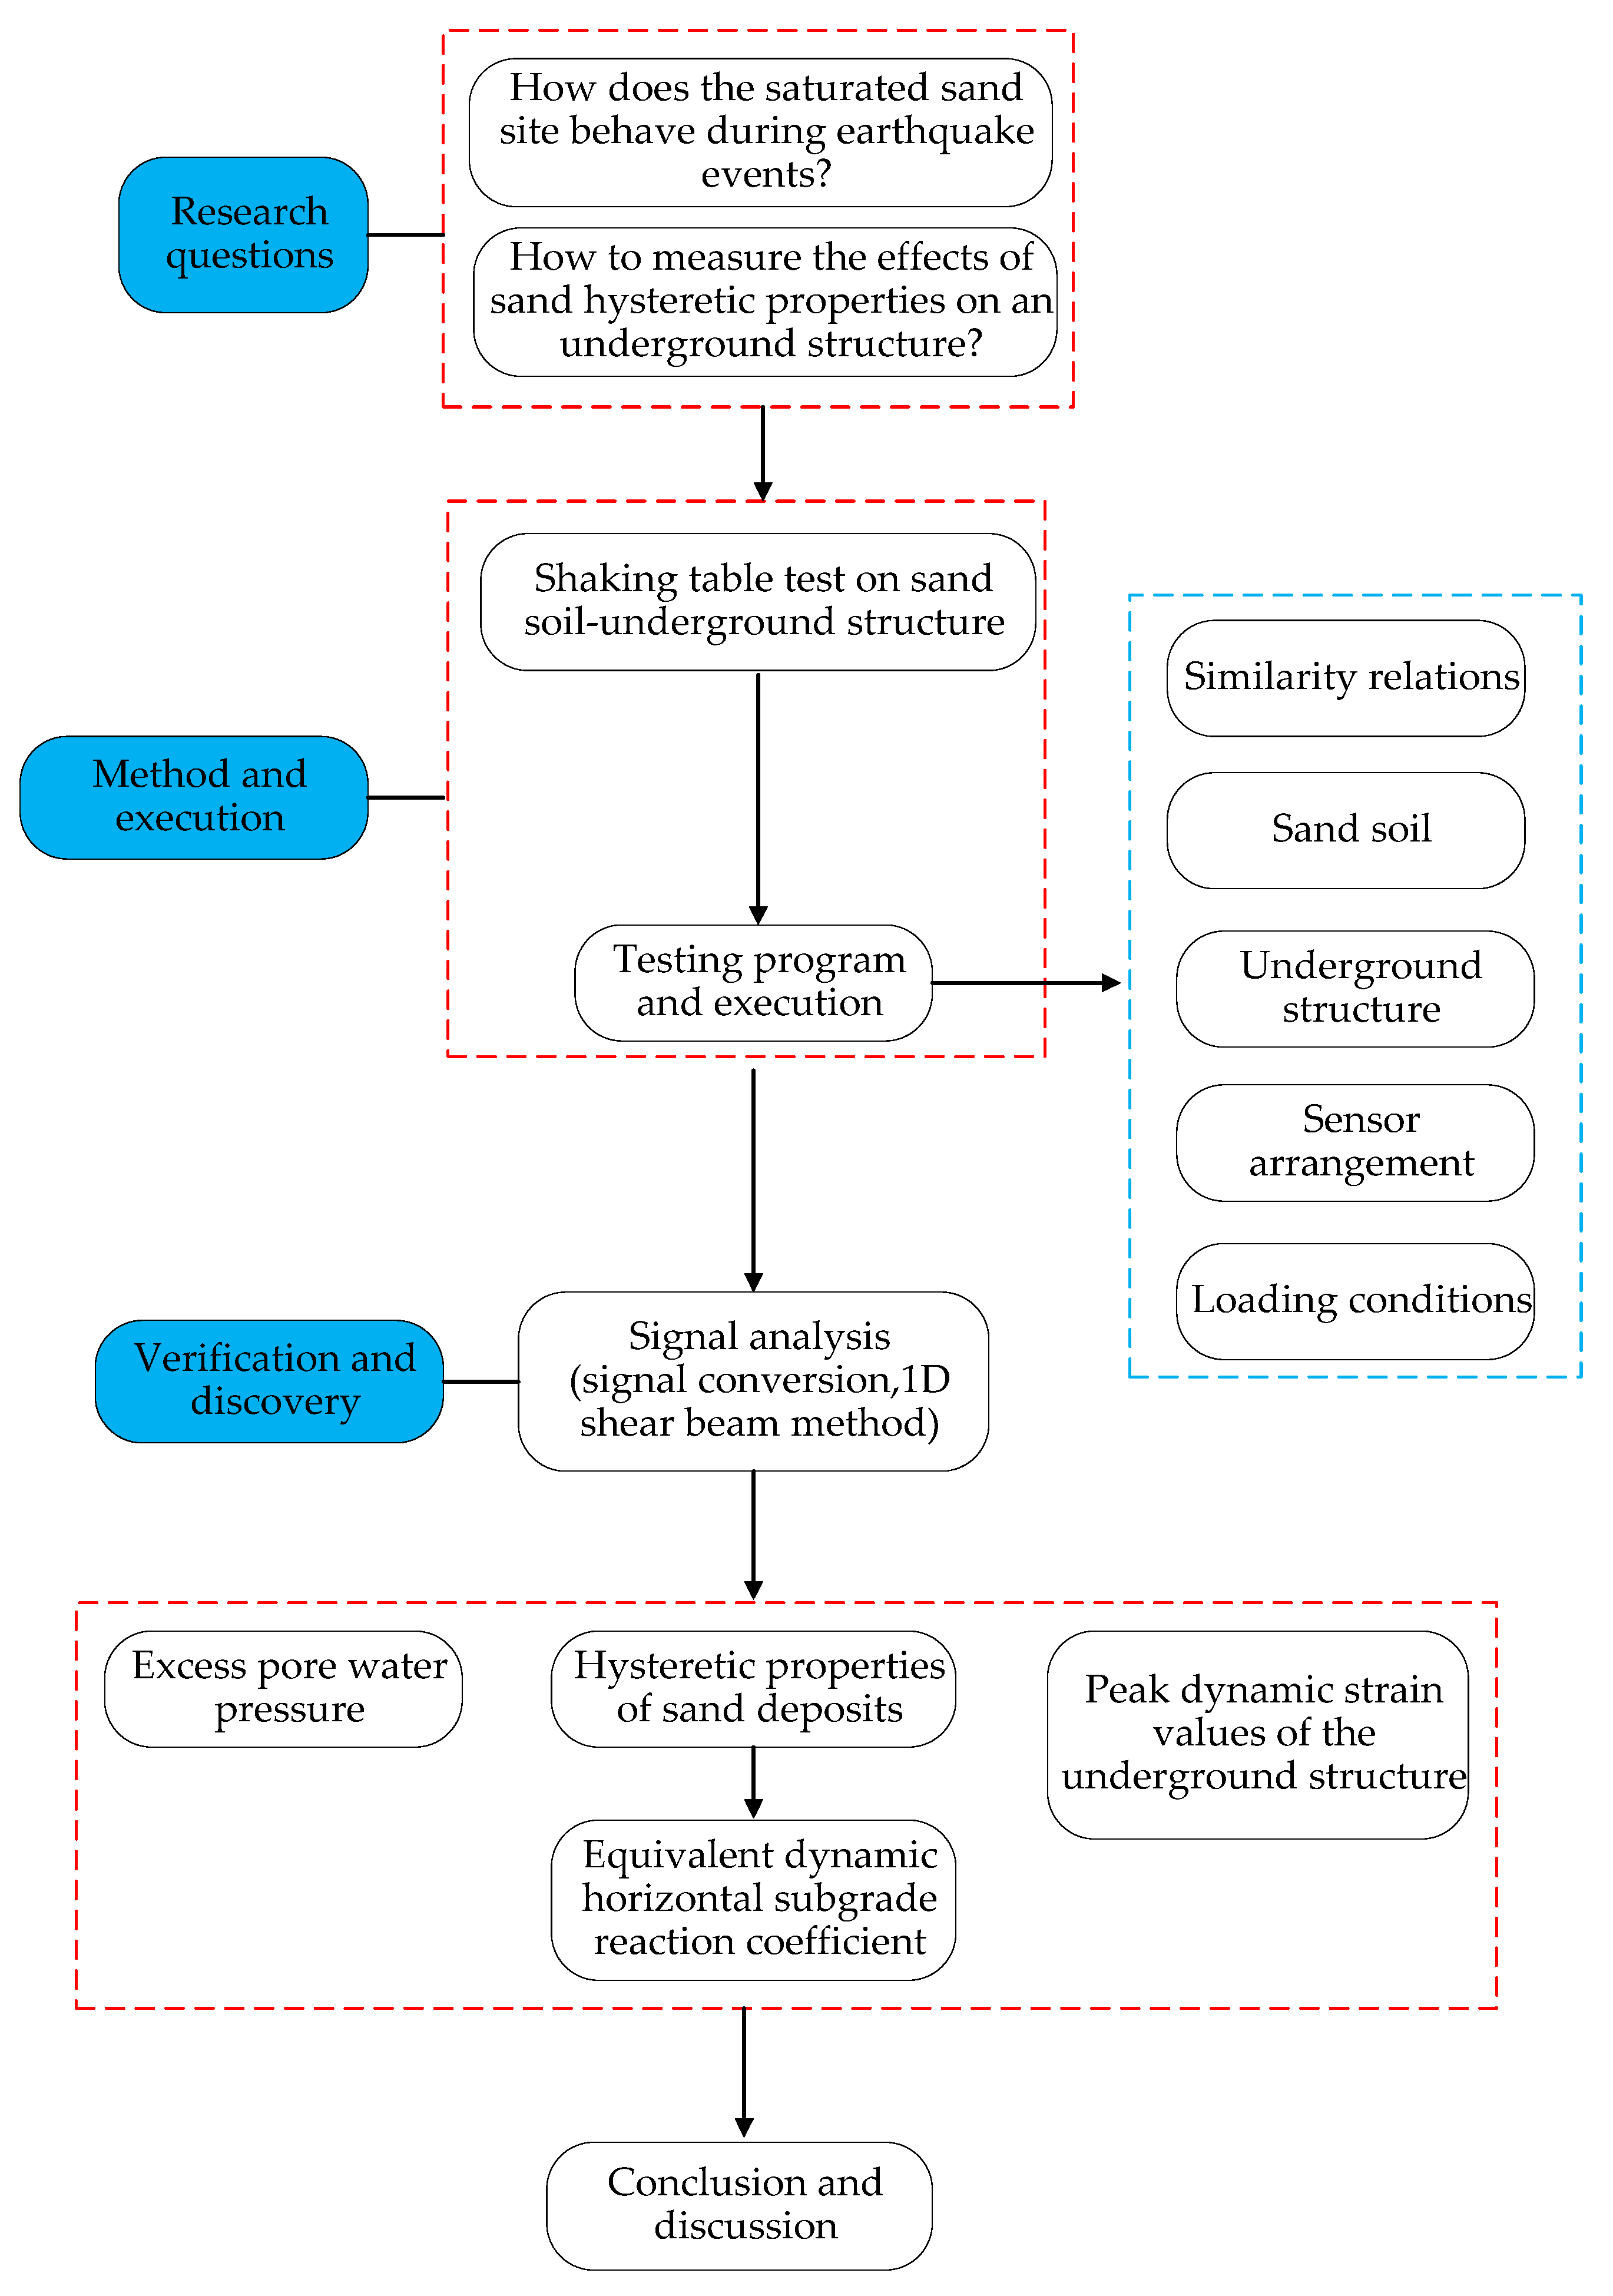
2. Testing Program
2.1. Similarity Ratio
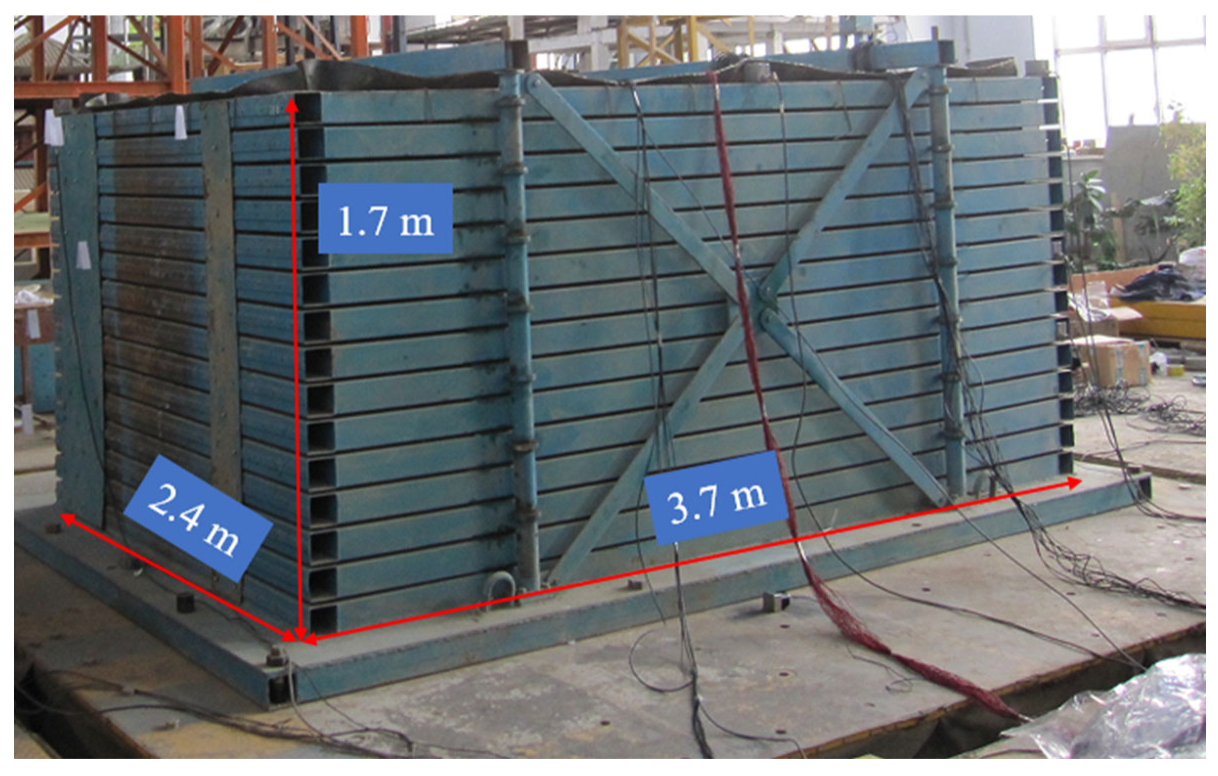
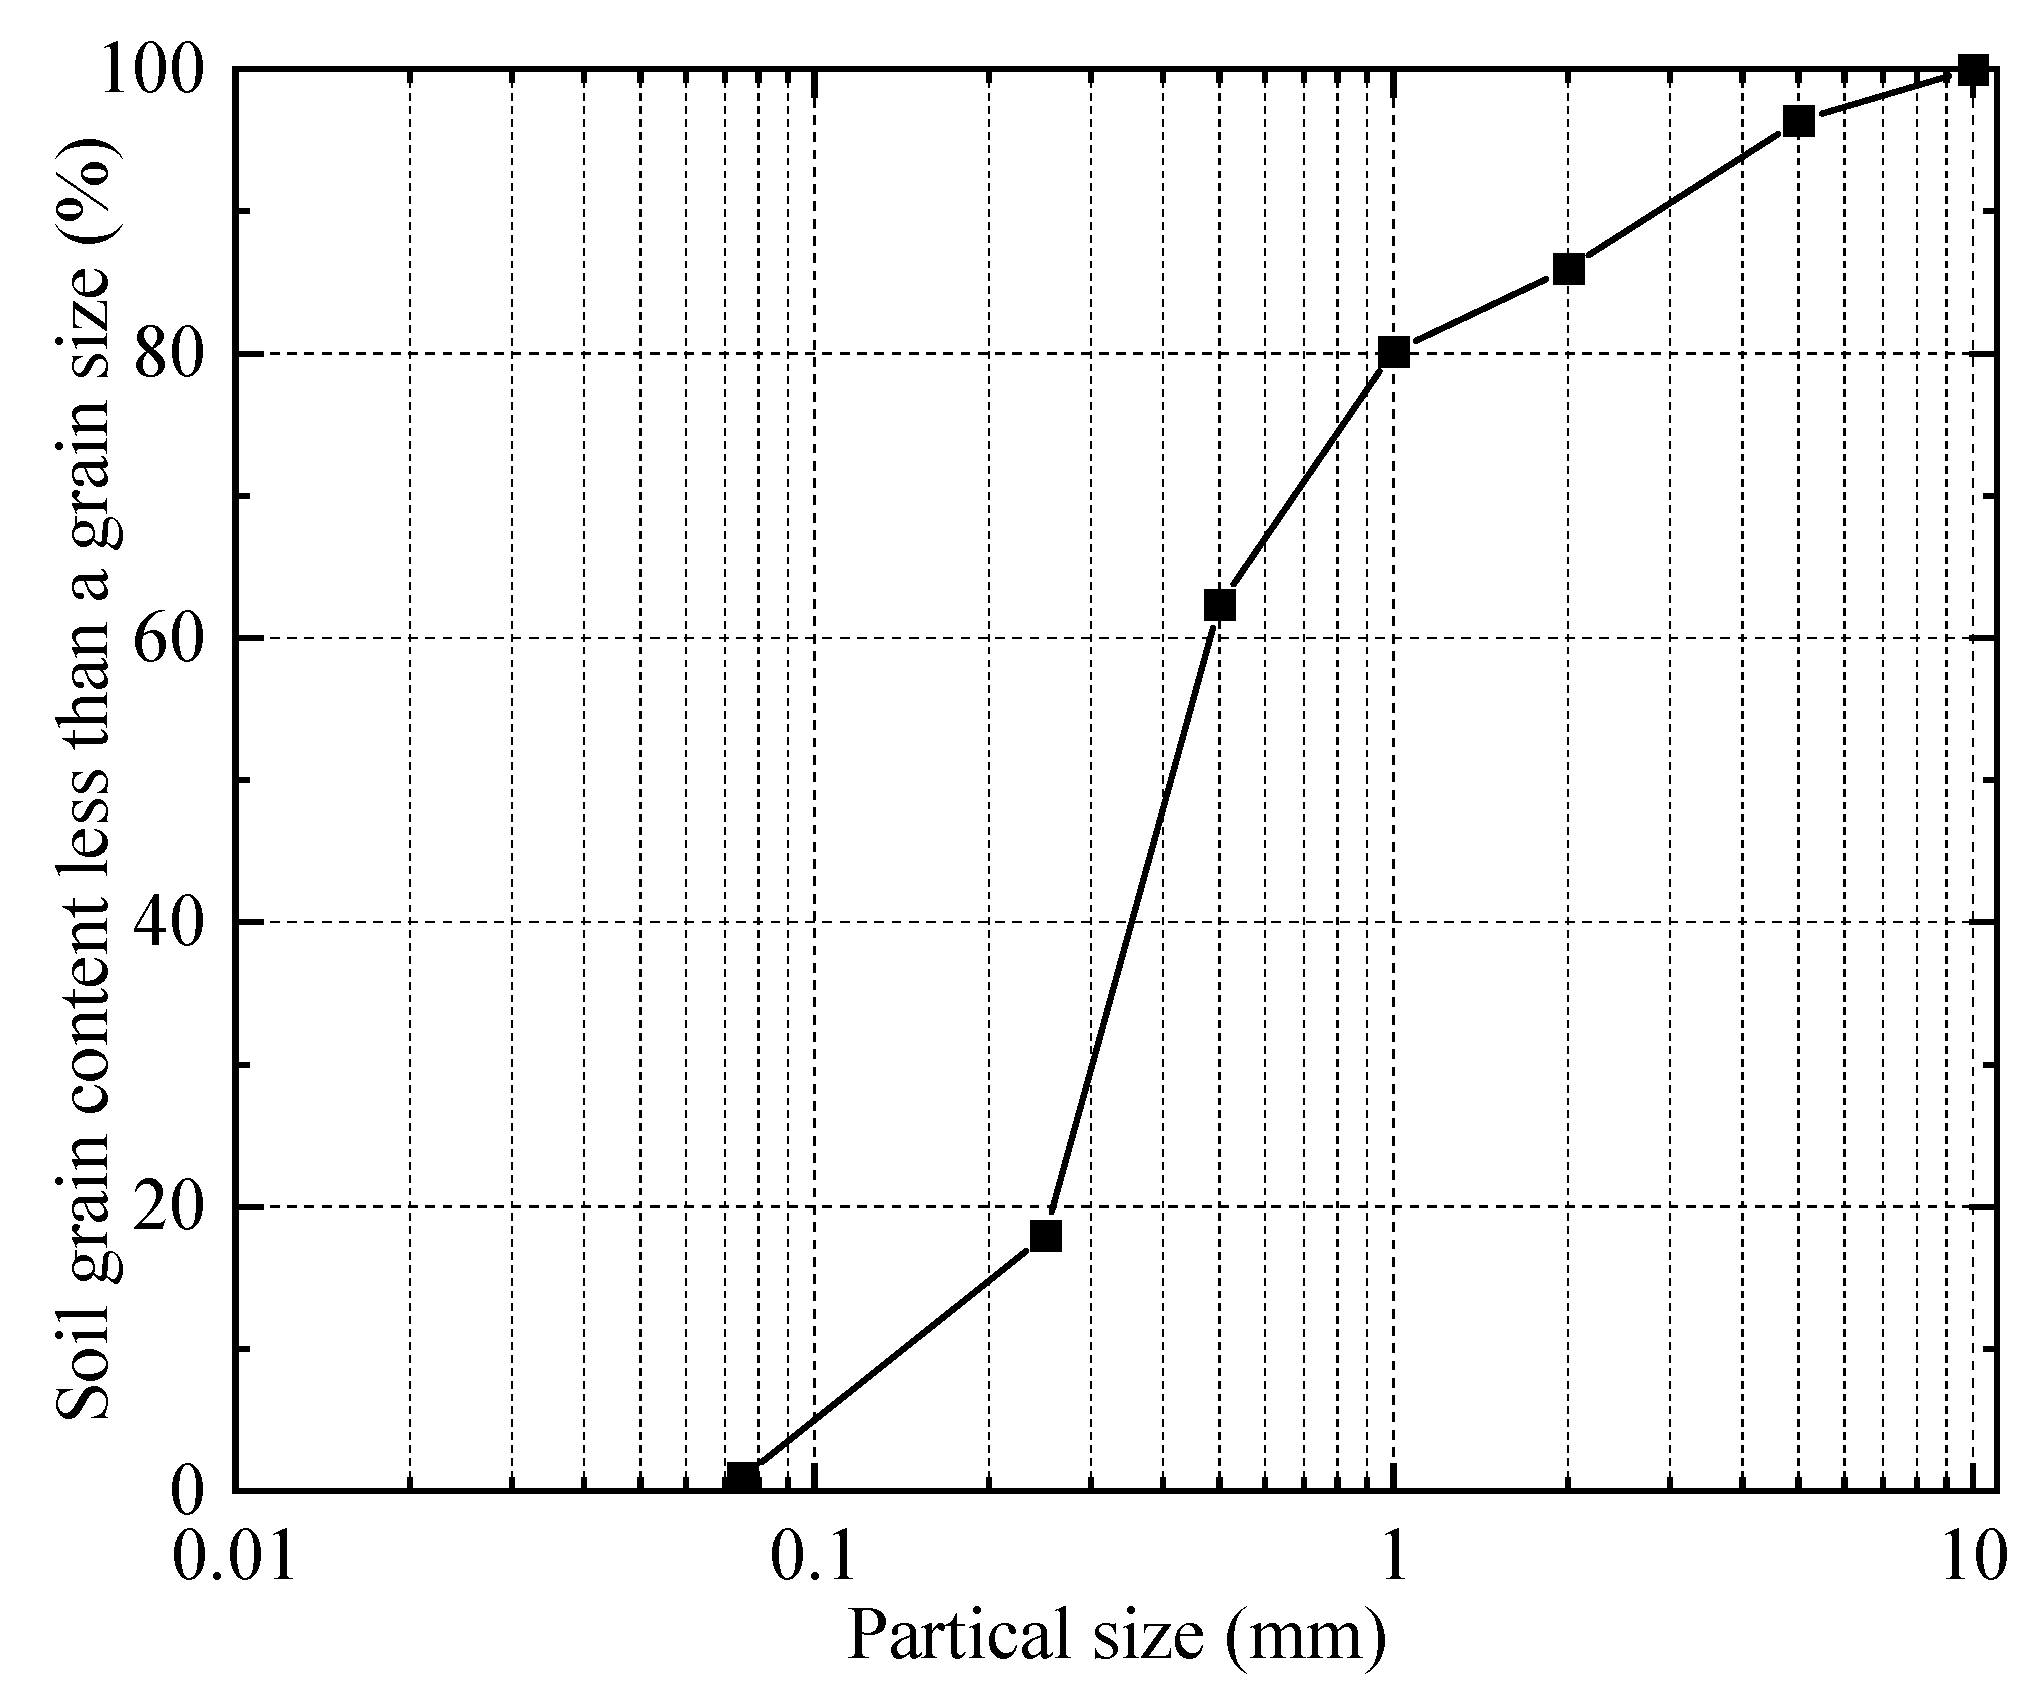
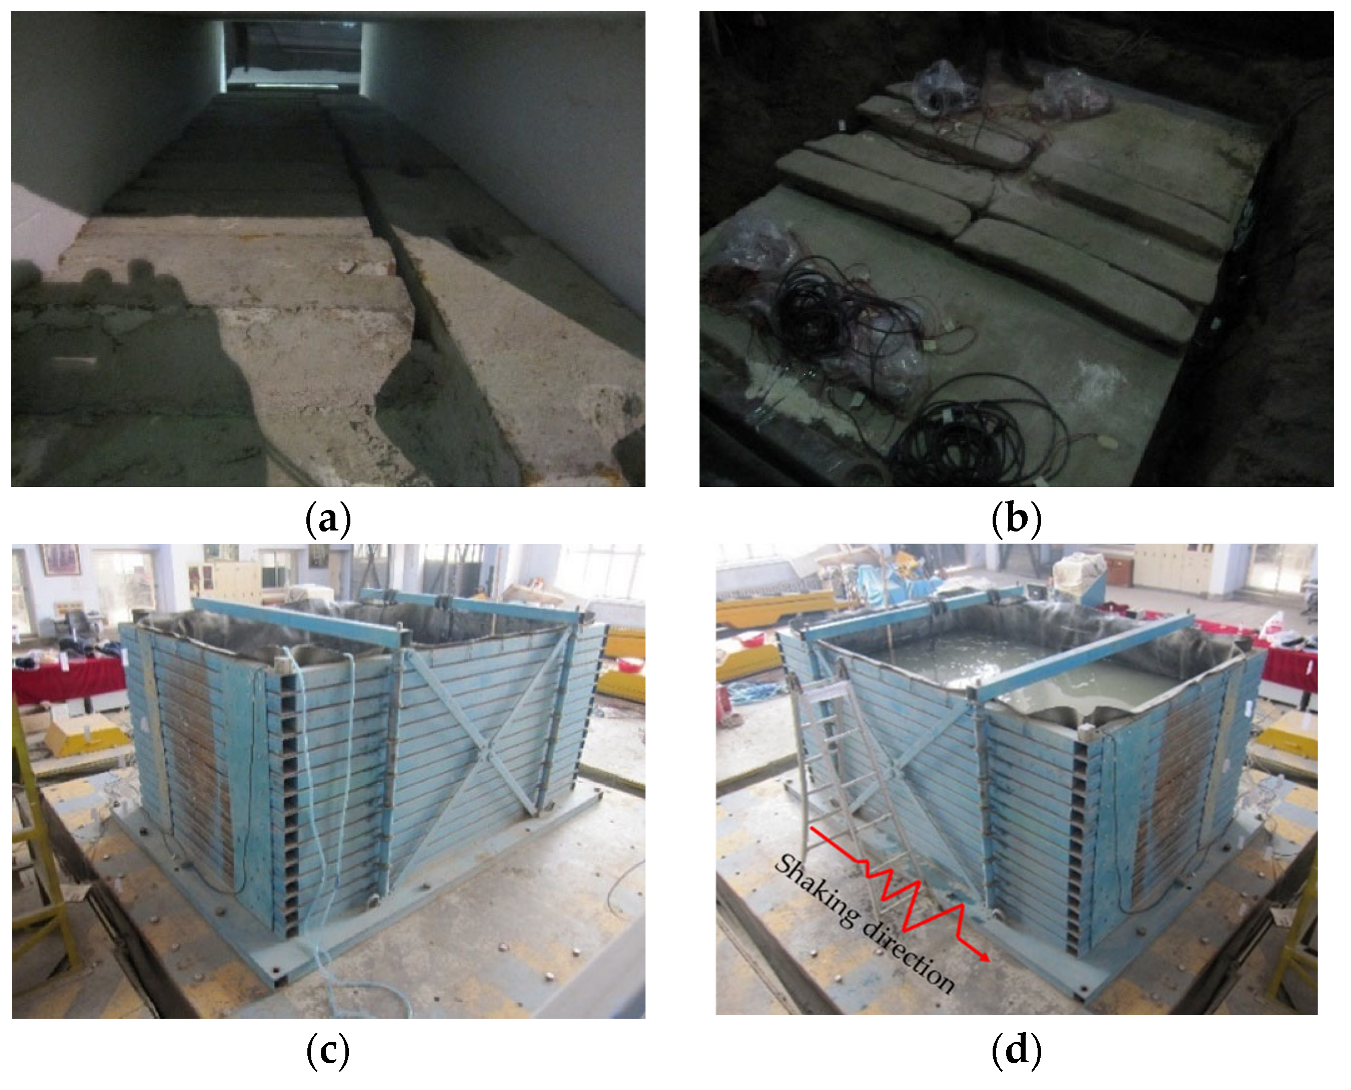
2.2. Laminar Shear Model Box and Preparation of Model Soil
2.3. Manufacture of Structural Model
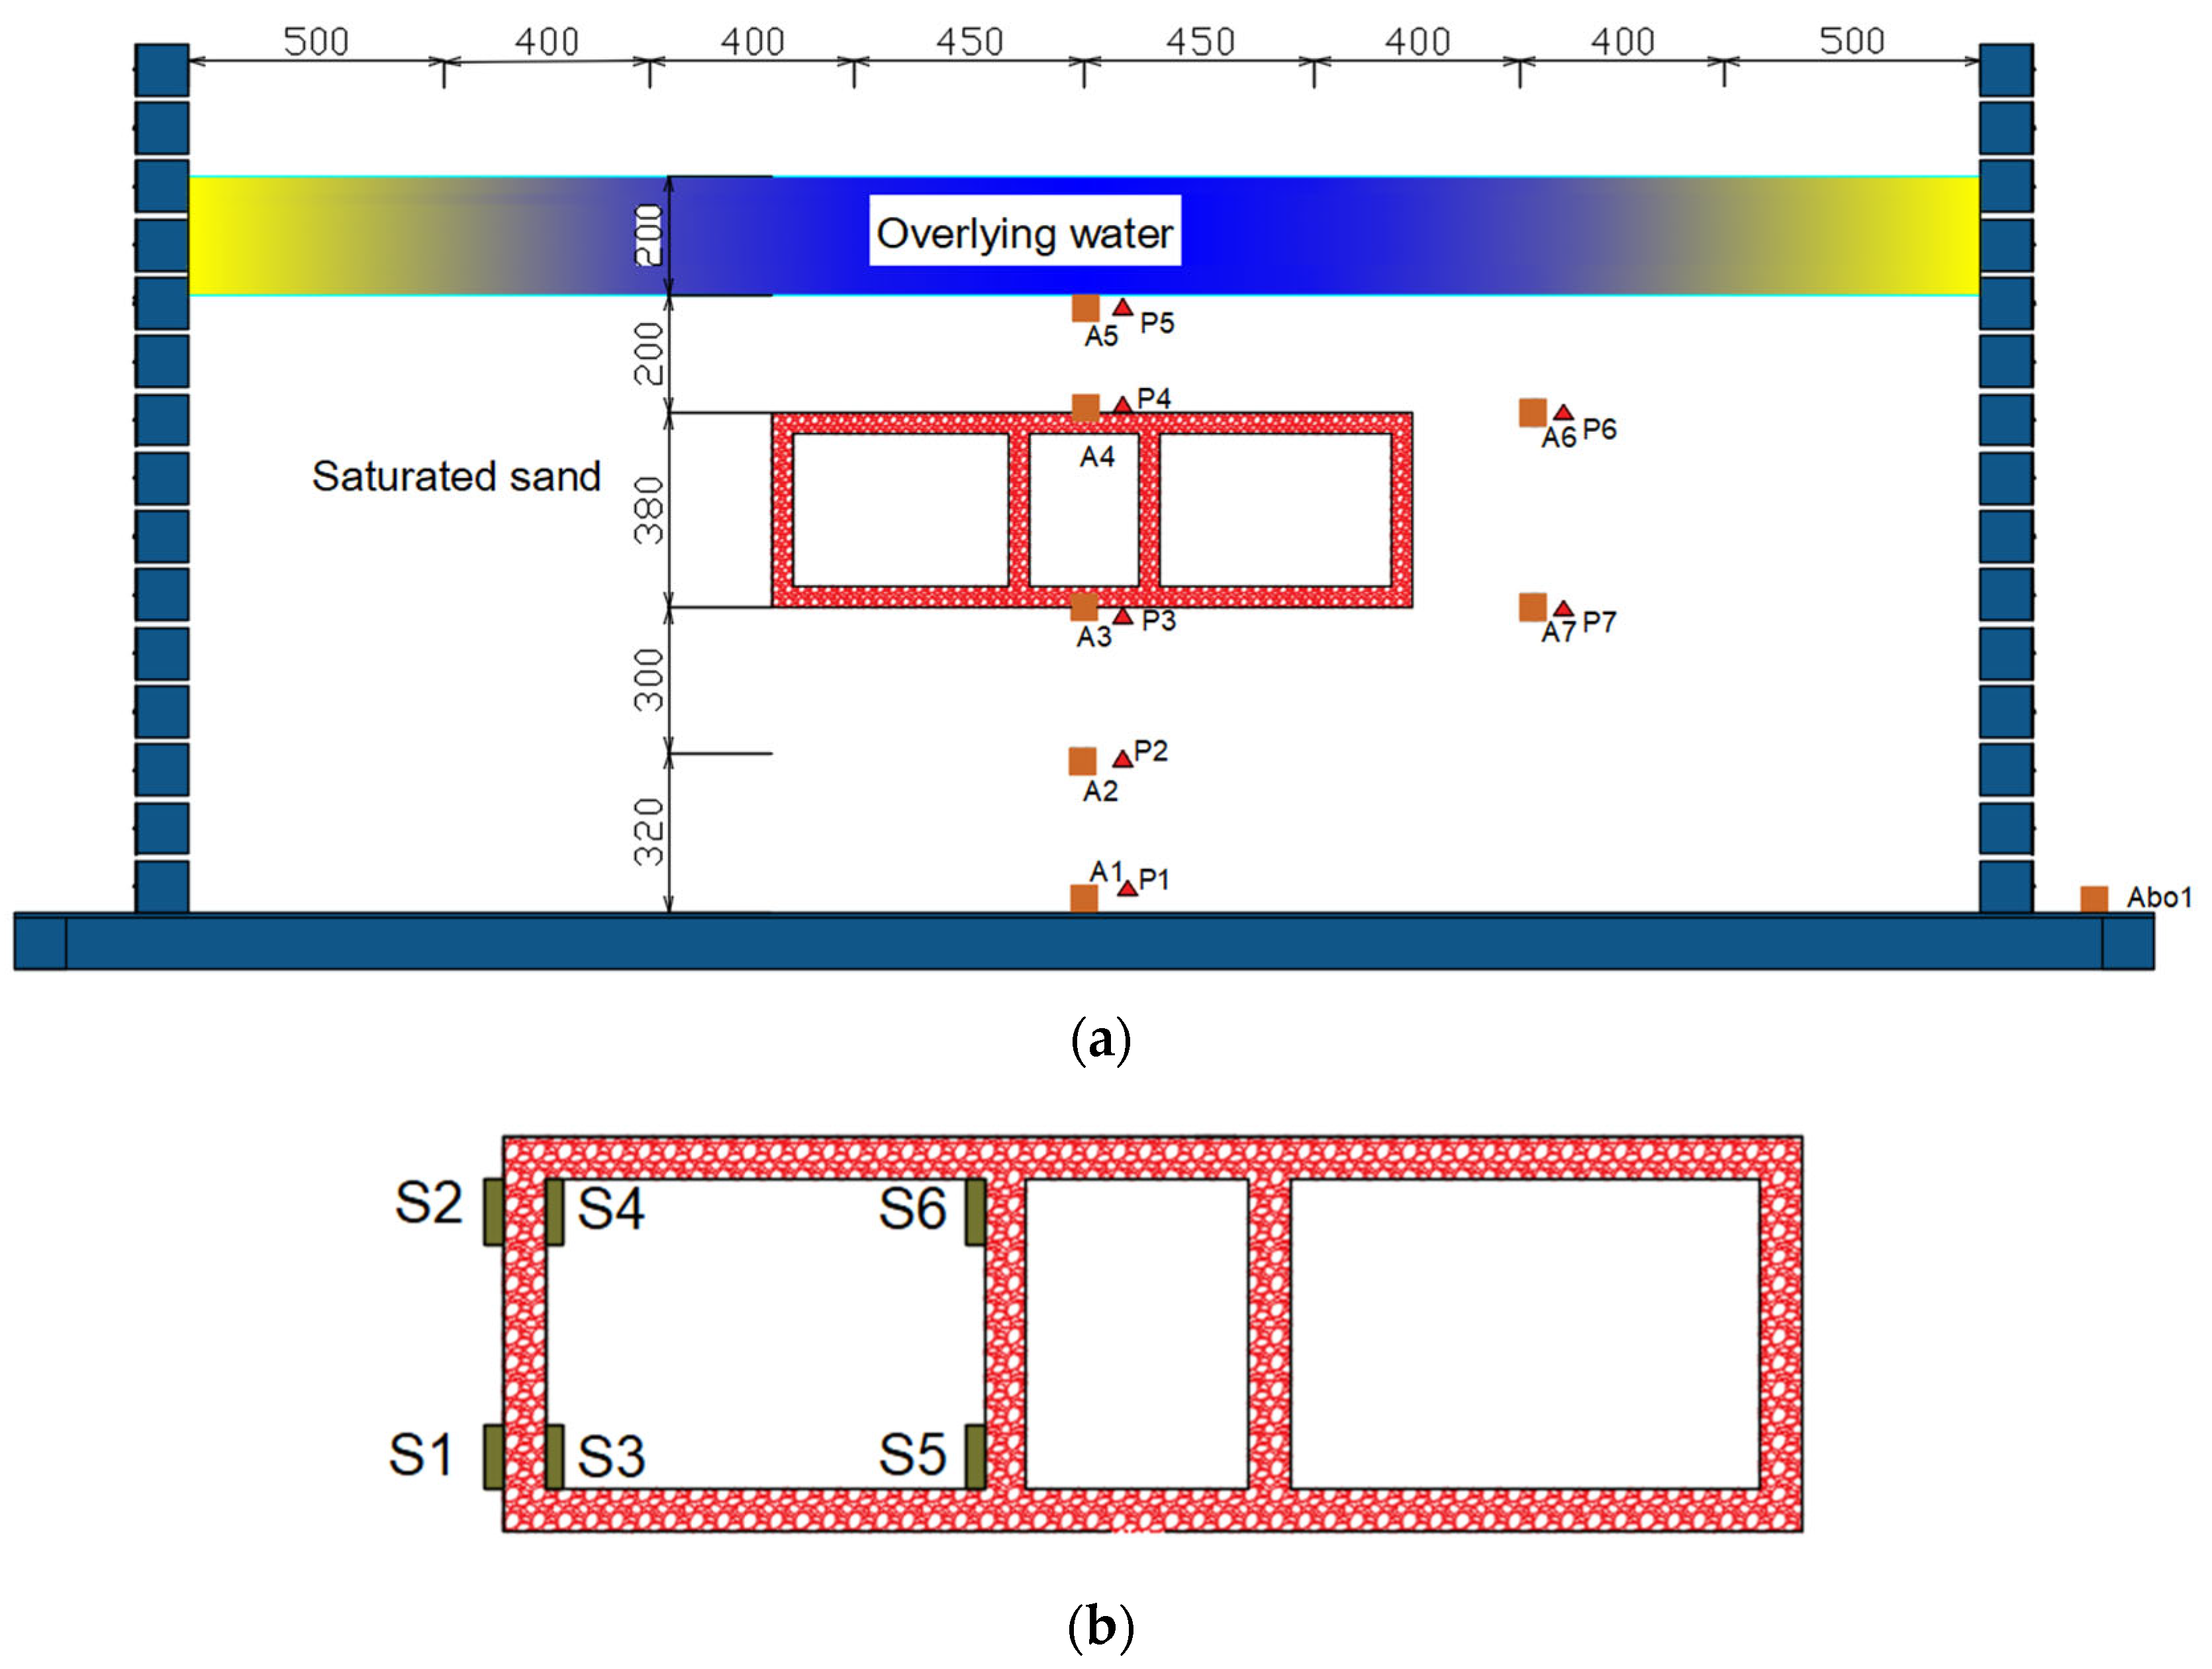
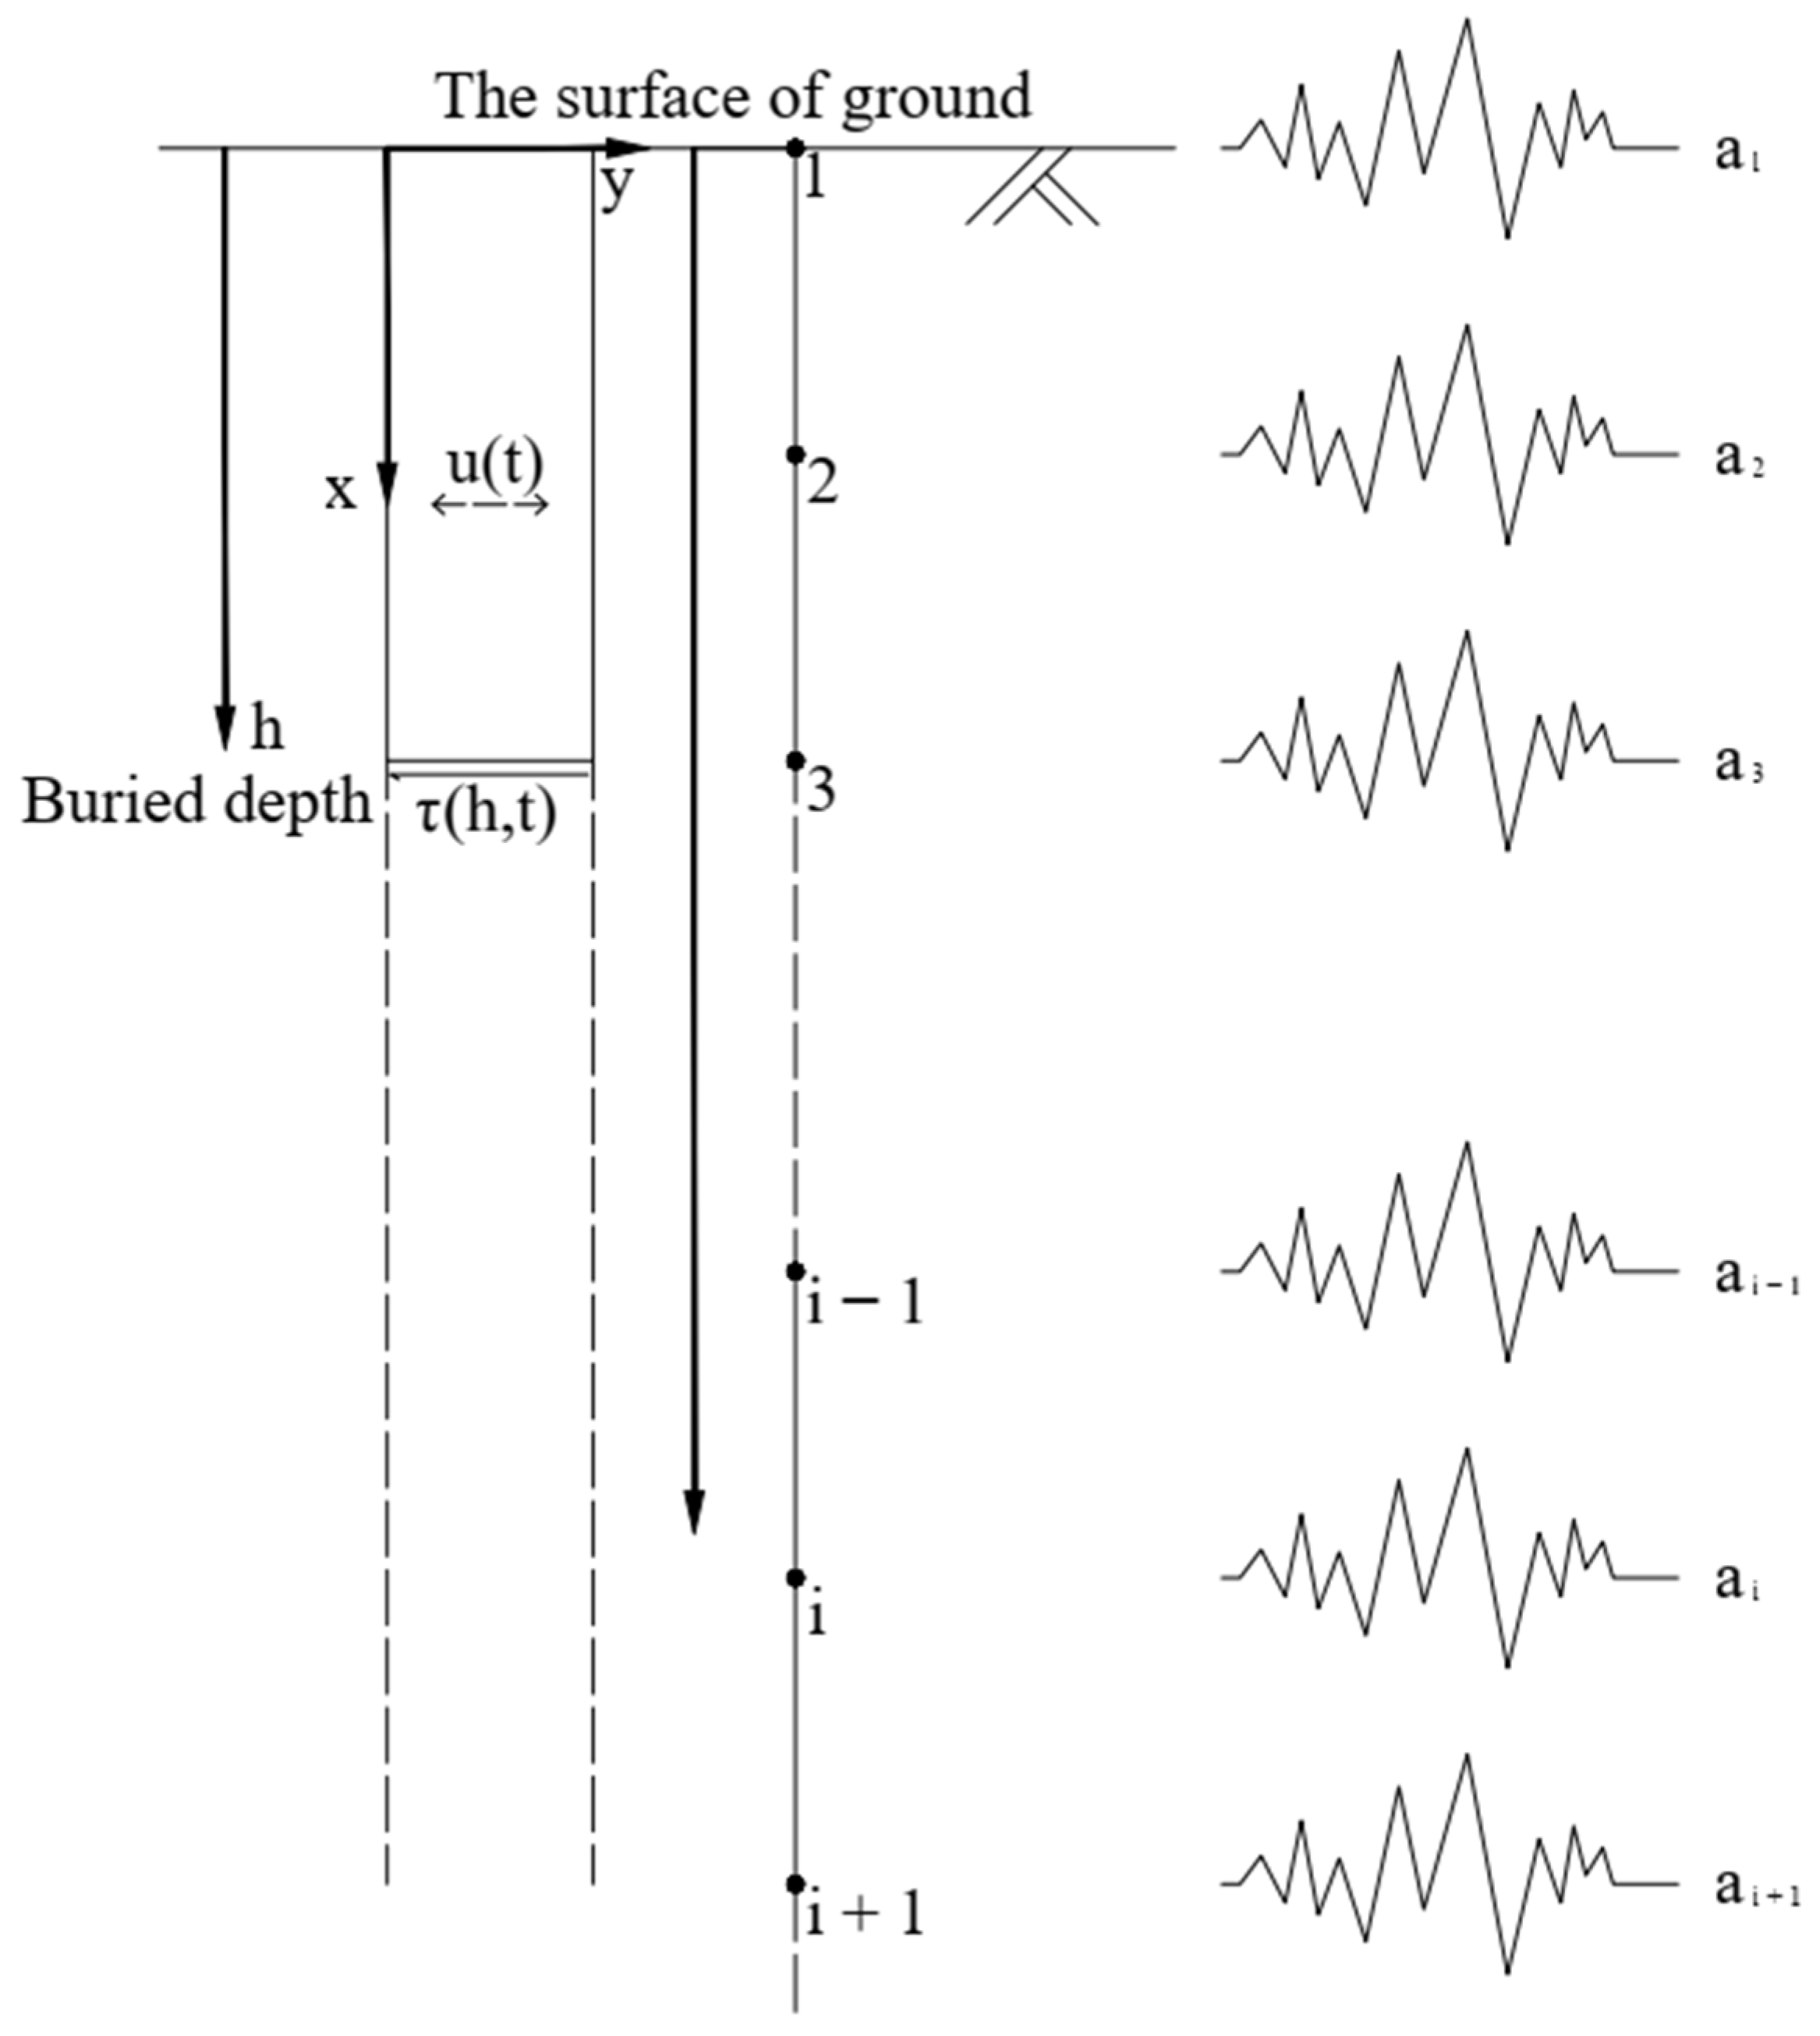
2.4. Sensor Arrangement
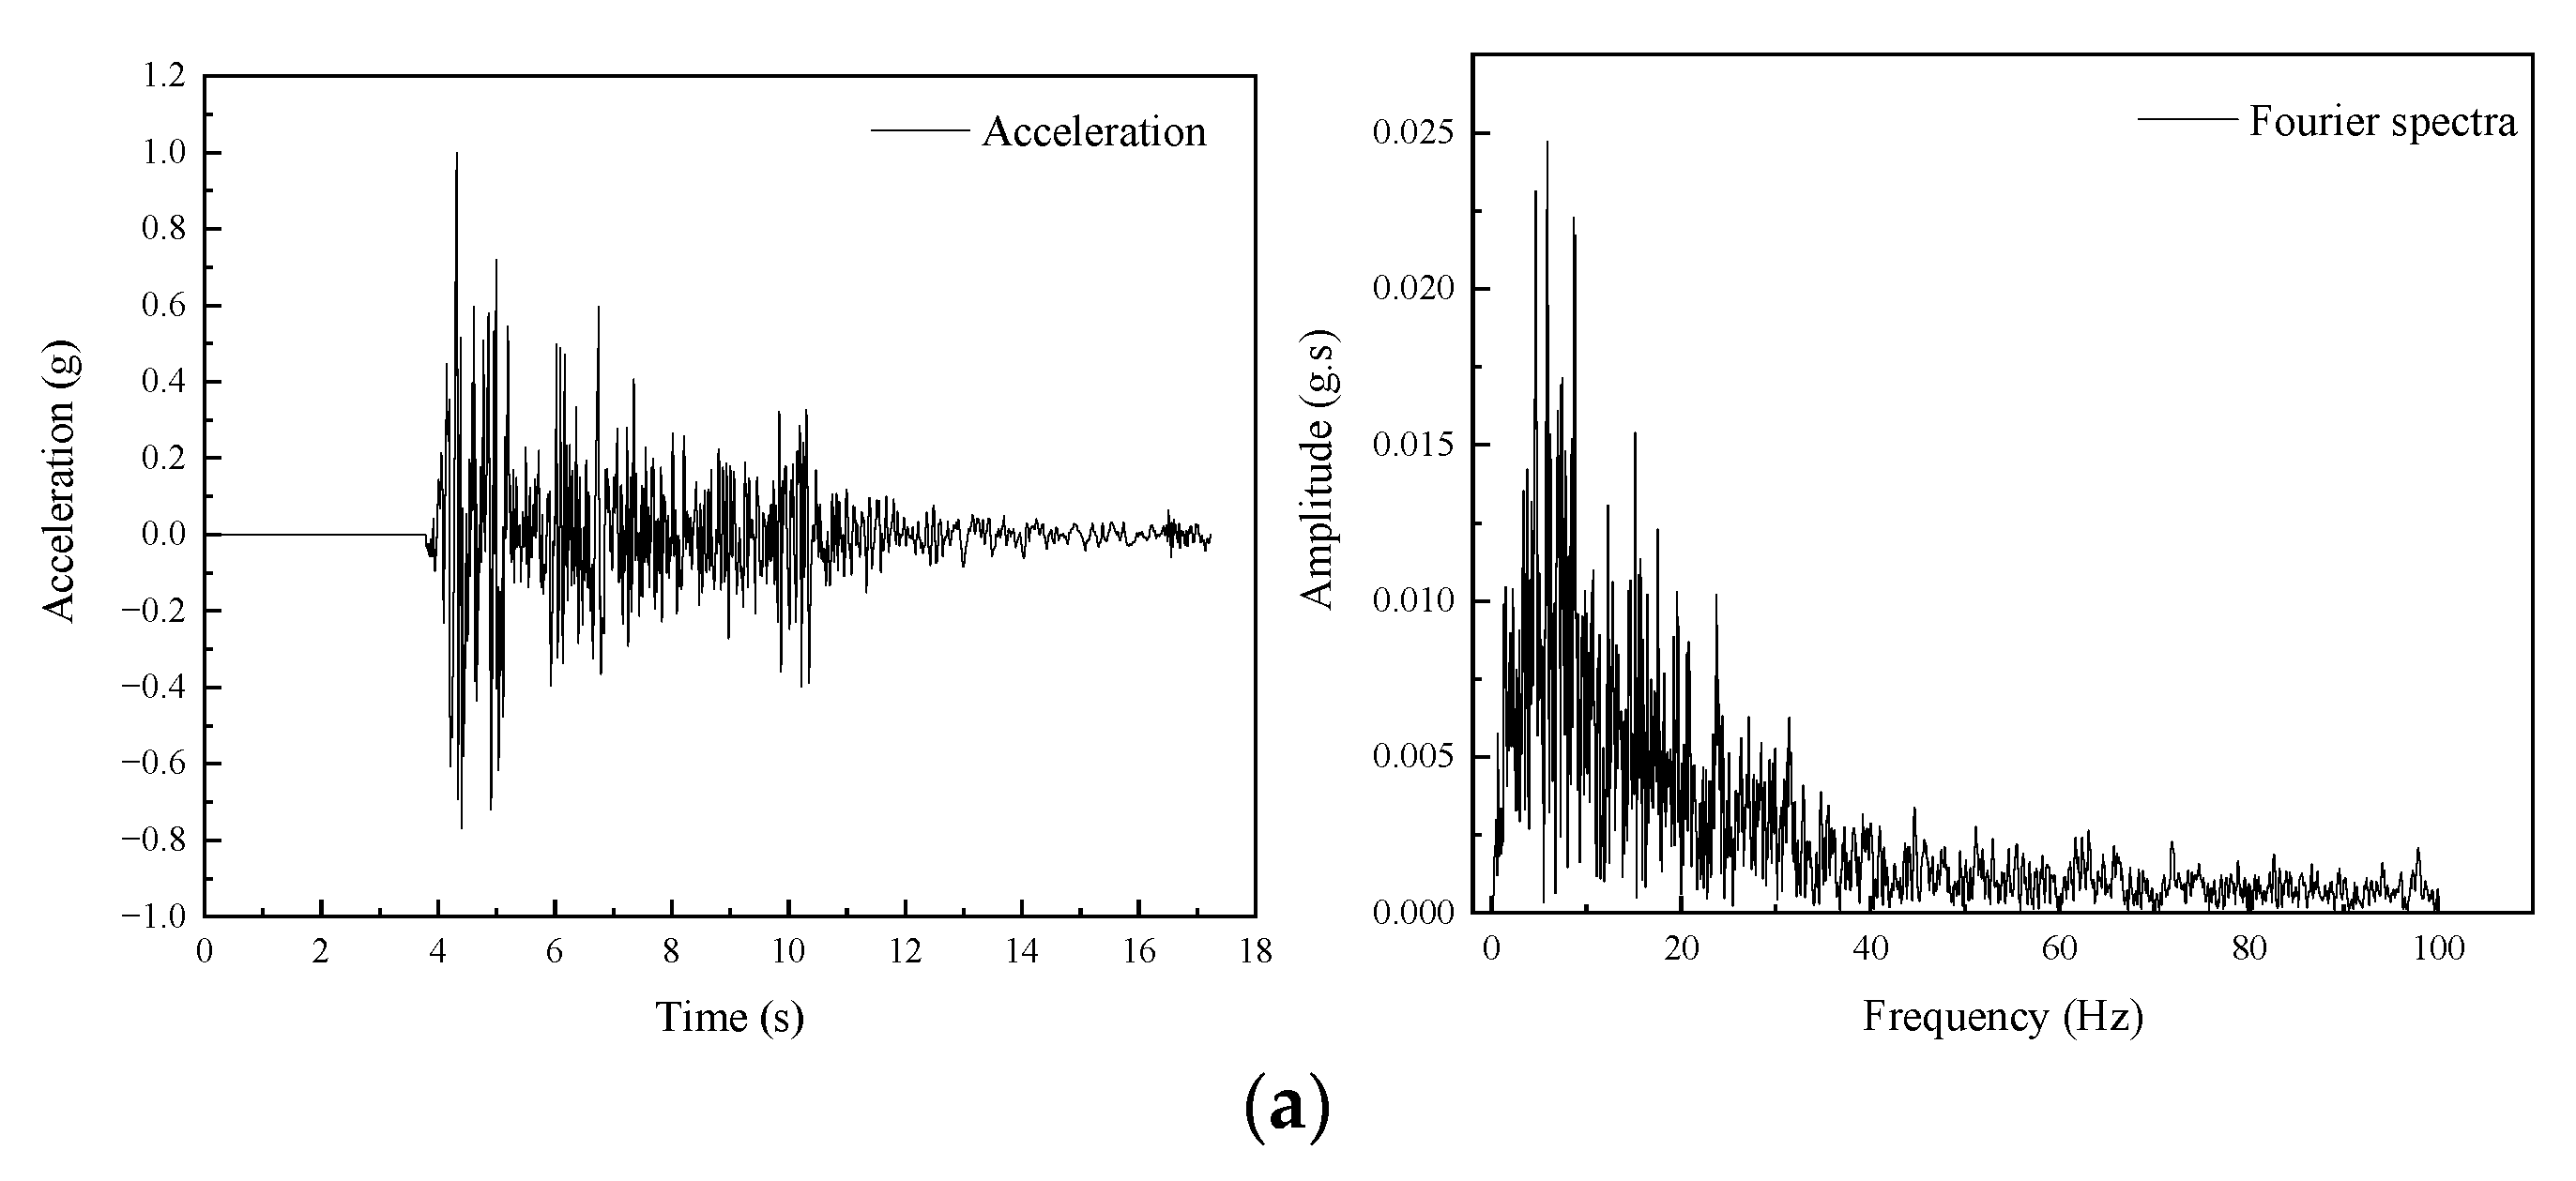
2.5. Input Earthquake Ground Motions
3. Testing Results and Analysis
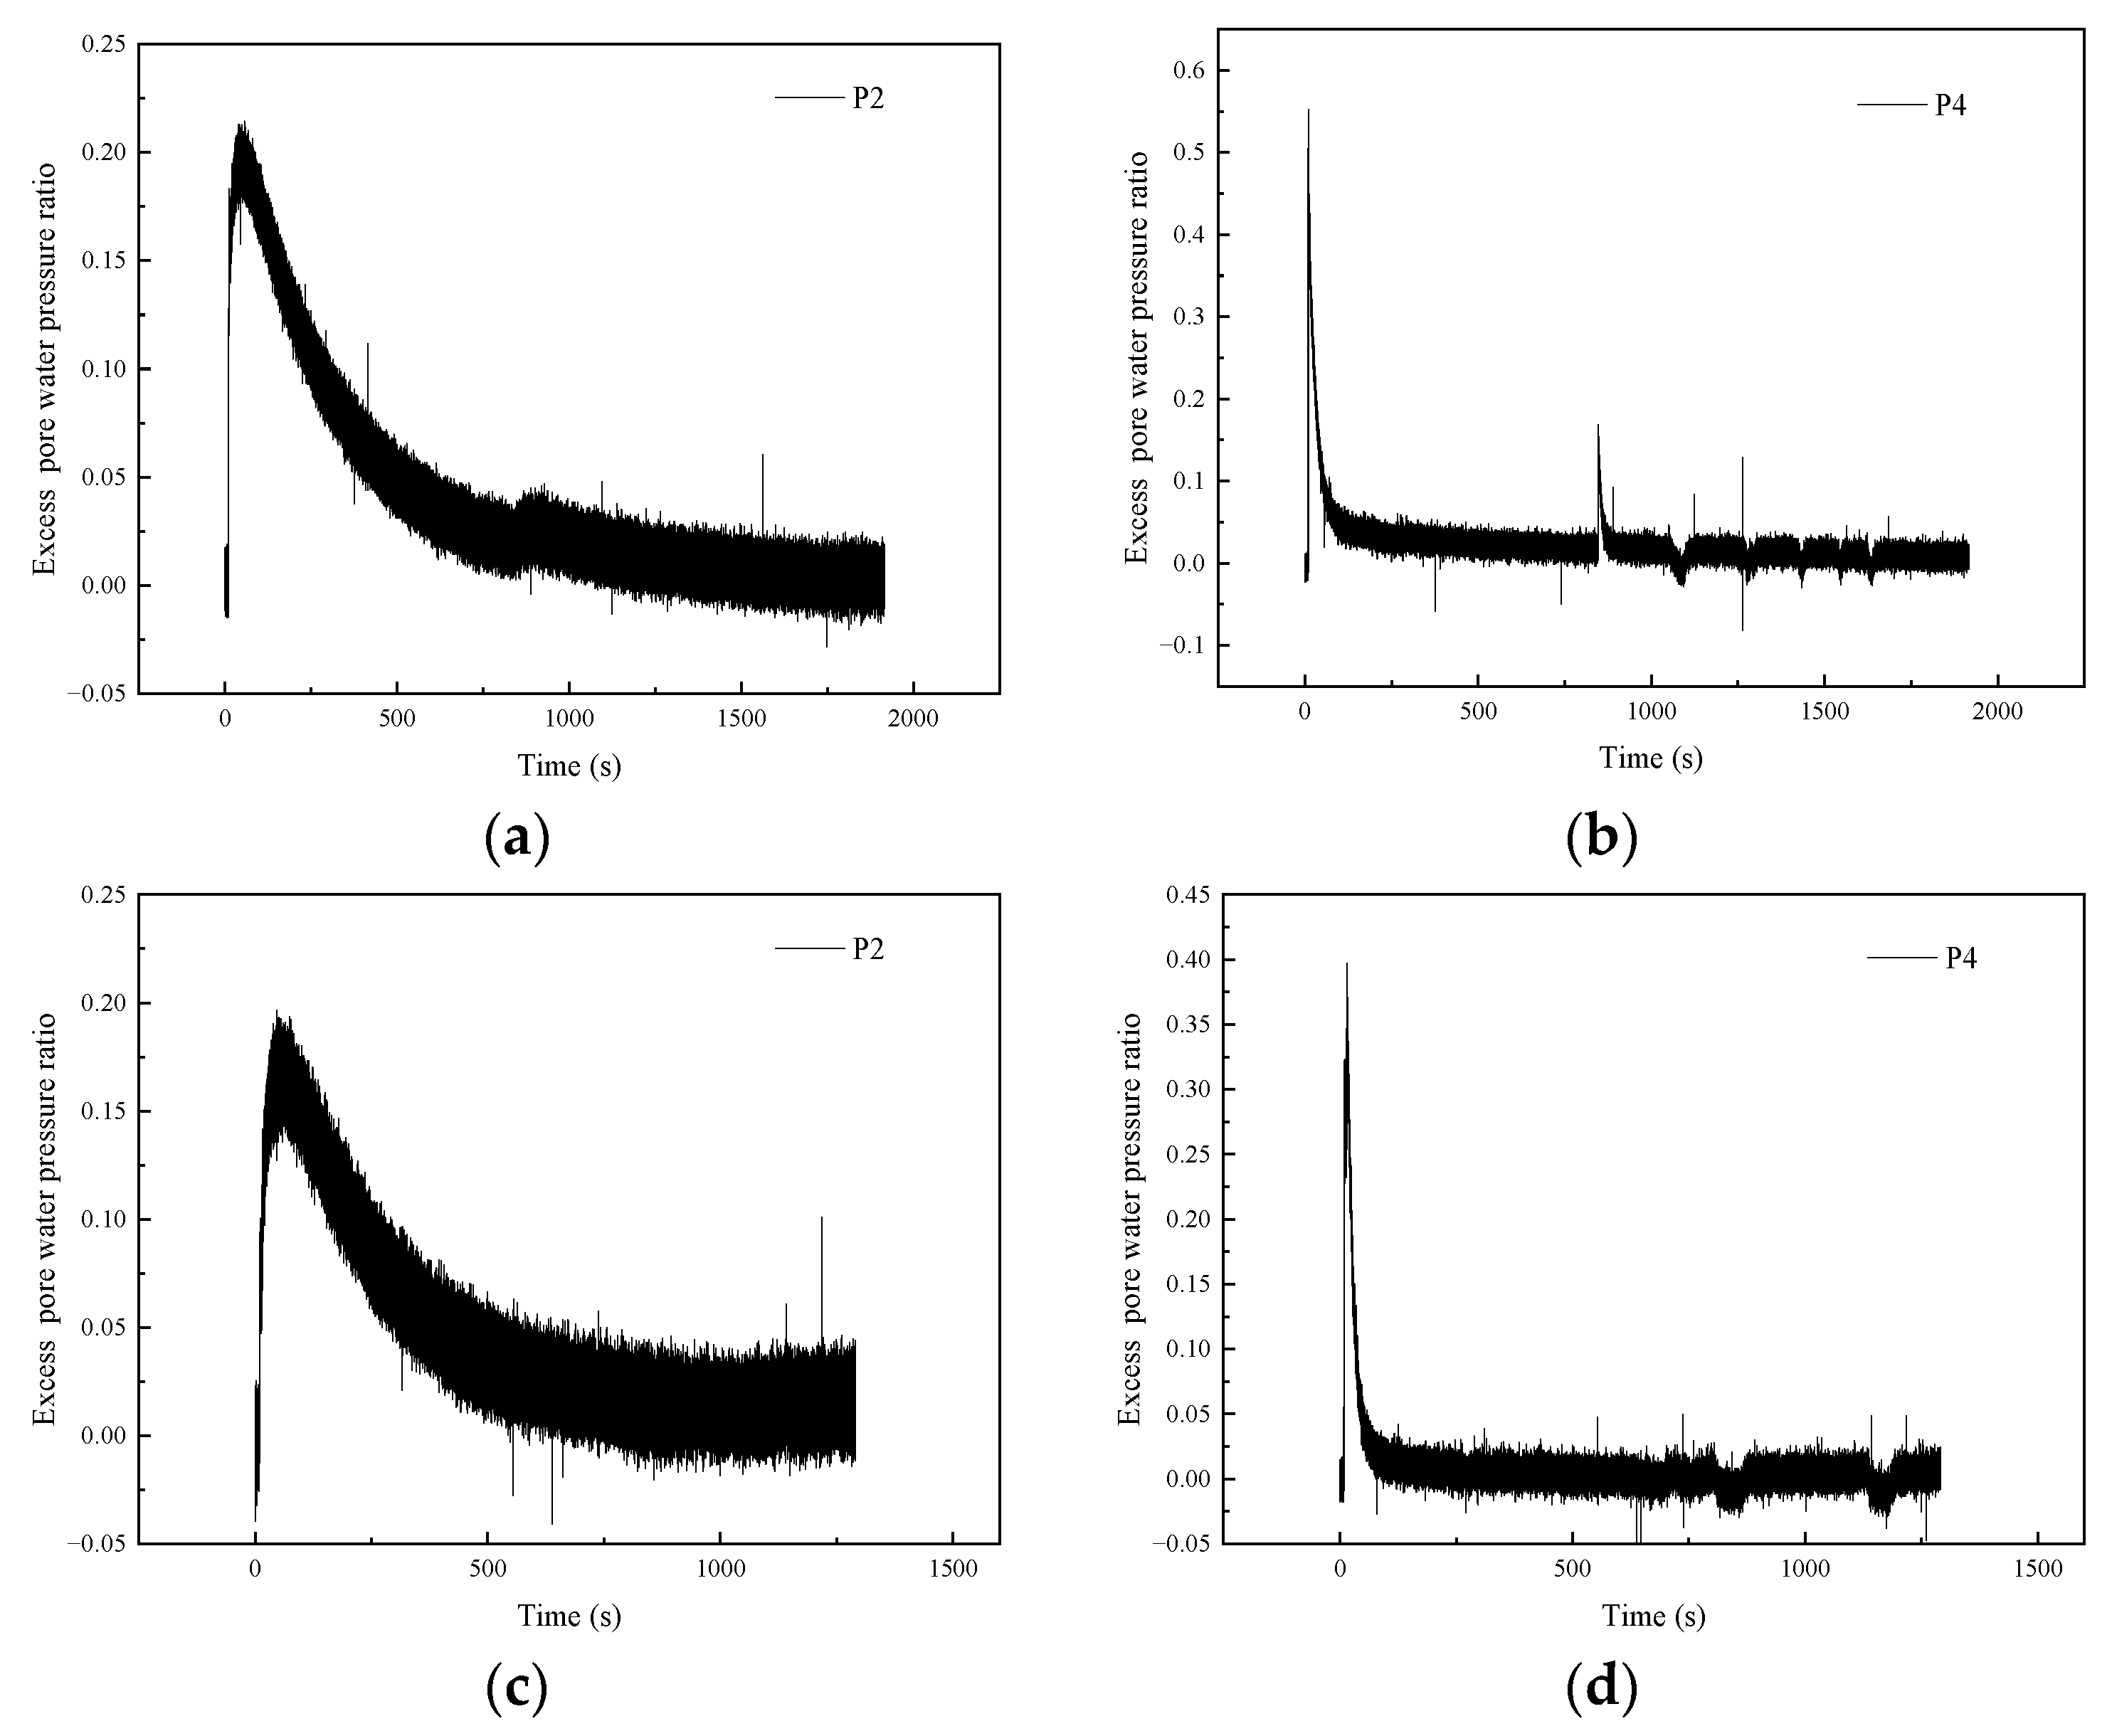
3.1. Excess Pore Water Pressure Ratio
- (1)
- With respect to the time history curve of the excess pore water pressure ratio, a trend that the excess pore water pressure ratio decreases with the increase of the buried depth has been found. This is mainly due to the subsidiary stress caused by the dead weight of the underground tunnel model. Due to the effects of the existing subsidiary stress, the soil underneath the bottom plate is more compact than the soil above the tunnel structure.
- (2)
- Under the same input ground motion, the excess pore water pressure of the overburden soil layer above the tunnel structure dissipates faster than that of the soil layer underneath the tunnel structure, indicating that the existence of the underground structure can change the dissipation rate of the excess pore water pressure of soil.
- (3)
- From the point of view of the peak excess pore water pressure ratio value, the peak value under the Kobe excitation is larger than that under the Wolong excitation. Considering the Wolong ground motion, the proportion of high-frequency components is obvious. On the contrary, as for the Kobe ground motion, the low-frequency components are more abundant. It can be seen that the spectral characteristics of ground motion have a noticeable effect on the development of excess pore water pressure in saturated sand soil, which verifies the opinion introduced in [3].

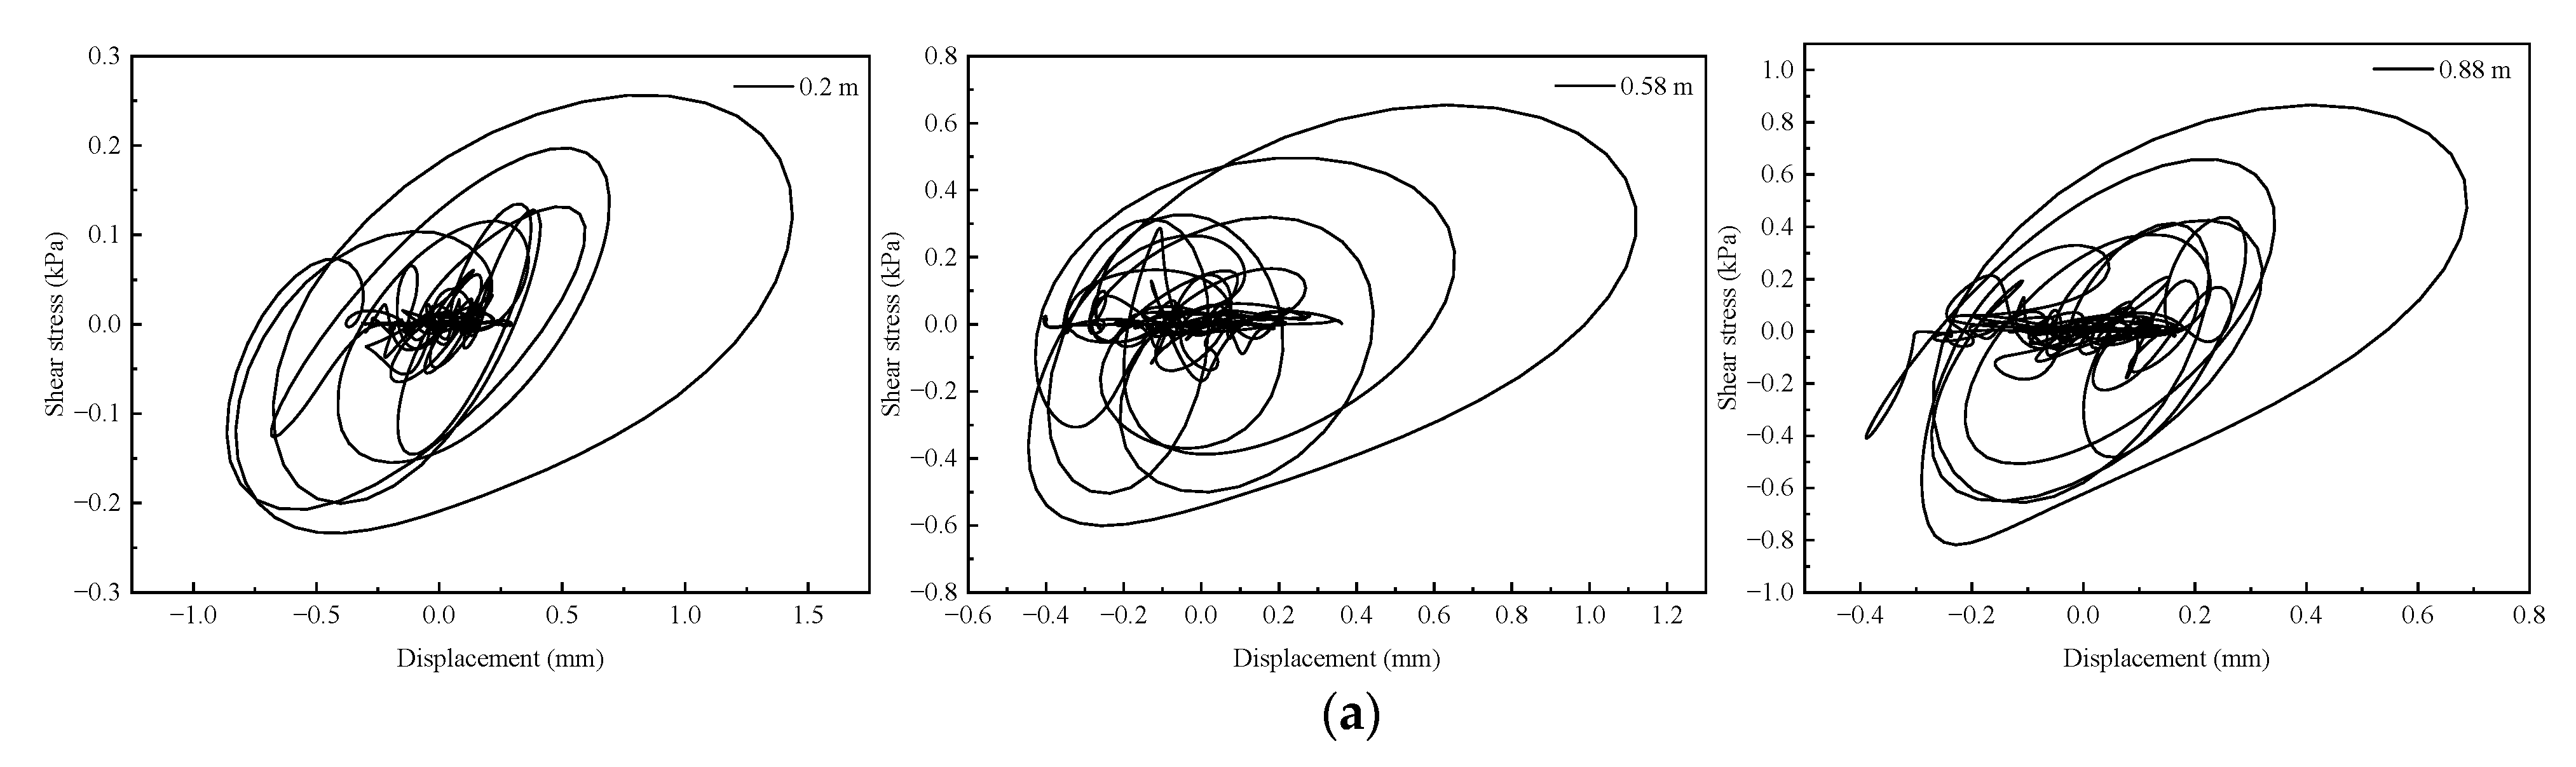
3.2. Dynamic Shear Stress–Displacement Hysteretic Curves of Soil Deposits
- (1)
- From the perspective of the development trend of shear stress from soil layers with different buried depths, the shear stress of shallow buried soil is generally smaller than that of deep buried soil. The displacement of soil decreases with the increase of the buried depth, and the displacement of shallow buried soil is the largest. This is owing to the fact that the greater the buried depth, the larger the additional stress of soil. In addition, due to the existence of the underground tunnel model, the soil surrounding and below the tunnel structure is well-constrained.
- (2)
- Considering the loading case of 0.1 g of ground motion, since the input seismic energy of the ground is small, the soil deposits basically remain in an elastic state. A trend whereby different earthquake waves have little influence on the shear stress value of the soil deposits has been found. Otherwise, input the same PGA, and different ground motions imposed to the testing model system obviously significantly affect the shear stress of the soil deposits. Given the case of a loading level with PGA 0.4 g, the peak shear stress values of the soil deposits are −2.3, −1.8, and −0.9 kPa, respectively, corresponding to the excitations of El-Centro, Kobe, and Wolong ground motions. Particularly worth mentioning is that the spectrum characteristics of ground motions have a significant effect on the development law of shear stress under moderate and strong earthquakes.
- (3)
- Ground motions have significant influence on the displacement of soil deposits. Taking the displacement of the soil deposit with a buried depth of 0.2 m for instance, under different seismic excitations with the same PGA, El-Centro ground motion induces the largest displacement, followed by the Kobe ground motion, and finally the Wolong ground motion, and the difference is more obvious when the input PGA is larger. This is mainly due to effects of ground motions on the dynamic responses of the saturated sandy soil site, i.e., the excess pore water pressure increases rapidly, which has the characteristic of filtering the high-frequency component of seismic waves, and thus the low-frequency portion plays a more obvious role.
- (4)
- With respect to the shear stress–displacement hysteretic curve, the hysteretic loop of each soil layer shows a good regularity in general under the loading cases of 0.1 g ground motions. The hysteretic loops become steeper with the increase of soil displacement. When the input PGA increases to 0.2 and 0.4 g, the hysteretic loop gradually slows down with the increase of soil displacement, and the area formed by the hysteretic loop expands. There is accumulating plastic deformation of soil deposits showing a softening trend and indicating that the nonlinear characteristics of the soil deposits are pretty obvious. Furthermore, there is an apparent attenuation law observed from the shear stiffness (namely the diagonal slope of a hysteretic loop) of the soil deposit with a buried depth of 0.2 m, followed by the soil deposit with a buried depth of 0.58 m. This phenomenon is not obvious in the soil deposit with a buried depth of 0.58 m. The development law of soil deposits’ shear stiffness can be explained in two aspects. On the one hand, the stiffness of the underground structure is large, which better restricts the deformation of the bottom soil. On the other hand, the excess pore water pressure of saturated sand at a shallow depth increases faster than that at a deep depth, and the effective stress of soil decreases more obviously; thus, the soil is more likely to produce and accumulate plastic deformation during the earthquake process.


3.3. Equivalent Dynamic Horizontal Subgrade Reaction Coefficient
- (1)
- The equivalent dynamic horizontal subgrade reaction coefficient increases with the increase of the buried depth. The difference between the equivalent dynamic horizontal subgrade reaction coefficient above and underneath the underground structure model is the largest. Considering the loading case of the 0.1 g El-Centro ground motion, the difference reaches 7.589 MN/m3.
- (2)
- The equivalent dynamic horizontal subgrade reaction coefficient decreases with the increase of the input PGA, especially under the action of moderate and strong earthquakes. The maximum reduction ratios of the equivalent dynamic horizontal subgrade reaction coefficient are 74.4%, 66.7%, and 47.3%, corresponding to the El-Centro, Kobe, and Wolong ground motions, respectively.
- (3)
- Comparing the maximum equivalent dynamic horizontal subgrade reaction coefficients of soil deposits under three ground motions, there are certain differences among the coefficients of the soil deposit with the same buried depth when subjected to the same input PGA. Under the loading conditions with 0.1 g PGA, the coefficient values of the loading case of El-Centro waves are generally larger than those of the other two seismic excitations. Owing to the order of input ground motions (El-Centro ground motion first, then Kobe ground motion, and finally Wolong ground motion), the soil remains in the initial state before the input of the El-Centro ground motion. When PGA increases to 0.2 and 0.4 g, the coefficient values of the loading case of the El-Centro wave are generally smaller than those of the other two seismic excitations. This may be because the low-frequency components of the El-Centro record are more abundant than the other two ground motions. Under the action of moderate and strong earthquakes, the liquefaction degree of saturated sand soil is increased, in which the influence of the low-frequency components of ground motion must be amplified. It also supports the opinion that the degree of liquefaction can affect the dynamic response of site soil [20].

| PGA | El-Centro Ground Motion | Kobe Ground Motion | Wolong Ground Motion | ||||||
|---|---|---|---|---|---|---|---|---|---|
| B.D. 0.2 m | B.D. 0.58 m | B.D. 0.88 m | B.D. 0.2 m | B.D. 0.58 m | B.D. 0.88 m | B.D. 0.2 m | B.D. 0.58 m | B.D. 0.88 m | |
| 0.1 g | 0.617 | 7.716 | 8.206 | 0.744 | 3.667 | 5.772 | 0.764 | 3.348 | 5.799 |
| 0.2 g | 0.442 | 2.110 | 4.721 | 0.413 | 3.496 | 5.092 | 0.855 | 2.947 | 4.966 |
| 0.4 g | 0.353 | 1.983 | 3.552 | 0.248 | 2.570 | 3.986 | 0.503 | 2.625 | 3.051 |
3.4. Dynamic Strain of the Underground Structure Model
- (1)
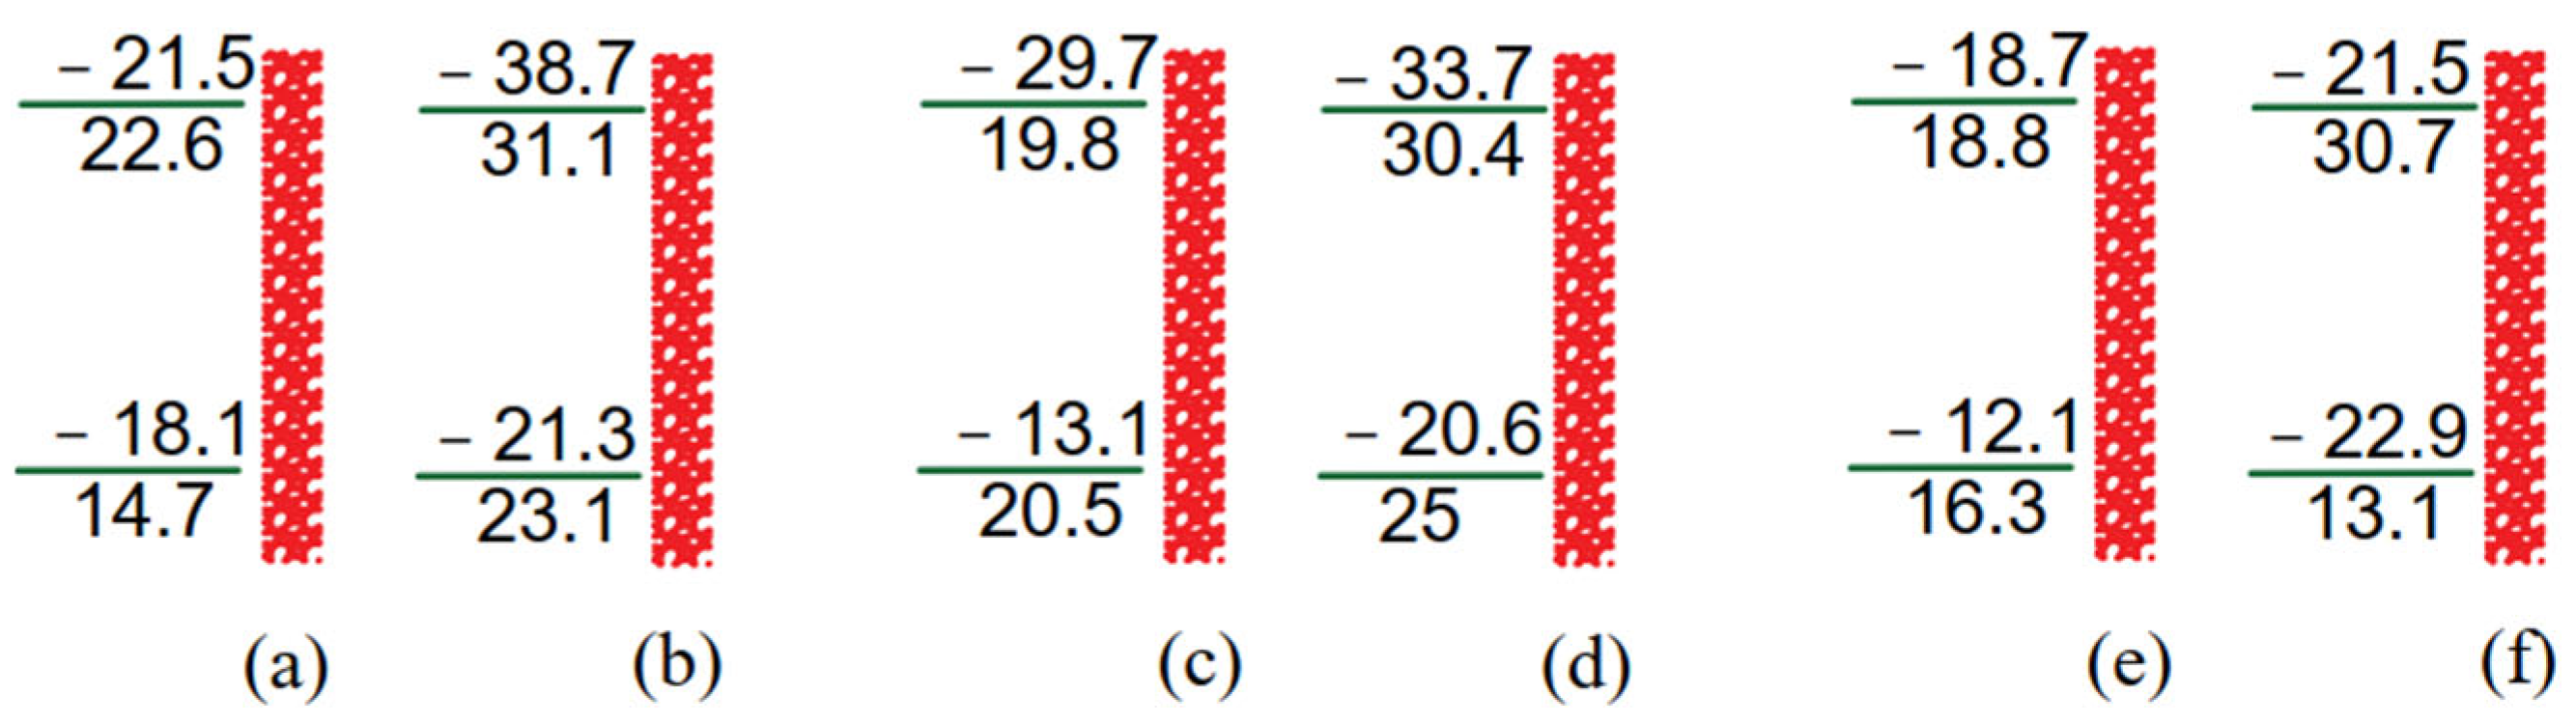
- Under all loading conditions, the strain on the sidewall of the underground structure presents the characteristics of approximate symmetry in tension and compression directions. In general, the peak dynamic strain value at the top of the sidewall is higher than that at the bottom of the sidewall (i.e., under the loading condition of El-Centro PGA 0.1 g, the peak dynamic strains of the top and bottom of the sidewall are 22.5 and −18.1 με, respectively), and this is similar to the distribution law of shear displacement in the soil deposits, which also coincides with the law that the seismic response of underground structures is controlled by the soil deformation.
- (2)
- The peak dynamic strain of the underground structure increases with the increase of the seismic excitation amplitude. The increase of the dynamic strain value of the top of the sidewall is obviously higher than that of the bottom of the sidewall when input PGA ranges from 0.1 to 0.2 g. Given that PGA of El-Centro ranges from 0.1 to 0.2 g, the compression (negative value in Figure 9) and tension (positive value in Figure 9) strain values of the top of the sidewall increase by 17.2 and 8.5 με, while those of the bottom of the sidewall increase by 3.2 and 8.4 με. The same rule has also been found under the other two seismic excitations. While, in the case of the same PGA, the peak dynamic strains are different due to different ground motions, i.e., the peak dynamic strain values of the top of the sidewall under the loading conditions of El-Centro PGA 0.2 g, Kobe PGA 0.2 g, and Wolong PGA 0.2 g are −38.7, −33.7, and 30.7 με, respectively. With the increase of PGA, the displacement of the soil deposit above the underground structure is significantly greater than that of the soil deposit surrounding and underneath the underground structure, and the equivalent dynamic horizontal subgrade reaction coefficient of the soil deposits also begins to decline. Thus, the elastic resistance of the soil to the underground structure decreases. Consequently, the structure needs to resist more seismic energy. It is also verified that the buried depth of underground structures and the development of internal forces of soil deposits can directly affect the level of soil–underground structure interaction.

4. Conclusions and Discussions
4.1. Discussion
- (1)
- More case studies about actual underground tunnels embedded in soft soil sites under seismic motions are required.
- (2)
- Numerical models investigating the saturated soil–underground structure interaction under diverse earthquake loadings are necessary.
- (3)
- High-precision sensors as well as mathematic methods estimating the seismic performance of soil foundations and underground structures need further development.
4.2. Conclusions
- (1)
- In consideration of the shaking process, the shear stress of the soil deposit above the underground structure and the soil deposits on both sides of the underground structure was smaller than that of the sand deposit underneath the underground structure, while the distribution law of the soil displacement showed the opposite trend (the shear stress–displacement hysteretic curves of the testing soil deposits exhibited that the shear stress of the soil deposits with a buried depth of 0.88 m was the largest, while the horizontal displacement was the smallest). The underground tunnel structure improved the additional effective stress of the ground soil to a certain extent.
- (2)
- The spectral characteristics of ground motion had obvious effects on the soil deformation of saturated sandy soil, especially when exposed to moderate and strong earthquakes. Inputting the ground motion with rich low-frequency components, the shear stress–displacement hysteretic loop of soil was plump, and the accumulated plastic deformation of soil deposits was obvious.
- (3)
- A certain degree of softening phenomenon of soil can be reflected by the shear stress–displacement hysteretic curves, which can be properly related to the horizontal displacement of the soil deposits and generation of the excess pore water pressure.
- (4)
- Based on the shear stress–displacement hysteretic curves of soil deposits, the equivalent dynamic horizontal subgrade reaction coefficient can be obtained by calculating the ratio of shear stress to displacement at any time in the earthquake time histories. The horizontal equivalent dynamic subgrade reaction coefficient increased with the increase of the soil buried depth and decreased with the increase of the input PGA value.
- (5)
- In the case of small earthquakes, the order of the input ground motions can affect the value of the equivalent dynamic horizontal subgrade reaction coefficient. While in the case of moderate and strong earthquakes, soil liquefaction can influence the equivalent dynamic horizontal subgrade reaction coefficient.
- (6)
- The peak dynamic strain value of the top of the sidewall was higher than that of the bottom of the sidewall when subjected to earthquakes. Overall, the development law of structural dynamic strain was in good agreement with the displacement distribution pattern of the soil deposits. Special attention should be paid to observing the foundation deformation underneath underground structures, as well as estimation of the shear stress state of the soil deposits on both sides and above underground structures. In extreme cases, corresponding measures should be taken to reduce the stress of underground structures buried in saturated sand sites.
- (7)
- This paper is a part of the results of the soil-underground structure shaking table model test. It is also worth analyzing the effects of soil materials and underground structure types on the seismic responses of underground structures. In addition, further improvements on the understanding of the seismic capacity of underground structures and related references for the earthquake prevention and disaster reduction of underground structures are also worth exploring.
Author Contributions
Funding
Data Availability Statement
Conflicts of Interest
References
- Wang, J.N.; Yang, J.; Zhuang, H.Y.; Ma, G.; Sun, Y. Seismic responses of a large unequal-span underground subway station in liquefiable soil using shaking table test. J. Earthq. Eng. 2021, 11, 1–22. [Google Scholar] [CrossRef]
- Zhao, K.; Wang, Q.Z.; Chen, Q.; Zhuang, H.Y.; Chen, G.X. Simplified effective stress modeling of shear wave propagation in saturated granular soils. Geotech. Lett. 2021, 11, 1–9. [Google Scholar] [CrossRef]
- Ko, Y.Y.; Chen, C.H. On the variation of mechanical properties of saturated sand during liquefaction observed in shaking table tests. Soil Dyn. Earthq. Eng. 2020, 129, 105946. [Google Scholar] [CrossRef]
- Chattaraj, R.; Sengupta, A. Liquefaction potential and strain dependent dynamic properties of Kasai River sand. Soil Dyn. Earthq. Eng. 2016, 90, 467–475. [Google Scholar] [CrossRef]
- Ye, B.; Xie, X.; Zhao, T.; Song, S.; Ma, Z.; Feng, X.; Zou, J.; Wang, H. Centrifuge tests of macroscopic and mesoscopic investigation into effects of seismic histories on sand liquefaction resistance. J. Earthq. Eng. 2020, 26, 4302–4324. [Google Scholar] [CrossRef]
- Xie, X.L.; Ye, B.; Zhao, T.; Feng, X.Q.; Zhang, F. Changes in sand meso-structure under repeated seismic liquefaction events during centrifuge tests. Soil Dyn. Earthq. Eng. 2021, 150, 106940. [Google Scholar] [CrossRef]
- Shooshpasha, I.; Bagheri, M. The effects of surcharge on liquefaction resistance of silty sand. Arab. J. Geosci. 2014, 7, 1029–1035. [Google Scholar] [CrossRef]
- Hamada, M.; Isoyama, R.; Wakamatsu, K. Liquefaction-induced ground displacement and its related damage to lifeline facilities. Soils Found. 1996, 36, 81–97. [Google Scholar] [CrossRef]
- Uenishi, K.; Sakurai, S. Characteristic of the vertical seismic waves associated with the 1995 Hyogo-ken Nanbu (Kobe), Japan earthquake estimated from the failure of the Daikai Underground Station. Earthq. Eng. Struct. Dyn. 2000, 29, 813–821. [Google Scholar] [CrossRef]
- Tokimatsu, K.; Tamura, S.; Suzuki, H.; Katsumata, K. Building damage associated with geotechnical problems in the 2011 Tohoku Pacific Earthquake. Soils Found. 2012, 52, 956–974. [Google Scholar] [CrossRef]
- Yamaguchi, A.; Mori, T.; Kazama, M.; Yoshida, N. Liquefaction in Tohoku district during the 2011 off the Pacific Coast of Tohoku Earthquake. Soils Found. 2012, 52, 811–829. [Google Scholar] [CrossRef] [Green Version]
- Wang, W.L.; Wang, T.T.; Su, J.J.; Lin, C.H.; Seng, C.R.; Huang, T.H. Assessment of damage in mountain tunnels due to the Taiwan Chi-Chi earthquake. Tunn. Undergr. Space Technol. 2001, 16, 133–150. [Google Scholar] [CrossRef]
- Zhuang, H.; Hu, Z.; Wang, X.; Chen, G. Seismic responses of a large underground structure in liquefied soils by FEM numerical modelling. Bull. Earthq. Eng. 2015, 13, 3645–3668. [Google Scholar] [CrossRef]
- Chen, S.; Wang, X.; Zhuang, H.; Xu, C.; Zhao, K. Seismic response and damage of underground subway station in a slightly sloping liquefiable site. Bull. Earthq. Eng. 2019, 17, 5963–5985. [Google Scholar] [CrossRef]
- Zhao, K.; Zhu, S.D.; Bai, X.X.; Wang, Q.; Chen, S.; Zhuang, H.; Chen, G. Seismic response of immersed tunnel in liquefiable seabed considering ocean environmental loads. Tunn. Undergr. Space Technol. 2021, 115, 104066. [Google Scholar] [CrossRef]
- Liang, L.; Hongyun, J.; Xiuli, D.; Peixin, S. Fully fluid-solid coupling dynamic model for seismic response of underground structures in saturated soils. Earthq. Eng. Eng. Vib. 2020, 19, 257–268. [Google Scholar] [CrossRef]
- Li, L.; Shi, P.X.; Du, X.L.; Jiao, H. Using numerical simulation to determine the seismic response of coastal underground structures in saturated soil deposits. J. Costal Res. 2017, 33, 583–595. [Google Scholar] [CrossRef]
- Yu, H.T.; Yan, X.; Bobet, A.; Yuan, Y.; Xu, G.; Su, Q. Multi-point shaking table test of a long tunnel subjected to non-uniform seismic loadings. Bull. Earthq. Eng. 2018, 16, 1041–1059. [Google Scholar] [CrossRef]
- Yu, H.T.; Yuan, Y.; Xu, G.P.; Su, Q.; Yan, X.; Li, C. Multi-point shaking table test for long tunnels subjected to non-uniform seismic loadings—Part II: Application to the HZM immersed tunnel. Soil Dyn. Earthq. Eng. 2018, 108, 187–195. [Google Scholar] [CrossRef]
- Ding, X.M.; Zhang, Y.L.; Wu, Q.; Chen, Z.; Wang, C. Shaking table tests on the seismic responses of underground structures in coral. Tunn. Undergr. Space Technol. 2021, 109, 103775. [Google Scholar] [CrossRef]
- Kheradi, H.; Nagano, K.; Nishi, H.; Zhang, F. 1-g shaking table tests on seismic enhancement of existing box culvert with partial ground-improvement method and its 2D dynamic simulation. Soils Found. 2018, 58, 563–581. [Google Scholar] [CrossRef]
- Su, C.; Baizan, T.; Haiyang, Z.; Jianning, W.; Xiaojun, L.; Kai, Z. Experimental investigation of the seismic response of shallow-buried subway station in liquefied soil. Soil Dyn. Earthq. Eng. 2020, 136, 106153. [Google Scholar] [CrossRef]
- Tao, L.J.; Shi, C.; Deng, P.; Zhang, F. Shaking table test of the effect of an enclosure structure on the seismic performance of a prefabricated subway station. Tunn. Undergr. Space Technol. 2022, 125, 104533. [Google Scholar] [CrossRef]
- Koseki, J.; Matsuo, O.; Koga, Y. Uplift behavior of underground structures caused by liquefaction of surrounding soil during earthquake. Soils Found. 1997, 37, 97–108. [Google Scholar] [CrossRef]
- Zhu, T.; Wang, R.; Zhang, J.M. Evaluation of various seismic response analysis methods for underground structures in liquefiable ground. Tunn. Undergr. Space Technol. 2021, 110, 103803. [Google Scholar] [CrossRef]
- Mahmoud, A.O.; Hussien, M.N.; Karray, M.; Chekired, M.; Bessette, C.; Jinga, L. Mitigation of liquefaction-induced uplift of underground structures. Comput. Geotech. 2020, 125, 103663. [Google Scholar] [CrossRef]
- Zhang, M.Z. Study on similitude laws for shaking table tests. Earthq. Eng. Eng. Vib. 1997, 2, 52–58. (In Chinese) [Google Scholar]
- Chen, H.J.; Li, X.J.; Yan, W.M.; Chen, S.; Zhang, X. Shaking table test of immersed tunnel considering the geological condition. Eng. Geol. 2017, 227, 93–107. [Google Scholar] [CrossRef]
- Han, L.; Liu, H.L.; Zhang, W.A.; Ding, X.; Chen, Z.; Feng, L.; Wang, Z. Seismic behaviors of utility tunnel-soil system: With and without joint connections. Undergr. Space 2022, 7, 798–811. [Google Scholar] [CrossRef]
- Sun, H.F.; Jing, L.P.; Meng, X.C.; Wang, N.W. A three-dimensional laminar shear soil container for shaking table test. J. Vib. Shock 2012, 13, 26–32. (In Chinese) [Google Scholar]
- David, Z.Y.; Moshe, E.; Moshe, A.A. Analysis of beams on nonlinear winkler foundation. Comput. Struct. 1989, 31, 287–292. [Google Scholar] [CrossRef]
- Pan, Y.J.; Li, G.S.; Liu, S.C.; Ouyang, T.J.; Cai, G.C. Study on the test method and value of the horizontal subgrade coefficient. Chin. J. Undergr. Space Eng. 2018, 14, 712–718. (In Chinese) [Google Scholar]
- Xu, K.; Jing, L.; Cheng, X.; Liang, H.; Bin, J. Laboratory tests for subgrade reaction coefficient in seismic design of underground engineering domain. Adv. Civ. Eng. 2020, 10, 1–14. [Google Scholar] [CrossRef]


| Physical Quantities | Similitude Relations | Model Structure |
|---|---|---|
| Length | 1/30 | |
| Displacement | 1/30 | |
| Equivalent density | 1.875 | |
| Duration | 1/4 | |
| Elastic modulus | 1/4 | |
| Acceleration | 7.57 |
Publisher’s Note: MDPI stays neutral with regard to jurisdictional claims in published maps and institutional affiliations. |
© 2022 by the authors. Licensee MDPI, Basel, Switzerland. This article is an open access article distributed under the terms and conditions of the Creative Commons Attribution (CC BY) license (https://creativecommons.org/licenses/by/4.0/).
Share and Cite
Cheng, X.; Xu, X.; Hu, Z.; Jing, L.; Liang, H.; Cui, J. Seismic Response of a Liquefiable Site-Underground Structure System. Buildings 2022, 12, 1751. https://doi.org/10.3390/buildings12101751
Cheng X, Xu X, Hu Z, Jing L, Liang H, Cui J. Seismic Response of a Liquefiable Site-Underground Structure System. Buildings. 2022; 12(10):1751. https://doi.org/10.3390/buildings12101751
Chicago/Turabian StyleCheng, Xinjun, Xiang Xu, Zhinan Hu, Liping Jing, Haian Liang, and Jie Cui. 2022. "Seismic Response of a Liquefiable Site-Underground Structure System" Buildings 12, no. 10: 1751. https://doi.org/10.3390/buildings12101751