Article

Analysis of Urban Spatial Accessibility of Museums within the Scope of Seoul

1
Department of Interior Design, Sangmyung University, Cheonan 31066, Korea
2
College of Design, Sangmyung University, Cheonan 31066, Korea
*
Author to whom correspondence should be addressed.
Buildings 2022, 12(10), 1749; https://doi.org/10.3390/buildings12101749
Submission received: 7 August 2022 / Revised: 14 October 2022 / Accepted: 17 October 2022 / Published: 20 October 2022

Abstract

:
While urban accessibility of museums plays a crucial role in the growth of a cultural city, in reality, an uneven distribution of museums exists in cities. In particular, museums are concentrated in certain regions or located in a place that is different from the cognitive experience of local residents. To solve this issue, this study quantified the urban space of Seoul, which has entered into the status of a cultural city since the 1990s, as its target city by using space syntax. Further, a suitability analysis was conducted by extracting the museums’ topological accessibility in the city structure as well as the accessibility by the travel angle and limit distance setting. The results showed that the physical locations of museums considering the minimum walking distance set in this study were somewhat separated or isolated from primary spaces where people travel. This indicates that determining museum locations by referring to the major travel routes throughout the city is a significant basis for securing physical accessibility. This study is meaningful as it establishes reference materials for determining museum locations in Seoul and will help form physical clusters of museums adjacent to each other.

1. Introduction

Today, the tourism industry in cultural cities is expanding due to reduced travel time and lowered transportation costs promoted by the development of different transportation [1,2,3]. In particular, this trend has further accelerated with the development of information technologies since the 2000s, allowing easier access to tourism information about cultural cities. [4]. When compared to contemporary new cities, such a cultural city differs largely in that it strengthens the power of cultural creation by effectively using cultural resources with local characteristics, such as arts and culture, cultural industry, and tourism [5]. It is one of the most important factors in affecting how tourists determine their destination [6,7]. In addition, cities that had been developed around the industries of the past are now transforming into cultural cities due to social and economic factors such as inflation, and have improved the economic profit in the neighboring regions of cultural facilities by the regeneration of abandoned industrial ruins to cultural facilities and attracting tourists [4,8,9]. Such cultural facilities play a role of direct cultural experience and cultural promotion to audiences, and, in particular, the cultural experience programs and thematic exhibitions in museums have performed such a role most intuitively [10]. Moreover, the types of museums have been divided into various areas, including arts, history, folklore, natural science, technology, and industry among others [11,12], but as its concept, a museum is defined as a facility that preserves, manages, researches, educates, and exhibits data toward the development of arts and culture, and the promotion of cultural entertainment [13,14], and, thus, the museums discussed in this study are based on the inclusive concept of a museum that promotes the development of a cultural city. However, those facilities not registered as a government facility or galleries mainly for special exhibitions are excluded from this study.
Seoul, the capital of Korea, has been a popular cultural city in Asia since the 2000s [15]. Until the 1990s, manufacturing was the center of economic development in Seoul. However, as a result of efforts to promote deindustrialization due to factors such as inflation and developing the service industry, industries such as manufacturing businesses began to move to the suburbs [16]. As the abandoned buildings and spaces previously used for industrial purposes started to create social issues [17,18], the government established urban regeneration policies. It revitalized old industrial heritage sites into infrastructures such as museums, art galleries, and cultural centers [19,20]. Although the strategies of Seoul to develop as a cultural city were rather late compared to other developed countries, it can be determined that the development period that promoted the cultural city was considerably shortened [21,22]. In particular, beginning in the 1990s, people became interested in culture and art due to the country’s economic stability, and the number of museums increased significantly with local government systems [23]. According to the Ministry of Culture, Sports, and Tourism’s 2018 survey of international visitors [24], the number of foreign tourists who visited Korea continued to rise from 2005 to 2014, and about 80% of them visited Seoul. Before the outbreak of COVID-19, the number of foreign tourists to Seoul showed a quantitative increase [25].
The urban accessibility of museums is the first thing to consider when creating museums to promote the growth of cultural cities [26]. However, in reality, there exists an uneven distribution of museums [27], where museums are heavily concentrated in some regions or their location is different from the cognitive experience of local residents [28]. Therefore, this study quantified the urban space of Seoul as its target city by using space syntax [29]. In addition to the topological structure formed by connecting urban roads, accessibility is also affected by the difficulty, mobility, and cognitive distance through space [30,31,32,33]. This study aimed to analyze the urban topological and structural accessibility of museums and the correlation of museum accessibility based on the travel angle and limit distance by setting the scope of the travel angle and limit distance. Its purpose lies in proposing the reference data for determining the location of a museum in a cultural city in the future by considering urban accessibility. Additionally, international visitors use a vehicle or public transportation to go to specific areas in Seoul [24,34,35], but most walk from that area to their designated destination [36,37]. Therefore, the analysis in this study only included roads that are accessible by both people and vehicles.

2. Space Syntax and Research Method
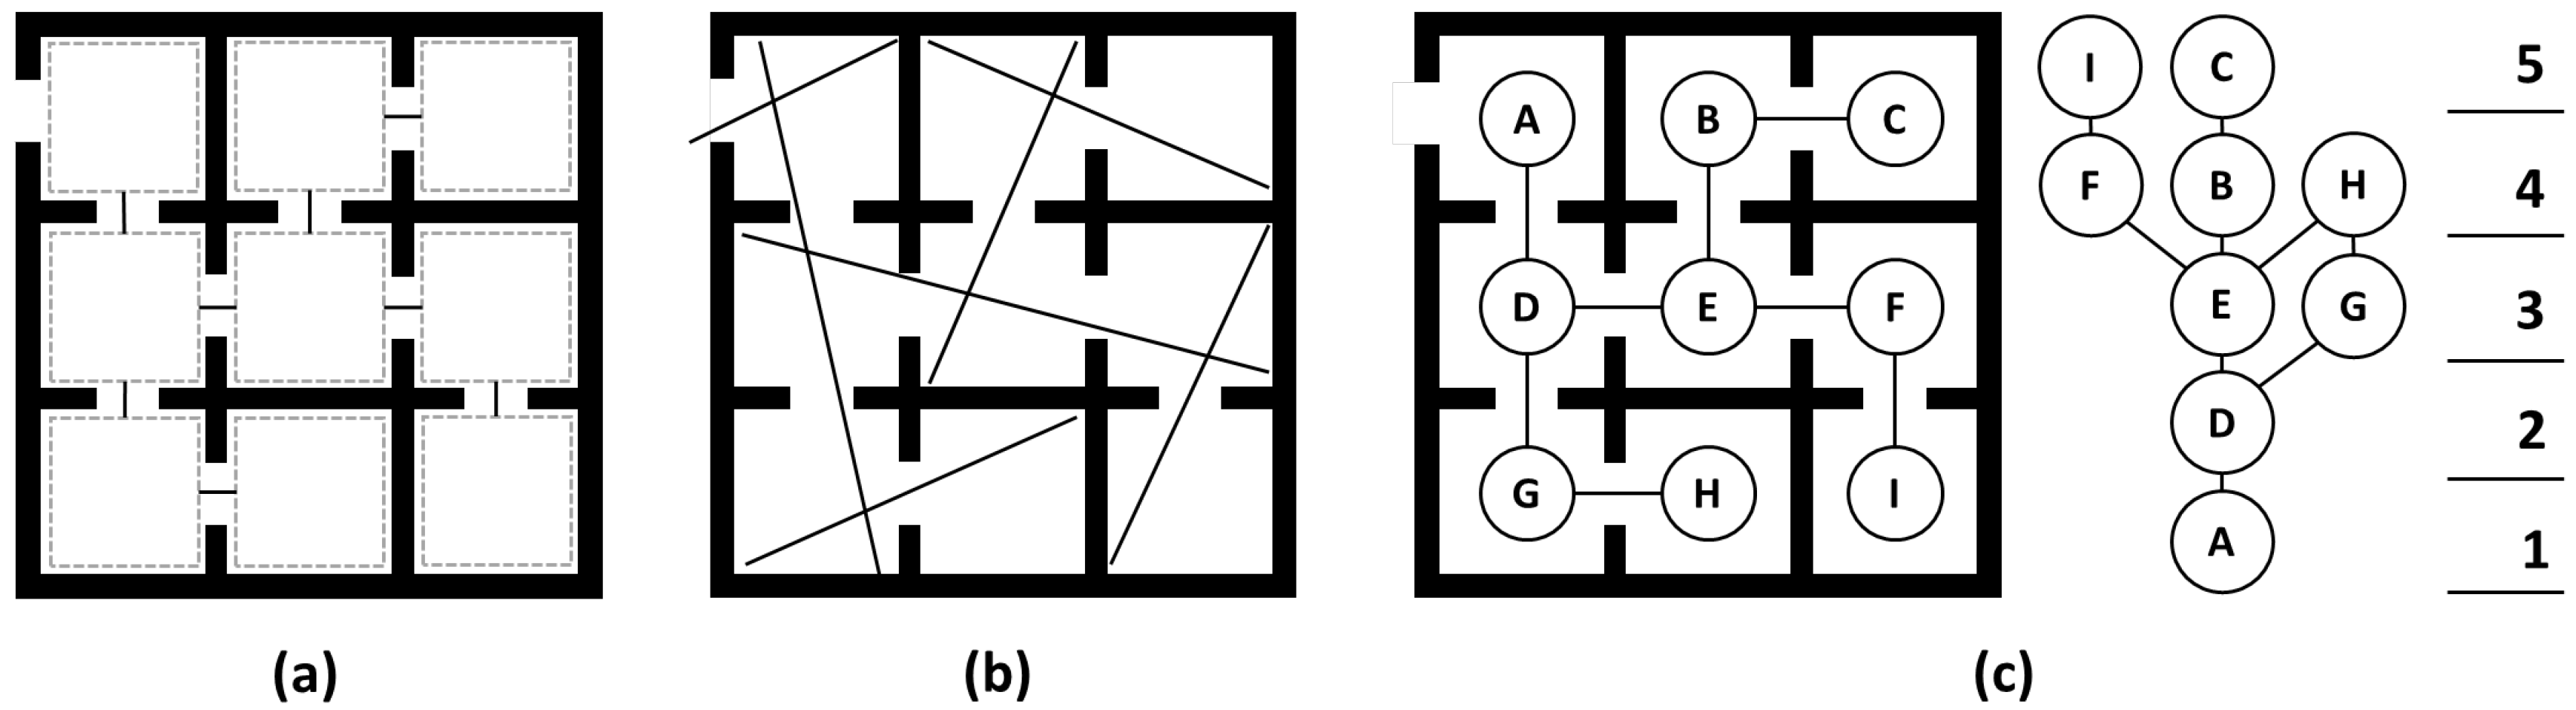
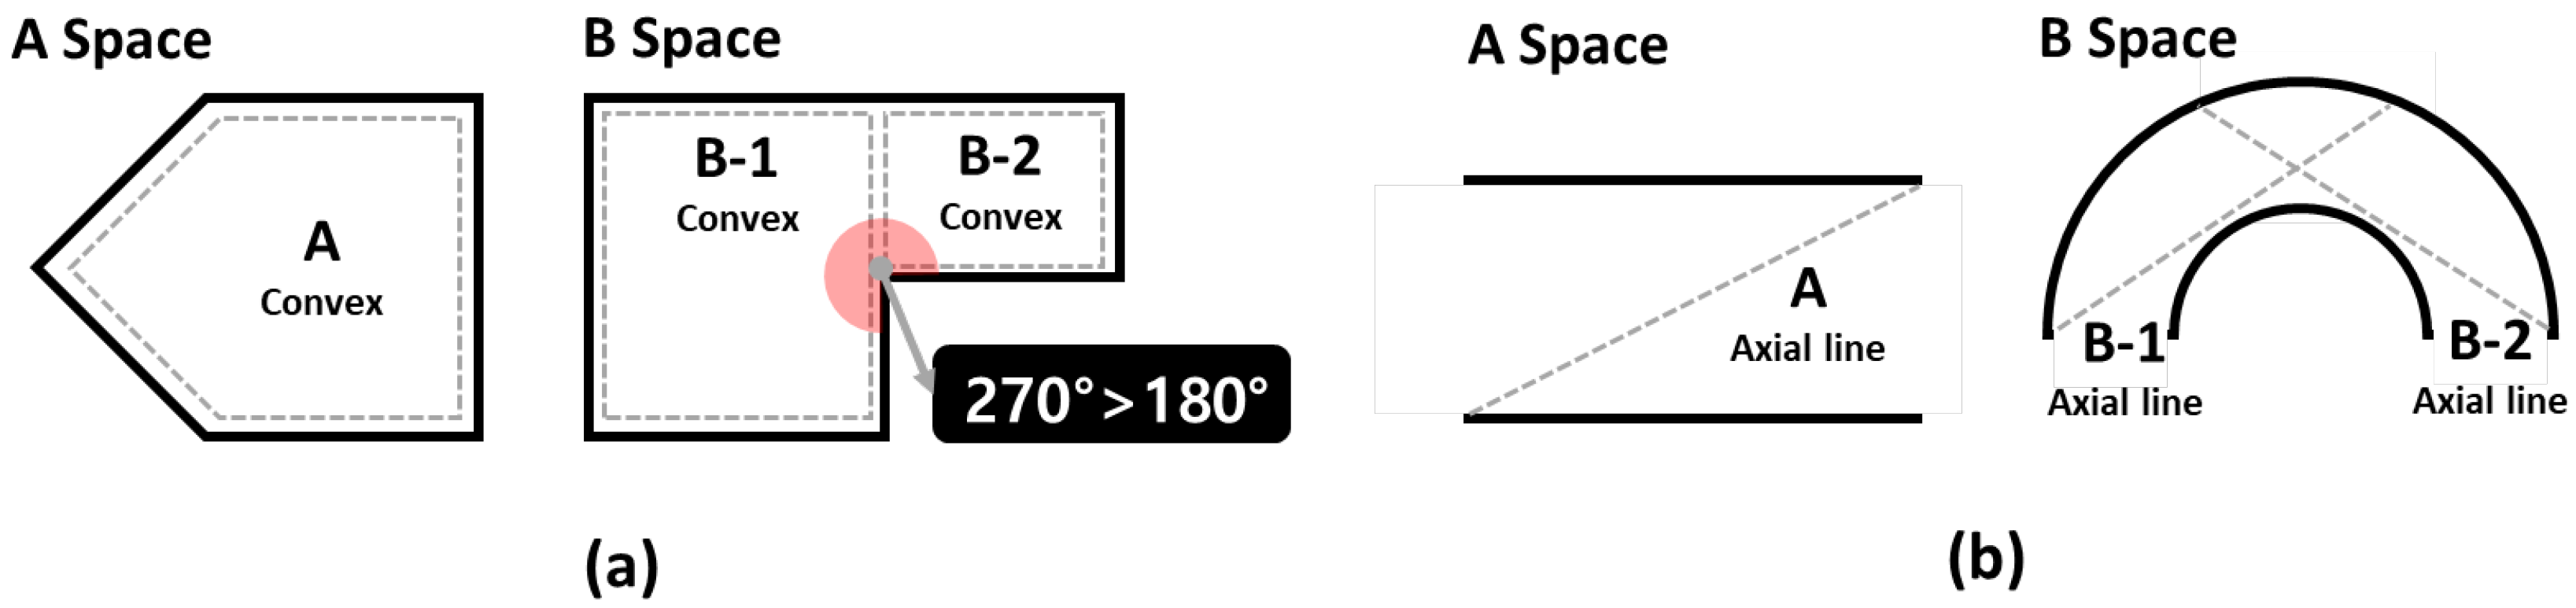
2.1. Space Syntax

Space syntax is a methodology for analyzing spatial layouts and configurations conceived by Hillier and Hanson [38]. Space syntax generally uses convex and axial maps to analyze a given space [39,40]. Segment maps allow us to represent space by improving axial maps by introducing the concept of angle and distance based on conventional axial maps [41]. Here, convex space defines the unit of space with the closed spatial area, which can be seen as a polygon with all interior angles not exceeding 180°. As opposed to the convex space, when humans recognize a space, the axial map can express it with lines connecting the visual maximum points of the connected spaces, and the convex space and the axial map define the number of spaces that are passed from a specific space to another as spatial depth [16,42]. In other words, when moving from a space A to the nearby D connected to A, the spatial depth between A and D is 1, and the graph that arranges the connection of several spaces by spatial depth expressing the connecting relation is called a J-Graph (Figure 1). Calculated from such a concept of spatial depth is the Total Spatial Depth (TSD) [16]. Furthermore, in the design of the convex space as shown in Figure 2, all interior angles of space A do not exceed 180°. Thus, the convex can be designed by referring to the space, but in space B, the interior angles do exceed 180°. Hence, space B should be segmented into B-1 and B-2 and regarded as two spaces in the process of analyzing spatial structure. The axial map also conforms to similar design criteria, and if a space is shown in a bent form, the axial lines should be separated so that each axial line can recognize the space at once. Generally, the analysis based on an axial map stresses the dynamic aspects and is often used in analyzing external spaces, whereas the convex space is more useful in reflecting static spatial characteristics and is used mainly in analyzing internal spaces [16,43]. In space syntax (Table 1), integration indicators are generally classified into global and local integration. These indicators have proven relevant to space use patterns and social, cultural, economic, and political phenomena [44]. In addition, the intelligibility index was used because of the need to recognize urban structure to analyze the accessibility of museums in Seoul, which is calculated using Equations (1)–(3) below. Table 2 shows the definitions of the symbols in the equations [29]. Local integration allows us to track the accessibility and density of use of a specified space by considering up to three spatial depths adjacent to the space [45]. Intelligibility can be explained by the R2 correlation coefficient calculated by the correlation between the global and local integration [46]. The closer the value is to 1, the more systematic and recognizable the space [47].
M D = T S D i = s = 1 m S × K s K 1
D n = 2 n l o g 2 n + 2 3 1 + 1 n 1 n 2
I i = D n 2 n 2 k = 1 n d i , k n 1 1
As shown in Figure 3, the concept of a general axial map is calculated by the intersections of line b and lines a, c, and d. However, the segment map is subdivided into a1, a2, b1, b2, b3, b4, c1, c2, d1, and d2 by considering the actual distance, and enables us to derive more realistic results by including changes in the axial line angles formed by segmentation [48]. In addition, setting a specific distance radius in a segment map enables us to measure the local travel angle-weighted integration within the radius distance. The weighted travel angle is usually in the range of 4 to 1024. When set to 1024, all roads with an angular change of at least 0.35° from a straight road are considered in the calculation. This study weighted all the parts with angular changes compared to straight roads to explain the results clearly. In other words, the weighted angle was set to 1024.

2.2. Range Settings

Although we can understand the structural relationship of urban topology by using segment maps, this study analyzed the accessibility of museums considering the accessibility, travel angle, and limit distance shown in the topological structure. In other words, the topological accessibility corresponding to the topological structure was calculated using axial maps, and the accessibility of museums considering the travel angle and the limit distance was calculated based on segment maps. The first question is whether the increase in the total number of spaces in the calculation formula of space syntax would affect the results and the research method’s validity. The second is the difficulties in interpreting a pure topological structure because the segment map is already a concept that includes angular weighting.
Assuming that people mainly use public transportation to access tourist spots in a cultural city, Yoon (2006) argued that the radius of the core station district is set to 250 m, that of the station district within a walking distance to 600 m, and that of the connecting transportation district to 2200 m by averaging the spatial scope of the station district from three different subway lines [49], and Kim (2010) proposed the radius of the subway station and bus station within a walking distance to be 672 m and 472 m, respectively, by considering the population of the neighboring district within the radius of 1000 m, the distance to the central station, and transfer [50]. Furthermore, Lee set the radius of the walking distance to be 400–500 m and 550–650 m, respectively, by dividing the area into the non-residential and residential centers [51]. As shown in previous literature, each scholar had somewhat different opinions about the spatial scope of a station district by research topics, but, generally, the scope of the distance that can be reached by walking was between 250 m and 2200 m. In addition, according to a survey conducted by the Ministry of Land, Transport and Maritime Affairs in 2012 [52], the cumulative frequency of taxi rides for distances of less than 2, 2–3, 3–4, 4–5, and more than 5 km were 34.9, 50.0, 60.1, 67.3, and 100.0%, In other words, if the moving distance is over 2 km, people are more likely to take a taxi, and, thus, it was determined to be reasonable to set the walking distance to be less than 2 km. Such a result is similar to the scope of the radius of a walking distance shown in previous literature, and, thus, this study set the maximum distance to 2000 m. Hong (2010) [53] suggested that the maximum cognitive distance for humans and landscapes was 250 m. Therefore, this study set the range in intervals up to 2000 m based on a 250 m radius to observe changes in accessibility according to the limit distance settings and analyzed the accessibility of museums by limiting the scope to a walking distance.

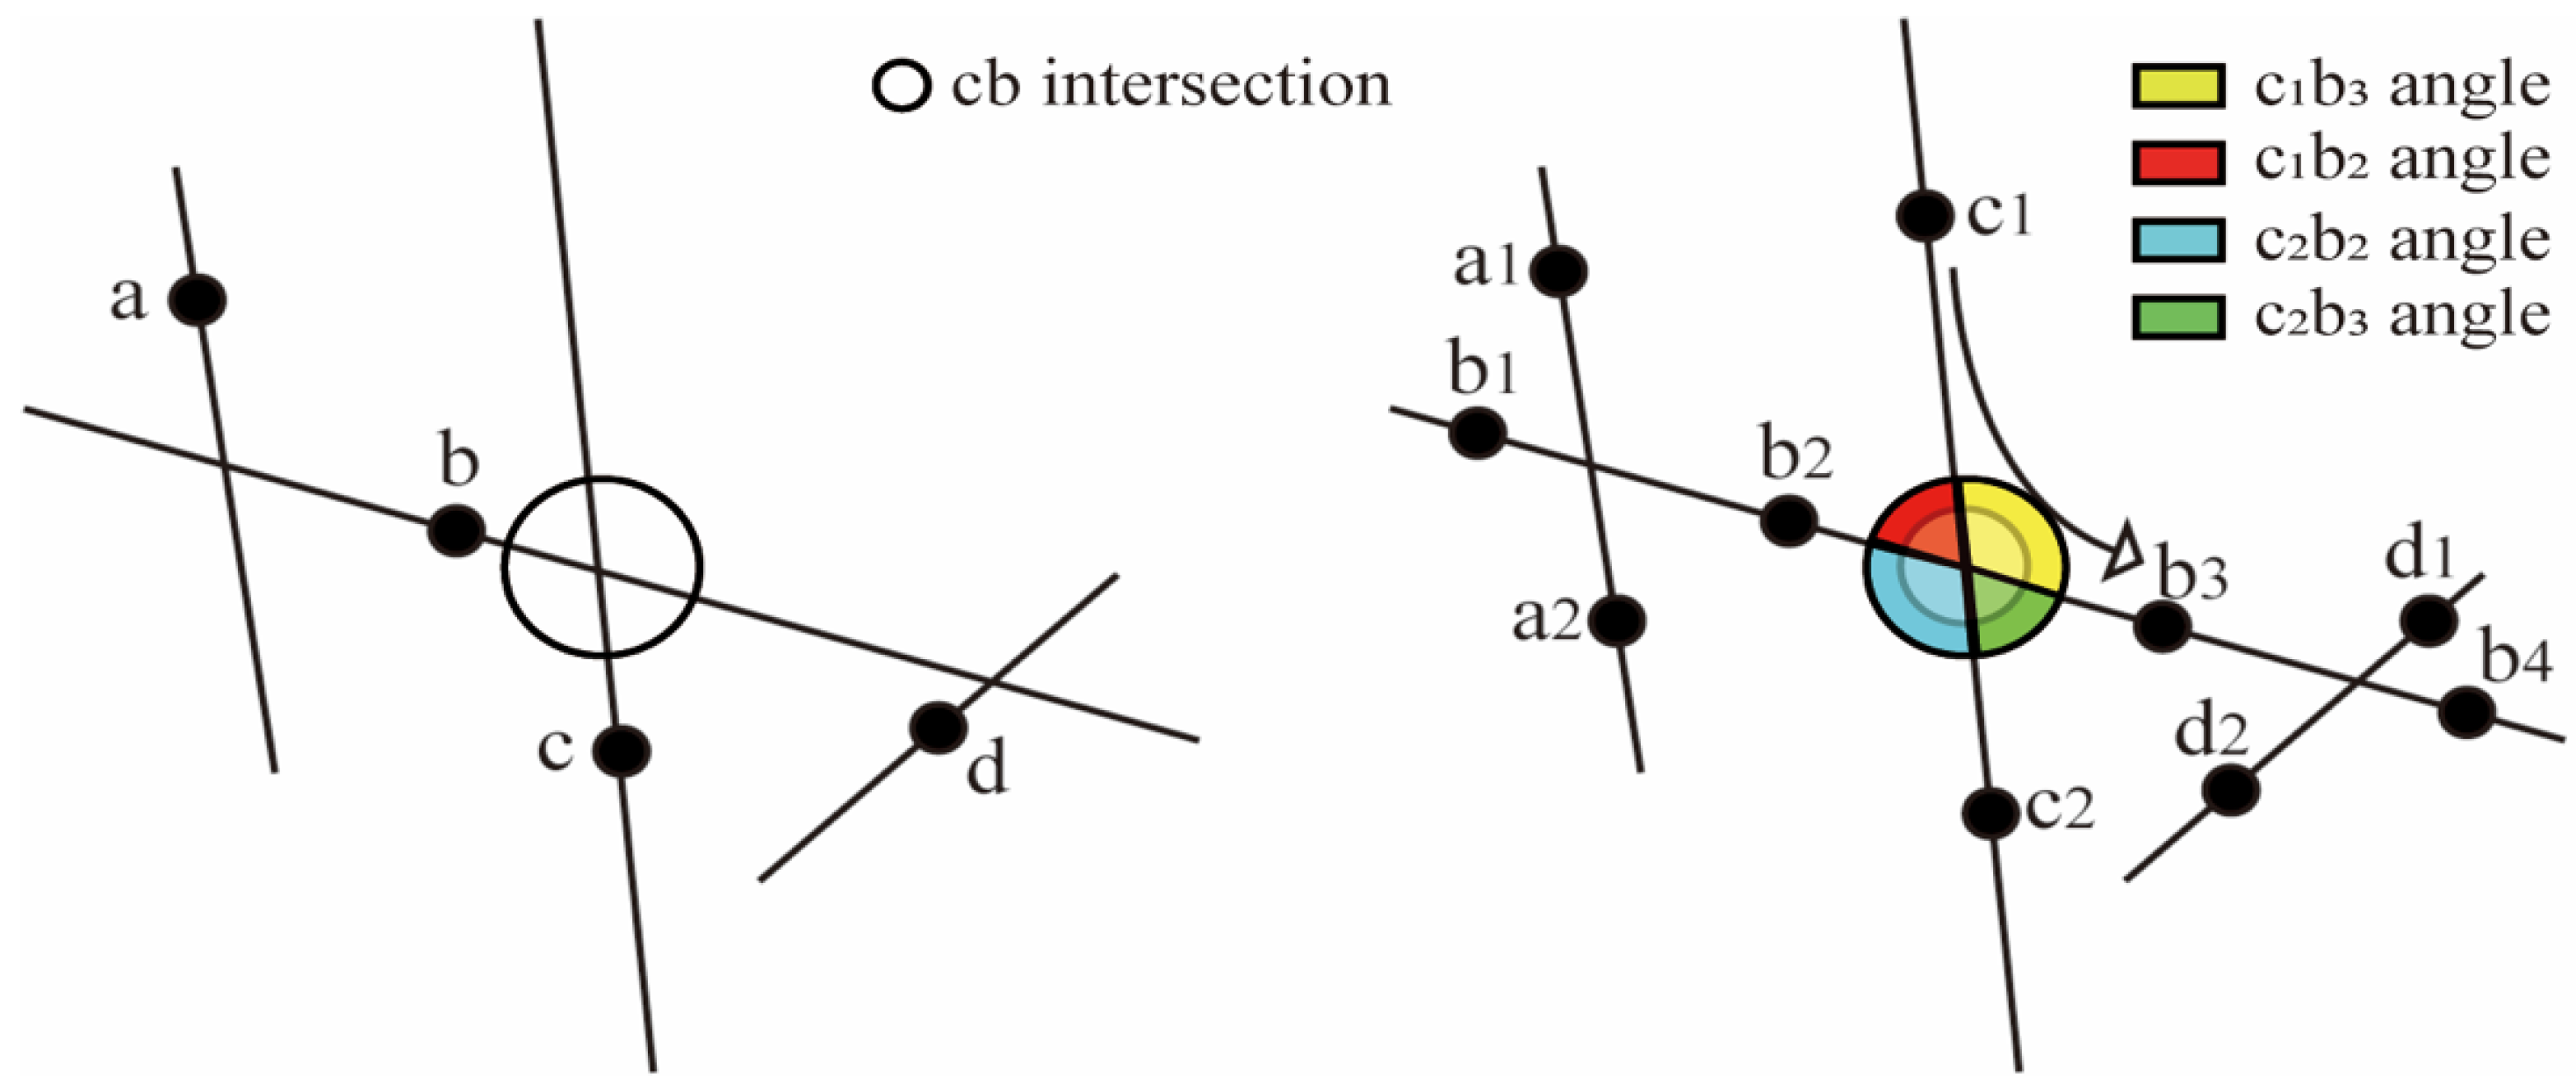
2.3. Research Method

Basic information about museums in Seoul was examined by referring to the Overview of National Cultural Infrastructure [54] published in 2021 by the Ministry of Culture, Sports and Tourism, and the GIS data of road sections in Seoul [55] to create axial maps were based on the updated version in 2022. GIS data includes roads that prohibit access to pedestrians, so they were removed from the analysis. The GIS data file was converted into a CAD file to establish the same unit standard, and then the scale was adjusted to a 1:1 metric standard to prepare axial maps. The overall research process is as follows.
The distribution of museums was checked based on the created urban space axial map of Seoul. Based on the results, the hierarchy of urban space in Seoul was analyzed to understand the status and derive each museum’s global and local integration. After converting to a segment map, the accessibility indicators of the museums were organized according to the weighted travel angle and limit distance settings.
In terms of the travel angle and limit distance settings, the weighted angle was set to 1024, and the limit distance to 250, 500, 750, 1000, 1250, 1500, 1750, and 2000. In order to make the derived data more readable, the absolute values of all indicators were organized in descending order and then converted to relative values within the range of 0.000–1.000 using Equation (4) below. Table 3 shows the interpretations of the symbols in the equation [16].
A r = 1 N x N m i n N m a x N m i n
Finally, to analyze the urban spatial accessibility of museums, correlation analyses were conducted between the global integration and local integration, and the fixed weighted travel angle of 1024 and the relative values of the accessibility index at the limit distance of 250 m, 500 m, 750 m, 1000 m, 1250 m, 1500 m, 1750 m, and 2000 m. The reason is that the polynomial curve fitting analysis is only significant when the derived relative values are mathematically correlated. After confirming the correlation, a goodness-of-fit analysis was performed using variables with significance. Insignificant variables were removed from this study.
All indicators related to urban hierarchy were calculated using the UCL Depth Map, and the Origin 2019b software package was used for correlation analysis and polynomial curve fitting analysis.

3. Analysis and Discussion

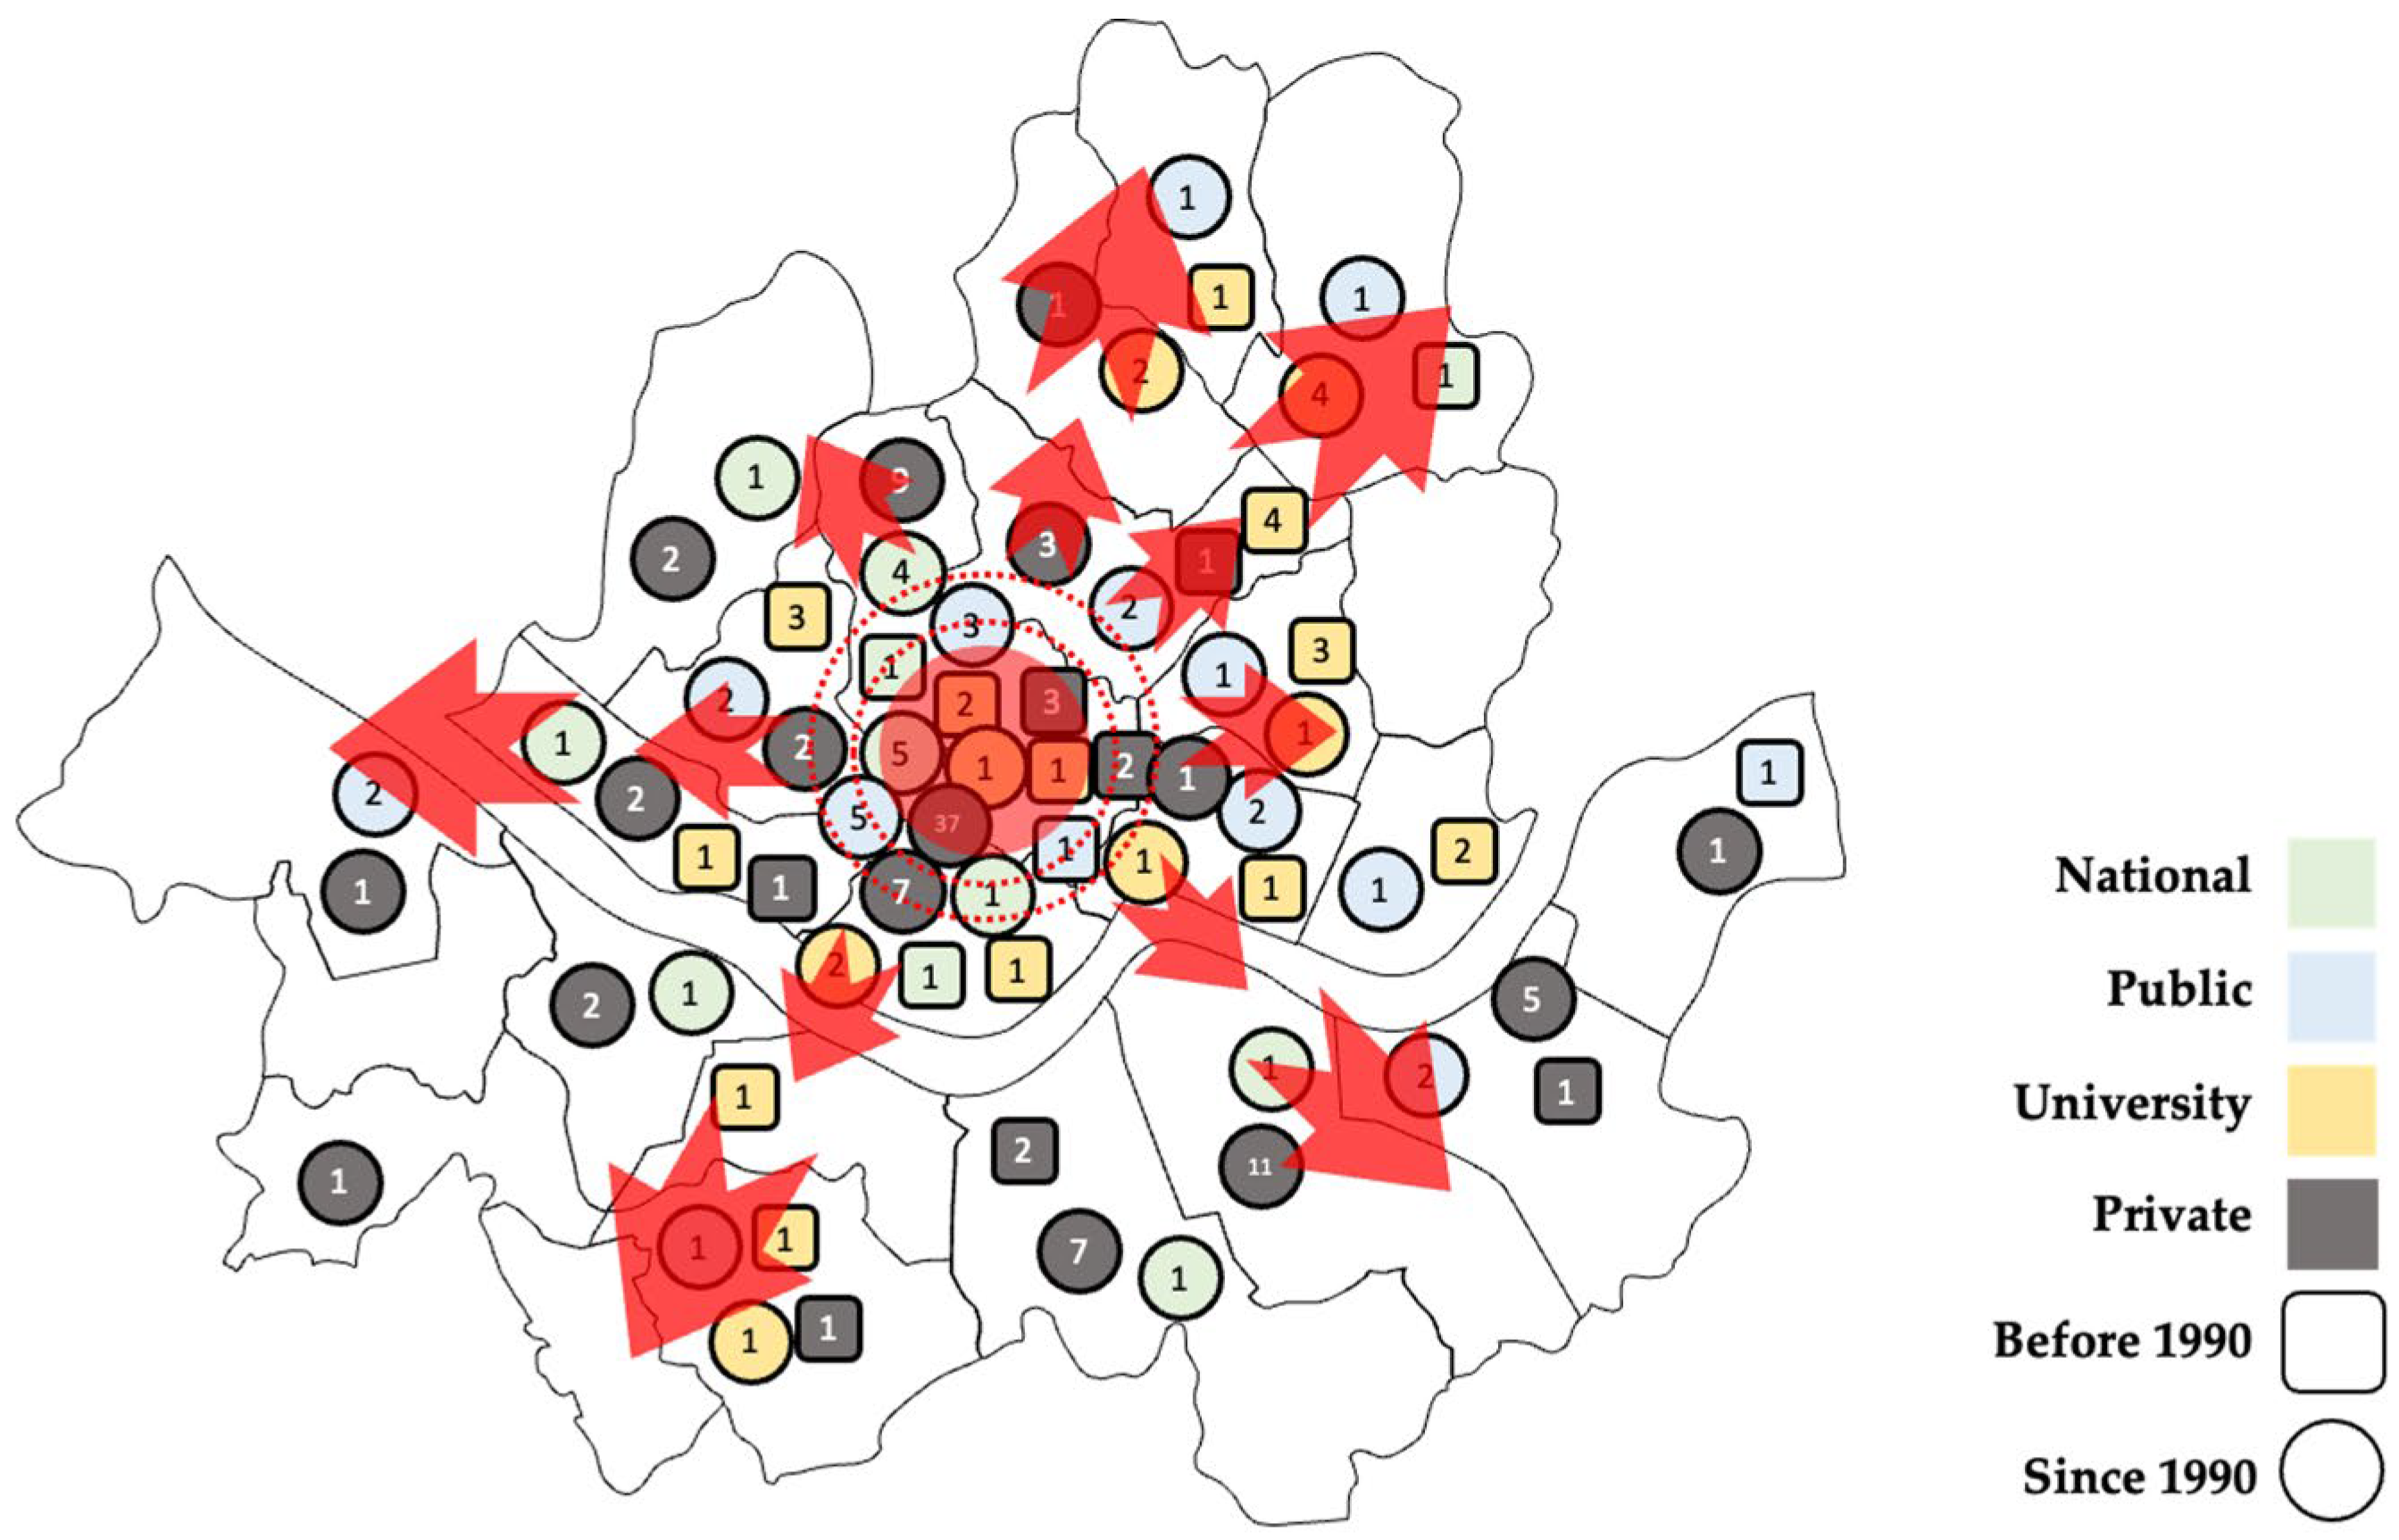
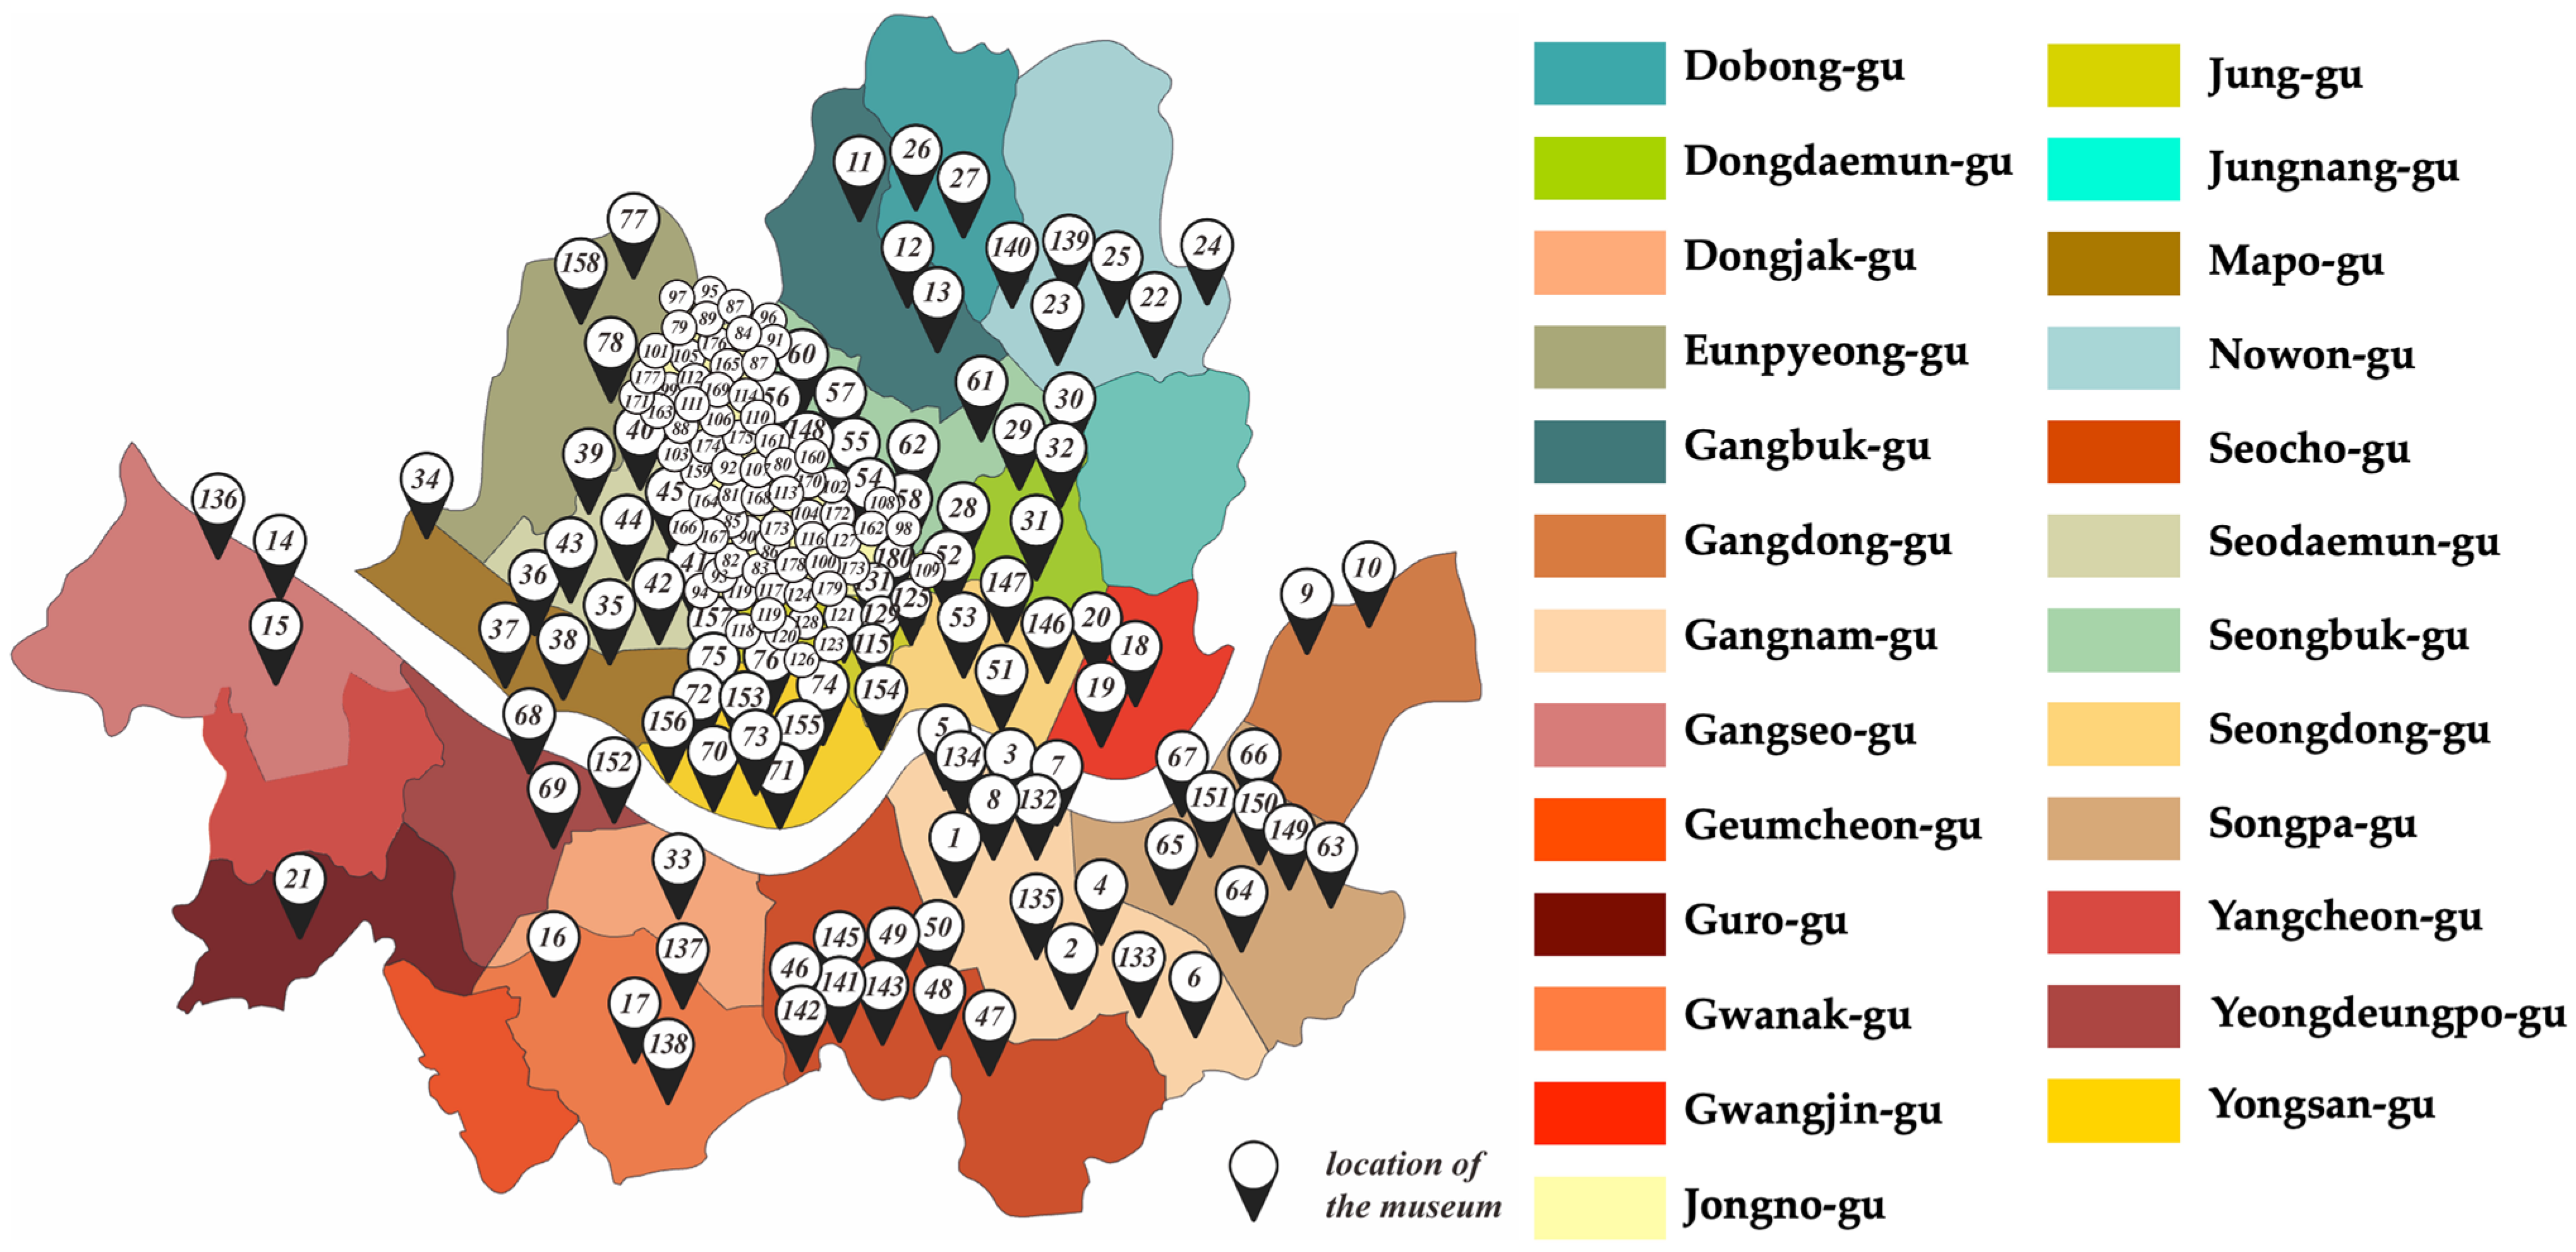
3.1. Distribution and Urban Hierarchy of Museums in Seoul

A total of 180 museums in Seoul were registered in the 2021 Overview of National Cultural Infrastructure, of which 43 were national and public museums, 104 were private museums, and 33 were university-affiliated museums. These numbers indirectly show that private organizations, not the government, lead the operation of cultural facilities and cultural promotion in Seoul. Additionally, most of the 37 museums built before 1990 in Seoul, the primary analysis target in this study, were affiliated with universities. Among the 143 museums that opened after 1990, 12 were affiliated with universities, 38 were national museums, and 93 were private museums. Figure 4 shows the distribution and expansion trends of museums built before and after 1990 by operating entity. This proves that, since 1990s, Seoul has transformed into a cultural city by focusing on cultural experience and promotion with the increase in the number of museums. Furthermore, the museums in Seoul were concentrated relatively in Jongno-gu and Jung-gu, but those established after 1990 tended to spread to the west in Gangseo-gu, the southeast in Seocho-gu, Gangnam-gu, and Songpa-gu, and the northeast in Gangbuk-go, Dobong-gu, and Nowon-gu; based on the Han River, the distribution density of the museums north of Han River is higher than in the south. The detailed distribution of the museums is shown in Figure 5.
A total of 167,059 axial lines were created by referring to the GIS data of Seoul constructed by the National Spatial Data Infrastructure Portal. As a result of investigating the status of urban hierarchy, the maximum and minimum values of global integration and local integration that can explain accessibility were 0.569, 0.381, 6.001, and 0.333, respectively, and the average values were 0.381 and 1.574 (Table 4).
As shown in Figure 6, the areas in Seoul with a high overall hierarchy on the global and local integration graphs were concentrated in Dongdaemun-gu, Seongdong-gu, Gwangjin-gu, Gangnam-gu, and Seocho-gu, but museums were concentrated in old downtown areas such as Jongno-gu and Jung-gu. This outcome is considered the result of urban development and expansion planned in Seoul’s development [22]. In other words, while building and installing museums in areas such as Jongno-gu and Jung-gu may have been reasonable in the past, today, the downtown area has moved to Gangnam-gu due to urban development, urban expansion, and government policies. In addition, the intelligibility of Seoul is 0.278, which is a considerably low result, indicating an urban space with low overall recognition.

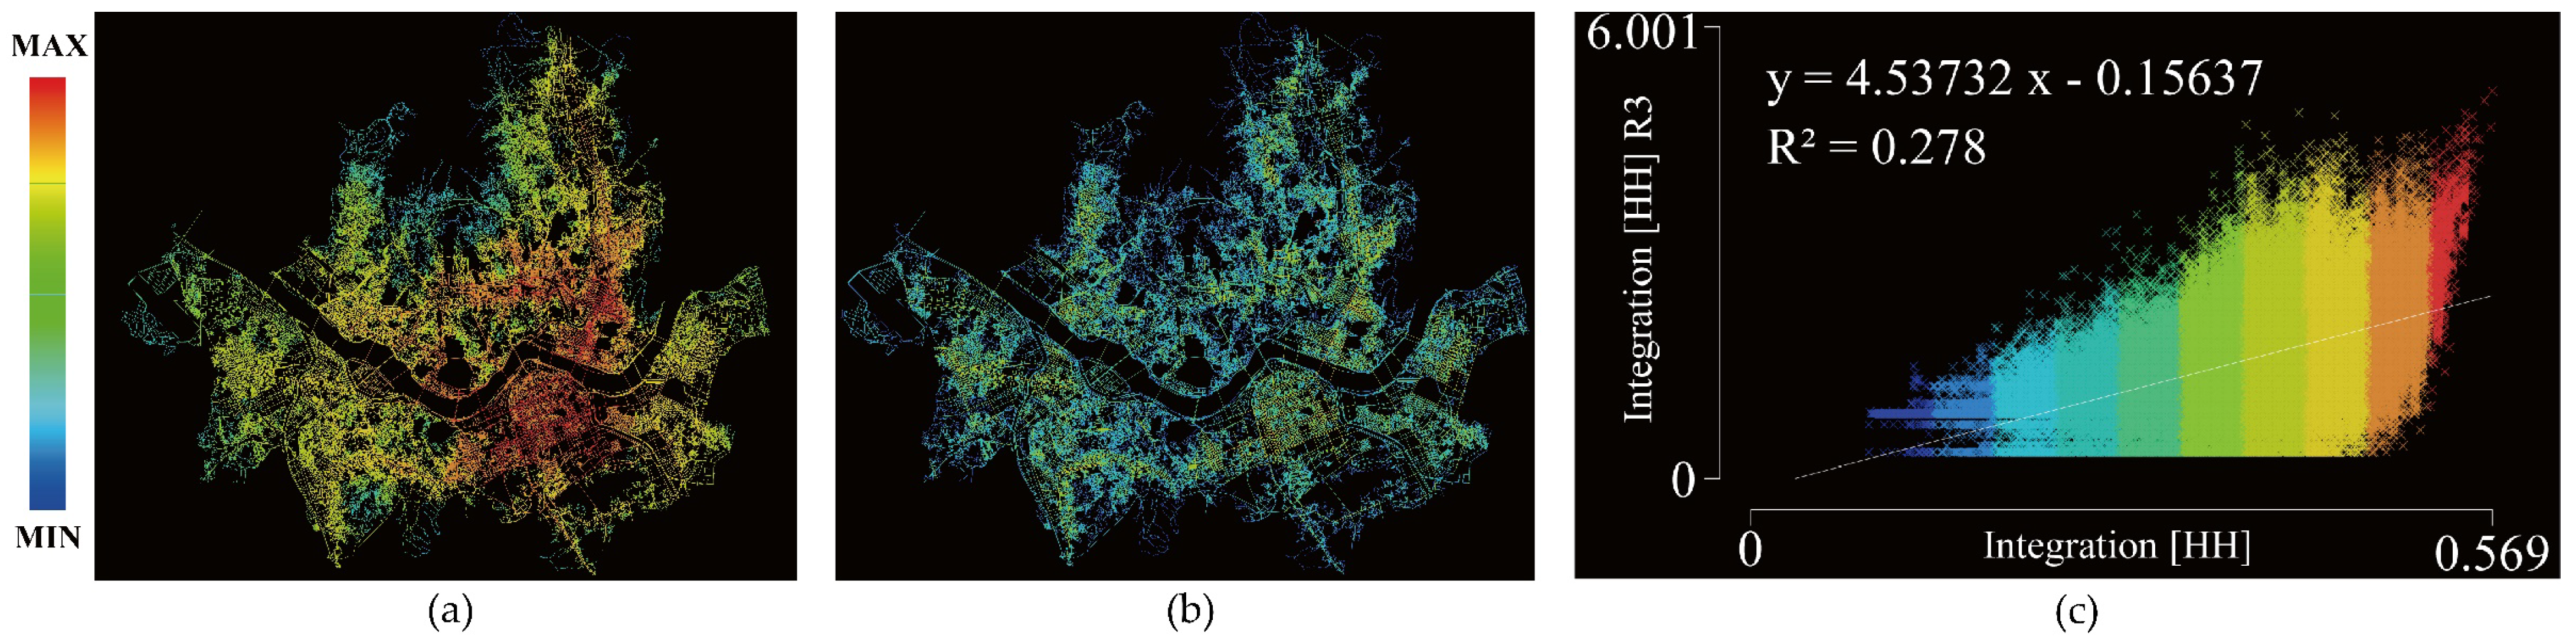
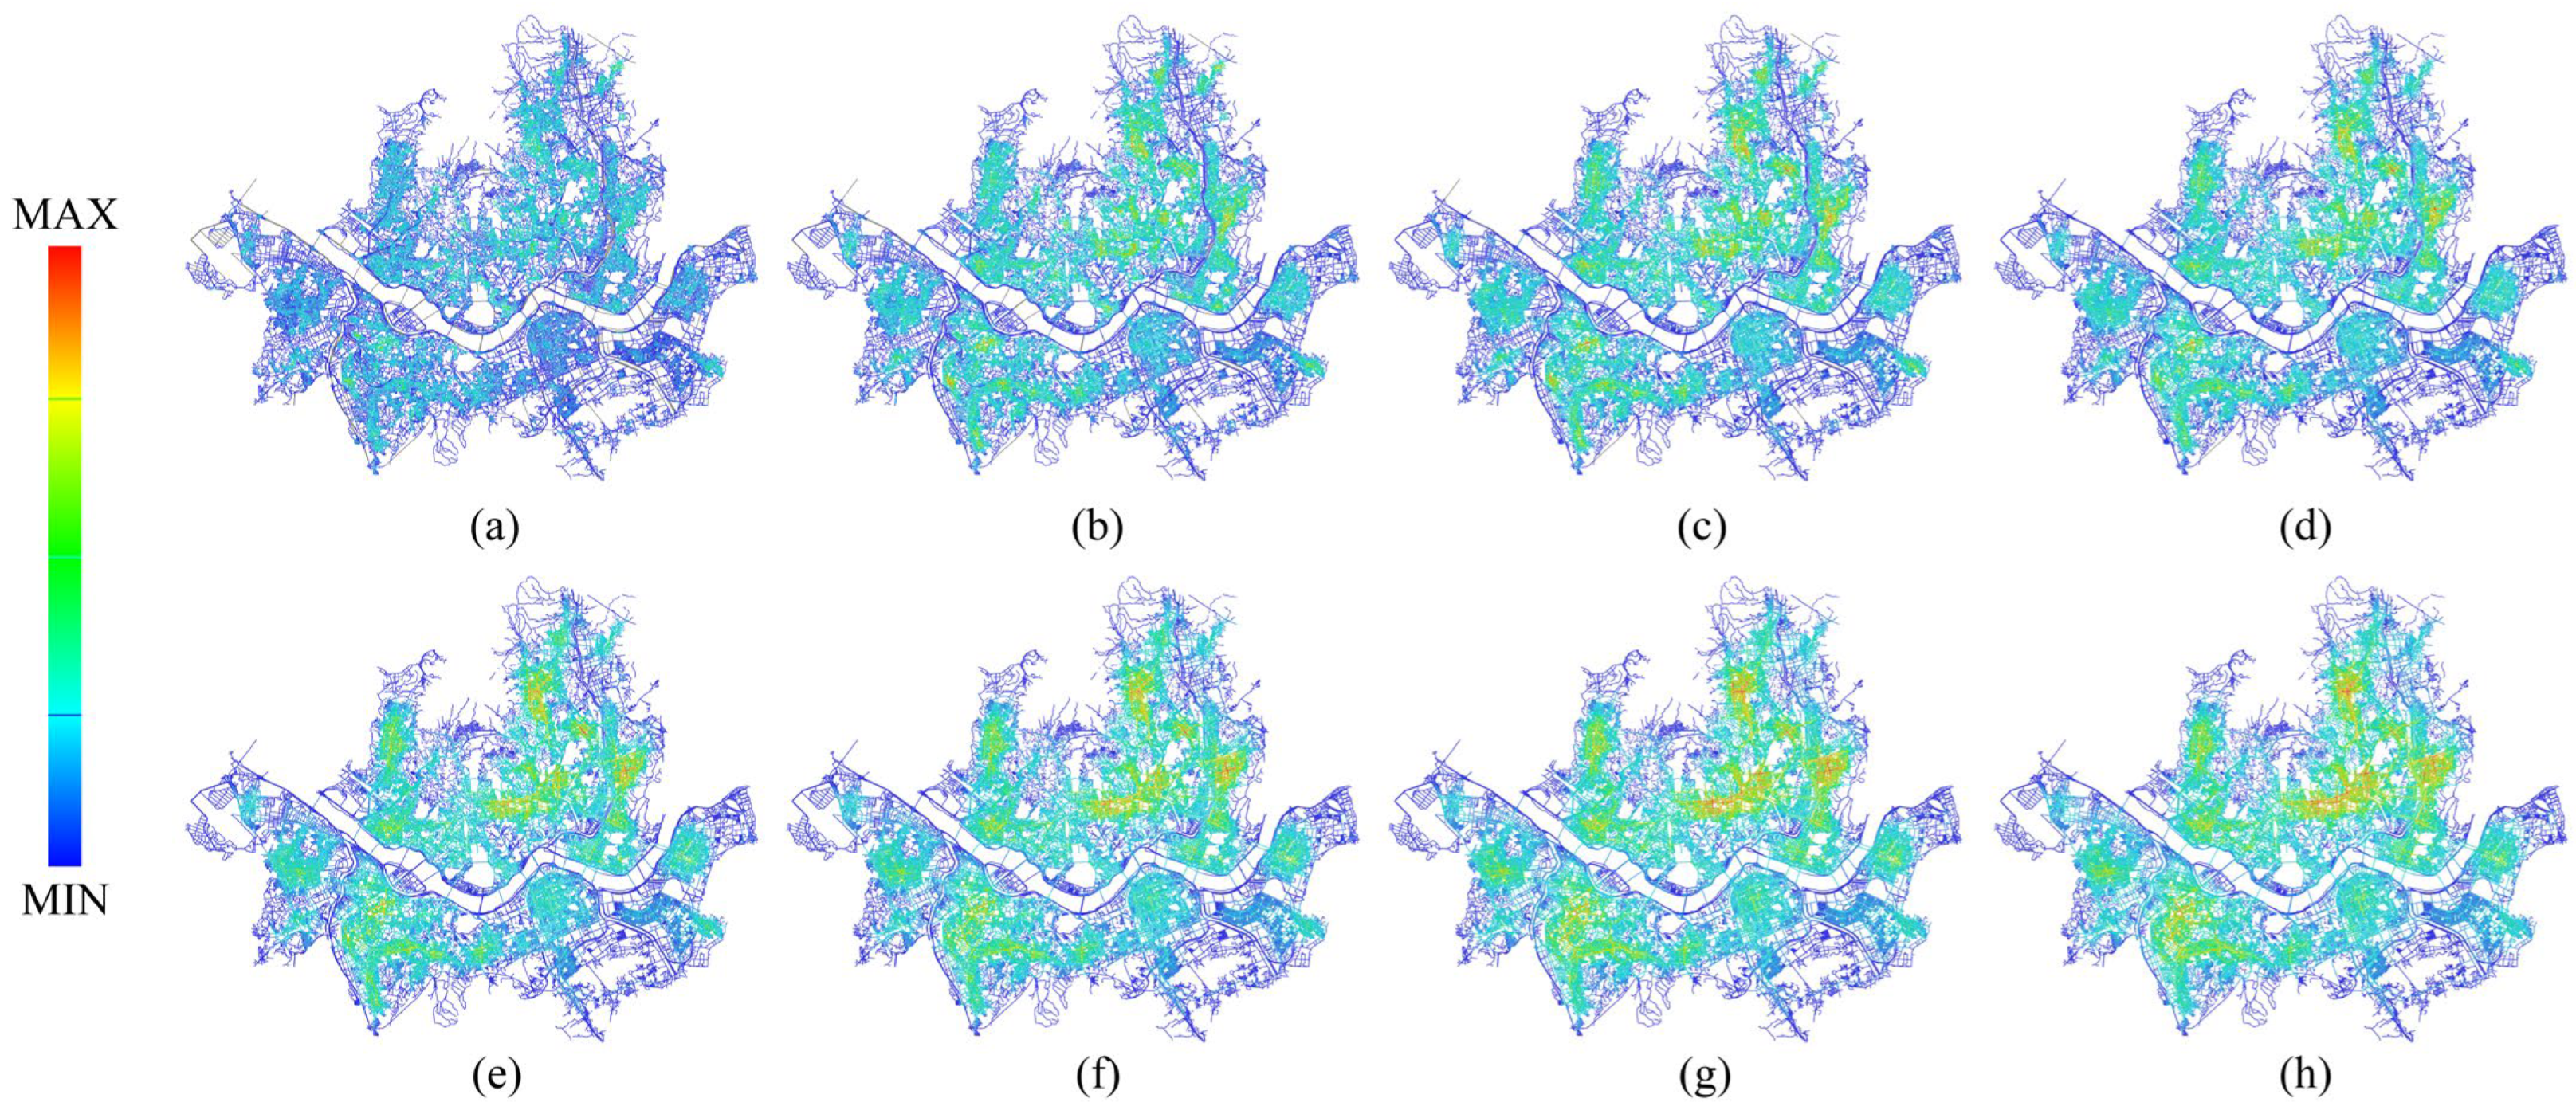
3.2. Correlation between Changes in Museum Accessibility and Urban Accessibility According to Travel Angle and Limit Distance Settings

As shown in Figure 7, the accessibility of Seoul according to the weighted travel angle and limit distance settings did not show a clear trend in areas with high integration in the 250 m and 500 m limit distance ranges and were relatively dispersed. After setting the limit distance range to at least 750 m, areas with changes in integration began to appear clearly. In particular, it was possible to observe significant changes in the areas adjacent to Jongno-gu, Jung-gu, and Dongdaemun-gu, as well as in Jungnang-gu and Seongbuk-gu, when the limit distance setting was extended. In general, when referring to urban hierarchy, Gangnam-gu had the highest accessibility, but after setting the travel angle and limit distance passing through space, the topological accessibility changed according to the limit distance settings. Therefore, as shown in Table 5, a correlation analysis of the accessibility indicators of all museums in Seoul was conducted. The results showed that they all were correlated except for the global integration and T1024_R250 (p < 0.01). This allowed us to predict that the global integration corresponding to museums in Seoul and T1024_R250 had factors that were not related or interpretable. However, there was a mathematically explainable causal relationship in the changes in museum accessibility according to the limit distance settings other than T1024_R250. In order to validate these predictions, this study set the global integration and local integration corresponding to museums as dependent variables, and the index values of the museums according to the weighted travel angle and extended limit distance settings were used as independent variables to perform a polynomial curve fitting analysis. As mentioned above, the museums’ global integration and T1024_R250 did not have a causal relationship in the correlation analysis, so this was excluded from the goodness-of-fit analysis.

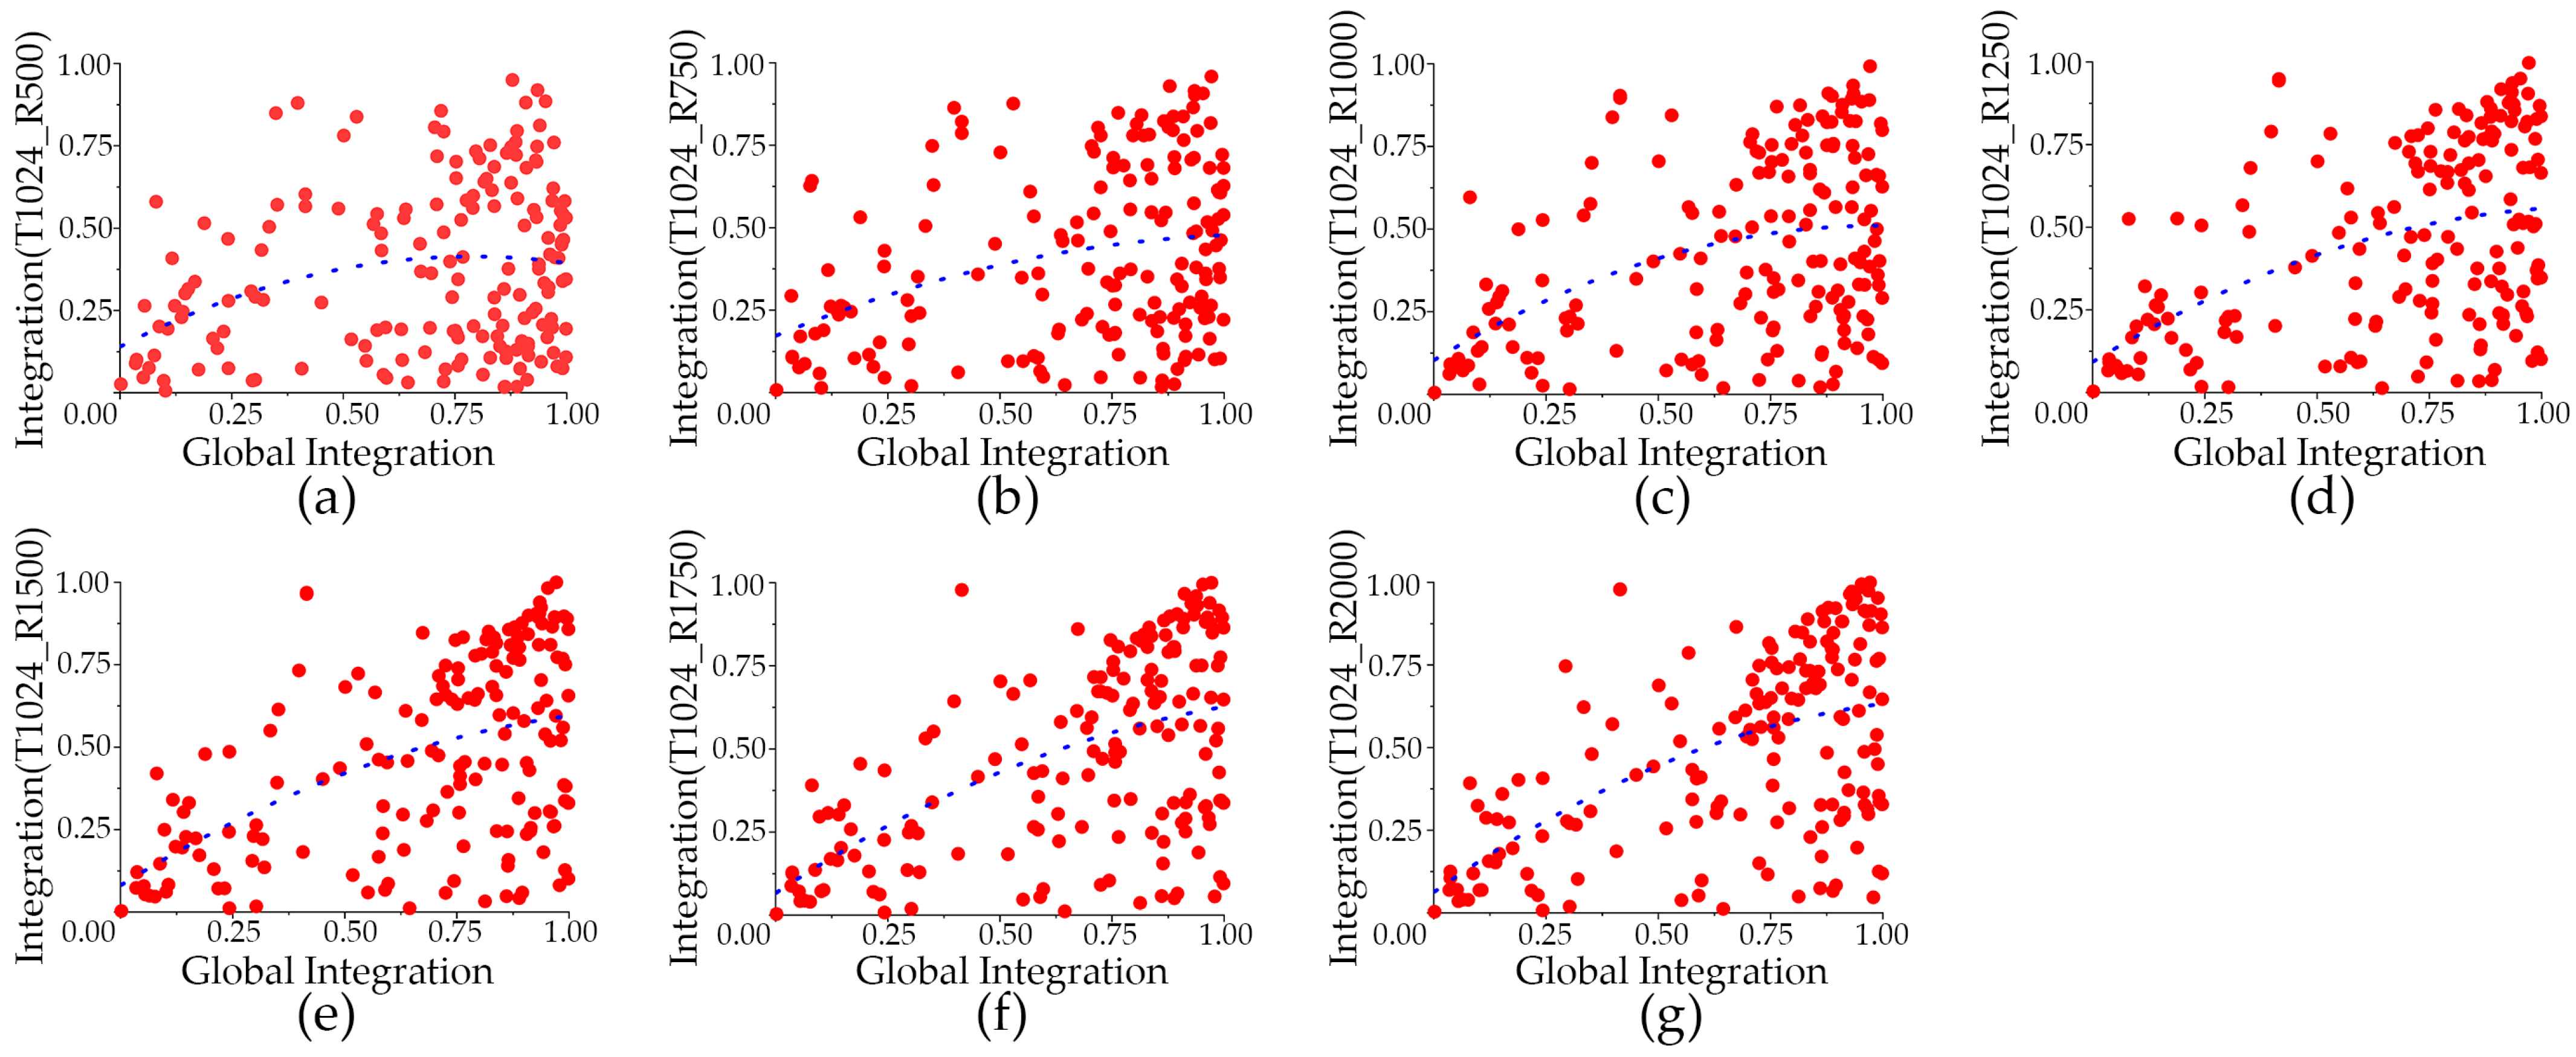
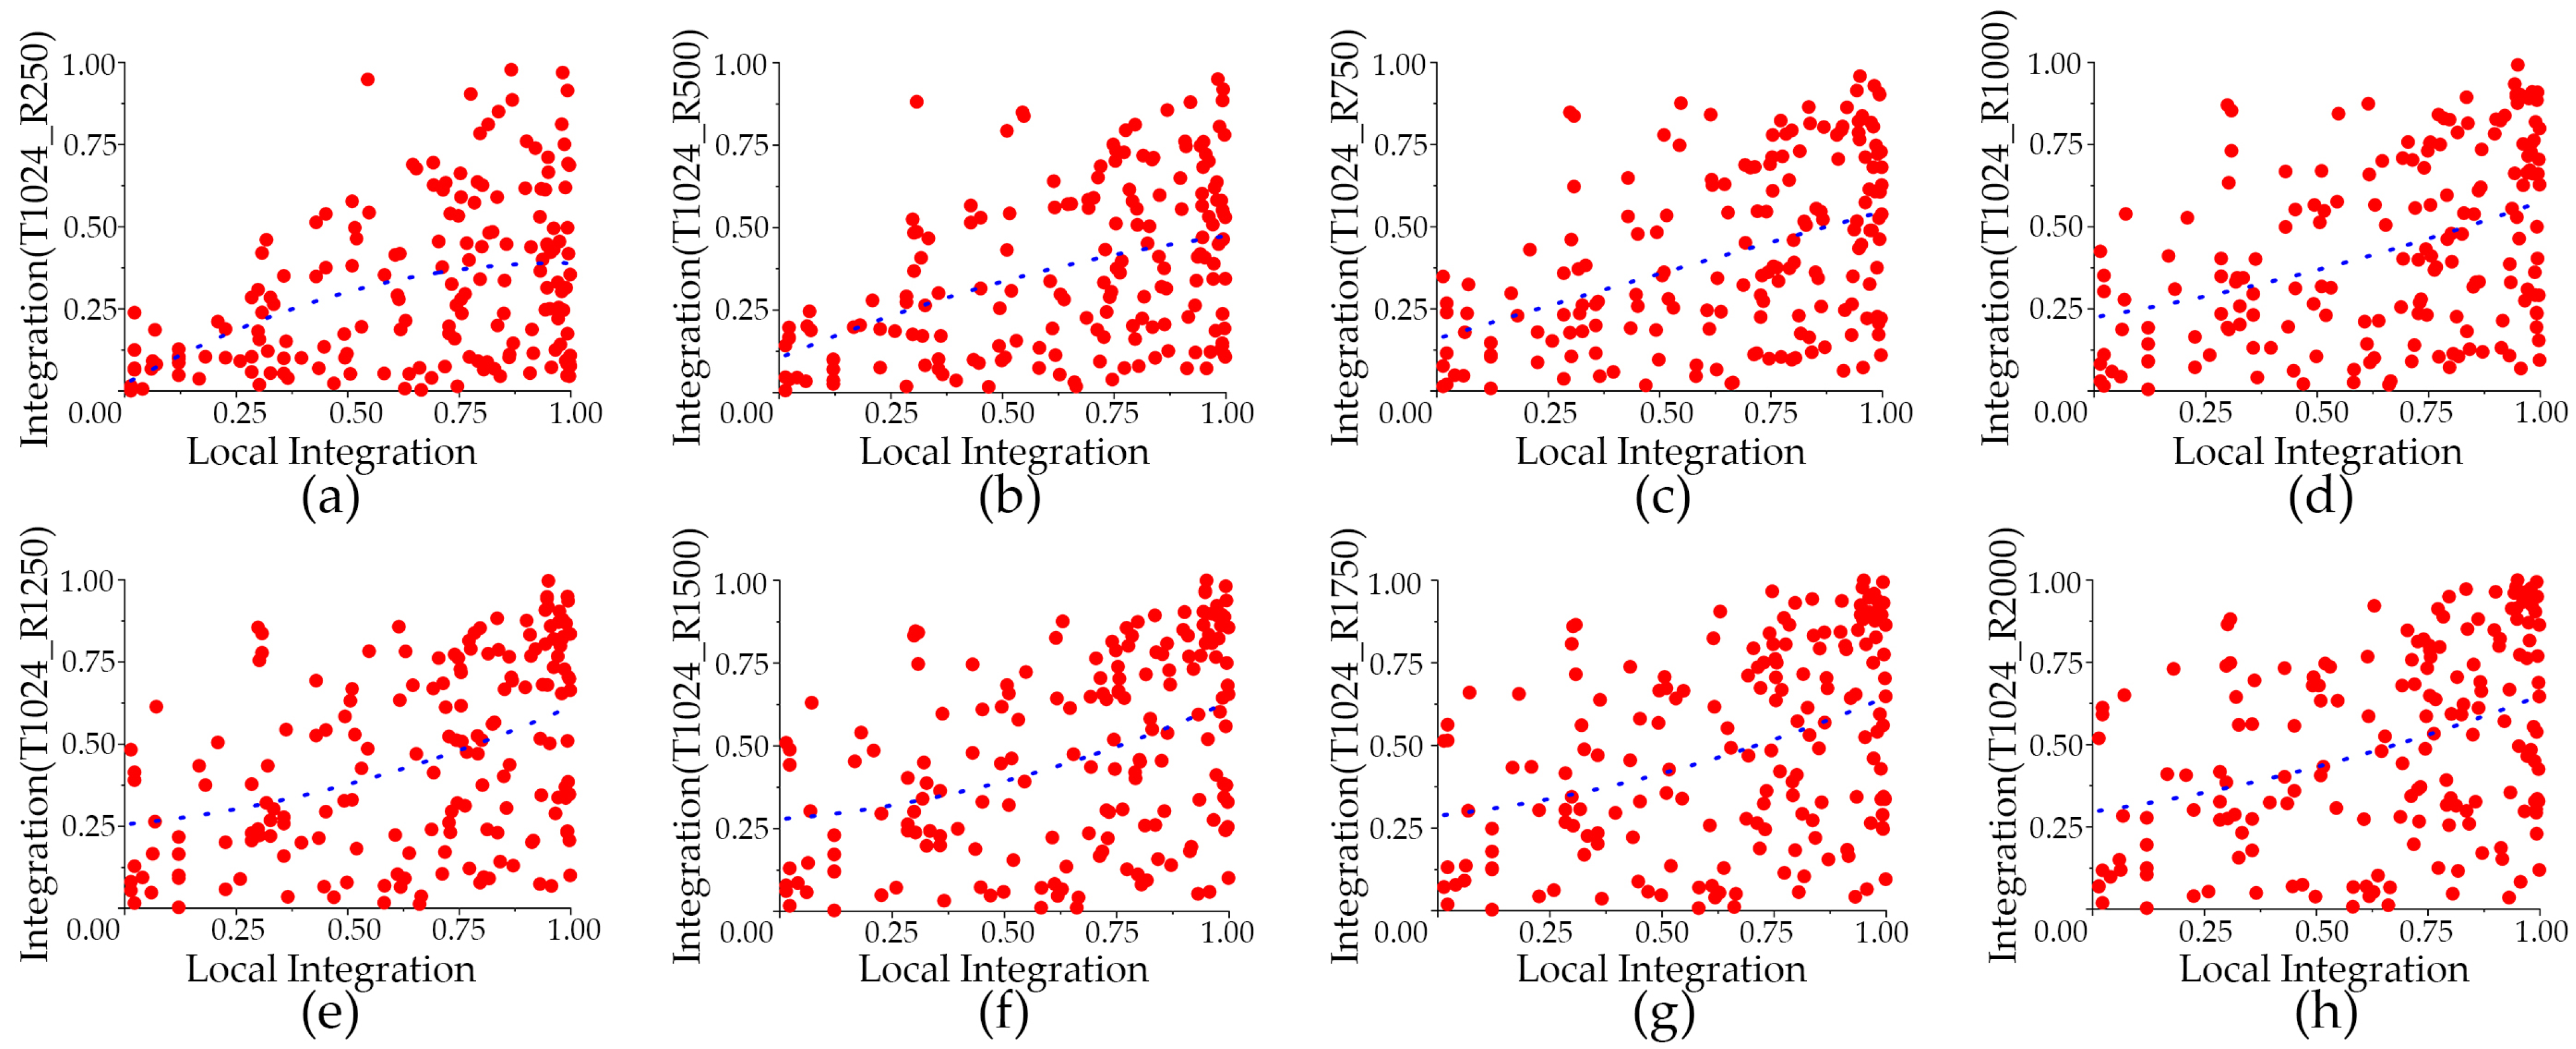
3.3. Polynomial Curve Fitting Analysis and Discussion

As shown in Table 6 and Table 7, the variances according to the global integration of the total urban space of museums in Seoul and the weighted travel angle and limit distance setting range were T1024 and R500 (F = 7.385, p < 0.01), T1024 and R750 (F = 10.105, p < 0.001), T1024 and R1000 (F = 17.661, p < 0.001), T1024 and R1250 (F = 23.390, p < 0.001), T1024 and R1500 (F = 29.271, p < 0.001), T1024 and R1750 (F = 34.944, p < 0.001), and T1024 and R2000 (F = 36.314, p < 0.001), respectively, and the ANOVA results of the local integration and weighted travel angle and limit distance setting range were T1024 and R250 (F = 18.684, p < 0.001), T1024 and R500 (F = 19.096, p < 0.001), T1024 and R750 (F = 20.975, p < 0.001), T1024 and R1000 (F = 16.869, p < 0.001), T1024 and R1250 (F = 18.078, p < 0.001), T1024 and R1500 (F = 17.030, p < 0.001), T1024 and R1750 (F = 15.888, p < 0.001), and R2000_I (F = 14.642, p < 0.001). The global integration and T1024 and R500 had a 0.01 significance level, and all others seemed to have a 0.001 significance level. So, it was confirmed that the independent variables according to the travel angle of museums and the limit distance setting range could explain the dependent variables (global integration and local integration) by a regression equation. Accordingly, Table 8 and Table 9 show the trend function equations and B1 and B2 intercepts of the goodness-of-fit analysis for the dependent and independent variables. Figure 8 and Figure 9 show the corresponding curve fitting plots.
The Residual Sum of Squares (RSS) and the coefficient of determination (R^2) according to the global integration of the total urban space of museums in Seoul and the weighted travel angle and limit distance setting range were T1024 and R500 (10.687, 0.077), T1024 and R750 (11.459, 0.102), T1024 and R1000 (11.488, 0.166), T1024 and R1250 (11.486, 0.209), T1024 and R1500 (11.435, 0.249), T1024 and R1750 (11.446, 0.283), and T1024 and R2000 (11.294, 0.291). The RSS of the independent variables T1024 and R250, T1024 and R500, T1024 and R750, T1024 and R1000, T1024 and R1250, T1024 and R1500, T1024 and R1750, and T1024 and R2000 corresponding to the local integration were 9.187, 9.524, 10.321, 11.574, 12.059, 12.762, 13.536, and 13.667, and the coefficients of determination were 0.174, 0.177, 0.192, 0.160, 0.170, 0.161, 0.152, and 0.142, respectively. The RSS of the global integration group maintained a relatively stable value, but the RSS of the local integration group gradually increased as the limit distance setting range was extended. The coefficients of determination in both groups were less than 0.4. Therefore, despite the correlation between the variables, the independent variable has a relatively large deviation in explaining the dependent variable. The discussion on the museum accessibility in Seoul offered the possibility of including factors in other areas besides the physical factors limited in this study, that is, the topological structure of space, the difficulty level in passing through the space, and mobility. In addition, the coefficient of determination in the goodness-of-fit analysis above was 0.4, which was below standard, but it tended to increase gradually as the limit distance setting range was extended.
The results above show no correlation between the global integration and T1024 and R250 among the indicators that can explain the accessibility of museums. These results indicate that accessibility, considering the minimum cognitive distance within Seoul, does not have a qualitative effect on the entire space. Moreover, according to the global integration and travel angle and limit distance settings, the RSS maintained a relatively stable range even if the limit distance setting range was different. However, in the group with the local integration set as a dependent variable, the RSS increased as the limit distance setting range extended. This outcome can be explained by the fact that the museums with limited spatial depth had more significant changes in accessibility as the walking distance from the urban space increased than the accessibility reviewed for the entire urban space. The correlation between the dependent variable and independent variable of the goodness-of-fit model could be explained with ANOVA in the global and local integration groups. However, compared to the local integration group, the coefficient of determination of the global integration group gradually increased as the corresponding limit distance setting extended. In other words, the maximum walking range was limited to 2000 m in this study, but when the limit distance was set to 2000 m or more, the coefficient of determination may gradually increase as the weighted range expands on the premise that the ANOVA reports a statistically significant result. When considering such aspects, it was determined that the future research would need to take into account the factors for expanding mobility in walking rather than a pure walking distance.

4. Conclusions

This study investigated the urban hierarchy and the distribution of museums in Seoul and examined the correlation between the accessibility of museums in the urban hierarchy and their accessibility according to the travel angle and limit distance settings. The main findings are as follows.
First, the physical accessibility of museums considering the minimum walking distance set in this research was not correlated with the accessibility of museums in the entire urban space of Seoul. This explains the fact that the physical locations of museums are somewhat isolated from the primary spaces in which people travel in terms of accessibility considering the minimum walking distance set in this study.
Second, the goodness-of-fit analysis showed that the accessibility of museums by travel angle and limit distance settings was more correlated with the accessibility of museums in the entire urban space than the urban accessibility of museums with limited spatial depth and the RSS showed a relatively stable state. Therefore, planning museums in Seoul based on the main space in which people travel would be more valuable in terms of physical accessibility than limiting a specific area and referring to its use density. It would also be a better measure to improve the awareness of physical paths for people who intend to visit museums in a cultural city.
Third, the independent variables corresponding to the travel angle and limit distance range in the global integration group can interpret the urban spatial accessibility of museums, but the coefficient of determination was low. This was attributed to the fact that the research scope was limited only to the walking distance and because the coefficient of determination gradually increased as the limit distance extended according to the global integration, travel angle, and limit distance settings.
The results above show that the urban accessibility of museums can be interpreted by limiting the walking distance in Seoul, but the coefficient of determination was low. Therefore, we believe it is necessary to supplement the research by considering future changes in museum accessibility due to vehicle travel distance. In particular, based on the results derived from this study, we realize the need for further research by comparing the results of tracking the circulation of people walking to museums. This will be facilitated by selecting a specific area that has good accessibility to museums in an urban space. This research is also a basic study examining the accessibility of museums in Seoul. Therefore, it is significant in securing reference materials for selecting locations for museums in Seoul in the future and is expected to promote the formation of museum clusters through physical access to nearby areas.

Author Contributions

Conceptualization, J.M. and X.Z.; methodology, X.Z.; writing—original draft preparation, X.Z.; writing—review and editing, J.M.; supervision, J.M. All authors have read and agreed to the published version of the manuscript.

Funding

This research was funded by a 2018 Research Grant from Sangmyung University.

Institutional Review Board Statement

Not applicable.

Informed Consent Statement

Not applicable.

Data Availability Statement

No additional data are available.

Conflicts of Interest

The authors declare no conflict of interest.

References

  1. Ashworth, G.J.; Tunbridge, J.E. The Tourist-Historic City; Belhaven Press: London, UK, 1990. [Google Scholar]
  2. Edwards, D.; Griffin, T.; Hayllar, B. Urban tourism research developing an agenda. Ann. Tour. Res. 2008, 35, 1032–1052. [Google Scholar] [CrossRef] [Green Version]
  3. Law, C.M. Urban Tourism: Attracting Visitors to Large Cities; Mansell Publishing Limited: London, UK, 1993; pp. 160–189. [Google Scholar]
  4. Ryu, C.H.; Kwon, Y.S. Elements that affect foreign tourists’ satisfaction: A case study in Seoul, Korea. Urban Des. Int. 2021, 26, 197–207. [Google Scholar] [CrossRef]
  5. Yu, Y.H.; Choi, M.G.; Jeong, J.Y. The effect of cultural city factors on urban identity and city brand equity. J. Inf. Technol. Appl. Manag. 2021, 28, 89–108. [Google Scholar] [CrossRef]
  6. De Carlo, M.; Canali, S.; Pritchard, A.; Morgan, N. Moving milan towards expo 2015: Designing culture into a city brand. J. Place Manag. Dev. 2009, 2, 8–22. [Google Scholar] [CrossRef]
  7. Xu, Y.; Rollo, J.; Esteban, Y. Evaluating experiential qualities of historical streets in Nanxun Canal Town through a space syntax approach. Buildings 2021, 11, 544. [Google Scholar] [CrossRef]
  8. PLAZA, B. Evaluating the influence of a large cultural artifact in the attraction of tourism: The Guggenheim Museum Case. Urban Aff. Rev. 2000, 36, 264–274. [Google Scholar] [CrossRef]
  9. Hyslop, D. Culture, regeneration and community: Reinventing the city. Int. J. Commun. Res. Engagem. 2012, 5, 152–165. [Google Scholar] [CrossRef]
  10. Van Aalst, I.; Boogaarts, I. From museum to mass entertainment: The evolution of the role of museums in cities. Eur. Urban Reg. Stud. 2002, 9, 195–209. [Google Scholar] [CrossRef]
  11. Thomas, N. The museum as method. Mus. Anthropol. 2010, 33, 6–10. [Google Scholar] [CrossRef]
  12. Stephen, A. The contemporary museum and leisure: Recreation as a museum function. Mus. Manag. Curatorship 2001, 19, 297–308. [Google Scholar] [CrossRef]
  13. Amato, F.; Chianese, A.; Mazzeo, A.; Moscato, V.; Picariello, A.; Piccialli, F. The talking museum project. Procedia Comput. Sci. 2013, 21, 114–121. [Google Scholar] [CrossRef] [Green Version]
  14. Marty, P.F.; Rayward, W.B.; Twidale, M.B. Museum informatics. Annu. Rev. Food Sci. Technol. 2003, 37, 259–294. [Google Scholar] [CrossRef]
  15. Suh, Y.K.; Gartner, W.C. Perceptions in international urban tourism: An analysis of travelers to Seoul, Korea. J. Travel Res. 2004, 43, 39–45. [Google Scholar] [CrossRef]
  16. Zhao, X.L. A Study on Urban Hierarchical Characteristics of Public Libraries-Focused on the Libraries in the Boundary District(gu) of Seoul, Korea. Ph.D. Thesis, Sangmyung University, Seoul, Korea, 2022. [Google Scholar]
  17. Hwang, K.; Schuetze, T.; Amoruso, F.M. Flood resilient and sustainable urban regeneration using the example of an industrial compound conversion in Seoul, South Korea. Sustainability 2020, 12, 918. [Google Scholar] [CrossRef] [Green Version]
  18. Yoon, J.; Lee, J. Adaptive reuse of apartments as heritage assets in the Seoul station urban regeneration area. Sustainability 2019, 11, 3124. [Google Scholar] [CrossRef] [Green Version]
  19. Lee, Y.K.; Lee, C.K.; Choi, J.W.; Yoon, S.M.; Hart, R.J. Tourism’s role in urban regeneration: Examining the impact of environmental cues on emotion, satisfaction, loyalty, and support for Seoul’s revitalized Cheonggyecheon stream district. J. Sustain. Tour. 2014, 22, 726–749. [Google Scholar] [CrossRef]
  20. Schmidt, M. Shaping Seoul: Employing Heritage in the Urban Regeneration Projects Seoullo 7017 and Again Sewoon; Leiden University: Leiden, The Netherlands, 2018. [Google Scholar]
  21. Shin, H. The punk and the post-developing city: Subculture-led urban regeneration in Seoul? City Cult. Soc. 2019, 19, 100295. [Google Scholar] [CrossRef]
  22. Jun, M.J.; Ha, S.K. Evolution of employment centers in Seoul. RURDS Rev. Urban Reg. Dev. Stud. 2002, 14, 117–132. [Google Scholar] [CrossRef]
  23. Kim, M.H.; Moon, J.M. A Study on the correlation between viewing behavior and exhibiting methods in museums-focusing on viewing behavior on weekdays and weekends in medium sized history museums in Korea. J. Asian Archit. Build. Eng. 2013, 12, 173–180. [Google Scholar] [CrossRef] [Green Version]
  24. Ministry of Culture, Sports and Tourism, 2018 Survey on International Visitors. Available online: https://www.mcst.go.kr/kor/s_notice/press/pressView.jsp?pSeq=17270 (accessed on 10 May 2022).
  25. Museum Knowledge Information System. Available online: https://www.mcst.go.kr/kor/s_notice/press/pressView.jsp?pSeq=17270 (accessed on 10 May 2022).
  26. Gospodini, A. European cities in competition and the new ‘uses’ of urban design. J. Urban Des. 2002, 7, 59–73. [Google Scholar] [CrossRef]
  27. Lee, J.Y.; Choi, S.D. Spatial distribution characteristics analysis of cultural infrastructure in Seoul: A focus on distribution of population and density of use. J. Tour. Stud. 2018, 30, 61–80. [Google Scholar] [CrossRef]
  28. Park, T.S.; Lee, M.Y. Accessibility measure of cultural facilities using urban network analysis. KSCE J. Civ. Eng. 2015, 35, 455–464. [Google Scholar] [CrossRef] [Green Version]
  29. Hillier, B.; Hanson, J. The Social Logic of Space; Cambridge University Press: Cambridge, UK, 1984. [Google Scholar]
  30. Ozbil, A.; Gurleyen, T.; Yesiltepe, D.; Zunbuloglu, E. Comparative associations of street network design, streetscape attributes and land-use characteristics on pedestrian flows in peripheral neighbourhoods. Int. J. Environ. Res. Public Health 2019, 16, 1846. [Google Scholar] [CrossRef] [PubMed] [Green Version]
  31. Cho, H. Angular-Weighted ERAM Model for Space Analysis. Ph.D. Thesis, Seoul National University, Seoul, Korea, 2006. [Google Scholar]
  32. Cho, E.K.; Son, K.H. An evaluation of spatial recognition and the accessibility of passenger facilities within Korean high-speed railway stations: Visibility graph analysis. Int. J. Vis. Des. 2013, 6, 33–44. [Google Scholar] [CrossRef]
  33. Turner, A. From axial to road-centre lines: A new representation for space syntax and a new model of route choice for transport network analysis. Environ. Plan. B Plan. Des. 2007, 34, 539–555. [Google Scholar] [CrossRef] [Green Version]
  34. Lee, T.R.; Kim, S.G. Problems and directions for improving transportation cards exclusively for foreigners in the metropolitan area. KSCE J. Civ. Eng. 2022, 42, 391–398. [Google Scholar] [CrossRef]
  35. Kim, J.H.; Jung, Y.D. Analysis of accessibility of individual tourists to destination using social network analysis: Focused on the Ulsan metropolitan city public transit network. J. Tour. Sci. 2018, 42, 209–223. [Google Scholar] [CrossRef]
  36. Jeong, C.; Jeong, N.S.; Lee, H. Forecasting demand and estimating the economic impact of walk tourists: Focused on Jeju Olle. J. Tour. Sci. 2011, 35, 389–408. [Google Scholar]
  37. Seo, H.; Park, J.S. A study on satisfaction on walking tourism in Seoul: Applied on expectation disconfirmation theory. J. Tour. Leis. Res. 2019, 31, 61–74. [Google Scholar] [CrossRef]
  38. Zolfagharkhani, M.; Ostwald, M.J. The spatial structure of yazd courtyard houses: A space syntax analysis of the topological characteristics of the courtyard. Buildings 2021, 11, 262. [Google Scholar] [CrossRef]
  39. Herthogs, P.; Debacker, W.; Tunçer, B.; De Weerdt, Y.; De Temmerman, N. Quantifying the generality and adaptability of building layouts using weighted graphs: The SAGA method. Buildings 2019, 9, 92. [Google Scholar] [CrossRef]
  40. Chau, H.W.; Newton, C.; Mei Min Woo, C.; Ma, N.; Wang, J.; Aye, L. Design lessons from three Australian dementia support facilities. Buildings 2018, 8, 67. [Google Scholar] [CrossRef] [Green Version]
  41. Kim, S.H.; Choei, N.Y. An analysis of the heterogeneity in tourists’ route via the space syntax. LHI J. 2020, 11, 39–48. [Google Scholar] [CrossRef]
  42. Lee, S.H. A Study on the Typology of Spatial Organization in Art Museum by Syntactic Analysis. Ph.D. Thesis, Hanyang University, Seoul, Korea, 2008. [Google Scholar]
  43. Kim, S.T. A Study on the Multi-Dimensional Space Analysis Model Using 3D Graphic Engine. Ph.D. Thesis, Hanyang University, Seoul, Korea, 2008. [Google Scholar]
  44. Lee, H.W.; Park, H.K.; Kim, S.T. A study on hierarchy analysis of the floor compositions of geriatric hospital treatment wards. J. Eng. Appl. Sci. 2018, 13, 7826–7833. Available online: https://www.medwelljournals.com/abstract/?doi=jeasci.2018.7826.7833 (accessed on 19 May 2022).
  45. Xu, Y.; Rollo, J.; Jones, D.S.; Esteban, Y.; Tong, H.; Mu, Q. Towards sustainable heritage tourism: A space syntax-based analysis method to improve tourists’ spatial cognition in Chinese historic districts. Buildings 2020, 10, 29. [Google Scholar] [CrossRef] [Green Version]
  46. Zhang, X.; Ren, A.; Chen, L.; Zheng, X. Measurement and spatial difference analysis on the accessibility of road networks in major cities of China. Sustainability 2019, 11, 4209. [Google Scholar] [CrossRef] [Green Version]
  47. Noichan, R.; Dewancker, B. Analysis of accessibility in an urban mass transit node: A case study in a Bangkok transit station. Sustainability 2018, 10, 4819. [Google Scholar] [CrossRef] [Green Version]
  48. Park, G.S.; Kim, M.S.; Choi, J.P. A study on the application of distance-weighting to ERAM model. JAIK 2014, 30, 119–126. [Google Scholar] [CrossRef]
  49. Yun, D.S.; Ko, J. Analysis of Daegu citizens’ subway use characteristics and access area of subway station. J. Korean Reg. Sci. Assoc. 2006, 22, 251–274. [Google Scholar]
  50. Kim, K.W.; Lee, D.H.; Choi, J.M.; Oh, I.S. Comparing the service coverages of subways and buses and estimating the walking distances of their users. KSCE J. Civ. Eng. 2010, 30, 541–552. [Google Scholar]
  51. Yi, C.H.; Jang, S.M.; Lee, S.G. Defining the spatial range of a subway catchment area by walking in consideration of moving distance within station building. J. Korea Plan. Assoc. 2013, 48, 235–248. [Google Scholar]
  52. Analysis of Taxi Data in Seoul, Korea Policy Briefing. Available online: https://www.korea.kr/news/pressReleaseView.do?newsId=155819695 (accessed on 1 July 2022).
  53. Hong, K.J. A Study on the Viewing Distance for Landscape Impact Assessment. Master’s Thesis, Seoul National University, Seoul, Korea, 2010. [Google Scholar]
  54. 2021 Overview of National Cultural Infrastructure, Ministry of Culture, Sports and Tourism. Available online: https://www.mcst.go.kr/kor/s_policy/dept/deptView.jsp?pSeq=1563&pDataCD=0417000000&pType=02 (accessed on 5 July 2022).
  55. Continuous Cadastral Map of Seoul, National Spatial Data Infrastructure Portal. Available online: http://www.nsdi.go.kr/lxportal/?menuno=3085 (accessed on 5 May 2022).
Figure 1. Example of Spatial Analysis Form: (a) Convex space; (b) Axial map; (c) J-Graph.
Buildings 12 01749 g001
Figure 2. Design of spatial analysis form: (a) Convex space; (b) Axial map.
Buildings 12 01749 g002
Figure 3. Axial map and segment map.
Buildings 12 01749 g003
Figure 4. Distribution and expansion trends of museums before and after 1990.
Buildings 12 01749 g004
Figure 5. Administrative categories and museum distribution in Seoul.
Buildings 12 01749 g005
Figure 6. Urban hierarchy graph−Seoul: (a) Global integration graph; (b) Local integration graph; (c) Intelligibility.
Buildings 12 01749 g006
Figure 7. Urban accessibility by angular distance weighting range in Seoul: (a) T1024_R250; (b) T1024_R5000; (c) T1024_R750; (d) T1024_R1000; (e) T1024_R1250; (f) T1024_R1500; (g) T1024_R1750; (h) T1024_R2000.
Buildings 12 01749 g007
Figure 8. Global integration and through angle and limit distance range fitted curves plot: (a) Global Integration and T1024_R500; (b) Global Integration and T1024_R750; (c) Global Integration and T1024_R1000; (d) Global Integration and T1024_R1250; (e) Global Integration and T1024_R1500; (f) Global Integration and T1024_R1750; (g) Global Integration and T1024_R2000.
Buildings 12 01749 g008
Figure 9. Local integration and through angle and limit distance range fitted curves plot: (a) Local Integration and T1024_R250; (b) Local Integration and T1024_R500; (c) Local Integration and T1024_R750; (d) Local Integration and T1024_R1000; (e) Local Integration and T1024_R1250; (f) Local Integration and T1024_R1500; (g) Local Integration and T1024_R1750; (h) Local Integration and T1024_R2000.
Buildings 12 01749 g009
Table 1. Key analysis indicators for axial map.
IndicatorInterpretation
IntegrationGlobal integrationA region with high integration means that movement is relatively easy among the overall regions to be analyzed.
Local integrationCalculated by considering only a few space depths from each space, generally three space depths.
IntelligibilityThe systemicity of the space is evaluated using an index derived from the correlation between the global and local integration.
Table 2. Interpretation of space syntax expressions.
TypeInterpretationTypeInterpretation
MD Average spatial depthKsThe number of spaces in Step S
TSDiTotal spatial depth in space iDnCorrection factor
SThe number of steps taken through space id(i, k)The depth from space i to space k
mThe number of steps from space i to the deepest spacenThe total number of nodes
KThe total number of spaces
Table 3. Relative value calculation formula interpretation.
TypeInterpretation
A(r)The relative interval value of the absolute value
NThe number of axial lines
NxThe absolute sequence number of the corresponding axial line
NxNmin ≤ Nx ≤ Nmax
NminThe minimum value of the axial line sequence number
NmaxThe maximum value of the axial line sequence number
Table 4. Urban hierarchy actuality in Seoul.
TypeGlobal IntegrationLocal Integration
Axial line167,059
Max0.5696.001
Min0.0900.333
Avg0.3811.574
Table 5. Accessibility indicator correlation analysis.
Pearson CorrelationII_3R250_IR500_IR750_IR1000_IR1250_IR1500_IR1750_IR2000_I
I1
I_30.541 **1
T1024_R2500.1160.399 **1
T1024_R5000.248 **0.417 **0.790 **1
T1024_R7500.313 **0.438 **0.693 **0.919 **1
T1024_R10000.393 **0.398 **0.633 **0.872 **0.945 **1
T1024_R12500.448 **0.407 **0.578 **0.814 **0.900 **0.980 **1
T1024_R15000.492 **0.396 **0.538 **0.765 **0.853 **0.947 **0.986 **1
T1024_R17500.526 **0.386 **0.503 **0.711 **0.797 **0.902 **0.953 **0.983 **1
T1024_R20000.529 **0.371 **0.491 **0.684 **0.765 **0.870 **0.924 **0.960 **0.974 **1
* p < 0.05, ** p < 0.01, *** p < 0.001.
Table 6. Global integration and through angle and limit distance range ANOVA.
KindsGlobal Integration
T1024 and R500
**
T1024 and R750
***
T1024 and R1000
***
T1024 and R1250
***
T1024 and R1500
***
T1024 and R1750
***
T1024 and R2000
***
DFMETMETMETMETMETMETMET
2177179217717921771792177179217717921771792177179
Sum of squares0.892 10.687 11.579 1.308 11.459 12.767 2.293 11.488 13.780 3.036 11.486 14.522 3.782 11.435 15.218 4.519 11.446 15.966 4.634 11.294 15.928
Mean square0.446 0.060 0.654 0.065 1.146 0.065 1.518 0.065 1.891 0.065 2.260 0.065 2.317 0.064
F7.385 10.105 17.661 23.390 29.271 34.944 36.314
* p < 0.05, ** p < 0.01, *** p < 0.001.
Table 7. Local integration and through angle and limit distance range ANOVA.
KindsLocal Integration
T1024 and R250
***
T1024 and R500
***
T1024 and R500
***
T1024 and R500
***
T1024 and R1250
***
T1024 and R1500
***
T1024 and R1750
***
T1024 and R2000
***
DFMETMETMETMETMETMETMETMET
21771792177179217717921771792177179217717921771792177179
Sum of squares1.939 9.187 11.126 2.055 9.524 11.579 2.446 10.321 12.767 2.206 11.574 13.780 2.463 12.059 14.522 2.456 12.762 15.218 2.430 13.536 15.966 2.261 13.667 15.928
Mean square0.970 0.052 1.028 0.054 1.223 0.058 1.103 0.065 1.232 0.068 1.228 0.072 1.215 0.076 1.131 0.077
F18.684 19.096 20.975 16.869 18.078 17.030 15.888 14.642
* p < 0.05, ** p < 0.01, *** p < 0.001.
Table 8. Global integration and through angle and limit distance range polynomial curve fitting analysis.
PlotGlobal Integration
Equationy = Intercept + B1* X^1 + B2* X^2
TypeT1024 and R500T1024 and R750T1024 and R1000T1024 and R1250T1024 and R1500T1024 and R1750T1024 and R2000
Intercept0.134 ± 0.0680.172 ± 0.0700.103 ± 0.0700.092 ± 0.0700.081 ± 0.0700.066 ± 0.0700.062 ± 0.070
B10.694 ± 0.2870.554 ± 0.2970.826 ± 0.2970.833 ± 0.2970.844 ± 0.2970.894 ± 0.2970.963± 0.295
B2−0.440 ± 0.256−0.249 ± 0.265−0.418 ± 0.265−0.369 ± 0.265−0.330 ± 0.265−0.333 ± 0.265−0.392 ± 0.263
Residual sum of squares10.687 11.459 11.488 11.486 11.435 11.446 11.294
R-Square (COD)0.077 0.102 0.166 0.209 0.249 0.283 0.291
Adj. R-Square0.067 0.092 0.157 0.200 0.240 0.275 0.283
Table 9. Local integration and through angle and limit distance range polynomial curve fitting analysis.
PlotLocal Integration
Equationy = Intercept + B1* X^1 + B2* X^2
TypeT1024_R250T1024_R500T1024_R750T1024_R1000T1024_R1250T1024_R1500T1024_R1750T1024_R2000
Intercept0.021 ± 0.0590.105 ± 0.0600.159 ± 0.0630.224 ± 0.0660.256 ± 0.0680.279 ± 0.0700.287 ± 0.0720.296 ± 0.072
B10.754 ± 0.2410.557 ± 0.2450.404 ± 0.2550.225 ± 0.2700.128 ± 0.2760.104 ± 0.2840.154 ± 0.2920.193 ± 0.293
B2−0.385 ± 0.212−0.188 ± 0.216−0.016 ± 0.2250.127 ± 0.2380.230 ± 0.2430.251 ± 0.2500.206 ± 0.2570.159 ± 0.258
Residual sum of squares9.187 9.524 10.321 11.574 12.059 12.762 13.536 13.667
R-Square (COD)0.174 0.177 0.192 0.160 0.170 0.161 0.152 0.142
Adj. R-Square0.165 0.168 0.182 0.151 0.160 0.152 0.143 0.132
Publisher’s Note: MDPI stays neutral with regard to jurisdictional claims in published maps and institutional affiliations.

