
Air Pollution with Fine Particles in Closed Parking and Theoretical Studies of the Interaction of Inhaled Particles in Respiratory Tract

Abstract
:1. Introduction
Problem Formulation
2. Materials and Methods
2.1. Ultrafine Particle Motion
2.2. Numerical Estimation of Air Flows in a Principled Model
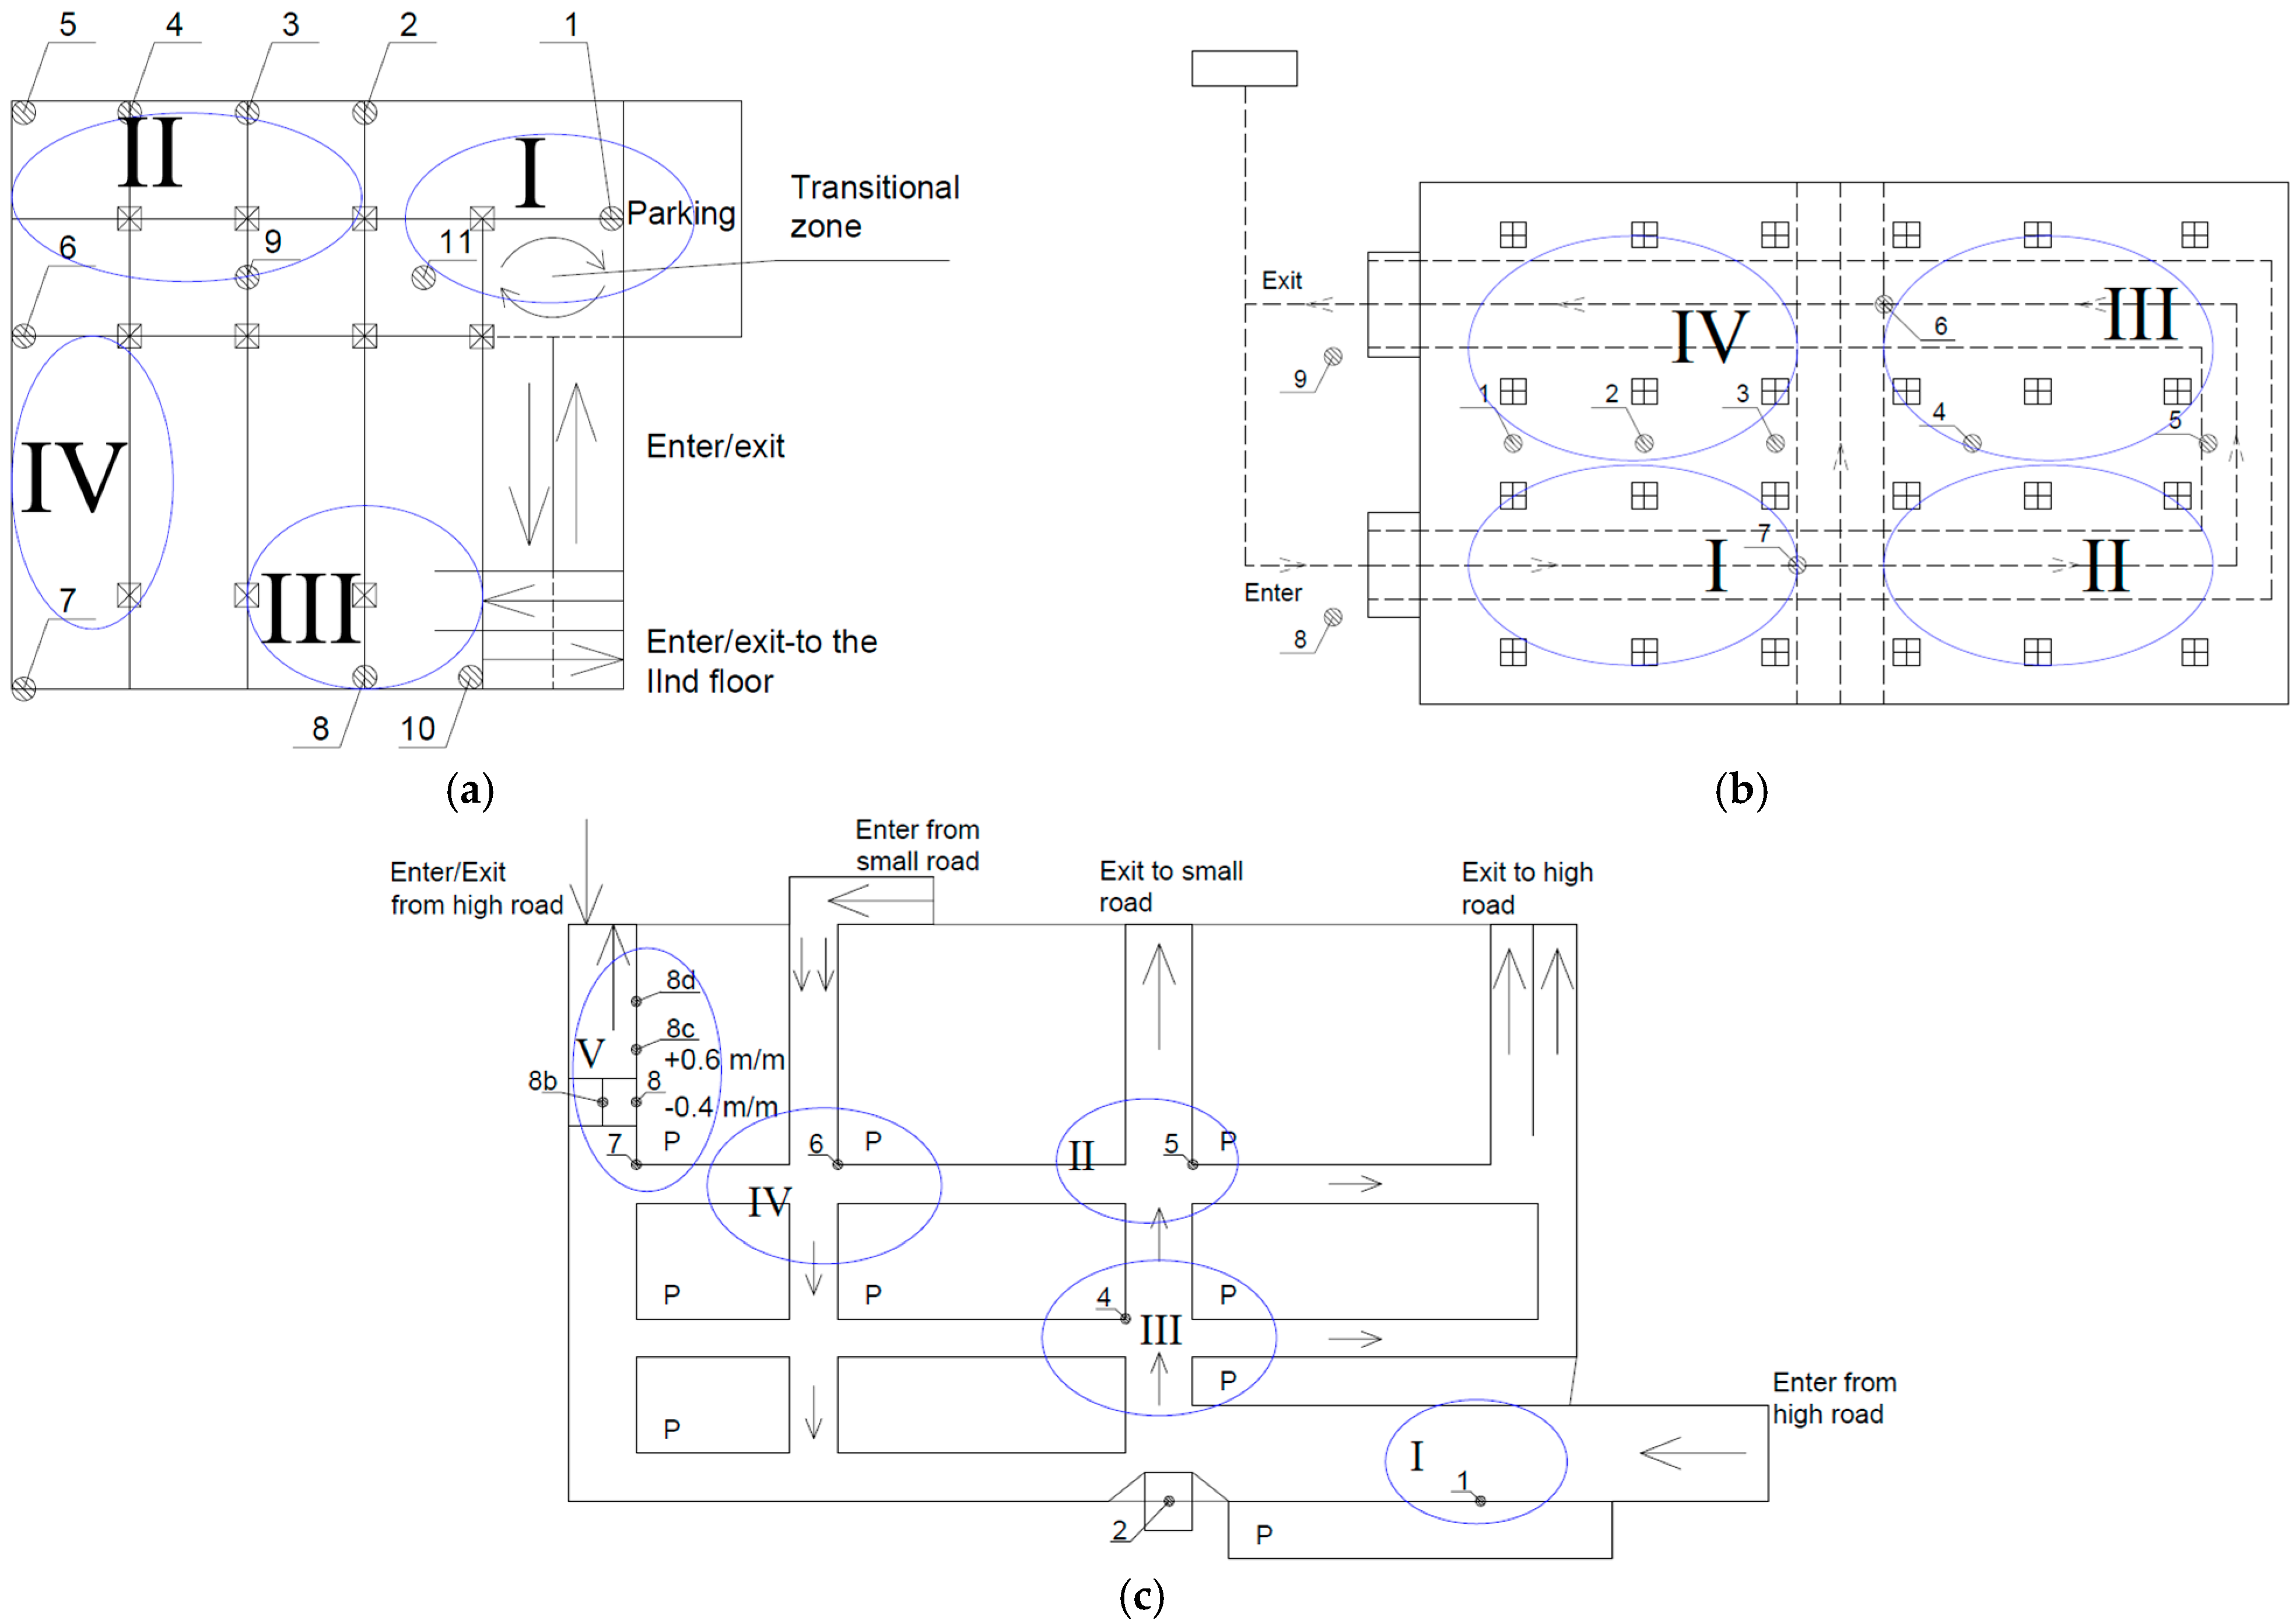
2.3. Field Research
3. Results
3.1. Field Research
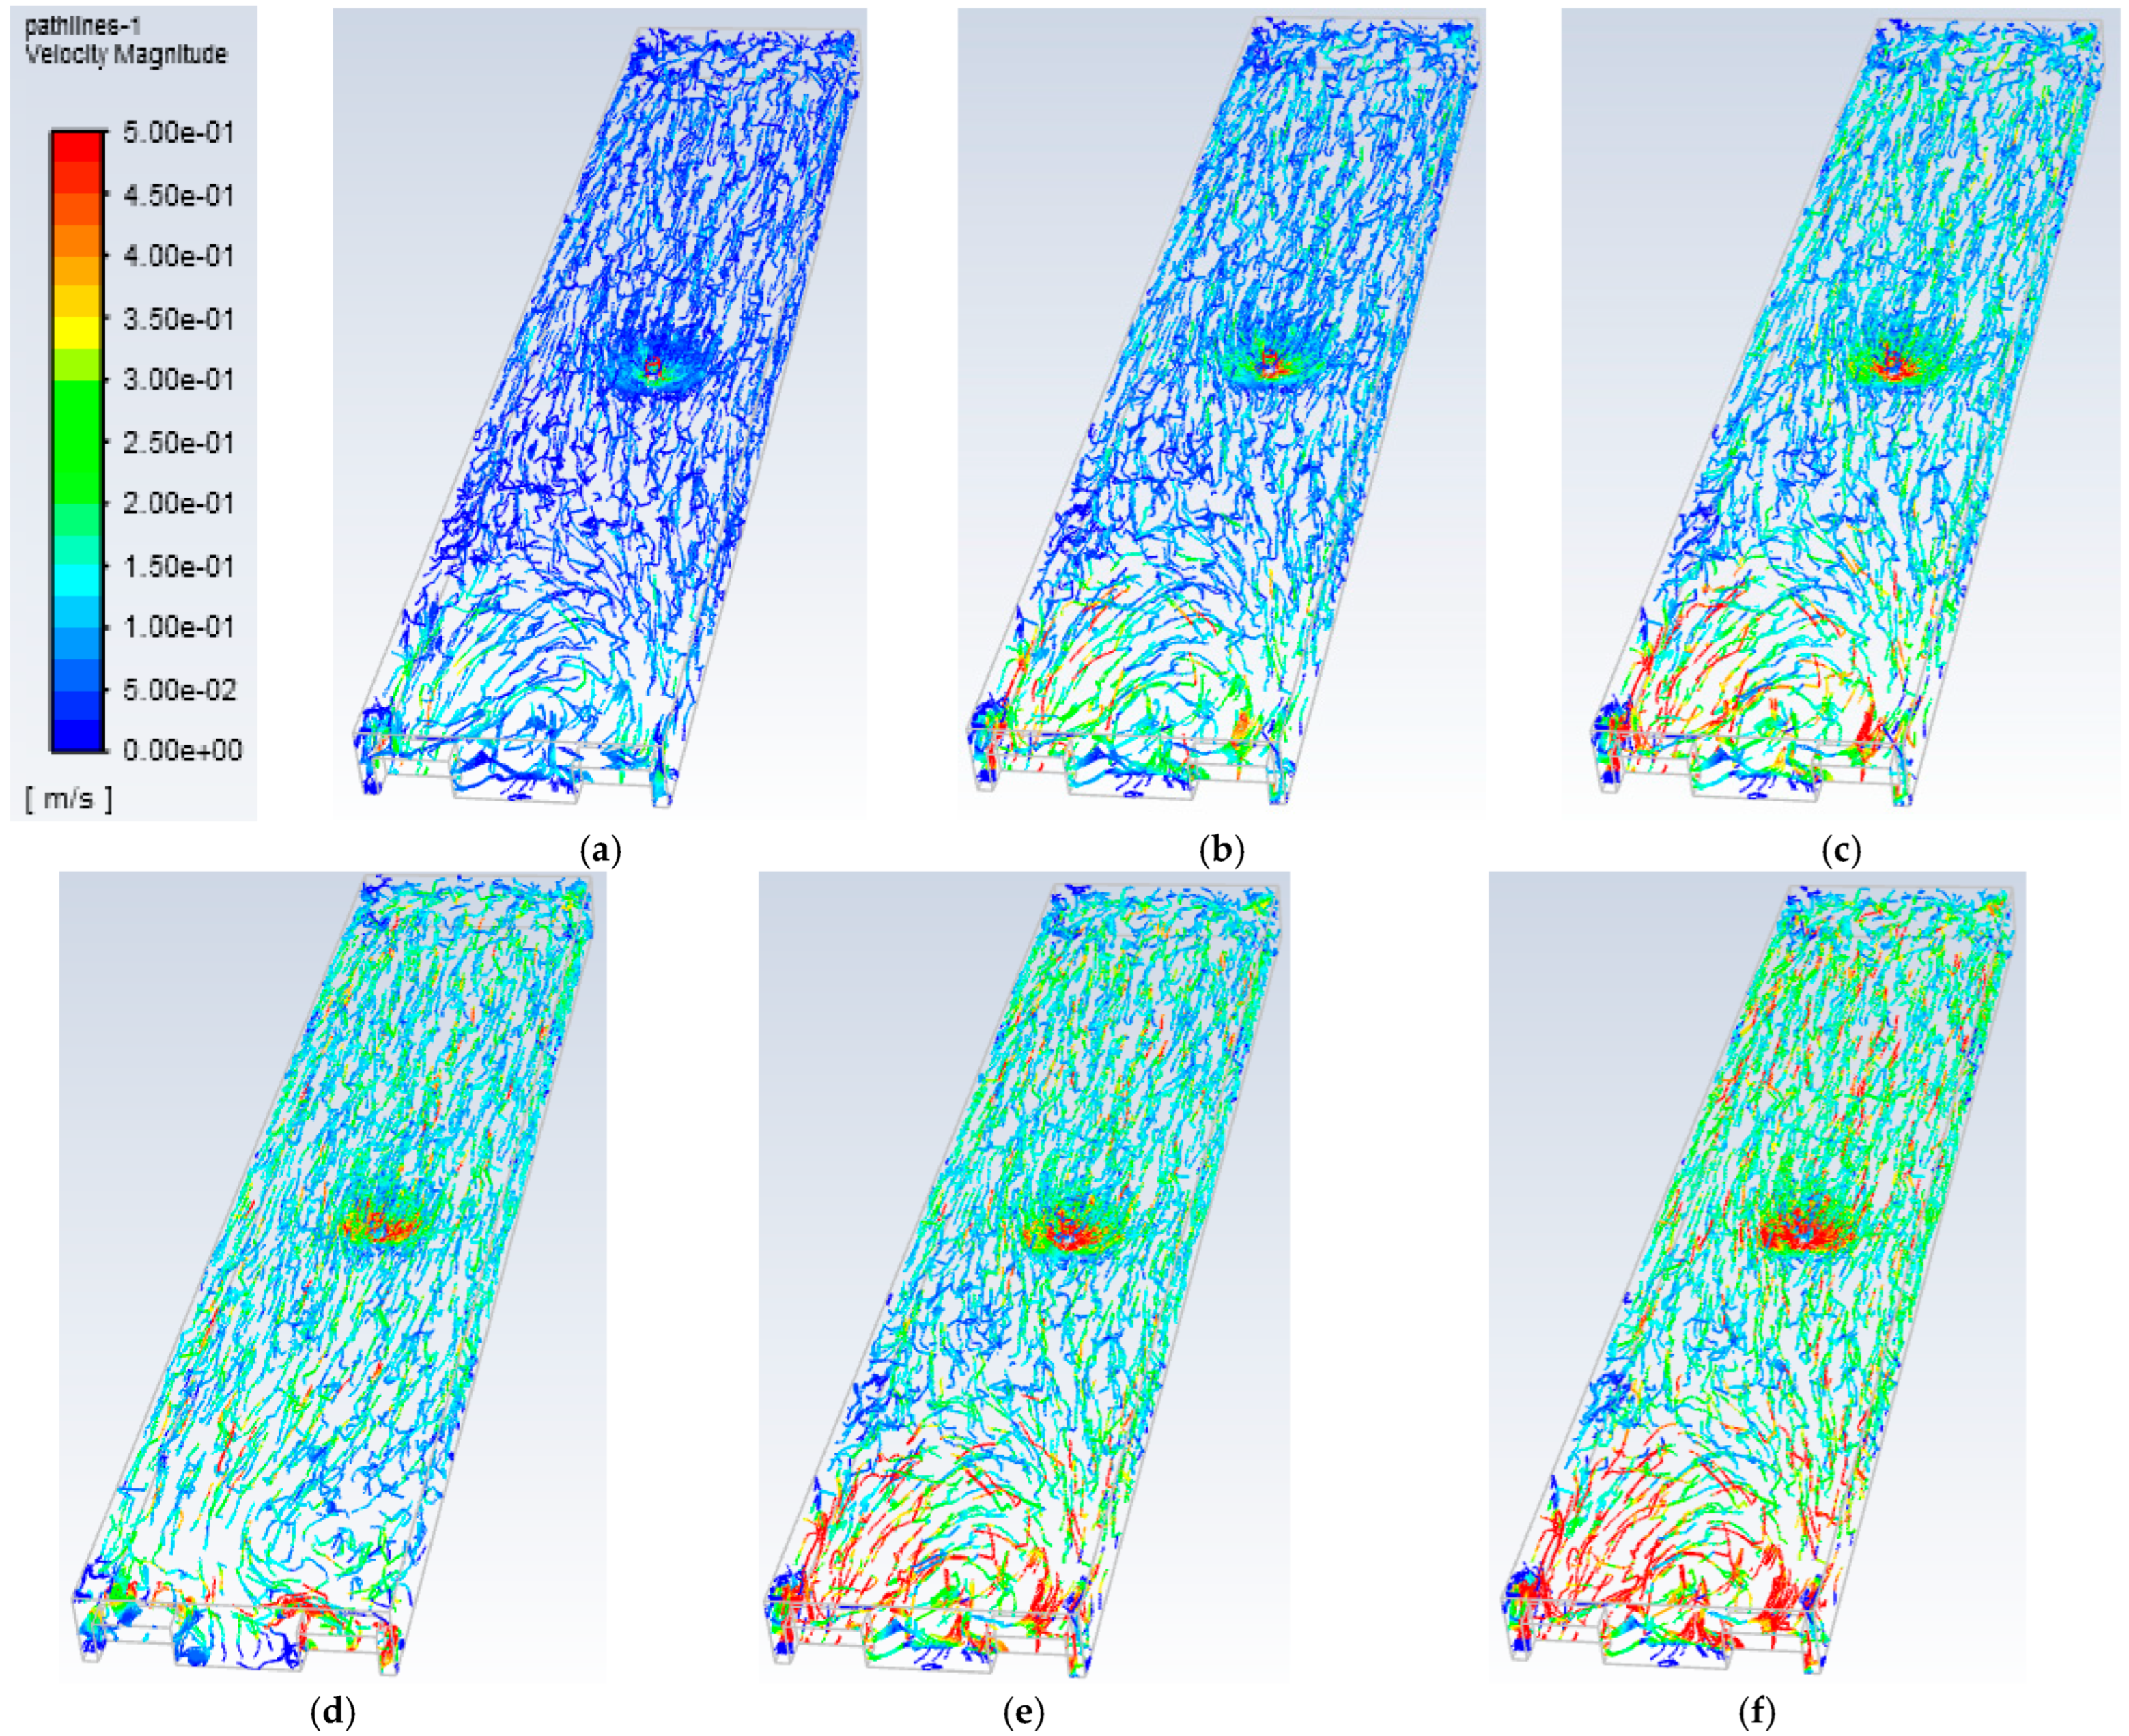
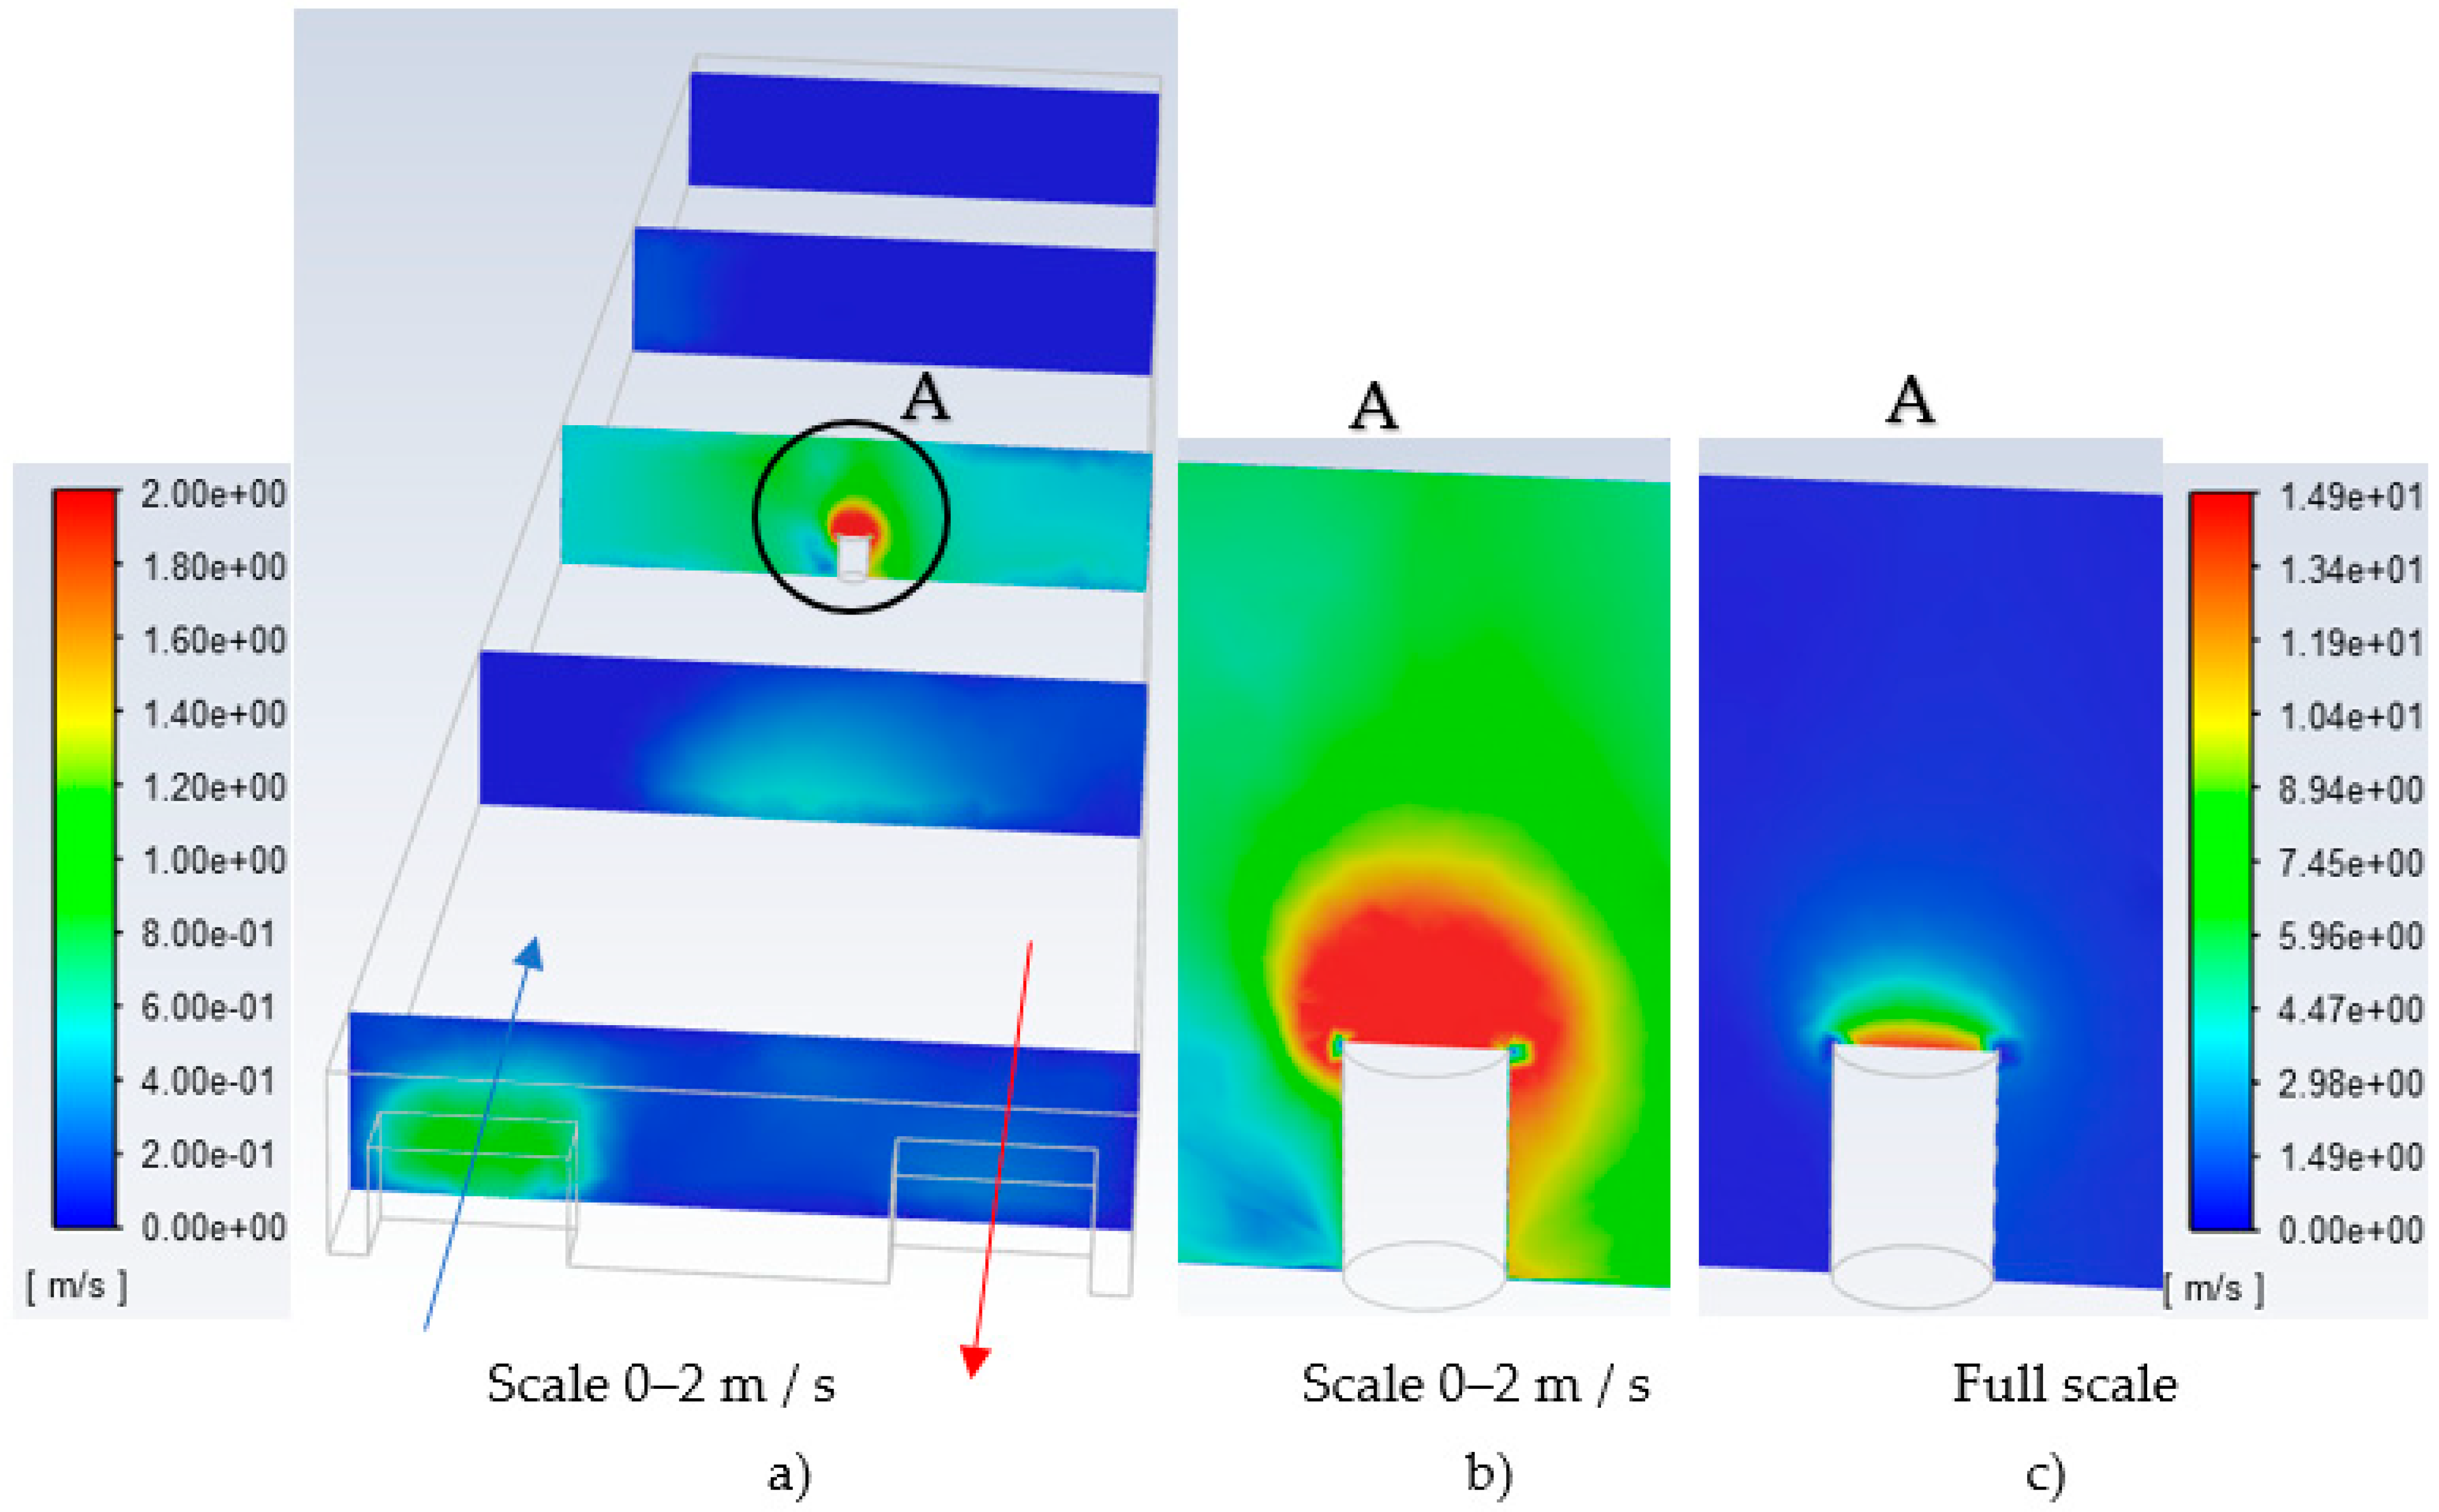
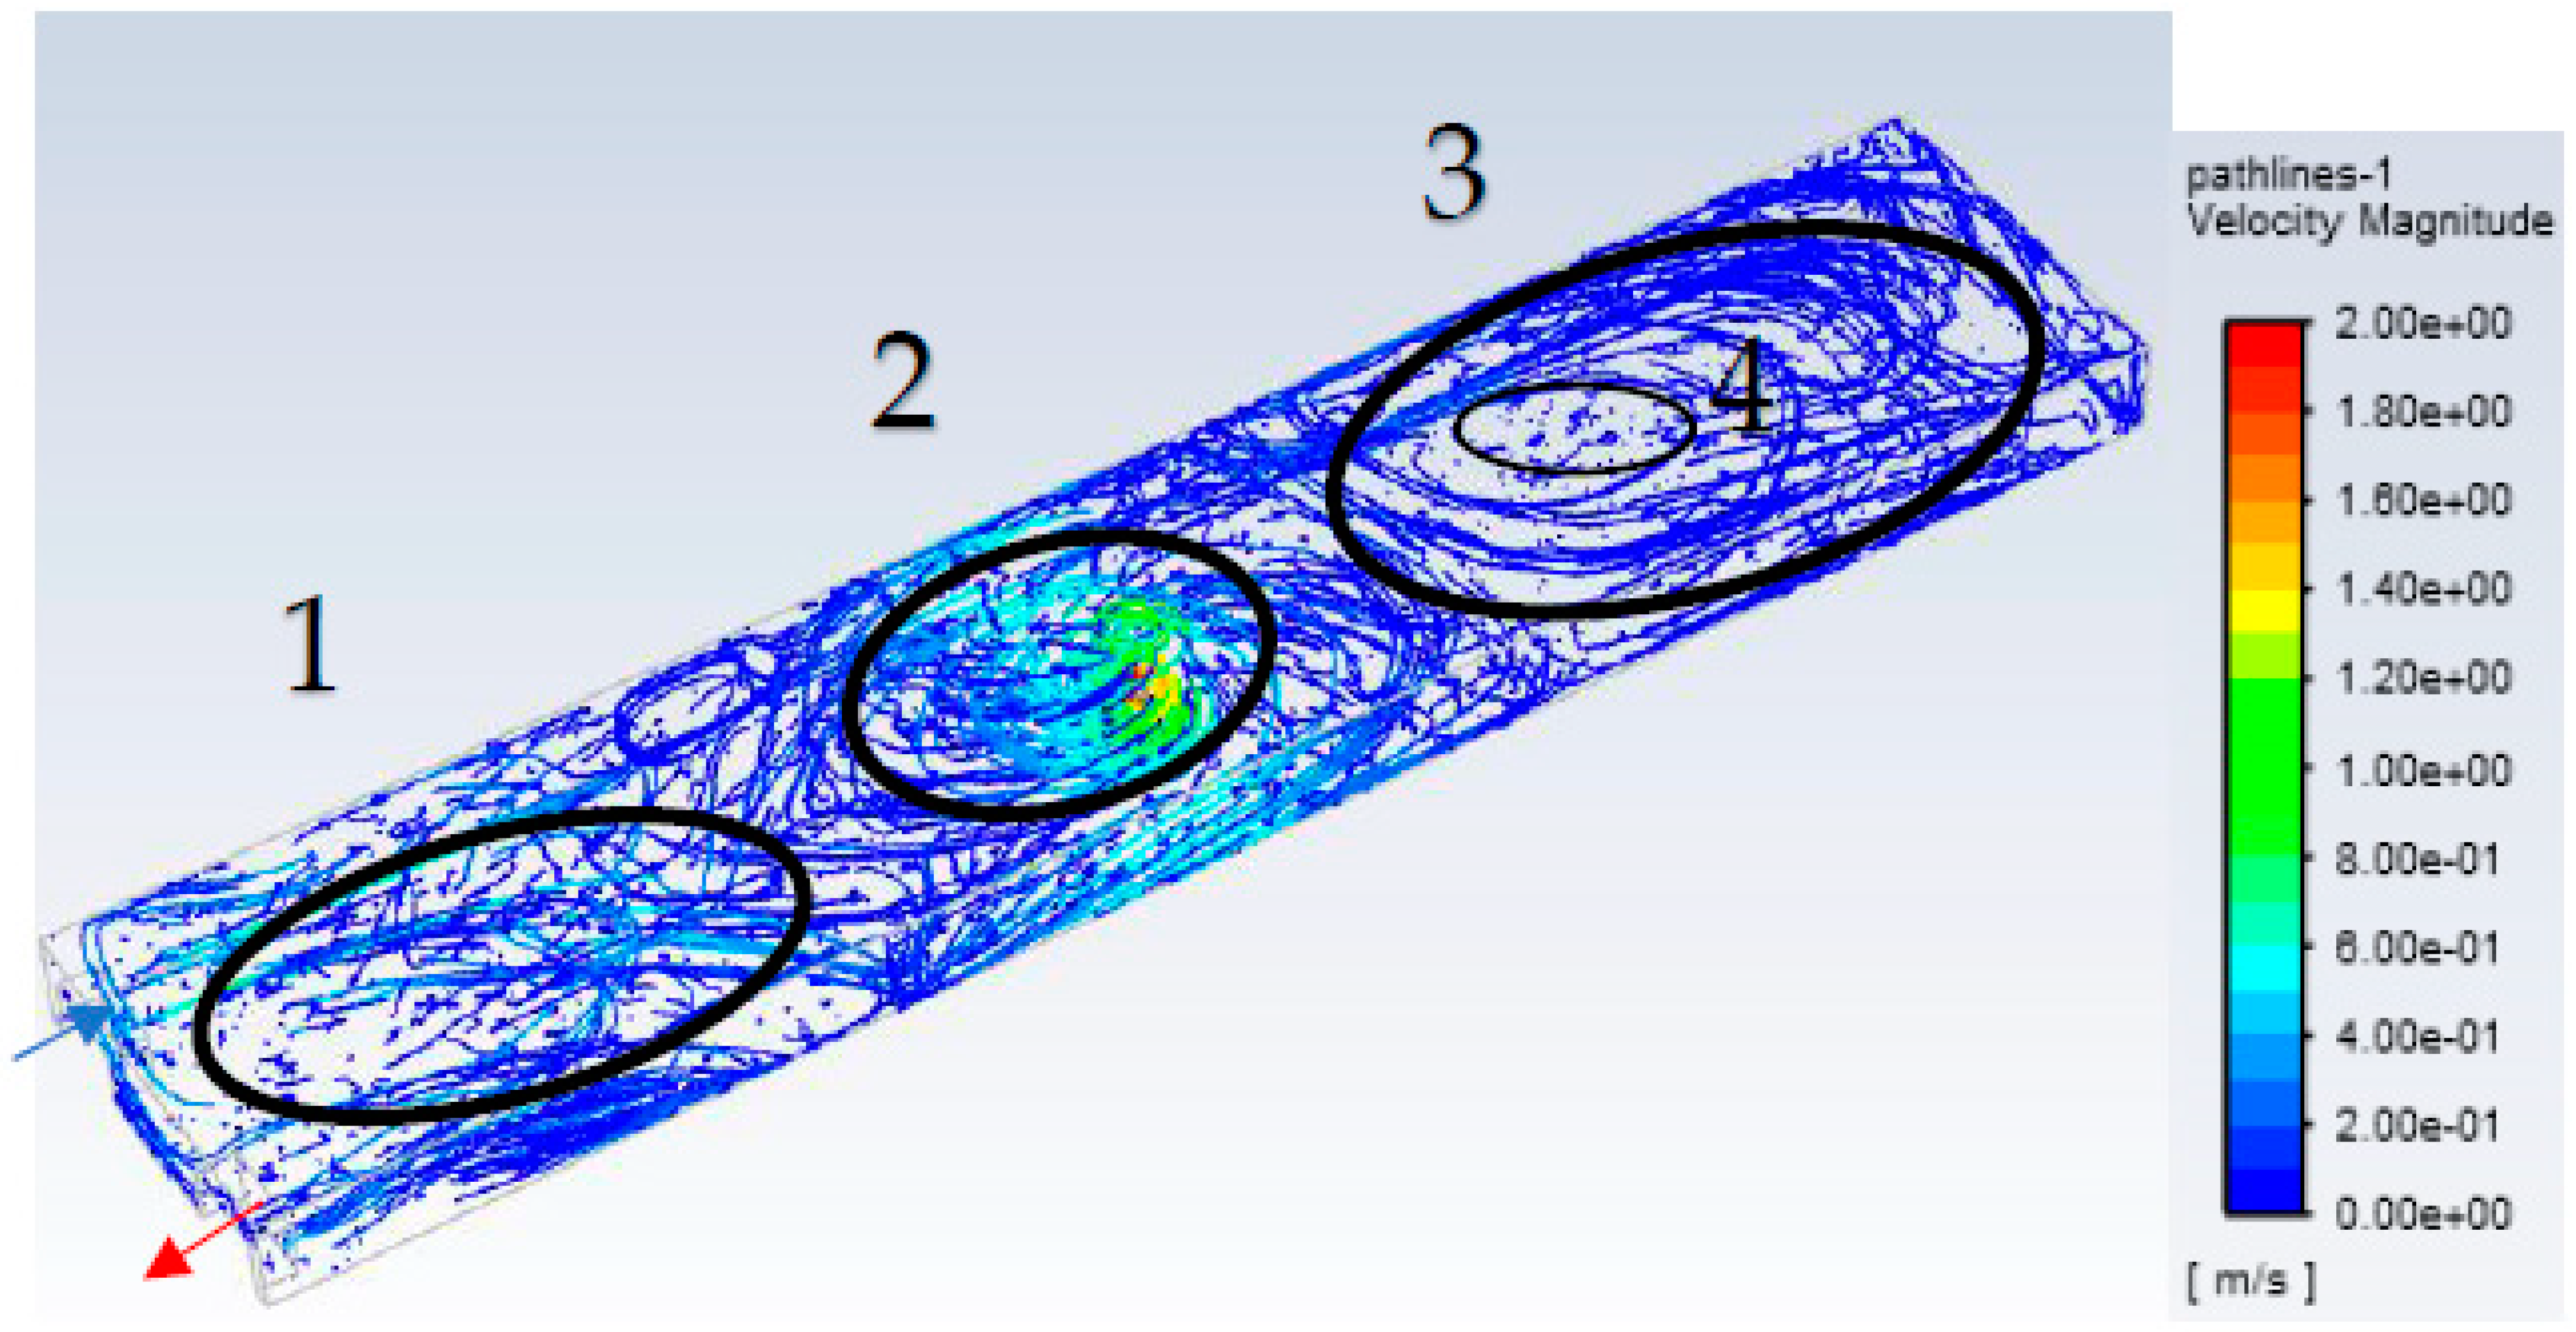
3.2. Numerical Modeling of Air Flows
4. Discussion
5. Conclusions
Author Contributions
Funding
Institutional Review Board Statement
Informed Consent Statement
Data Availability Statement
Acknowledgments
Conflicts of Interest
References
- Tomas, J. Adhesion of Ultrafine Particles—A Micromechanical Approach. Chem. Eng. Sci. 2007, 62, 1997–2010. [Google Scholar] [CrossRef]
- Morawska, L.; Buonanno, G. The Physics of Particle Formation and Deposition during Breathing. Nat. Rev. Phys. 2021, 3, 300–301. [Google Scholar] [CrossRef] [PubMed]
- Steiner, S.; Bisig, C.; Petri-Fink, A.; Rothen-Rutishauser, B. Diesel Exhaust: Current Knowledge of Adverse Effects and Underlying Cellular Mechanisms. Arch. Toxicol. 2016, 90, 1541–1553. [Google Scholar] [CrossRef] [PubMed] [Green Version]
- Oberdörster, G.; Oberdörster, E.; Oberdörster, J. NANOTOXICOLOGY: An Emerging Discipline Evolving from Studies of Ultrafine Particles. Environ. Health Perspect. 2005, 113, 823–839. [Google Scholar] [CrossRef]
- Patton, J.S.; Byron, P.R. Inhaling Medicines: Delivering Drugs to the Body through the Lungs. Nat. Rev. Drug Discov. 2007, 6, 67–74. [Google Scholar] [CrossRef]
- ECOpoint Inc. What Are Diesel Emissions. Exhaust Particulate Matter. Available online: https://dieselnet.com/tech/dpm_size.php (accessed on 25 July 2022).
- Abdul-Khalek, I.; Kittelson, D.; Brear, F. The Influence of Dilution Conditions on Diesel Exhaust Particle Size Distribution Measurements. In Proceedings of the International Congress & Exposition, Detroit, MI, USA, 1–4 March 1999; SAE International: Warrendale, PA, USA, 1999. [Google Scholar]
- Kittelson, D.B. Engines and Nanoparticles: A Review. J. Aerosol Sci. 1998, 29, 575–588. [Google Scholar] [CrossRef]
- Barone, T.L.; Lall, A.A.; Storey, J.M.E.; Mulholland, G.W.; Prikhodko, V.Y.; Frankland, J.H.; Parks, J.E.; Zachariah, M.R. Size-Resolved Density Measurements of Particle Emissions from an Advanced Combustion Diesel Engine: Effect of Aggregate Morphology. Energy Fuels 2011, 25, 1978–1988. [Google Scholar] [CrossRef]
- De Filippo, A.; Maricq, M.M. Diesel Nucleation Mode Particles: Semivolatile or Solid? Environ. Sci. Technol. 2008, 42, 7957–7962. [Google Scholar] [CrossRef]
- Höglund, P.G. Parking, Energy Consumption and Air Pollution. Sci. Total Environ. 2004, 334–335, 39–45. [Google Scholar] [CrossRef]
- Kim, S.R.; Dominici, F.; Buckley, T.J. Concentrations of Vehicle-Related Air Pollutants in an Urban Parking Garage. Environ. Res. 2007, 105, 291–299. [Google Scholar] [CrossRef]
- Vuković, G.; Aničić Urošević, M.; Razumenić, I.; Kuzmanoski, M.; Pergal, M.; Škrivanj, S.; Popović, A. Air Quality in Urban Parking Garages (PM10, Major and Trace Elements, PAHs): Instrumental Measurements vs. Active Moss Biomonitoring. Atmos. Environ. 2014, 85, 31–40. [Google Scholar] [CrossRef]
- Takacs, A.; Haidegger, T. Infrastructural Requirements and Regulatory Challenges of a Sustainable Urban Air Mobility Ecosystem. Buildings 2022, 12, 747. [Google Scholar] [CrossRef]
- Li, Y.; Xie, Y.; Sun, S.; Hu, L. Evaluation of Park Accessibility Based on Improved Gaussian Two-Step Floating Catchment Area Method: A Case Study of Xi’an City. Buildings 2022, 12, 871. [Google Scholar] [CrossRef]
- Ren, L.; An, F.; Su, M.; Liu, J. Exposure Assessment of Traffic-Related Air Pollution Based on CFD and BP Neural Network and Artificial Intelligence Prediction of Optimal Route in an Urban Area. Buildings 2022, 12, 1227. [Google Scholar] [CrossRef]
- Zhao, Y.; Zhao, J. Numerical Assessment of Particle Dispersion and Exposure Risk in an Underground Parking Lot. Energy Build. 2016, 133, 96–103. [Google Scholar] [CrossRef]
- Cui, S.; Xie, B.; Li, R.; Pei, J.; Tian, Y.; Zhang, J.; Xing, X. G-C3N4/CeO2 Binary Composite Prepared and Its Application in Automobile Exhaust Degradation. Materials 2020, 13, 1274. [Google Scholar] [CrossRef] [Green Version]
- Tobalina-Baldeon, D.; Sanz-Adan, F.; Martinez-Calvo, M.A.; Santamaría-Pena, J. Dynamic Tensile Stress-Compressive Stress Behavior of Thermoplastic Matrix Composite Materials Reinforced with Continuous Fiber for Automotive Damping and Anti-Vibration Structural Elements. Materials 2020, 13, 5. [Google Scholar] [CrossRef] [Green Version]
- Zhao, Y.; Song, X.; Wang, Y.; Zhao, J.; Zhu, K. Seasonal Patterns of PM10, PM2.5, and PM1.0 Concentrations in a Naturally Ventilated Residential Underground Garage. Build. Environ. 2017, 124, 294–314. [Google Scholar] [CrossRef]
- Nowoświat, A.; Dulak, L. Impact of Cement Dust Pollution on the Surface of Sound-Absorbing Panels on Their Acoustic Properties. Materials 2020, 13, 1422. [Google Scholar] [CrossRef] [Green Version]
- Li, L.; Mullan, A.F.; Clements, N. Exposure to Air Pollution in Indoor Walkways of a Suburban City. Build. Environ. 2020, 183, 107171. [Google Scholar] [CrossRef]
- Garcia, E.; Rice, M.B.; Gold, D.R. Air Pollution and Lung Function in Children. J. Allergy Clin. Immunol. 2021, 148, 1–14. [Google Scholar] [CrossRef]
- Gamble, J.; Jones, W.; Minshall, S. Epidemiological-Environmental Study of Diesel Bus Garage Workers: Acute Effects of NO2 and Respirable Particulate on the Respiratory System. Environ. Res. 1987, 42, 201–214. [Google Scholar] [CrossRef]
- Zhang, W.; Li, Q.; Tang, M.; Zhang, H.; Sun, X.; Zou, S.; Jensen, J.L.; Liou, T.G.; Zhou, A. A Multi-Scale Approach to Study Biochemical and Biophysical Aspects of Resveratrol on Diesel Exhaust Particle-Human Primary Lung Cell Interaction. Sci. Rep. 2019, 9, 18178. [Google Scholar] [CrossRef] [Green Version]
- Park, E.-J.; Roh, J.; Kang, M.-S.; Kim, S.N.; Kim, Y.; Choi, S. Biological Responses to Diesel Exhaust Particles (DEPs) Depend on the Physicochemical Properties of the DEPs. PLoS ONE 2011, 6, e26749. [Google Scholar] [CrossRef]
- Jasevičius, R.; Kruggel-Emden, H.; Baltrėnas, P. Numerical Simulation of the Sticking Process of Glass-Microparticles to a Flat Wall to Represent Pollutant-Particles Treatment in a Multi-Channel Cyclone. Particuology 2017, 32, 112–131. [Google Scholar] [CrossRef]
- Jasevičius, R.; Baltrėnas, P.; Kačianauskas, R.; Grubliauskas, R. DEM Simulation of the Impact of Ultrafine Glass Particles on the Partition Wall of the Multichannel Cyclone. Part. Sci. Technol. 2014, 32, 576–587. [Google Scholar] [CrossRef]
- Jasevičius, R.; Tomas, J.; Kačianauskas, R. Simulation of Normal Impact of Ultrafine Silica Particle on Substrate. Part. Sci. Technol. 2011, 29, 107–126. [Google Scholar] [CrossRef]
- Jasevičius, R. Numerical Modeling of the Mechanics of the Interaction of Coronavirus with the Lung Epithelial Cell. Mech. Adv. Mater. Struct. 2022, 29, 1–16. [Google Scholar] [CrossRef]
- Park, K.; Kittelson, D.; Zachariah, M.; McMurry, P. Measurement of Inherent Material Density of Nanoparticle Agglomerates. J. Nanoparticle Res. 2004, 6, 267–272. [Google Scholar] [CrossRef]
- Sen, N.; Weprin, S.; Peter, Y. Discrimination Between Lung Homeostatic and Injury-Induced Epithelial Progenitor Subsets by Cell-Density Properties. Stem Cells Dev. 2013, 22, 2036–2046. [Google Scholar] [CrossRef] [PubMed]
- Roan, E.; Waters, C.M. What Do We Know about Mechanical Strain in Lung Alveoli? Am. J. Physiol. Cell. Mol. Physiol. 2011, 301, L625–L635. [Google Scholar] [CrossRef] [PubMed] [Green Version]
- Jasevičius, R.; Baronas, R.; Kruggel-Emden, H. Numerical Modelling of the Normal Adhesive Elastic–Plastic Interaction of a Bacterium. Adv. Powder Technol. 2015, 26, 742–752. [Google Scholar] [CrossRef]
- Fischer, H. Function of Proton Channels in Lung Epithelia. Wiley Interdiscip. Rev. Membr. Transp. Signal. 2012, 1, 247–258. [Google Scholar] [CrossRef] [Green Version]
- Ng, A.W.; Bidani, A.; Heming, T.A. Innate Host Defense of the Lung: Effects of Lung-Lining Fluid PH. Lung 2004, 182, 297–317. [Google Scholar] [CrossRef]
- Zasadzinski, J.A.; Stenger, P.C.; Shieh, I.; Dhar, P. Overcoming Rapid Inactivation of Lung Surfactant: Analogies between Competitive Adsorption and Colloid Stability. Biochim. Biophys. Acta-Biomembr. 2010, 1798, 801–828. [Google Scholar] [CrossRef] [Green Version]
- Kang, D.; Chugunova, M.; Nadim, A.; Waring, A.J.; Walther, F.J. Modeling Coating Flow and Surfactant Dynamics inside the Alveolar Compartment. J. Eng. Math. 2018, 113, 23–43. [Google Scholar] [CrossRef] [Green Version]
- Evans, J.A.; Whitelaw, W.A. The Assessment of Maximal Respiratory Mouth Pressures in Adults. Respir. Care 2009, 54, 1348–1359. [Google Scholar]
- Lausted, C.G.; Johnson, A.T.; Scott, W.H.; Johnson, M.M.; Coyne, K.M.; Coursey, D.C. Maximum Static Inspiratory and Expiratory Pressures with Different Lung Volumes. Biomed. Eng. Online 2006, 5, 29. [Google Scholar] [CrossRef]


| Objects | Initial Parameters | Values | References |
|---|---|---|---|
| Particle | 100 nm | – | |
| – – | |||
| – | |||
| −1.50 m/s | [30] | ||
| – | |||
| [31,32], 1.2 g/cm3) | |||
| [25] | |||
| – | |||
| 0.25 | (Jasevičius et al., 2014, 2017) | ||
| [26] | |||
| [25] | |||
| Epithelium Cell | [32] | ||
| [33] | |||
| [34] | |||
| . | (type I cell) | [35] | |
(type II cell) | [35] | ||
| Alveoli water | PH | 6.9 | [36] |
| – | |||
| – | |||
| nm (physically) 0.77 nm (theoretically) 80 | [37] [37] [37] | ||
| [38] | |||
| Alveoli |
| Diameter Parameter | Values at Certain Points | ||||
|---|---|---|---|---|---|
| S | L | U | A′ | ||
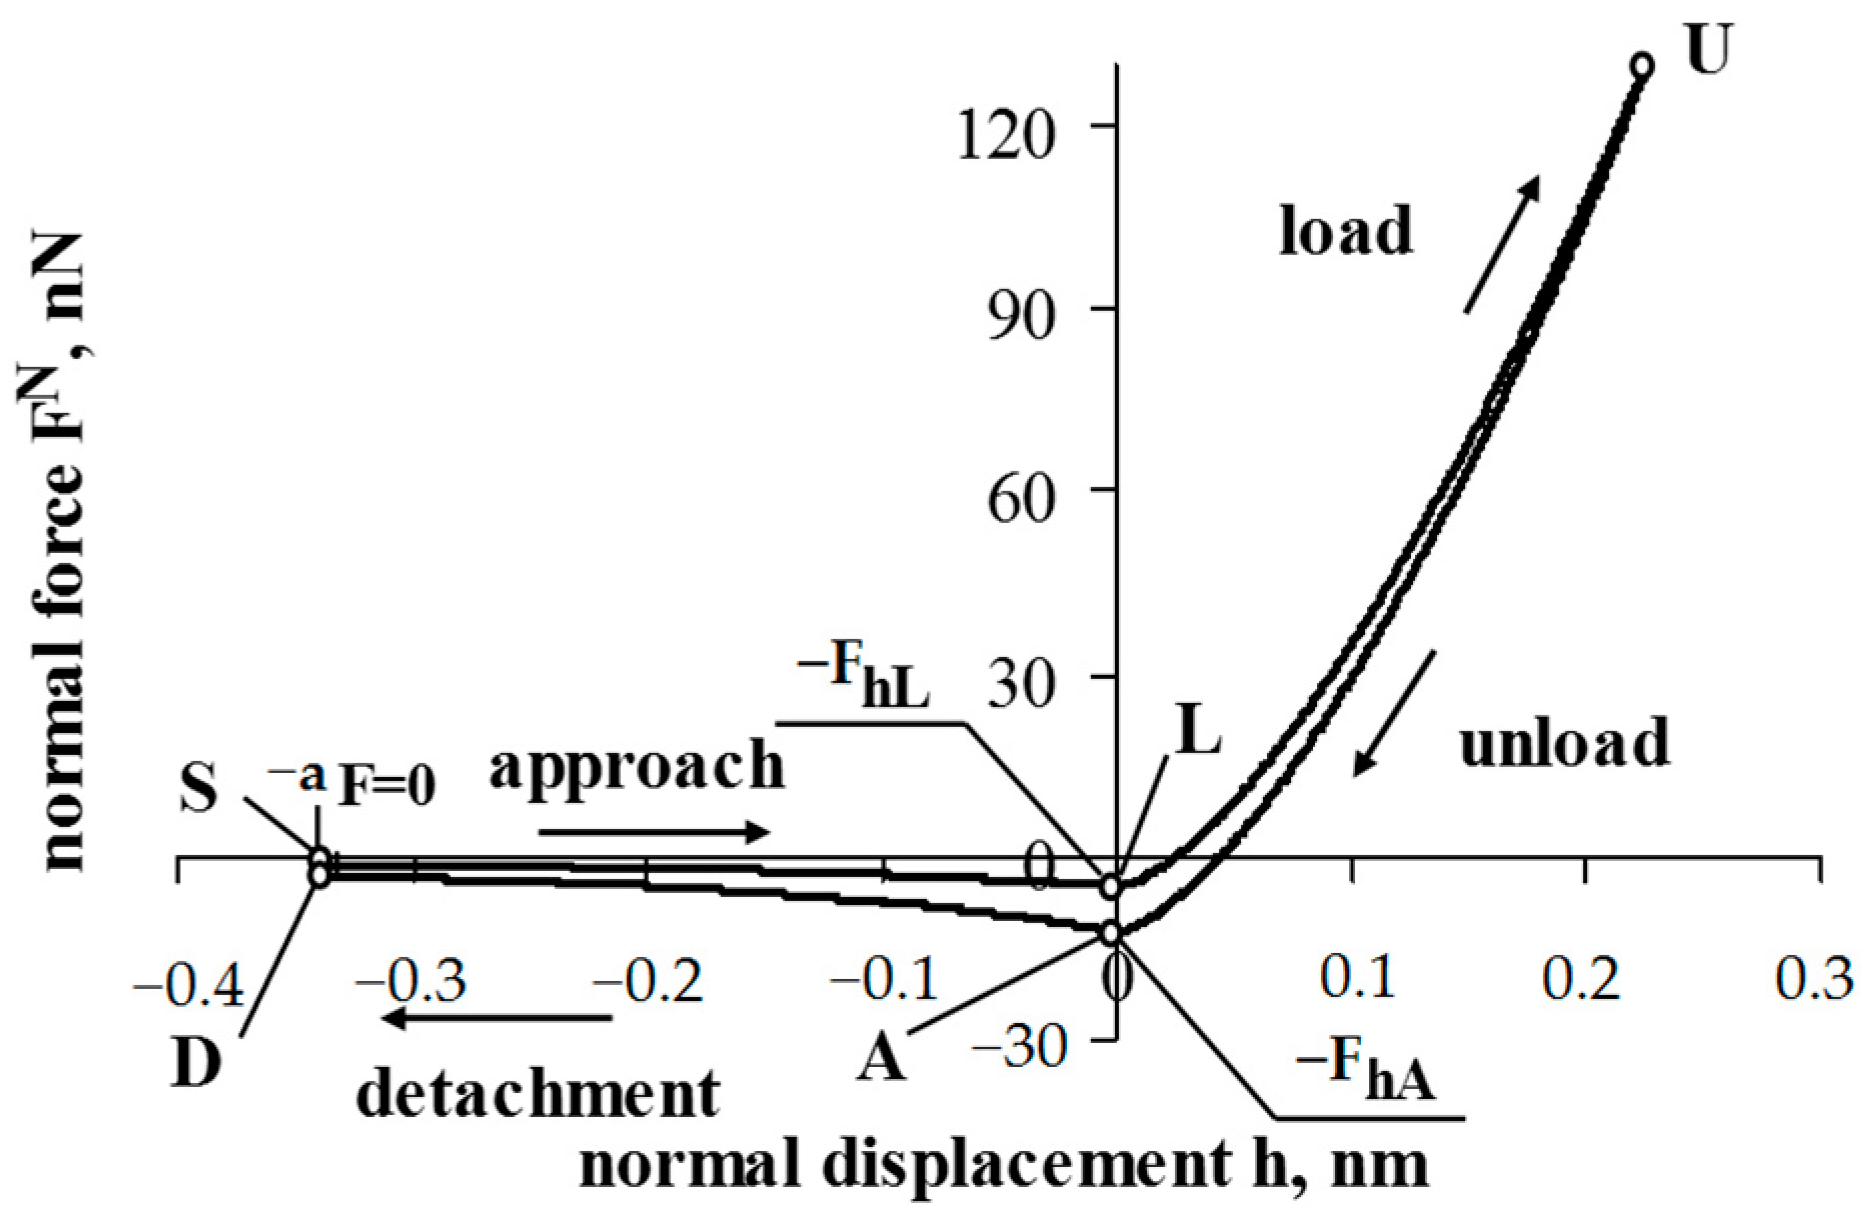
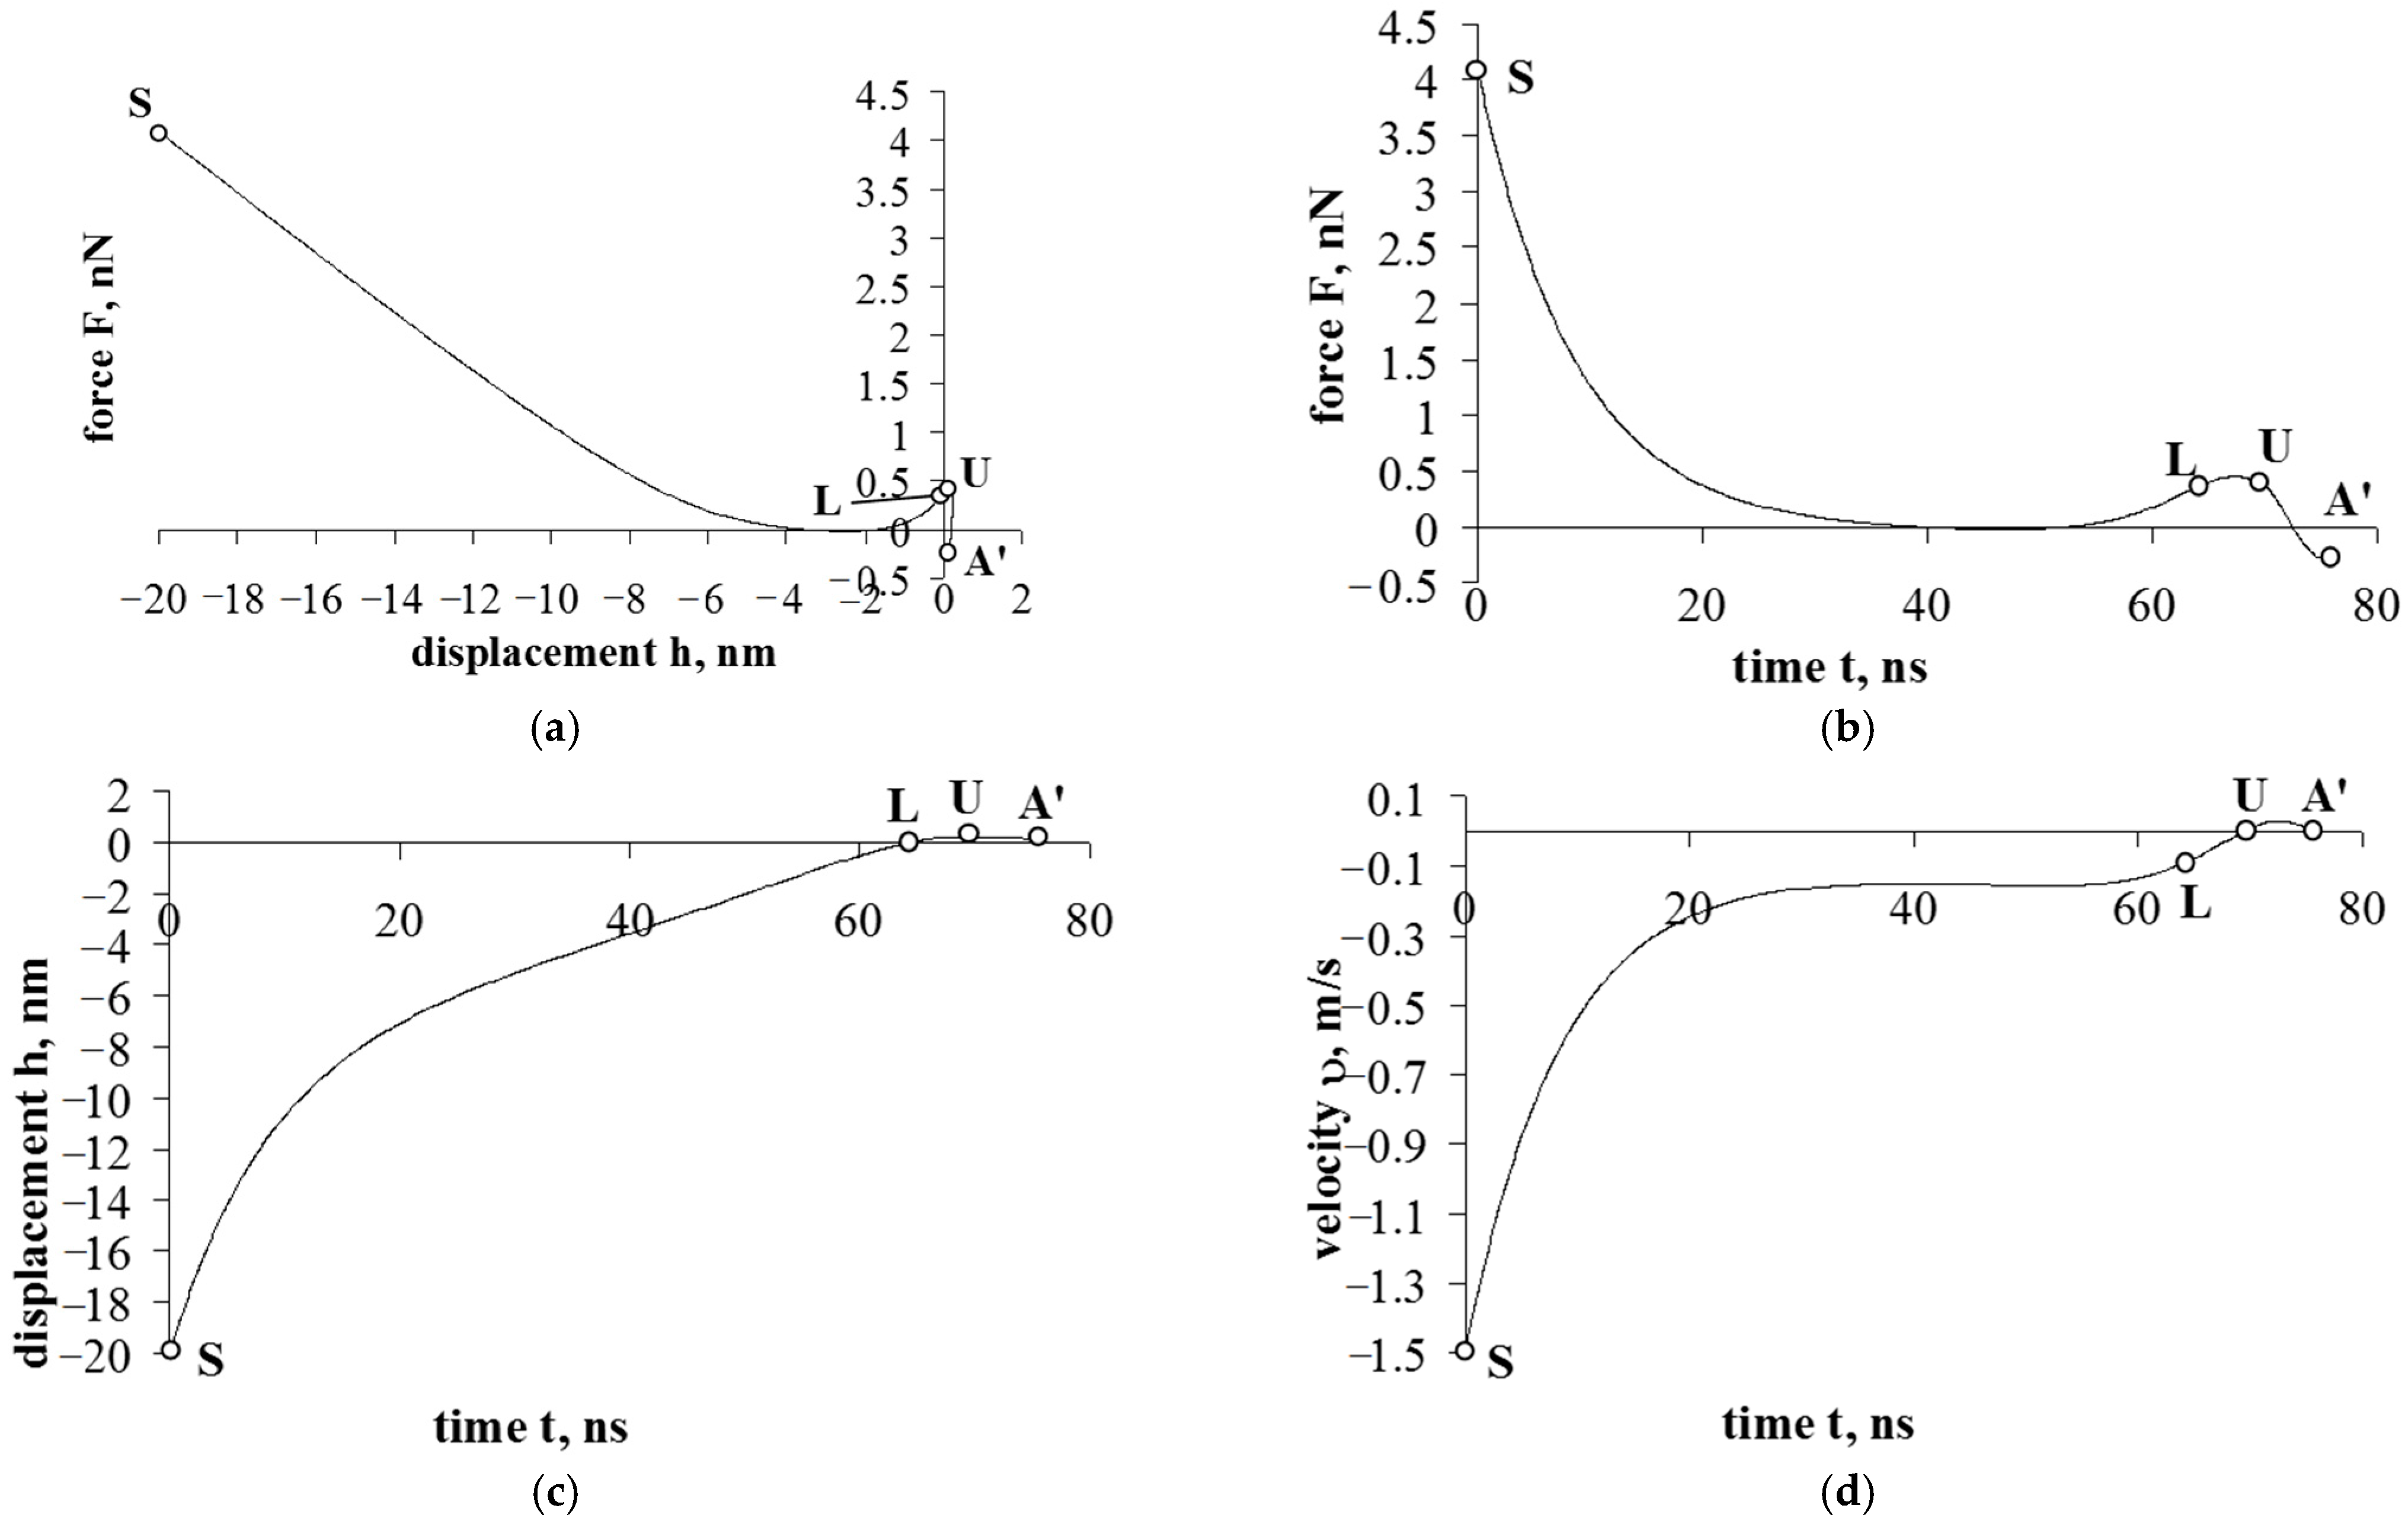
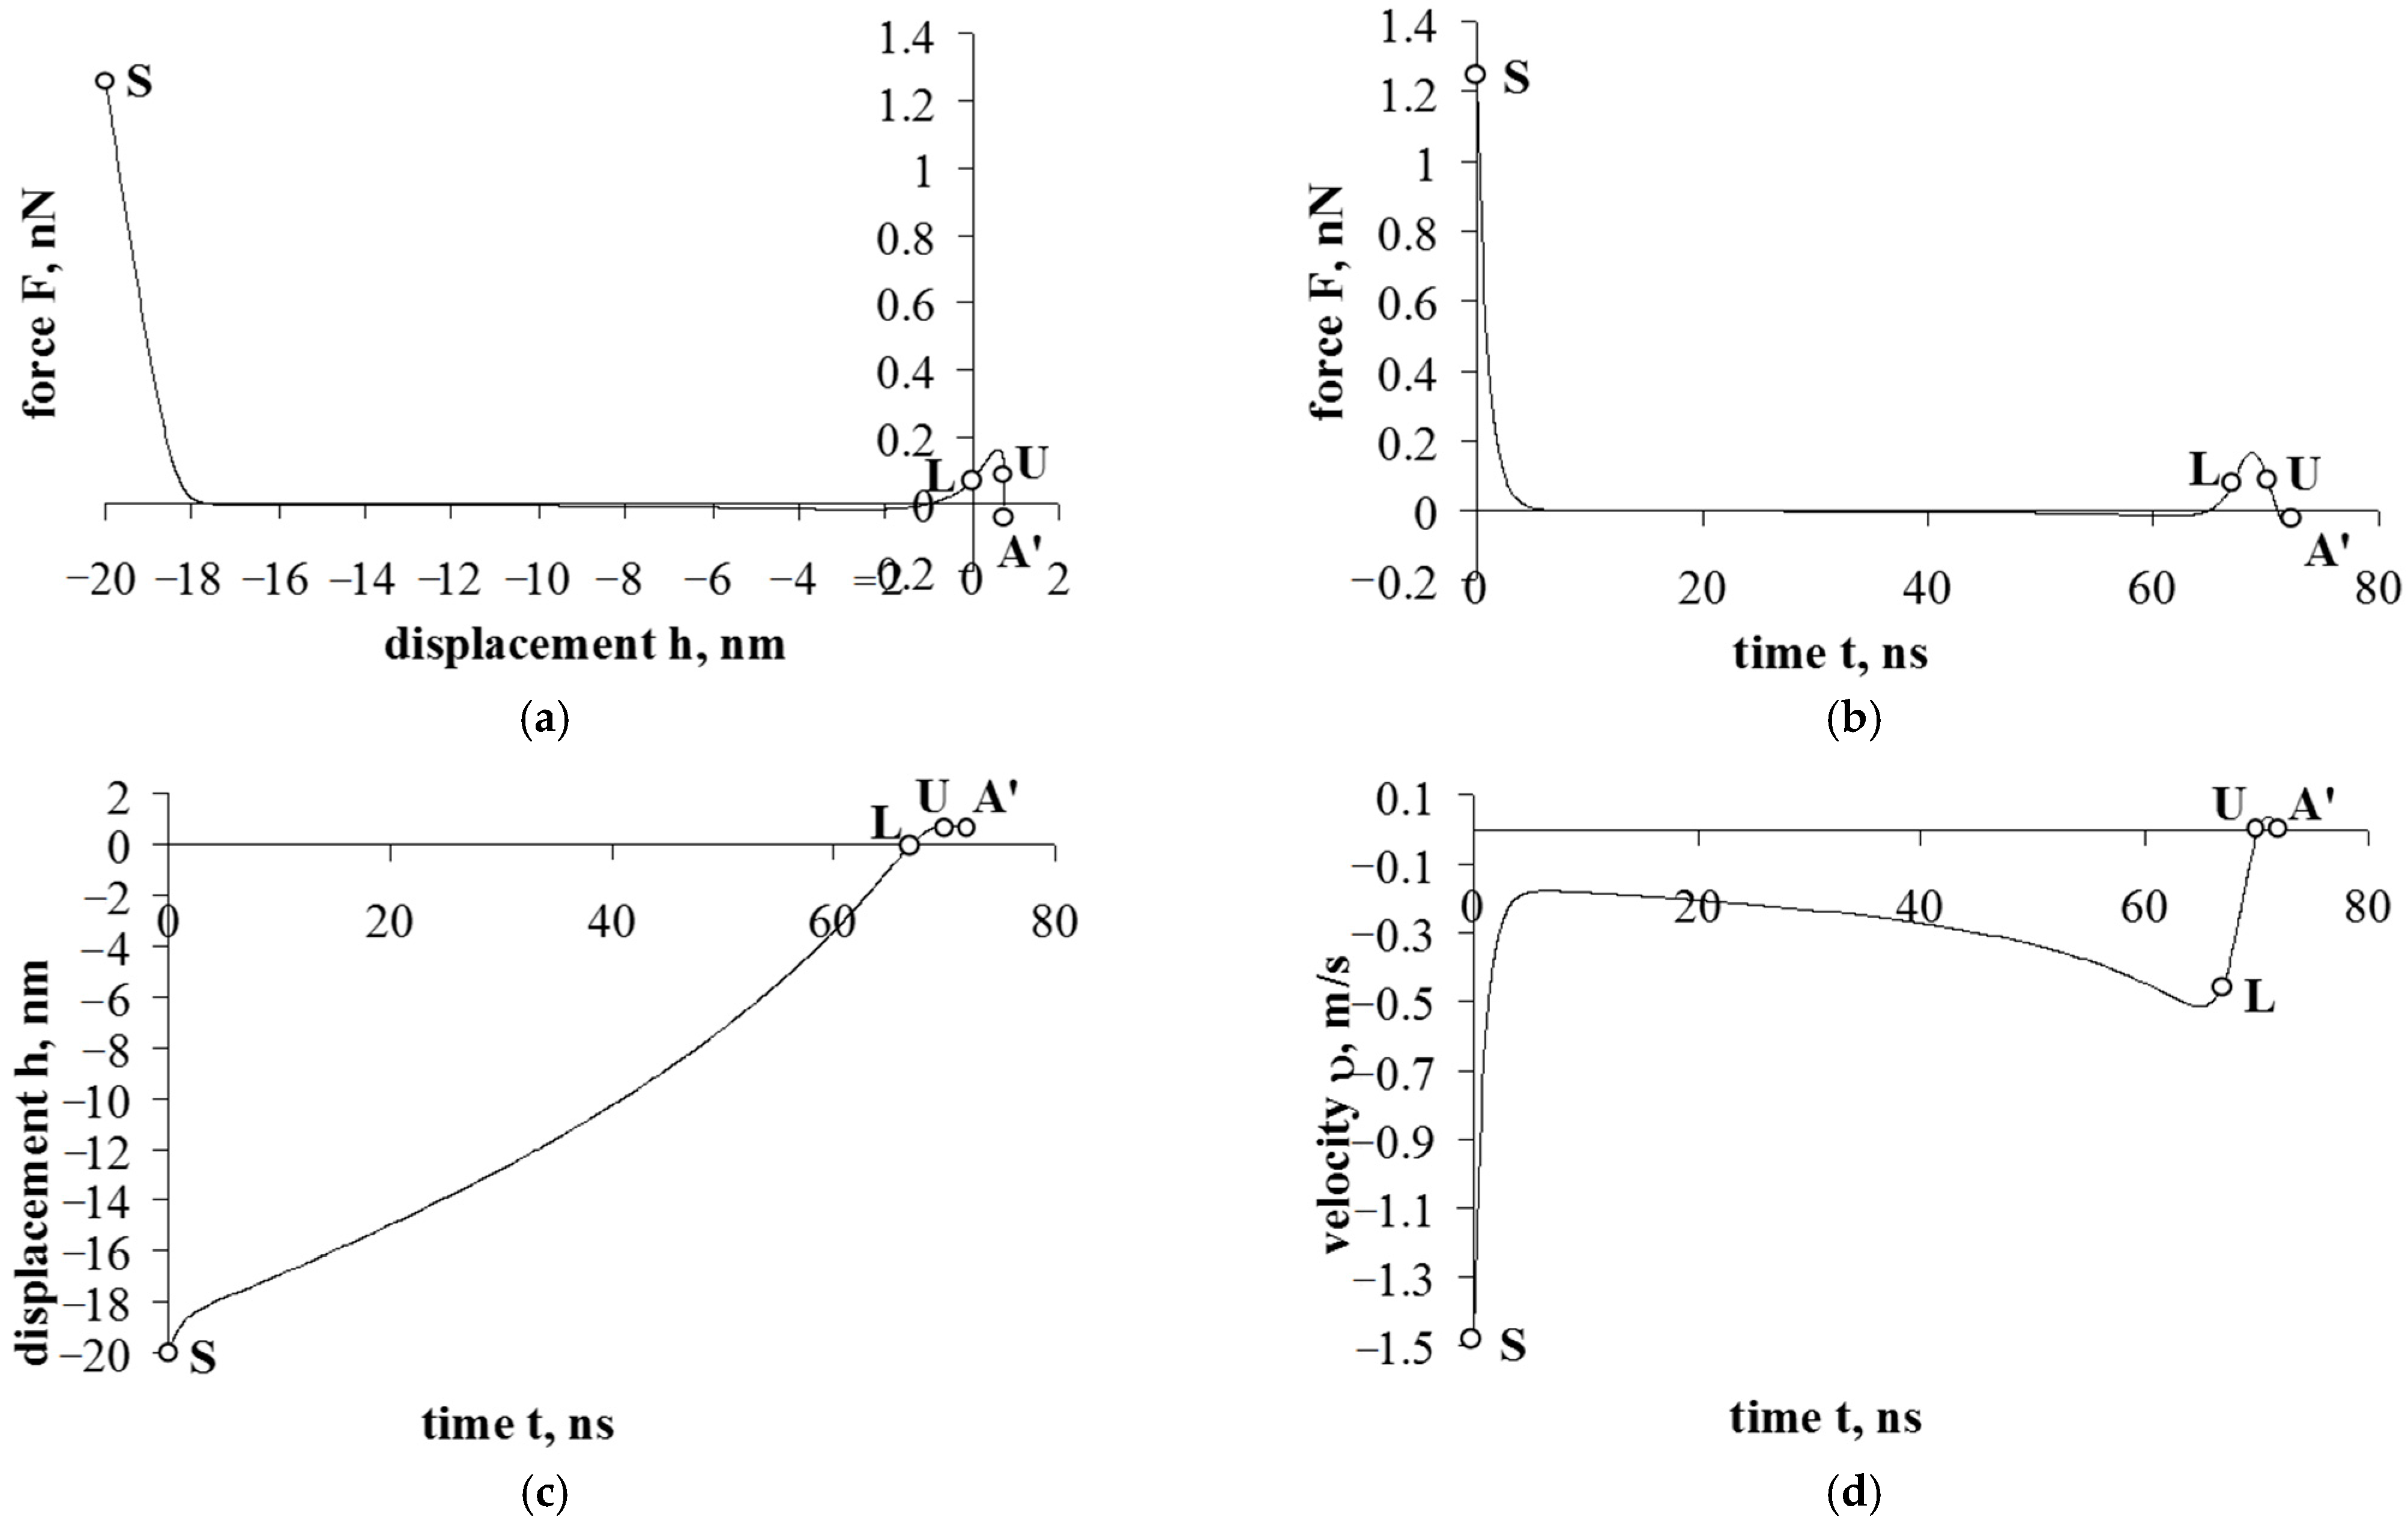
| 100 nm | , ns | 0 | 66.985 | 70.198 | 72.231 |
| , nN | 1.264 | 0.06914 | 0.0845 | −0.03 | |
| , nm | 20 | 0 | 0.750 | 0.703 | |
| , m/s | −1.5 | −0.4536 | 0 | 0 | |
| 300 nm | , ns | 0 | 64.401 | 69.583 | 75.847 |
| , nN | 4.091 | 0.375 | 0.4 | −0.279 | |
| , nm | 20 | 0 | 0.232 | 0.126 | |
| , m/s | −1.5 | −0.08841 | 0 | 0 | |
| Parameter Values at a Eight of 0.1 m/at a Height of 1.0 m/at a Height of 1.5 m | |||
|---|---|---|---|
| Parameter | Temperature, °C | Relative Humidity, % | Air flow Rate, m/s |
| At the entrance: | |||
| Zone A | 2.1/2.8/3.1 | 71.1/70.5/69.9 | 0.31/0.37/0.45 |
| Zone B | 2.9/3.5/3.9 | 65.5/64.6/63.1 | 0.21/0.27/0.31 |
| Zone C | 2.3/2.5/2.8 | 66.3/65.9/65.7 | 0.25/0.28/0.32 |
| At the exit: | |||
| Zone A | 2.5/3.0/3.4 | 71.1/70.5/69.9 | 0.32/0.38/0.43 |
| Zone B | 3.1/3.7/4.0 | 65.5/64.6/63.1 | 0.23/0.29/0.32 |
| Zone C | 2.5/2.8/3.1 | 66.3/65.9/65.7 | 0.27/0.29/0.33 |
| Across the inner space: Zone A | |||
| I | 3.4/3.7/4.1 | 60.5/59.6/59.1 | 0.21/0.27/0.31 |
| II | 3.7/3.9/4.2 | 58.3/57.1/56.8 | 0.22/0.26/0.32 |
| III | 3.5/3.8/4.1 | 58.5/57.5/57.9 | 0.23/0.26/0.29 |
| IV | 3.7/3.8/4.0 | 58.2/57.3/57.7 | 0.22/0.25/0.30 |
| Mean | 3.6/3.8/4.1 | 58.9/57.9/57.9 | 0.22/0.26/0.31 |
| Standard Deviation | 0.1/0.1/0.1 | 0.9/1.0/0.8 | 0.01/0.01/0.01 |
| Zone B | |||
| Mean | 3.9/4.1/4.5 | 57.2/56.2/56.2 | 0.23/0.27/0.32 |
| Standard Deviation | 0.1/0.1/0.1 | 0.9/1.0/0.8 | 0.01/0.01/0.01 |
| Zone C | |||
| Mean | 3.8/4.1/4.4 | 55.4/54.5/54.5 | 0.23/0.27/0.31 |
| Standard Deviation | 0.1/0.1/0.1 | 0.9/0.9/0.8 | 0.01/0.01/0.01 |
| Outdoor conditions at: | |||
| Zone A | 0.7 | 85.3 | 3.1 |
| Zone B | 1.2 | 72.3 | 3.8 |
| Zone C | 1.0 | 69.6 | 4.2 |
| Test Point No. | Numerical Concentration of Particles Not Smaller than the Specified Size (µm), Units | Average Number of Cars | |||||
|---|---|---|---|---|---|---|---|
| 0.3 | 0.5 | 1 | 2 | 5 | 10 | ||
| 1 | 34,365 | 6453 | 2565 | 630 | 53 | 7 | 2 |
| 2 | 58,658 | 8452 | 2994 | 731 | 66 | 5 | 3 |
| 3 | 36,163 | 7628 | 3147 | 847 | 90 | 6 | 1 |
| 4 | 43,474 | 7613 | 3169 | 812 | 94 | 8 | 1 |
| 5 | 53,597 | 7785 | 2851 | 691 | 72 | 5 | 1 |
| 6 | 39,613 | 6862 | 2670 | 660 | 71 | 5 | 1 |
| 7 | 47,043 | 7578 | 2928 | 741 | 68 | 3 | 0 |
| 8 | 44,371 | 7099 | 2737 | 688 | 69 | 4 | 2 |
| 9 | 66,498 | 8006 | 3162 | 828 | 102 | 8 | 2 |
| 10 | 45,894 | 7393 | 2789 | 675 | 81 | 6 | 2 |
| 11 | 38,136 | 6941 | 2775 | 699 | 89 | 7 | 2 |
| Test Point No. | Numerical Concentration of Particles not Smaller than the Specified Size (µm), Units | Average Number of Cars | |||||
|---|---|---|---|---|---|---|---|
| 0.3 | 0.5 | 1 | 2 | 5 | 10 | ||
| 1 | 86,775 | 6164 | 1677 | 497 | 87 | 1 | 0 |
| 2 | 87,495 | 6358 | 1658 | 493 | 82 | 1 | 0 |
| 3 | 116,438 | 8023 | 1989 | 538 | 69 | 2 | 0 |
| 4 | 110,691 | 7579 | 1890 | 555 | 91 | 3 | 0 |
| 5 | 97,392 | 7416 | 2079 | 665 | 125 | 7 | 1 |
| 6 | 105,723 | 7479 | 1988 | 639 | 114 | 6 | 0 |
| 7 | 96,512 | 7038 | 1977 | 613 | 112 | 2 | 0 |
| 8 | 104,724 | 6630 | 1737 | 593 | 123 | 11 | 0 |
| 9 | 96,286 | 6966 | 2003 | 662 | 124 | 9 | 0 |
| Test Point No. | Numerical Concentration of Particles Not Smaller than the Specified Size (µm), Units | Average Number of Cars | |||||
|---|---|---|---|---|---|---|---|
| 0.3 | 0.5 | 1 | 2 | 5 | 10 | ||
| 1 | 37,135 | 4041 | 1120 | 244 | 35 | 3 | 2 |
| 2 | 51,641 | 5493 | 1561 | 326 | 47 | 3 | 4 |
| 4 | 59,913 | 6550 | 1814 | 361 | 44 | 2 | 3 |
| 5 | 63,969 | 6509 | 1768 | 327 | 38 | 2 | 3 |
| 6 | 122,635 | 15,580 | 3906 | 642 | 63 | 3 | 1 |
| 7 | 109,927 | 13,059 | 3342 | 562 | 53 | 3 | 4 |
| 8 | 49,799 | 5240 | 1508 | 326 | 46 | 5 | 3 |
| Before lifting | 39,425 | 4480 | 1308 | 286 | 38 | 4 | 3 |
| Lifting | 42,667 | 4953 | 1177 | 259 | 35 | 4 | 3 |
| End of lifting | 52,026 | 5075 | 1171 | 258 | 43 | 6 | 3 |
Publisher’s Note: MDPI stays neutral with regard to jurisdictional claims in published maps and institutional affiliations. |
© 2022 by the authors. Licensee MDPI, Basel, Switzerland. This article is an open access article distributed under the terms and conditions of the Creative Commons Attribution (CC BY) license (https://creativecommons.org/licenses/by/4.0/).
Share and Cite
Chlebnikovas, A.; Jasevičius, R. Air Pollution with Fine Particles in Closed Parking and Theoretical Studies of the Interaction of Inhaled Particles in Respiratory Tract. Buildings 2022, 12, 1696. https://doi.org/10.3390/buildings12101696
Chlebnikovas A, Jasevičius R. Air Pollution with Fine Particles in Closed Parking and Theoretical Studies of the Interaction of Inhaled Particles in Respiratory Tract. Buildings. 2022; 12(10):1696. https://doi.org/10.3390/buildings12101696
Chicago/Turabian StyleChlebnikovas, Aleksandras, and Raimondas Jasevičius. 2022. "Air Pollution with Fine Particles in Closed Parking and Theoretical Studies of the Interaction of Inhaled Particles in Respiratory Tract" Buildings 12, no. 10: 1696. https://doi.org/10.3390/buildings12101696