Article

Analysis of the Effect of Mainshock-Aftershock Sequences on the Fragility of RC Bridge Columns

1
Department of Urban Construction, Beijing University of Technology, Beijing 100124, China
2
Key Laboratory of Urban Security and Disaster Engineering of Ministry of Education, Beijing University of Technology, Beijing 100124, China
*
Author to whom correspondence should be addressed.
Buildings 2022, 12(10), 1681; https://doi.org/10.3390/buildings12101681
Submission received: 25 August 2022 / Revised: 25 September 2022 / Accepted: 27 September 2022 / Published: 13 October 2022
(This article belongs to the Special Issue Structural Vibration Control Research)

Abstract

:
The mainshock (MS) is often accompanied by a number of aftershocks (AS). The existence of AS may cause the seismic demand to be greater than the MS. In order to better evaluate the impact of AS, this paper takes RC columns as the research object and performs incremental dynamic analysis (IDA) on the actual recorded mainshock-aftershocks (MS-AS). The Park–Ang model and incremental damage index are used to quantify the effect of the MS and AS, respectively. The damage and fragility analysis of the parameters such as reinforcement ratio, axial compression ratio and shear-span ratio are carried out respectively. The results show that the seismic demand of the MS-AS is greater than the MS. Besides, the damage of the column gradually increases with the increase of axial compression ratio and shear-span ratio, and gradually decreases with the increase of the reinforcement ratio. When the seismic design grade is 7, 8, and 9 degree, the maximum increase rate of additional damage caused by aftershocks is 7, 13, and 15% of the MS, respectively. When the column is in a medium damaged and a severely damaged state, the growth rate of additional damage can be estimated to be 12.7 and 11% of the MS, respectively. The fragility of columns in different damage states under the action of MS-AS is greater than that of MS. Reducing the axial pressure ratio can greatly reduce the damage probability of columns in different damage states. The effect of the MS-AS can be comprehensively considered to select appropriate design parameters in the design, and the additional damage caused by the AS can be estimated according to the damage condition of the column.

1. Introduction

A large amount of historical data indicates that earthquakes often occur in the form of earthquake sequences [1]. Although most aftershocks are not as strong as the mainshock, the strength and stiffness of the concrete structure are often degraded due to the effect of the mainshock. Due to the limited time between the mainshock and the aftershock, it is often impossible to repair, and the effect of the aftershock on the structure is even greater than the mainshock, causing further structural damage or even collapse [2,3]. The past series of earthquakes also show that the existence of aftershock tends to exacerbate the loss of structures in earthquakes. Quantifying the risk of further damage to the bridge from aftershocks is essential to post mainshock decision-making, functionality, and recovery. The compounding effect of the damage and disruption caused by the earthquake sequences in Chi-Chi (1999), Wenchuan (2008), Tohoku (2011), and Italy (2016) are just a few examples of the implications of mainshock-aftershock event sequences (Atzori et al. 2012 [4]; Kazama and Noda 2012 [5]; Galadini et al., 2017 [6]). Therefore, the damage of aftershock to the structure cannot be ignored. However, the magnitude of aftershock effect on concrete structures and the effect of aftershock in different damage states are not clear. Even the impact of aftershocks is not considered in the existing specification.
In recent years, the research on aftershocks has been beneficially explored by the academic community. Ji et al. [7] selected more than 200 MS-AS sequences from very dense and hard soil profiles, performed a nonlinear response history analysis of the single-degree-of-freedom, and evaluated the effects of structure, strong ground motion, and site-specific parameters on the γ index. Wen et al. [8] studied the effect of rotating mainshock-aftershock sequences in different directions on the seismic performance of the structure. The effect of ground motion rotation is significant for MS-AS sequences and can exceed 25% for all EDPs considered. Amiri S et al. [9] performed MS-AS analysis for a single degree of freedom using residual displacement as an index. The functional relationship between the residual displacement ratio and the elastic vibration period is predicted under different post-yielding stiffness ratio levels and different aftershock intensities. The proposed equations can be used for structural seismic evaluation for MS-AS sequences. Shokrabadi M et al. [10,11] used the MS-AS to evaluate the structural performance of five ductile reinforced concrete frames of different heights using a continuous nonlinear response history analysis method. Zhang et al. [12] proposed a new approach to develop state-dependent fragility curves using real MS-AS records. Results indicated that fragility curves based on residual interstorey drift ratio, peak ground velocity, and maximum inter-storey drift ratio are the best choice to characterize the cumulative damage effect. A summary of the above studies reveals that most of the studies are based on real main aftershock ground vibrations for single-degree-of-freedom structures. However, most of the studies are limited to structures of a particular period, and less research has been conducted on the additional damage caused by aftershocks in different damage states. Therefore, the additional damage caused by aftershocks in different damage states needs to be further explored.
A fragility curve describes the probability of a structure being damaged beyond a specific limit state for various levels of earthquake. An important aspect of structural seismic fragility is to derive the fragility curve to determine the degree of damage under different intensities [13]. Chen et al. [14] investigates the seismic fragility and the associated direct financial losses of tall pier bridges subjected to MA sequences using the vector-based intensity measure considering both main- and aftershocks. The analytical results show that while the structural vulnerabilities increase with both the intensities of main- and aftershocks, the role of mainshocks is observed more substantially. Hashemi S V et al. [15] studied the seismic performance of the BRB frame and the effect of SMA on the seismic performance of the frame. The results showed that the use of SMA can reduce the cost of repair and restoration of damaged systems, making building systems more resilient. Ali Massumi et al. [16] presented the effects of aftershock ground motion on the collapse capacity of post-mainshock buildings. The different parameters were selected to evaluate the effect of its characteristics on the collapse capacity of buildings. Irfan Z et al. [17] assessed the seismic performance of existing buildings through an IDA-based vulnerability curve. The type of building damage can be predicted by referring to the vulnerability curve. However, previous studies on bridge seismic risk assessment were less focused on the effect of the mainshocks, and aftershock has often been ignored [18,19,20,21,22,23]. Neglecting aftershocks may lead to a severe underestimation of the seismic collapse risk [24,25,26,27,28]. An accurate evaluation of highway bridges under the action of seismic sequence is necessary. A summary of the above on vulnerability can be found: IDA is an effective means to study the main-aftershock. Most of the studies of fragility to damage are directed to a specific structure. For bridge structures, the increments of aftershocks on the probability of exceeding different damage states need to be further explored.
Based on the shortcomings of the above studies, the purpose of this paper is to quantify the damage of aftershocks at different earthquake magnitudes and the effects of aftershocks on different damaged structures. Therefore, the study combines the basic structure of the bridge, i.e., the column, to carry out the time history analysis of the MS-AS. The difference in the period of bridge piers can be realized by adjusting the reinforcement ratio and the axial compression ratio. The models of the RC column are established with OpenSees. The nonlinear time history analysis of incremental dynamic analysis (IDA) under multiple working conditions of MS and MS-AS are carried out based on the actually recorded seismic waves. The damage of columns with different parameters is quantified based on the Park–Ang damage model. The additional damage caused by AS under different seismic intensity and the effect of AS under different damage states are obtained. Combined with the theory of vulnerability analysis, the vulnerability curves are used to comprehensively evaluate the damage probability of columns in different damage states. This paper provides guidance for the design of bridges in multi-seismic areas and damaged bridges to resist AS. The flow chart of research content and significance is shown in Figure 1.
As can be seen from Figure 1, the seismic magnitude is selected according to the site conditions for site-specific design. Based on the quantitative description of aftershock deterioration damage in this paper, it is verified whether the bridge meets the design requirements under the action of the MS-AS. For the damaged piers, the magnitude of the AS impact on the damaged structure is judged according to the existing damage state so that some necessary measures can be taken to avoid further economic losses.

2. Basic Theory of Analysis

2.1. Damage Model and Damage Index

The Park–Ang damage model was proposed by Park and Ang [29] in 1985. The model used the linear combination of the maximum displacement of the structure and the accumulated hysteretic energy to express the damage of the structure. The calculation formula of the Park–Ang is shown in Equation (1).
D I = δ m a x δ u d E F y δ u
In Equation (1): DI is the damage index of the structure; δmax is the maximum displacement of the component under the action of an earthquake; δu is the ultimate displacement of a component under monotonic loading failure. The deformation corresponding to the strength of the component drops to 85%; Fy is the yield shear force of the component; d E is the hysteretic energy absorbed by the component; β is the energy dissipation factor and the value is 0.15 in this study.
The corresponding relationship between the different damage states and the damage index obtained from the Kunnath [30] column test. The research of Hose et al. [31] on the performance level of bridge structures are considered in this study. This paper uses five kinds of levels of damage. The corresponding relationship between different grades and damage index is shown in Table 1.

2.2. Incremental Damage Evaluation Index

In order to explain the relationship between the additional damage caused by the AS and the damage caused by the MS, Yu [32] proposed the incremental damage index to quantify the damage of AS. The expression is shown in Equation (2).
δ D I = | D I M A D I M D I M | × 100 %
In Equation (2): δDI is incremental damage index; DIMA and DIM are the cumulative damage of the structure under the action of the MS-AS and the MS, respectively.

2.3. Fragility Analysis Theory

The fragility of structure refers to the probability of exceeding a certain failure state under the action of a certain intensity of ground motion. The expression of beyond probability is shown in Equation (3):
F d , i ( x ) = p [ D C | I M = x ] ; i = 1 , 2 , N
In Equation (3): D is the seismic demand of the structure; C is the seismic capacity of the structure; IM is the seismic intensity parameter.
The nonlinear time history analysis of the structure is carried out. The logarithmic discrete points of the seismic intensity parameters and the seismic demand values of the structure are input into the Cartesian coordinate system. The logarithmic discrete point regression analysis is carried out to obtain the relationship between the seismic demand of the structure and the seismic intensity [33,34]. The expression is shown in Equation (4):
ln ( S D ) = a ln ( I M ) + ln ( b )
In Equation (4): IM represents the ground motion intensity parameter; a ,   b represent the linear regression coefficient.
The logarithmic standard deviation β D | I M is expressed as Equation (5):
β D | I M = S r N 2
In Equation (5), N is the number of nonlinear time history analysis, Sr is the residual sum of squares of regression analysis.
The expression is shown in Equation (6):
S r = i = 1 n [ ln ( D i ( ln b + a ln I M i ) ] 2
Combining Equations (4) and (5) to obtain a probabilistic seismic demand model, as shown in Equation (7):
P [ D C | I M ] = 1 Φ ( ln S C ln S D β D | I M )
Many scholars had assumed that both the capacity limit state and the seismic response of the component obey the lognormal distribution, and the logarithmic value also obeys the lognormal distribution [35]. The lognormal distribution can be expressed as Equation (8):
f ( x ) = 1 2 π σ ln x x e ( x μ ln x ) 2 2 σ ln x 2 , 0 < x < +
In Equation (8):
σ ln x = ln ( 1 + δ x 2 )
μ ln x = ln ( μ x 1 + δ x 2 )
In Equation (9), σ ln x is the logarithmic standard deviation. In Equation (10), μ ln x is the log mean of the structure response.
Equation (7) can be expressed as the Equation (11):
P [ D C | I M ] = Φ ( ln S D / S C β D 2 + β C 2 )
In Equation (11), Sc is the mean value of the seismic capacity of the structure, βc and βD are the standard deviations of competence and demand for structure. When the spectral acceleration Sa [36] is used as the independent variable, β D 2 + β C 2 is taken as 0.4; when the peak acceleration PGA is used as the independent variable, β D 2 + β C 2 is taken as 0.5.

3. Numerical Model and Selection of Ground Motion

3.1. Numerical Simulation of Bridge Column

According to the regulation of the bridge in the current “Guideline for Seismic Design of Highway Bridges”, the bridge column can usually be simplified as “single column model” in seismic analysis. In this study, the time history analysis of MS-AS is carried out. When the shear-span ratio of the column (L0/D) is 10, the axial compression ratio μ is from 0.05 to 0.2. The axial compression ratio in this paper is calculated by the standard value of concrete strength, i.e., fck = 26.8 Mpa. When the axial compression ratio μ is 0.1, the shear span ratio of the column is 6, 10, 14 and 18, respectively. Based on the OpenSees finite element software, different materials are used to simulate the different positions of the section, i.e., the Concrete01 is used to simulate the protective layer and constrained concrete, and the Kent–Park model [37] is used to calculate the stress–strain relationship. The reinforcing steel constitutive model [38] can well consider the yield and fatigue of longitudinal reinforcement and reflect the yield and hardening of reinforcement under earthquake action, which is used to simulate reinforcement. Each node of the column is connected by fiber elements and the cross-section of the column is divided into several fibers, and different fiber materials give different constitutive relationships. The element type of the node connection is the nonlinear beam column. Element deformation takes into account the P-Δ effect. The simplified numerical model of the column is shown in Figure 2. The basic parameters of reinforcement and concrete are shown in Table 2.

3.2. Determination of Basic Parameters of Damage Model

In order to obtain the required parameters of the damage model, the piers are subjected to pushover loading. The yield displacement and yield strength of the piers are obtained according to the equivalent energy method. The results are shown in Figure 3. DY represents the yield displacement; DU represents the ultimate displacement, and FY represents the yield load. μ represents the axial pressure ratio in Figure 3. Different structures often have different periods, and the basic period of the structure represents the basic characteristics of the structure. Therefore, a basic periodic analysis is performed on the designed piers. The results are shown in Table 3.
Figure 3 indicates that the equivalent yield displacement of the column is almost unchanged with the increase of the reinforcement ratio and axial compression ratio. The ultimate displacement decreases nonlinearly with the increase of the axial compression ratio. The larger the axial compression ratio, the smaller the ultimate displacement. The equivalent yield load of the column increases linearly with the increase of the reinforcement ratio. The larger the axial compression ratio, the greater the equivalent yield load. Table 3 shows that the basic period of the column gradually decreases with the increase of the reinforcement ratio and increases with the increase of the axial compression ratio.
When the axial compression ratio increases, the concrete area in the compression zone increases, and the stress of the tensile steel bars decreases, which can result in a slight increase in the equivalent yield load of the column. The ultimate displacement is the displacement value when the column drops to 85% of the maximum load. Due to the P-Δ effect of the column and eccentric compression, the concrete at the bottom of the column with a larger axial compression ratio is more likely to collapse and reach the ultimate displacement. When the reinforcement ratio increases, the height of the concrete compression zone increases and most of the column section is compressed, and a small eccentric compression failure mode appears. As a result, the concrete in the compression zone is more likely to reach the ultimate compressive stress and reach the ultimate displacement.

3.3. Selection and Synthesis of Seismic Waves

Since multiple AS often occur after the MS, this paper selected the largest AS as the AS [39,40]. Due to the seismic frequency spectrum characteristics and the effect of duration, the MS-AS seismic waves of different sites are different. According to the shear wave velocity, 26 mainshocks and aftershocks with shear wave velocities between 350 and 500 m/s in the Chi-Chi earthquake were selected. The acceleration response spectra of the MS and AS with damping ratio of 5% are shown in Figure 4 and Figure 5, respectively. The intensity of ground motion [41] can be described by the peak acceleration (PGA), the response spectrum acceleration Sa (T), etc. The research results of Padgett et al. [42] showed that the PGA was a more appropriate index of earthquake intensity. Therefore, this study chooses PGA as the seismic wave intensity index. The MS and AS measured at the same station are connected to form the MS-AS sequences. The MS and AS are separated by 30 s to ensure that the structure has enough free vibration time after MS to simulate real MS-AS sequences [43].

4. Damage Analysis of RC Column under MS-AS

The Guideline for Seismic Design of Highway Bridges (JTGTB02-01-2008) gives different seismic acceleration peaks to different seismic intensity, i.e., 6 degree (a = 0.05 g), 7 degree (a = 0.1 g or 0.15 g), 8 degree (a = 0.2 g or 0.3 g), 9 degree (a = 0.4 g). This study modulates the selected peak acceleration of ground motion between 0.05 g and 0.4 g at intervals of 0.05 g. A total of 12,896 working conditions is obtained. The maximum displacement at the top of the column and the shear force at the bottom of the column are extracted from the analysis results, and the damage is calculated according to the Park–Ang model. The average value of the damage index under the same peak acceleration is taken as the damage of a certain earthquake intensity, and the effect of aftershock is explained by the incremental damage index.

4.1. Effect of Axial Compression Ratio on Damage of RC Column

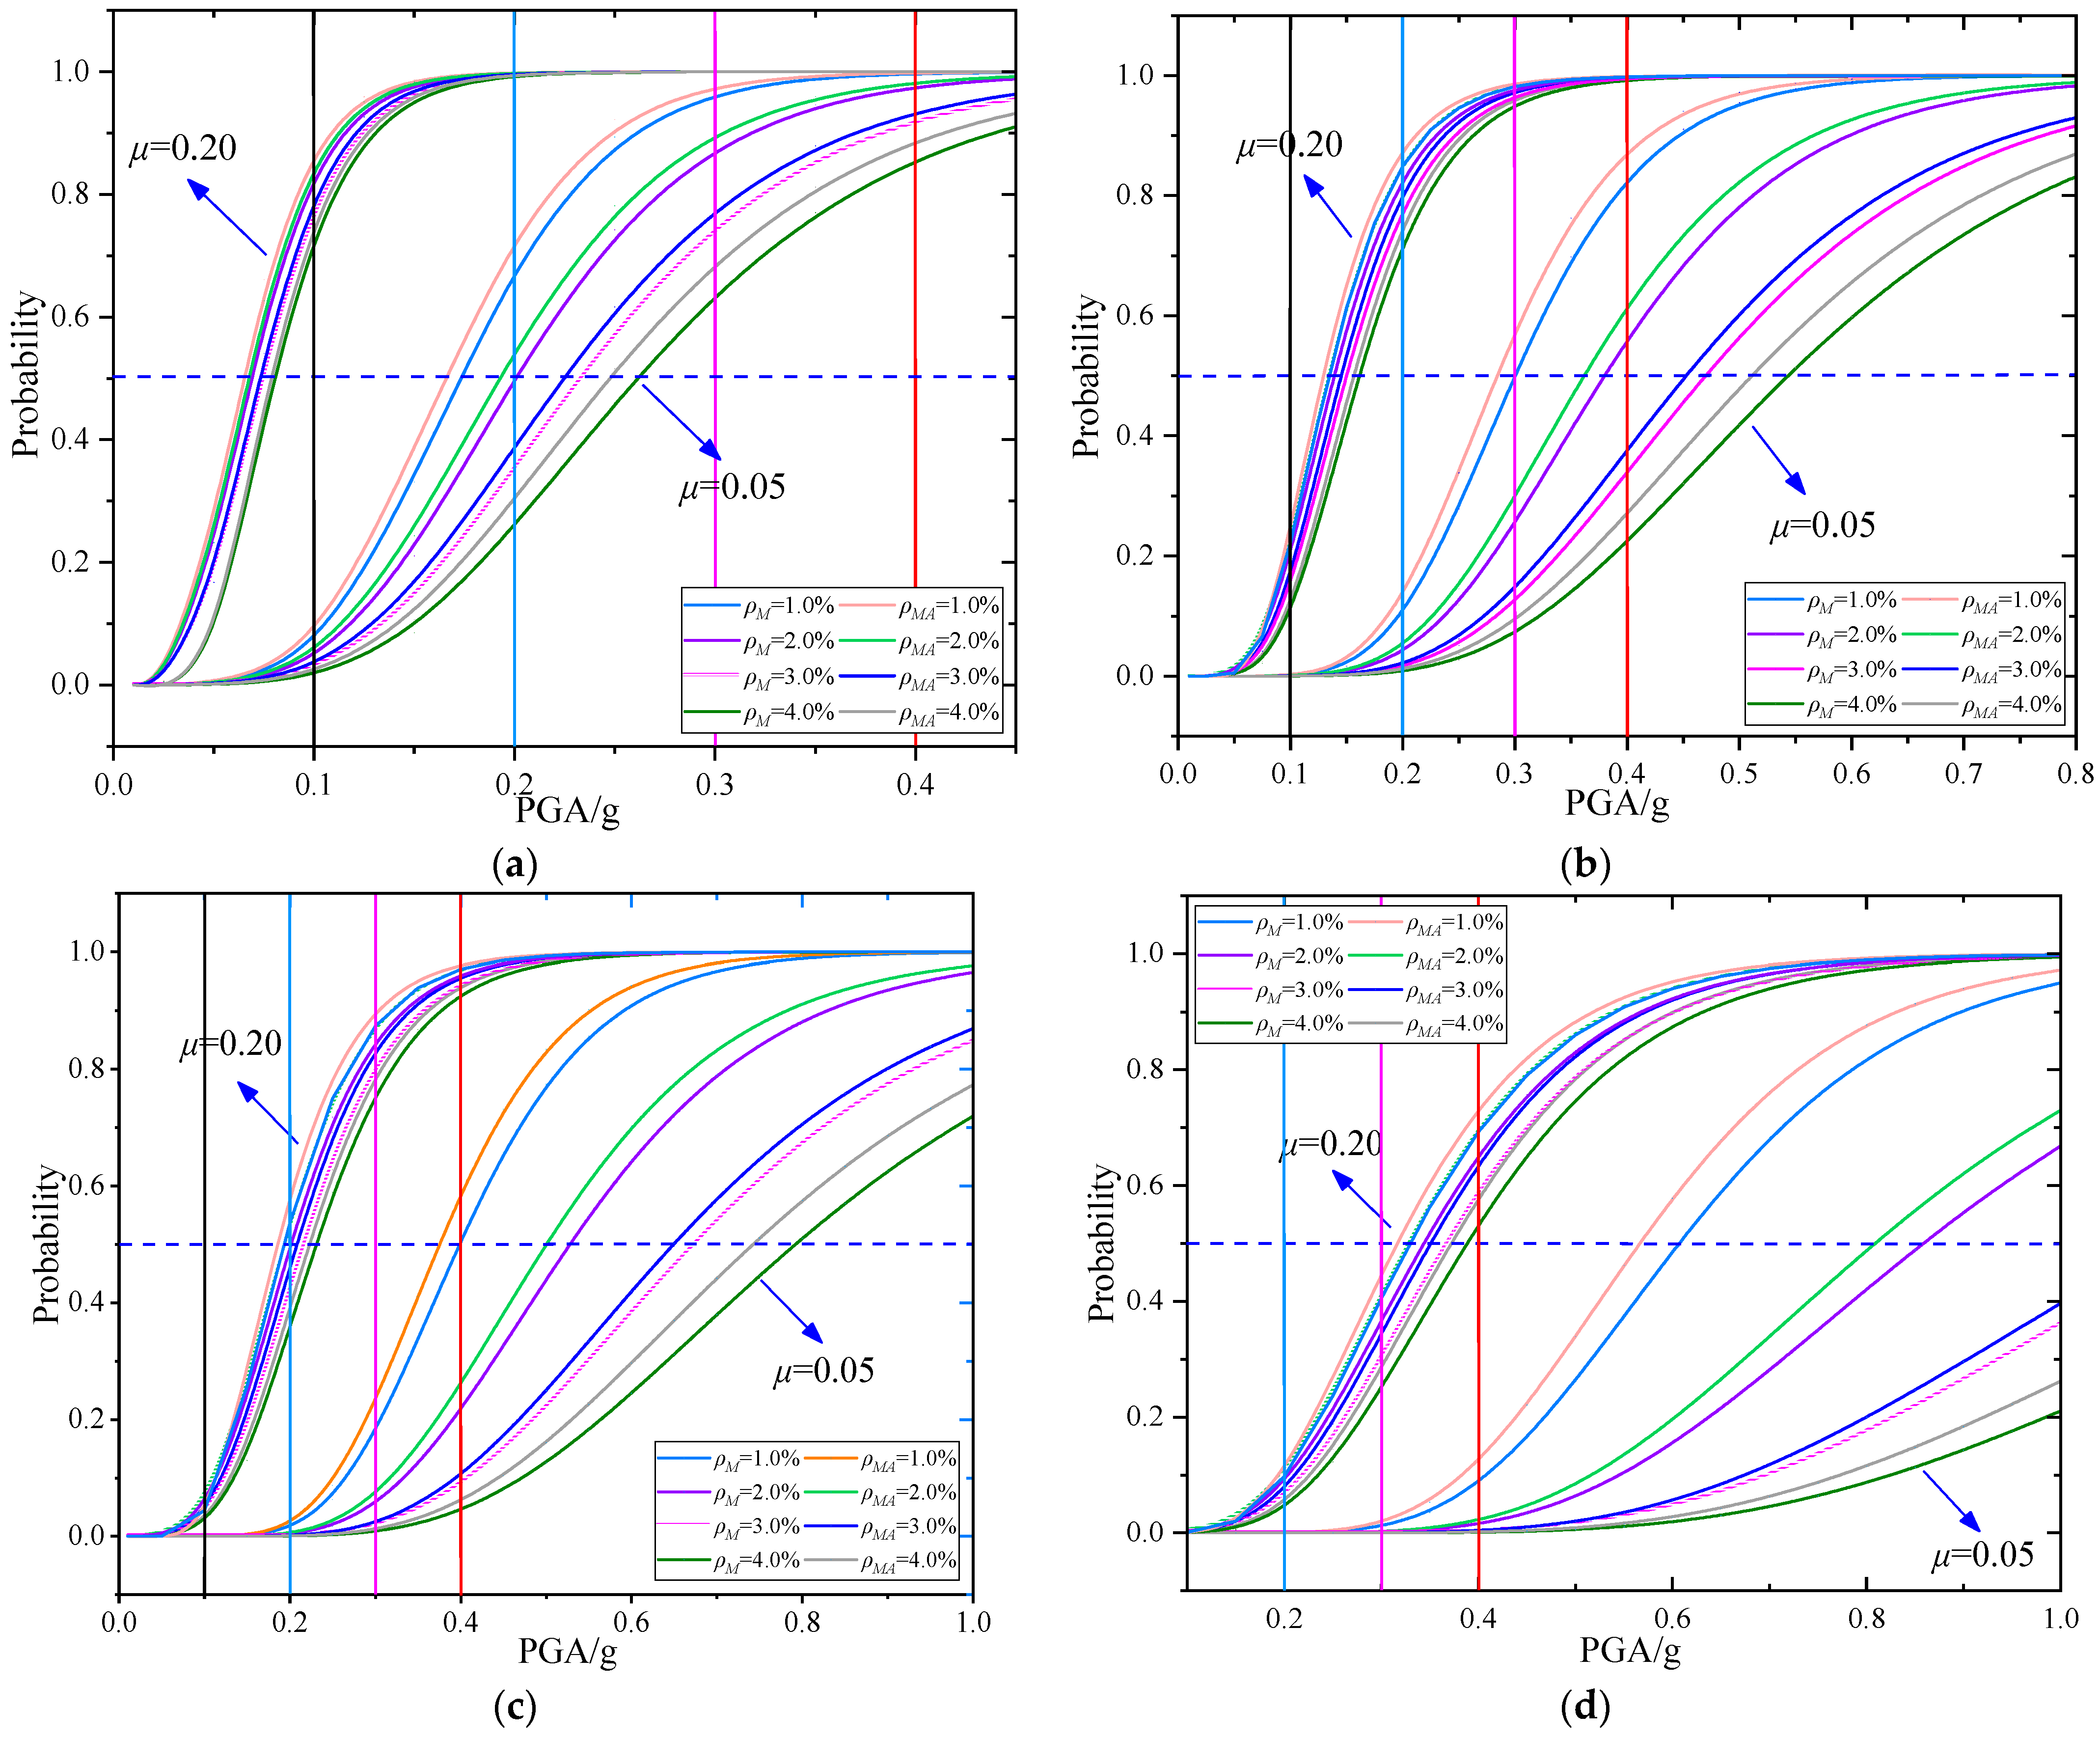
In order to illustrate the influence of aftershocks on bridge piers with different periods, the cross-combination is carried out in combination with the common reinforcement ratio and axial compression ratio. The MS and MS-AS sequences time history analysis were performed on the designed columns. Due to the limitation of space, only the damage index of partial reinforcement ratio is listed here. The damage of the columns is shown in Figure 6a–d.
Figure 6 indicates that the seismic demand of the column under the action of the MS-AS is greater than MS, and this demand increases with the increase of axial compression ratio and decreases with the increase of reinforcement ratio. Besides, the column is in a slight or no damage state when PGA ≤ 0.1 g, and the effect of aftershock can be basically ignored. However, the additional damage caused by the aftershock is less when the column damage index is greater than 0.8. The reason is that the average value of the column damage under the same PGA is taken. When the damage of the mainshock is greater than 1, aftershock is not probable to cause additional damage. The number of seismic waves with damage index exceeding 1 caused by mainshock increases with the increase of mainshock damage, resulting in a small proportion of the aftershock damage.
Figure 6a shows that the effect of aftershock under different earthquake intensities decreases with the reduction of mainshock damage. The damage of different columns under the action of the MS-AS is reduced from slight damage state to non-damage state when PGA = 0.2 g, which could possibly improve the durability of the column. Furthermore, increasing the reinforcement ratio can not only significantly reduce the damage of the column caused by the MS, but also reduce the effect of aftershock when PGA ≥ 0.3 g. Figure 6b indicates that the effect of aftershock under different earthquake intensities decreases with the decrease of mainshock damage. Besides, increasing the reinforcement ratio is likely to reduce the damage of the column from medium damage to slight damage when PGA = 0.2 g. Increasing the reinforcement ratio is possible to reduce the column from severe damage to medium damage and avoid further deterioration when PGA = 0.3 g. Moreover, some columns with smaller reinforcement ratio can have collapsed due to the effect of aftershock when PGA = 0.4 g and increasing the reinforcement ratio is likely to avoid the collapse of the bridge.
Figure 6c indicates that increasing the reinforcement ratio can reduce the damage of the column from severe damage to slightly damaged when PGA = 0.2 g, and the columns generally do not collapse. Besides, increasing the reinforcement ratio is possible to reduce the damage index when PGA = 0.3 g, and the column may collapse due to the impact of aftershocks when PGA = 0.4 g and ρ = 3.0%. Figure 6d shows that increasing the reinforcement ratio can reduce the damage of the column from severe damage to medium damage and avoid further deterioration when PGA = 0.2 g. Besides, the column with smaller reinforcement ratio can collapse due to the effect of aftershock, and increasing the reinforcement ratio is probable to prevent the bridge from collapsing when PGA = 0.3 g. Furthermore, it is probable that the columns collapse when PGA = 0.4 g. The collapse of the column is likely to be avoided by adjusting the axial compression ratio. Therefore, the appropriate axial compression ratio and reinforcement ratio should be selected for the high earthquake area. The effect of aftershock should be considered in varying degrees.
In order to study the effect of aftershock, the above Formula (2) is used to quantitatively analyze the additional damage caused by aftershock. For the convenience of statistics, the growth rate of the damage of the column caused by aftershock is calculated separately. The maximum damage rate of columns with different reinforcement ratios is regarded as the damage of a certain axial compression ratio. The results are shown in Table 4.
Table 4 indicates that the growth rate of additional damage to the columns caused by an aftershock gradually decreases with the increase of the axial compression ratio, and it initially increases and then decreases with the increase of PGA. Besides, the maximum damage growth rate of columns of different magnitudes is not probable to exceed 13%. When the seismic level is 7 degree, the maximum increase rate of damage caused by aftershock is about 7% of the mainshock. When the seismic level is 8 degree, the maximum increase rate of damage caused by aftershock is about 13% of the mainshock. When the seismic level is 9 degree, the maximum growth rate of damage caused by aftershock is about 12% of the mainshock. Due to the damage of the column, a slight aftershock is likely to exceed the bearing capacity limit, causing serious economic losses. Therefore, the additional damage caused by aftershock can be comprehensively considered in the design according to different magnitudes.
The growth rate of additional damage to the column caused by aftershock does not appear at μ = 0.2. The main reasons are: (1) As the axial compression ratio increases, the damage to the column caused by the mainshock gradually increases, and the additional caused by aftershock is relatively reduced. (2) When the damage index of the mainshock is greater than 1, it is probable that the aftershock is not likely to cause additional damage, resulting in a relatively low increase in damage caused by the aftershock.

4.2. Effect of Shear-Span Ratio on Damage of RC Column

In order to illustrate the generality of the above research conclusions, a comparative analysis of MS-AS damage of bridge columns with different shear-span ratios is carried out. The basic parameters of the bridge column are ρ = 2.0%, ρsv = 1.5%, μ = 0.1. Time history and modal analysis of the column with shear-span ratios of 6, 10, 14, and 18 are carried out. Figure 7 shows the damage comparison chart of the bridge column under the action of MS and MS-AS of different seismic intensity. The basic period and additional damage are shown in Table 5.
Figure 7 indicates that the MS-AS earthquake demand of columns with different shear-span ratios is greater than the MS. As the shear-span ratio increases, the seismic demand gradually increases. Table 5 shows that the column damage index is less than 0.2 and the growth rate of column damage does not exceed 2.5% when PGA ≤ 0.1 g. Therefore, the effect of aftershock can be ignored. Besides, the columns with different shear-span ratios does not exceed medium damage and the growth rate of additional damage caused by aftershock does not exceed 10% when PGA = 0.2 g. When PGA = 0.3 g and 0.4 g, the damage growth rates of the column with a shear-span ratio of 6 caused by aftershock are 11.71 and 14.79%, respectively. However, the columns are slightly and severely damaged under the action of the mainshock, and the actual damage caused is limited. Furthermore, the growth rate of additional damage to columns caused by aftershock gradually decreases with the increase in shear-span ratio with different magnitudes. This situation is closely related to the additional damage of the column caused by aftershocks less than 1 and the large difference in the period of the column. For the area with a seismic level of 6 degree, the effect of aftershock can be ignored. When the seismic intensity is 7 degree, the additional damage caused by aftershock is about 4%. When the seismic intensity is 8 degree, the additional damage caused by aftershock is about 12%. When the seismic intensity is 9 degree, the additional damage caused by aftershock is about 15%. The damage growth rate of different seismic intensity caused by aftershock is close to the above research.
From the above study, it can be seen that the additional damage caused by aftershocks did not exceed 15%, which is smaller than 25% proposed by Wen [8,28]. The main reason is that the effect of incidence angle is not considered in this paper, and the damage is additional damage at the specified seismic wave velocity. In addition, the conclusion of this paper is greater than the 12.3% proposed by Zhang [12] because the object of study in reference [12] is wooden structures with a greater capacity to absorb seismic energy under earthquake.

4.3. Effect of Aftershock on Column with Different Damage Degree

For bridge structures in practical engineering, the occurrence of MS is often accompanied by AS. Although the intensity of AS is mostly less than that of MS, the structure is often already deteriorated when AS occur, which may lead to further increase of structural damage. Given that most of the existing research is focused on MS and less on AS, Equation (2) is used to quantify the additional damage caused by AS in order to make use of the existing research results for MS in structural design. The steps of the analysis in this section are as follows: (1) the IDA of MS and MS-AS is carried out for the pier; (2) the damage states of piers with different reinforcement rates caused by MS are counted and classified according to the damage states selected in 
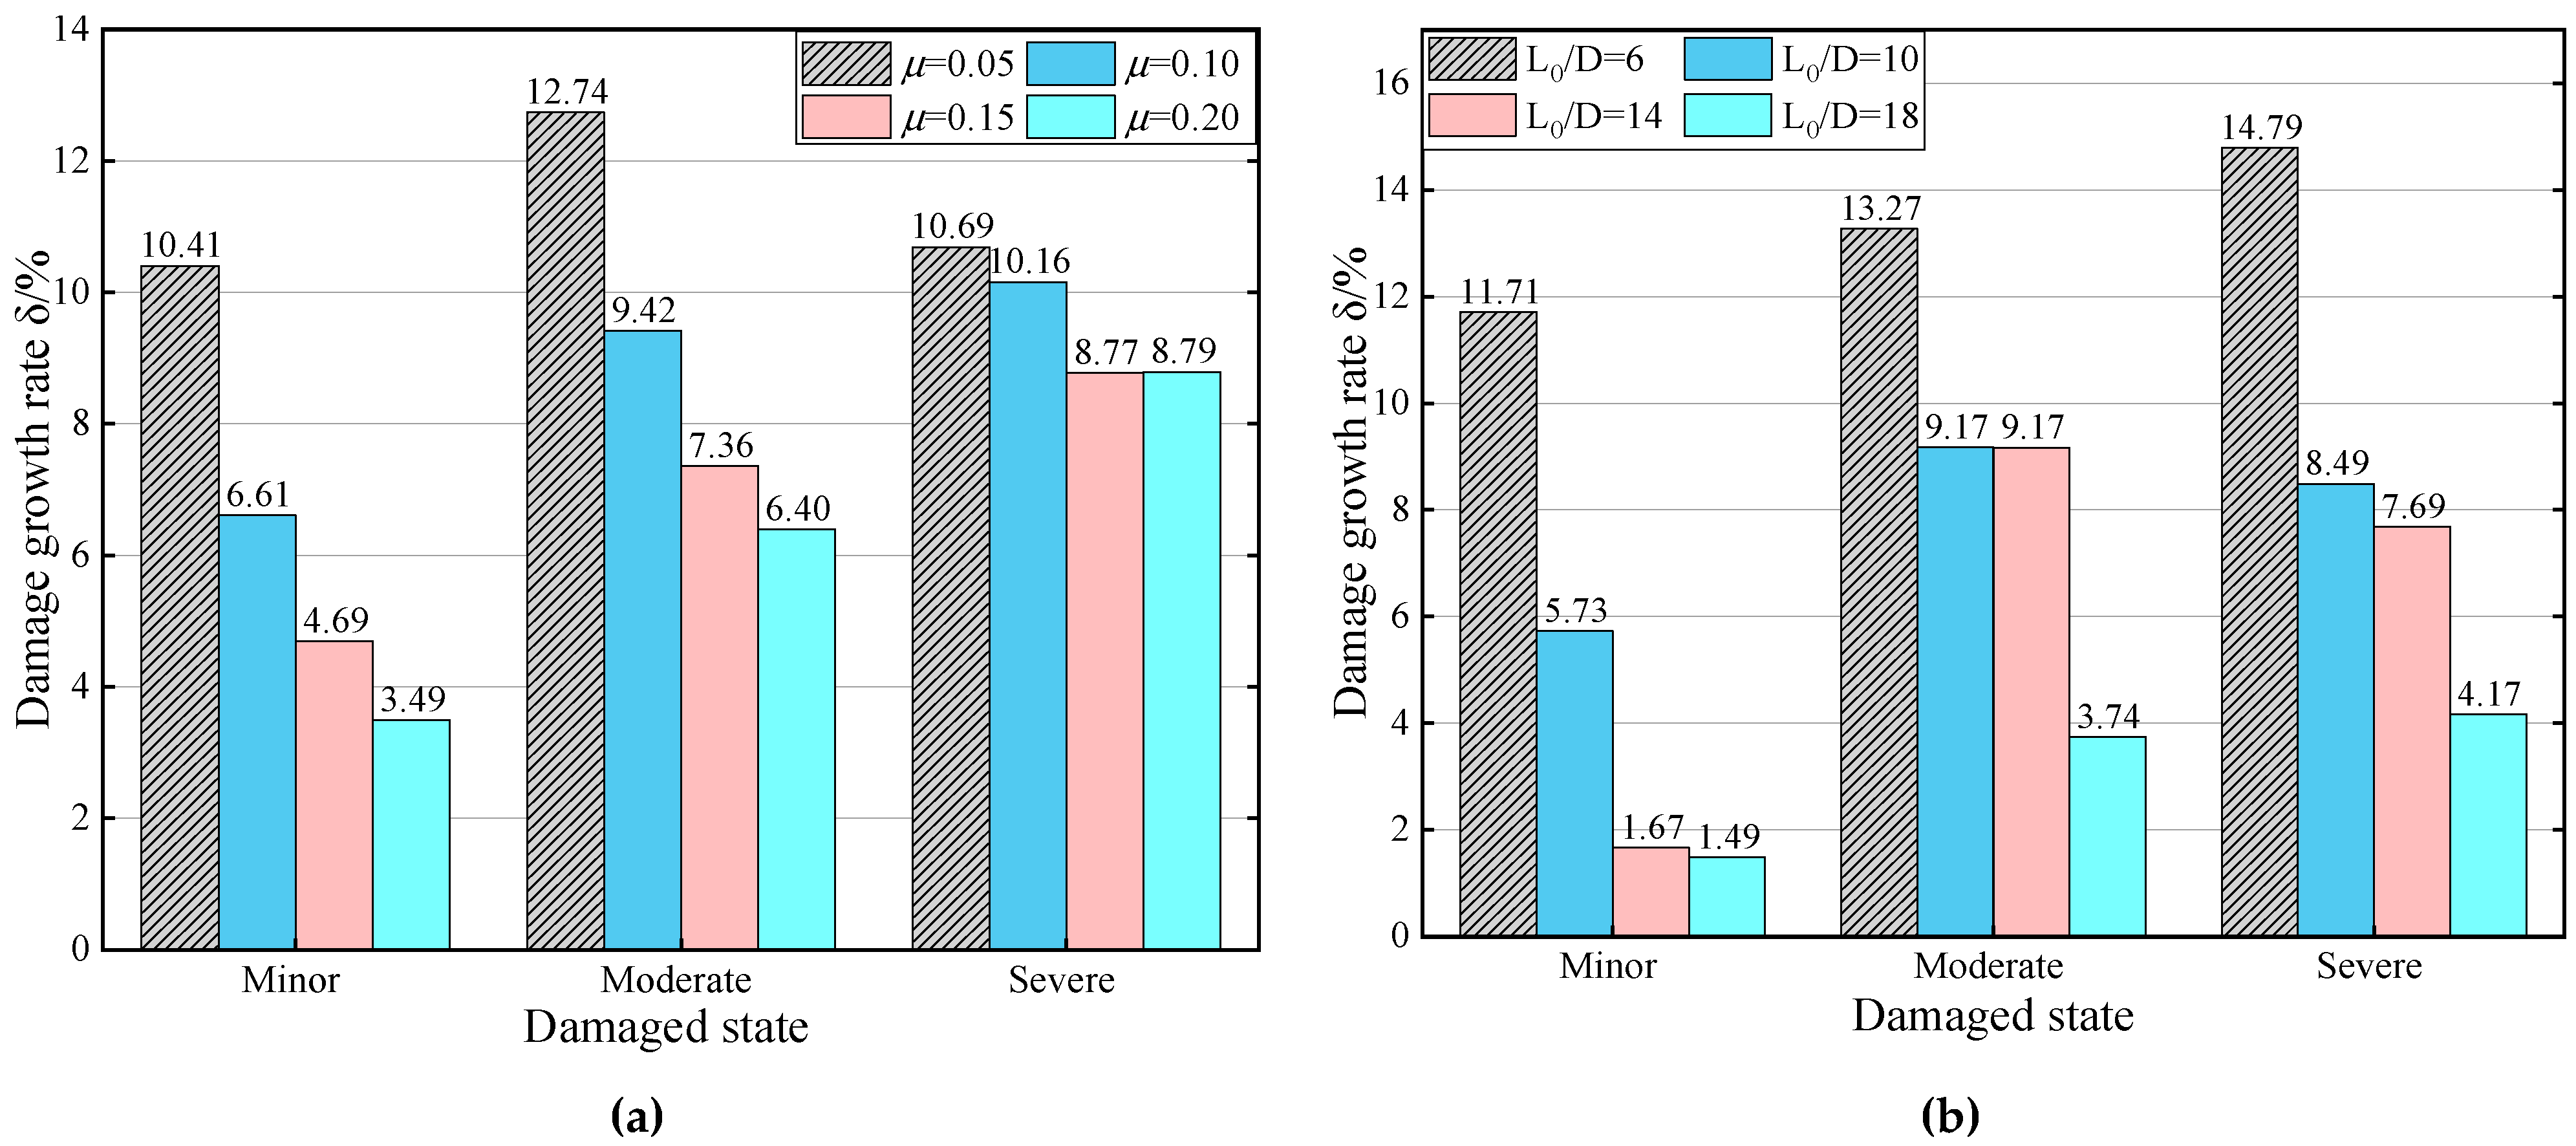
Table 1; (3) the damage growth rate of AS in different damage states is counted, and the maximum value is selected as the additional damage caused by AS; (4) For piers with different axial compression ratio, the process of (1)–(3) is repeated to obtain the additional damage under different damage states caused by AS with different axial compression ratio. The additional damage in different damage states is shown in Figure 8a,b.
As can be seen from Figure 8a, when the column is in different damage states, the additional damage caused by aftershocks gradually decreases with the increase of axial compression ratio. Besides, the additional damage to the column caused by aftershock gradually increases with the increase of damage when μ ≥ 0.1. Furthermore, the maximum growth rate of the additional damage to the column caused by aftershocks is 10.4% when the column is slightly damaged, and it gradually decreases as the axial compression ratio increases. However, the damage caused by the mainshock is relatively small, and therefore the actual damage caused by the aftershocks is limited. When the column is in a medium damaged state, the growth rate of additional damage caused by aftershocks is up to 12.7%, and furthermore the axial compression ratio decreases significantly between 0.05 and 0.15. Since the damage index of the medium damage state is between 0.25 and 0.4, the aftershocks have a certain impact on the actual damage of the column. When the column is in a severely damaged state, the growth rate of the additional damage caused by aftershocks decreases slightly with the increase in axial compression ratio, which can be conservatively estimated to be 11% of the mainshock damage. However, the damage caused by aftershocks is relatively large since the damage index of the severe damage state is greater than 0.4. As can be seen from Figure 8b, the additional damage caused by aftershocks gradually decreases with the increase of the shear-span ratio. Besides, when the shear span ratio is between 6 and 10, the additional damage is significantly reduced. However, due to the relatively large mainshock damage index of the columns with a shear-span ratio of 18, the additional damage caused by the aftershocks is relatively small.

5. Fragility Analysis of RC Column under MS-AS

5.1. Effect of Axial Compression Ratio on Fragility of RC Column

This part combines the results of the IDA time history analysis above and the logarithm of the seismic peak acceleration, and the damage index is plotted as a scatter plot. The least square method is used to linearly fit the scatter plot. Only scatter diagrams with μ = 0.05, ρ = 1.0% are listed due to the limitation of space. The scatter plot is shown in Figure 9. According to the above method, the damage index of each column is linearly fitted. The statistical results of the correlation coefficient of the linear fitting of each column are shown in Table 6.
Table 6 indicates that the correlation of the linear fitting of each column decreases as the axial compression ratio increases and increases as the reinforcement ratio increases. It can be seen that the dispersion of the seismic response of the piers will gradually increase when the piers enter the plastic state from elastic under the seismic load.
According to the linear fitting equation in Table 6, the fragility curves of the columns beyond different damage states under the action of MS and MS-AS are drawn. The difference in median PGA value corresponding to each column is examined. The median value of fragility curves, referred to as the median PGA (g), is the IM corresponding to 50% probability of exceeding a specified limit state. As the median PGA increases, the fragility of the bridge is reduced. Only the fragility curves for the axial compression ratio of 0.05 and 0.2 are listed here. The fragility curves and median values are shown in Figure 10 and Figure 11, respectively.
Figure 10 indicates that the damage probability of the column gradually decreases with the increase of the reinforcement ratio, and the fragility of the columns under the action of the MS-AS is greater than that of the MS. Increasing the reinforcement ratio can significantly reduce the probability of column failure when μ ≤ 0.10. However, the performance of reducing the fragility of the column by increasing the reinforcement ratio gradually decreases with the increase of the axial compression ratio. The damage probability of the column in different damage states gradually increases with the increase of axial compression ratio; nevertheless, the effect of aftershock is lower in columns with a small axial compression ratio.
Figure 10a shows that the probability of minor damage of columns with different reinforcement ratios exceeds 70% when μ = 0.2 and PGA = 0.1 g. Therefore, the axial compression ratio should be reasonably selected in design to avoid cracks of columns under small earthquakes, which can improve the durability of the structure in special areas. Figure 10b indicates that the probability of medium damage of columns with different reinforcement ratios exceeds 70% when μ = 0.2 and PGA = 0.2 g. It is not ideal to improve the ability of the column by increasing reinforcement ratio to resist medium damage. Besides, reducing the axial compression ratio can effectively improve the probability to resist medium damage. Figure 10c indicates that the probability of serious damage of columns exceeds 70% when μ = 0.2 and PGA = 0.3 g, and the probability of serious damage is reduced to less than 10% by increasing reinforcement ratio. Therefore, it is extremely uneconomical to reduce the fragility of the column by increasing the reinforcement ratio. Besides, the severely damaged column often enters the plastic stage, and the existence of aftershock tends to aggravate the collapse of the structure. Therefore, the effect of aftershock should be considered in the design. Figure 10d shows that increasing the reinforcement ratio to reduce the collapse probability is less than 20% when μ = 0.2. It is not as good as severe or medium damage by increasing the reinforcement ratio to reduce the probability of the column’s collapse. Nevertheless, reducing the axial compression ratio can greatly reduce the probability of the collapse of column.
Figure 11 indicates that the median PGA50% of the column gradually increases with the increase of the damage state, and the PGA50% gradually decreases with the increase of the axial compression ratio and increases with the increase of the reinforcement ratio. When the axial compression ratio increases from 0.05 to 0.1, the reduction of PGA50% is particularly prominent. When the axial compression ratio is 0.1 to 0.15, increasing the reinforcement ratio can increase the PGA50% to a certain extent for columns with minor and medium damage. However, this trend flattens out between 0.15 and 0.2. Besides, the PGA50% of the MS is larger than the MS-AS, and the PGA50% caused by the aftershock gradually decreases with the increase of the axial compression ratio. The smaller PGA50% due to subsequent earthquakes for a certain reinforcement ratio show the importance of aftershock in the progressive damage to the column and further indicates the necessity to capture aftershock effects on fragility assessment of bridges, which has not been considered by current codes to date. The above shows that the optimal design axial compression ratio under the action of the MS-AS should be between 0.05 and 0.1. In this interval, increasing the reinforcement ratio can better improve the PGA50% of the column, and the effect of aftershock should be considered based on the damage of the mainshock.

5.2. Effect of Shear-Span Ratio on Fragility of RC Column

To illustrate the generality of the above research, the fragility analysis of columns with different shear-span ratios is carried out. The scatter diagram is drawn by the above method and fitted linearly. The linear fitting correlation coefficients are shown in Table 7.
According to the linear fitting equation in Table 7, the fragility curves of the columns beyond different damage states under the action of MS and MS-AS are drawn, and the median value of fragility curves is obtained. Due to space limitations, only the fragility curves of medium and severe conditions are listed. The fragility curves and the median fragility PGA50% of columns with different shear-span ratios are shown in Figure 12a–d and Figure 13, respectively.
Table 7 shows that the logarithmic correlation between the damage index and the acceleration gradually decreases with the increase of the shear-span ratio. Figure 12 shows that the vulnerability of columns under the action of MS-AS is greater than MS. Besides, the fragility of the column for a certain damage state decreases with the decrease of the shear-span ratio, but the effect of aftershock on the fragility gradually increases. As can be seen from Figure 12a, the smaller the shear-span ratio, the greater the effect of aftershock. Figure 12b indicates that the fragility curves with shear-span ratios of 10, 14, and 18 are little different in the severely damaged state. This situation is due to: (1) The period of the columns changes greatly when the shear-span ratio is 10, 14, 18, and the corresponding response spectrum of the period changes greatly. (2) The plastic deformation of the column is irregular and damage index is less than or equal to 1.
As can be seen from Figure 13, the median fragility PGA50% of the column gradually decreases with the increase of the shear-span ratio and gradually increases with the increase of the damage state. Besides, the PGA50% under the MS-AS is smaller than the MS, and the effect of aftershock on the PGA50% decreases as the shear-span ratio increases. Reducing the shear-to-span ratio can greatly reduce the damage probability of bridge piers and increase the ability of piers to resist aftershocks.

6. Conclusions

Based on the OpenSees analysis platform, the paper selects the mainshocks and aftershocks with shear wave speeds between 350 and 500 m/s for IDA analysis of the bridge columns. The effect of the columns with different axial compression ratios, reinforcement ratios and shear-span ratios is discussed. The conclusions are:
  • The seismic demand of the column under the action of the MS-AS sequences is greater than MS. This demand increases with the increase of axial compression ratio and decreases with the increase of reinforcement ratio. When the column is in a slight or no damage state, the effect of aftershock can be basically ignored.
  • The additional damage caused by AS can be comprehensively considered in the design according to different magnitudes. When the seismic level is 7 degree, the maximum increase rate of additional damage is about 7% of MS. When the seismic level is 8 degree, the maximum increase rate of additional damage is about 13% of MS. When the seismic level is 9 degree, the maximum growth rate of additional damage is about 15% of MS.
  • The additional damage caused by AS gradually decreases with the increase of axial compression ratio in different damage states. When the column is slightly damaged, the influence of aftershocks can be ignored. When the column is in a medium damaged state, the growth rate of additional damage is up to 12.7%. When the column is in a severely damaged state, the growth rate of the additional damage can be conservatively estimated to be 11% of the MS.
  • The fragility of bridge piers in different damage states under the action of MS-AS is greater than that of MS. Increasing the reinforcement ratio can significantly reduce the damage probability of columns in different damage states when μ ≤ 0.1. However, the performance of reducing the fragility of columns by increasing the reinforcement ratio gradually decreases with the increase of the axial compression ratio. The effect of aftershock on the exceeding probability is lower in columns with small axial compression ratio.

Author Contributions

Conceptualization, T.W., Q.H. and J.W.; methodology, Q.H.; software, T.W. and L.W.; visualization, L.W.; writing—original draft preparation, T.W.; writing—review and editing, T.W., Q.H. and L.W. All authors have read and agreed to the published version of the manuscript.

Funding

This research is jointly funded by the National Natural Science Foundation of China (NSFC) (Grants No. 51878016, 51838010), Beijing Municipal Education Commission (IDHT20190504, KZ202010005001).

Data Availability Statement

The data presented in this study are available on request from the corresponding author.

Acknowledgments

These supports are gratefully acknowledged. The results and conclusions presented in the paper are those of the authors and do not necessarily reflect the view of the sponsors.

Conflicts of Interest

The authors declare that they have no known competing financial interests or personal relationships that could have appeared to influence the work reported in this study.

References

  1. Ogata, Y. Statistical models for earthquake occurrences and residual analysis for point processes. J. Am. Stat. Assoc. 1988, 83, 9–27. [Google Scholar] [CrossRef]
  2. Kam, W.Y.; Pampanin, S.; Elwood, K. Seismic performance of reinforced concrete buildings in the 22 February Christchurch (Lyttleton) earthquake. Bull. New Zealand Soc. Earthq. Eng. 2011, 44, 239–277. [Google Scholar] [CrossRef] [Green Version]
  3. Priestley, M.J.N. The Whittier Narrows, California earthquake of October 1, 1987–damage to the I-5/I-605 separator. Earthq Spectra 1988, 4, 389–405. [Google Scholar] [CrossRef]
  4. Atzori, S.; Tolomei, C.; Antonioli, A.; Boncori, J.P.M.; Bannister, S.; Trasatti, E.; Pasquali, P.; Salvi, S. The 2010–2011 Canterbury, New Zealand, seismic sequence: Multiple source analysis from InSAR data and modeling. J. Geophys. Res. 2012, 117, B08305. [Google Scholar] [CrossRef]
  5. Kazama, M.; Noda, T. Damage statistics (Summary of the 2011 off the Pacific Coast of Tohoku Earthquake damage). Soils Found 2012, 52, 780–792. [Google Scholar] [CrossRef] [Green Version]
  6. Galadini, F.; Falcucci, E.; Gori, S.; Kayen, R.E.; Lingwall, B.; Pizzi, A.; Di Domenica, A.; Zimmaro, P.; Stewart, J.P.; Lanzo, G.; et al. Chapter 2: Seismic source and surface rupture. In Engineering Reconnaissance Following the 2016 Central Italy Earthquakes, 2nd ed.; Zimmaro, P., Stewart, J.P., Eds.; No. GEER-0500; Geotechnical Extreme Events Reconnaissance Association: Hurricane, Sandy, 2017; pp. 33–50. [Google Scholar]
  7. Ji, D.; Wen, W.; Zhai, C.; Katsanos, E. Maximum inelastic displacement of mainshock-damaged structures under succeeding aftershock. Soil Dyn. Earthq. Eng. 2020, 136, 106248. [Google Scholar] [CrossRef]
  8. Wen, W.; Ji, D.; Zhai, C. Ground motion rotation for mainshock-aftershock sequences: Necessary or not? Soil Dyn. Earthq. Eng. 2020, 130, 105976. [Google Scholar] [CrossRef]
  9. Amiri, S.; Bojórquez, E. Residual displacement ratios of structures under mainshock-aftershock sequences. Soil Dyn. Earthq. Eng. 2019, 121, 179–193. [Google Scholar] [CrossRef]
  10. Shokrabadi, M.; Burton, H.V.; Stewart, J.P. Impact of sequential ground motion pairing on mainshock-aftershock structural response and collapse performance assessment. J. Struct. Eng. 2018, 144, 04018177. [Google Scholar] [CrossRef]
  11. Shokrabadi, M.; Burton, H.V. Risk-based assessment of aftershock and mainshock-aftershock seismic performance of reinforced concrete frames. Struct. Saf. 2018, 73, 64–74. [Google Scholar] [CrossRef]
  12. Zhang, L.; Goda, K.; Luca, F.D.; De Risi, R. Mainshock-aftershock state-dependent fragility curves: A case of wood-frame houses in British Columbia, Canada. Earthq. Eng. Struct. Dyn. 2020, 49, 884–903. [Google Scholar] [CrossRef]
  13. Hosseinpour, F.; Abdelnaby, A.E. Fragility curves for RC frames under multiple earthquakes. Soil Dyn. Earthq. Eng. 2017, 98, 222–234. [Google Scholar] [CrossRef]
  14. Chen, X.; Xiang, N.; Guan, Z.; Li, J. Seismic vulnerability assessment of tall pier bridges under mainshock-aftershock-like earthquake sequences using vector-valued intensity measure. Eng. Struct. 2022, 253, 113732. [Google Scholar] [CrossRef]
  15. Hashemi, S.V.; Pouraminian, M.; Sadeghi, A. Equipped with Seismic Fragility Curve Development of Frames with BRB’s Equipped with Smart Materials subjected to Mainshock-Aftershock Ground Motion. J. Struct. Constr. Eng. 2021, 8, 76–95. [Google Scholar] [CrossRef]
  16. Massumi, A.; Sadeghi, K.; Ghojoghi, O. Effect of Aftershock Characteristics on the Fragility Curve of Post-Mainshock RC Frames. Res. Sq. 2021, 1–24. [Google Scholar] [CrossRef]
  17. Irfan, Z.; Abdullah, A.; Afifuddin, M. Development of fragility curve based on incremental dynamic analysis curve using ground motion Aceh earthquake. In Proceedings of the E3S Web of Conferences, EDP Sciences, Bandung, Indonesia, 11–12 October 2022; Volume 340, p. 02001. [Google Scholar] [CrossRef]
  18. Movaghati, S.; Abdelnaby, A. Advancements in fragility analysis using numerical calibration methods for a horizontally curved RC bridge. Eng. Struct. 2016, 125, 236–243. [Google Scholar] [CrossRef]
  19. Lombardi, L.; Luca, F.D. Derivation of fragility curves at design stage through linear time-history analysis. Eng. Struct. 2020, 219, 110900. [Google Scholar] [CrossRef]
  20. Forcellini, D. Analytical fragility curves of shallow-founded structures subjected to Soil-Structure Interaction (SSI) effects. Soil Dyn. Earthq. Eng. 2020, 141, 106487. [Google Scholar] [CrossRef]
  21. Dong, Y.; Frangopol, D.M.; Saydam, D. Sustainability of highway bridge networks under seismic hazard. J. Earthq. Eng. 2014, 18, 41–66. [Google Scholar] [CrossRef]
  22. Pang, Y.; Wang, X. Cloud-IDA-MSA Conversion of Fragility Curves for Efficient and High-Fidelity Resilience Assessment. J. Struct. Eng. 2021, 147, 04021049. [Google Scholar] [CrossRef]
  23. Bao, X.; Jin, L.; Liu, J.; Xu, L. Framework for the mainshock-aftershock fragility analysis of containment structures incorporating the effect of mainshock-damaged states. Soil Dyn. Earthq. Eng. 2021, 153, 107072. [Google Scholar] [CrossRef]
  24. Nazari, N.; De Lindt, J.W.; Li, Y. Effect of mainshock-aftershock sequences on wood frame building damage fragilities. ASCE J. Perform. Constr. Facil. 2015, 29, 04014036. [Google Scholar] [CrossRef]
  25. Jalayer, F.; Ebrahimian, H. Seismic risk assessment considering cumulative damage due to aftershocks. Earthq. Eng. Struct. Dyn. 2017, 46, 369–389. [Google Scholar] [CrossRef]
  26. Han, R.; Li, Y.; Van de Lindt, J. Assessment of seismic performance of buildings with incorporation of aftershocks. J. Perform. Constr. Facil. 2015, 29, 04014088. [Google Scholar] [CrossRef]
  27. Rosti, A.; Del Gaudio, C.; Rota, M.; Ricci, P.; Di Ludovico, M.; Penna, A.; Verderame, G.M. Empirical fragility curves for Italian residential RC buildings. Bull. Earthq. Eng. 2021, 19, 3165–3183. [Google Scholar] [CrossRef]
  28. Wen, W.; Zhai, C.; Ji, D.; Li, S.; Xie, L. Framework for the vulnerability assessment of structure under mainshock-aftershock sequences. Soil Dyn. Earthq. Eng. 2017, 101, 41–52. [Google Scholar] [CrossRef]
  29. Park, Y.J.; Ang, A.H.; Wen, Y.K. Seismic damage analysis of reinforced concrete buildings. J. Struct. Eng. 1985, 111, 740–757. [Google Scholar] [CrossRef]
  30. Kunnath SEl-Bahy, A.; Taylor, A.; Stone, W. Cumulative Seismic Damage of Reinforced Concrete Bridge Piers, NIST Interagency/Internal Report (NISTIR); National Institute of Standards and Technology: Gaithersburg, MD, USA, 1997. [CrossRef]
  31. Hose, Y.D.; Seible, F. Performance Evaluation Database for Concrete Bridge Components and Systems under Simulated Seismic Loads; Pacific Earthquake Engineering Research Center: Berkeley, CA, USA, 2000; Volume 16, pp. 413–442. [Google Scholar] [CrossRef]
  32. Yu, X.; Lu, D.; Xiao, H. Incremental damage spectrum of mainshock-aftershock sequence type ground motions. Eng. Mech. 2017, 34, 47–53. [Google Scholar]
  33. Cavalieri, F.; Correia, A.A.; Crowley, H.; Pinho, R. Seismic fragility analysis of URM buildings founded on piles: Influence of dynamic soil–structure interaction models. Bull. Earthq. Eng. 2020, 18, 4127–4156. [Google Scholar] [CrossRef]
  34. He, X.; Lu, Z. Seismic fragility assessment of a super tall building with hybrid control strategy using IDA method. Soil Dyn. Earthq. Eng. 2019, 123, 14. [Google Scholar] [CrossRef]
  35. Mackie, K.R.; Stojadinovi, C.B. R-factor parameterized bridge damage fragility curves. J. Bridge Eng. 2007, 12, 500–510. [Google Scholar] [CrossRef]
  36. Federal Emergency Management Agency. HAZUS99 Use’s Manual; Federal Emergency Management Agency: Washington, DC, USA, 1999.
  37. Kent, D.C. Inelastic Behavior of Reinforced Concrete Members with Cyclic Loading; University of Canterburry: Christchurch, New Zealand, 1969. [Google Scholar] [CrossRef]
  38. Dhakal, R.; Maekawa, K. Modeling for Post-yield Buckled of Reinforcement. J. Struct. Eng. 2002, 128, 1139–1147. [Google Scholar] [CrossRef] [Green Version]
  39. Utsu, T. A statistical study on the occurrence of aftershocks. Geophys. Mag. 1961, 30, 521–605. [Google Scholar]
  40. Han, R. Performance-Based Engineering for Evaluation and Retrofitting Non-Ductile Reinforced Concrete Buildings Incorporating Aftershock Hazard. Michigan Technological University. 2015. Available online: https://www.researchgate.net/publication/304089902 (accessed on 1 September 2015).
  41. Mackie, K.R.; Stojadinović, B. Performance-based seismic bridge design for damage and loss limit states. Earthq. Eng. Struct. Dyn. 2007, 36, 1953–1971. [Google Scholar] [CrossRef]
  42. Padgett, J.E.; Nielson, B.G.; DesRoches, R. Selection of optimal intensity measures in probabilistic seismic demand models of highway bridge portfolios. Earthq. Eng. Struct. Dyn. 2008, 37, 711–725. [Google Scholar] [CrossRef]
  43. Yuan, W.; Wang, Z.; Pang, Y.; Zhong, J. Seismic fragility analysis of a continuous girder bridge subject to an earthquake mainshock-aftershock sequence. J. Harbin Eng. Univ. 2016, 37, 1671–1676. [Google Scholar]
Figure 1. Research content and significance.
Buildings 12 01681 g001
Figure 2. Bridge column fiber model.
Buildings 12 01681 g002
Figure 3. The basic parameters of the column.
Buildings 12 01681 g003
Figure 4. Mainshock response spectrum curves.
Buildings 12 01681 g004
Figure 5. Aftershock response spectrum curves.
Buildings 12 01681 g005
Figure 6. Damage index of the column under MS-AS: (a) μ = 0.05; (b) μ = 0.1; (c) μ = 0.15; (d) μ = 0.2.
Buildings 12 01681 g006
Figure 7. Damage index of the column.
Buildings 12 01681 g007
Figure 8. Additional damage: (a) different axial compression ratio; (b) different shear-span ratio.
Buildings 12 01681 g008
Figure 9. Scatter diagram of the column under MS-AS.
Buildings 12 01681 g009
Figure 10. Fragility curves of the column under MS-AS: (a) minor damage; (b) medium damage; (c) severe damage; (d) complete failure.
Buildings 12 01681 g010
Figure 11. The median fragility PGA50% beyond different damage states: (a) minor damage; (b) medium damage; (c) severe damage; (d) complete failure.
Buildings 12 01681 g011aBuildings 12 01681 g011b
Figure 12. Fragility curves of the column: (a) Medium damage; (b) Serious damage.
Buildings 12 01681 g012
Figure 13. The median fragility PGA50% under different shear-span ratio.
Buildings 12 01681 g013
Table 1. Range of damage index for different damage states.
Damage LevelDamage CharacteristicsDamage
Index
Basically intactMicrocracks appear0~0.1
Minor damageLocally through micro cracks appear and the longitudinal bars yield0.1~0.25
Medium damageThe cracks developed significantly and the concrete protective layer began to fall off0.25~0.4
Serious injuryThe crack widens sharply, and the partial concrete protective layer falls off0.4~0.8
Completely destroyedStirrup fracture or longitudinal reinforcement Buckling fracture, the core area concrete is crushed≥0.8
Table 2. Basic parameters of reinforcement.
Categoryd (mm)fy (Mpa)fu (Mpa)εshεsuEs (Mpa)Esh (Mpa)ρ (%)
Longitudinal284005400.040.15200,00040001.0~4.0
Stirrup163354550.040.15200,00040001.5
c (mm)fcc (Mpa)fcu (Mpa)εccεcuEc (Mpa)\\
Confined concrete4526.8021.440.00140.00432500\\
Cover concrete151041.9033.520.00530.02232500\\
Table 3. Basic period (T) of the columns.
Longitudinal Reinforcement Ratio
μ1.0%1.5%2.0%2.5%3.0%3.5%4.0%
0.050.510.490.480.470.450.440.43
0.100.720.700.680.660.640.620.61
0.150.910.870.840.820.790.770.75
0.201.061.020.990.950.930.900.87
Table 4. Maximum damage growth rate (%).
Axial Load Ratio
PGA (g)0.050.100.150.20
0.106.242.873.883.49
0.156.015.194.735.41
0.206.467.857.367.84
0.2510.419.428.778.79
0.3012.7410.168.416.55
0.3512.099.698.405.65
0.4011.768.425.454.35
Table 5. The columns damage growth rate (%).
Seismic Acceleration
L 0 / D Period0.1 g0.15 g0.20 g0.25 g0.30 g0.35 g0.40 g
60.312.133.232.227.8411.7113.2714.79
100.682.173.545.739.178.258.498.17
141.141.181.679.175.846.737.695.84
161.691.493.743.534.171.922.502.79
Table 6. Linear fitting equation of the columns.
μρMSMS-AS
aLn(b) R 2 aLn(b) R 2
0.051.0%1.6450.6000.8751.6790.7330.885
1.5%1.5130.2030.8711.5420.3180.882
2.0%1.423-0.0530.8951.4410.0840.904
2.5%1.343-0.2540.8921.346-0.1980.901
3.0%1.300-0.4020.8891.298-0.3540.899
3.5%1.273-0.5230.8841.266-0.4800.900
4.0%1.246-0.6250.8791.256-0.5410.907
0.101.0%1.5581.1160.8441.6021.2560.856
1.5%1.5341.0310.8641.5651.1460.874
2.0%1.5070.9040.8681.5411.0220.880
2.5%1.4570.7110.8681.4910.8260.881
3.0%1.3990.5360.8651.4240.6310.875
3.5%1.3430.3860.8611.3720.4840.878
4.0%1.2780.2250.8661.3050.3180.886
0.151.0%1.3821.1810.7841.3991.2630.801
1.5%1.4011.1490.8151.4311.2570.833
2.0%1.4151.1110.8451.4421.2120.860
2.5%1.3951.0470.8541.4251.1480.866
3.0%1.3930.9990.8661.4231.0960.877
3.5%1.3870.9240.8681.4151.0200.881
4.0%1.3680.8310.8691.4000.9340.882
0.201.0%1.2971.2170.7651.3001.2720.774
1.5%1.2881.1900.7781.3001.2580.792
2.0%1.2831.1500.7911.3011.2290.810
2.5%1.2861.1060.8121.3031.1840.834
3.0%1.2961.0780.8331.3171.1600.852
3.5%1.3061.0480.8471.3301.1330.863
4.0%1.3241.0310.8591.3411.1060.871
Table 7. Linear fitting equation of the columns.
L 0 / D Earthquake TypeaLn(b) R 2
6MS1.5190.2770.850
MS-AS1.5900.4730.869
10MS1.5070.9040.868
MS-AS1.5411.0220.880
14MS1.2770.7460.748
MS-AS1.3020.8420.764
18MS1.1640.7480.683
MS-AS1.1700.7890.689
Publisher’s Note: MDPI stays neutral with regard to jurisdictional claims in published maps and institutional affiliations.

