Article

A Fairer Renewable Energy Policy for Aged Care Communities: Data Driven Insights across Climate Zones

1
Faculty of Engineering, Queensland University of Technology (QUT), Brisbane, QLD 4000, Australia
2
College of Automation & College of Artificial Intelligence, Nanjing University of Posts and Telecommunications, Nanjing 210042, China
3
Bolton Clarke, Brisbane, QLD 4059, Australia
*
Author to whom correspondence should be addressed.
Buildings 2022, 12(10), 1631; https://doi.org/10.3390/buildings12101631
Submission received: 29 August 2022 / Revised: 21 September 2022 / Accepted: 27 September 2022 / Published: 8 October 2022
(This article belongs to the Collection Low-Carbon Buildings and Urban Energy Systems)

Abstract

:
Communal living for older people exists in many different forms, such as suburban communities, lifestyle communities, retirement villages and residential aged care communities (RAC) where electricity is supplied via a main gate meter to the whole community. Australia’s Small-scale Renewable Energy Scheme incentivizes individuals and businesses to install renewable energy systems up to 100 kW peak. A system of this size, however, may not meet a community’s energy needs or sustainability goals. In contrast, other residential dwellings are allowed to install a minimum solar inverter of 5 kW. Therefore, this paper investigates small-scale renewable energy targets on a per bed basis for RACs and the impact of a change from the current 100 kW peak small-scale renewable energy policy. A data driven clustering-based method has been implemented to identify financially optimal photovoltaic (PV) system ratings for ten RACs across four climate zones. Explored are 100 kW peak PV and net zero electricity scenarios. Results show RACs with 5 kW PV per bed can move closer to a net zero electricity goal and generate 800 to 1400 GWh of renewable electricity each year with significant financial savings. A fairer renewable policy, based on kilowatts per bed, is advocated to improve communities’ energy resilience, financial sustainability, and environmental sustainability.

1. Introduction

Energy is important in maintaining thermal comfort and healthy environment, especially in senior living communities and in healthcare contexts [1,2]. In terms of aged care, residential aged care communities (RACs) provide communal living for seniors, some of whom live independently whilst others are frail and having a variety of care needs [3,4]. In different regions, RACs may be known as nursing homes or care homes [5,6]. They are simultaneously a residence and a healthcare facility.
Healthcare facilities are often energy intensive due to 24/7 operation and their needs to ensure quality service delivery [7,8]. In aged care communities, there are often air conditioned public and private spaces, catering services, laundry services, a dining hall, activity areas, and library facilities, as well as spaces for offices, nurses or for allied health provisions. Residents in aged care or senior living communities are typically 75 or above [9,10].
Furthermore, budget constraints may be an issue for many sectors, including the aged care sector [11]. At the same time, healthcare and aged care communities often have high energy needs during daytime hours [12,13], which may well coincide with the daytime solar profile. Therefore, it makes sense to have renewable energy from solar photovoltaic systems (PV) to offset those sites’ electricity needs.
Then, the question that comes into mind is how to determine suitable PV system ratings for each community’s needs, given that they have different motivations and constraints. In terms of sustainability related motivations, net zero is a common type of goal, such as net zero electricity (or known as 100% renewable electricity [14]), net zero energy [15], and net zero emissions [16].
When a goal is established, onsite renewable selection can become more purposeful. For example, in the case of net zero electricity, onsite renewables can be sized up to meet energy demand on a yearly basis [17]. For renewable enablement in the real world, cashflow (including capital expenditure-CAPEX and operational expenditure-OPEX) and rate of return can be important key performance indicators (KPI) in feasibility or pre-feasibility studies [18]. Such analysis requires detailed data on both energy use and energy generation.
When datasets are in fine resolution for a year or more, data processing can become time consuming as computation becomes demanding [19]. A time efficient and highly accurate method to determine on-site renewable system sizing is to calculate renewable systems’ KPIs after identifying typical energy use profiles, such as typical days for a year [20]. Typical energy use profiles can be identified by clustering algorithms, a type of unsupervised machine learning [21]. In this way, computation is done on a few representative days rather than iteratively calculating KPIs for all renewable sizing on yearly energy and climate datasets, which is very time consuming.
Solar PV is the most common form of distributed renewable generation in Australia and its governing legislation is Australian Renewable Energy (Electricity) Regulations 2001. The regulation has specified that small scale renewable energy systems are no more than 100 kW [22]. Those small-scale systems are financially incentivized by the Small Scale Renewable Energy Scheme (SSRES) [23]. Research has shown that the SSRES has promoted solar uptake for Australian households [24,25].
Renewable energy should be accessible to those who are vulnerable and in need [26]. Aged care communities are homes to our senior residents with services available to support their living. Those aged care communities vary in size, such as bed numbers and occupant numbers [7]. The 100 kW PV systems (the cap of the SSRES) may be grossly insufficient for meeting their energy needs, such as for sustainability goals or for the purpose of energy bill management.
Solar PV systems of those aged care communities are unlikely to be as large as a solar power station. Large scale solar energy systems (>100 kWp) have more complicated rules, pricing mechanisms and require more resources to build and operate [27]. On the other hand, residential dwellings (single households) have a default minimum of 5 kW applied to a solar inverter size for single phase electricity connections [28]. This paper poses a scenario where aged care facilities are considered a ‘collection of households’ and hence able to size PV systems based on the number of ‘households’ in the facility (indicated by the number of beds provided by the facility).
A research and energy policy gap exists in how to enable fairer renewable energy to senior residents in residential aged care communities. Therefore, with the energy needs, constraints and the policy gap in mind, this paper’s contribution to knowledge and society includes:
  • Using a data driven approach to test and propose changes to the existing regulation for a fairer renewable energy policy for aged care residents;
  • Quantifying financially optimal PV sizing and the gaps between existing policy allowance and the optimal sizing; and
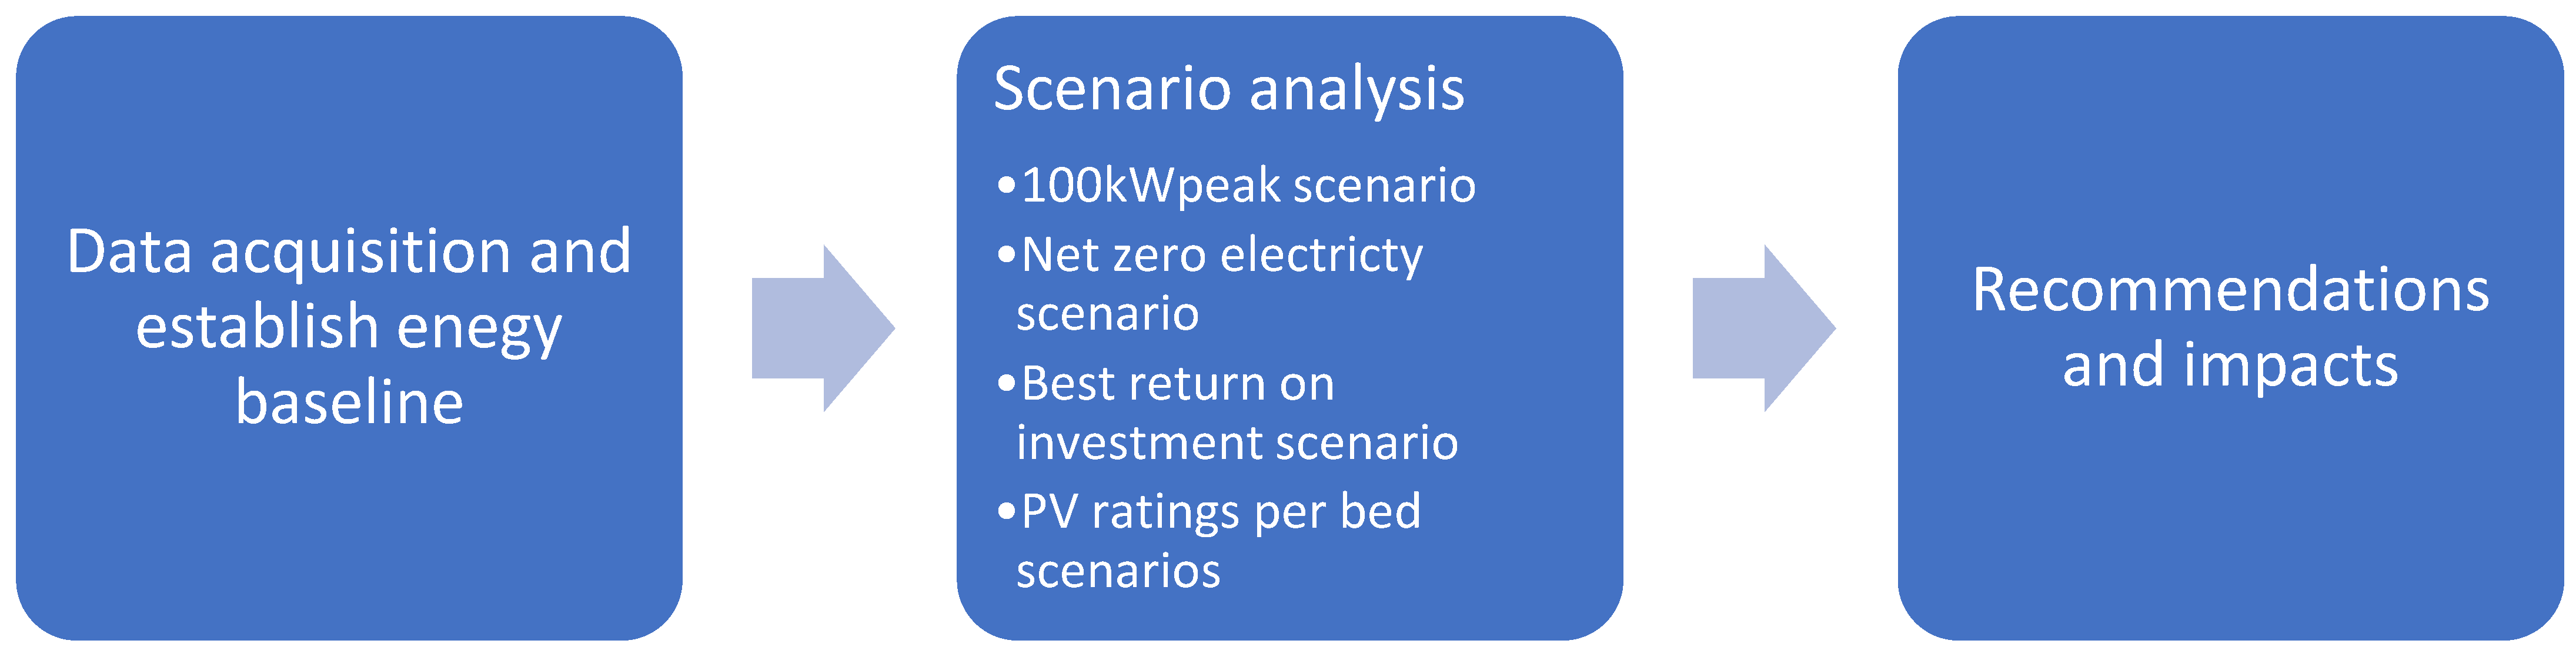
  • Proposing a change to the SSRES application to RACs, creating co-benefits beyond energy bill savings, as demonstrated in other research that renewables can enable environmental benefits and renewable energy equity for our society [29,30].
The following section presents the data driven method in investigating PV investment scenarios and associated sustainability and financial impacts. Then, case study results are followed by the policy implication section expanding into national impact studies, potential for relieving pressure on public resources, and improving renewable energy equity for senior residents. The paper concludes by highlighting the key study findings.

2. Methodology

As presented in Figure 1, the methodology starts with data acquisition and energy baseline study for community case studies. Then, a set of scenario analysis is conducted to investigate the impact of various PV system sizing in terms of local renewable generation meeting electricity demands. Recommendations and national impact studies follow the scenario analysis.

2.1. Data Acquisition

Real site electricity demand data from ten residential aged care communities are used in the case study. They are from an Australia-wide not-for-profit aged care provider. Those ten cases represent the geographic and climate coverage of the aged care provider’s RACs at the time when this research was conducted. Two of the cases are from tropical areas in the northern Queensland region. Six of the case communities are from the subtropical capital city region—Brisbane—the Queensland’s largest population centre. Another two communities are from temperate climates: one from Toowoomba (an inland city), and one from Sydney (Australia’s largest city).
This research uses 30 min interval electricity demand data which are recorded by high precision utility revenue grade meters complying with Australian Standards 62052 and 62053. The climate data are obtained from Australian Bureau of Meteorology’s nearest station to each case study site [31].
To visually provide a geographical sense of the case study, an Australian climate zone map is provided in Figure 2 with case communities numbered. The case study communities are distributed across Australian eastern seaboard with a distance of 2591 km from Community 1 in Cairns to Community 10 in Sydney. The characteristics of the ten residential aged care communities in four Australian climate zones are presented in Table 1. Most of the communities consist of single storey brick veneer buildings with additional areas for carparks. The Sydney community has two-storey concrete buildings. All case communities’ occupancy rates are quite high, nearly 100% all the time. Energy baseline, including electricity use per bed, is presented in Section 3.1.

2.2. Scenario 1: 100 kWp

In this scenario, the maximum solar rooftop PV system rating of 100 kWp is applied to all community cases. Calculation is conducted to quantify yearly electricity outputs from those 100 kWp systems and percentage of each community’s electricity needs met by the local renewable energy generation, in an annual basis.

2.3. Scenario 2: Net Zero Electricity

‘Net zero electricity’ can be applied to energy or emissions, for example, Net Zero Electricity, Net Zero Energy or Net Zero Emission [15]. This scenario uses the goal of Net Zero Electricity, where a PV system rating per bed is determined based on yearly electricity use and PV system generation capacity as shown in the following Equation (1).
P V N Z E = E y / 365 / b e d   n u m b e r E G 1 k W p
P V N Z E is the photovoltaic system rating under the net zero electricity scenario. E y is the yearly electricity use in kilowatt hour per year (kWh/year). E G 1 k W p is the mean unit daily generation which is the average kilowatt hour electricity generated by 1 kWp PV system per day (kWh/kWp/day).

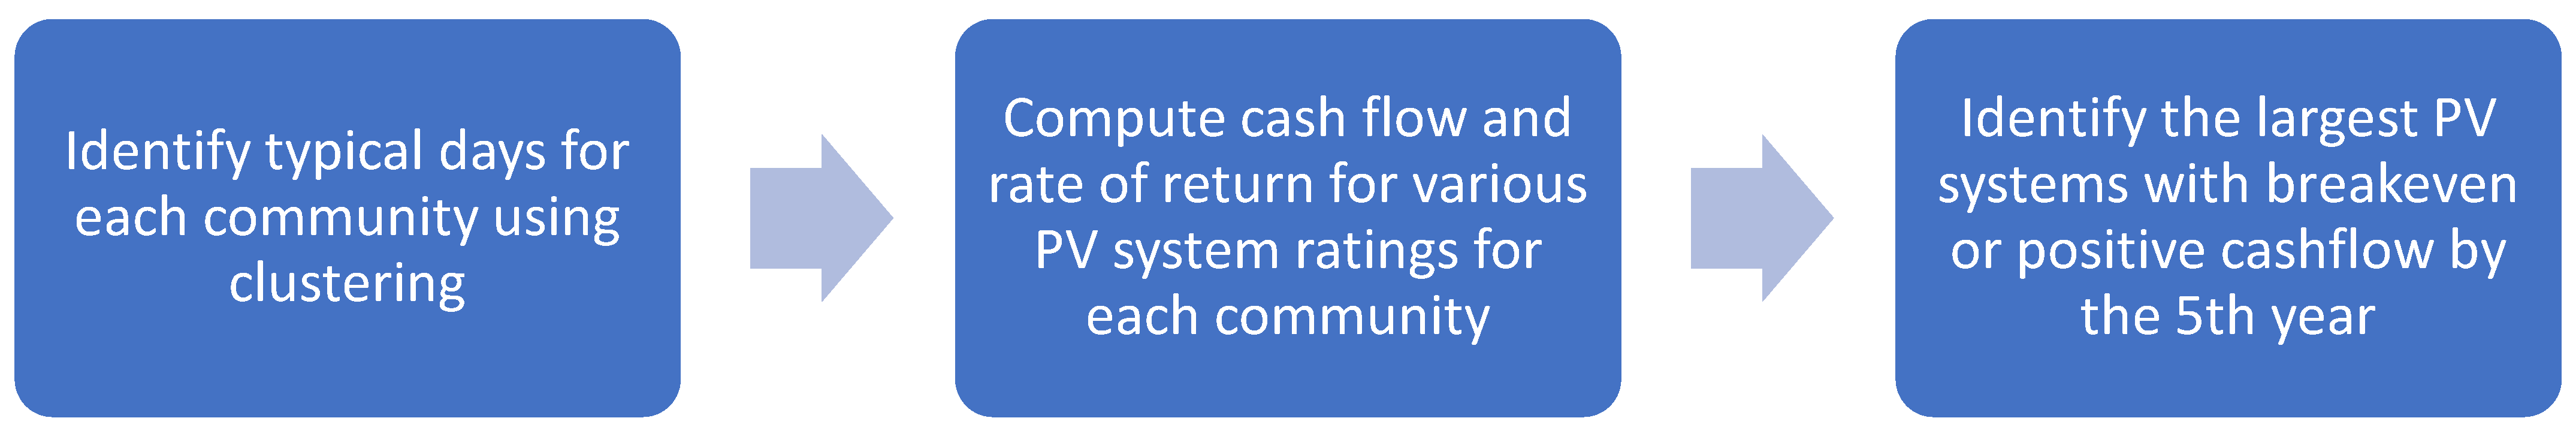
2.4. Scenario 3: Best Return on Investment Scenario

In this scenario, publicly available demand tariff (DT) structure and pricing are used (Table 2). Energy Charge (EC, a dollar value per unit of electrical energy use, such as AUD per kWh) is a popular form of electricity tariff around the world, however, it does not truly reflect the cost of electricity delivery, such as network infrastructure costs to deliver energy at peak times. EC is a DT component for using energy from the grid. Demand Charge (DeCh) is a DT component to reflect the cost of building and maintaining poles, wires and transformers for delivering electricity. In addition, Feed-in Tariff (FiT) is the reward customers can earn when exporting energy to the grid. Daily fixed charge is not considered since that will not be influenced by PV systems. The calculation has used solar system costing parameters from Table A1 in Appendix A.
Computation may be challenging when dealing with multiple yearly fine interval datasets, such as energy demand data and climate data. A multi-dimension clustering algorithm is implemented to identify typical days for each community case [20]. Then, those typical days are used in simulation to identify the optimal PV rating for each community, as shown in Figure 3.
Depending on the analysis purpose, there may be different inputs to the clustering algorithm. For this research, inputs to the clustering algorithm are maximum daily temperature, daily PV outputs and daytime energy charge (Table 3).
The clustering algorithm implemented in this research is Gaussian mixture model clustering (GMM), a type of non-supervisory machine learning algorithms [35]. With an iterative expectation maximisation algorithm (EM), the GMM has two steps: expectation (E step) and maximization (M step) [36,37].
In Equation (2) E step, GMMs’ posterior probabilities γ j k are computed with model weights ω k , probability density function ϕ k , taking in considerations of observations x , mean μ k and covariance k . k is the k-th component.
γ j k = ω k ϕ k ( x | μ k , k ) k = 1 K ω k ϕ k ( x | μ k , k )
where ω k ( 0 , 1 ) ,   k = 1 K ω k = 1 ,
Equations (3)–(5) are for the M step; new weights, mean and covariance are obtained with the previous E step’s posterior probabilities. N is the number of samples. n is the n-th sample.
ω k = ϕ k N
μ k = 1 ϕ k j = 1 N γ j k x n
k = 1 ϕ k j = 1 N γ j k ( x n μ k ) ( x n μ k ) T
E-step and M-step are iterated until reaching a convergence with no updates to GMM’s parameters. Equations (6)–(8) present the results of clusters and each cluster has a d number of dimensions (in the case study results, d = 3 shown in Table 3). Then, in the following step, μ k (clusters’ centres) are used to identify typical days.
ψ ( x ) = k = 1 K ω k ϕ k ( x | μ k , k )
ϕ k ( x | μ k , k ) = ( 2 π ) d 2 | k | 1 2 exp { 1 2 ( x μ k ) T k 1 ( x μ k ) }
k = 1 K ω k = 1
Equation (9) expresses the ideal on how to identify typical days that can be used to represent yearly data. μ k is Cluster k ‘s characteristic scenario. x j are observations. Each cluster’s percentage is represented with λ k . The typical scenarios C k are for this clustering run when there is a minimum distance between x j and cluster mean μ k . j is a positive integer index from 1 to the size of cluster k .   k is also a positive integer with a value between 1 to K (number of GMM clusters).
C k = x j , λ k = ω k where   conditions   are : min ( | x j μ k | ) ,     j   ,   k   ( 1 , K )
Once C k and λ k become available, they can be used to compute energy investments’ financial KPIs in a very time efficient and accurate manner instead of computing KPIs on years of multidimensional datasets. The cashflow of various PV system investments becomes available once PV systems’ costs, energy savings, demand reduction and typical days’ energy costs are combined. Then, internal rates of return (IRR) can be calculated with the cashflow information. IRR can be used as an indicator for project’s profitability or financial risk evaluation [38] and it is a rate that would return net present value (NPV) to zero as shown in Equation (10).
C 0 + t = 1 Y C t ( 1 + I R R ) t = N P V = 0
where, C 0 is the investment value in the initial year; C t is the cashflow for year t and Y is the number of years in cashflows.
The best PV system rating is the largest PV system which turns zero or positive cashflow by Year 5 since the initial investment. Year 5 is selected because it is often an industry expectation to have return on investment within no more than 5 years of time.

2.5. Scenario 4 and 5: PV Ratings per Bed Scenario

There are two PV system ratings considered here: 3 kWp per bed and 5 kWp per bed. The 3 kWp and 5 kWp ratings are developed based on Australian rooftop solar PV systems installation status, historical data and industry guidelines:
  • December 2020, average small scale PV system rating reached 9 kWp [39]. If we assume a typical three-bedroom dwelling, we could further assume 3 kWp per bed. Alternatively, if we divide the total kWp by the average occupancy per household (2.5 persons), the system size would be 3.6 kW/pp.
  • Australian national guidelines specify a default 5 kVA allowance for embedded generation at each customer connected to a normal power network (single phase connection) [28].
  • In 2019, typical residential PV system rating was 6.6 kWp [40], equating to 2.64 kW/pp.

3. Case Study Results

Energy baseline results are presented in the following section, followed by 100 kWp scenario, NZE scenario, best return on investment scenario and PV rating per bed scenarios for the ten Australian aged care communities across four climate zones.

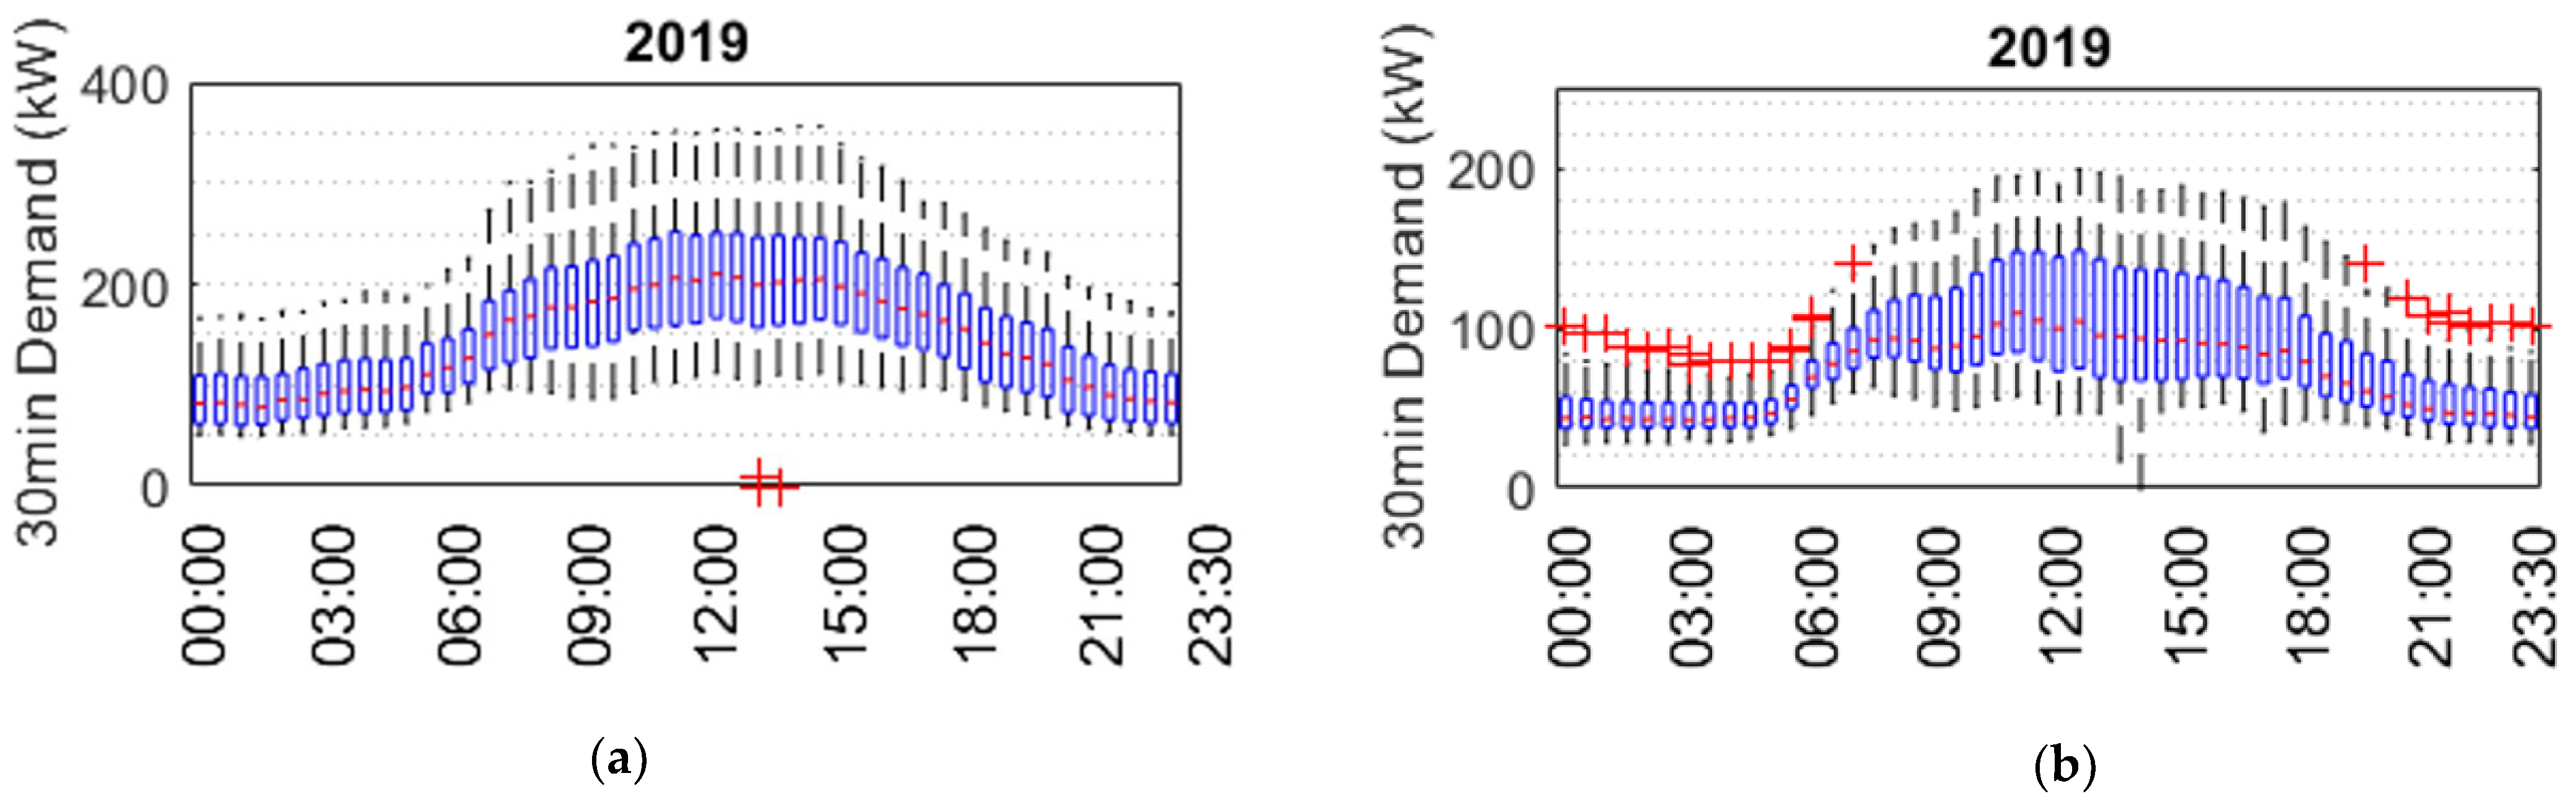
3.1. Energy Baseline

Table 4 summarises the energy baseline for the case study communities. For the two tropical communities, electricity use intensity (EUI) is 26.51 kWh/bed/day and 27.20 kWh/bed/day. For the six subtropical communities, EUI ranges from 15.63 kWh/bed/day for Community 5 with the largest number of beds, to 33.37 kWh/bed/day for Community 7 with the fewest bed. Community 7 and 8 have the highest EUI among the subtropical communities. The temperate climate zone communities tend to have lower electricity use on a per bed per day basis.
These aged care communities regularly have high electricity demand during daytime as shown in Figure 4. A year of half hourly demand data are plotted for Community 1 and Community 3 (containing 17,520 time steps). There are 48 boxplots inside each graph, representing 48 of half hourly intervals. Red crosses above or below each boxplot are outliers. The top tip of each boxplot is maximum demand for each time interval; the bottom tip of each boxplot is the minimum demand for each time interval. The short red dash inside each box is the median demand value for each time interval. The top edge of each box is the 75th percentile value and the bottom edge of each box is the 25th percentile value.

3.2. Scenario 1: 100 kWp Rating for All Communities

In this scenario a 100 kWp PV system is applied to all communities through simulation. The PV system output values are obtained from a National Renewable Energy Lab program (NREL, [41]). On a yearly basis as shown in Table 5, only 12% to 23% of the tropical and subtropical communities’ electricity use can be met by the 100 kWp PV system. The percentage figures seem to be slightly better for communities in temperate climate zones.

3.3. Scenario 2: Net Zero Electricity Goals

When a net zero electricity goal is adopted (Table 6), tropical communities would need 6.23 kWp/bed PV system to offset onsite electricity use. This 6.23 kWp/bed rating is obtained by the bottom row of Table 4 divided by the average generation of a 1 kWp PV at Cairns or Townsville (as described in Equation (1)). For subtropical climates (Community 3 to Community 8), an average of 5.8 kWp/bed is needed to meet communities’ electricity demand. However, smaller size communities may need higher ratings on a per bed basis, such as 8 kWp/bed for Community 7 with 60 beds.

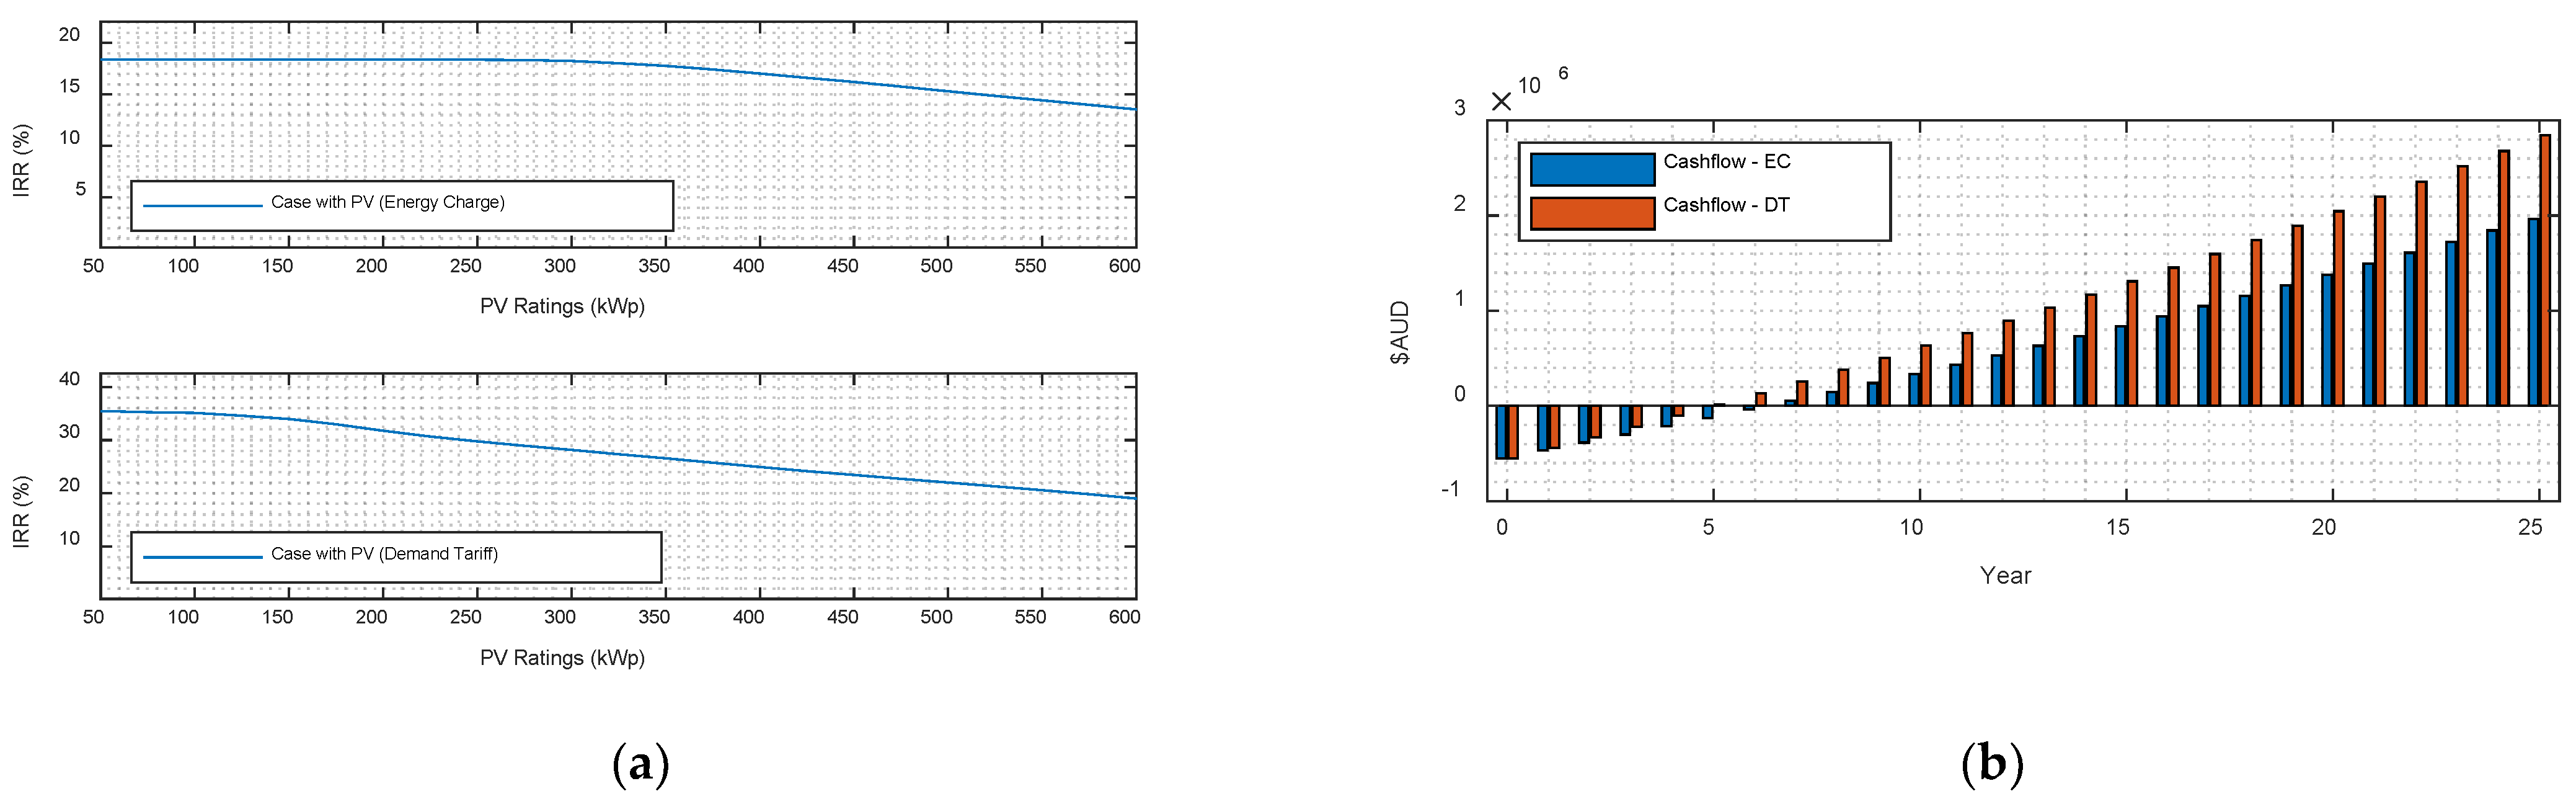
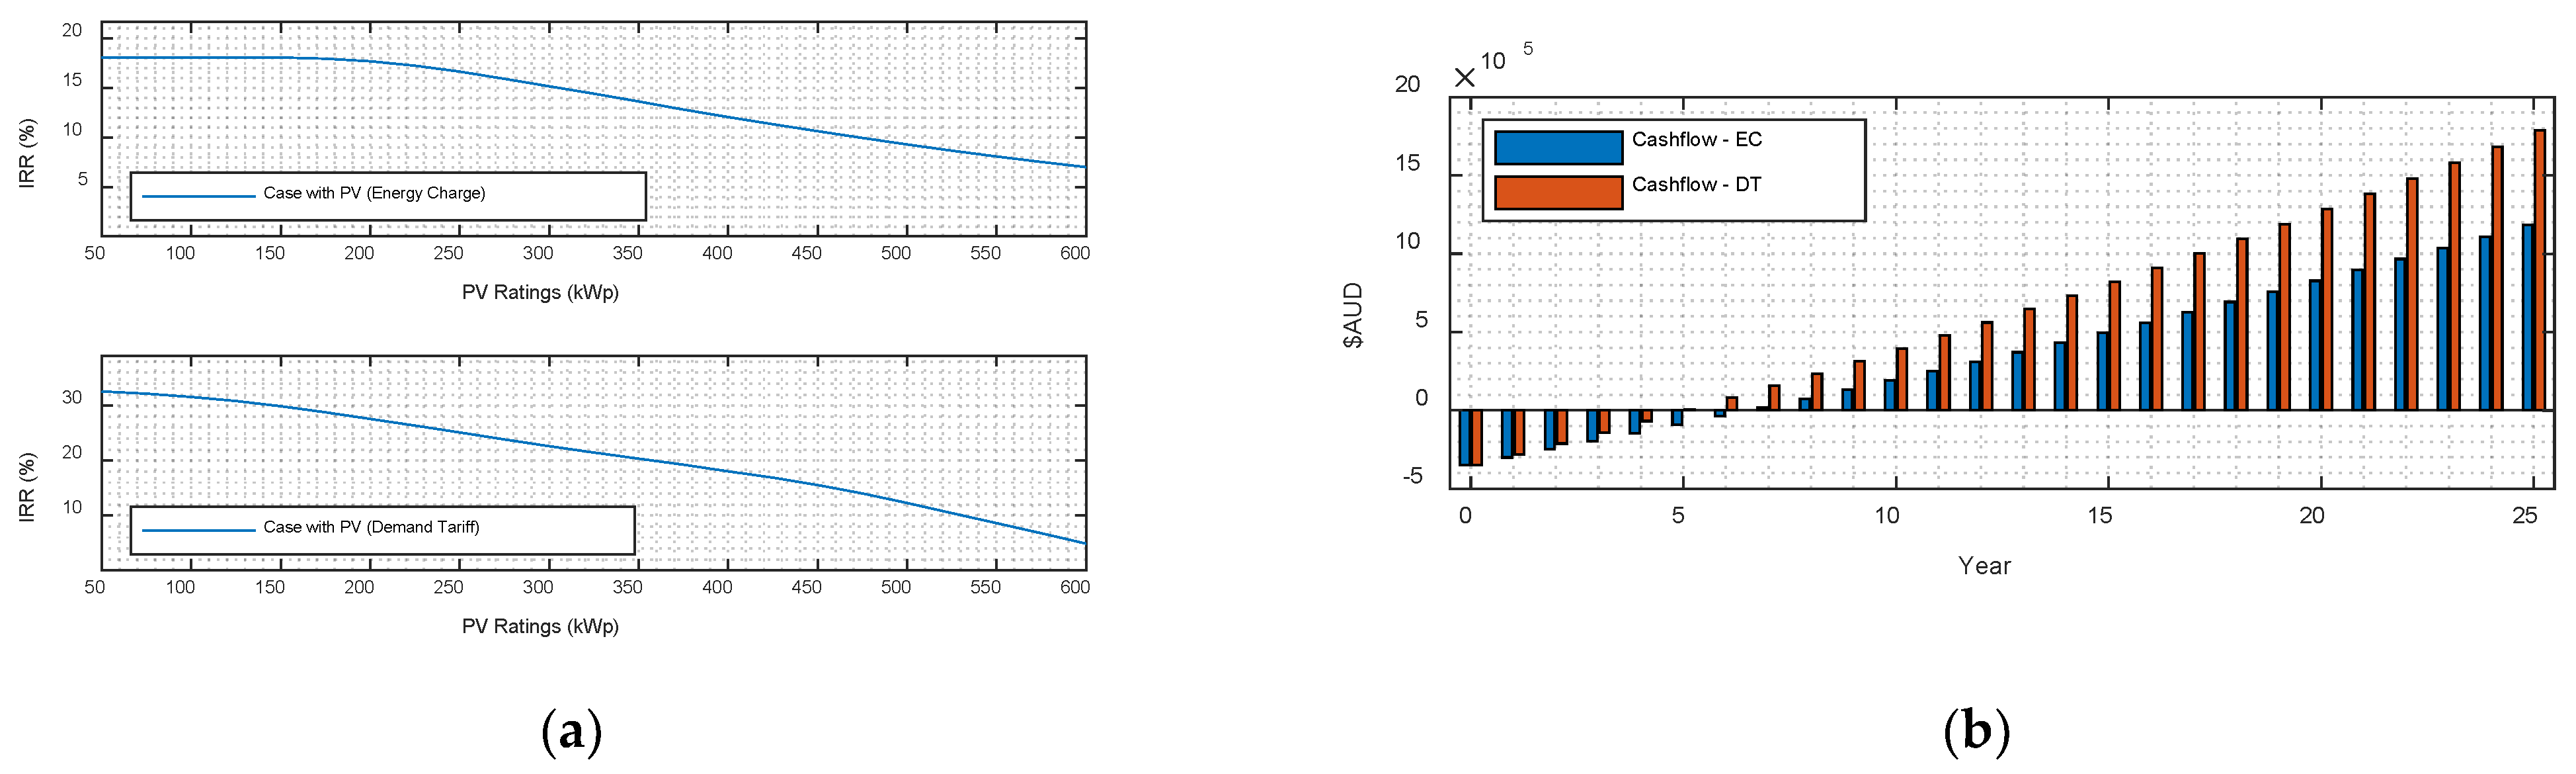
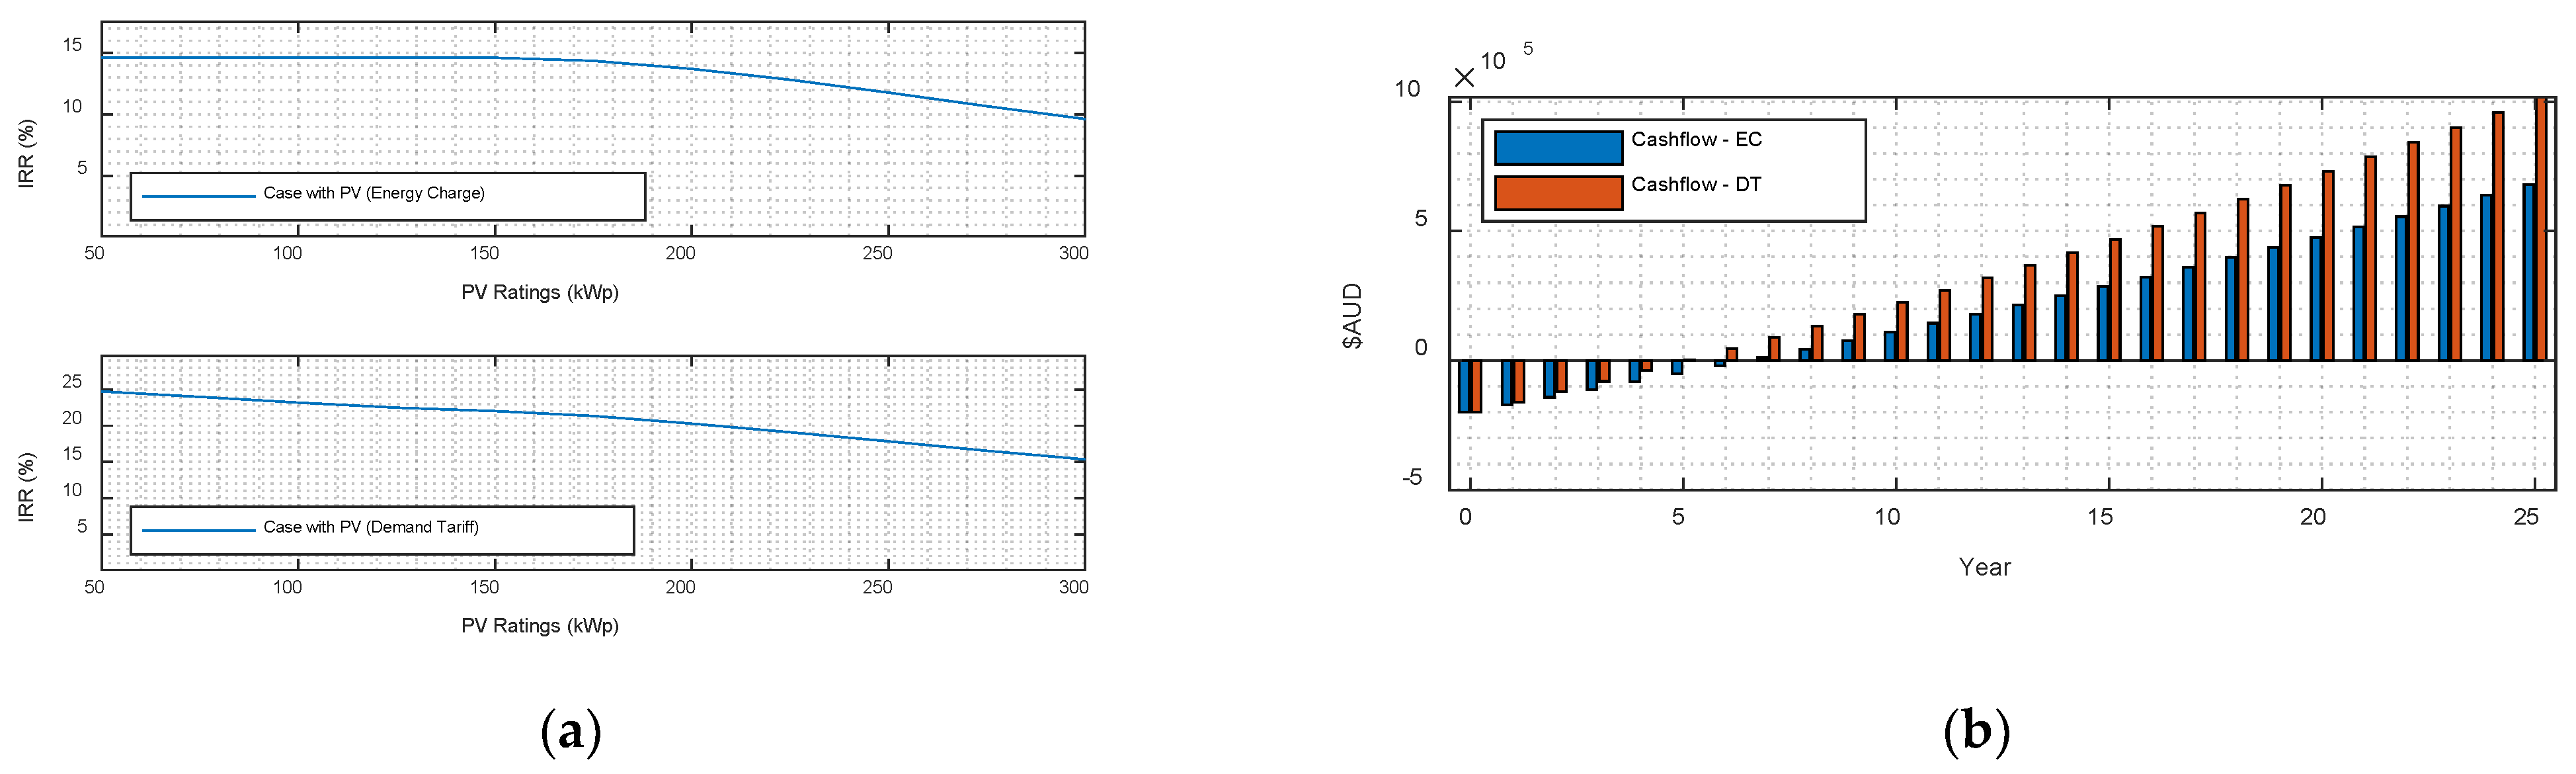
3.4. Scenario 3: Best Return on Investment Scenario

This scenario identifies the largest possible PV system rating for each community based on break even or positive cashflow by the 5th year since the PV investment.
The process starts with a clustering algorithm to identify typical days for each community. Then, various PV system outputs, costing and savings are superimposed on those identified typical days for each community. Formulation of the process is presented in previous methodology section.
To save space and to illustrate the process, three communities’ clustering outcomes are presented: typical days for Community 1, 5 and 10 in Table 7, Table 8 and Table 9, respectively. When clusters’ centroids (typical days) are identified, those days’ maximum temperatures and solar outputs are obtained from history data. Then, energy charge of each typical day is calculated with 30 min interval electricity demand data and tariff in Table 2 in Section 2.4.
For tropical Community 1 (Table 7), nearly 50% of days in a year have a typical maximum temperature around 27.72 °C and a typical daytime energy charge around AUD 300 for electricity use. The remaining 50% of the year has warm to hot days (30 to 32 °C) with typical daytime energy charges between AUD 450 and 460.
For subtropical Community 5 (Table 8), 53.2% of days have a typical daily maximum temperature around 23.39 °C with a moderate daytime energy charge around AUD 193.77 per day. However, for the remainder of the year, with warmer days, Community 5 needs around AUD 290 for daytime electricity use on the average.
For Community 10 in a temperate climate zone (Table 9), nearly a quarter (27.2%) of days are cool days with typically AUD 189.94 daytime energy charge. A total of 35.9% days are quite mild, and another 37% days are typically above 29 °C with both higher solar outputs and higher daytime energy charges.
The accuracy of the three communities’ typical days has been critically evaluated by studying the differences between yearly bill calculated from typical days and yearly bill calculated from their whole yearly datasets. As presented in Table 10, the differences are quite small, all less than 1%.
After identifying typical days for each community, PV systems of various sizes can be simulated on the real data of each community’s typical days. To illustrate this process, the IRR and cashflow of the same communities (1, 5, 10) are presented in Figure 5, Figure 6 and Figure 7, respectively.
For Community 1, analysis has been conducted for PV systems rating from 50 kWp to 600 kWp. As shown in Figure 5a, when only energy saving (reduction for energy charge) is considered, PV systems never had an IRR above 18%. When both energy savings and demand reduction (2 aspects of DT) are considered, IRRs are above 30% to start with and maintained above 18% for the studied PV rating range. The 550 kWp PV system reaches positive cashflow by the 5th year and this rating is the largest PV sizing to meet the cashflow criterium. Considering savings in both energy and demand reduction, cashflow gets much more positive than only thinking of PV for energy savings as shown in Figure 5b. One of the key reasons for this is: aged care communities tend to have peak electricity demands during the day, which mostly happen during solar hours [13]. For this community, a 550 kWp PV can achieve a positive cashflow by the fifth year and a significant financial savings (revenue) near to AUD 3 million by the end of the PV system lifetime (assumed to be 25 years).
For the subtropical Community 5, a similar picture appears: IRRs are much higher when demand tariff is considered, compared to consideration of only the savings in energy charges as shown in Figure 6a. For this community, 350 kWp is the largest PV system rating to reach positive cashflow by the 5th year. By the end of the PV system lifetime (25 years), a significant saving of AUD 1.8 million is achievable.
When comparing the top plot and the bottom plot in Figure 7a, Community 10’s IRRs from demand tariff’s energy saving and demand reduction are continuously greater than IRRs from savings in energy charges. The 200 kWp is the largest PV system rating for the community and its cashflow turns slightly positive by the 5th year as presented in Figure 7b. Over AUD 1 million savings can be achieved by the end of the PV system lifetime.
In summary, the best PV system rating for each community is presented in Table 11. In this scenario, tropical communities need 4.2 kWp/bed and subtropical communities need an average of 3.4 kWp/bed with higher allowances for communities of higher electricity use intensity, such as for Community 7 and 8.
In this scenario in terms of PV outputs meeting communities’ electricity needs, most communities can achieve 50% of the net zero electricity goal and have a positive cashflow by the 5th year. In another word, those PV investments would make profits for those communities from the 5th year in operation for about 20 years until the end of PV systems lifetime.

3.5. Scenarios 4 and 5: 3 kWp/Bed, 5 kWp/Bed

This section presents findings for scenarios where communities are provided with access to PV system sizing similar to that applied to households, i.e., 3 or 5 kWp/bed.
As shown in Table 12, when a 3 kWp/bed rating is applied to all communities, 5 communities in subtropical and temperate zones can achieve 50% of the net zero electricity goal. However, tropical communities and 3 subtropical communities are a bit far away from that goal; the 3 kWp/bed rating is lower than what is needed to achieve the best return on investment results in the previous section. On a positive note, however, the 3 kWp/bed rating is most likely compensating the local daytime electricity use of those communities. Further with the 3 kWp/bed rating, five of the ten communities would be able to breakeven on the 5th year because their PV system ratings (row 4 of Table 12) are smaller than the system ratings with optimal returns in the previous section (row 4 of Table 11).
When 5 kWp/bed rating is considered, treating community residents like a customer in a normal network as per Australian national guideline [28], all communities can achieve over 62% of the net zero electricity goal (Table 13). Four communities can achieve net positive electricity and the surplus renewable electricity could be used to compensate for the carbon emissions from other forms of stationary energy use, such as natural gas for cooking, hot water and heating needs.

4. Implication and Discussion

This research investigates the impact of renewable energy policy on residential care communities. It raises the issue of potential unfairness in the way that energy policies and incentive are applied to residents in households compared with residents in a communal setting. The results demonstrate that the equitable application of household renewable energy sizing to a residential community can positively impact communities’ energy reduction, financial sustainability, and low carbon transition. A fairer renewable energy policy for aged care communities can have significant national impact, alleviate public resource constraints, and improve renewable energy equity.

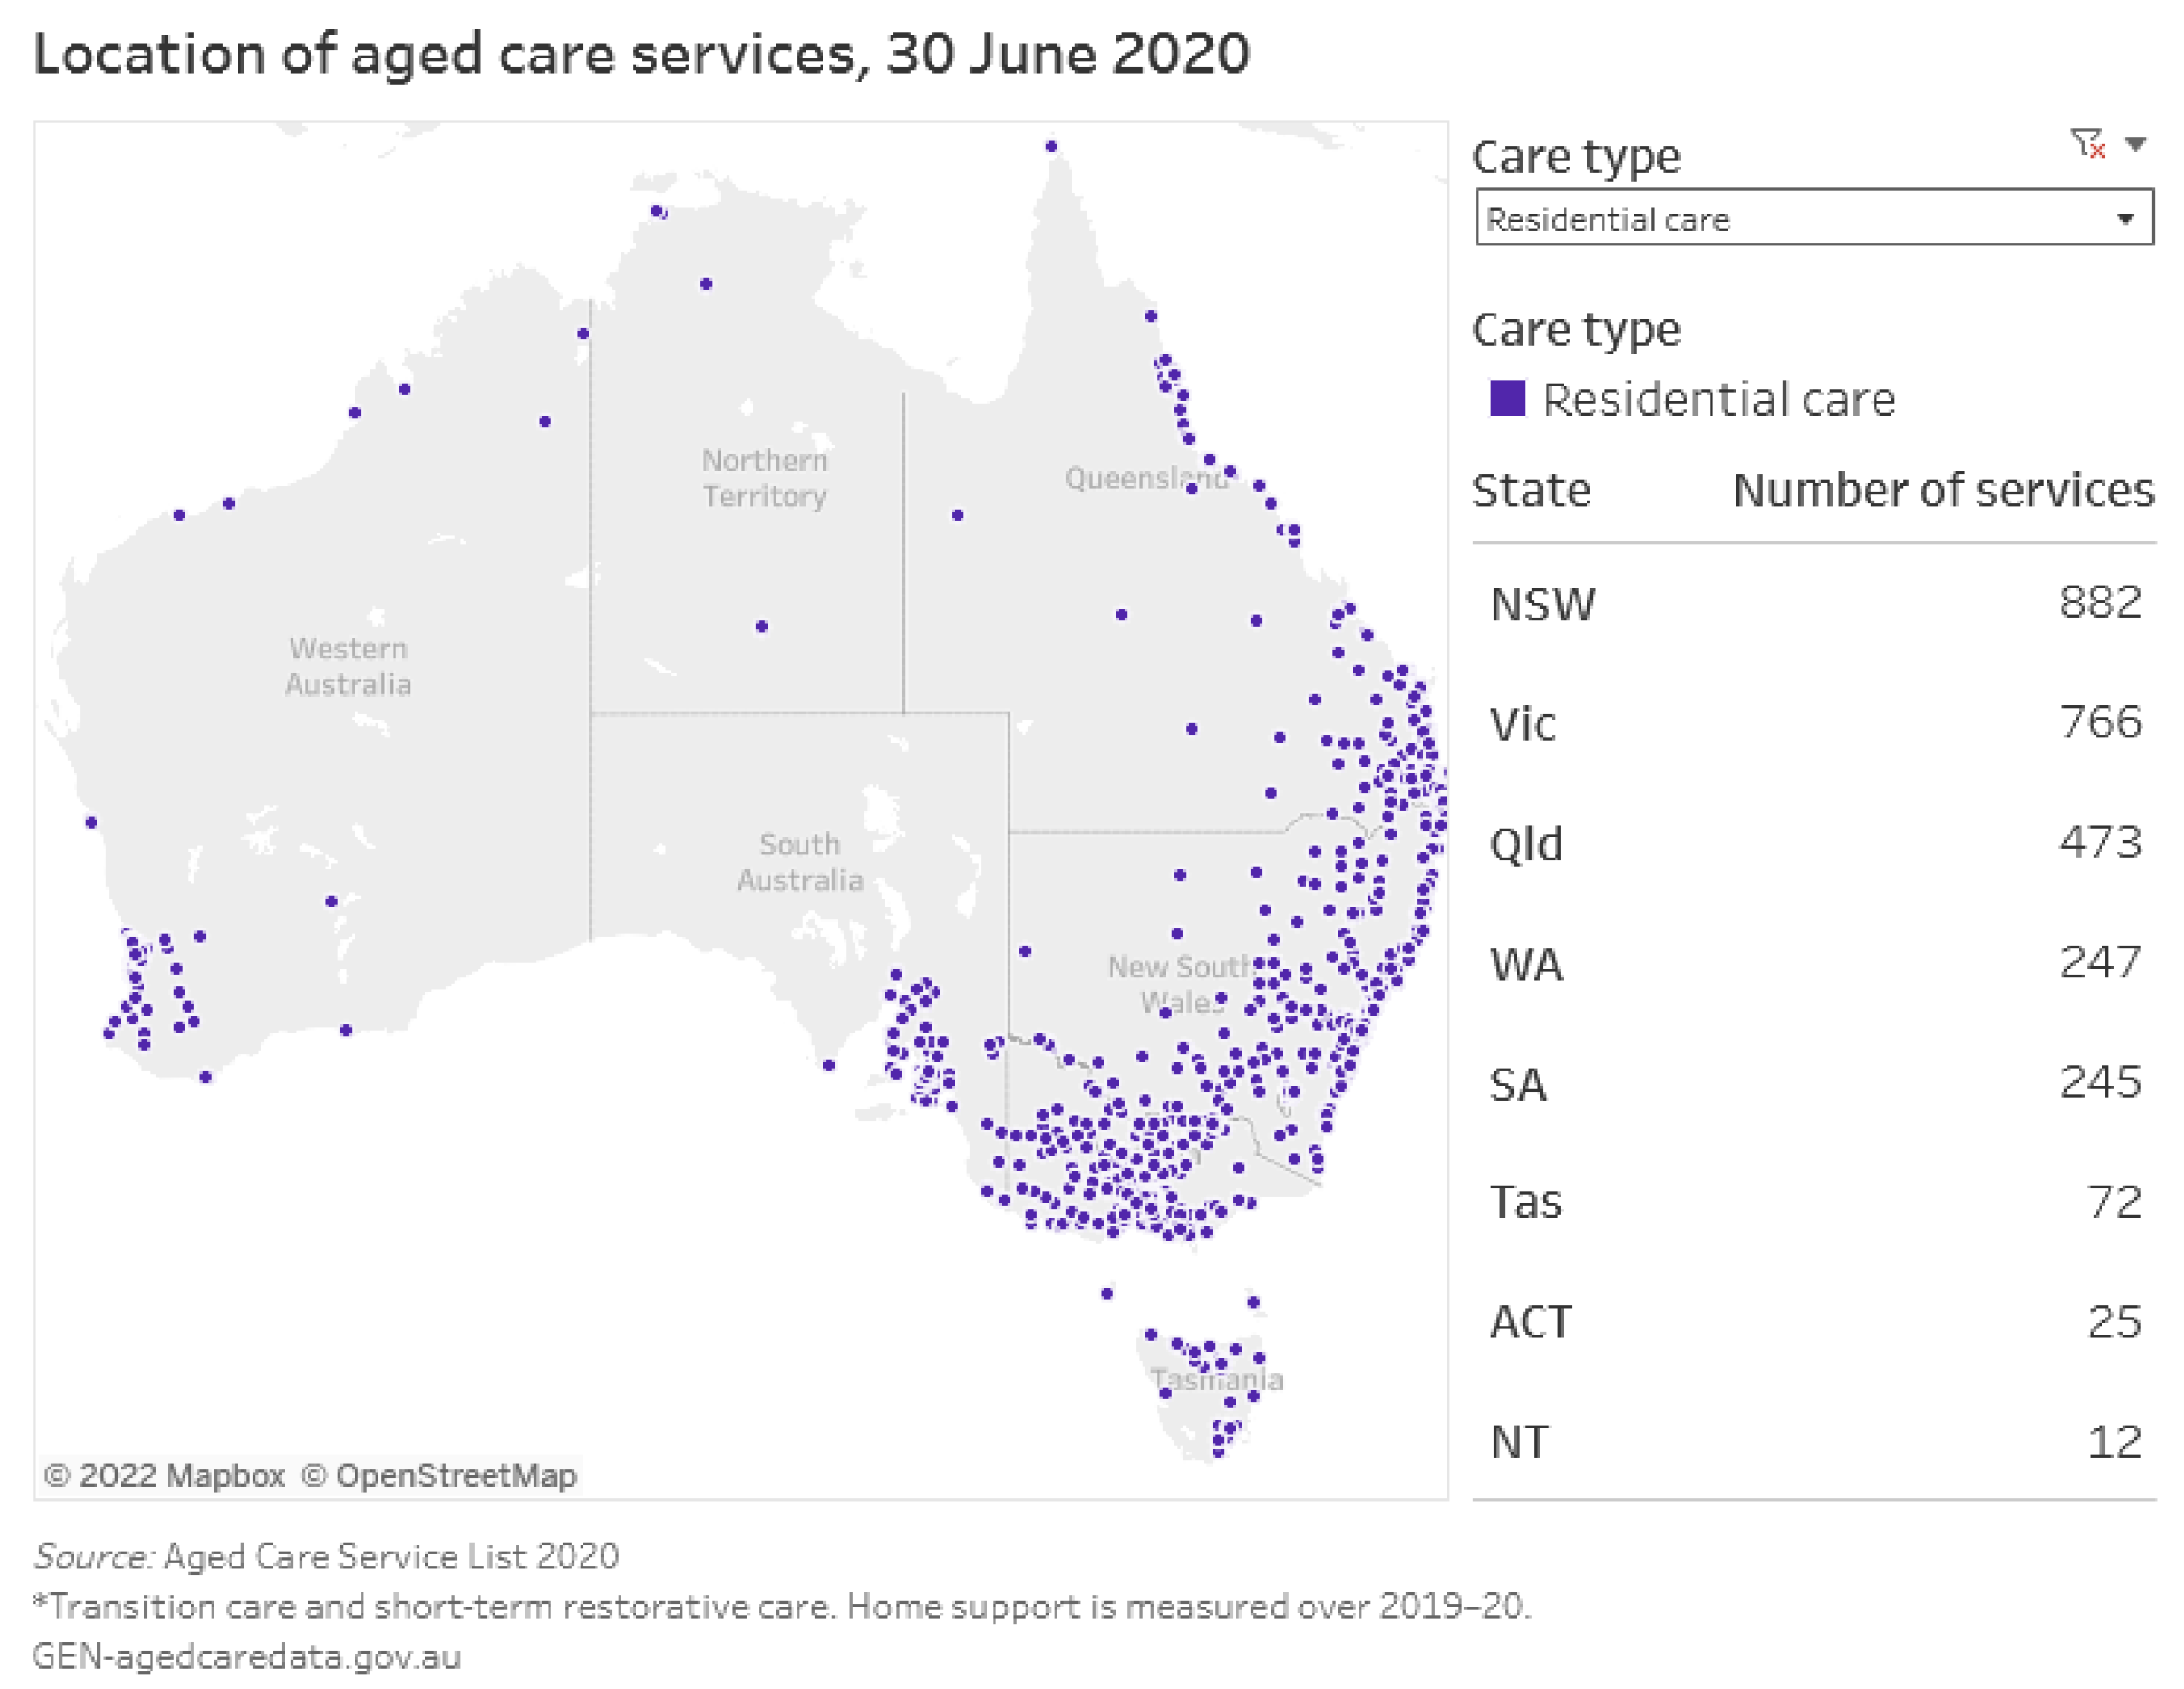
4.1. National Impact

There were 189,954 residents using residential aged care in the 2019–2020 financial year (July 2019 to June 2020) based on Australian government statistics [42]. In total, by 30 June 2020, there were 2722 residential aged care facilities across Australia [43], as shown in Figure 8.
Our society is on the journey of low carbon transition. The 3 kWp/bed quota is near to the best return on investment scenario in Section 3.4. When the 3 kWp/bed limit is applied to all Australian aged care communities, renewable generation and emission reduction could be increased by 209% when compared to the base 100 kWp per community scenario (Table 14).
If senior residents are entitled to have 5 kWp/bed, Australian aged care communities can produce 349% more renewable energy and further reduce 670,000 tonnes emission than the 100 kWp per community scenario. The bill savings impact is discussed in the following section.

4.2. Alleviate Public Resource Constraints

Healthcare is often under budget constraints. Due to service and healthcare needs, senior living and aged care communities typically have higher energy use intensity, compared to individual dwellings in the same climate [6,7]. This energy consumption is needed to ensure safe and reliable operation of aged care communities, such as energy for running medical and healthcare equipment, nursing and communal spaces, central kitchen and community facilities.
Resource scarcity is a recurrent theme. Multiple reports evidenced aged care cost pressure and budget constraints [45,46], as does the recent Royal Commission into Aged Care Quality and Safety [11]. In the 2019 to 2020 financial year, over AUD 13 billion dollars were spent by Australian governments for residential aged care services, including AUD 13,436.5 million from Australian commonwealth government and AUD 201.9 million from Australian state governments [47]. In addition, there was another AUD 214.2 million recorded for aged care’s capital expenditure. However, this public funding seems to be insufficient. The recent Royal Commission into Aged Care Quality and Safety calls for a rapid increase in government funding for the aged care sector [11]. For example, the Royal Commission projects at least 6.6 times more federal government funding for residential aged care, comparing 2050 to 2020 scenario.
Renewable energy technology can help alleviate the public budget pressure for the aged care sector at a ballpark figure of AUD 40 to 139 million dollars potential bill savings per year (last column estimates in Table 14). If a middle value of an annual AUD 90 million energy saving is achieved, it equates to an additional 1272 residential aged care service places (each residential aged care place was allocated with AUD 13,436.5 million/189,954 = AUD 70,736 government funding in 2020).
Please note Table 14 bill savings (the last column) are based on a conservative pricing estimate and future savings could be significantly more when electricity prices escalate over the serviceable life of the PV systems.

4.3. Renewable Energy Equity

On one side, Australia has abundant solar resources and has the highest small scale solar PV systems penetration in the world with over 25% of homes having a solar system [48,49]. Individual dwellings often have its own energy meter and small-scale renewable energy system (no more than 100 kWp PV) would be applicable to them with direct incentives.
Aged care communities often have one gate meter for the whole community while the same 100 kWp limit is applicable for the whole community. However, a community is the home for tens or over a hundred senior residents. This means it is more difficult for senior residents in aged care communities to achieve a sustainable energy goal, compared to residents in individual households.
Therefore, we would advocate for small scale renewable energy system for communal and senior living to be on a per bed basis. If Australian Distribution Network guideline (5 kWp) is applied to aged care communities on a per bed basis, rather than per meter or per site, aged care communities in subtropical and temperate climate zones would likely achieve or be near to net zero electricity goals on a yearly basis.
Information availability is probably one of the first things to be considered in terms of realising the renewable energy equity for our senior residents. Australian aged care sector is already regulated, and residential aged care communities are regularly examined for quality assurance. Site addresses, services and bed numbers are regularly reported, and the information is available on public domain [50], which can enable the calculation of renewable energy sizing options for each aged care communities.

5. Conclusions

For aged care communities, a small-scale renewable target on a per bed basis clearly demonstrates significant impact in renewable energy generation, emission reduction, relieving public budget constraints and improving renewable energy equity for community residents, compared to a static 100 kWp limit for each site or each meter.
This call for a fairer renewable energy policy for aged care communities can potentially be applied to other communal living settings to support energy equity, sustainability, and low carbon transition, such as for retirement villages, mixed mode communities (e.g., seniors and students living).
Other constraining factors for PV systems installation are not discussed in this paper, such as available roof space or car park space, network capacity and technical limits to accommodate more renewables during solar hours [51]. These factors are site specific, network location specific and need to be further assessed in detail for each community.

Author Contributions

Conceptualization, A.L. and W.M.; methodology, A.L.; software, A.L.; validation, A.L.; formal analysis, A.L. and W.M.; investigation, A.L., W.M., J.C. and J.M.; resources, W.M.; data curation, J.C., J.M. and M.O.; writing—original draft preparation, A.L. and Y.Y.; writing—review and editing, A.L., W.M., T.Y., S.Z., Y.Y., J.C., J.M. and M.O.; visualization, A.L.; supervision, W.M.; project administration, W.M.; funding acquisition, W.M. and J.M. All authors have read and agreed to the published version of the manuscript.

Funding

This research was undertaken as part of the Innovation Hub for Affordable Heating and Cooling project (iHub project) led by Australian Institute of Refrigeration, Air Conditioning and Heating (AIRAH). The project received funding from Australian Renewable Energy Agency’s Advancing Renewables Program.

Data Availability Statement

The climate dataset is publicly available on the Australian Bureau of Meteorology site: http://www.bom.gov.au/Climate (accessed on 3 August 2021). The raw data related to the site are proprietary. If there is an interest in collaboration, please contact the corresponding author.

Acknowledgments

The authors sincerely thank Bolton Clarke for providing some of the data. Computational resources and services used in this work were provided by the Research Support Group, Queensland University of Technology (QUT), Brisbane, Australia.

Conflicts of Interest

The authors declare no conflict of interest. The funders had no role in the design of the study; in the collection, analyses, or interpretation of data; in the writing of the manuscript; or in the decision to publish the results.

Appendix A

Solar PV system costing details are in the following Table A1.
Table A1. Solar PV system costing.
DescriptionParameters
Interest rate3%
PV system service life25 years
PV efficiency drop20% over 25 years
PV inverter systemAUD 1200/kWp
PV system yearly maintenance—labourAUD 200/10 kWp PV system in the base year, subject to inflation
PV system yearly maintenance—materialAUD 400/10 kWp PV system in the base year, subject to inflation

References

  1. Miller, W.; Vine, D.; Amin, Z. Energy Efficiency of Housing for Older Citizens: Does It Matter? Energy Policy 2017, 101, 216–224. [Google Scholar] [CrossRef] [Green Version]
  2. Miller, W.F.; Liu, A.; Crompton, G.; Ma, Y. Healthcare Sector Energy Baseline and Key Performance Indicators; Australian Institute of Refrigeration, Air-conditioning and Heating (AIRAH): Brisbane, Australia, 2020. [Google Scholar]
  3. Yigitcanlar, T.; Kankanamge, N.; Inkinen, T.; Butler, L.; Preston, A.; Rezayee, M.; Gill, P.; Ostadnia, M.; Ioppolo, G.; Senevirathne, M. Pandemic Vulnerability Knowledge Visualisation for Strategic Decision-Making: A COVID-19 Index for Government Response in Australia. Manag. Decis. 2021, 60, 893–915. [Google Scholar] [CrossRef]
  4. Xia, B.; E, J.; Chen, Q.; Buys, L.; Yigitcanlar, T.; Susilawati, C. Understanding Spatial Distribution of Retirement Villages: An Analysis of the Greater Brisbane Region. Urban Sci. 2021, 5, 89. [Google Scholar] [CrossRef]
  5. Sun, K.; Specian, M.; Hong, T. Nexus of Thermal Resilience and Energy Efficiency in Buildings: A Case Study of a Nursing Home. Build. Environ. 2020, 177, 106842. [Google Scholar] [CrossRef]
  6. Fonseca, P.; Esteves, P.; Marques, L.; Anibal, A. Analysis of Total Energy Consumption in 100 Care Homes for Elderly; University of Coimbra: Coimbra, Portugal, 2011. [Google Scholar]
  7. Liu, A.; Miller, W.; Crompton, G.; Zedan, S. Has COVID-19 Lockdown Impacted on Aged Care Energy Use and Demand? Energy Build. 2021, 235, 110759. [Google Scholar] [CrossRef]
  8. Liu, A.; Miller, W.; Crompton, G.; Ma, Y. Principles to Define Energy Key Performance Indicators for the Healthcare Sector. In Proceedings of the Smart Grid and Energy System Conference, Perth, Australia, 23–26 November 2020; Wen, F., Shahnia, F., Eds.; IEEE Xplore: Piscataway, NJ, USA, 2021. [Google Scholar]
  9. Xia, B.; Chen, Q.; Walliah, J.; Buys, L.; Skitmore, M.; Susilawati, C. Understanding the Dynamic Behaviour of the Australian Retirement Village Industry: A Causal Loop Diagram. Int. J. Strateg. Prop. Manag. 2021, 25, 346–355. [Google Scholar] [CrossRef]
  10. Wang, Z.; Yu, H.; Jiao, Y.; Wei, Q.; Chu, X. A Field Study of Thermal Sensation and Neutrality in Free-Running Aged-Care Homes in Shanghai. Energy Build. 2018, 158, 1523–1532. [Google Scholar] [CrossRef]
  11. Royal Commission into Aged Care Quality and Safety. Aged Care Reform: Projecting Future Impacts—Research Paper 11. Available online: http://agedcare.royalcommission.gov.au (accessed on 11 January 2022).
  12. Liu, A.; Miller, W.F. Healthcare Living Laboratories: Queensland Children’s Hospital—Energy Baseline Data; Australian Institute of Refrigeration, Air-Conditioning and Heating (AIRAH): Brisbane, Australia, 2020. [Google Scholar]
  13. Liu, A.; Miller, W.; Chiou, J.; Zedan, S.; Yigitcanlar, T.; Ding, Y. Aged Care Energy Use and Peak Demand Change in the COVID-19 Year: Empirical Evidence from Australia. Buildings 2021, 11, 570. [Google Scholar] [CrossRef]
  14. Burch, H.; Anstey, M.H.; McGain, F. Renewable Energy Use in Australian Public Hospitals. Med. J. Aust. 2021, 215, 160–163. [Google Scholar] [CrossRef]
  15. Miller, W.; Liu, L.A.; Amin, Z.; Gray, M. Involving Occupants in Net-Zero-Energy Solar Housing Retrofits: An Australian Sub-Tropical Case Study. Sol. Energy 2018, 159, 390–404. [Google Scholar] [CrossRef]
  16. Ma, Y.; Zedan, S.; Liu, A.; Miller, W. Impact of a Warming Climate on Hospital Energy Use and Decarbonization: An Australian Building Simulation Study. Buildings 2022, 12, 1275. [Google Scholar] [CrossRef]
  17. Cao, S.; Hasan, A.; Sirén, K. Analysis and Solution for Renewable Energy Load Matching for a Single-Family House. Energy Build. 2013, 65, 398–411. [Google Scholar] [CrossRef]
  18. Colmenar-Santos, A.; Campíñez-Romero, S.; Pérez-Molina, C.; Castro-Gil, M. Profitability Analysis of Grid-Connected Photovoltaic Facilities for Household Electricity Self-Sufficiency. Energy Policy 2012, 51, 749–764. [Google Scholar] [CrossRef]
  19. Khorasany, M.; Mishra, Y.; Ledwich, G. Market Framework for Local Energy Trading: A Review of Potential Designs and Market Clearing Approaches. IET Gener. Transm. Distrib. 2018, 12, 5899–5908. [Google Scholar] [CrossRef] [Green Version]
  20. Liu, A.; Miller, W.; Cholette, M.E.; Ledwich, G.; Crompton, G.; Li, Y. A Multi-Dimension Clustering-Based Method for Renewable Energy Investment Planning. Renew. Energy 2021, 172, 651–666. [Google Scholar] [CrossRef]
  21. Ahmad, T.; Chen, H.; Guo, Y.; Wang, J. A Comprehensive Overview on the Data Driven and Large Scale Based Approaches for Forecasting of Building Energy Demand: A Review. Energy Build. 2018, 165, 301–320. [Google Scholar] [CrossRef]
  22. Renewable Energy (Electricity) Regulations 2001; Federal Register of Legislation: Canberra, Australia, 2021; pp. 1–217.
  23. Australian Government Clean Energy Regulator Renewable Energy Target Financial Incentives. Available online: http://www.cleanenergyregulator.gov.au/RET/How-to-participate-in-the-Renewable-Energy-Target/Financial-incentives (accessed on 15 February 2022).
  24. Best, R.; Chareunsy, A.; Li, H. Equity and Effectiveness of Australian Small-Scale Solar Schemes. Ecol. Econ. 2021, 180, 106890. [Google Scholar] [CrossRef]
  25. Best, R.; Burke, P.J.; Nishitateno, S. Evaluating the Effectiveness of Australia’s Small-Scale Renewable Energy Scheme for Rooftop Solar. Energy Econ. 2019, 84, 104475. [Google Scholar] [CrossRef] [Green Version]
  26. Keady, W.; Panikkar, B.; Nelson, I.L.; Zia, A. Energy Justice Gaps in Renewable Energy Transition Policy Initiatives in Vermont. Energy Policy 2021, 159, 112608. [Google Scholar] [CrossRef]
  27. Australian Government Clean Energy Regulator Large-Scale Renewable Energy Target. Available online: http://www.cleanenergyregulator.gov.au/RET/About-the-Renewable-Energy-Target/How-the-scheme-works/Large-scale-Renewable-Energy-Target (accessed on 15 February 2022).
  28. Energy Networks Australia. National Distributed Energy Resources Grid Connection Guidelines Technical Guidelines for Low Voltage Embedded Generation Connections; Energy Networks Australia: Melbourne, Australia, 2019; ISBN 978-1-925871-06-7. [Google Scholar]
  29. Anderson, K.; Farthing, A.; Elgqvist, E.; Warren, A. Looking beyond Bill Savings to Equity in Renewable Energy Microgrid Deployment. Renew. Energy Focus 2022, 41, 15–32. [Google Scholar] [CrossRef]
  30. Chapman, A.J.; McLellan, B.C.; Tezuka, T. Prioritizing Mitigation Efforts Considering Co-Benefits, Equity and Energy Justice: Fossil Fuel to Renewable Energy Transition Pathways. Appl. Energy 2018, 219, 187–198. [Google Scholar] [CrossRef]
  31. Australian Bureau of Meteorology Climate Data Online. Available online: http://www.bom.gov.au/climate/data/ (accessed on 15 June 2021).
  32. Australian Building Codes Board. Australia Climate Zone Map; Australian Building Codes Board: Canberra, Australia, 2019.
  33. Chester, C.; Gardiner, T.; Liddy, A.; Lim, W.F.; Spencer, L. Final Determination Regulated Retail Electricity Prices for 2018–2019; Queensland Competition Authority: Brisbane, Australia, 2018. [Google Scholar]
  34. De Saram, M.; Murphy, S. Solar Feed-in Tariff Report 2018–2019; Queensland Competition Authority: Brisbane, Australia, 2019. [Google Scholar]
  35. Miller, C.; Nagy, Z.; Schlueter, A. A Review of Unsupervised Statistical Learning and Visual Analytics Techniques Applied to Performance Analysis of Non-Residential Buildings. Renew. Sustain. Energy Rev. 2018, 81, 1365–1377. [Google Scholar] [CrossRef]
  36. Lu, Y.; Tian, Z.; Peng, P.; Niu, J.; Li, W.; Zhang, H. GMM Clustering for Heating Load Patterns In-Depth Identification and Prediction Model Accuracy Improvement of District Heating System. Energy Build. 2019, 190, 49–60. [Google Scholar] [CrossRef]
  37. McLachlan, G.J.; Peel, D. Finite Mixture Models; John Wiley & Sons: Hoboken, NJ, USA, 2004. [Google Scholar]
  38. Shaw-Williams, D.; Susilawati, C.; Walker, G. Value of Residential Investment in Photovoltaics and Batteries in Networks: A Techno-Economic Analysis. Energies 2018, 11, 1022. [Google Scholar] [CrossRef] [Green Version]
  39. Australian Energy Council. Solar Report Quarter 2 2021; Australian Energy Council: Melbourne, Australia, 2021. [Google Scholar]
  40. Green Energy Markets. Projections for Distributed Energy Resources—Solar PV and Stationary Energy Battery Systems—Report for Australian Energy Market Operator; Green Energy Markets: Melbourne, Australia, 2020. [Google Scholar]
  41. Dobos, A.P. PVWatts Version 5 Manual (NREL/TP-6A20-62641); National Renewable Energy Laboratory (NREL): Golden, CO, USA, 2014; 20p. [CrossRef]
  42. Australian Institute of Health and Welfare People Using Aged Care Services, 2018–2019. Available online: https://www.gen-agedcaredata.gov.au/Resources/Factsheets-and-infographics (accessed on 19 December 2021).
  43. Australian Institute of Health and Welfare Providers, Services and Places in Aged Care. Available online: https://www.gen-agedcaredata.gov.au/Topics/Providers,-services-and-places-in-aged-care (accessed on 19 December 2021).
  44. Australian Energy Market Operator. Carbon Dioxide Equivalent Intensity Index 2021 Summary File. Available online: https://aemo.com.au/en/energy-systems/electricity/national-electricity-market-nem/market-operations/settlements-and-payments/settlements/carbon-dioxide-equivalent-intensity-index (accessed on 6 February 2022).
  45. Mcnamee, J.P.; Kobel, C.; Rankin, N.M. Structural and Individual Costs of Residential Aged Care Services in Structural and Individual Costs of Residential Aged Care Services in Australia. The Resource Utilisation and Classification Study: Report 3 Australia; University of Wollongong: Wollongong, Australia, 2019; ISBN 9781741282979. [Google Scholar]
  46. Royal Commission into Aged Care Quality and Safety. The Cost of Residential Aged Care—Research Paper 9; The University of Queensland: Brisbane, Australia, 2020. [Google Scholar]
  47. Australian Productivity Commission 2021 Part F Section 14 Aged Care Services—Data 2021. Available online: https://www.gen-agedcaredata.gov.au/www_aihwgen/media/Productivity-Commission/rogs-2021-partf-section14-aged-care-services.pdf (accessed on 12 January 2022).
  48. Geoscience Australia. Australian Energy Resource Assessment; Australian Department of Industry: Canberra, Australia, 2018.
  49. Platt, G.; Spak, B.; Dowd, A.-M. Household Solar on the Rise in Australia; Commonwealth Scientific and Industrial Research Organisation (CSRIO): Canberra, Australia, 2020.
  50. Australian Government My Aged Care Website. Available online: https://www.myagedcare.gov.au/find-a-provider/ (accessed on 14 February 2022).
  51. Liu, A.; Shafiei, M.; Ledwich, G.; Walker, G.; Krause, O.; Terry, J.; Morosini, G.-M. Enabling More Solar in Distribution Network with an Automated Analysis Tool. In Proceedings of the 10th IEEE PES Innovative Smart Grid Technologies Conference—Asia, Brisbane, Australia, 5–8 December 2021; Saha, T.K., Ed.; IEEE Xplore: Piscataway, NJ, USA, 2021. [Google Scholar]
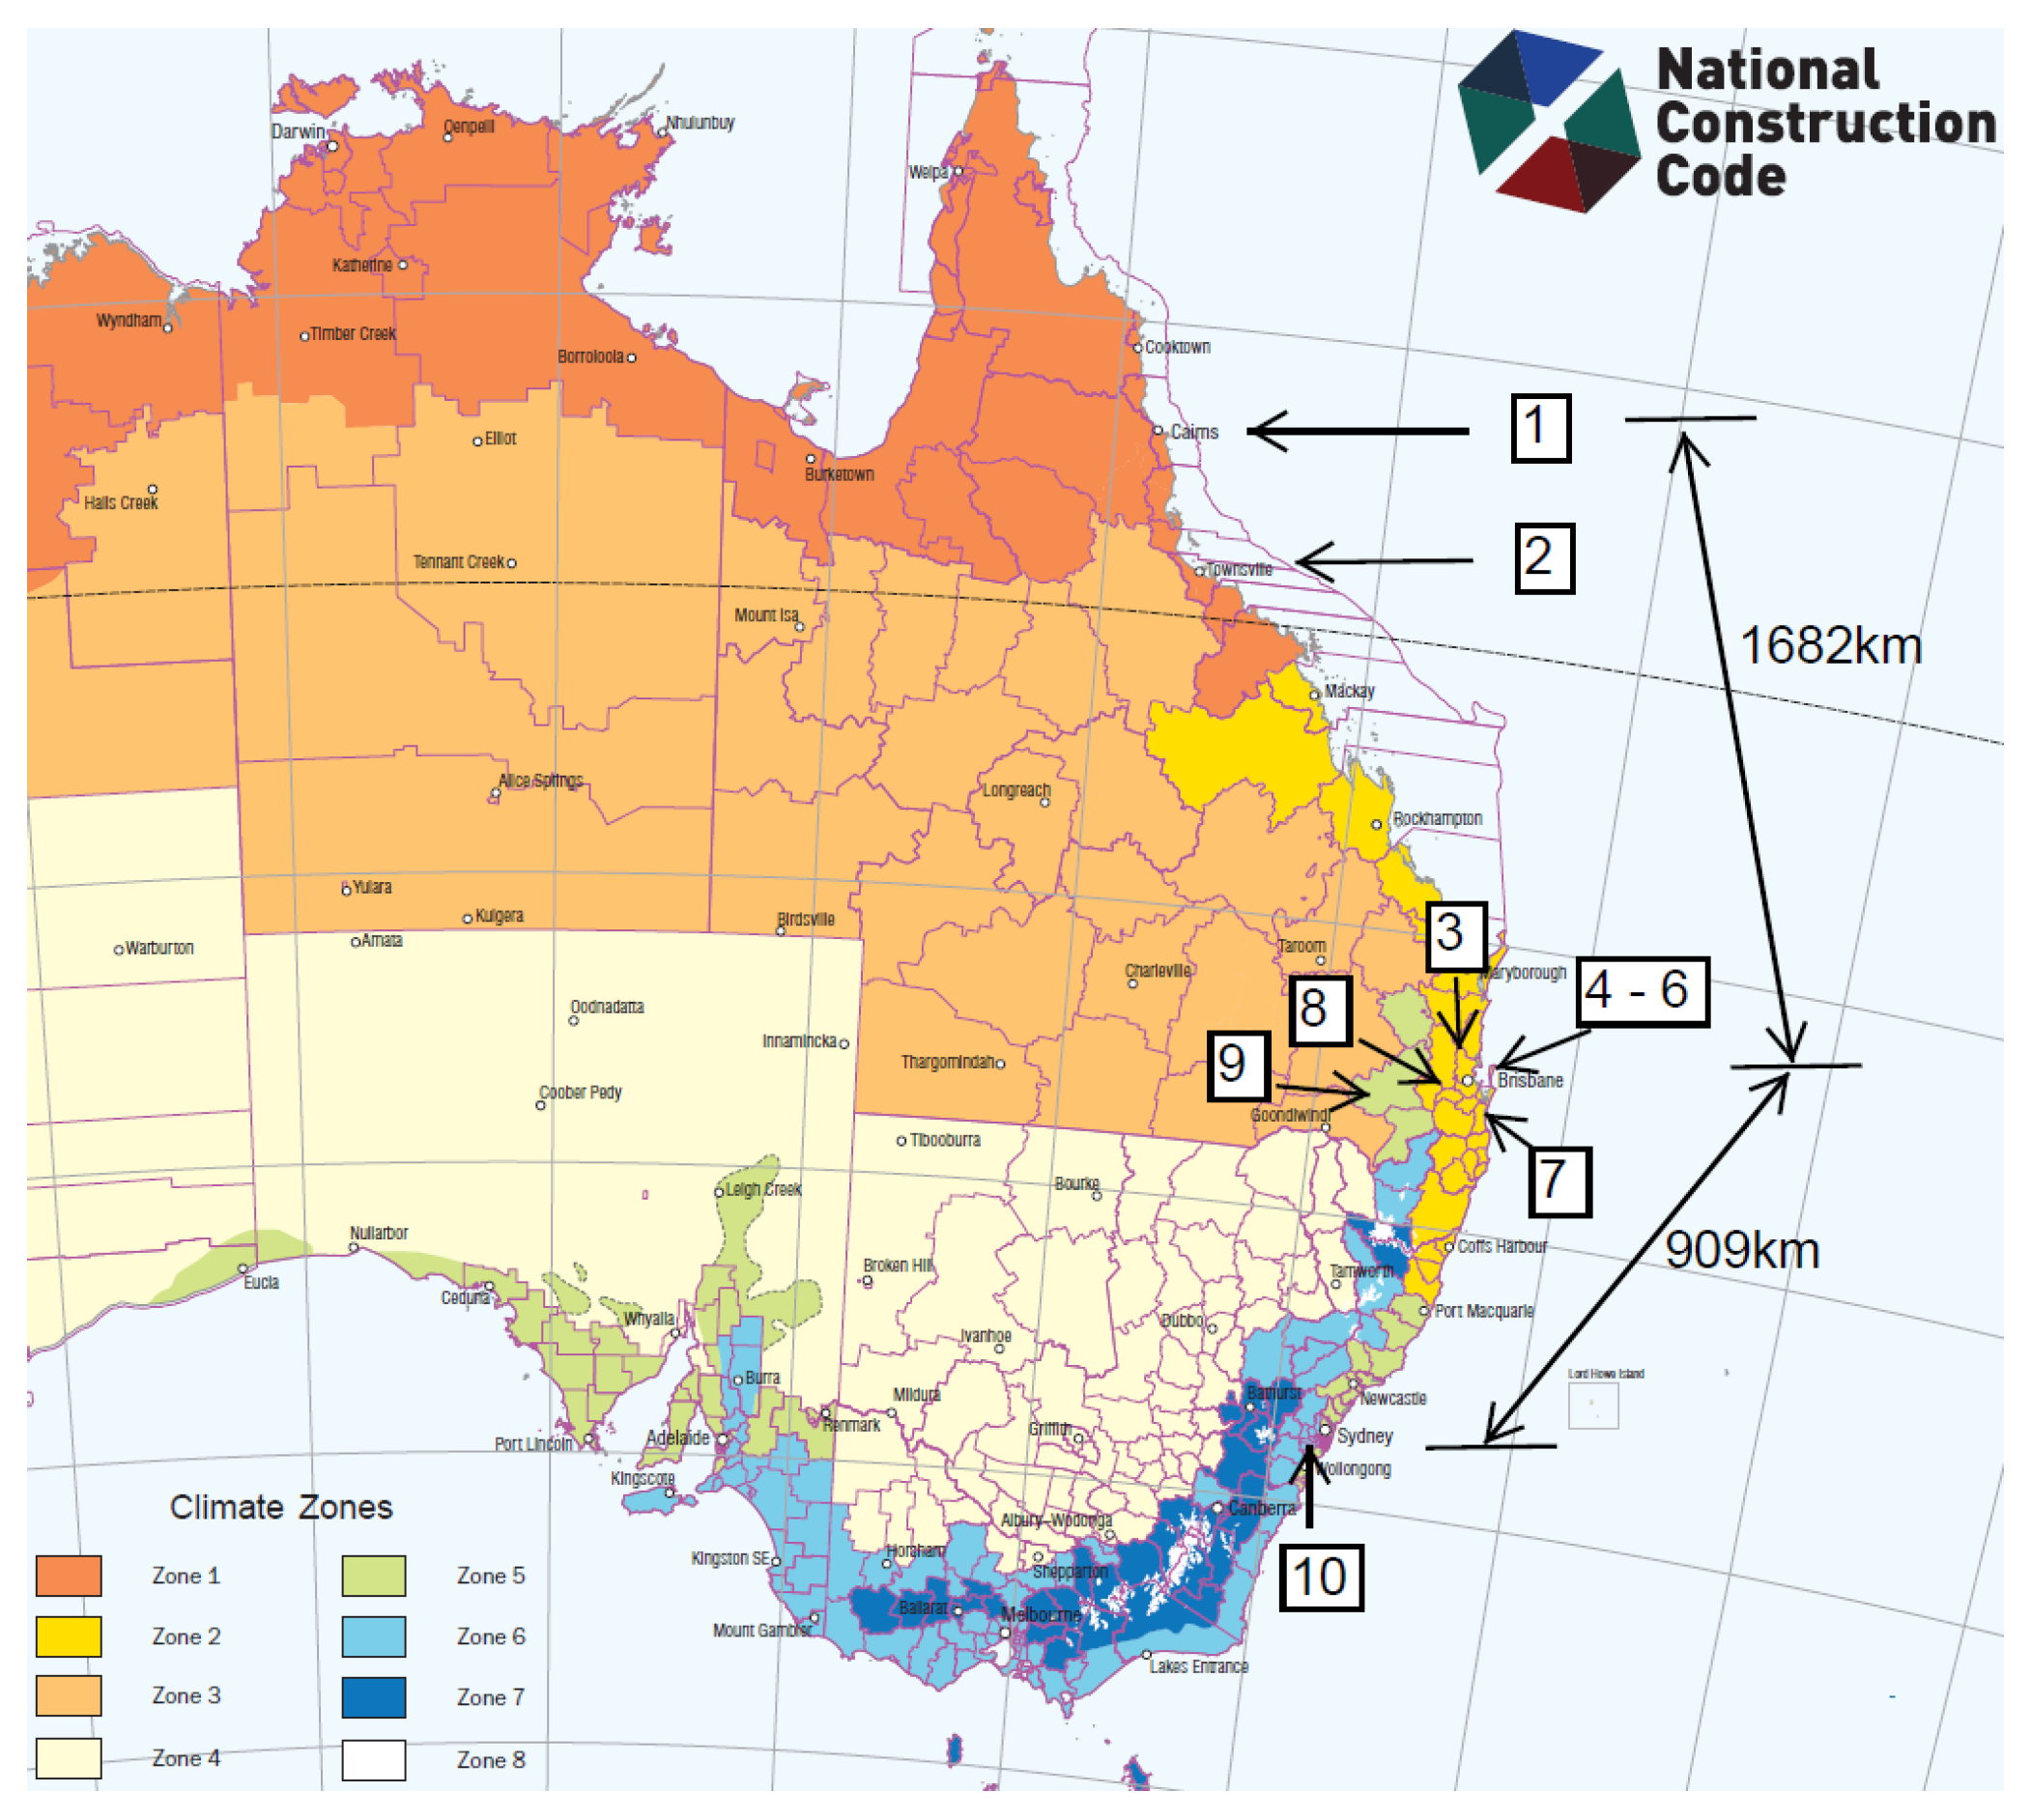
Figure 1. Research flow chart.
Buildings 12 01631 g001
Figure 2. Case communities across Australian climate zones (adopted from [32]).
Buildings 12 01631 g002
Figure 3. Flowchart to identify the best return on investment PV system rating.
Buildings 12 01631 g003
Figure 4. Annual demand profile expressed in boxplots from Community 1 (a) and Community 3 (b).
Buildings 12 01631 g004
Figure 5. Financial KPIs for PV investment at Community 1: (a) Internal Rate of Return; (b) Cashflow for the community when PV capacity is 550 kWp.
Buildings 12 01631 g005
Figure 6. Financial KPIs for PV investment at community 5: (a) Internal Rate of Return; (b) Cashflow (PV = 350 kWp).
Buildings 12 01631 g006
Figure 7. Financial KPIs for PV investment at community 10: (a) Internal Rate of Return; (b) Cashflow (PV = 200 kWp).
Buildings 12 01631 g007
Figure 8. Residential aged care facilities across Australia, adopted from [43].
Buildings 12 01631 g008
Table 1. Characteristics of case study residential aged care communities.
Community No.RAC LocationBed NumberClimate
1Cairns132Tropical with high humidity summer and warm winter
(Climate Zone 1 [32])
2Townsville102
3Murrumba Downs94Subtropical with warm humid summer and mild winter
(Climate Zone 2)
4Pinjarra Hills116
5Sunnybank Hills140
6Parkinson100
7Logan60
8Ipswich94
9Toowoomba80Warm temperate (Climate Zone 5)
10Sydney120Mild temperate (Climate Zone 6)
Table 2. Demand tariff structure and pricing.
DescriptionPricingNotes
Energy charge (EC) 1, 2AUD 0.161/kWh Use of grid energy in a month; to reflect energy generation/market/retailing costs
Demand charge (DeCh) 1, 2AUD 23.708/peak kW/monthBased on the highest peak demand kW in a month; to reflect network infrastructure costs
Feed-in tariff (FiT) 2, 3AUD 0.060/kWhBased on accumulated energy exported to the grid in a month
Notes: The tariff details are from a government determination document [33]. The prices are in Australian currency without goods and service tax. The feed-in tariff is from a government monitoring report [34].
Table 3. Clustering inputs.
DimensionPurposeInputs for Clustering
1To reflect seasonal variationMaximum daily temperature
2To reflect PV generationDaily outputs per unit PV rating
3To estimate PV’s financial impactEnergy charge during daytime hours
Table 4. Community energy baseline data (2019).
Community No.12345678910
CommunityCNSTSVMRDPJHSBHPKSLOGIPSTWBSYD
Climate zonesTropical
(Zone: 1)
Subtropical
(Zone: 2)
Temperate
(Zone: 5 and 6)
Bed numbers 1321029411614292609480120
Mean electricity use
kWh/bed/day
26.5127.2019.6924.7515.6321.9833.3731.4917.1613.40
Table 5. Percentages of 100 kWp PV system generation meeting demands.
Community No.12345678910
CommunityCNSTSVMRDPJHSBHPKSLOGIPSTWBSYD
PV system output
kWh/kWp/day [41]
4.254.364.174.174.174.174.174.294.463.85
Maximum PV size due to regulation (kWp)100
Equivalent to PV kWp/bed0.760.981.060.860.701.091.671.061.250.83
% PV outputs meeting electricity needs12%16%23%15%19%21%21%14%32%24%
Table 6. PV System Sizing for Meeting Net Zero Electricity Goal.
Community No.12345678910
CommunityCNSTSVMRDPJHSBHPKSLOGIPSTWBSYD
% PV outputs meeting electricity needs100%
NZE required
kWp/bed
6.236.234.725.933.755.278.007.343.853.48
Table 7. Typical days for tropical climate—community 1.
No.RepresentingMax Daily Temperature (°C)Daily Solar Outputs (kWh/kWp)Energy Charge during Daytime (AUD) 2, 3 Represent Percentages of Days in a Year
1Hot days 132.285.38458.8413.2%
2Warm days 130.813.92449.4736.9%
3Mild days 1 27.723.83300.5349.9%
Notes: Three typical days are identified for Community 1, each one with a different temperature, solar and energy charge during daytime hours. Energy charge is a component of demand tariff (more information is in previous Table 2). Energy charge during daytime hours is the electrical energy charge for the community for each typical day’s daytime consumption which can be offset by PV generation.
Table 8. Typical days for subtropical climate—community 5.
No.RepresentingMax Daily Temperature (°C)Daily Solar Outputs (kWh/kWp)Energy Charge during Daytime (AUD)Represent Percentages of Days in a Year
1Warm days29.174.40297.7629.8%
2Mild days28.735.76289.6217.1%
3Cool days23.393.24193.7753.2%
Table 9. Typical days for temperate climate—community 10.
No.RepresentingMax Daily Temperature (°C)Daily Solar Outputs (kWh/kWp)Energy Charge during Daytime (AUD)Represent Percentages of Days in a Year
1Warm days29.845.29208.8822.5%
2Warm days29.544.18214.2014.5%
3Mild days22.943.09160.9035.9%
4Cool days19.172.48189.9427.2%
Table 10. Clustering accuracy evaluation.
No.Community1
(Tropical)
5
(Subtropical)
10
(Temperate)
Daytime Energy chargesBased on whole data set (2019)AUD 137,350AUD 87,985AUD 68,358
Based on typical daysAUD 137,790AUD 87,324AUD 68,371
Differences0.32%0.75%0.02%
Table 11. Percentages of PV generation meeting energy needs.
Community No.12345678910
CommunityCNSTSVMRDPJHSBHPKSLOGIPSTWBSYD
Climate zonesTropical
(Zone: 1)
Subtropical
(Zone: 2)
Temperate
(Zone: 5 and 6)
Optimal return PV rating kWp 550425250375350250250475175200
Equivalent to PV kWp/bed4.24.22.73.22.52.74.25.02.21.7
% PV outputs meeting electricity needs65%59%56%48%62%53%51%68%55%46%
Table 12. Percentages of PV system generation meeting demands for 3 kWp/bed.
Community No.12345678910
CommunityCNSTSVMRDPJHSBHPKSLOGIPSTWBSYD
Climate zonesTropical
(Zone: 1)
Subtropical
(Zone: 2)
Temperate
(Zone: 5 and 6)
PV system rating if 3 kWp/bed396306282348426276180282240360
% PV outputs meeting electricity needs47%43%64%48%76%55%37%40%77%83%
Table 13. Percentages of PV system generation meeting demands for 5 kWp/bed.
Community No.12345678910
CommunityCNSTSVMRDPJHSBHPKSLOGIPSTWBSYD
Climate zonesTropical
(Zone: 1)
Subtropical
(Zone: 2)
Temperate
(Zone: 5 and 6)
PV system rating if 5 kWp/bed 660510470580710460300470400600
% PV outputs meeting electricity needs78%71%106%79%127%92%62%67%128%138%
Table 14. Comparison of renewables policies for Australian aged care communities.
Policy
Allowance
Statistics
(2020)
Total PV
Potential
Yearly
Energy Generation 1
Yearly
Emission
Reduction 2
Yearly
Bill
Savings 3
100 kWp per community2722 communities272,200 kWp397.4 GWh269,445 tonAUD 39.7 mil
3 kWp/bed189,954 residents569,862 kWp832.0 GWh564,095 tonAUD 83.2 mil
5 kWp/bed189,954 residents949,770 kWp1386.7 GWh940,158 tonAUD 138.7 mil
Notes: 1 Consider on the average 1 kWp PV generates 4 kWh electricity per day across Australia. 1 year has 365 days. 2 In the year of 2021, Australian National Electricity Market’s carbon intensity was 0.678 kg CO2-e/kWh [44]. 3 Consider 1 kWh electricity has a value of AUD 0.10 through a combination of offsetting local energy consumption and earning feed in tariff by exporting electricity to the grid.
Publisher’s Note: MDPI stays neutral with regard to jurisdictional claims in published maps and institutional affiliations.

