1. Introduction
The main priority for reducing earthquake damage depends on the reliable determination of the seismic hazard. Risk is the combination of the probability or frequency of a defined threat and the magnitude of the consequences of the occurrence. In other words, the level of risk is proportional to the hazard’s intensity (or magnitude) and the vulnerability of the affected elements [
1,
2]. After each earthquake, significant loss and damage to life and properties emphasize the necessity to demonstrate the seismic hazard reliably. Therefore, determining the seismic risk of any region is an integral part of modern pre-earthquake disaster management [
3,
4,
5,
6,
7]. This is also important for the seismic sensitivity assessment and retrofit decision making of structures [
8,
9].
The assessment of seismic risk is recognized as an early and emerging new discipline that was introduced as a logical continuation of seismic hazard research that Luis Esteva (1967, 1968) [
10,
11] and Allin Cornell [
12] carried out. As stated in an elementary definition of this discipline, outlined by the EERI Committee on Seismic Risk in 1984, “seismic risk is the probability that social and economic consequences of earthquakes will equal or exceed specified values at a site, at various sites or in an area during a specified exposure time” [
13]. Opinions in the literature on initial earthquake risk assessment differ greatly. For example, Luis Esteva (1967, 1968) and Allin Cornell (1968) were the first to initiate seismic risk analysis in 1968. On the other hand, Whitman et al. pointed to several previous assessments of earthquake loss estimations, such as the NOAA1 study for San Francisco [
14], and state that earthquake loss studies follow this for more than thirty US regions [
15]. On the other hand, long before these studies, John Freeman’s Earthquake Damage and Earthquake Insurance [
16], accepted as an earthquake damage prediction today, was published [
17]. Afterwards, earthquake damage prediction was mostly regarded as part of the insurance sector until the publication of Cornell’s work in 1968 [
2]. After that, seismic hazard and risk analyses for different parts of the world were out using different methods, such as the Philippines [
18], Bangladesh [
19], Iran [
20], Korean Peninsula [
21], Pakistan [
22,
23], Croatia [
5,
24,
25], Brazil [
26], Italy [
27], Argentina [
28], Bosnia-Herzegovina [
29], Malaysia and Singapore [
30] and Turkey [
31,
32]. In addition, Turkey has smaller-scale studies for different provinces in the Eastern Anatolia region, such as Bingöl [
33] and Van [
34,
35,
36].
Seismicity is based on geological, tectonic and statistical data. Macro seismic data regarding the earthquake origin time, location, epicenter, source parameters and magnitude are the most important parameters in determining the seismic hazard of any region. Furthermore, the seismicity of a region is an indicator of a future earthquake in that region [
37,
38,
39]. Therefore, the data from destructive earthquakes significantly contribute to determining seismic hazard zones more realistically and developing fundamental principles for the design of earthquake-resistant structures. Thus, Turkey’s demand for renewal in seismic hazard maps and principles for designing earthquake-resistant structures, especially after the 2011 Van earthquakes, emerged. Thanks to the studies performed, both seismic hazard maps and seismic design codes were updated in 2018 and started to be used in 2019 [
31,
40,
41,
42].
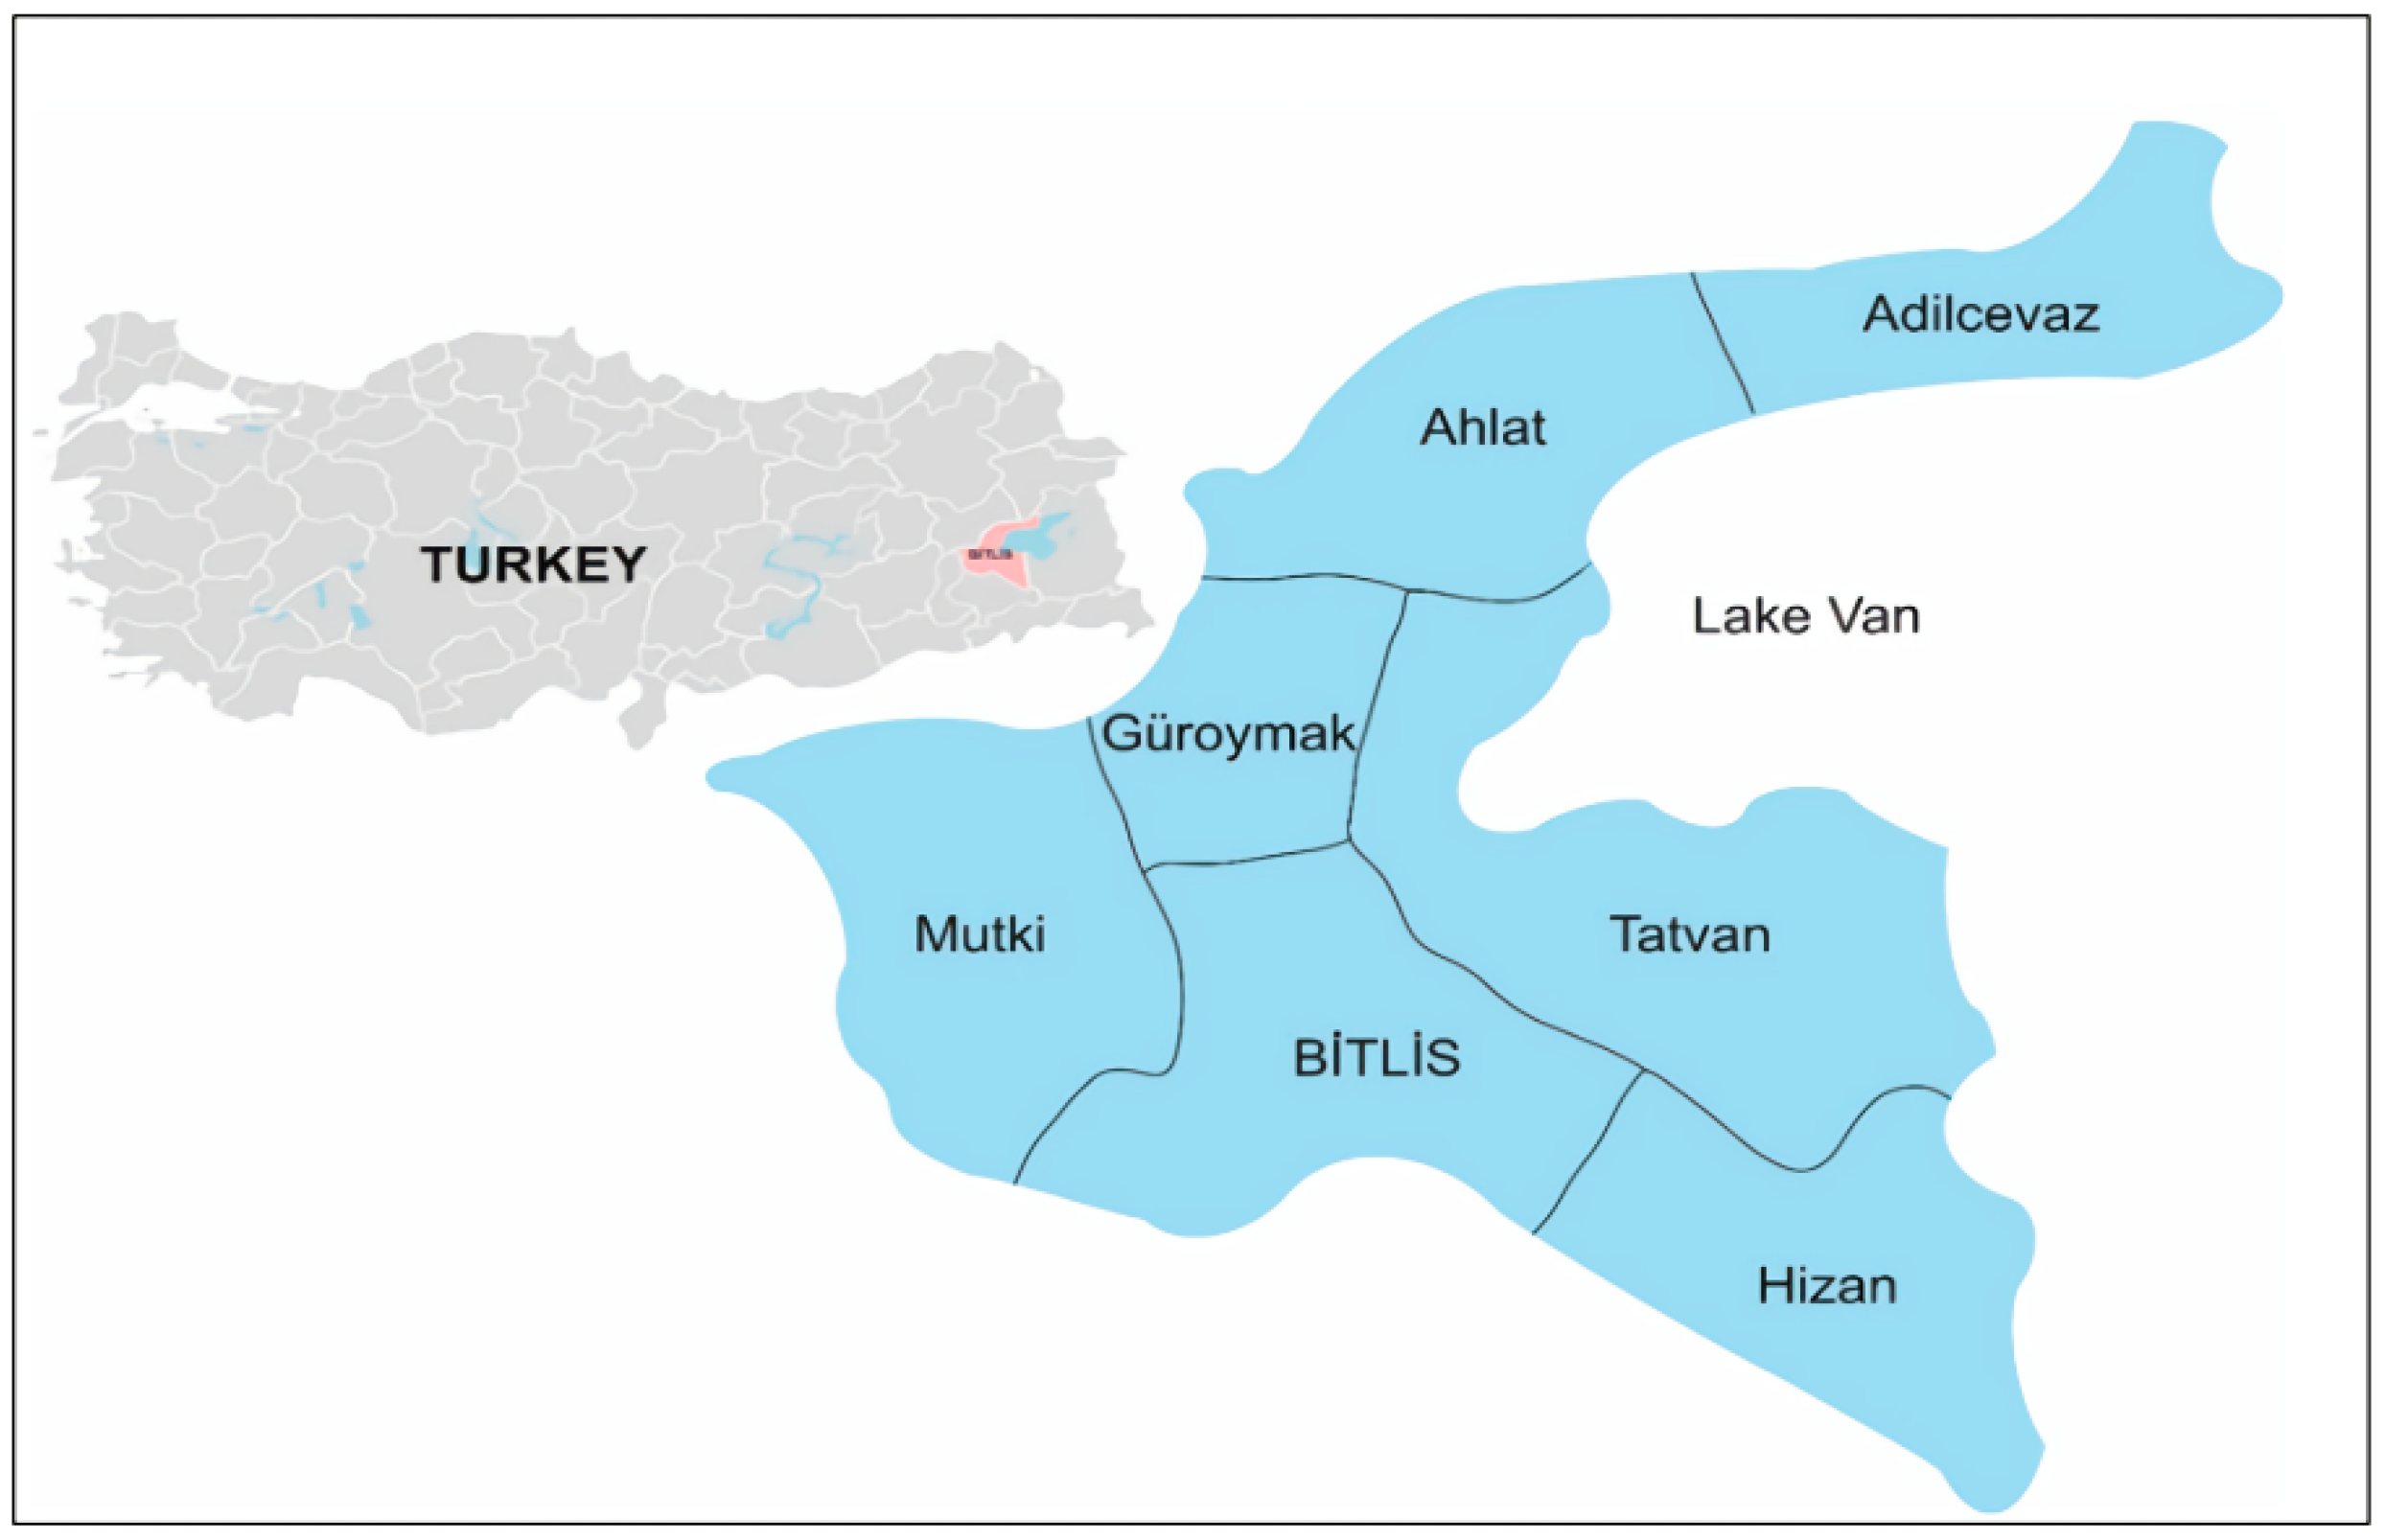
In this study, Bitlis province was selected as it is located in Lake Van Basin in Eastern Turkey. Lake Van Basin is one of Turkey’s current and intensive seismic activity regions. Specifically, the earthquakes, whose epicenter was Van province located in this basin, and the losses that come after the earthquakes have, once again, revealed the seismic risk of the basin.
Figure 1 displays the districts of the Bitlis province and its geographical location.
Bitlis is a historical city surrounded by mountains, located on the strait passages connecting Eastern Anatolia to South-Eastern Anatolia, located between 41°33′–43° and 37°54′–38°58′. Bitlis is in a position worth examining due to the seismicity in Bitlis and especially its close surroundings and the earthquakes that occurred in the past. This study conducted a probabilistic seismic hazard analysis for Bitlis province, considering the seismic sources and attenuation relationships. The results are compared to the design spectra in the last two seismic design codes. In addition, structural analyses were performed by using the mean design spectrum obtained from the used attenuation relationships and the last two design spectra. The study is important regarding the site-specific seismic hazard analysis and comparing the last two earthquake hazard values for Bitlis. Furthermore, different design spectra were tried to reveal at what level the earthquake hazard changes affect the building performance. Therefore, in light of current data and studies, the region’s seismicity, the earthquake hazard and their behaviour under the effect of earthquakes should be reviewed.
2. Tectonics and Seismicity of Bitlis
It is a known fact that local geological soil conditions directly affect and alter seismic activity characteristics and may damage existing structures on these soils [
43,
44]. In the center of Bitlis and its vicinity, the metamorphic rocks of Bitlis massif, upper cretaceous mélange in the Ahlat-Adilcevaz area, Eocene aged Ahlat conglomerate, Miocene aged Adilcevaz Limestone, polio-quaternary volcanism and alluvium outcrop are present. Rock assemblages are in the Van Lake Basin formed in the Paleozoic Era–present time period and alluvial sediment outcrop. Generally, the metamorphic rocks of the Bitlik Massif in are the south of the basin, volcanic and volcanoclastic rocks that are products of young Nemrut and Süphan are in the west and north areas, volcanic rocks and ophiolite components of the Yüksekova Complex are in the east of the basin, young-present streams and lacustrine sediments and carbonates outcrop [
45,
46,
47,
48,
49,
50,
51]. The Bitlis Massif contains ophiolites of the old ocean floor and rock assemblages containing different metamorphic facies [
52].
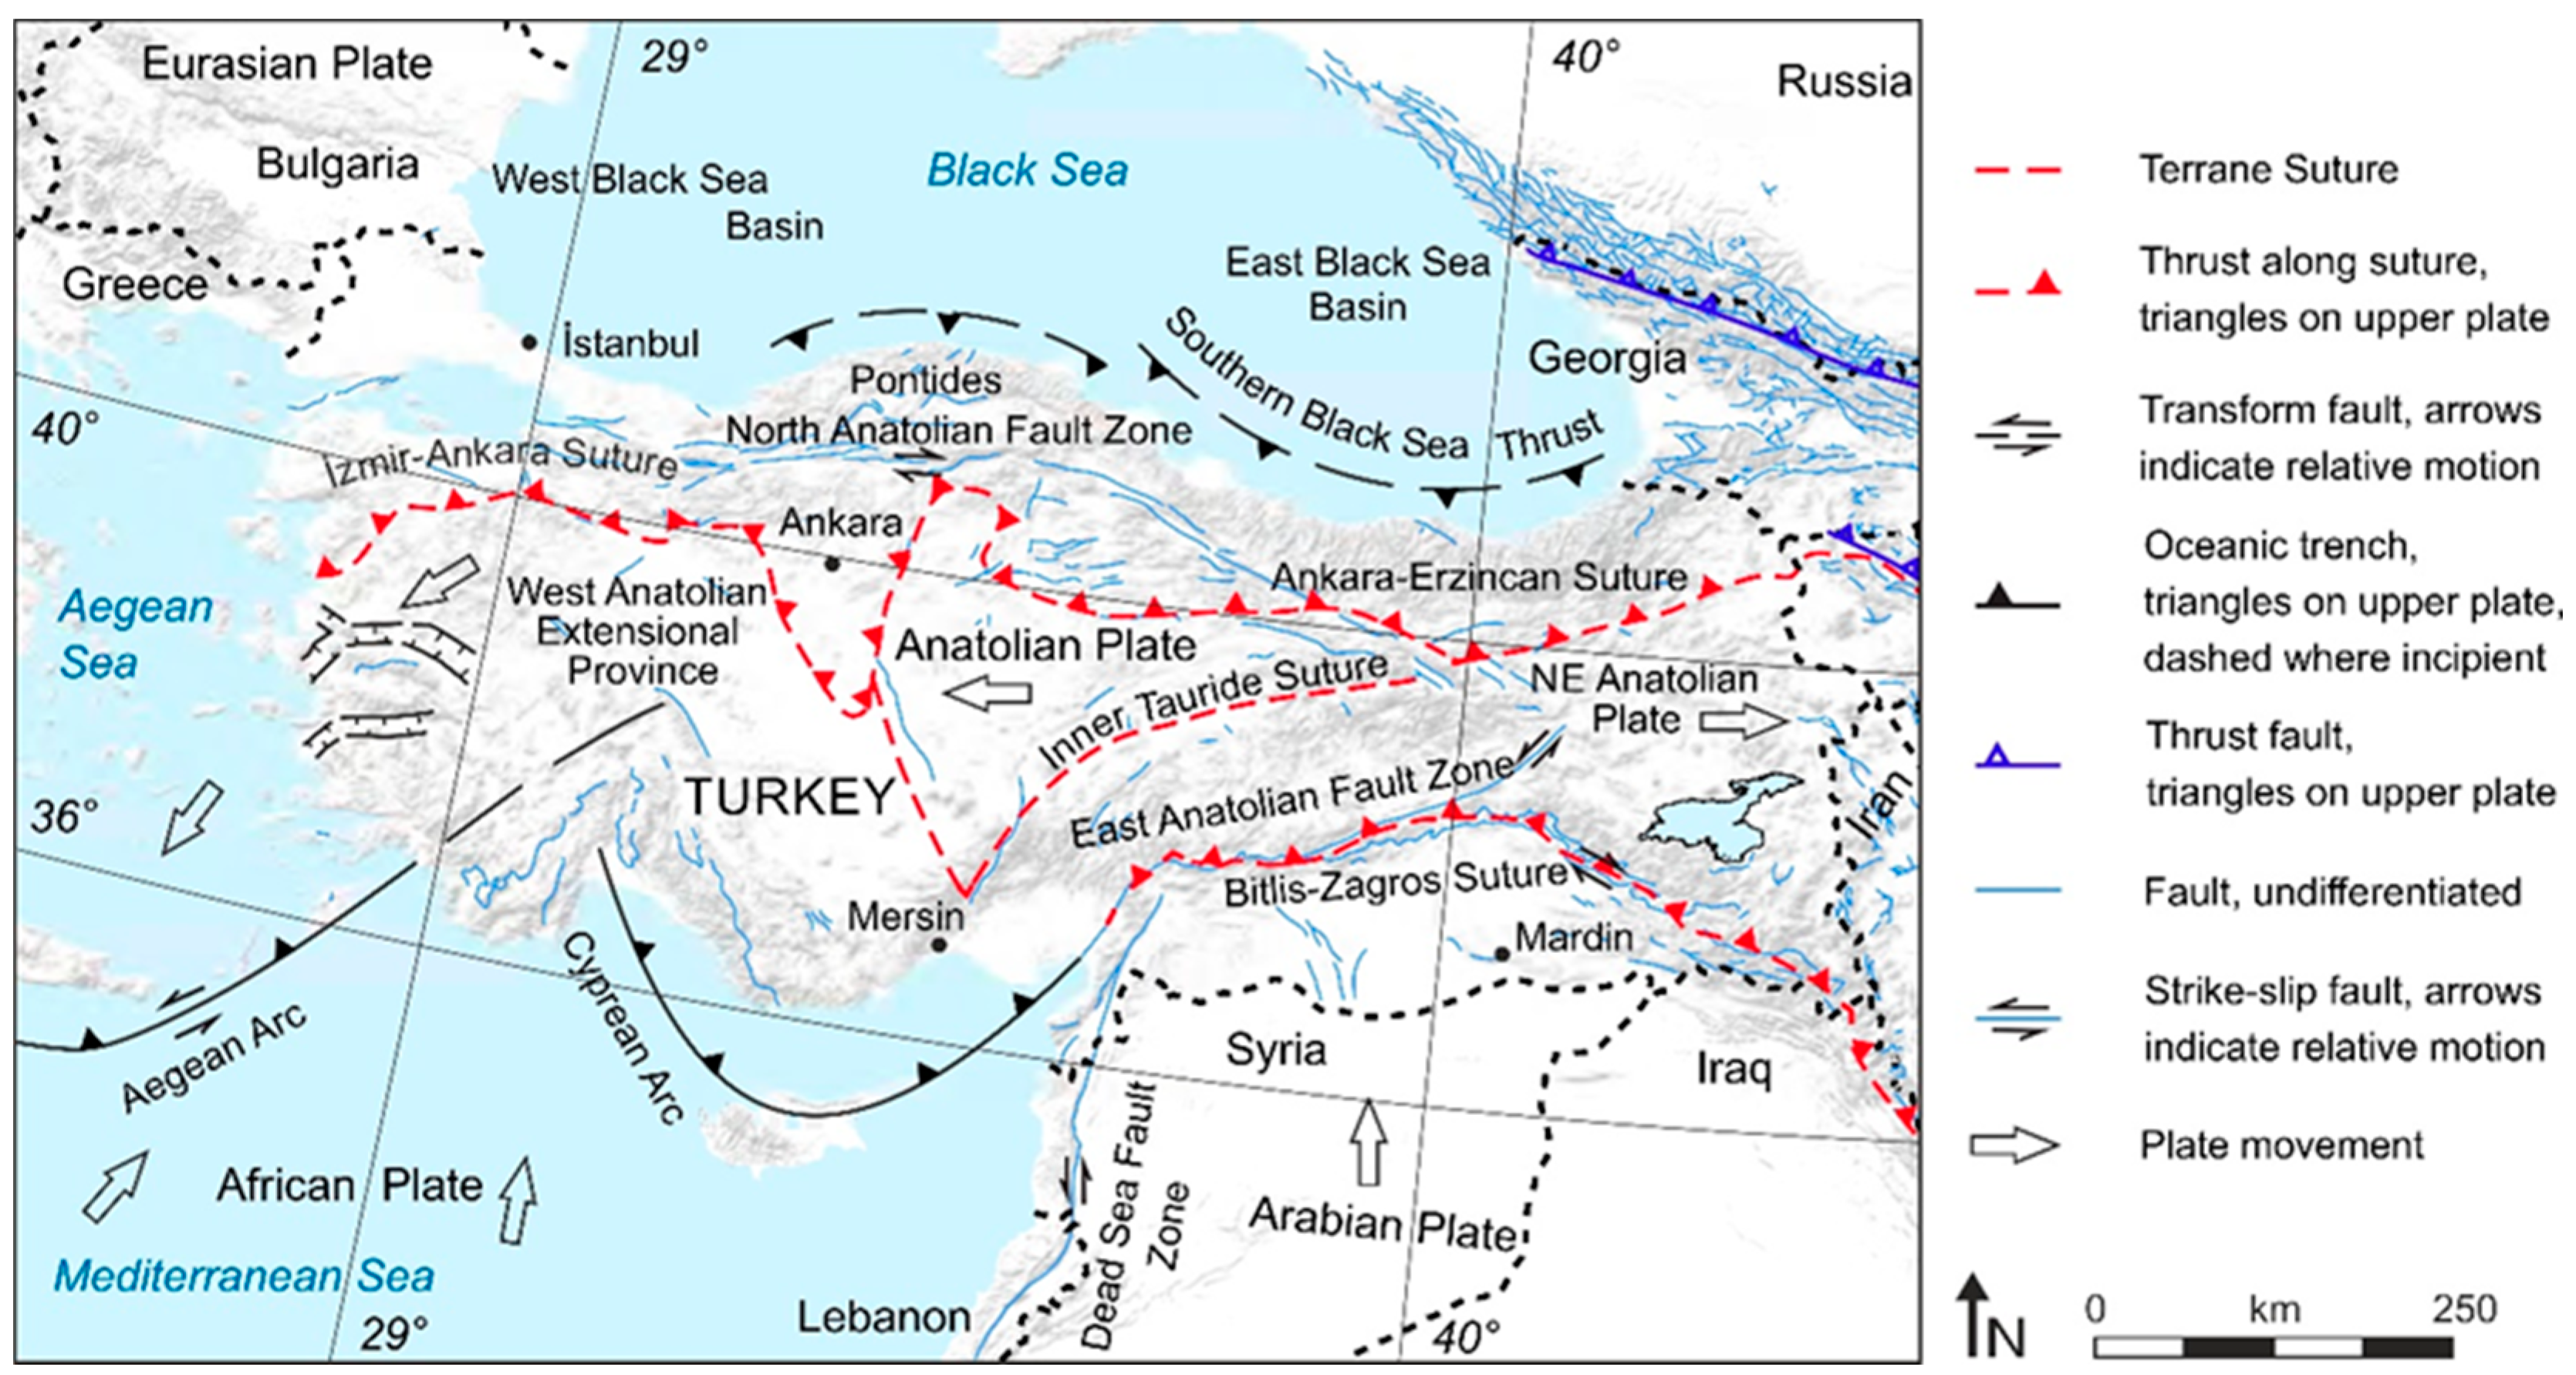
The Eastern Anatolia Region, located on the Alpine-Himalayan seismic belt, one of the most important seismic belts in the world, is seismically active. This area where these two faults in the nature of intra-continental transform faults limit the Anatolian plate and cross fault systems developed among them are a region with the highest density of active faults in Turkey. Eastern Anatolia is under continental shortening and thickening effects due to the continental collision between the Arabian and Eurasian plates [
53,
54,
55,
56,
57]. In addition, the volcanism in the region was developed by this collision [
49,
58]. This active continental collision forces the Anatolian Plate to move counterclockwise to the west, along the North Anatolian Fault Zone (NAFZ) and East Anatolian Fault Zone (EAFZ), two major strike-slip fault zones (
Figure 2) [
59,
60]. Sinistral-slip NAFZ and dextral-slip EAFZ join the Karliova Triple Junction (KTJ) located in Eastern Anatolia [
61]. Many fault lines in Turkey have developed due to this active continental collision [
59,
62,
63,
64,
65,
66]. Both Bitlis-Zagros Suture Belt and Karliova Triple Junction are close to Bitlis province.
Lake Van, which is a product of the tectonic pressure led by the collision of the Arabian and Eurasian Plates [
59,
67,
68] and partially remained in the province of Bitlis, is in a tectonic structure that has undergone intense deformation in Eastern Anatolia [
69,
70]. With its volume of 607 km
3 and a maximum depth of 451 m, Lake Van is the fourth largest lake in the world among inland lakes in terms of water content, after the Caspian Sea, the Aral Sea and Lake Issyk-Kul [
71]. Therefore, earthquake activity is very high around Lake Van [
72,
73]. In addition, a major and destructive earthquake that may occur in the Lake Van Basin can closely affect the Bitlis city center and districts in this basin.
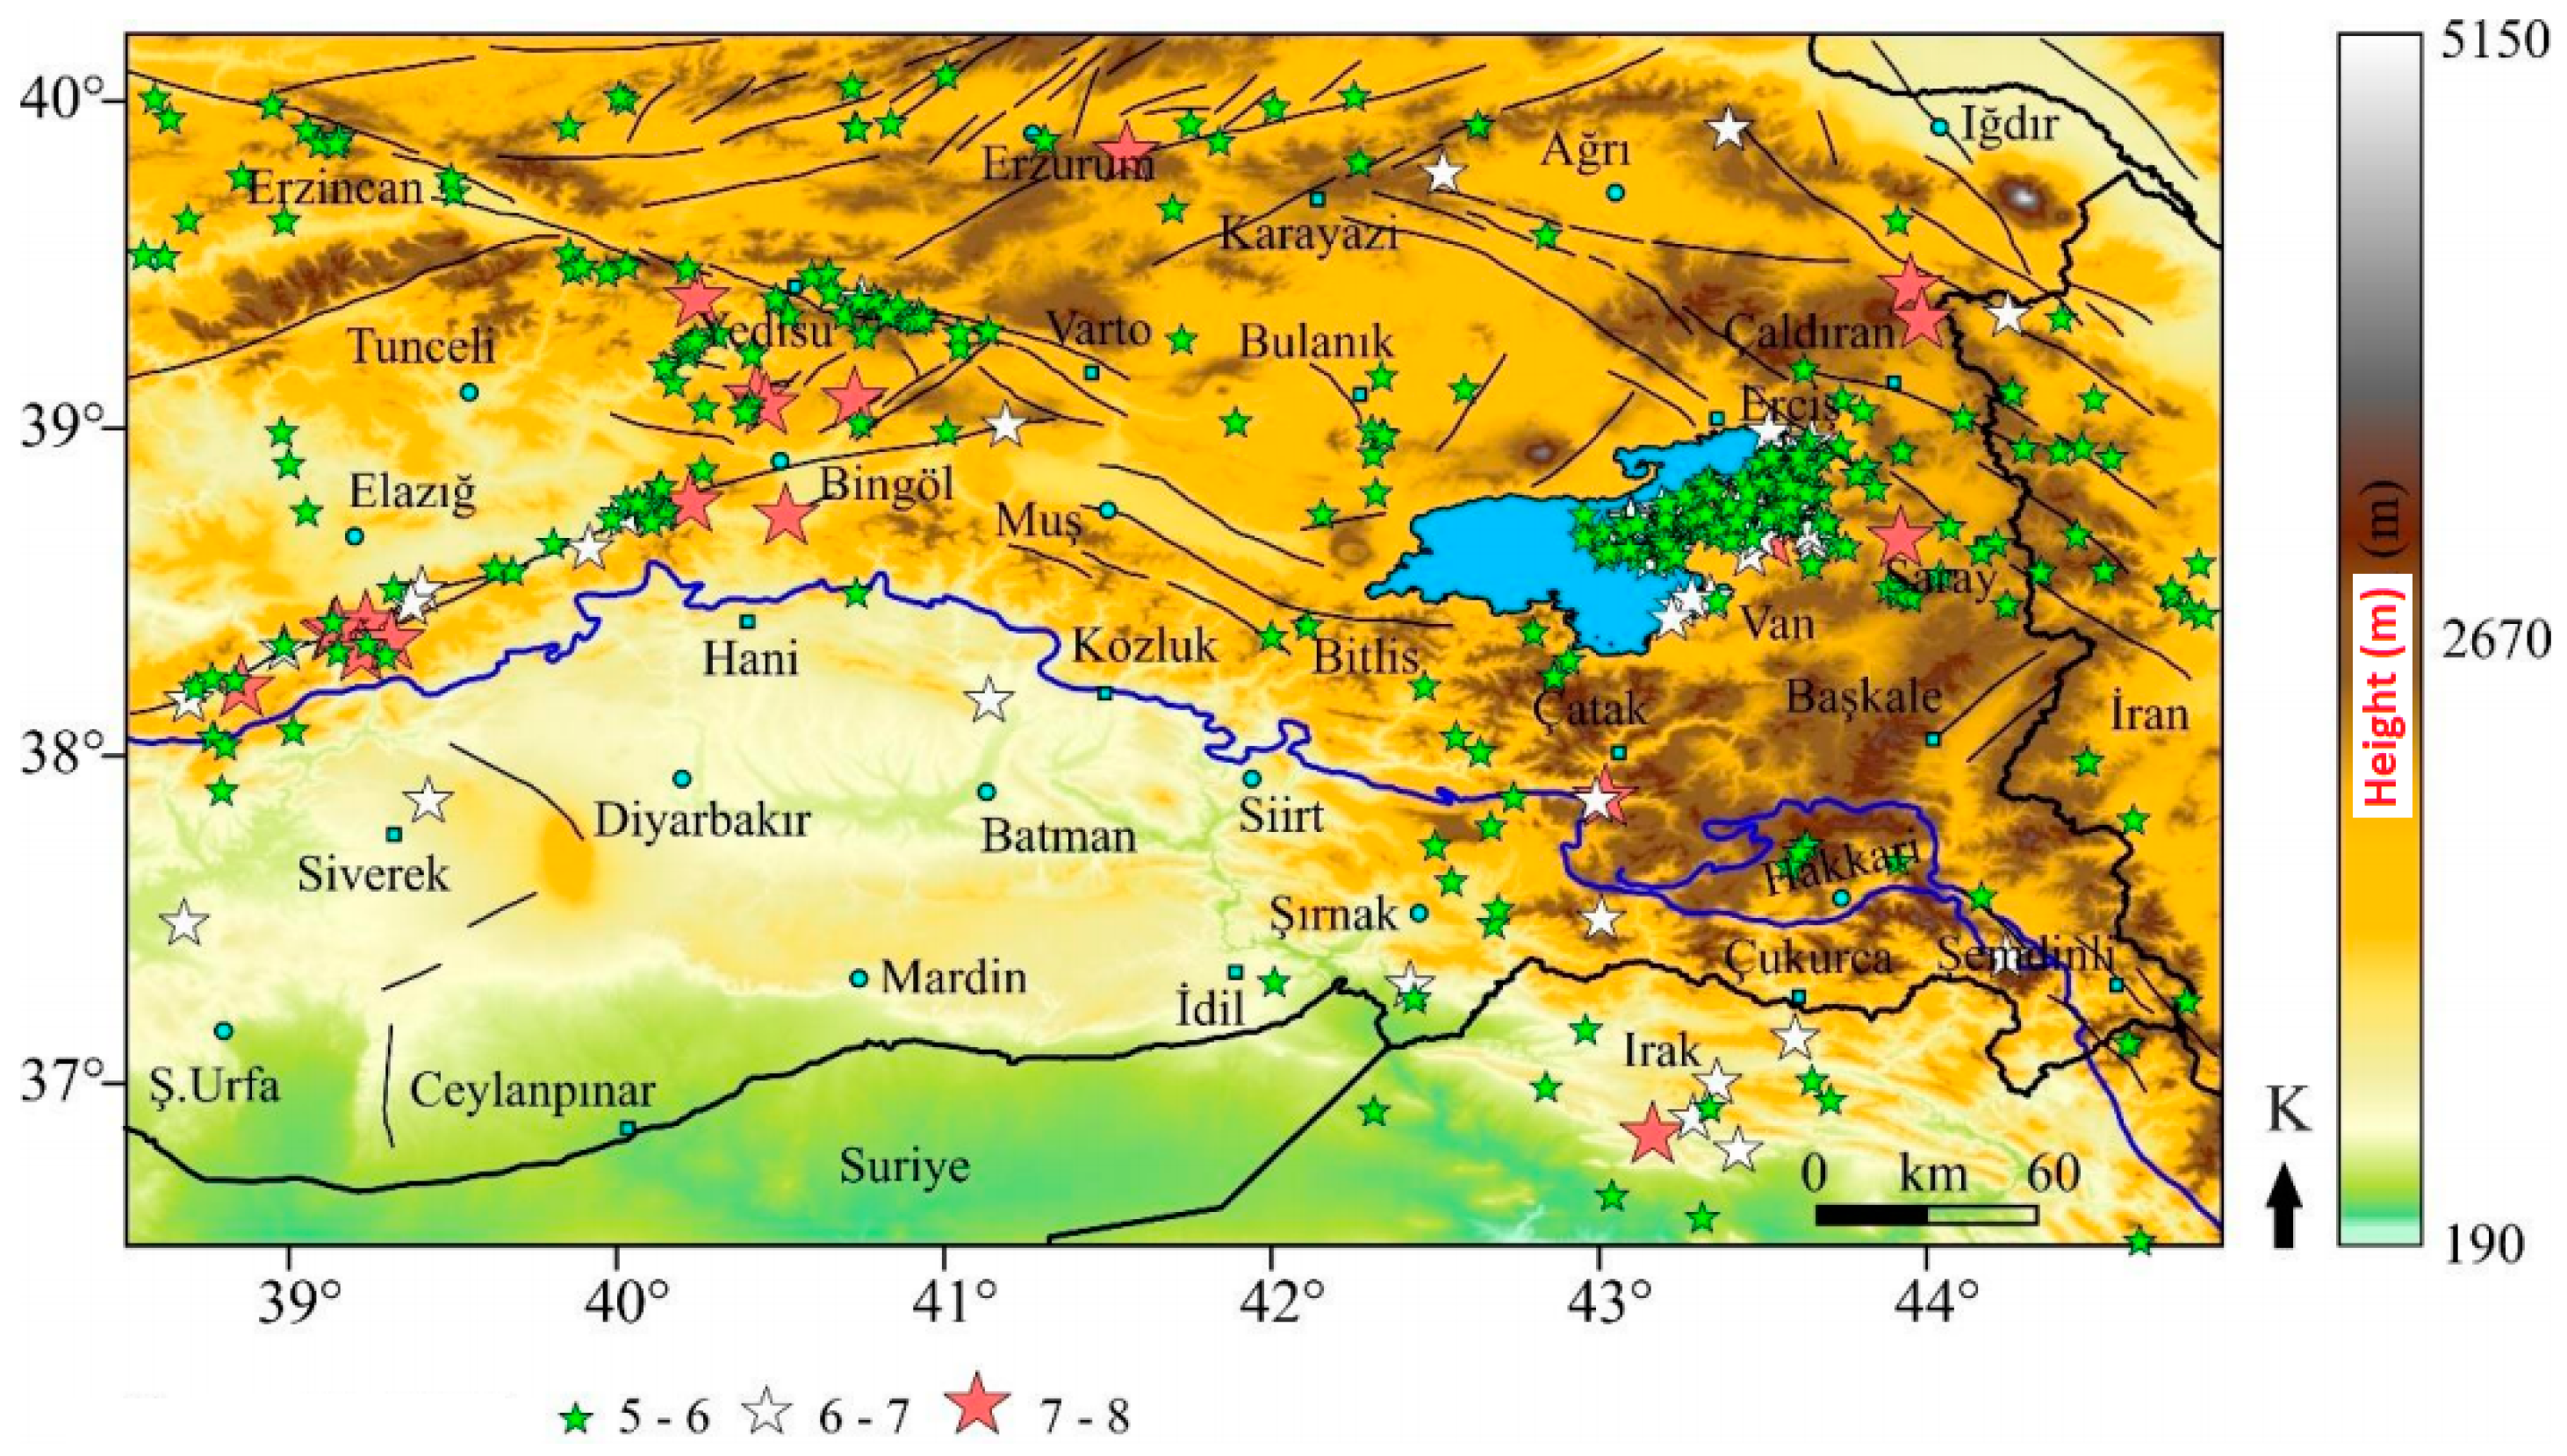
Table 1 shows some major and destructive earthquakes around Bitlis in the instrumental period. The M ≥ 5.0 earthquakes in and around Bitlis between 1900 and 2017 are shown in
Figure 3.
3. Current Seismic Parameters of Bitlis
The fact that December 27, 1939, Erzincan, December 20, 1942, Niksar–Erbaa, June 20, 1943, Adapazari-Hendek, November 26, 1943, Tosya-Ladik and February 1, 1944, Bolu-Gerede earthquakes occurred at close time intervals and led to huge economic losses and casualties triggered the efforts to reduce earthquake losses in Turkey [
81,
82]. Turkey’s first official earthquake zonation map was prepared in 1945 following these earthquakes [
83,
84]. The historical development in these maps is shown in
Table 2.
In the seismic hazard models used in the creation of the earthquake hazard map published in 1996, the errors resulting from the use of the attenuation relationship obtained from Western US measurements were ignored due to lack of data in the earthquake catalogue, uncertainties in the geographical boundaries of earthquake source faults and lack of local data [
85]. The Seismic Zoning Map of Turkey, which entered into force in 1996, was renewed by the Disaster & Emergency Management Authority, Presidential of Earthquake Department and published in 2018 and became effective as of January 1, 2019. The new map was prepared in cooperation with the public and universities through the project titled Updating Turkey Earthquake Hazard Maps, which was supported by the AFAD National Earthquake Research Programme (UDAP). The new map was prepared with much more detailed data, considering the most up-to-date earthquake source parameters, earthquake catalogues and next-generation mathematical models. Unlike the previous map, the new map includes peak ground acceleration values rather than earthquake zones and the concept was removed [
86,
87,
88].
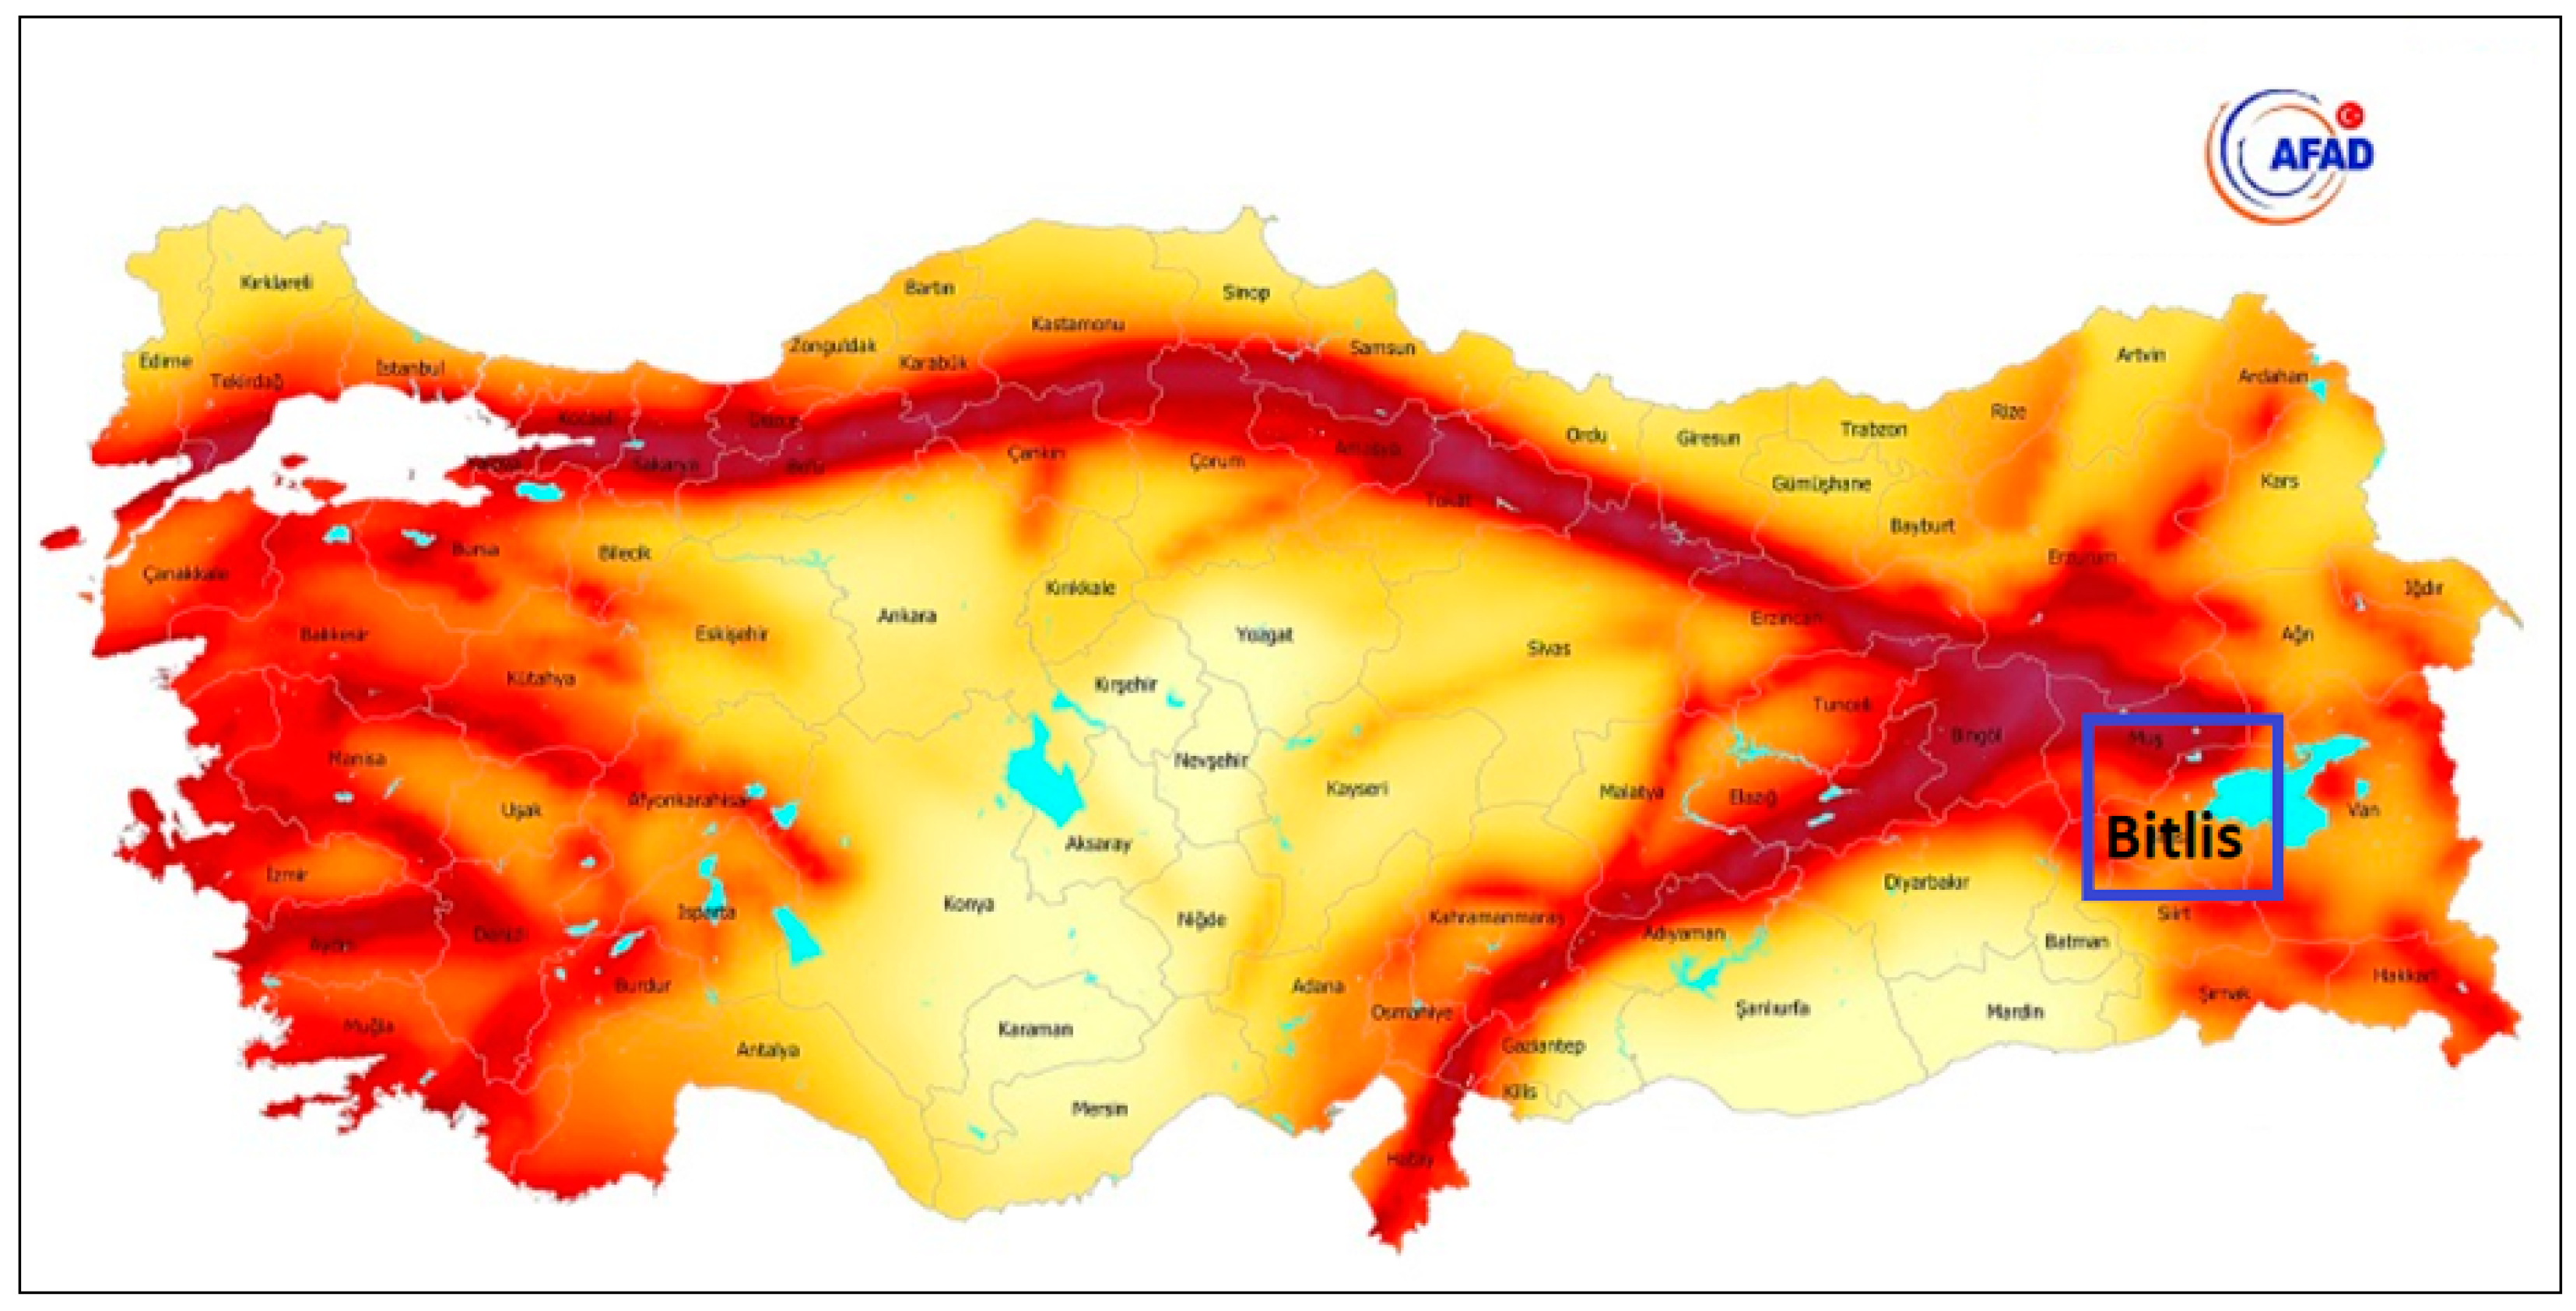
In the studies of determining the source zone forming the basis for creating the earthquake hazard map that entered into force in 2019, a total of 105 seismic sources was identified by taking into account the active fault database of Turkey [
89] and the earthquake catalogue [
90]. The highest earthquake magnitudes of these seismic sources were determined after statistical analysis of instrumental and historical earthquake catalogues. In addition, the ground motion databases of Turkey, Greece, Italy, and California, which have similar seismotectonic structures, were compiled, and a broad, strong ground motion database was created. Moreover, four ground motion prediction equations that best represent this database were used in probabilistic seismic hazard analysis with a different emphasis [
91]. An updated earthquake hazard map of Turkey is given in
Figure 4.
Turkish Earthquake Hazard Maps have started to be used with the Turkish Building Earthquake Code (TBEC-2018). Thanks to these maps, earthquake and earthquake-building parameters of any geographical location can be determined. These values can be obtained practically using the Turkey Earthquake Hazard Maps Interactive Web Application (TEHMIWA). Ground motion levels for four different exceedance probabilities were identified in the TBEC-2018 (
Table 3).
The peak ground acceleration (PGA) and peak ground velocity (PGV) obtained for different probabilities of exceedance of all neighborhoods in Bitlis province are shown in
Table 4.
There are seven districts (Adilcevaz, Ahlat, Güroymak, Hizan, Mutki and Tatvan) in Bitlis province, including the central district. The southern side of the Nemrut volcanic mount in the province of Bitlis is located 10 km from the Tatvan district and about 24 km from Bitlis central district. Mount Süphan, which is approximately 85 km away from Bitlis city center and part of which is located within the boundaries of Adilcevaz district, is the highest mountain of volcanic origin (4058 m) in Turkey after the Mount of Greater Agri (Ararat).
Table 5 compares PGA and PGV values measured by different earthquake ground motion levels for seven districts of Bitlis province.
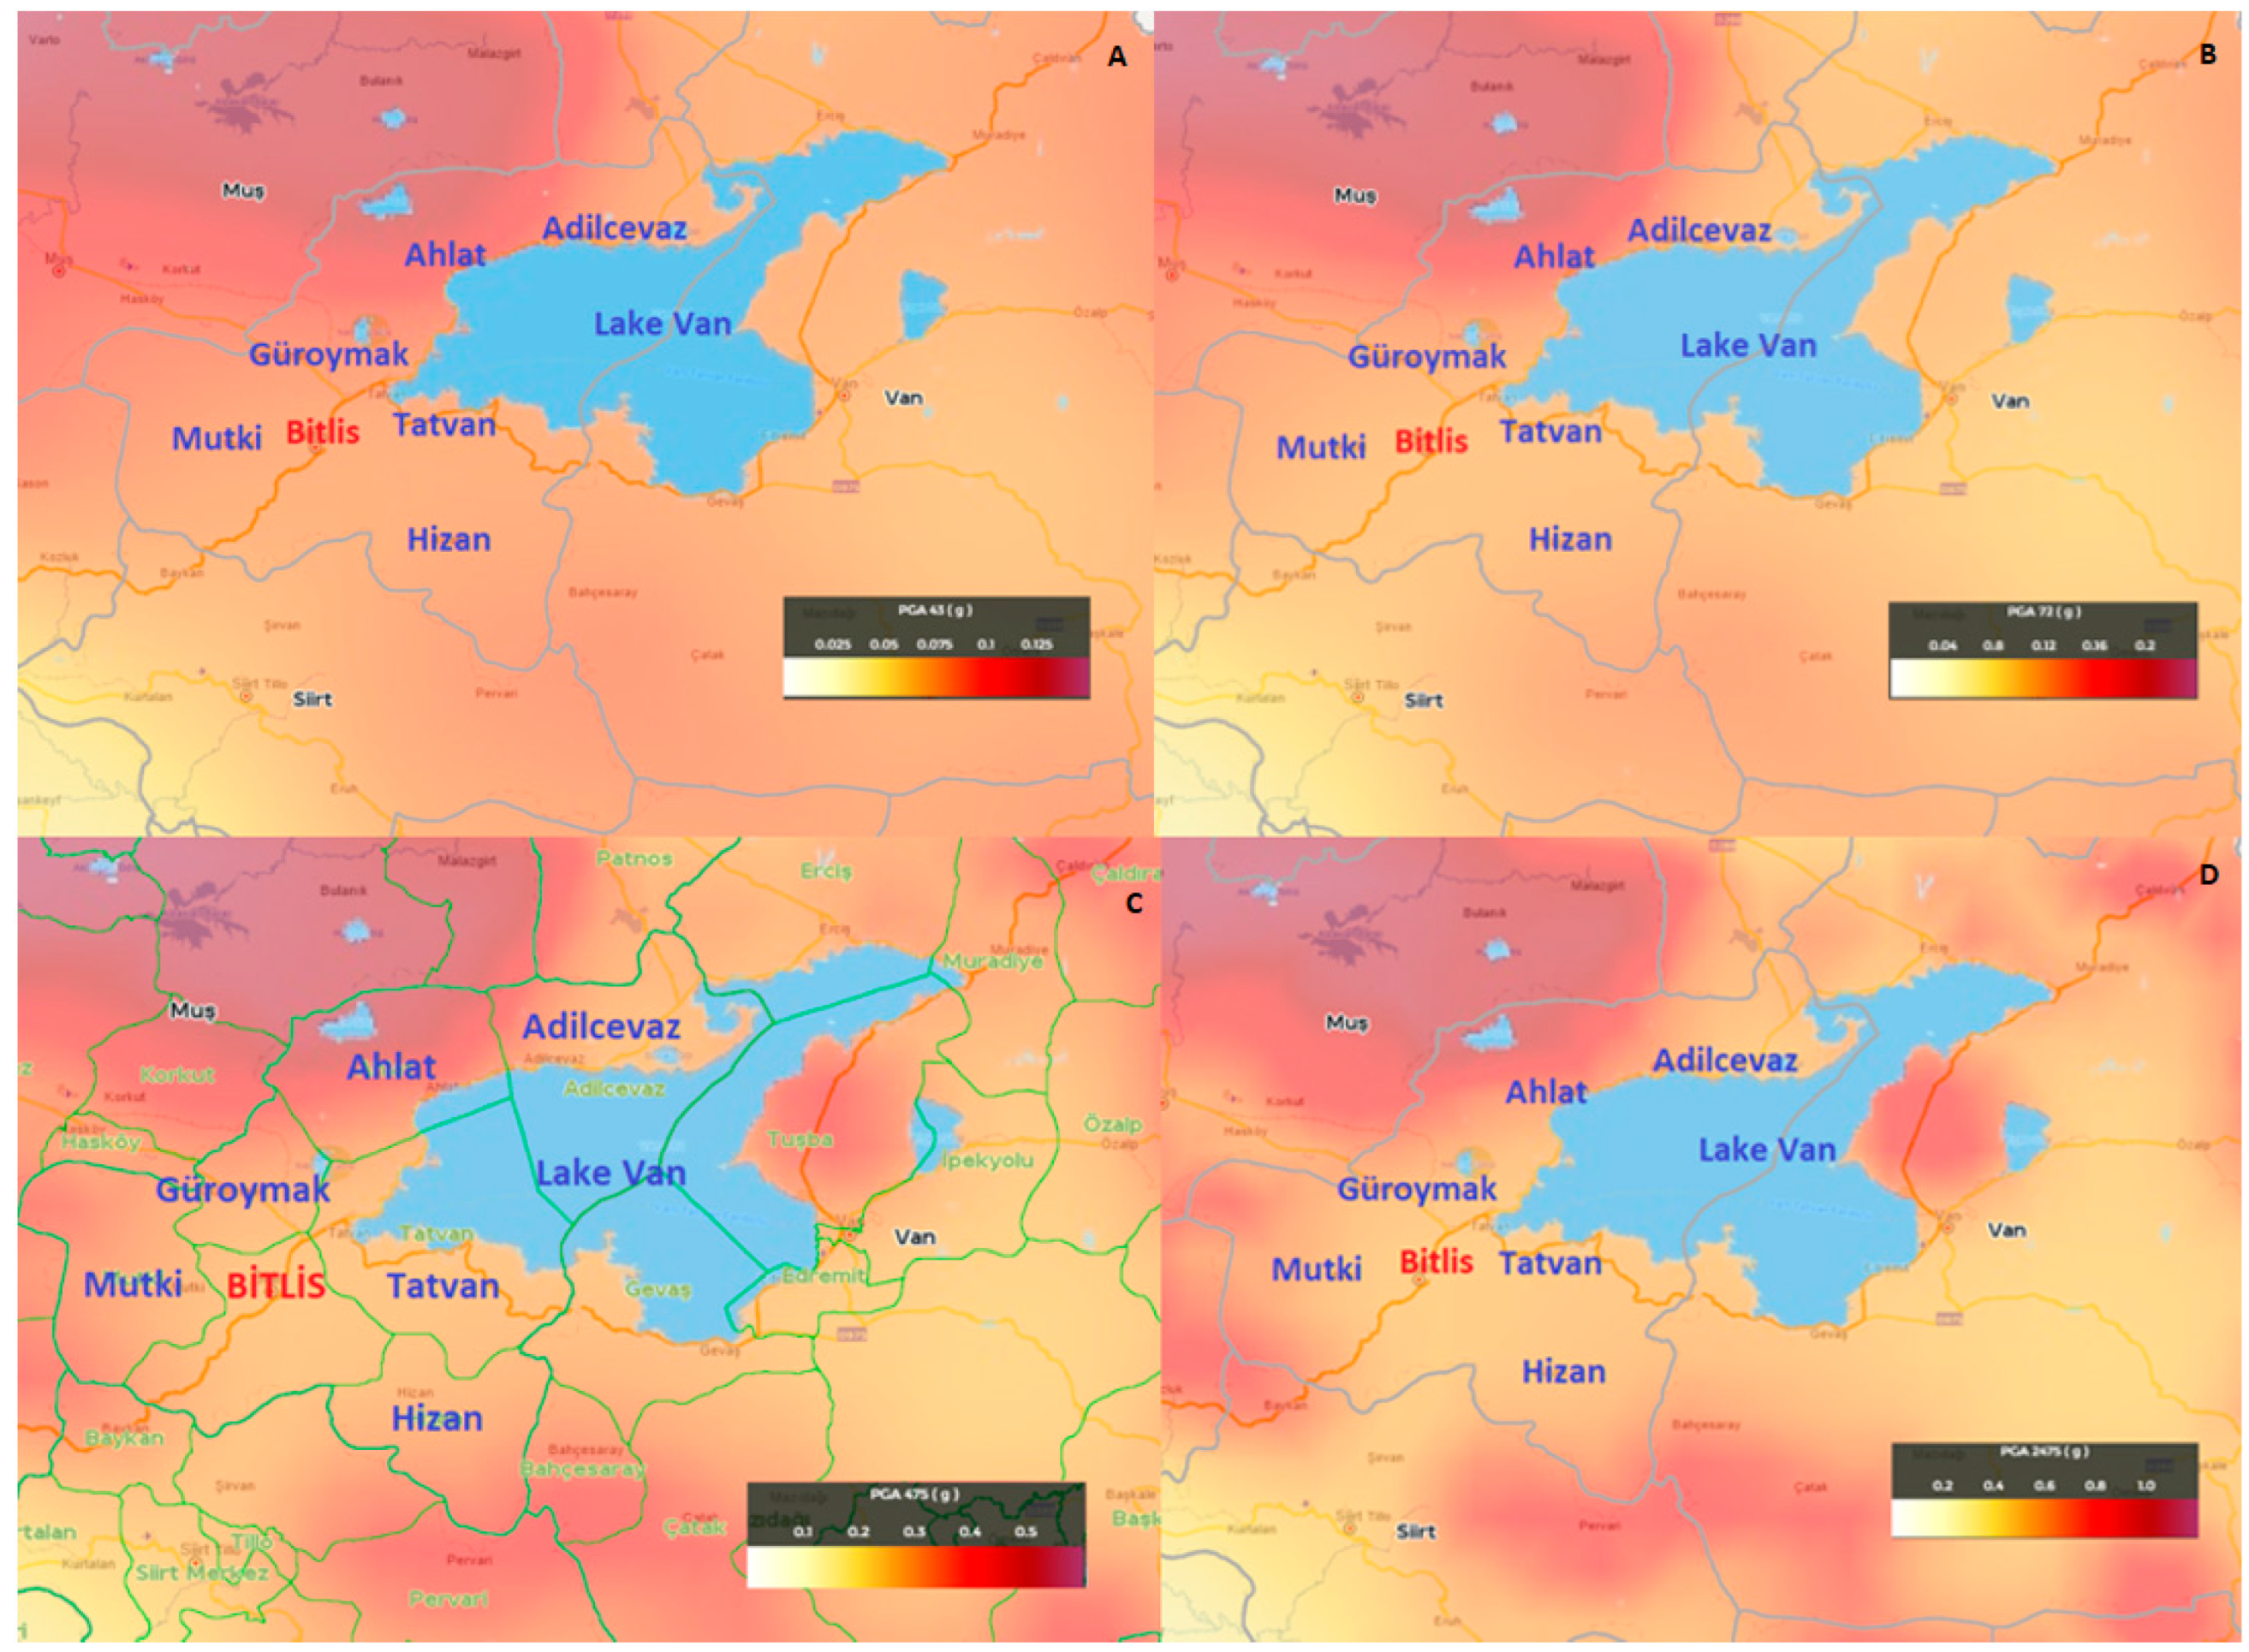
Turkish Earthquake Hazard Map Interactive Web Application (TEHMIWA) has become available for the computation of earthquake parameters used in structural analyses for any geographic location since the beginning of 2019 [
86,
88]. The seismic hazard maps obtained for Bitlis and its districts for the earthquake ground motion level (DD-1) that is a 2% probability of exceedance (repetition period 2475 years) in 50 years is given in
Figure 5A, for 10% is given in
Figure 5B, for 50% is given in
Figure 5C and for 68% is given in
Figure 5D by using TEHMIWA.
In order to make comparisons for design spectra, the ZB class was chosen as the local ground condition from the local soil class given in TBEC-2018. The features of this soil class are given in
Table 6.
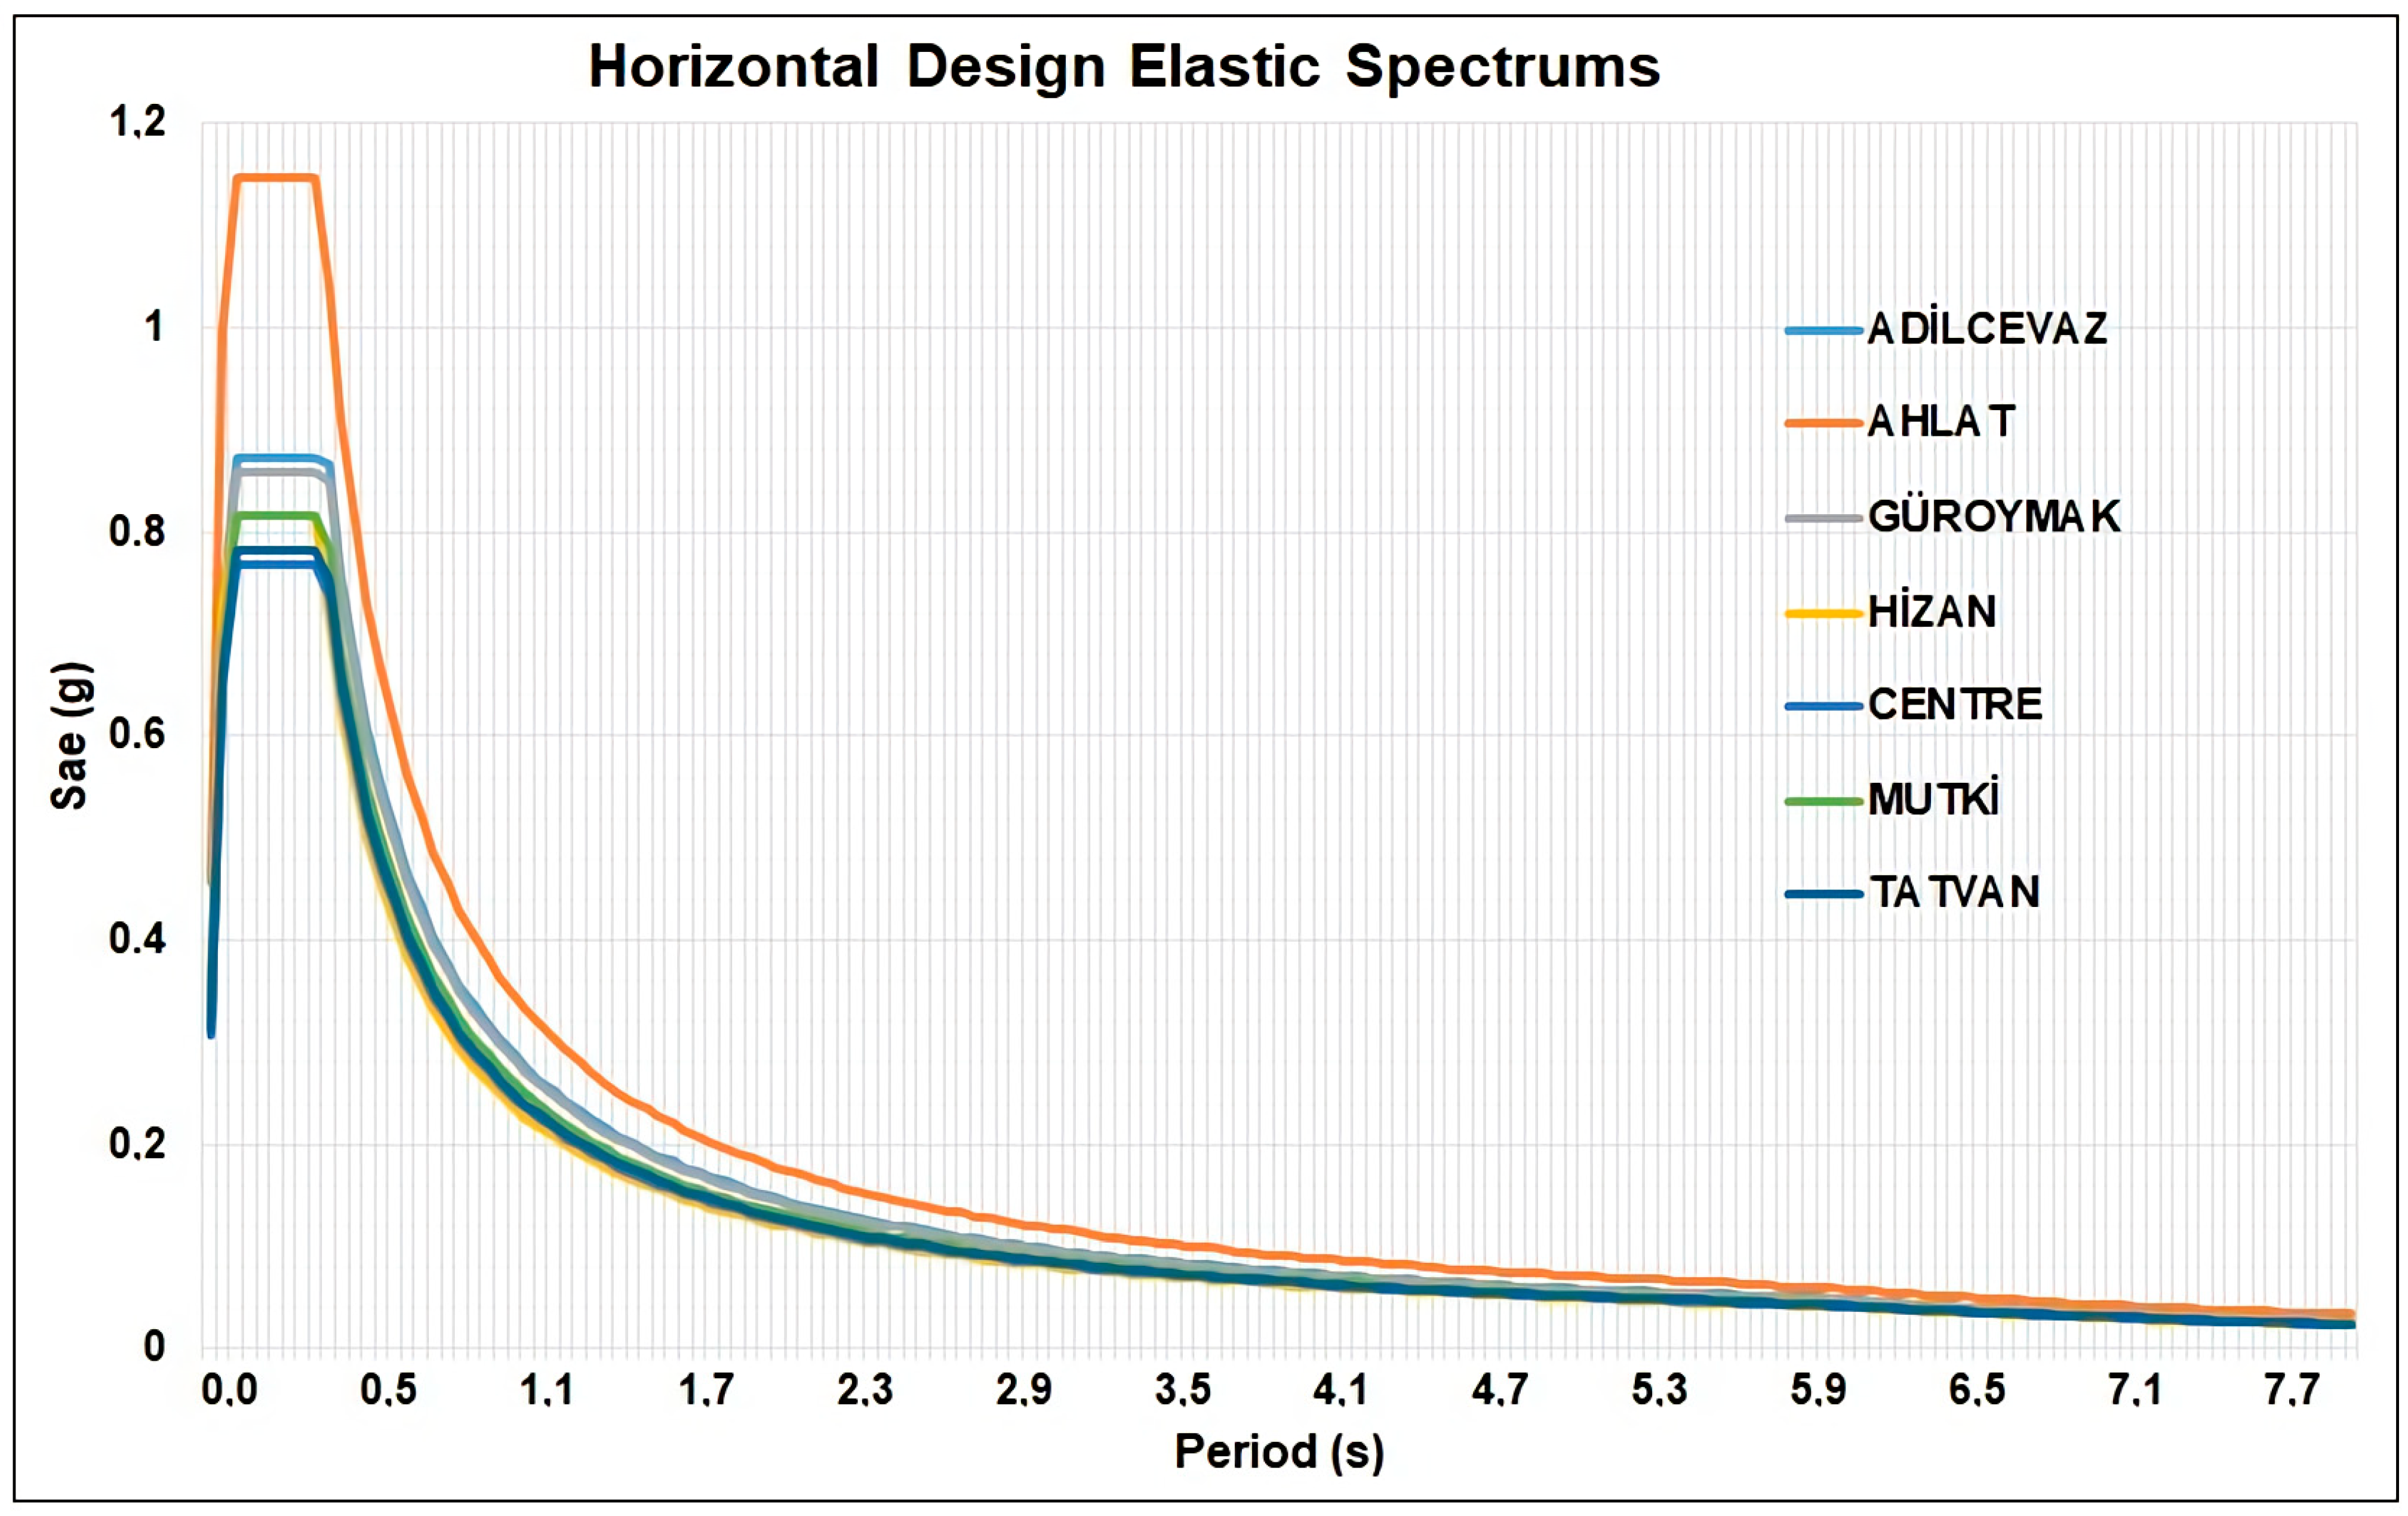
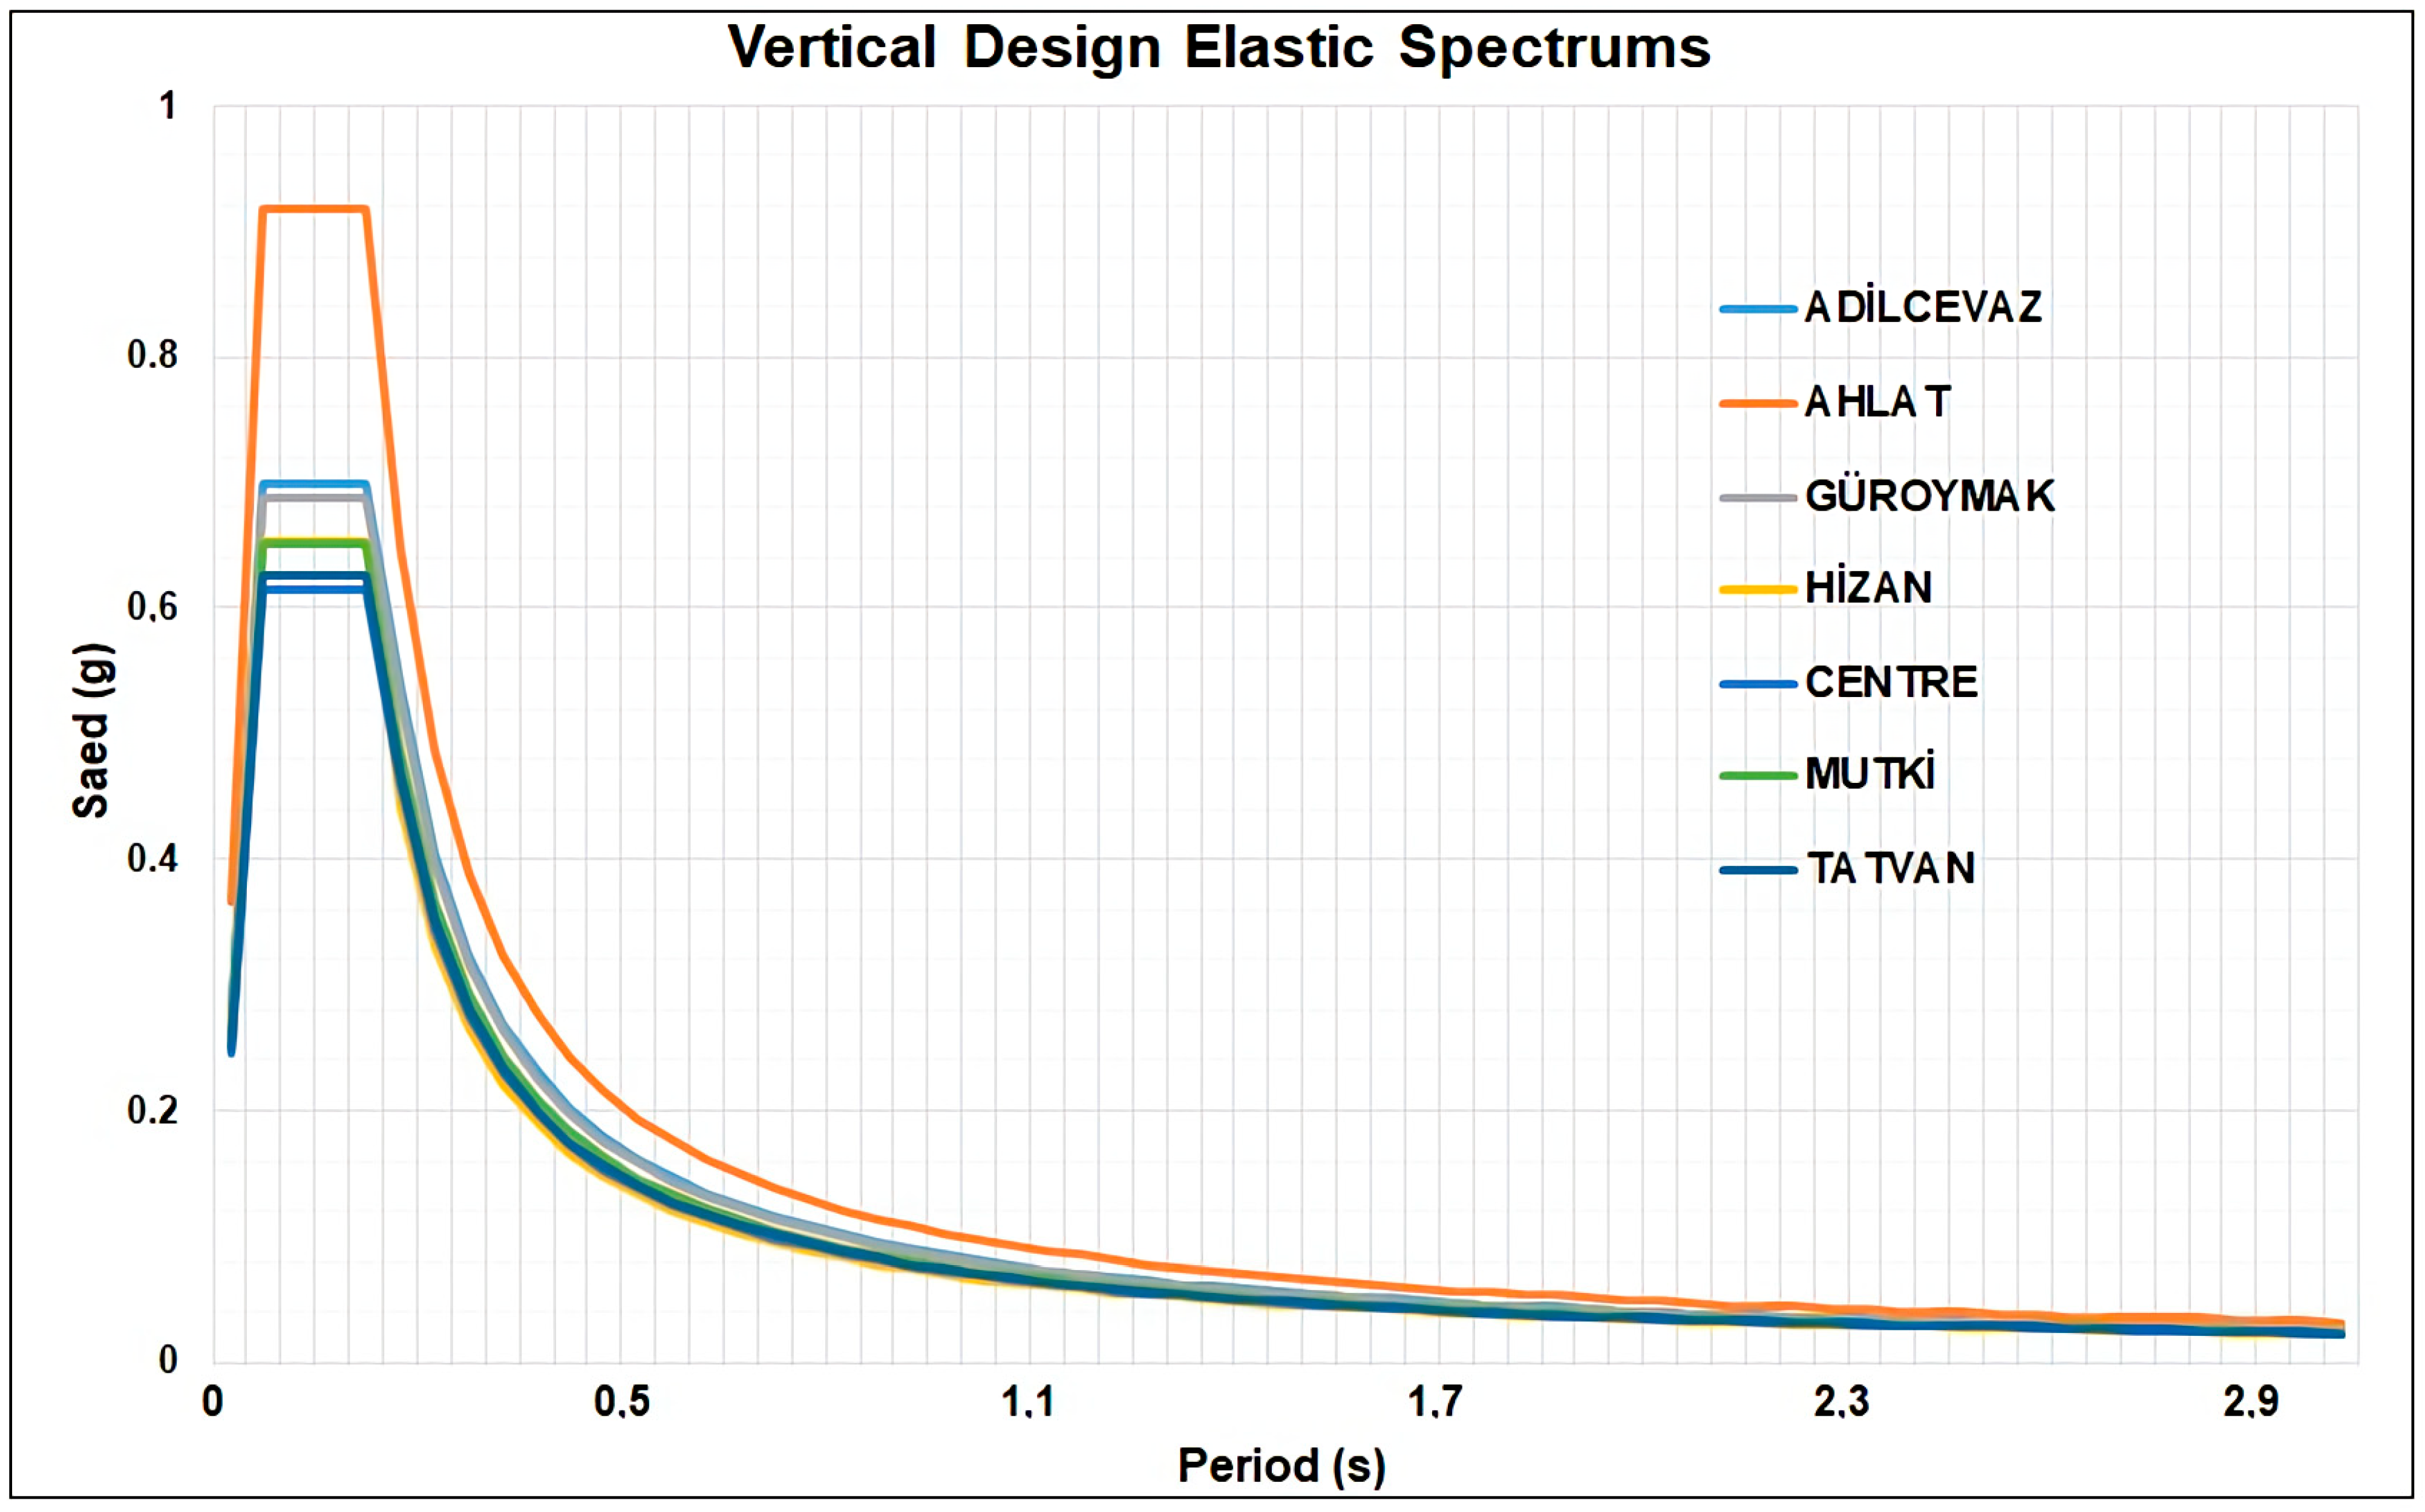
Figure 6 and
Figure 7 compare horizontal and vertical elastic design spectra obtained when the DD-2 ground motion level of Bitlis districts and local soil profile belongs to the ZB soil type. The vertical elastic design spectrum first started to be used with TBEC-2018.
According to TSDC-2007 and TBEC-2018, the spectral acceleration coefficients and dominant ground periods of the design earthquake (DD-2) with a 10% probability of exceedance in 50 years are shown in
Table 7. DD-2 ground motion level was chosen because it is included in the last two seismic design codes.
4. Seismic Hazard Analyses
The threat posed by earthquakes on human activities in many parts of the world is a sufficient reason for carefully considering earthquakes in design structures and facilities. Seismic hazard analysis is the first step in earthquake risk assessment. Seismic hazard analysis involves quantitatively estimating ground-shaking hazards in a particular area. The main purpose of the seismic hazard analysis is to measure the parameters related to seismic ground motion (acceleration, velocity, displacement) for calculating the seismic loading conditions that the ground and engineering structures will be exposed to in the future [
92,
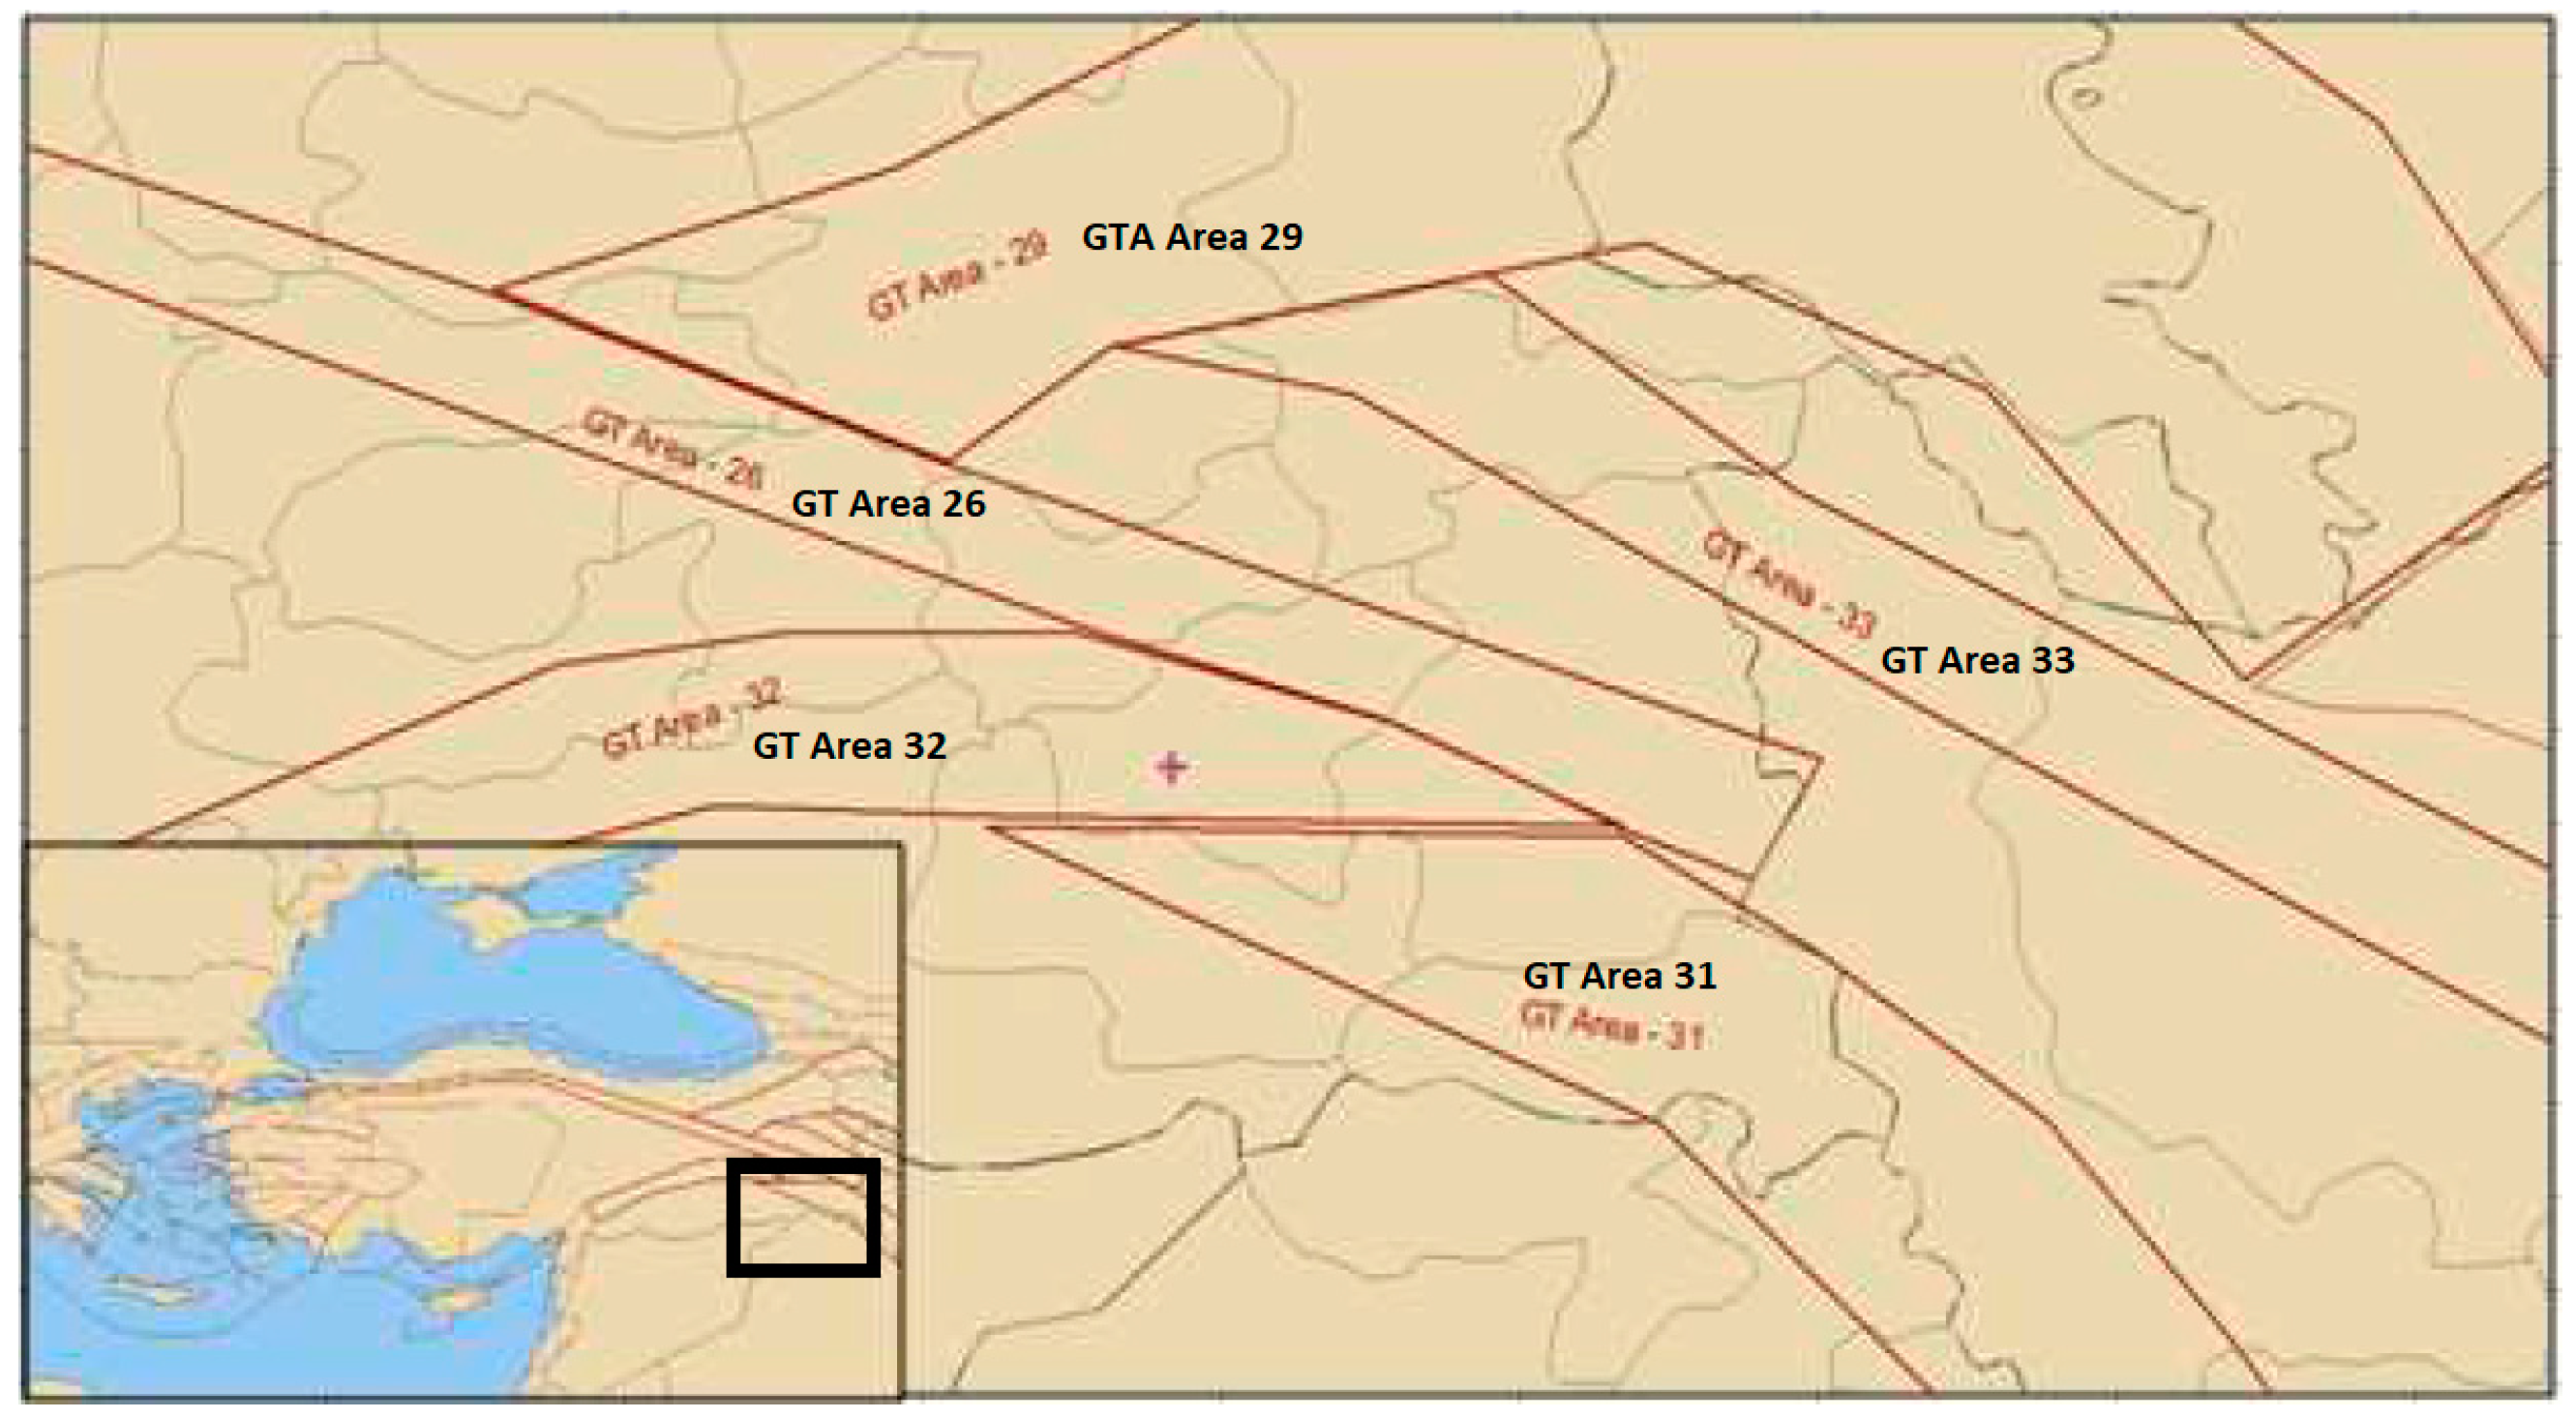
93]. In this study, Probabilistic Seismic Hazard Analysis (PSHA) for Bitlis city center was made using EZ-FRISK v7.43 software developed by Robin McGuire. In the calculations, two data sets were used to select earthquake sources. First, a study was conducted by considering regional data in the EZ-FRISK program database valid for Greece, Turkey, Lebanon, Syria and Israel. In this context, the areal earthquake sources of GT Area 26 (North Anatolian Fault), GT Area 31 (Bitlis Thrust Belt-East), GT Area 32 (Bitlis Thrust Belt-West) and GT Area 33 (Van-North) were taken into account in the analysis (
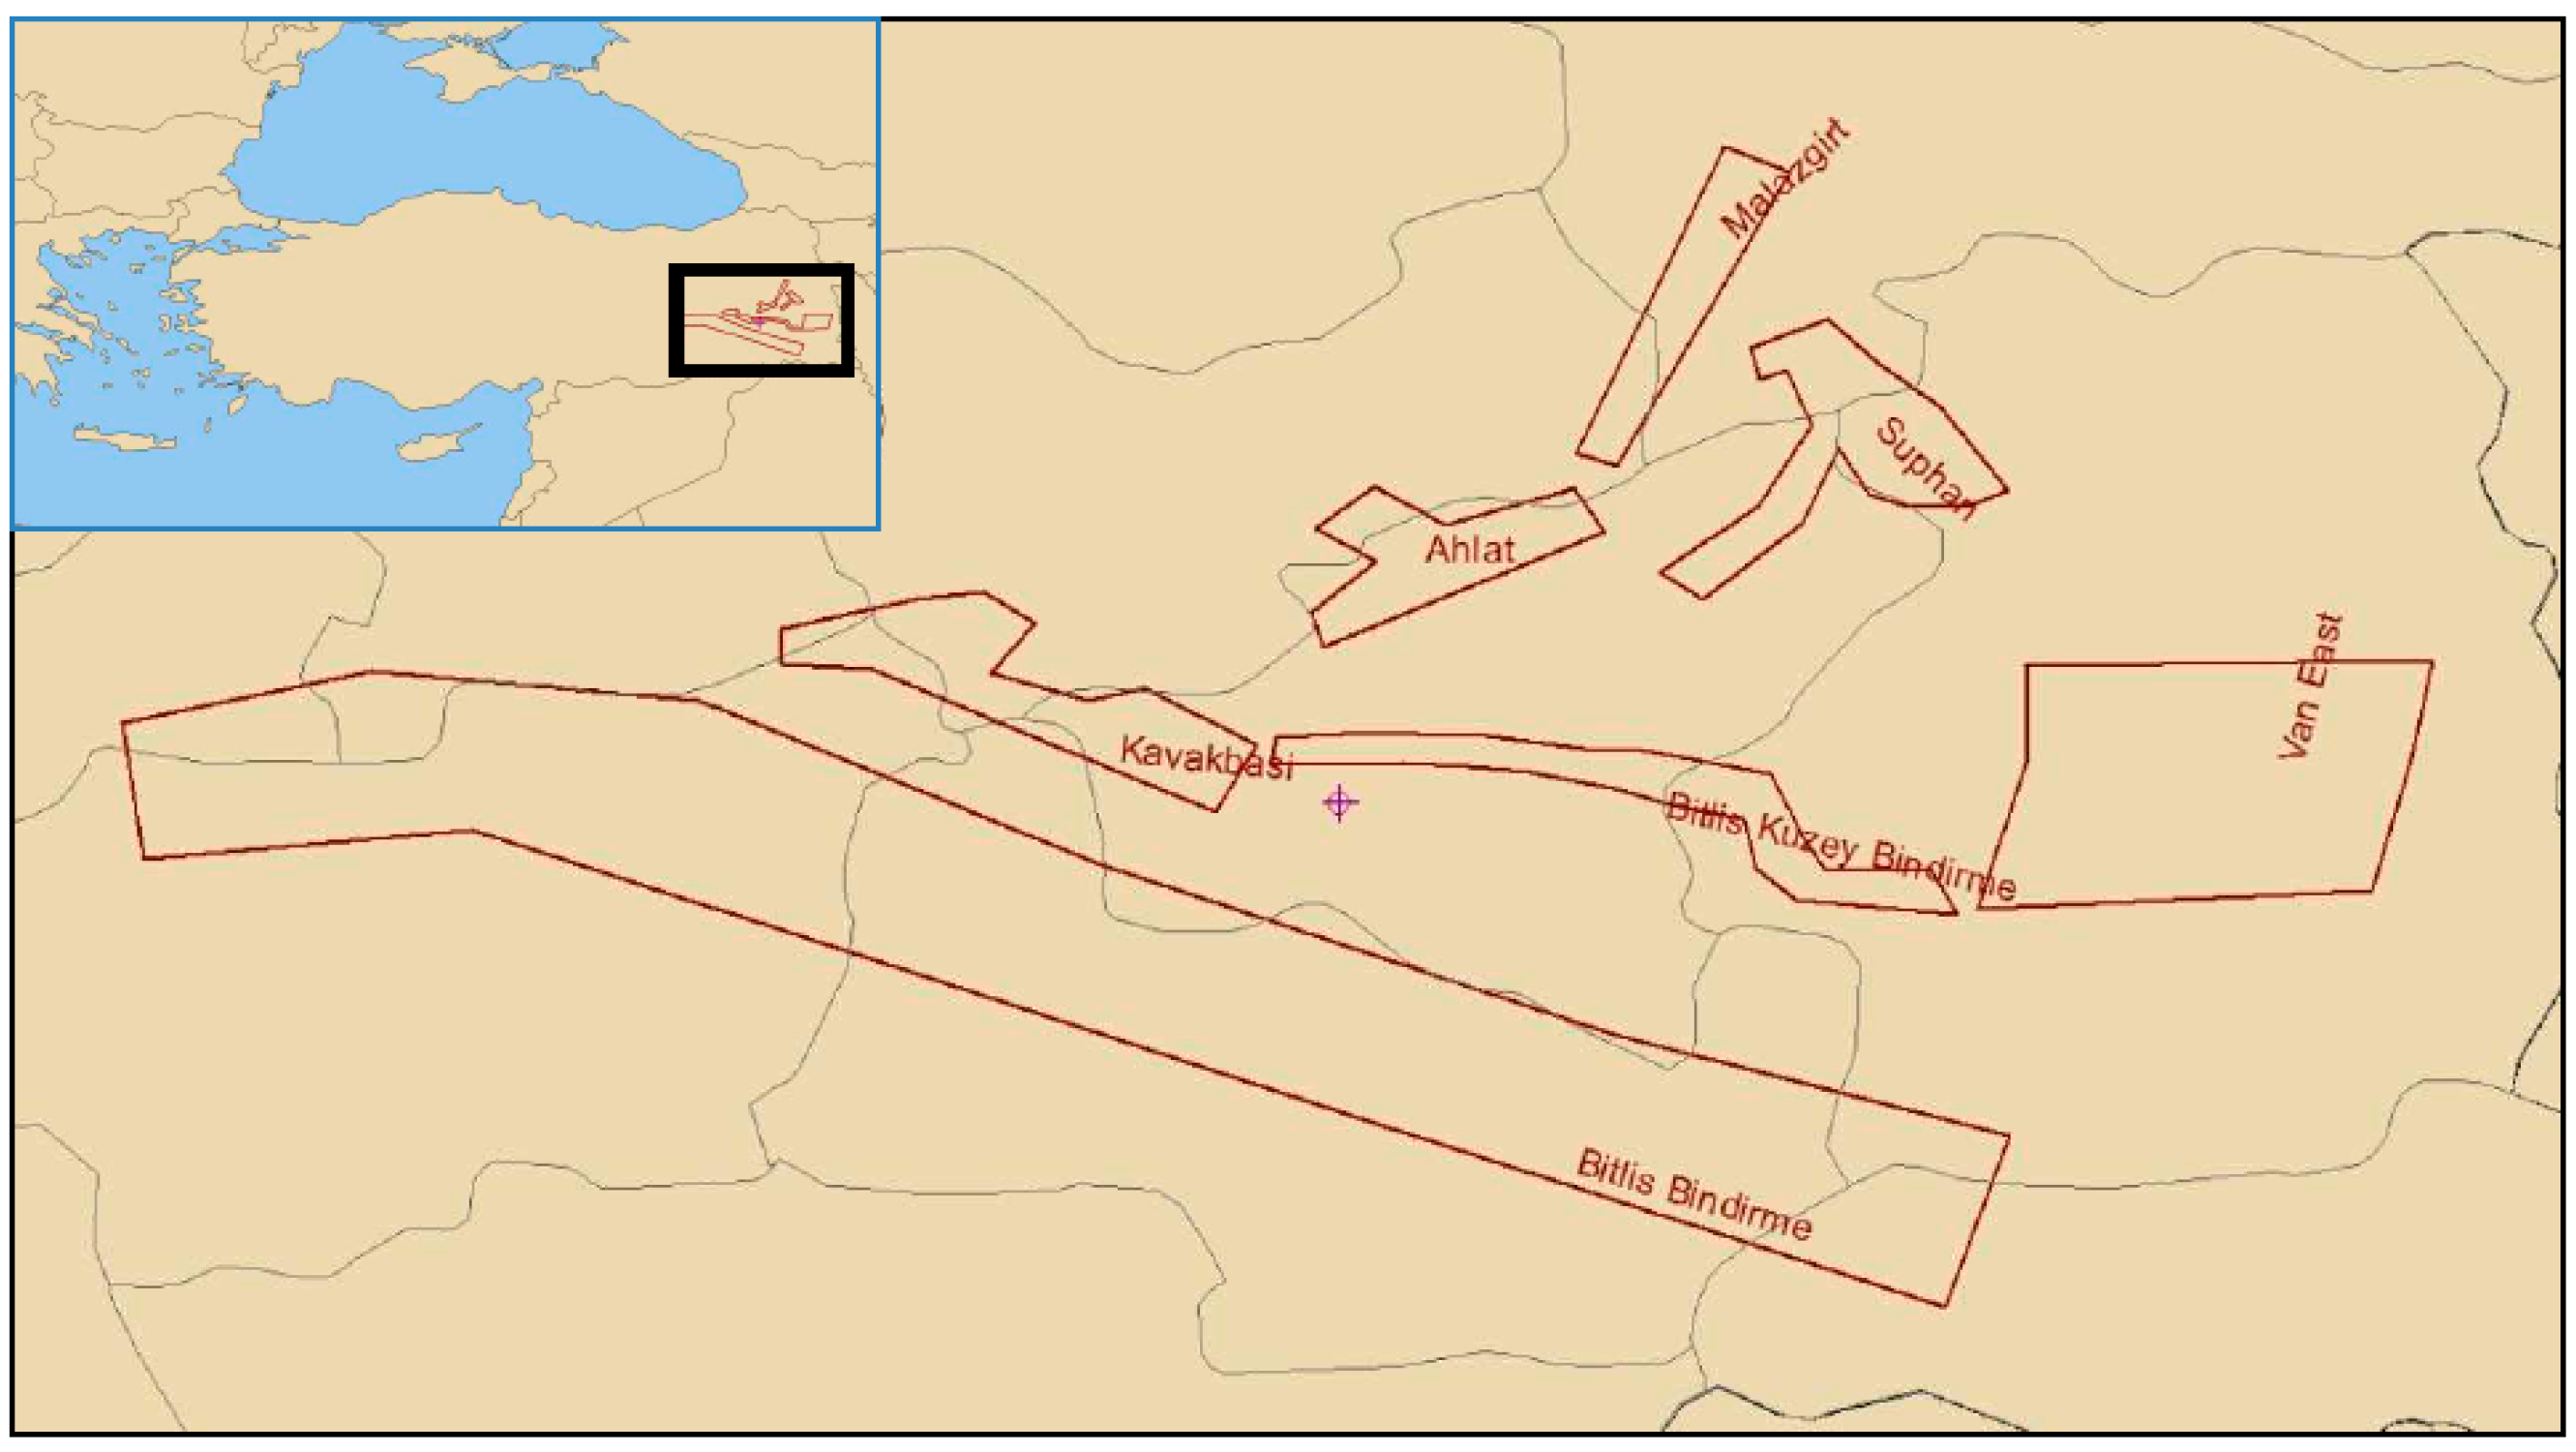
Figure 8). Secondly, Bitlis’s fault groups and surroundings were defined as areal sources. Since there are many fault and fault groups in the region and the fault parameters cannot be defined, the necessity of defining areal sources as earthquake sources has emerged. The study defined fault groups as Kavakbaşı, Bitlis Thrust-North, Bitlis Thrust, Van East, Suphan, Ahlat, and Malazgirt zones (
Figure 9).
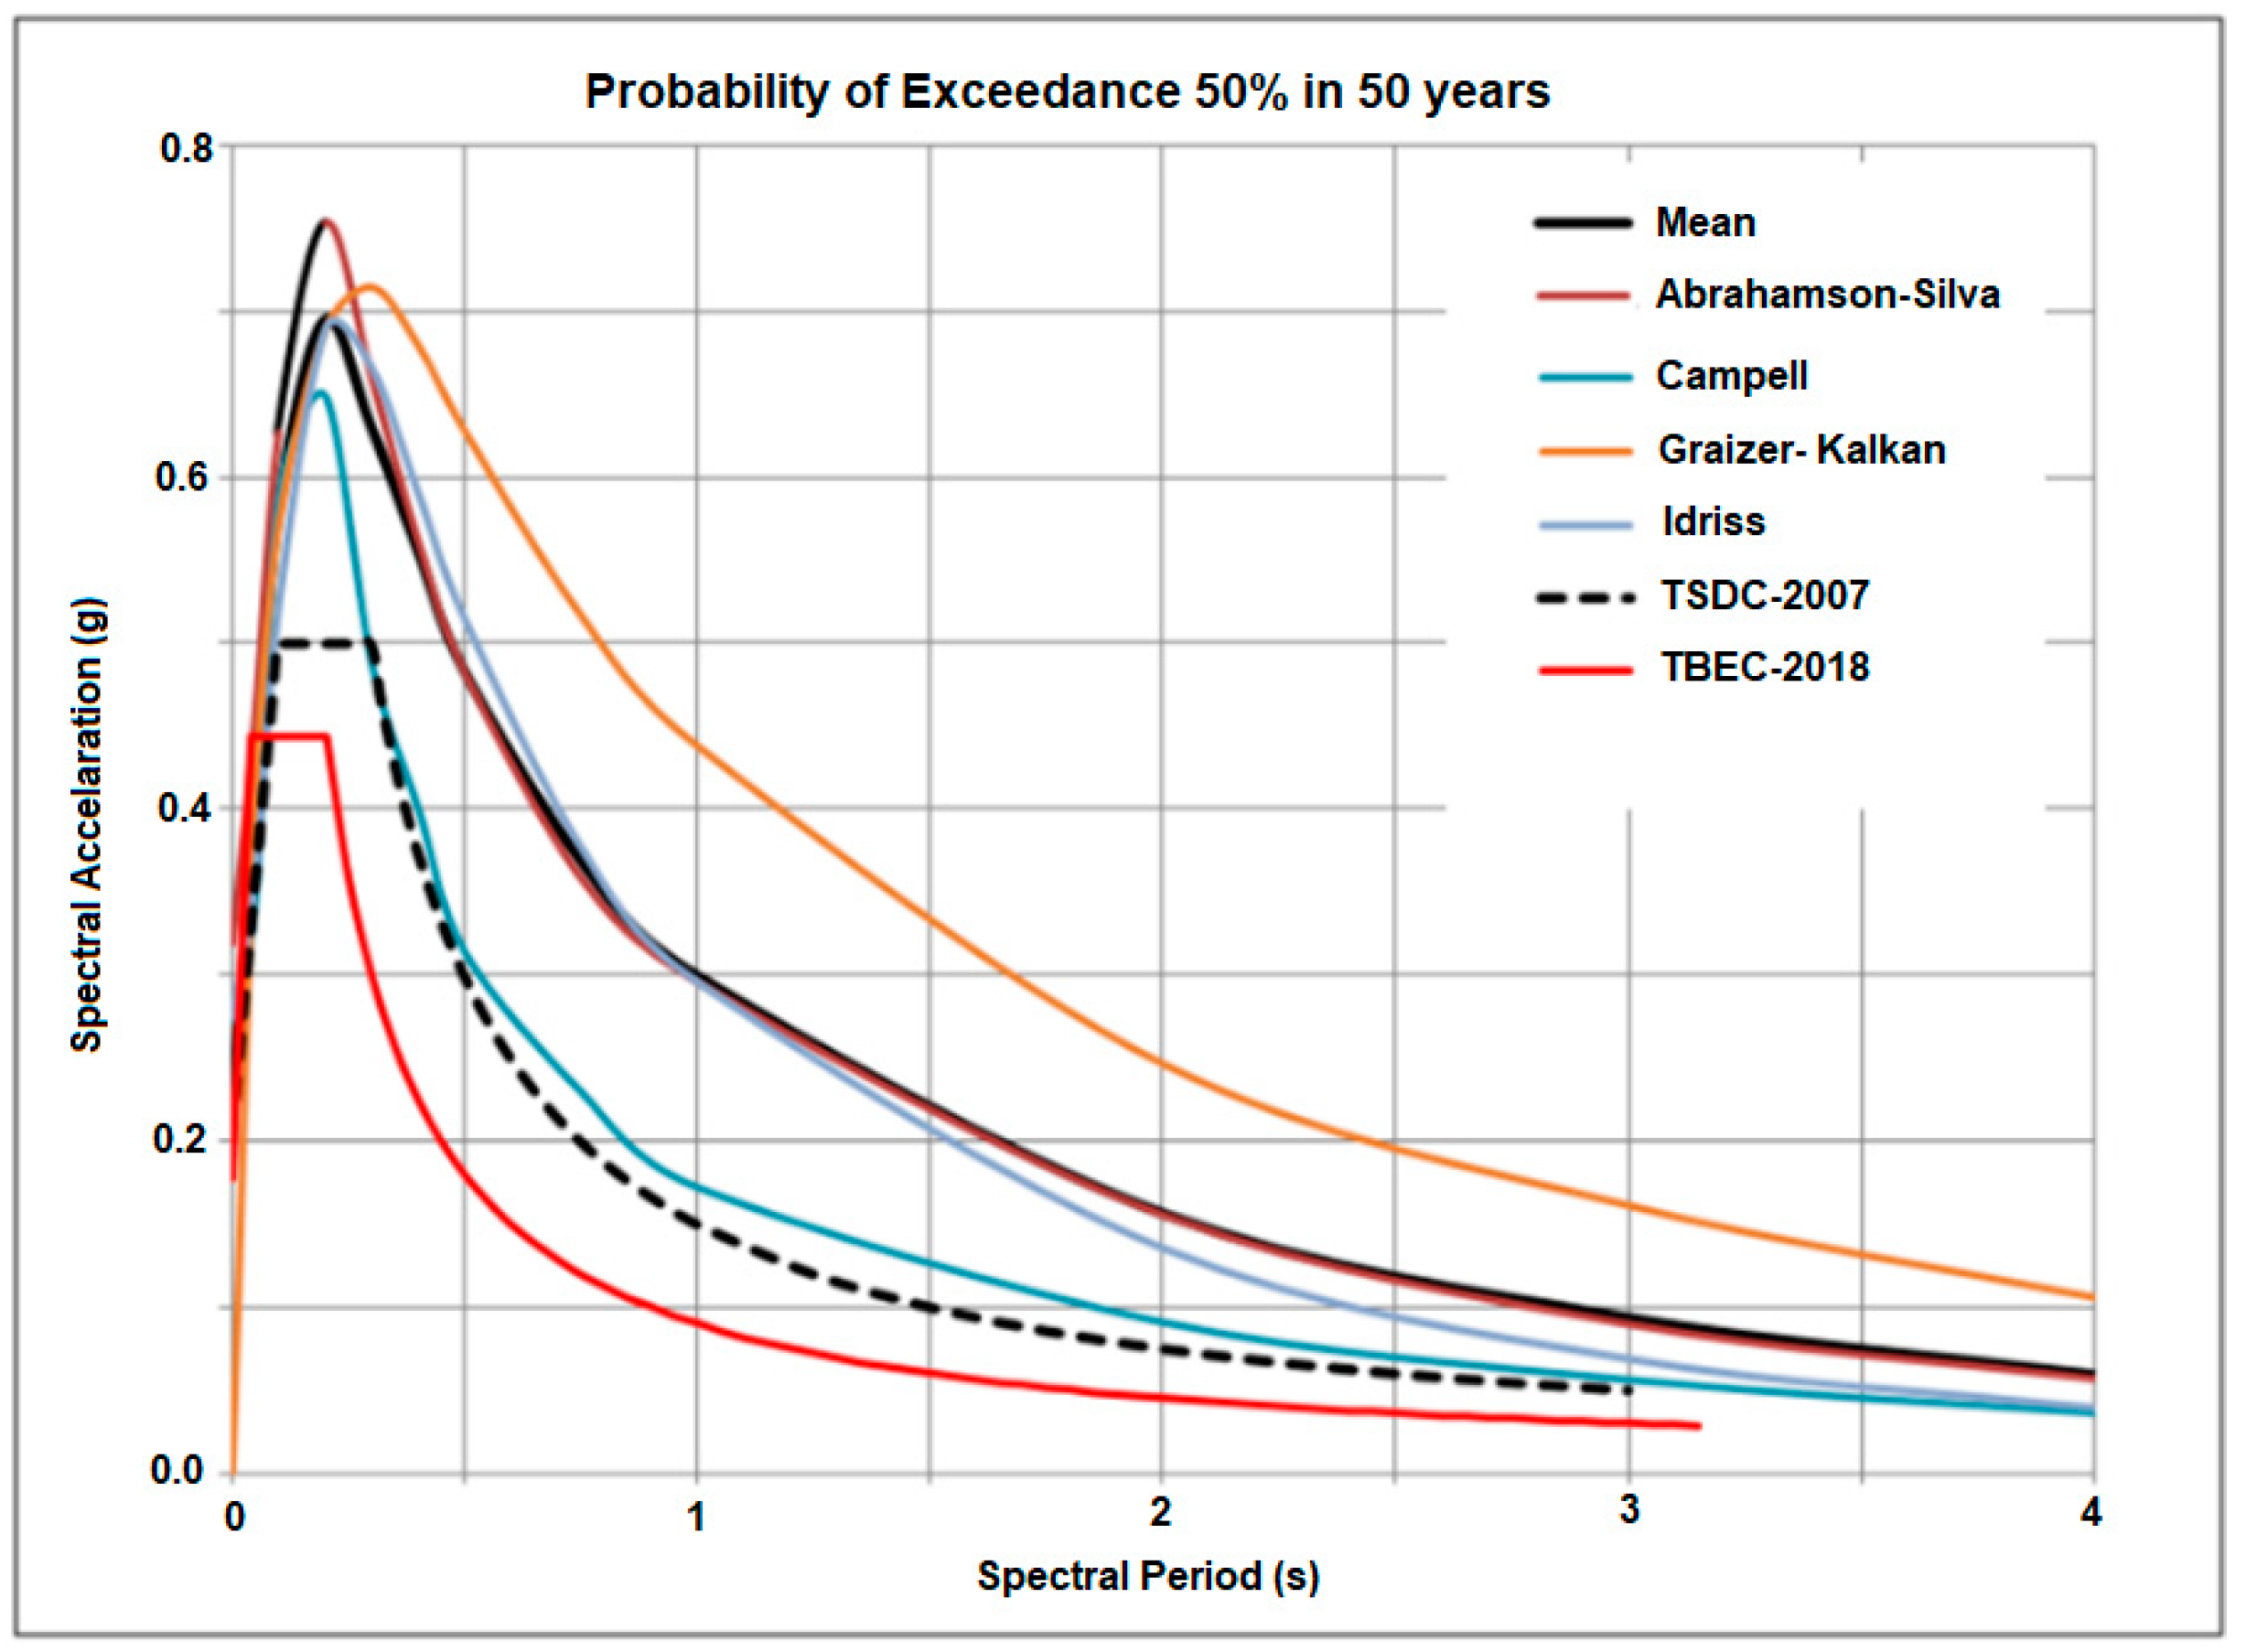
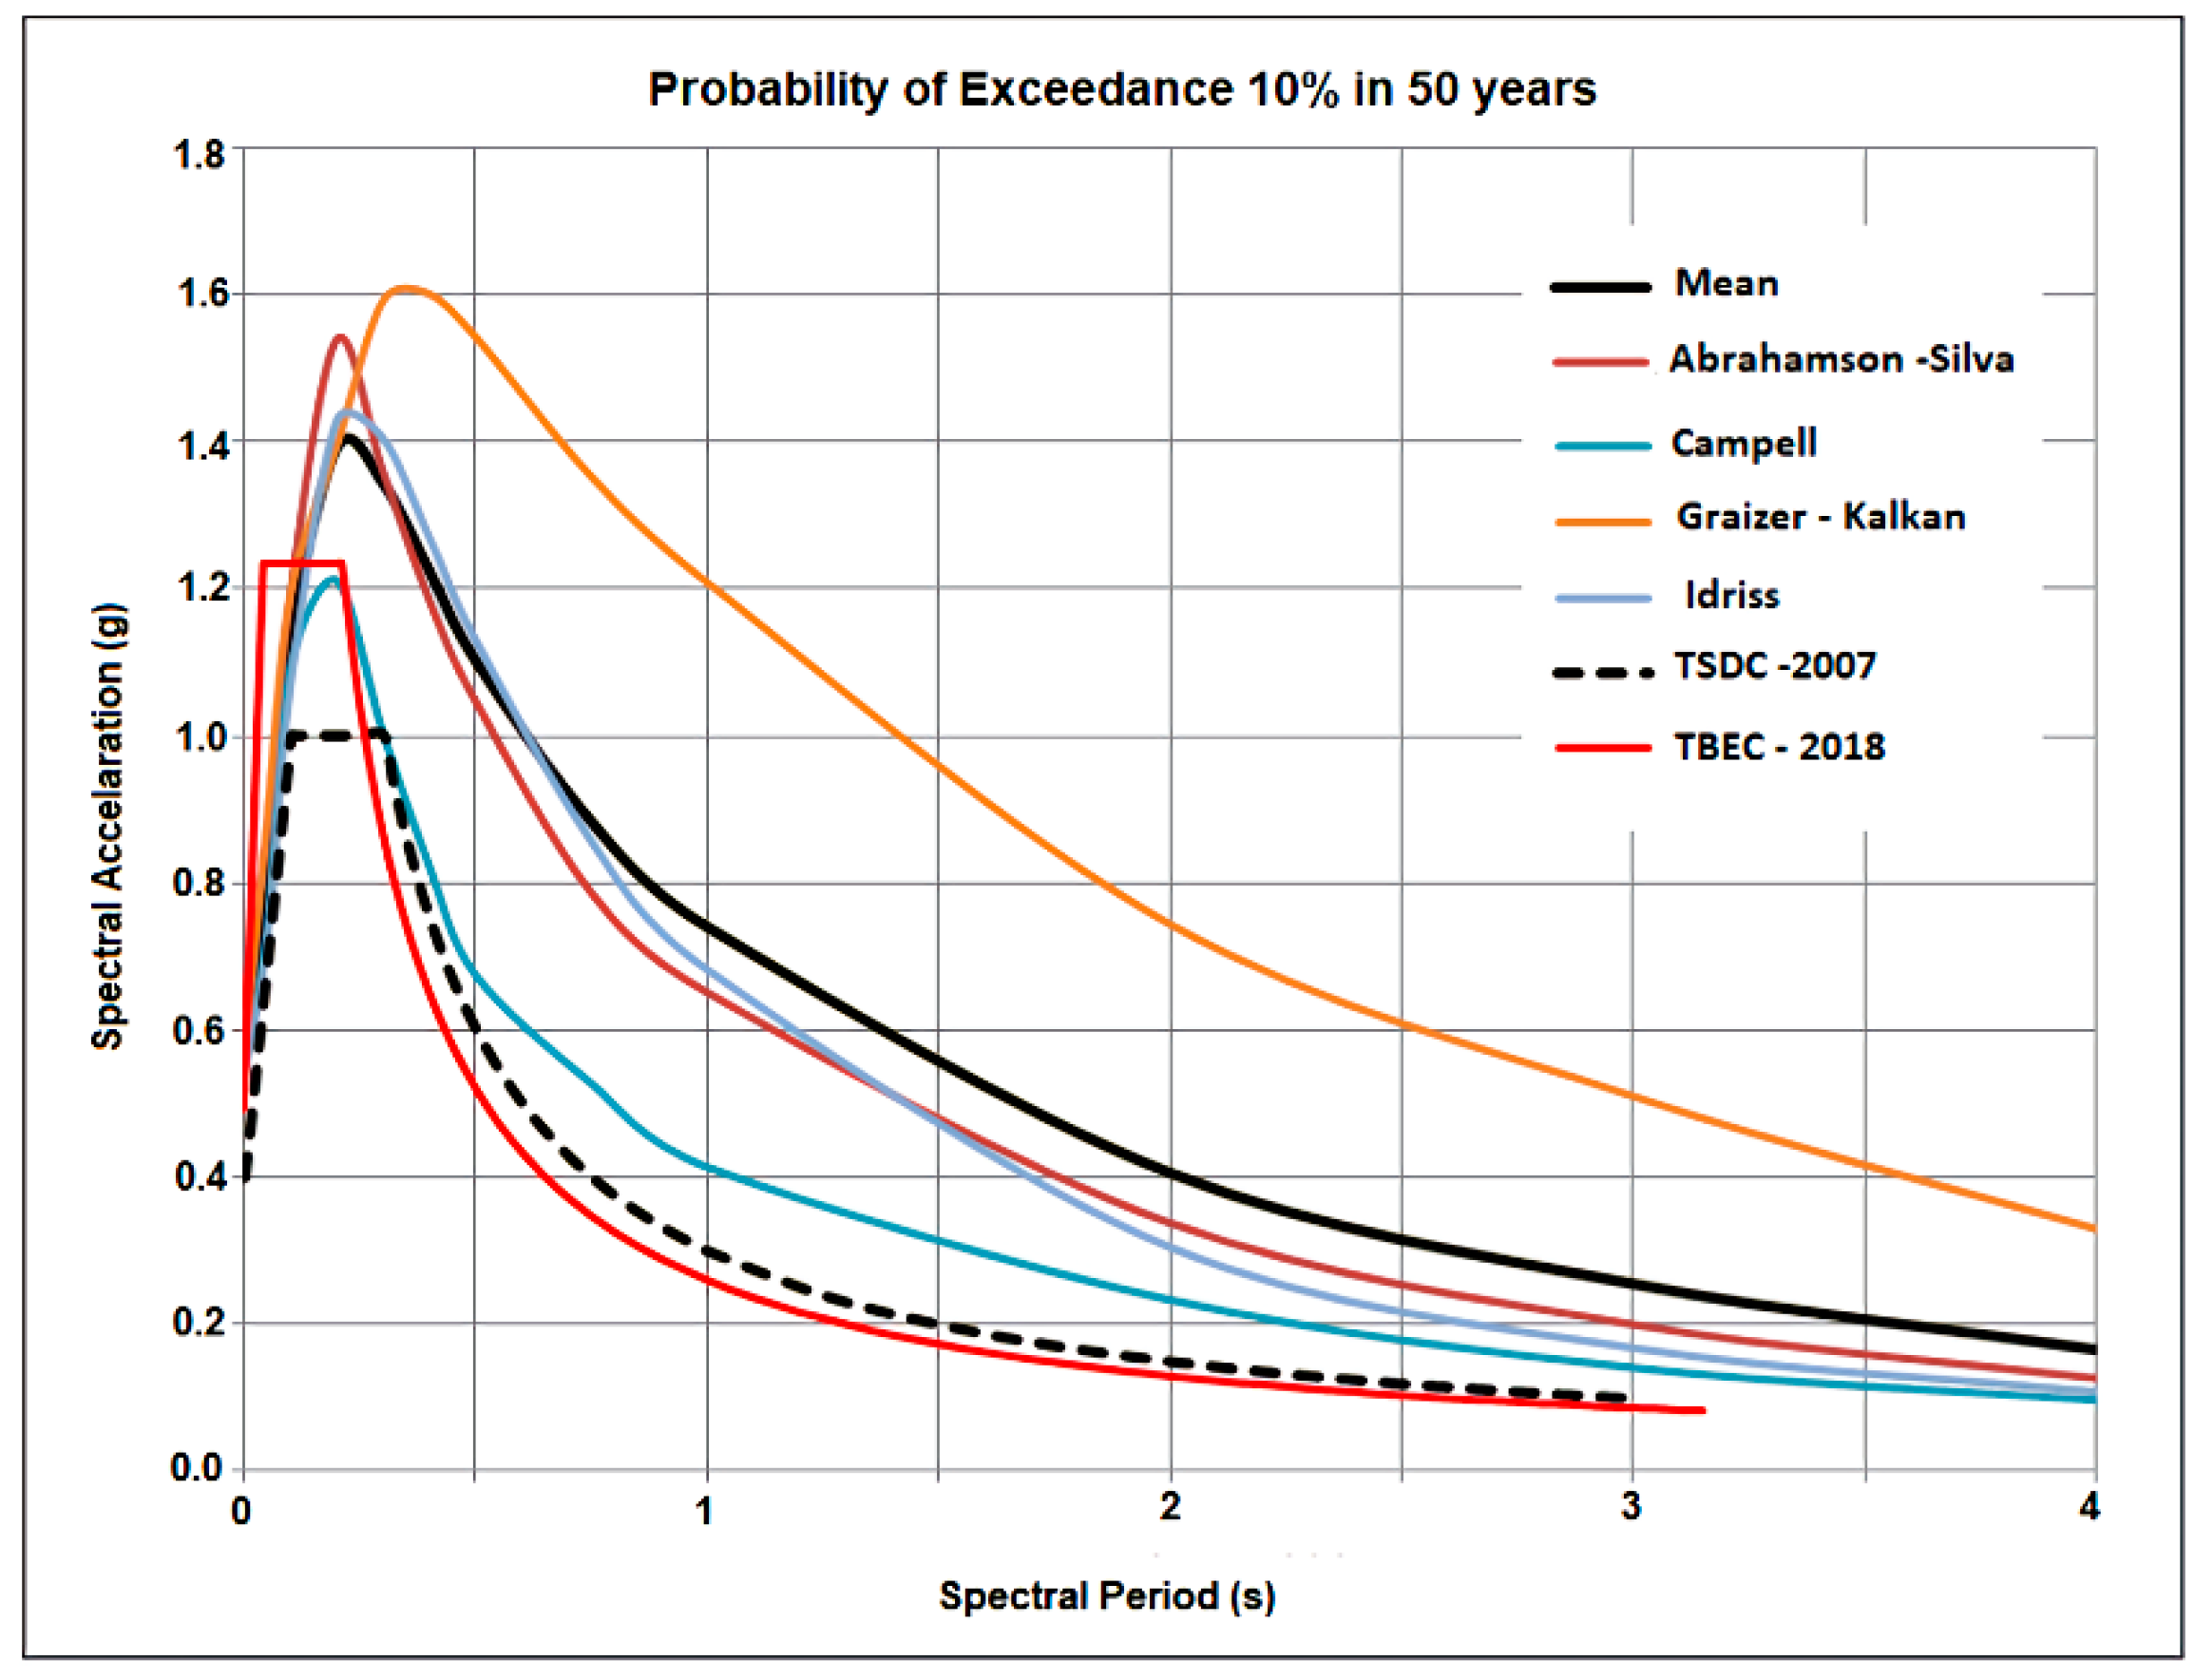
These areal earthquake sources are used to measure the change in spectral accelerations at periods for the earthquakes with a 50%, 10% and 2% probability of exceedance in 50 years. The strong ground motion acceleration records for the Eastern Anatolia region are very limited. The Abrahamson-Silva (1997) [
94] and Campbell (2003) NGA Ground-Motion Relations [
95], which is valid for shallow earthquakes around the world, the Graizer-Kalkan (2009) [
96], which is valid in active tectonic zones around the world and Idriss (2008) [
97] attenuation relations, which is developed for strike-slip shallow earthquakes, were used in the study. The software program obtained peak ground acceleration values as a function of the return periods. Uniform probability response spectra were obtained for the selected return periods.
Figure 10 shows the response spectra for the Ahlat district with the highest risk of earthquake hazard, which has a 50% probability of exceedance in 50 years and a 72-year return period. A comparison of response spectra with a probability of exceedance in 50 years and a recurrence period of 475 years for Ahlat is shown in
Figure 11.
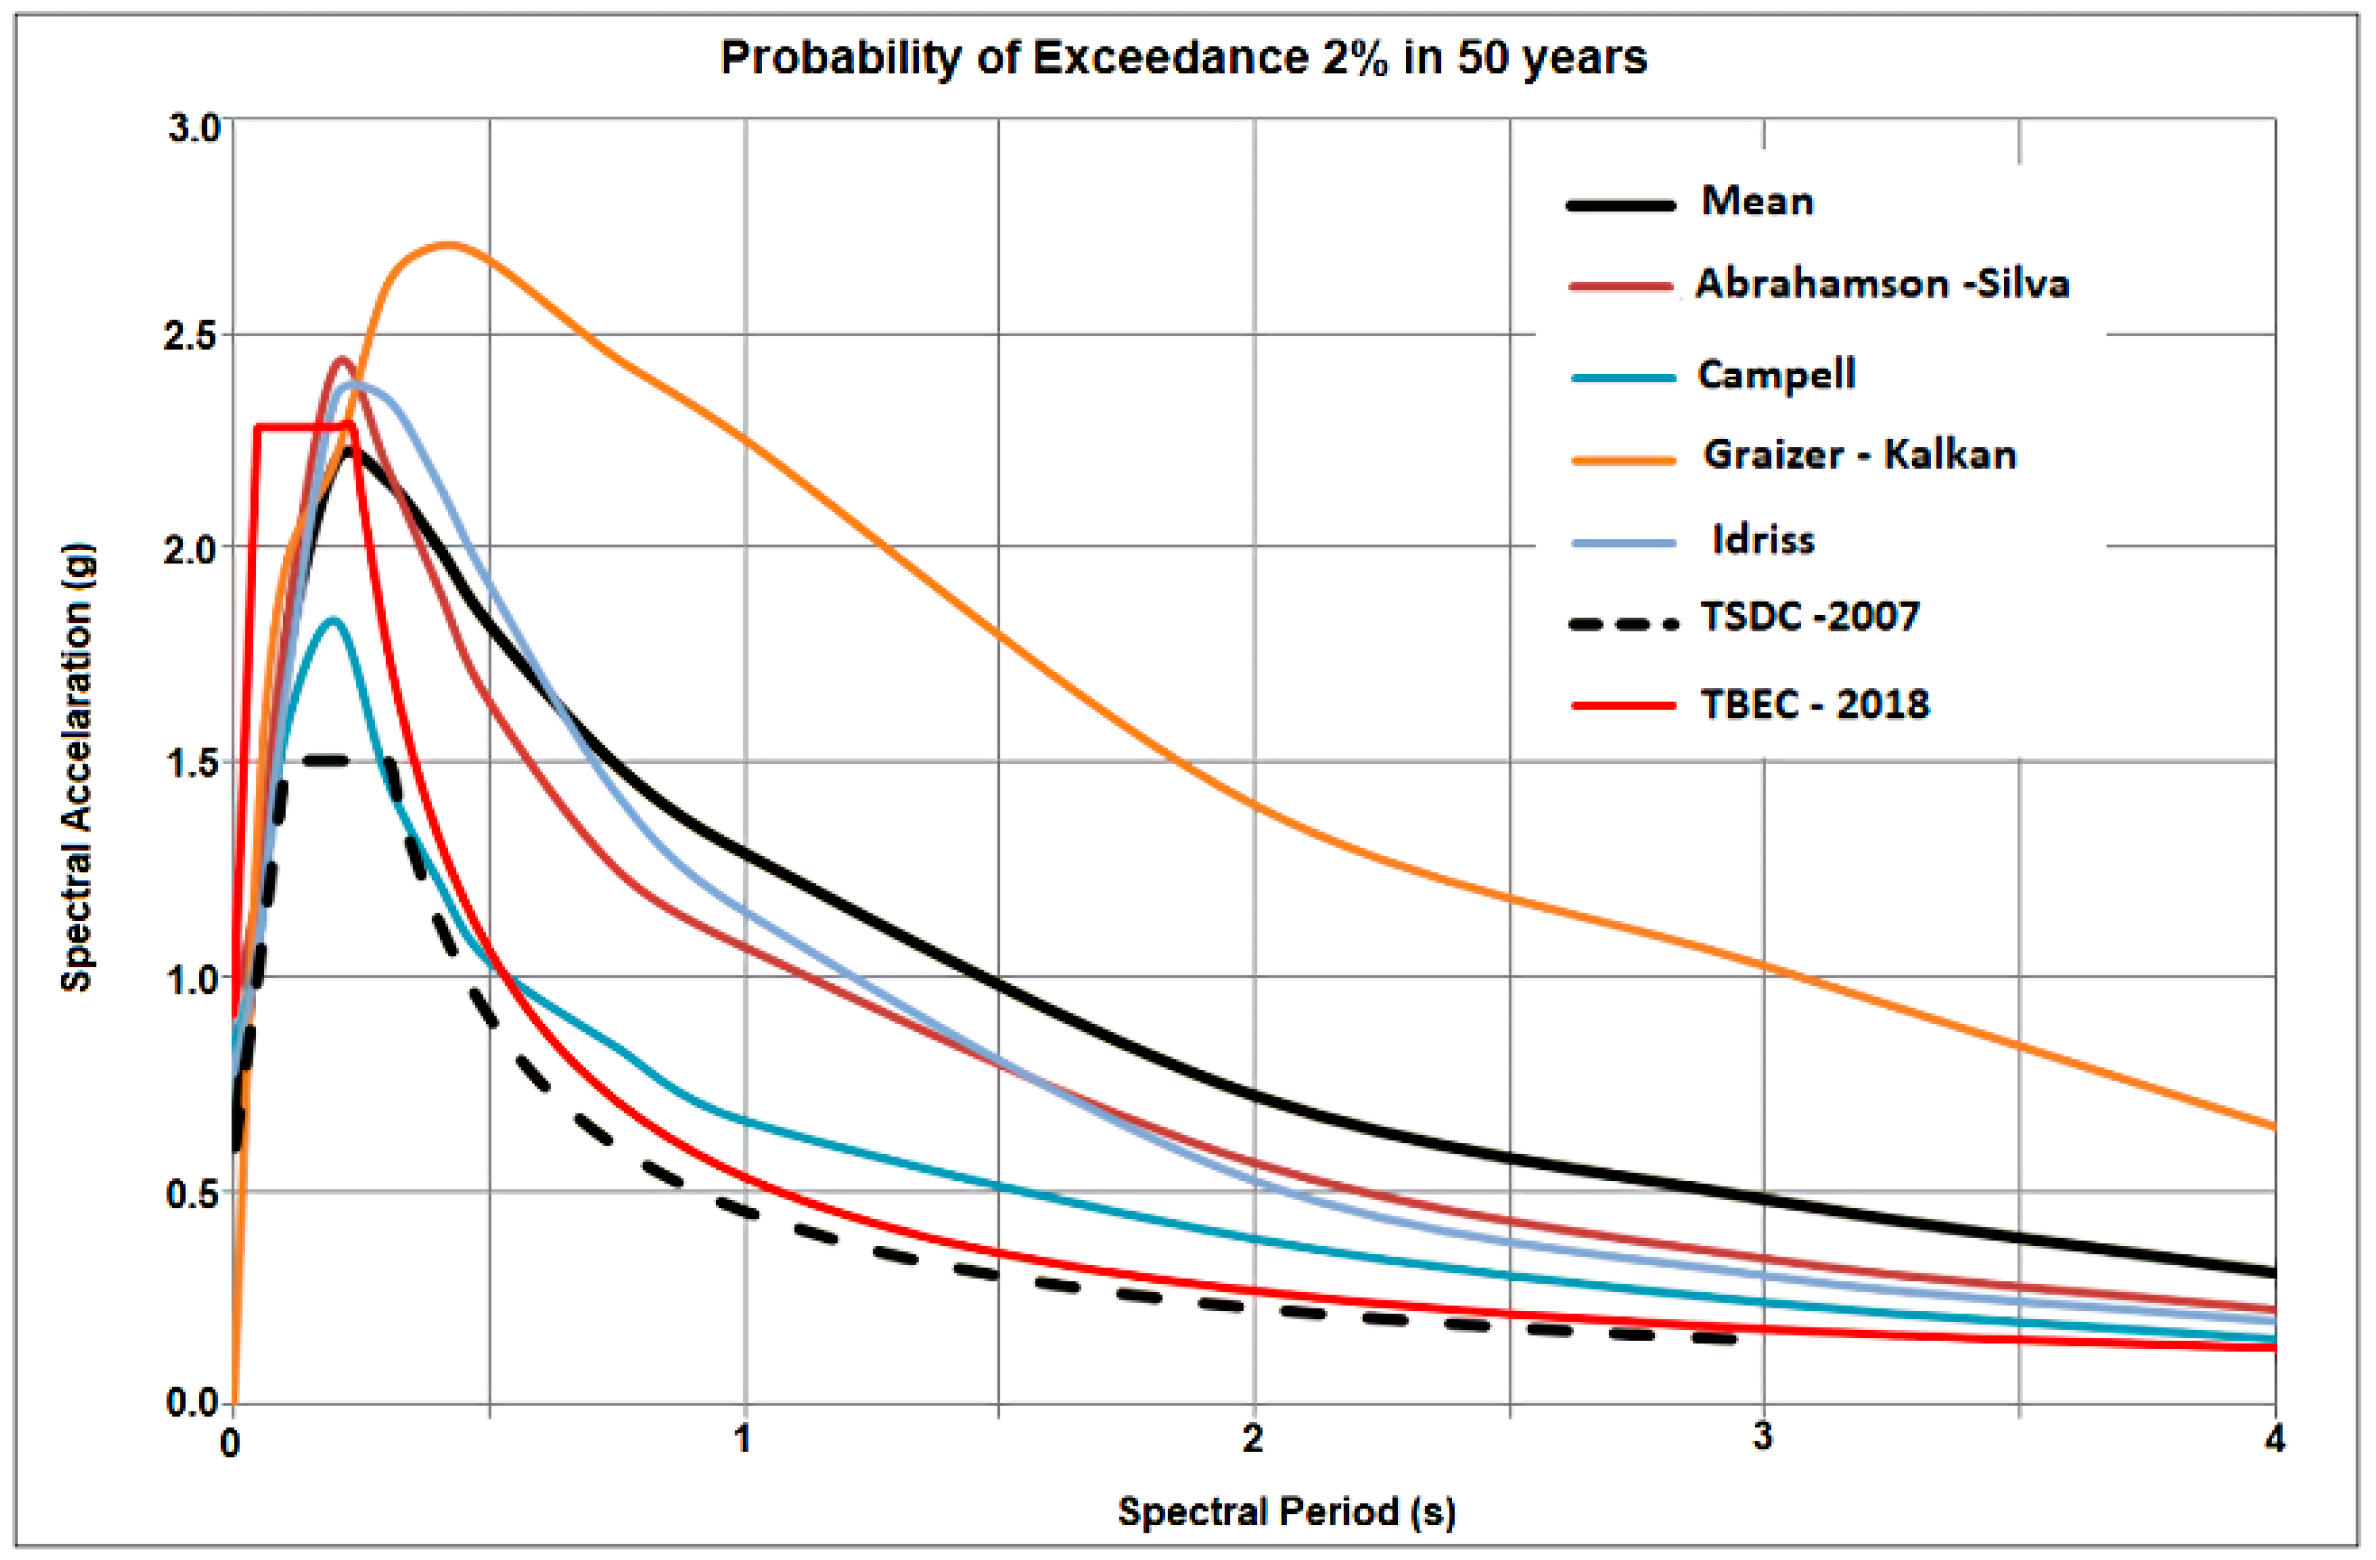
A comparison of response spectra with a probability of exceedance in 50 years and a recurrence period of 2475 years for Ahlat is shown in
Figure 12.
5. Structural Analysis
Structural analyses were carried out using academic licensed Seismostruct software.
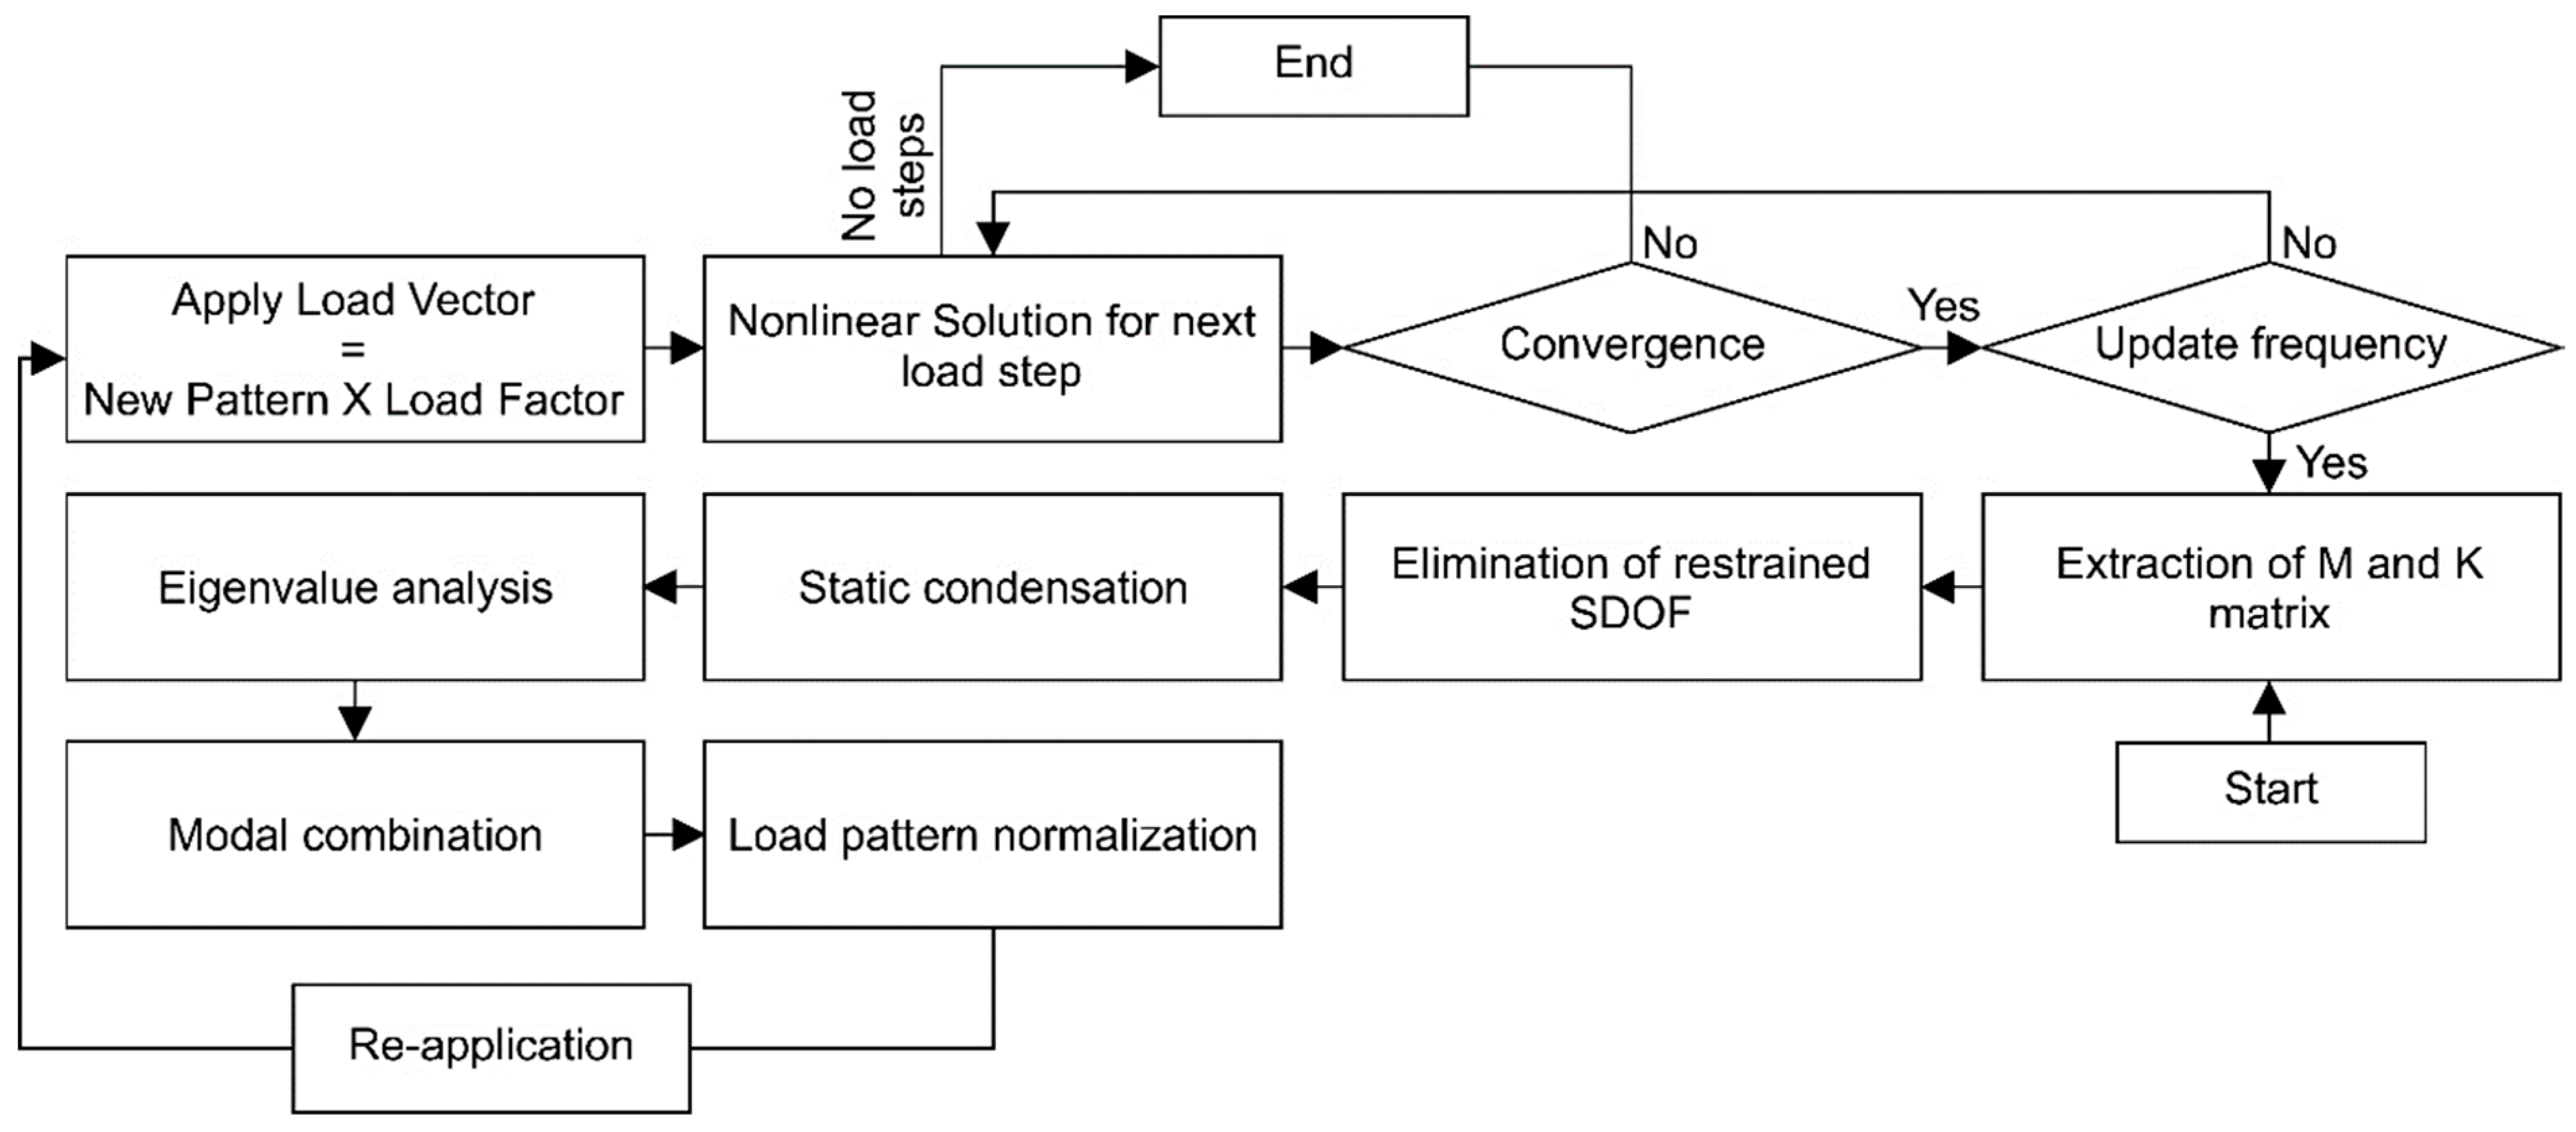
Static pushover analysis has been widely used to determine the seismic behavior of structures. Various pushover analysis methods have been developed, including modal pushover, adaptive pushover, and cyclic pushover, where some of the weaknesses of the traditional pushover method are eliminated [
98]. In this study, the static adaptive pushover analysis method was used. In this method, the effect of the frequency content and deformation of the ground motion on the structure’s dynamic behavior is considered to determine the structure’s capacity under horizontal loads. Furthermore, in this method, analysis was carried out taking into account the mode shapes and participation factors obtained from the eigenvalue analyses performed at each step. As a result, load distributions and strain profiles can be obtained for the structure with the help of the method. In conventional pushover analysis, the input functionality and load control types are similar to static adaptive pushover analysis [
99,
100,
101,
102,
103,
104,
105]. This procedure can be expressed under four main headings: (i) definition of nominal load vector and inertia mass, (ii) computation of load factor, (iii) calculation of normalized scaling vector, and (iv) update of loading displacement vector [
106]. The flow chart of the adaptive pushover analyses is given in
Figure 13.
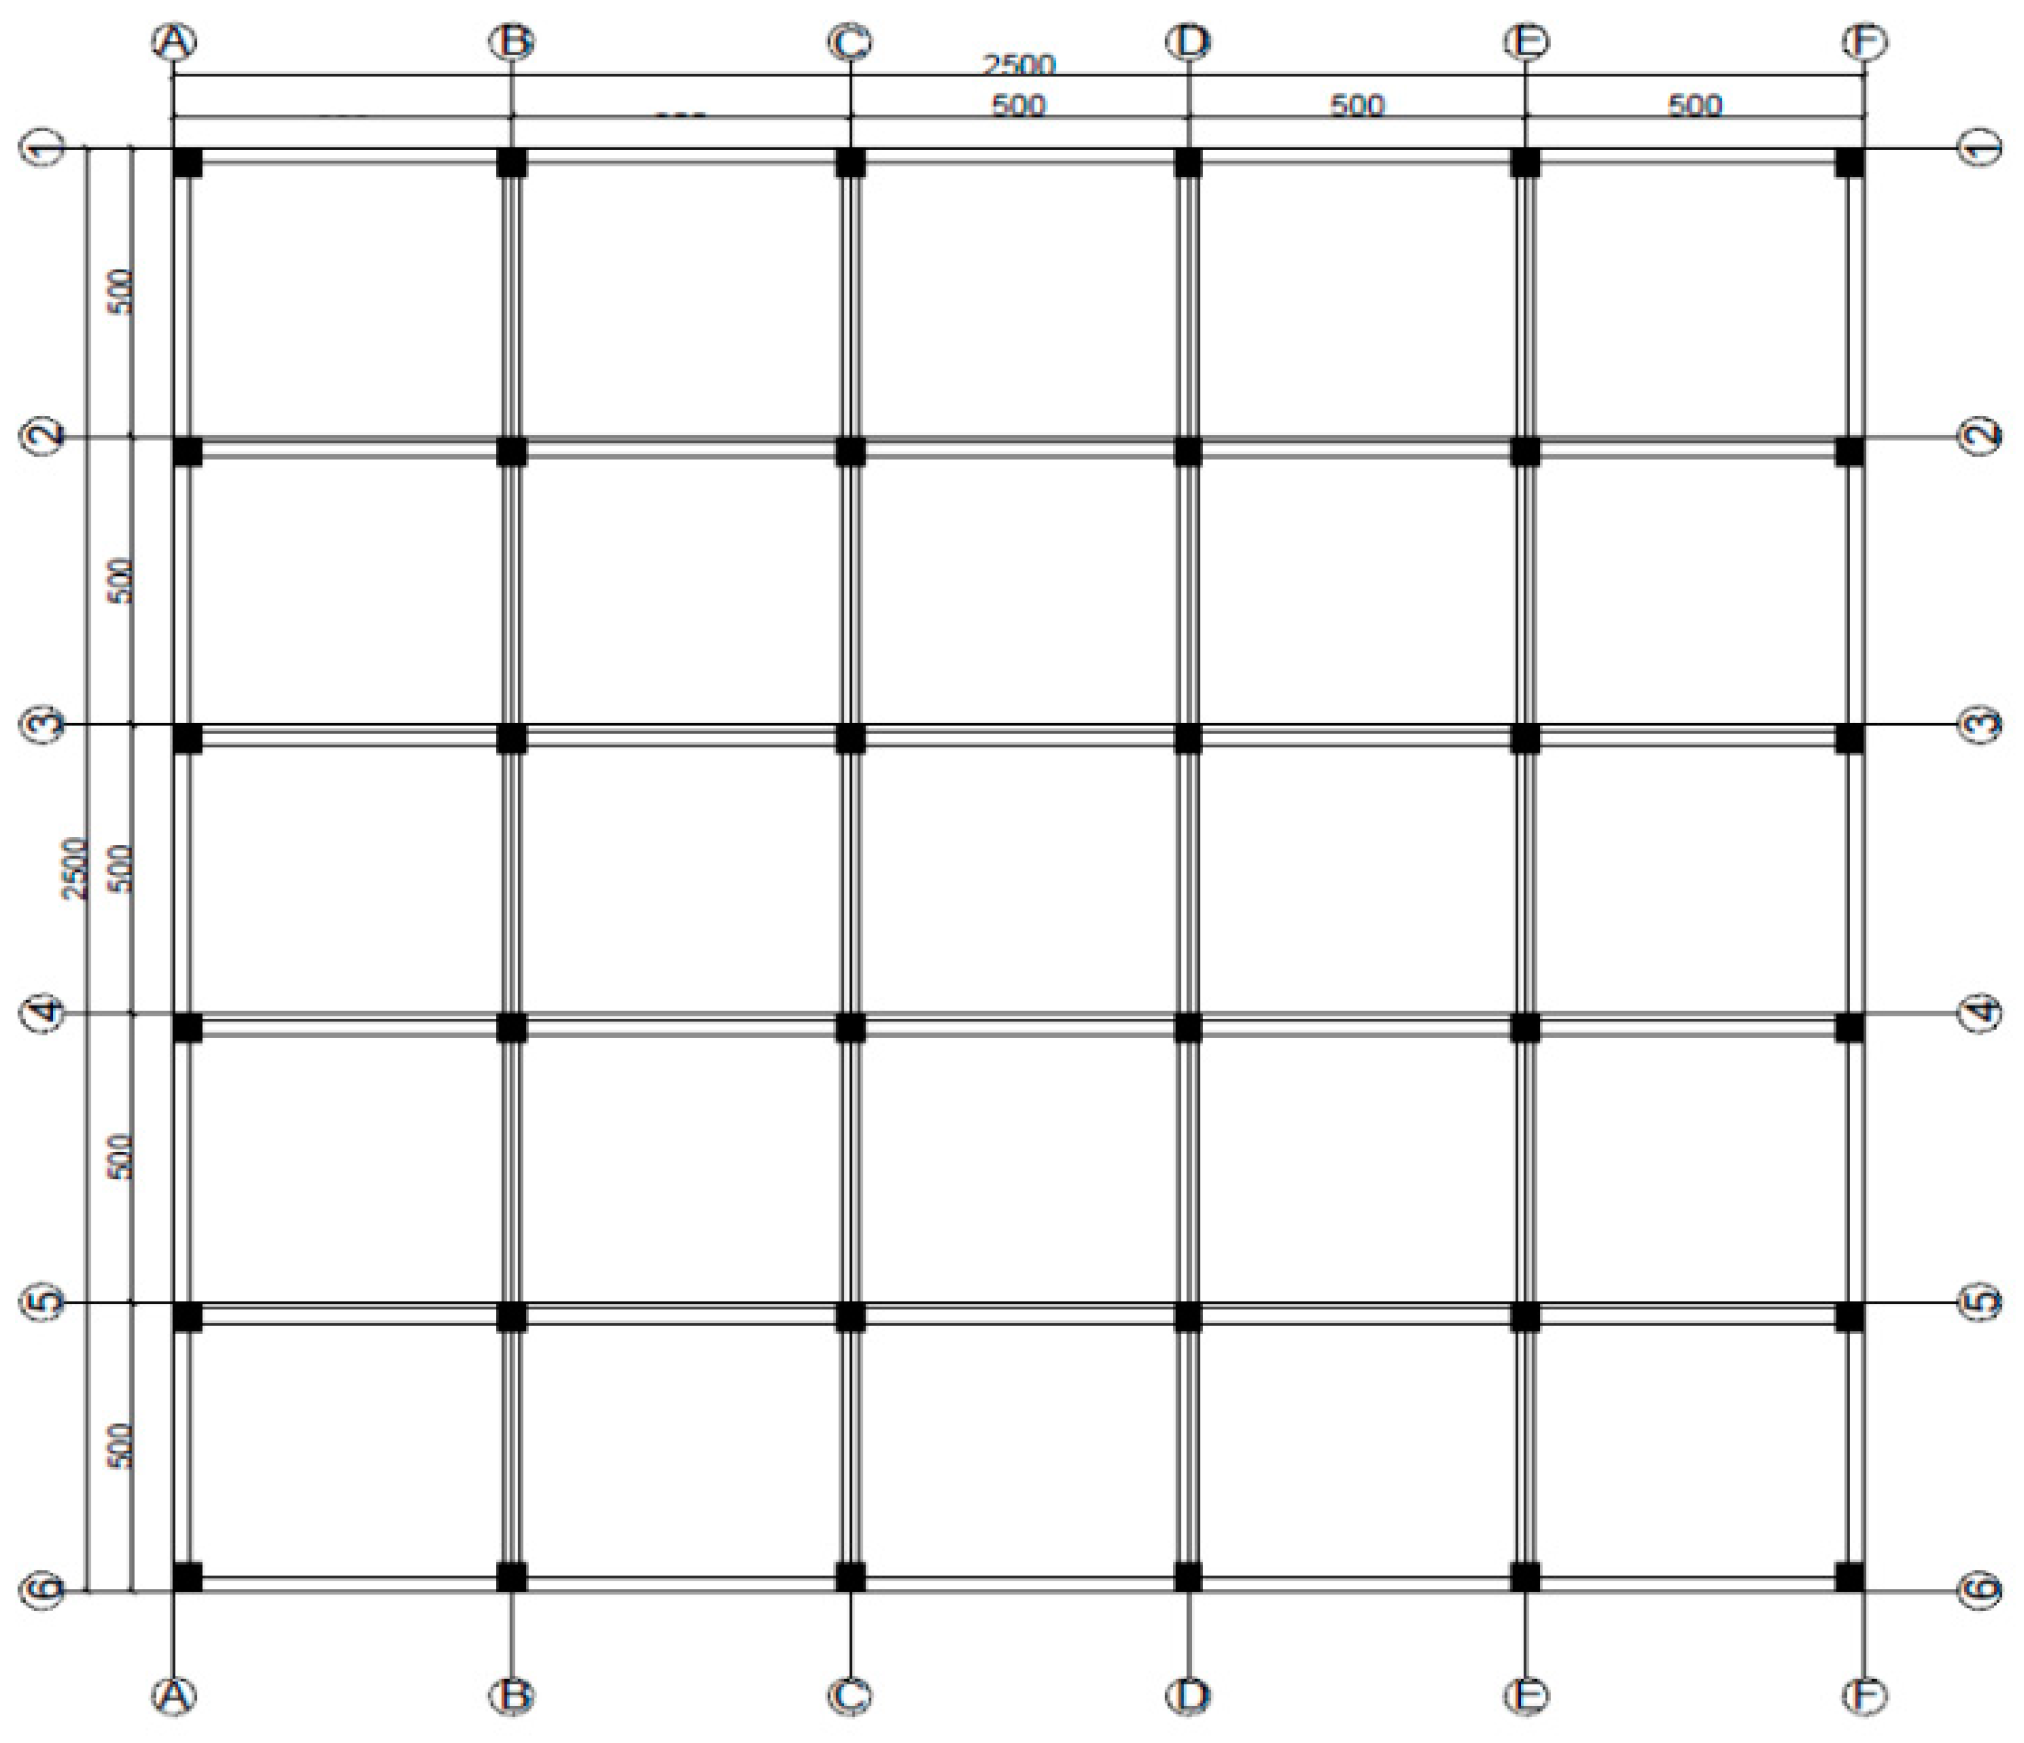
A seven-story RC building with the same structural characteristics was chosen as an example to reveal the structural analysis result differences for the settlements on the same fault zone. The analyses were performed in only one direction, since the RC building was chosen symmetrically in both directions. Five equal spans of 5 m length are considered in both the X and Y directions. A seven-story RC building with a total length of 2500 cm in both X and Y directions was chosen as the structural model. The blueprint of the selected RC building is given in
Figure 14.
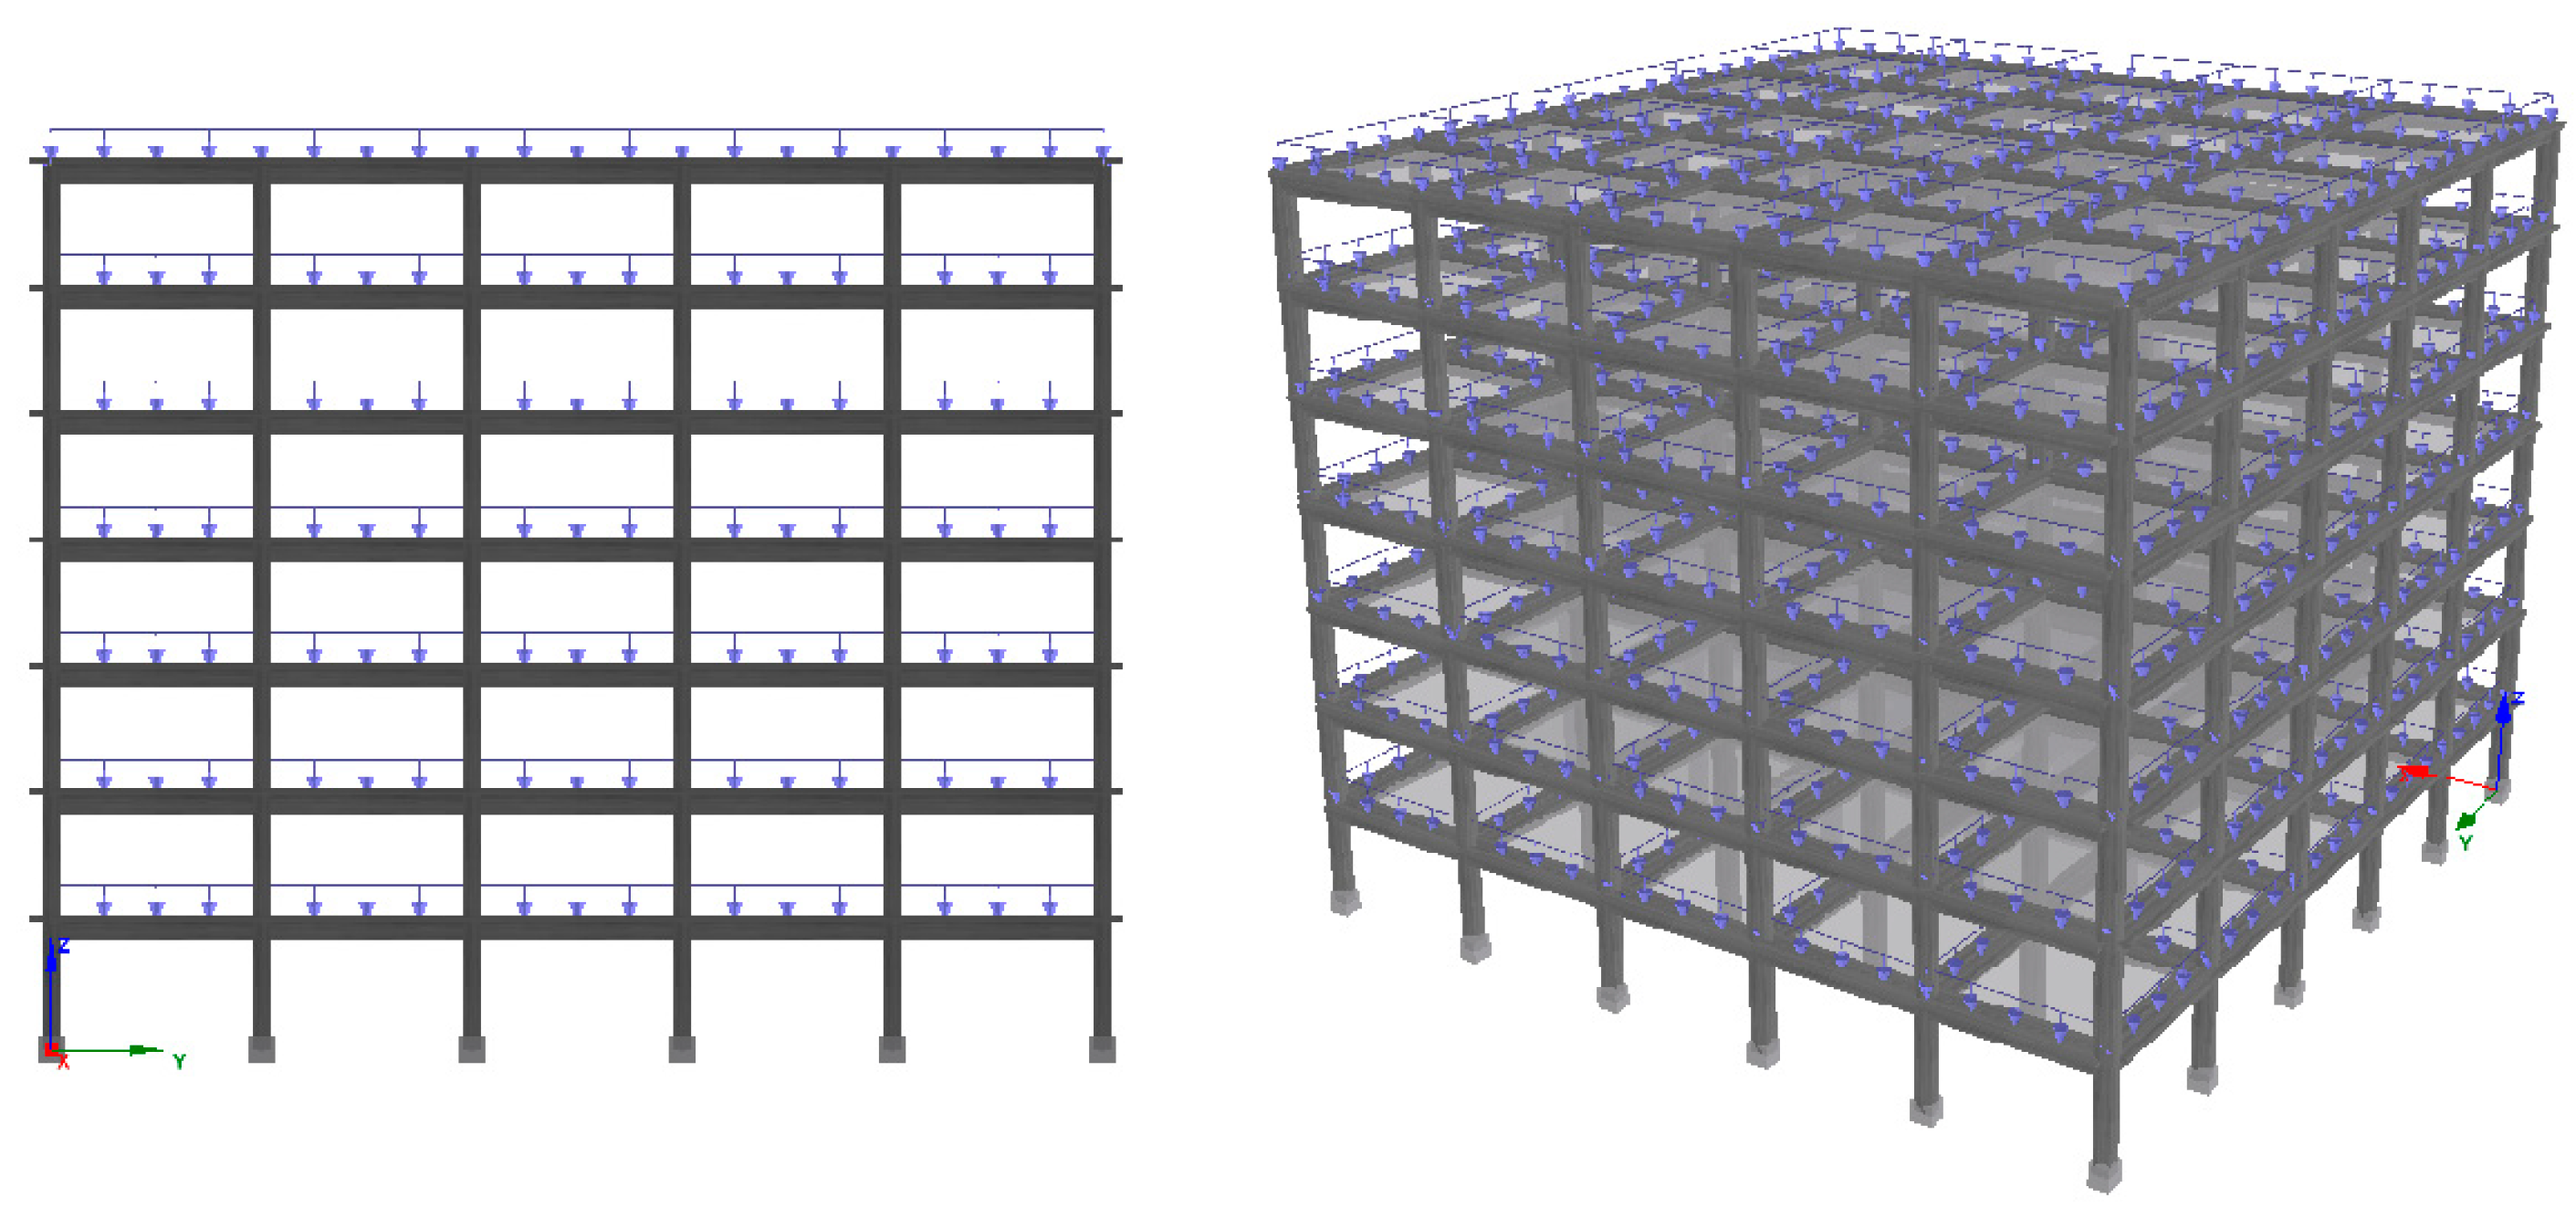
Permanent and incremental loads were applied to the structure of the software. Incremental load values were selected as displacement. Permanent load values of 5.00 kN were taken into consideration. The target displacement was selected as 0.42 m. All these values were the same in all structural models used in this study. The three-dimensional model obtained in the software for the structure and the loads that were applied are given in
Figure 14. The Menegotto-Pinto steel model (stl_mp) for all reinforcement in structural elements and Mander et al. nonlinear concrete model (con_ma) for concrete were selected as material model.
Each story had an equal height and was taken as 3 m. The material class used for all load-bearing elements of the structure was selected as C25-S420. All columns were selected as 0.40 × 0.50 m and beams were selected as 0.25 × 0.60 m. The transverse reinforcements used in both elements were selected as ϕ10/10. The reinforcements used in the columns were selected as 4ϕ20 at the corners and 4ϕ16 on the top, bottom and left–right sides. The reinforcements used in the beams were selected as 4ϕ16 on the lower side, 5ϕ14 on the upper side and 2ϕ12 on the side. The damping ratio was taken as % 5 in all structural models. The ZB class was chosen as the ground class. The importance of structure was taken into consideration in Class II. The slabs were selected as rigid diaphragms. The 2D and 3D structural models are shown in
Figure 15.
Structural characteristics taken into account while creating the sample reinforced concrete building model are shown in
Table 8.
The force-based plastic-hinged frame members (infrmFBPH) are selected for structural elements in the sample RC building model. These elements model the spread inelasticity based on force and only limit the plasticity to a finite length. In total, 100 fiber elements are defined for the selected sections. This value is sufficient for such sections. Plastic-hinge length (Lp/L) was chosen as 16.67%.
The sample RC building was analyzed using the three different horizontal design spectrum curves, such as mean, TSDC-2007 and TBEC-2018, obtained for Ahlat. As a result of the analysis, the base shear forces were calculated for each spectrum. The displacement values were obtained for three different points on the idealized curve. The first value refers to displacement at the moment of yield, the second value refers to the intermediate (d
int) displacement and the third value refers to the target displacement. Elastic stiffness (K_elas) and effective stiffness (K_eff) values were calculated separately for all models. Three different performance criteria were obtained for damage estimation. These are considered as near collapse (NC), significant damage (SD) and damage limitation (DL). All these values are calculated separately for different design spectra. The comparison of all values obtained in the X direction as a result of structural analyses is shown in
Table 9.
The stiffness value of any structural reinforced-concrete element differs from the estimated stiffness value under the impact of earthquake. Therefore, the concept of effective cross-sectional stiffness has emerged in the analysis and design of RC structural members. The stiffness of the cracked sections of RC structural systems is taken into account to determine its performance under earthquake loads. The effective stiffness of the cracked sections is obtained using the predicted stiffness reduction coefficients of the elastic stiffness value [
108,
109,
110]. In this study, elastic stiffness (K_elas) and effective stiffness (K_eff) values were directly obtained by using the stiffness reduction coefficients estimated in the software used.
6. Conclusions
During the update of earthquake hazard maps in 2018, the province of Bitlis and its districts located in the Eastern Anatolia Region were considered a region with a high earthquake risk in Turkey. PGA and PGV values were obtained for different probabilities of exceedance. According to the values obtained within the scope of this study, PGA values in 50 years for the province were found as follows: 0.49–1.04 g for 2% probability of exceedance; 0.26–0.57 g for 10% probability of exceedance; 0.010–0.20 g for 50% probability of exceedance; and 0.08–0.13 g for 68% probability of exceedance, respectively. The study obtained horizontal and vertical elastic design spectra for each district by choosing the same local soil class. The order of magnitude of PGA values has also remained valid for design spectrum. Computation of design spectrum on a point basis indicates that the earthquake behaviour of structures can be calculated more realistically.
This study is important regarding the joint implementation of the Turkey Building Earthquake Code that entered into force in 2019 and the Turkey Earthquake Hazard Maps presented with this code. Changes were observed in the result values obtained for all neighborhoods and districts in Bitlis province. It was concluded that the reason for these differences is due to factors, such as site-specific seismicity characteristics, fault groups and their characteristics, the distance of the selected geographical locations to the fault/fault groups and earthquake history of the region. The results indicate that obtaining design spectra by considering the site-specific earthquake hazard stipulated in the new earthquake code is remarkable. Furthermore, earthquake data will give applicable and practical results thanks to the transition from macro-zoning to micro-zoning.
Since the structural properties were kept constant in the sample RC building model considered in all settlements, the base shear force, elastic and effective stiffness values and period values were approximately equal. However, the differentiation in the design spectrum significantly changed the target displacements predicted for the expected performance levels of the structure. This reveals once again that the design spectrum significantly affects the target displacements expected from the buildings and, thus, the building performance level under impact of earthquake. While the greatest displacement values were obtained for the design spectrum obtained by considering the average of the attenuation relations, the lowest values were obtained using the design spectrum stipulated in the previous code. By comparing the stipulated values in the last two codes, it is concluded that the requests for displacement requests in the last regulation were greater.


