Article

Fragility Analysis of Wind-Induced Collapse of a Transmission Tower Considering Corrosion

School of Civil Engineering and Architecture, Northeast Electric Power University, Jilin 132012, China
*
Author to whom correspondence should be addressed.
Buildings 2022, 12(10), 1500; https://doi.org/10.3390/buildings12101500
Submission received: 2 September 2022 / Revised: 16 September 2022 / Accepted: 18 September 2022 / Published: 21 September 2022
(This article belongs to the Special Issue Advanced Numerical and Computer Methods in Civil Engineering)

Abstract

:
To investigate the variation law of the wind-resistant performance of transmission towers during their operation, this paper proposes an evaluation method for the wind resistance of the transmission tower considering corrosion, and a 220-kV transmission tower is analyzed as an example. Considering the uncertainty of the material and geometric parameters, the wind-induced collapse of the transmission tower was analyzed, and the collapse wind speeds were obtained via pushover and incremental dynamic analyses. In addition, the sensitivity of the transmission tower to various parameters was analyzed. Based on the existing meteorological and corrosion data, corrosion prediction models were established using a back-propagation (BP) artificial neural network, and the mean relative error between the predicted and measured values of the test samples was 8.91%. On this basis, the corrosion depth of the tower members in the four regions was predicted, and the fragility of the transmission tower was analyzed considering the effects of corrosion and strong winds. The results show that the collapse wind speed of the transmission tower is most significantly affected by the thickness of the angle steel, followed by the elastic modulus and yield strength, and is less affected by the width of the angle steel. When the exposure time was 25 years, the wind-resistant performance of transmission towers in regions with severe acid rain and coastal industrial regions decreased by 10% to 20%. With an increase in exposure time, the failure mode of the transmission tower tended to be brittle failure.

1. Introduction

A transmission tower is a tall and flexible structure, and it is significantly affected by wind load; therefore, wind load is very important in the structural design of transmission towers [1]. Wind tunnel tests and numerical simulation methods are often used in the research on the wind-resistant performance of transmission towers. Deng et al. [2] studied the dynamic characteristics and wind-induced vibration response of a tower-line system using wind-tunnel tests. Huang et al. [3] performed a numerical simulation and wind tunnel test of a transmission tower and compared the results of the test and simulation using the gust loading factors and gust response factors. The response and failure modes of transmission towers can be effectively predicted using nonlinear finite element analysis [4,5]. Zhang and Xie [6] used nonlinear buckling and dynamic analyses to evaluate the ultimate bearing capacity and vulnerable parts of a transmission tower. In the finite element analysis of transmission towers, more accurate results can be obtained by considering the coupling effects of the transmission tower and lines. Yasui et al. [7] simplified a transmission line as a truss element and studied the wind-induced vibration responses of different transmission towers. Battista et al. [8] calculated the response and stability of a transmission tower through time-domain and frequency-domain analyses.
Transmission towers are often affected by uncertain factors during their operation; therefore, it is more meaningful to evaluate the carrying capacity of transmission towers using probability analysis. The fragility analysis method is widely used to study the seismic performance of structures. Yazdani et al. [9,10] evaluated the seismic performance of plain concrete arch bridges under near-field and far-field earthquakes using an incremental dynamic analysis method. Chen et al. [11] revealed the potential failure modes of concrete gravity dams through incremental dynamic analysis. However, these studies only considered the randomness of seismic waves in their fragility analysis. So, Dolsek [12] conducted incremental dynamic analyses on four-story reinforced concrete frame models considering the uncertainty of the material properties. In recent studies, the probability analysis method has been applied to evaluate the wind resistance performance of transmission towers. Tian et al. [13] conducted fragility analysis of a transmission tower-line system considering the uncertainty of the wind load. Pan et al. [14] analyzed the sensitivity of transmission towers to earthquakes using the stripe analysis method. Fu et al. [15,16,17,18] conducted extensive research on the fragility analysis of transmission towers, proposed an uncertainty analysis method, and observed that deterministic analysis overestimated the wind-resistant performance of transmission towers; moreover, they confirmed that uncertainty analysis is effective in predicting the failure mode of the structure and performed fragility analysis of a transmission tower subjected to wind and rain loads. Based on the above research, we think it is necessary to consider the uncertainty of structure parameters and wind loads when conducting the fragility analysis of a transmission tower.
Research on the wind resistance of transmission towers has been conducted in-depth, but most analyses of transmission towers do not consider the effect of corrosion. As transmission towers are always in an outdoor atmospheric environment, they are vulnerable to atmospheric corrosion [19]. Corrosion causes mass loss and weakens the mechanical properties of steel [20,21], resulting in a decrease in the stability of the transmission tower. Therefore, the effect of corrosion should be considered when analyzing the bearing capacity of transmission towers. The degree of atmospheric corrosion of steel has a quantitative relationship with environmental factors and the chemical composition of steel [22,23,24]. Therefore, the corrosion rate of steel can be predicted according to the measured data. Zhi et al. [25] combined the nonlinear grey Bernoulli model with a genetic algorithm to predict the atmospheric corrosion rate of carbon steels; however, in the field of corrosion prediction, artificial neural network has broad application prospects. Song et al. [26] constructed four models to predict the corrosion rate of carbon steel in a dynamic atmospheric corrosion environment. Mohammed et al. [27] predicted the corrosion rate of medium carbon steel using an artificial neural network. In addition to the above research, the artificial intelligence algorithm can also be applied to the sensitivity analysis of steel corrosion. Li et al. [28] combined the mean impact value algorithm and back-propagation (BP) artificial neural network to evaluate the factors affecting the soil corrosion rate of Q235 steel. Cai et al. [29] conducted a sensitivity analysis of steel under atmospheric corrosion using an artificial neural network. Halama et al. [30] evaluated the effect of the SO2 concentration on the atmospheric corrosion rate of carbon steel using an artificial neural network. Therefore, we think that the corrosion of steel can be accurately predicted if appropriate influencing factors can be selected.
Generally, strong winds are the main reason for the collapse of transmission towers, and steel corrosion is a hidden danger that affects their stability. However, the existing research did not give enough consideration to corrosion. Therefore, it is necessary to analyze the wind-resistant performance of transmission towers considering corrosion. In this paper, a method for evaluating the wind resistance of a transmission tower based on corrosion prediction and fragility analysis is proposed for the first time, and an uncertainty analysis of the collapse of a 220 kV transmission tower under the coupling effect of corrosion and strong wind is performed, which provides a valuable reference for the wind-resistant design of high-voltage transmission towers.

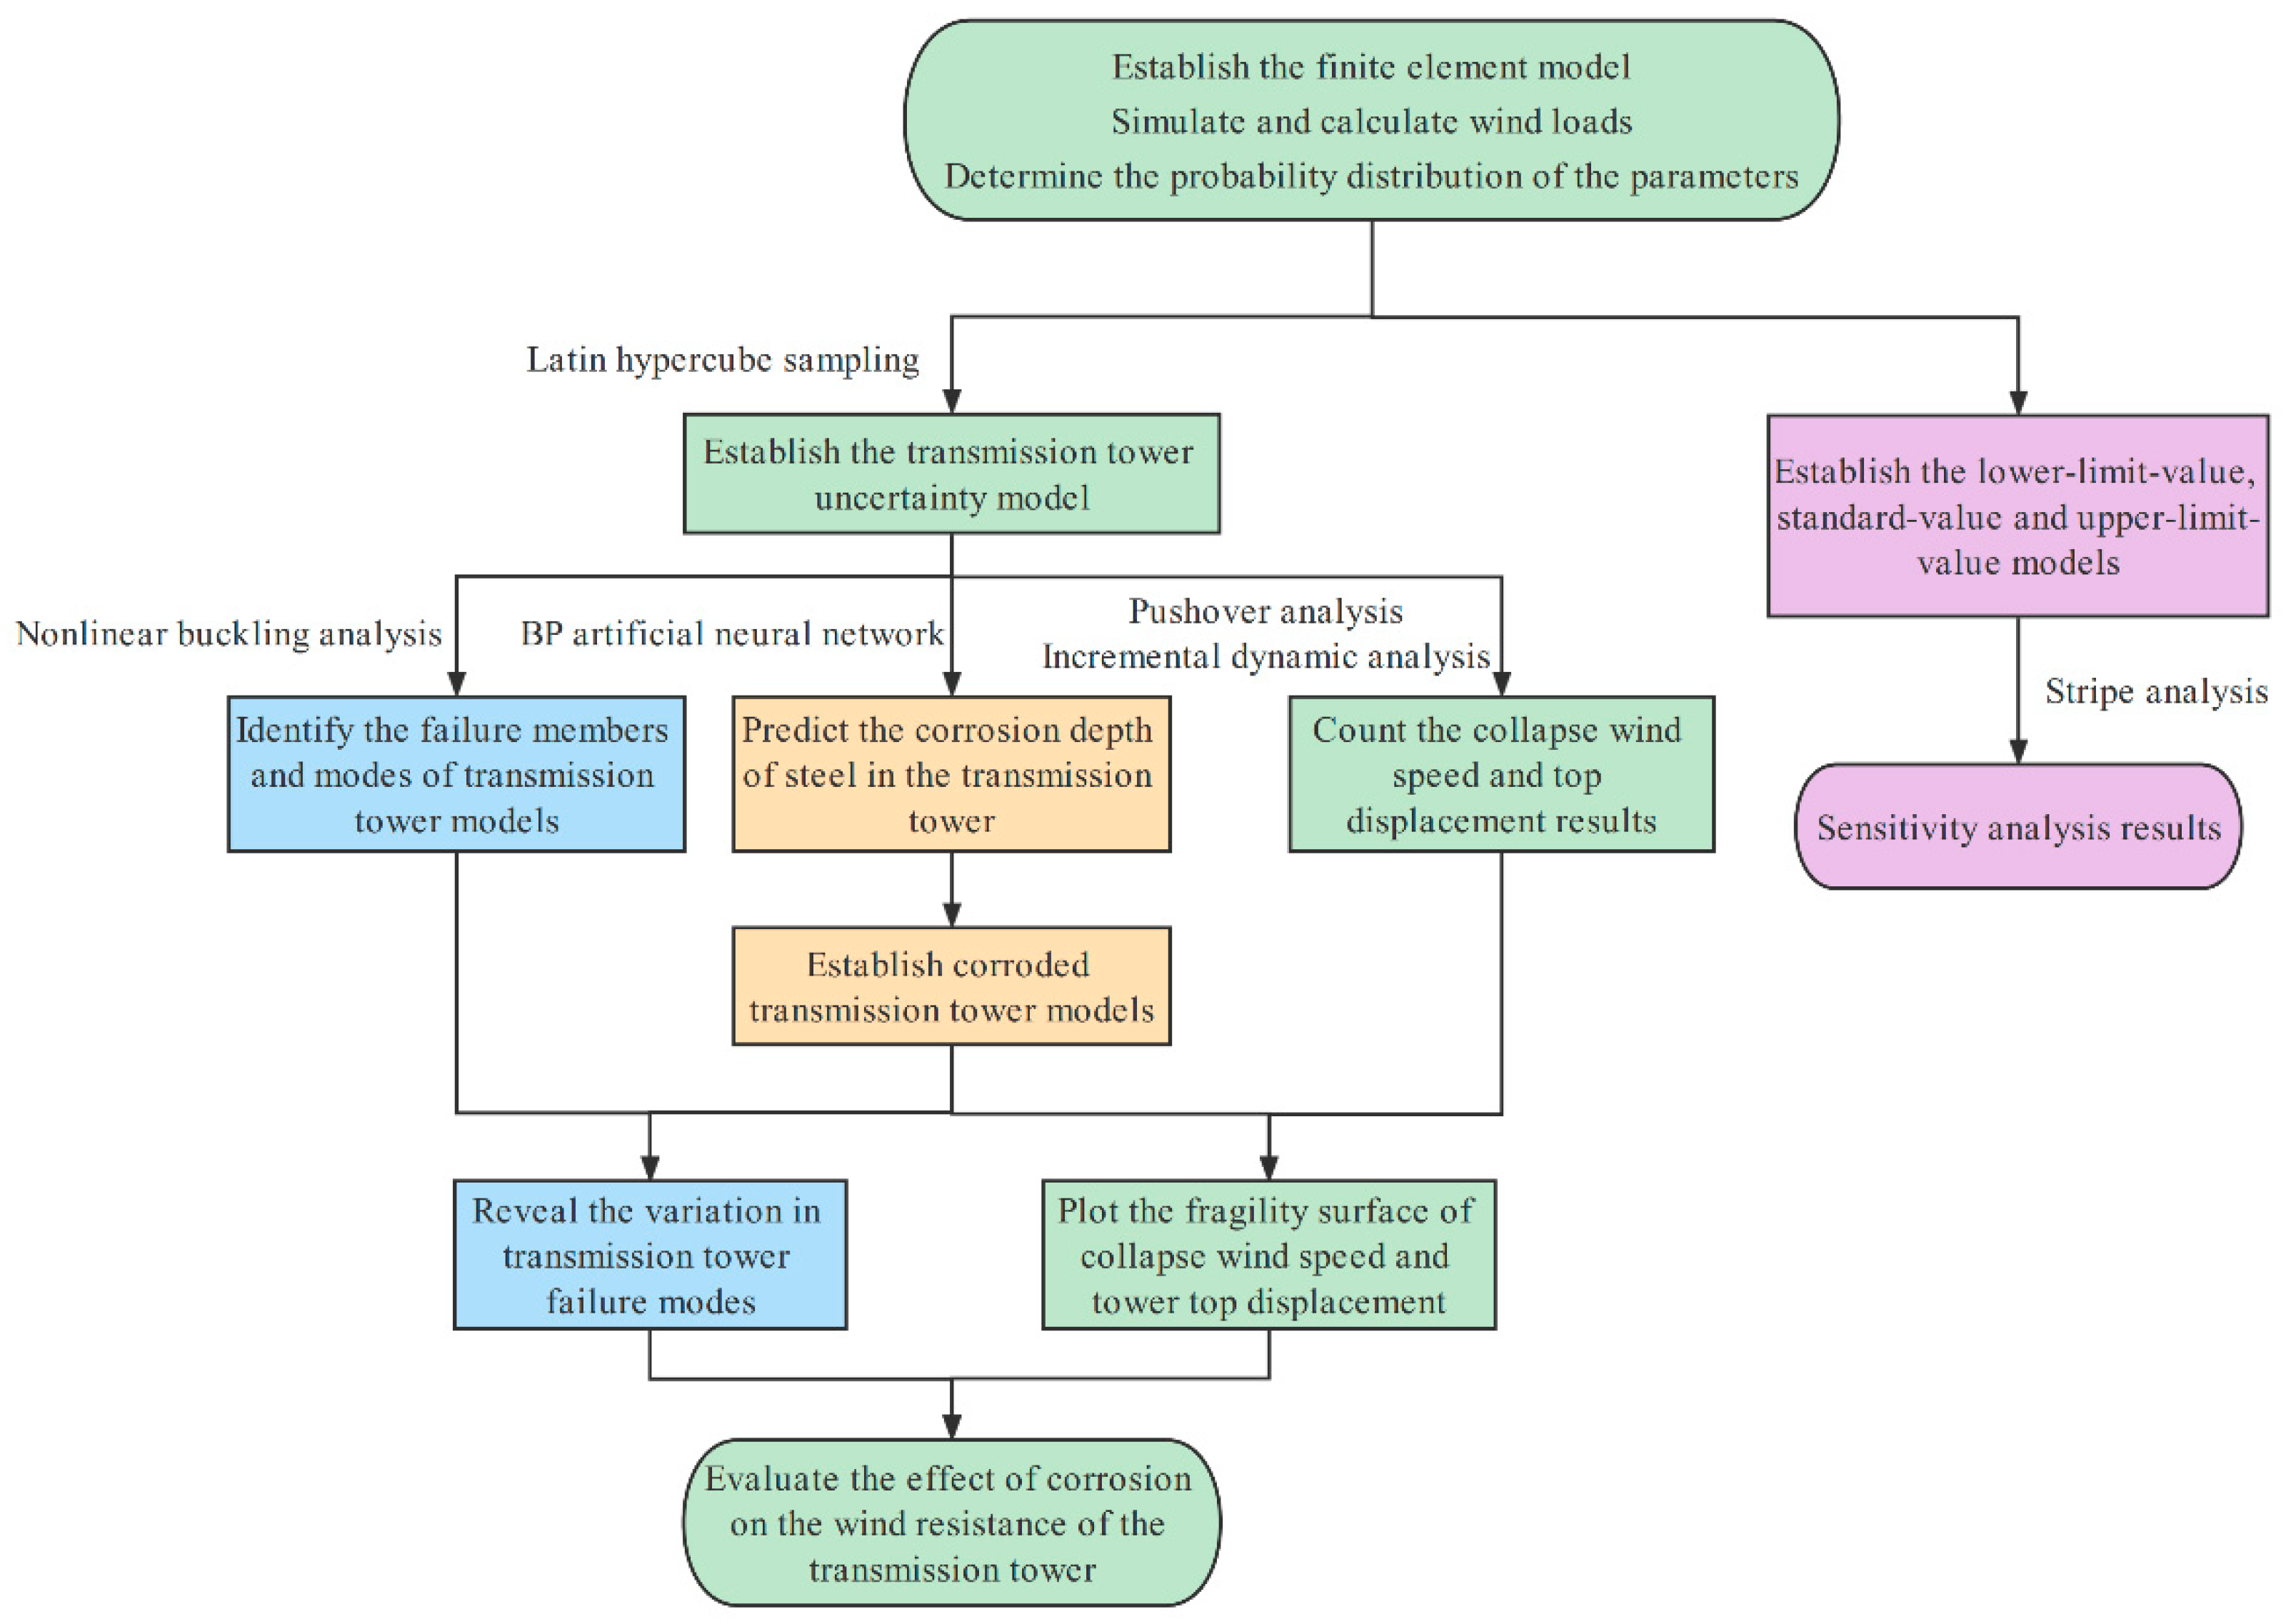
2. Probabilistic Evaluation Method for Wind Resistance of a Transmission Tower

The effect of corrosion on the wind resistance of transmission towers has not been considered in most studies. Therefore, in this paper, a method is proposed to evaluate the wind performance of a transmission tower by considering the effect of corrosion. As shown in Figure 1, the method is based on probability analysis and considers the uncertainty of the structural parameters of the transmission tower. The evaluation method includes three parts. First, after determining the probability distribution of parameters, a sensitivity analysis of the transmission tower is performed to obtain the collapse wind speed range of the structure and evaluate the impact of various parameters on the wind-resistant performance of the transmission tower. Subsequently, the Latin hypercube sampling method is used to sample each parameter, and the uncertainty models of the transmission tower are established. The fragility curves of the collapse wind speed and tower top displacement are obtained using pushover and incremental dynamic analyses, and the distribution of initial failure members in the transmission tower is obtained using nonlinear buckling analysis, which provides a comprehensive probabilistic assessment of the wind resistance performance of the transmission tower in the initial state.
Based on the existing measured steel corrosion data, the corrosion depth prediction models of steel are obtained using a BP artificial neural network, and corroded transmission tower models are established. Combined with the above analysis methods, the corresponding fragility surfaces are obtained, and the variation rules for the failure modes and members of the transmission tower are identified. Based on the analysis results, the impact of corrosion on the wind-resistant performance of the transmission tower is evaluated.

3. Sensitivity Analysis of the Tower-Line System under Wind Loads

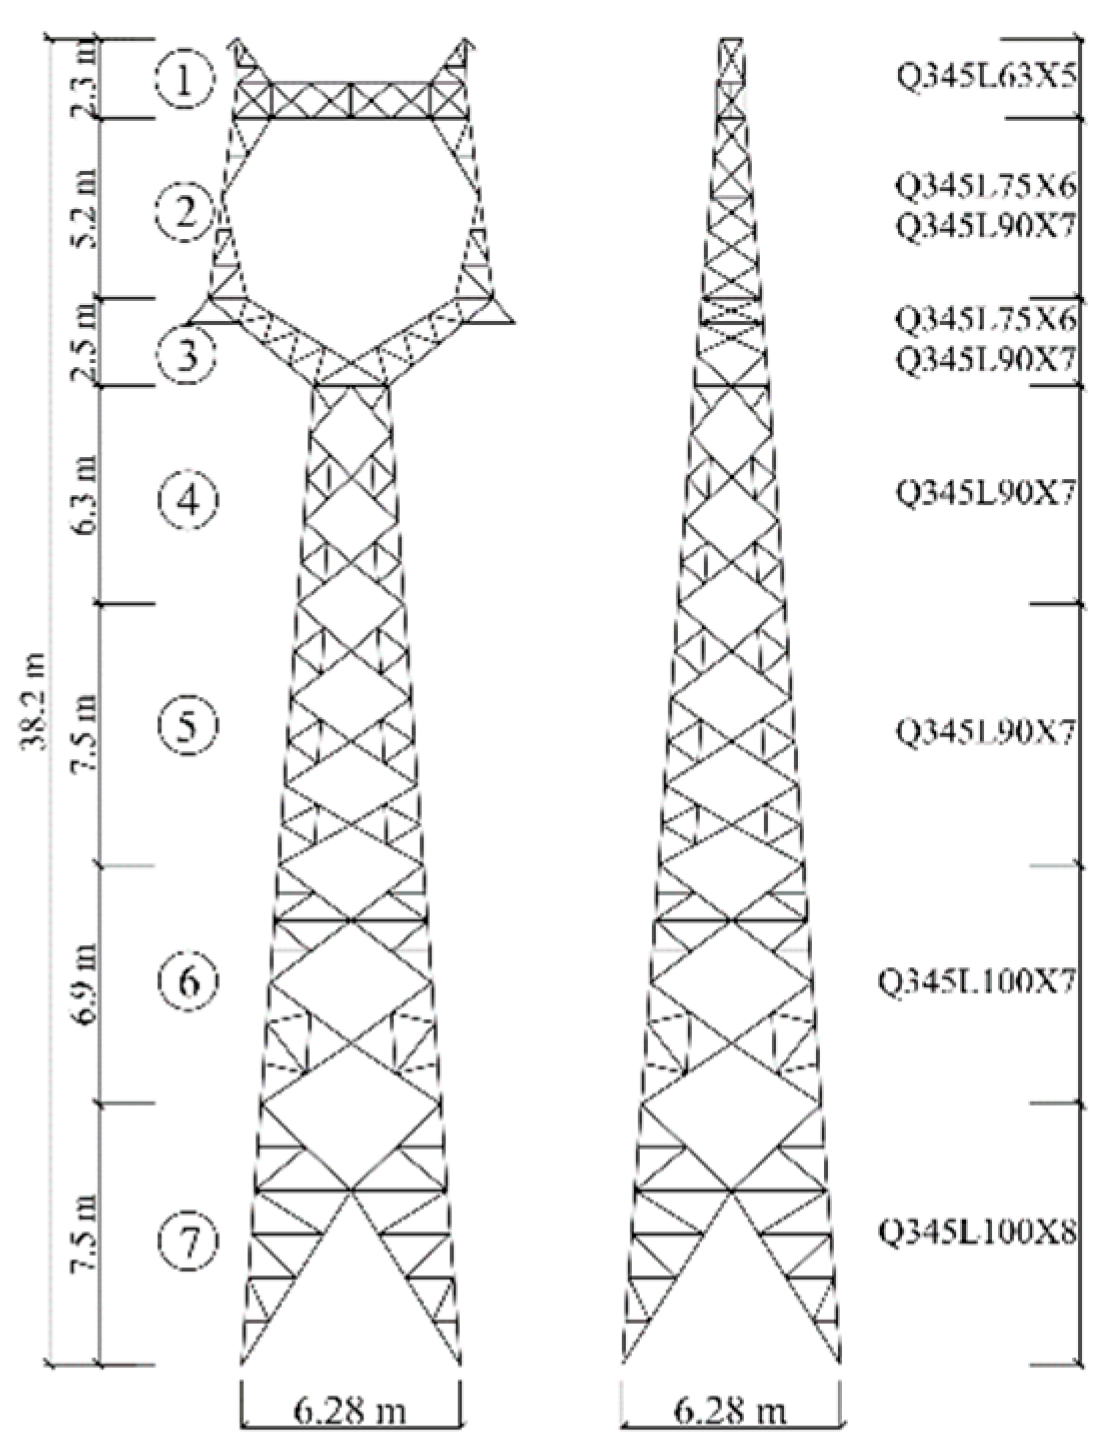
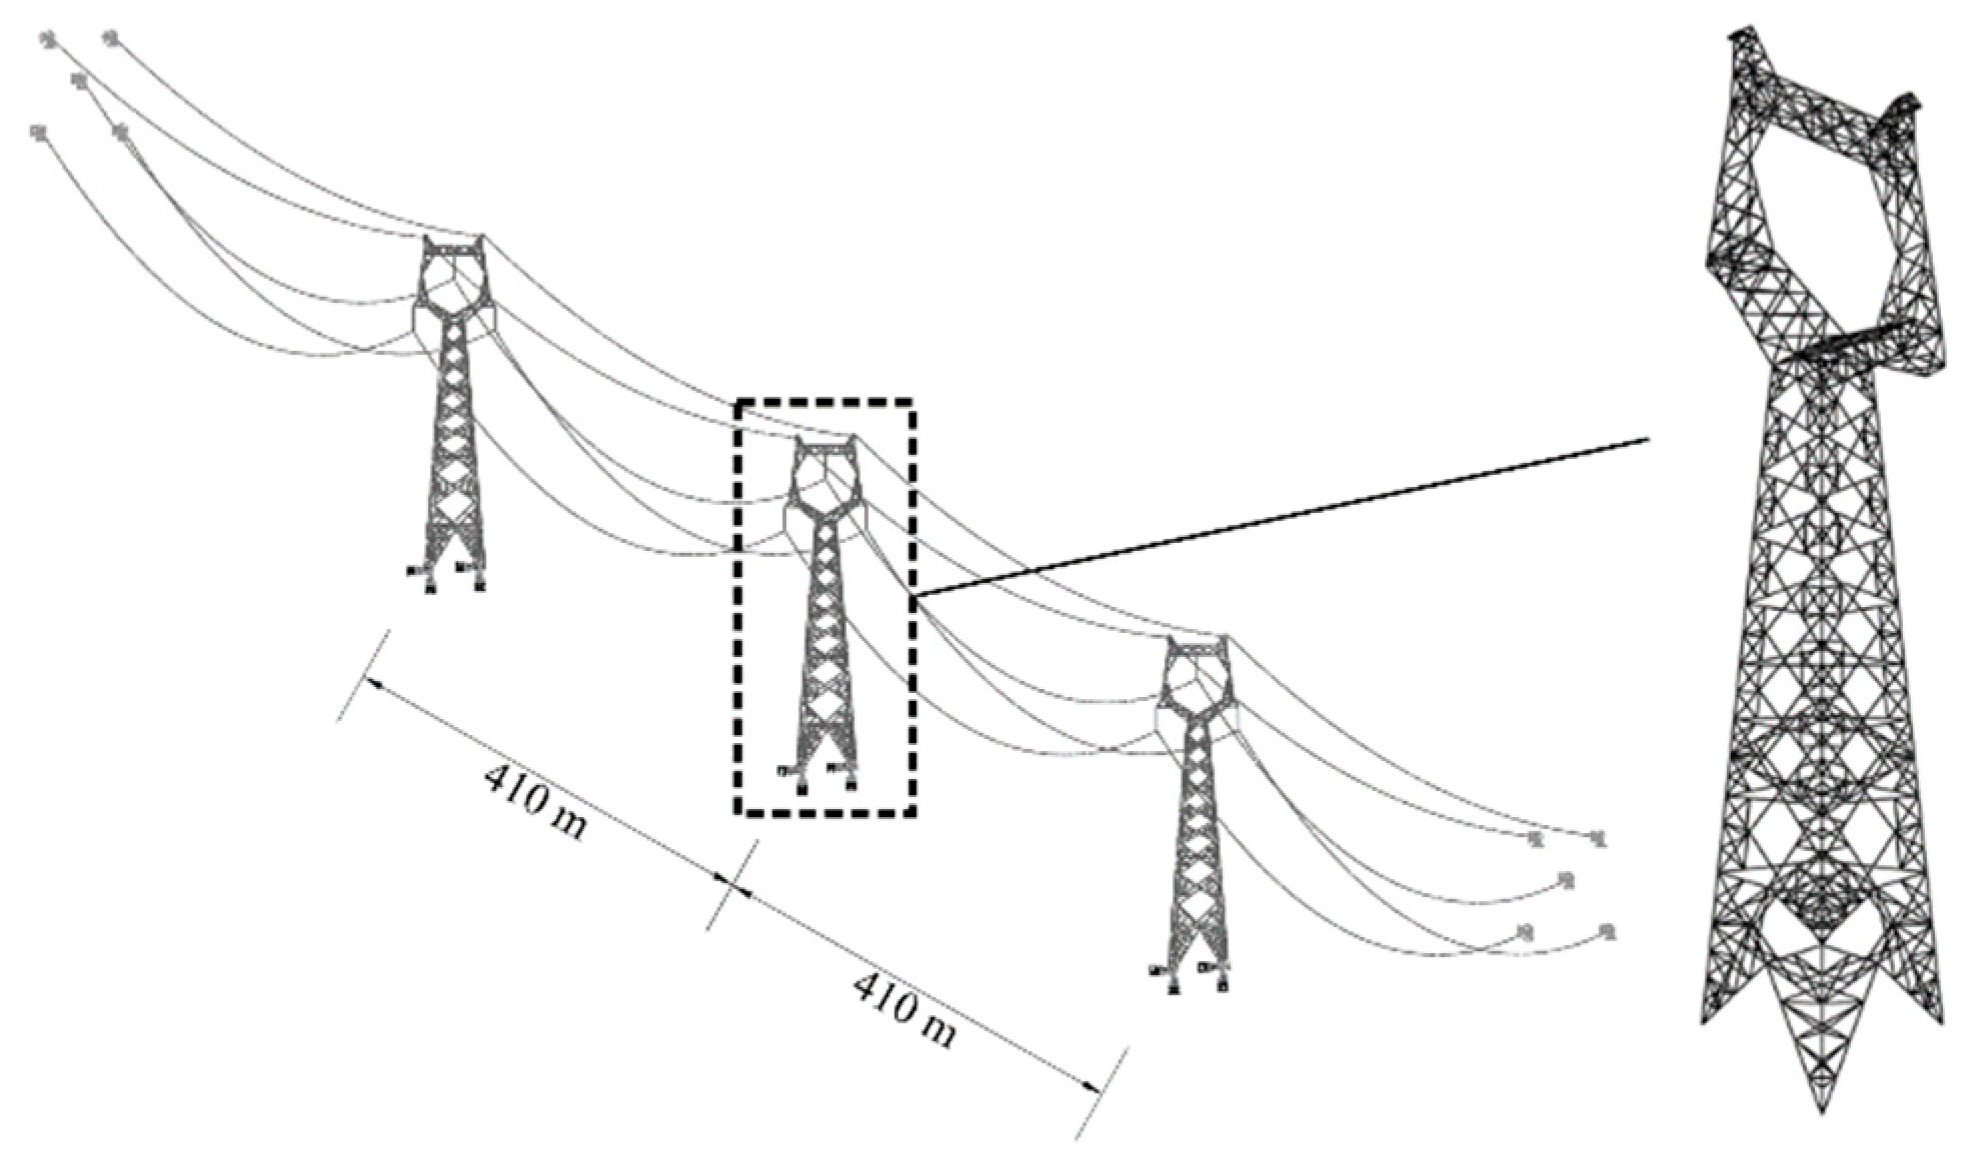
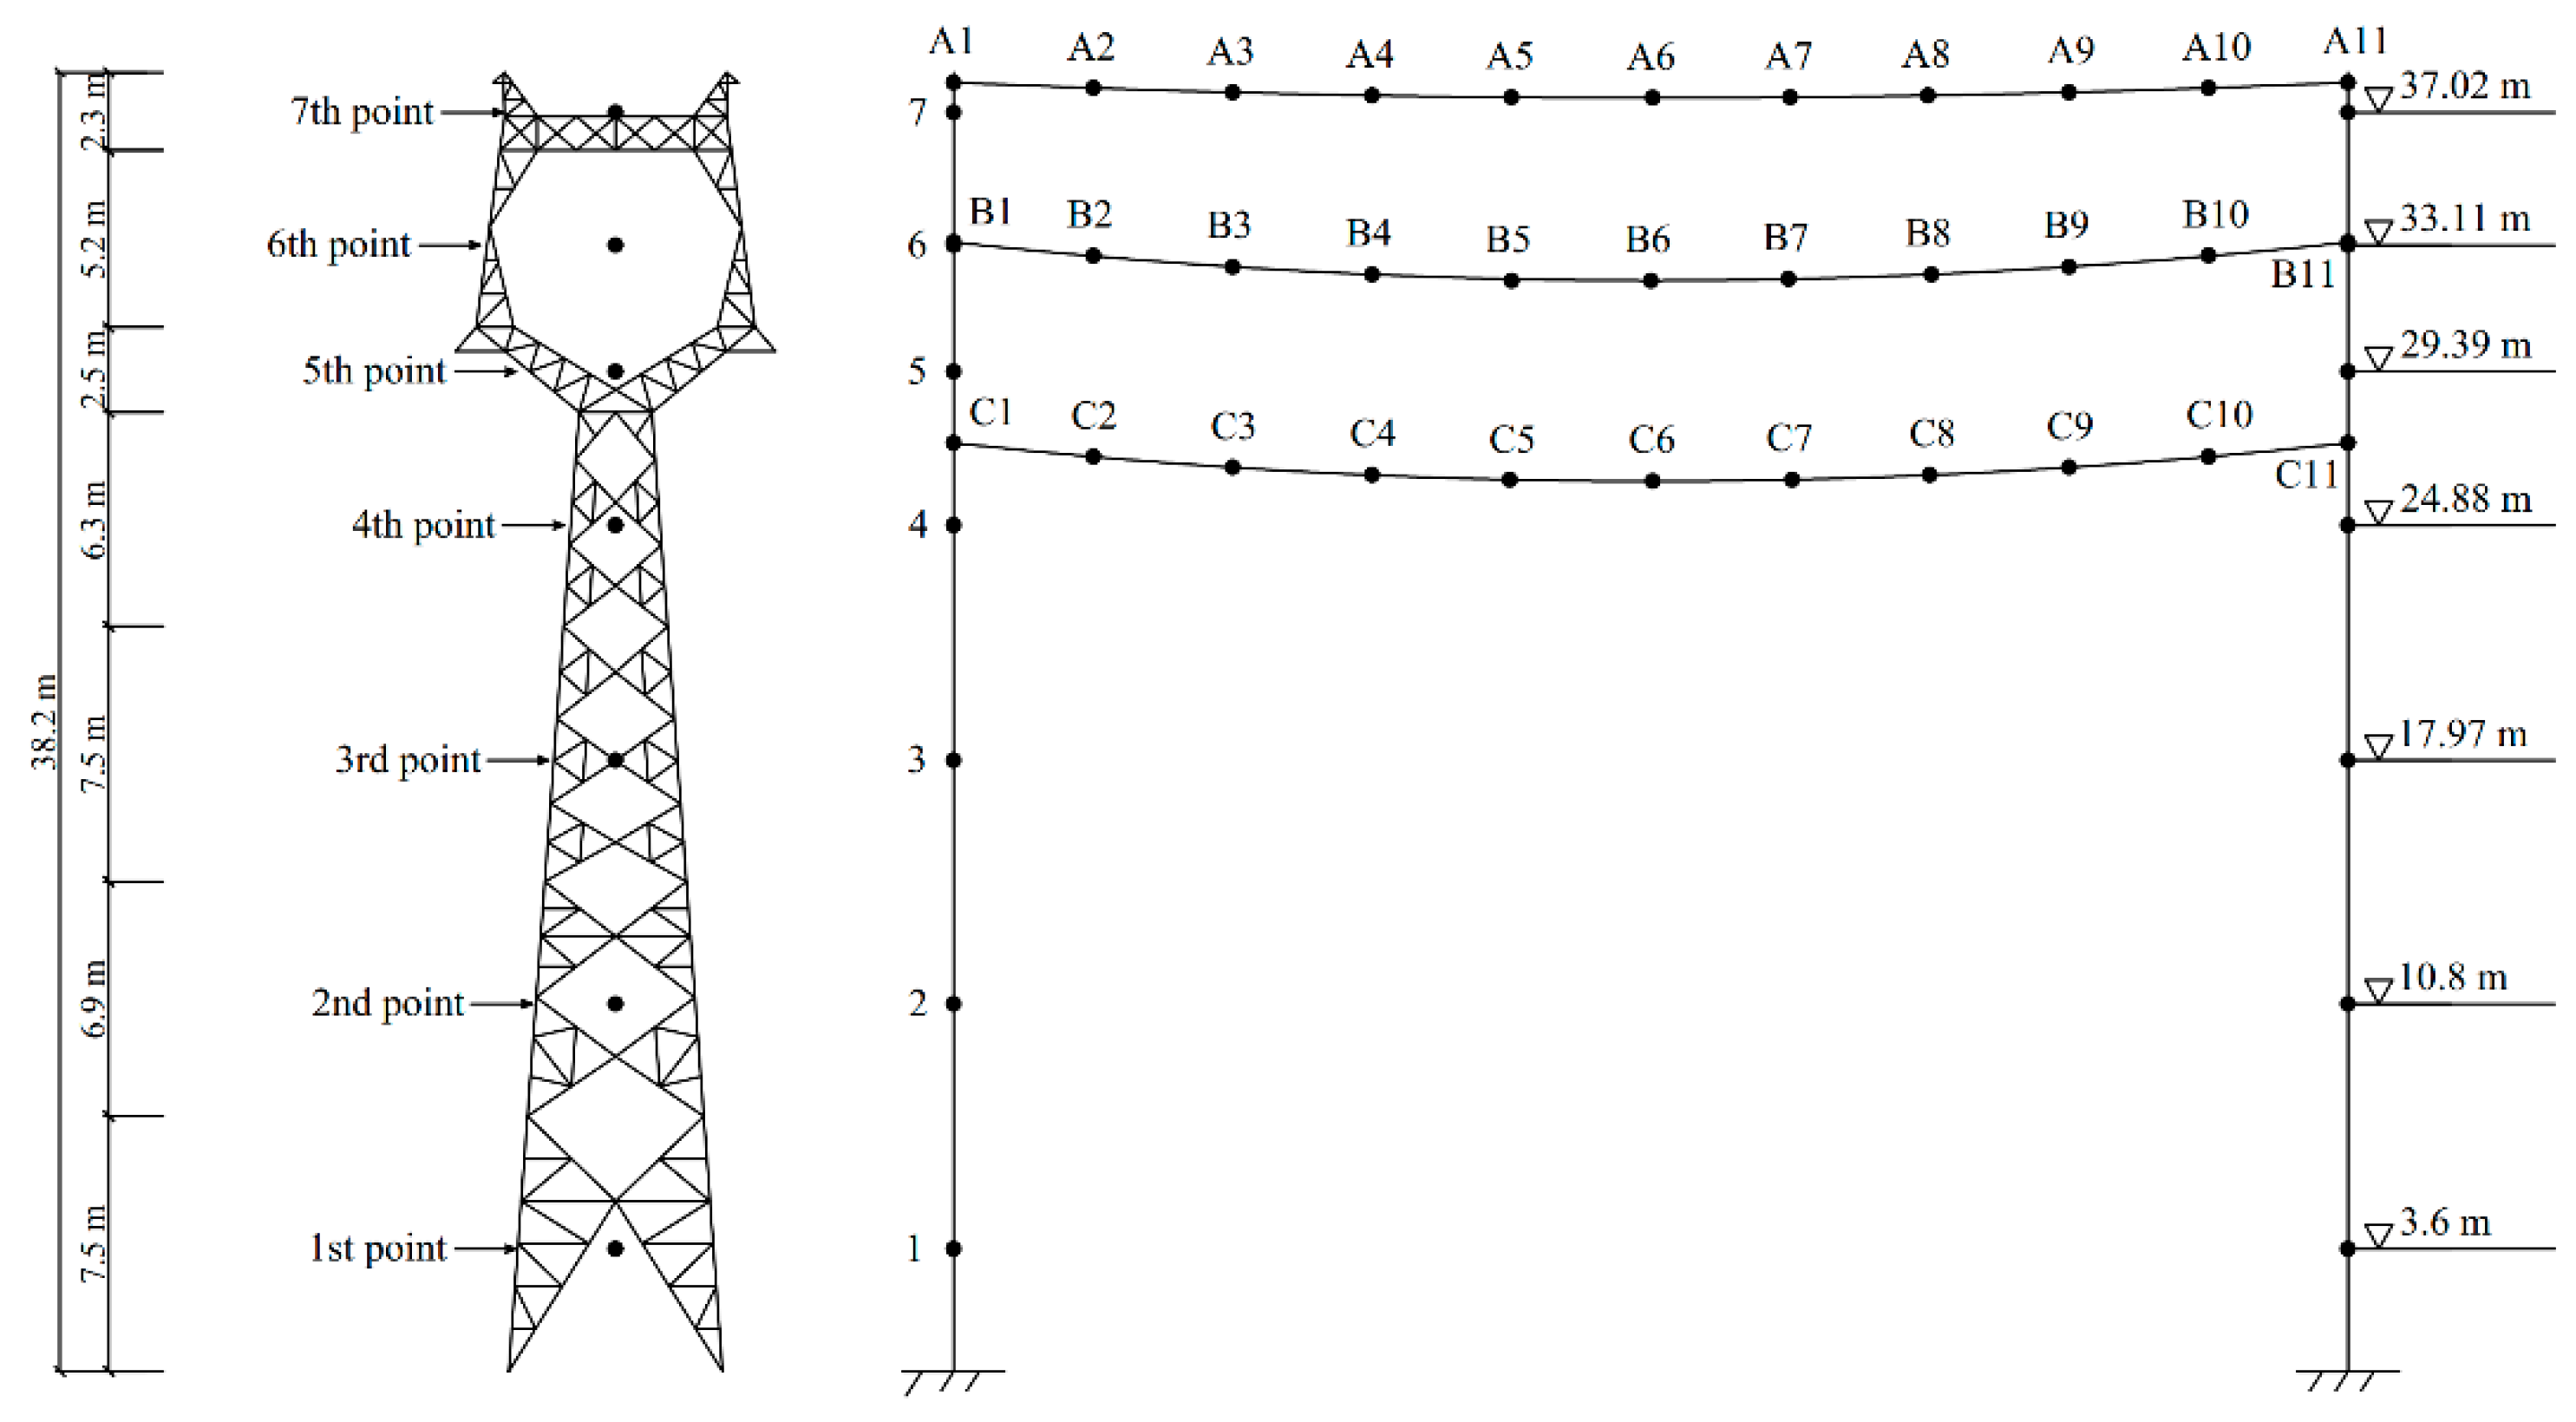
3.1. Finite Element Model

A latticed 220 kV transmission tower was investigated in this study. The nominal height was 30 m. The parameters of the conductor and the ground wire are listed in Table 1. The horizontal span was 410 m. The tower members were composed of Q235 and Q345 angle steels. The segmentation of the tower and parameters of the main leg members are shown in Figure 2.
The finite element models of the transmission tower and tower line system were established using the Abaqus 2020 software. The B31 element was used to simulate the tower members, and the T3D2 element was used to simulate both the transmission line and the insulator. Fixed constraints were applied to the bottom of the transmission tower. Hinge restraints were used at the ends of the transmission line and at the connection of the insulator to the transmission tower and conductor. A bilinear isotropic hardening plasticity model was used to simulate the constitutive model of the steel material, as shown in Figure 3. The finite element model of the structure is shown in Figure 4. The modal analysis results of the transmission tower were as follows: the first-order natural frequencies of lateral bending (the direction perpendicular to the transmission line), longitudinal bending (the direction parallel to the transmission line), and torsion were 2.095, 2.107, and 4.856 Hz, respectively.

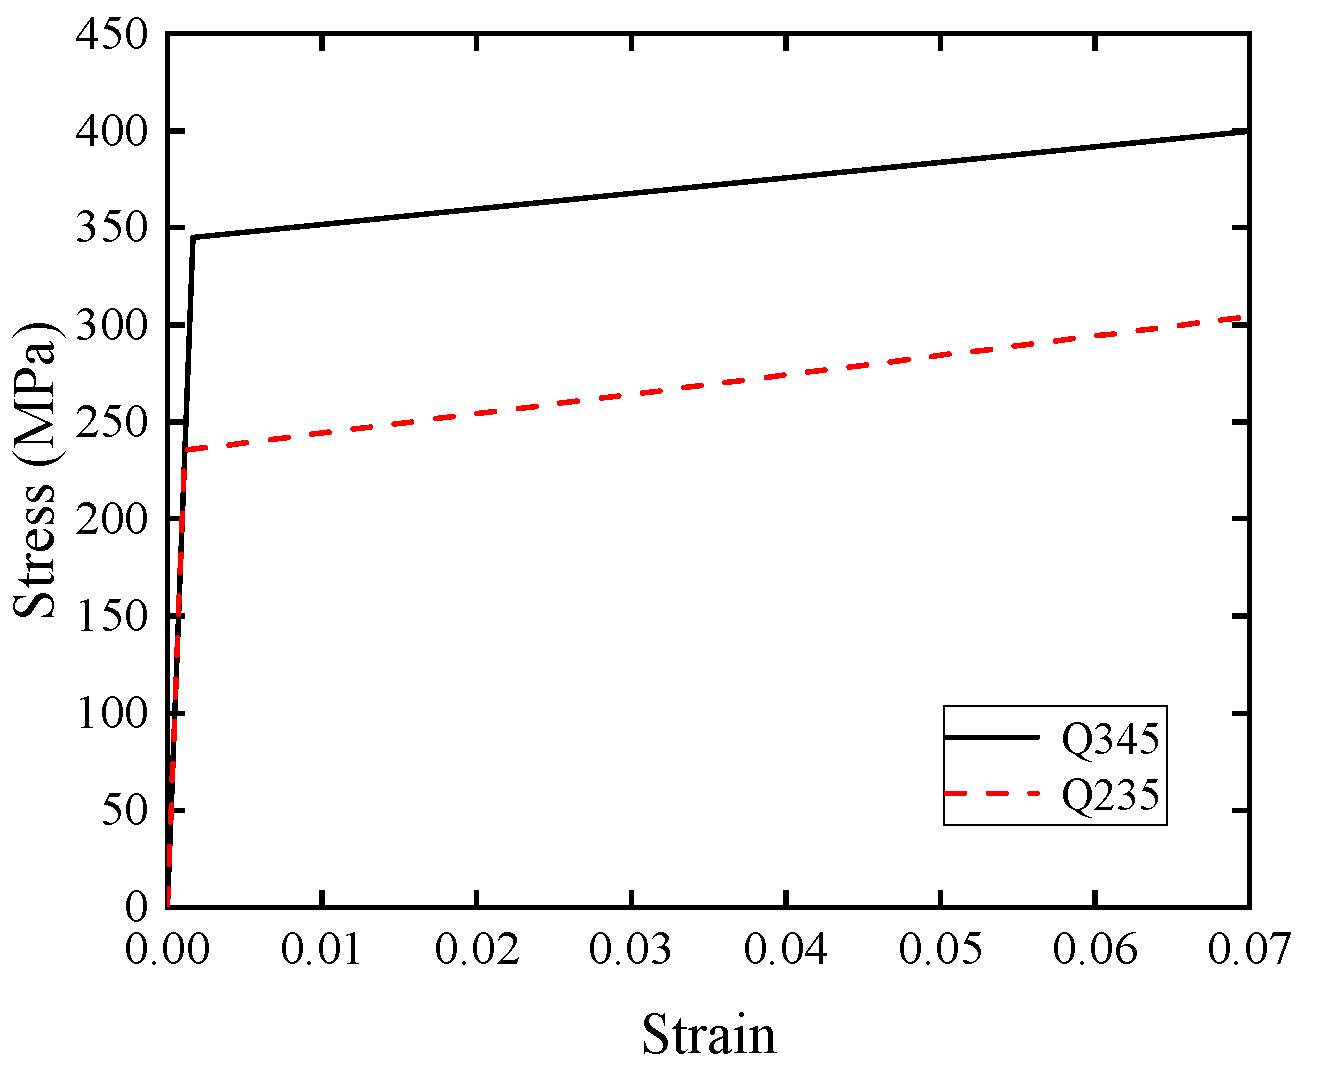
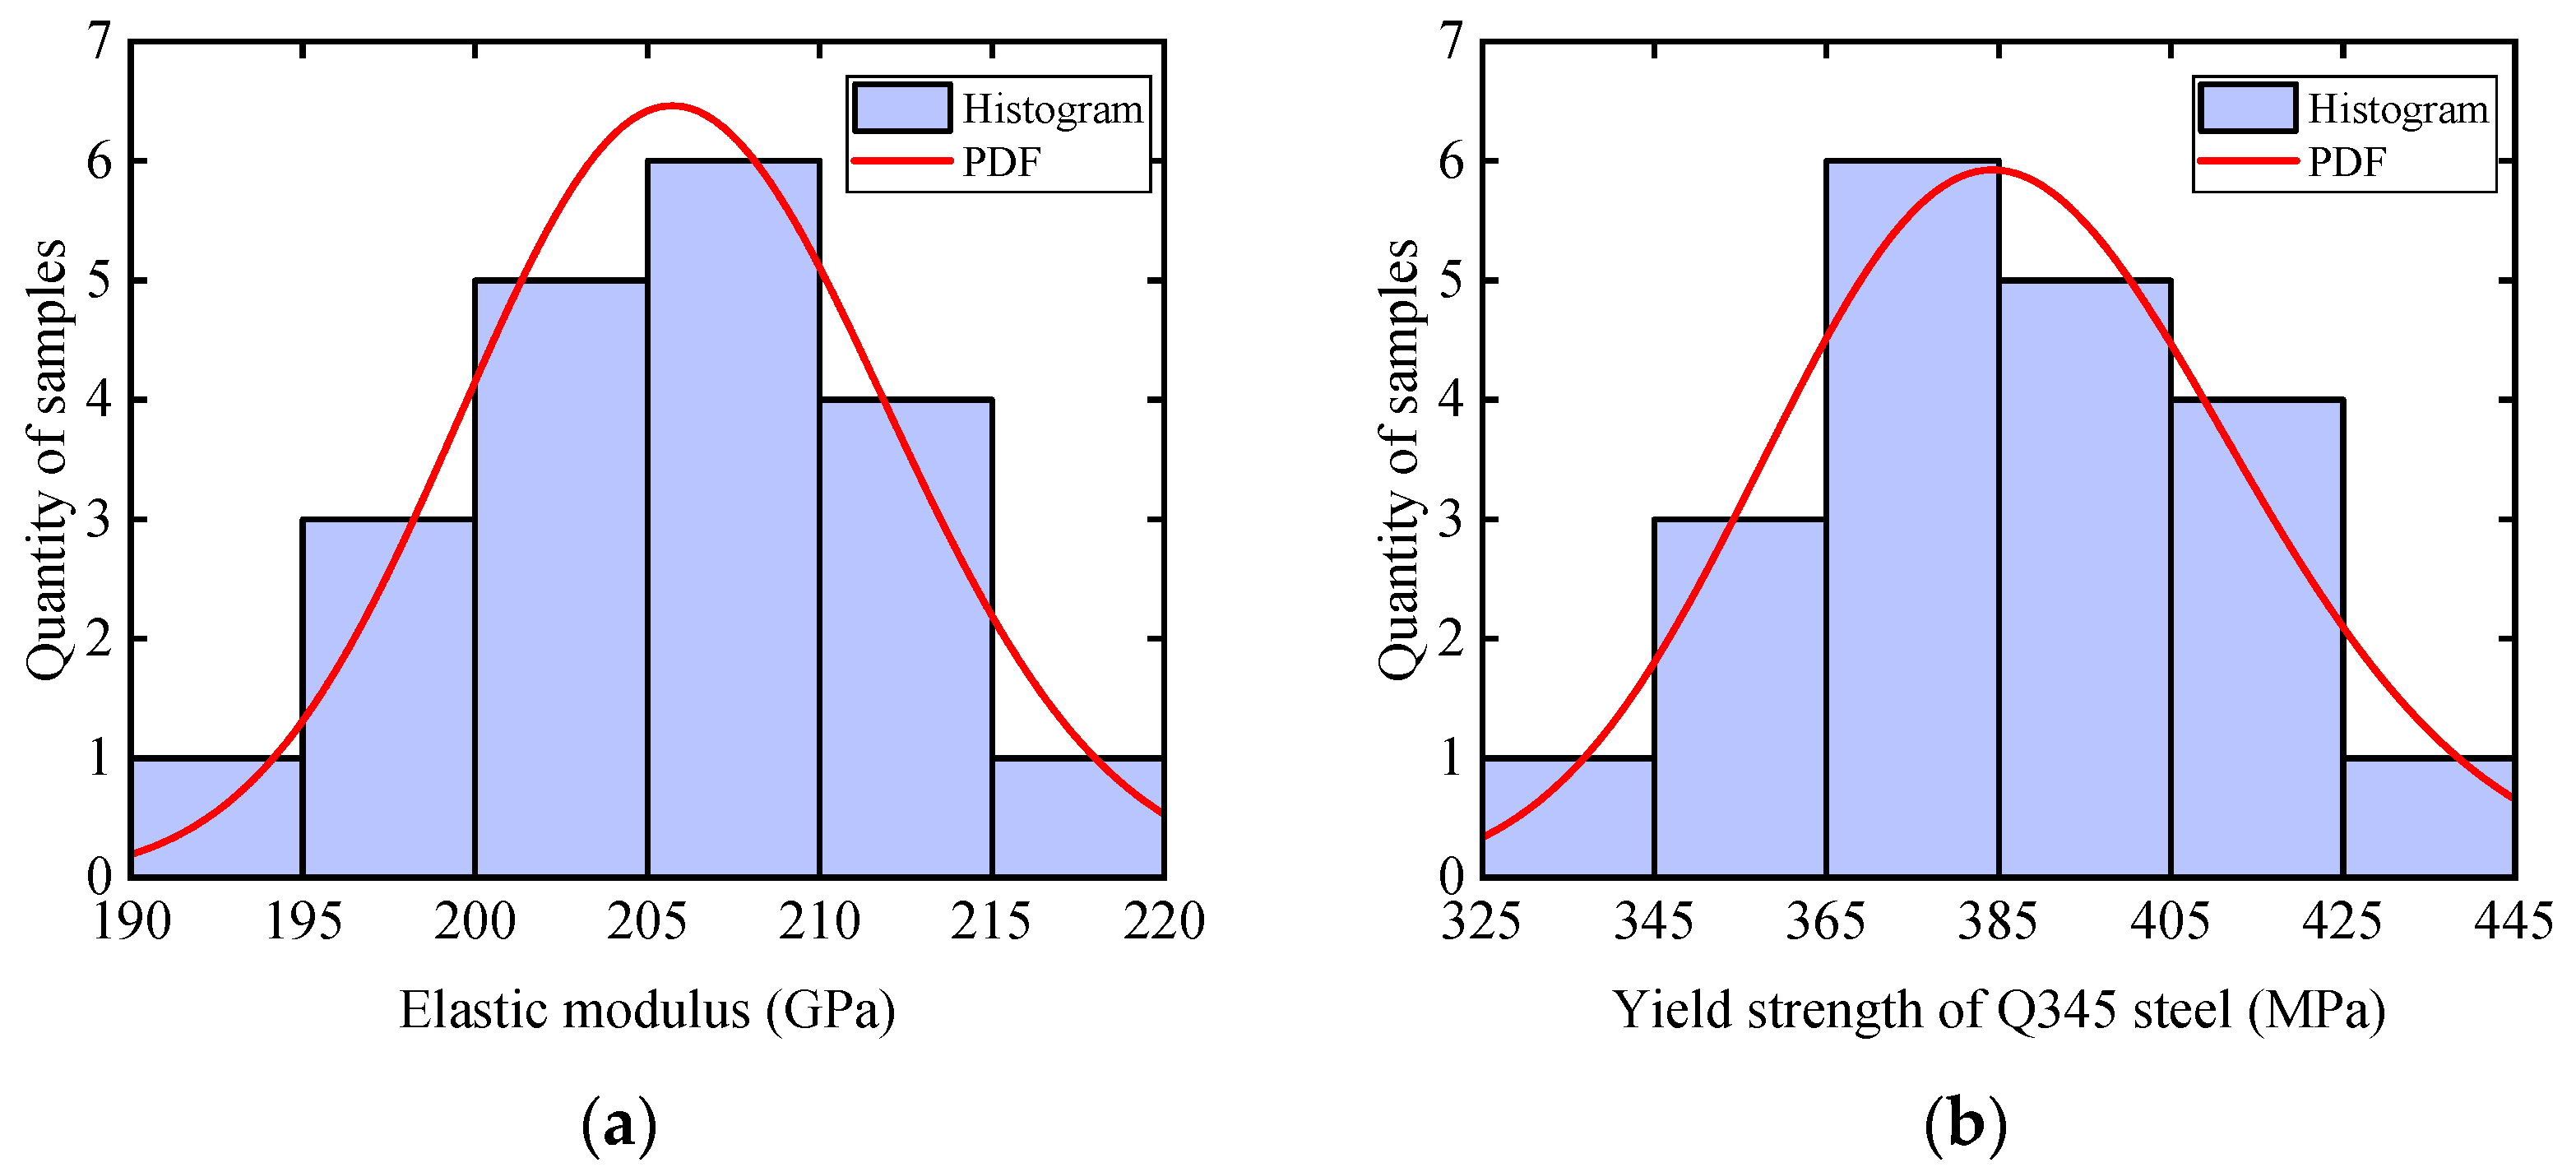
3.2. Uncertainty of Material and Geometric Parameters

Transmission tower members are inevitably affected by external factors during their production and transportation, resulting in random variations in their parameters, which also affects the wind-resistant performance of transmission towers. Therefore, in this study, the uncertainty of the six parameters in the structure was considered based on existing research [15]. The material property parameters included the yield strength of Q235 steel, yield strength of Q345 steel, elastic modulus, and Poisson’s ratio. The geometric parameters included the width and thickness of the angle steel. The probability distributions of different parameters are listed in Table 2. According to the unified standard for the reliability design of building structures [31], the standard values of the elastic modulus and Poisson’s ratio took the 0.5 quantile value of the probability distribution, and the standard values of material strength took the 0.05 quantile value of the probability distribution. Therefore, the mean value of each material-property parameter was obtained. The mean values of the geometric parameters were obtained from the statistical results of relevant research [32]. In addition, the mean value of the geometric parameters in Table 2 was equal to that of the measured results divided by the standard value.
Considering that the calculation cost of the fragility analysis for multiple groups of transmission tower models with different corrosion degrees was relatively large, the sample size in this paper was determined to be 20 based on relevant research [13], and the accuracy of analysis can be evaluated as follows [33]:
N > ln 1 K P f
where K is the confidence level, P f is the failure probability, and N is the sample size. By calculation, the accuracy of probability analysis in this paper is close to 90%.
The above parameters were sampled using the Latin hypercube sampling (LHS) method, which has an advantage over Monte Carlo sampling in that the sampling effect is good even when the sample size is low. LHS is a stratified sampling method, that is, the research object is divided into multiple parts with equal probability, and then the sample proportion is determined according to the sample size, and each part is sampled according to this proportion [34]. The sampling results are shown in Figure 5. Uncertainty models of the transmission tower were established based on the sampling results.

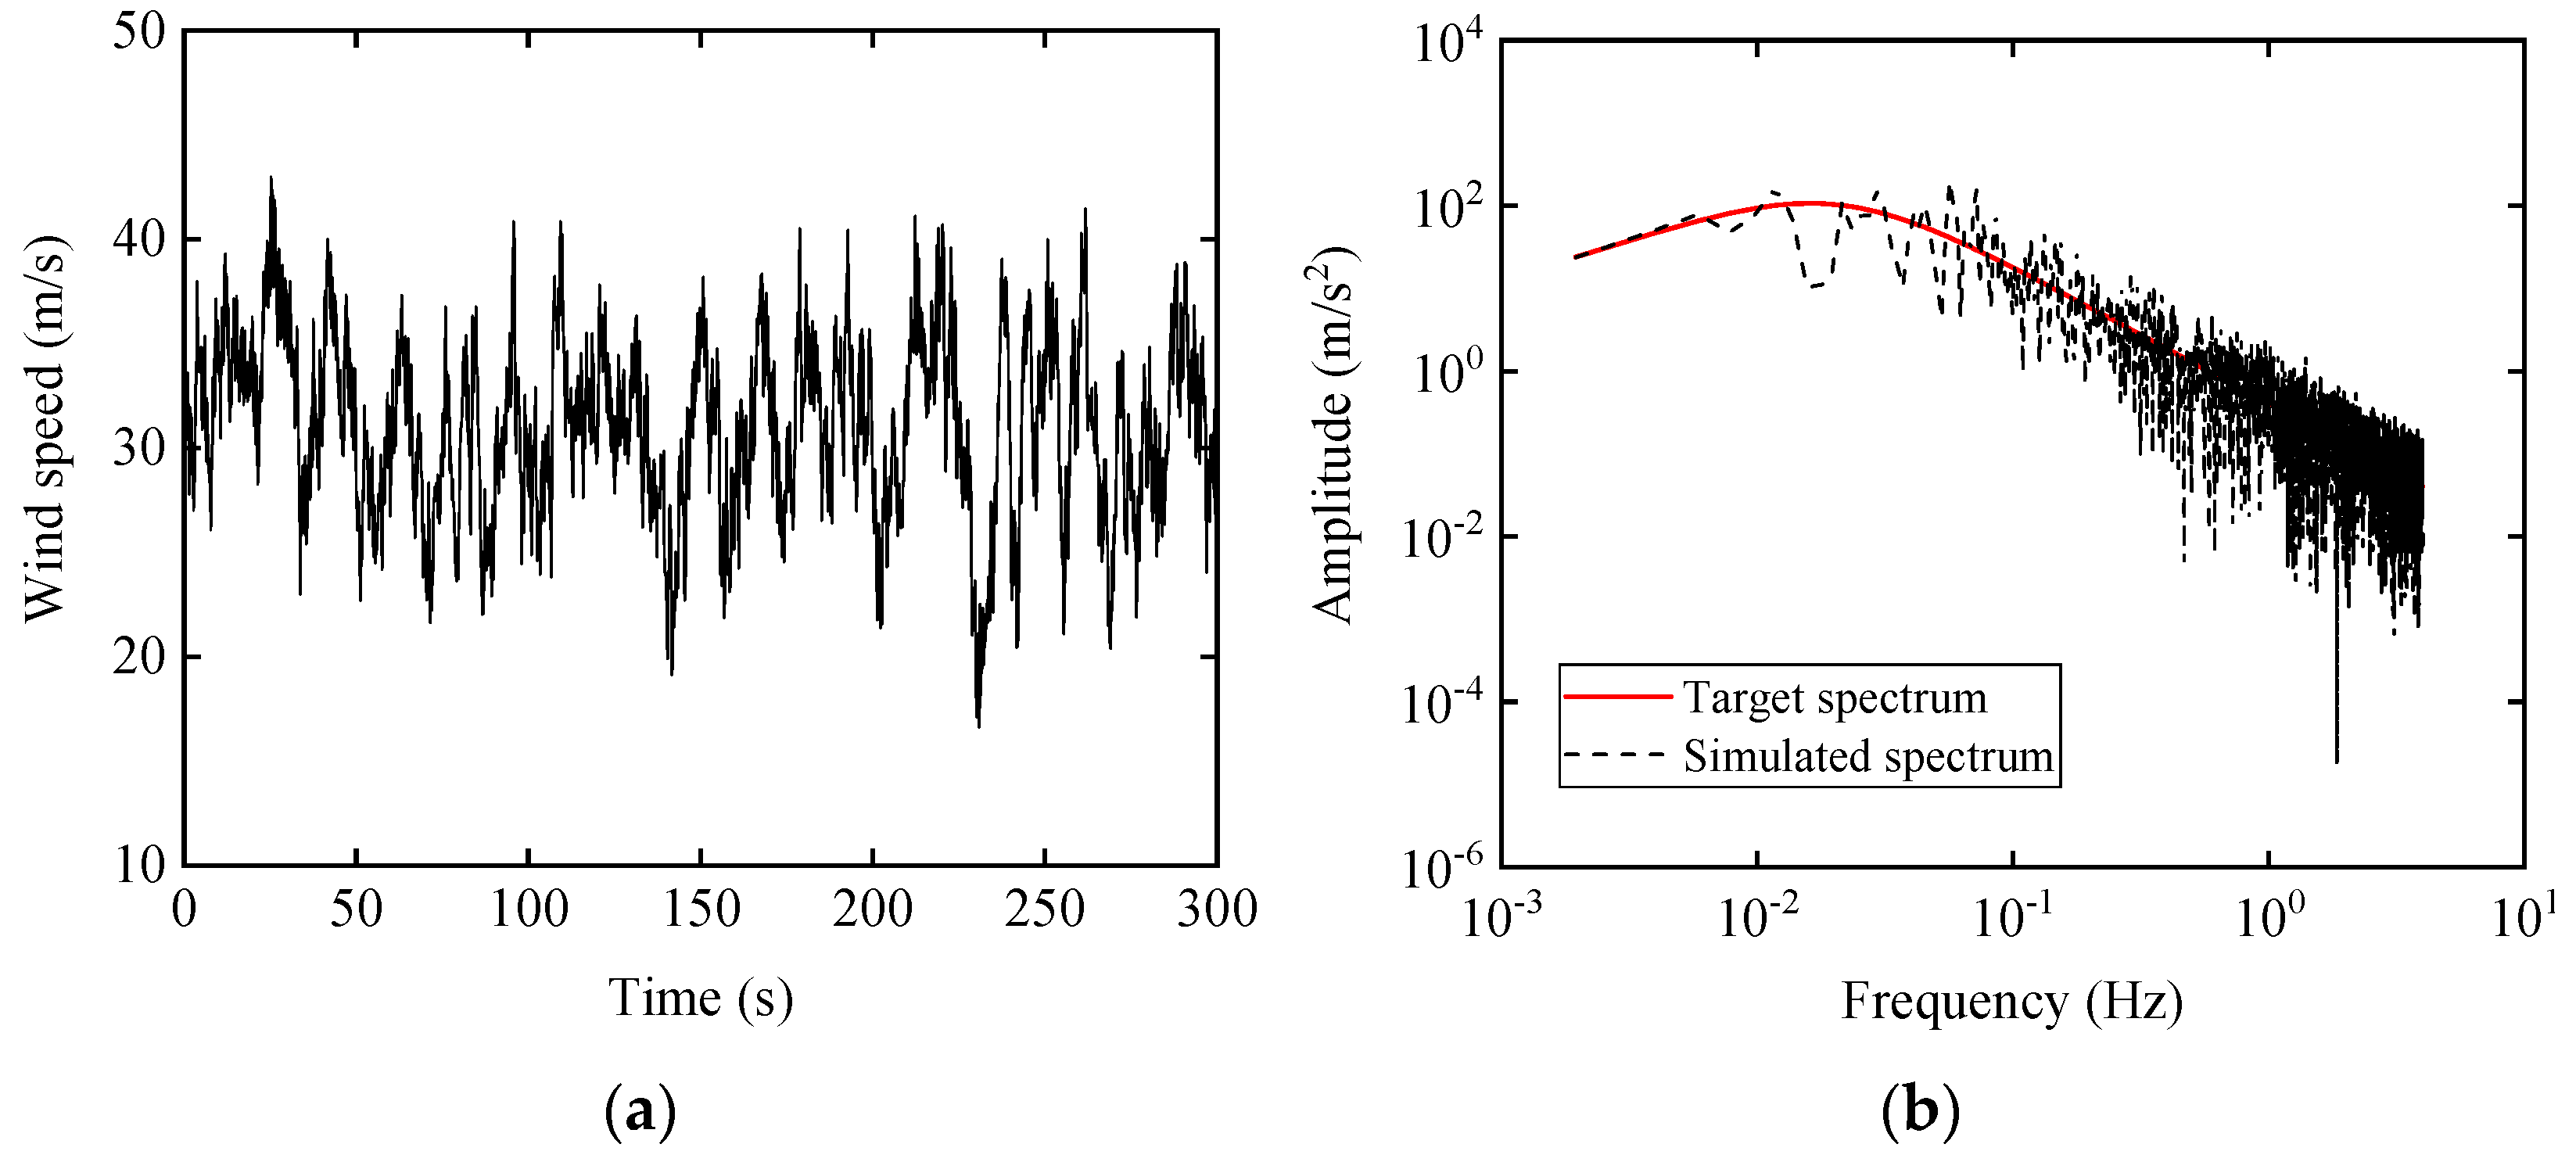
3.3. Simulation of Wind Load

The simulation of the wind load on a structure is the basis of nonlinear dynamic analysis. The transmission tower was divided into seven panels vertically, and the transmission line was divided into ten parts longitudinally. The simplified wind load points of the tower-line system are shown in Figure 6.
Atmospheric boundary-layer wind consists of static and fluctuating winds. The static wind speed was calculated according to the exponential law, and the fluctuating wind speed with the Davenport spectrum was simulated using the harmonic superposition method. The harmonic synthesis method uses spectral decomposition and trigonometric series superposition to realize the numerical simulation of random process samples [17]. The total time of the wind speed time series was 300 s. The time interval was 0.125 s, and the cutoff frequency was 4 Hz. Taking a basic wind speed of 25 m/s as an example, the wind speed at the top of the tower is shown in Figure 7a. In addition, Figure 7b shows that the simulation spectrum was consistent with the target spectrum, indicating that the simulated wind speed can be used for nonlinear dynamic analysis.

3.4. Sensitivity Analysis

Different material and geometric parameters have different degrees of impact on transmission towers. Using the basic collapse wind speed of the transmission tower as the criterion, the lower-limit-value, standard-value, and upper-limit-value models of the tower-line system were established. The strip analysis method is widely used in the sensitivity analysis of structures under earthquake [14], so in this paper, we studied the sensitivity of the transmission tower under wind load using this method.
The lower and upper limit values of each parameter were taken as the 0.05 and 0.95 quantiles of its probability distribution, respectively. To better reflect the impact of each parameter on the transmission tower, according to the control variable method [34], we changed only one parameter of the structure, and the other parameters still had their standard values when the model was established. The most unfavorable wind incidence angle for this tower was 90° (the direction perpendicular to the transmission line); therefore, the response of the transmission tower at this wind incidence was selected for research.
Multiple basic collapse wind speeds can be obtained by an extensive dynamic analysis of the models, and the log mean and log-standard deviation of the collapsed wind speeds for each group of models can be calculated using the maximum likelihood estimation method:
μ ^ = 1 n i = 1 n ln X i σ ^ 2 = 1 n   i = 1   n ln X i - 1 n i = 1 n ln X i 2    
where μ ^ and σ ^ are the maximum likelihood estimators of the parameters in the lognormal distribution. The results of stripe analysis for the standard-value model are shown in Figure 8. The log mean and log-standard deviation of the basic collapse wind speeds for the standard-value model were 3.412 and 0.0397, respectively.
The log mean interval of the basic collapse wind speed corresponding to each parameter is shown in Figure 9a. The vertical dotted line represents the log-mean value of the collapsed wind speed of the standard value model, the end of each bar represents the analysis result of the lower- or upper-limit-value model, and the length of the bar reflects the impact level of its corresponding parameter on the basic collapse wind speed of the transmission tower. The bar length of the angle steel thickness was the largest, as shown in Figure 9a, indicating that the angle steel thickness had the greatest impact on the collapsed wind speed when the tower was in operation. The yield strength of Q345 steel and elastic modulus also had a significant effect on the collapse of the transmission tower. The width of the angle steel had a slight effect on the wind-resistant performance of the tower because the measured values of the angle steel width were close to the standard value according to the statistical results of the relevant research [32]. The bar length of the yield strength of Q235 steel was the minimum, which was due to the stress and deformation of the diagonal members of the transmission tower in this paper were relatively small. However, the results will be different for transmission towers with large stress on diagonal members.
The log-standard deviation reflects the dispersion degree of the collapsed wind speed results. Figure 9b shows that the change in geometric parameters reduced the log-standard deviation of the collapsed basic wind speeds, which meant that the collapsed basic wind speed of the transmission tower became more concentrated. The variations in the elastic modulus and Poisson’s ratio made the basic collapse wind speed results more dispersed; however, the strength of the steel did not significantly affect the dispersion of the basic collapse wind speed results.

4. Fragility Analysis of Transmission Tower Considering Structural Uncertainty

Based on the established uncertainty models, pushover analysis for the transmission tower and incremental dynamic analysis for the tower-line system were performed. The calculation results of the two analysis methods were compared to study the collapse resistance of the transmission tower, and the calculation accuracy of the pushover analysis was evaluated using probability analysis.

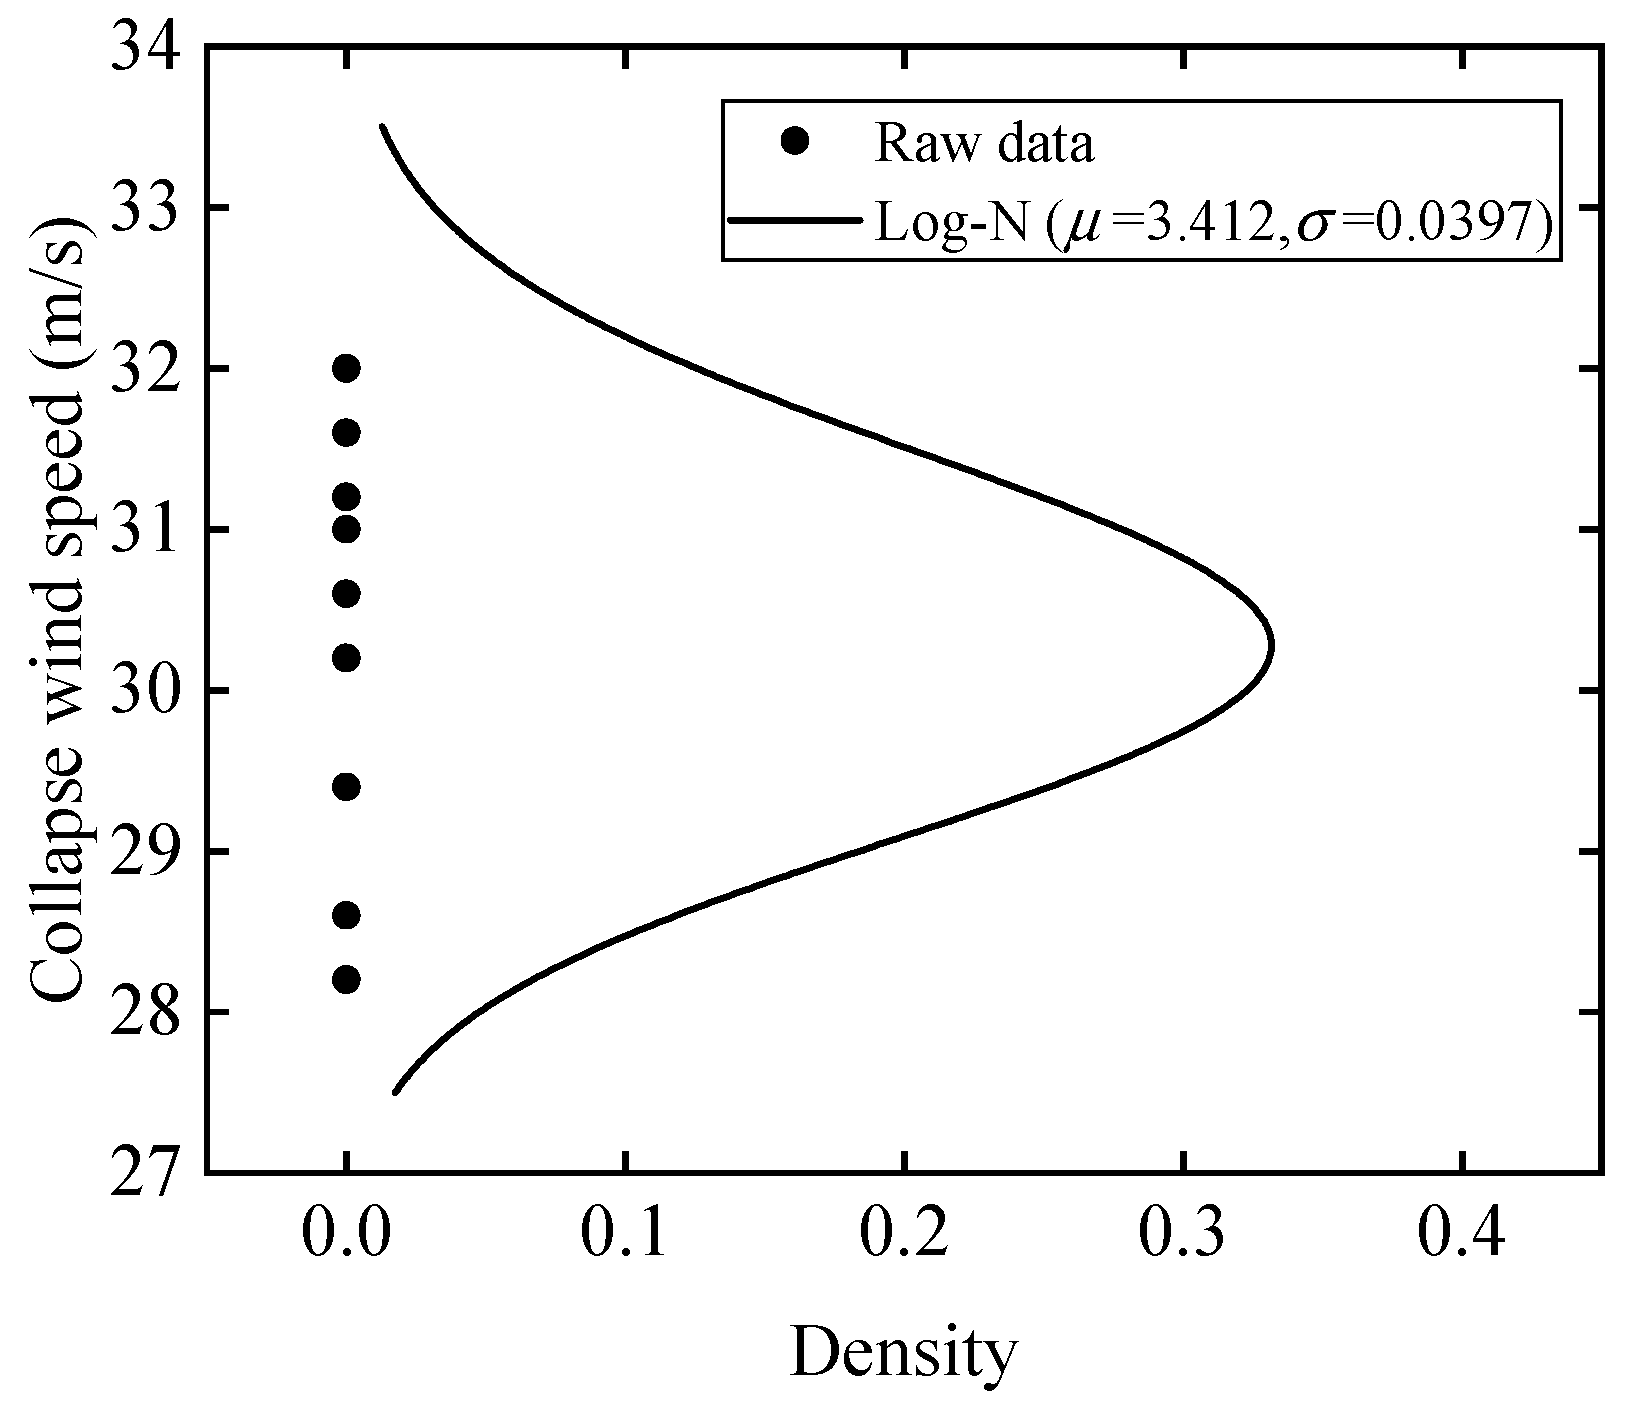
4.1. Pushover Analysis

The simplified wind load points of the transmission tower are the same as those in the previous section, and the wind incidence angle was still determined to be 90° when calculating the equivalent static loads. The equivalent static wind loads of the structure were calculated according to the load code for the design of overhead transmission lines [35]. The wind load on the transmission tower panels can be calculated using the following equation:
P T = W 0 · μ Z · μ S · β Z · A S
where W 0 is the standard value of the reference wind pressure (kN/m2); μ Z is the coefficient of wind pressure variation with height; μ S is the shape coefficient of the tower; A S is the calculated value of the projected area; and β Z is the wind vibration coefficient, calculated as follows [35]:
β Z i = 1 + 2 g ε t I 10 B Z i 1 + R 2
B Z i = m i ϕ 1 i μ S i μ Z i A i j = 1 n j = 1 n ( μ S j μ Z j ϕ 1 j I ¯ Z j A j ) ( μ S j μ Z j ϕ 1 j I ¯ Z j A j ) c o h Z ( z j , z j ) j = 1 n m j ϕ 1 j 2
R 2 = π 6 ζ 1 x 1 2 ( 1 + x 1 2 ) 4 / 3
x 1 = 30 f 1 k w W 0
where g is the peak factor equal to 2.5; ε t is the reduction coefficient of the wind load fluctuation; I10 is the nominal turbulence intensity at a 10 m height, which is 0.14 for class B ground roughness; B Z i is the background factor; R 2 is the resonance factor; ϕ 1 is the first-order mode coefficient of the structure; c o h Z ( z j , z j ) is the vertical coherence function; ζ 1 is the first-order damping ratio of the structure; and f1 is the first-order natural frequency of the structure.
The wind load on the transmission line can be calculated using the following equation:
P D = β C · α L W 0 μ Z μ S C d L P
where β C is the gust coefficient of the conductor and ground wire; α L is the span reduction factor; μ S C is the shape coefficient of the transmission line, which is 1.0 when the diameter is greater than 17 mm and otherwise equal to 1.1; d is the diameter of the transmission line; and L P is the horizontal span.
The wind load of the insulator string can be calculated using the following equation:
P J = n λ 1 W 0 μ Z μ S 1 A 1
where n is the number of insulator strings perpendicular to the wind direction; λ 1 is the shielding reduction factor of the wind load on the insulator string; μ S 1 is the shape coefficient of the insulator, equal to 1.0; and A 1 is the calculated value of the wind-pressure bearing area of the insulator string.
The calculated results for the wind load on the structure are shown in Table 3 and Table 4.
The calculated wind loads were applied to the corresponding nodes on the transmission tower in the form of concentrated forces. The weights of the conductor, ground wire, and insulator were also simplified as a concentrated force and applied at the corresponding position of the transmission tower. A pushover analysis was performed on the uncertainty models. By increasing the basic wind speed continuously to cause the collapse of the transmission tower models, the pushover curves of the uncertainty models were obtained (Figure 10).
We observed that the displacement response of the deterministic model lay between those of the uncertainty models. The basic collapse wind speed of the deterministic model was 30.4 m/s, and the collapsed-tower top displacement was 0.391 m. According to the analysis results of the uncertainty models, multiple collapse wind speeds and tower-top displacements were obtained. The fragility curve of the uncertainty analysis for the transmission tower was obtained by fitting the collapse data to the cumulative function of the lognormal distribution.
The fragility curves of the basic collapse wind speed and tower top displacement are shown in Figure 11. The value corresponding to a 10% probability in the fragility curve is frequently used as the critical collapse datum; thus, the collapse wind speed calculated by the uncertainty analysis was 28.68 m/s and the ultimate displacement at the top of the tower was 0.368 m. Compared with the results of the deterministic analysis, the collapse wind speed and ultimate tower top displacement of the uncertainty analysis were 5.66% and 5.88% lower, respectively, which indicated that the results of the deterministic analysis overestimated the bearing capacity of the structure.

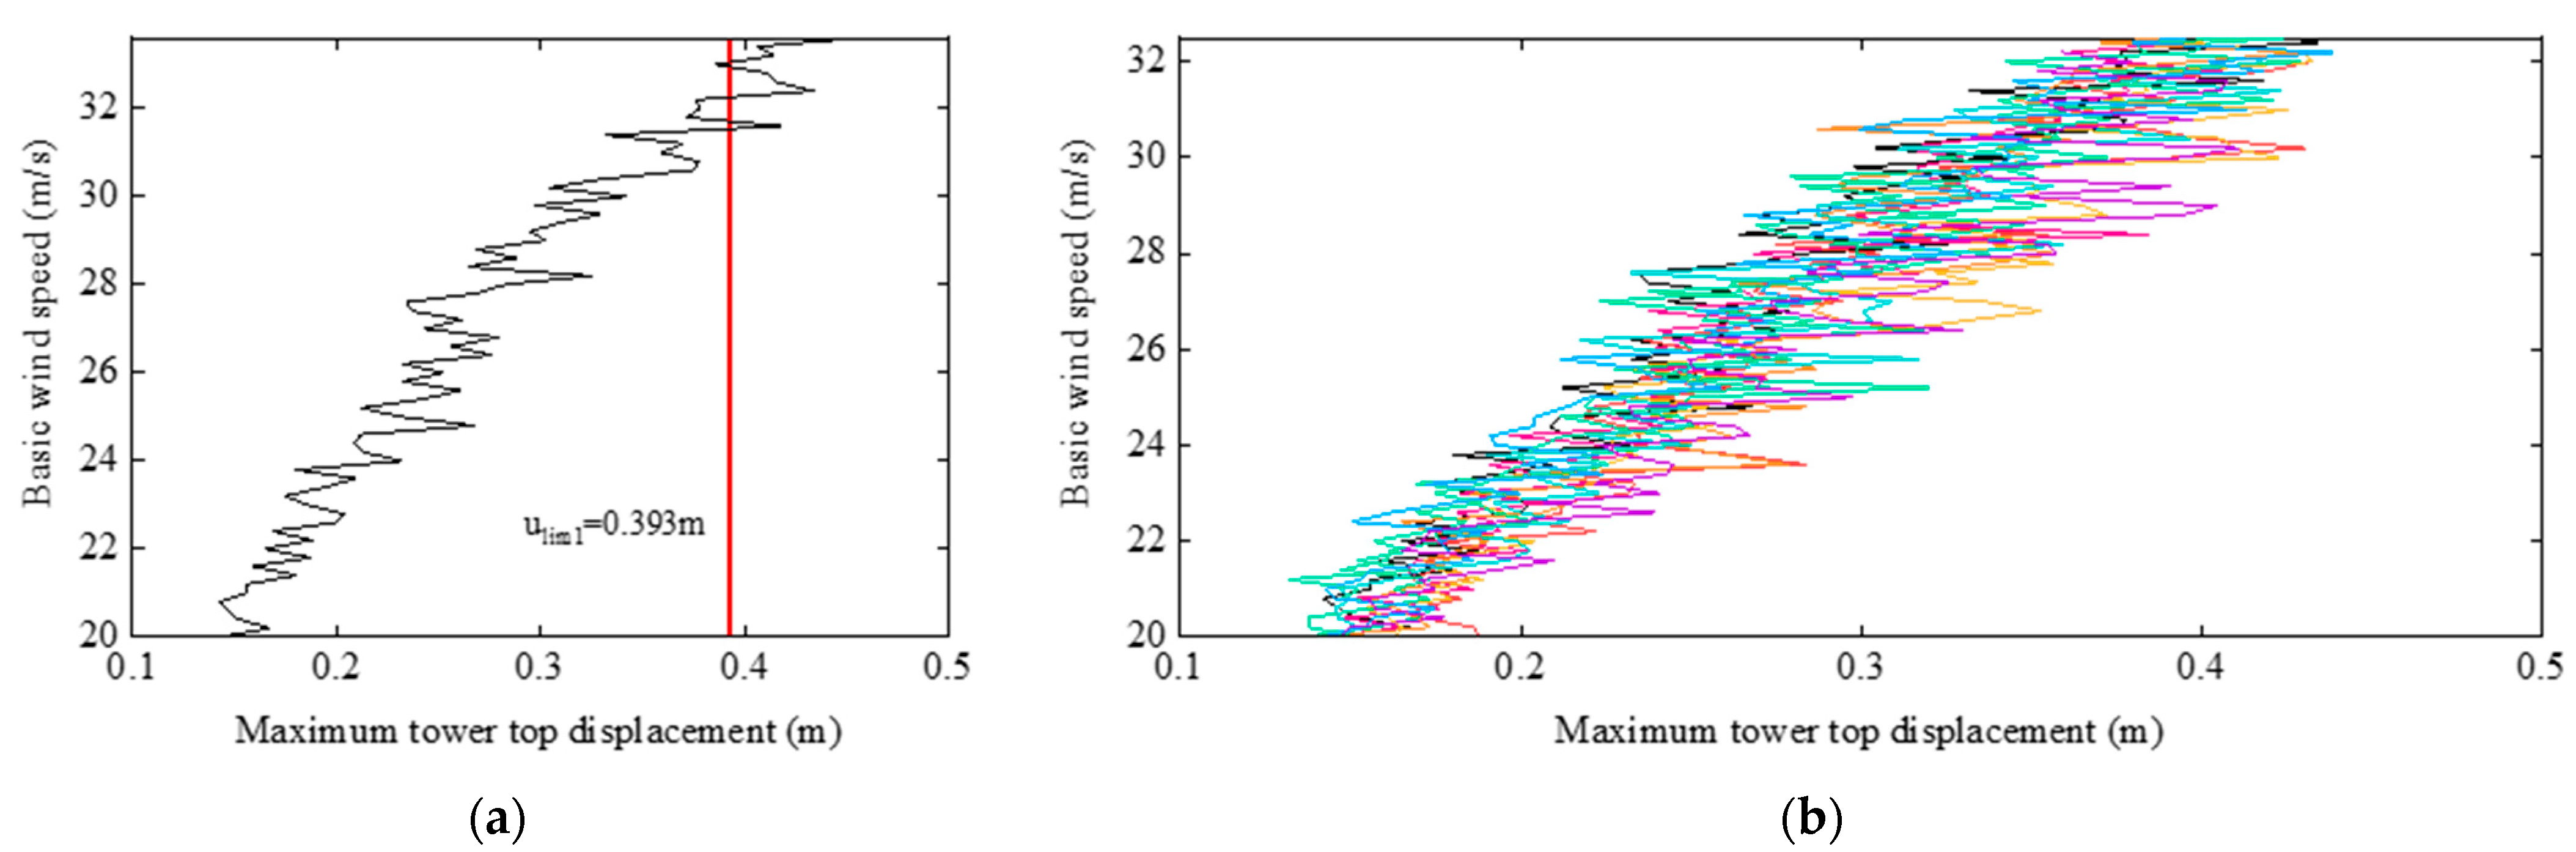
4.2. Incremental Dynamic Analysis

The collapsed tower top displacement of each sample was determined using the nonlinear static analysis results. These displacements were taken as the critical values of the transmission tower models for incremental dynamic analysis.
When calculating the response of the tower-line system under different wind speeds, multiple wind speed time histories were generated by the harmonic superposition method to consider the uncertainties in the wind load. In total, 20 groups of wind speeds were gradually increased from 20 m/s, and the increment in the basic wind speed was 0.2 m/s, when calculating the response of the tower-line system under different wind speeds. By capturing the maximum top displacement of the transmission tower at each basic wind speed, the variation curve could be obtained, as shown in Figure 12. The red line in Figure 12a is the collapsed tower top displacement of the transmission tower model. Only part of the data are shown in Figure 12b to avoid overlapping curves, and each curve represents the result of the incremental dynamic analysis.
In the incremental dynamic analysis of the tower-line system, we considered that the basic wind speed corresponding to the tower top displacement that exceeded the critical displacement value for the first time was the basic collapse wind speed. The collapse wind speed for each sample was obtained and compared with that calculated using pushover analysis. As shown in Figure 13a, the collapse wind speed values obtained using the two methods were similar, with a maximum relative error of 5.7% and a mean relative error of 3.18%, indicating that the mass and coherence functions were considered when calculating the equivalent wind load according to the load code for the design of the overhead transmission line [35]; therefore, accurate response results can be obtained using pushover analysis.
Based on the collapse wind speed of each sample, the fragility curve corresponding to the incremental dynamic analysis was fitted. The comparison results of the collapse wind speed fragility curves obtained using the two methods are shown in Figure 13b. We observed that the end position of the fragility curve corresponding to the incremental dynamic analysis was farther from the starting position, which was due to the uncertainty of the wind load being considered in the incremental dynamic analysis. The curve of the pushover analysis was on the left side of the curve of the incremental dynamic analysis, and the starting positions of the two curves were close. In the fragility curve corresponding to the incremental dynamic analysis, the basic collapse wind speed corresponding to the 10% probability was 28.96 m/s, which is only 0.97% different from the result of the pushover analysis, which further indicated that the collapse wind speed obtained using the pushover analysis was accurate.

5. Prediction of Corrosion Depth Based on the BP Artificial Neural Network

The BP artificial neural network is a widely used network model. Its construction concept is as follows: first, a part of the measured data is input into the neural network as the training set, the weights in the network are adjusted through the back-propagation algorithm until the error meets the requirement, and then the test set is calculated using the generated model to evaluate the prediction accuracy of the artificial neural network.

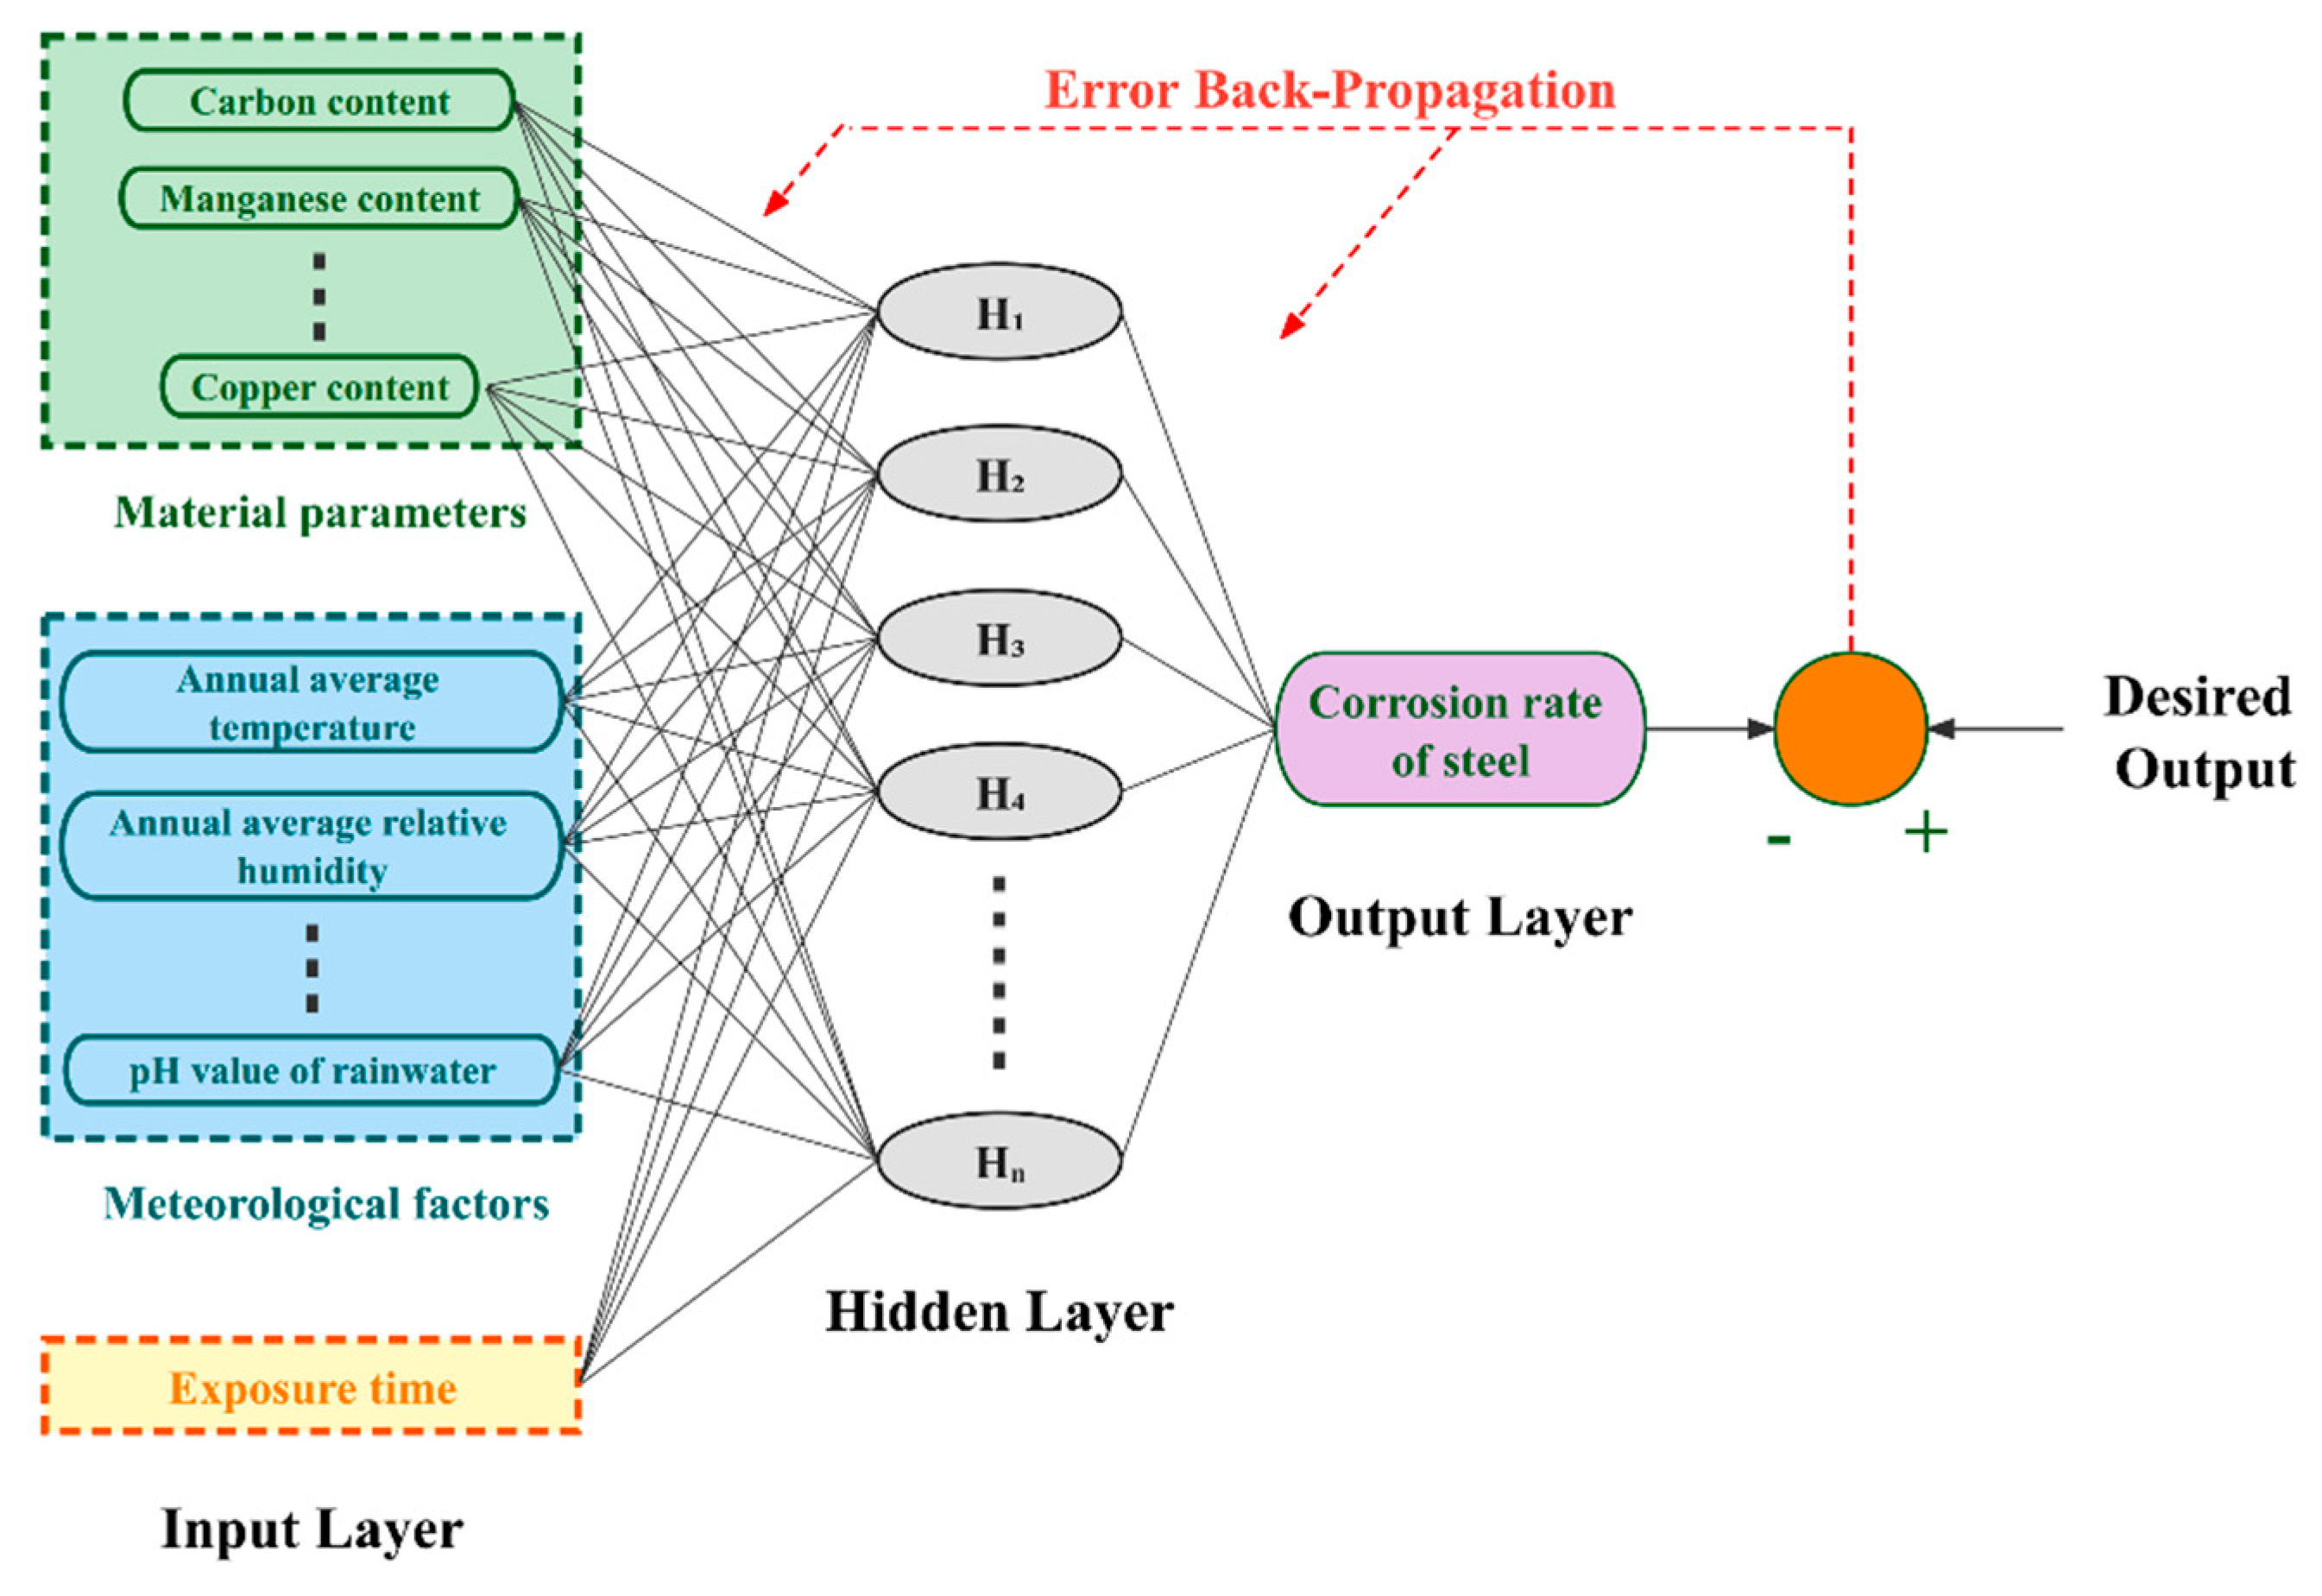
5.1. Generation of the Artificial Neural Network Model

In this study, a three-layer neural network was constructed based on the corrosion data from the National Materials Corrosion and Protection Data Center [36]. As shown in Figure 14, the connections between adjacent layers of the neural network were fully connected. The data selection for the neural network prediction model is shown in Table 5. There were 15 steel materials involved in the model construction, and the steel types were carbon steel and low-alloy steel. Meteorological data and atmospheric corrosion data during model training were obtained from the test stations in six regions. The meteorological data are presented in Table 6. The exposure times of the specimens were 1, 2, 4, 8, and 16 years. The input factors of the neural network model included material parameters, meteorological factors, and exposure time. The number of nodes in the input layer was 15, and the parameter in the output layer was the corrosion rate of steel.
The transfer function of the network was a sigmoid function with a learning rate of 0.05. The interval of the optimal number of hidden layer nodes was determined using existing research [37]. After testing, the number of hidden layer nodes was nine, and a neural network prediction model was obtained through training.

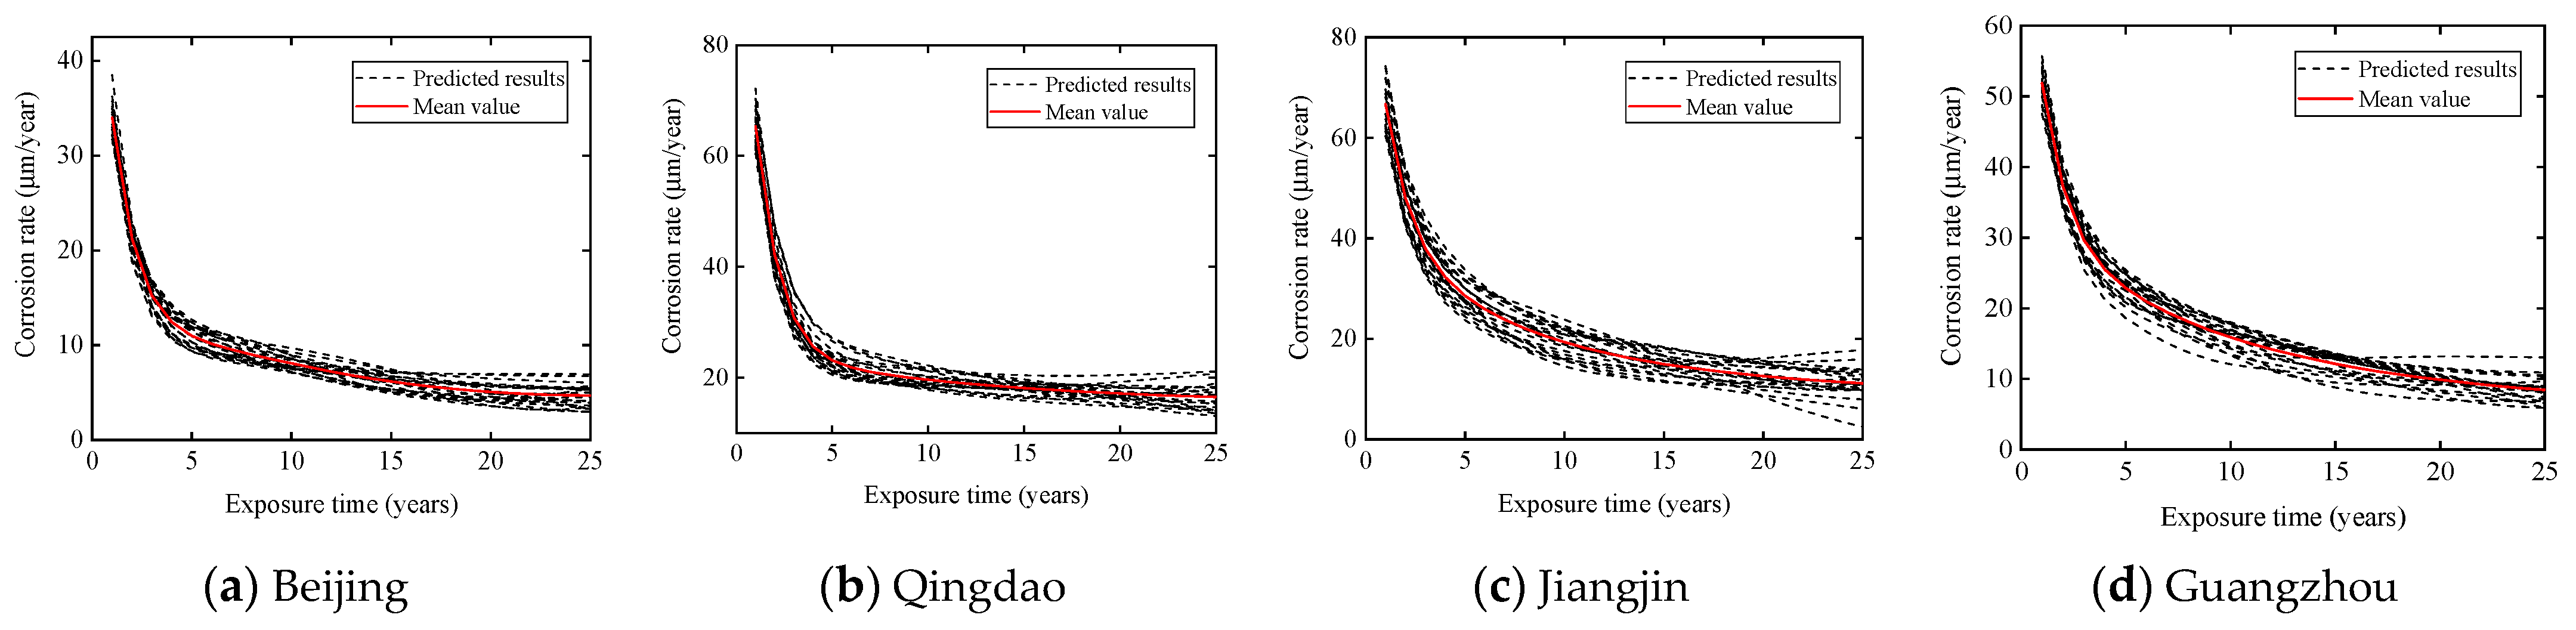
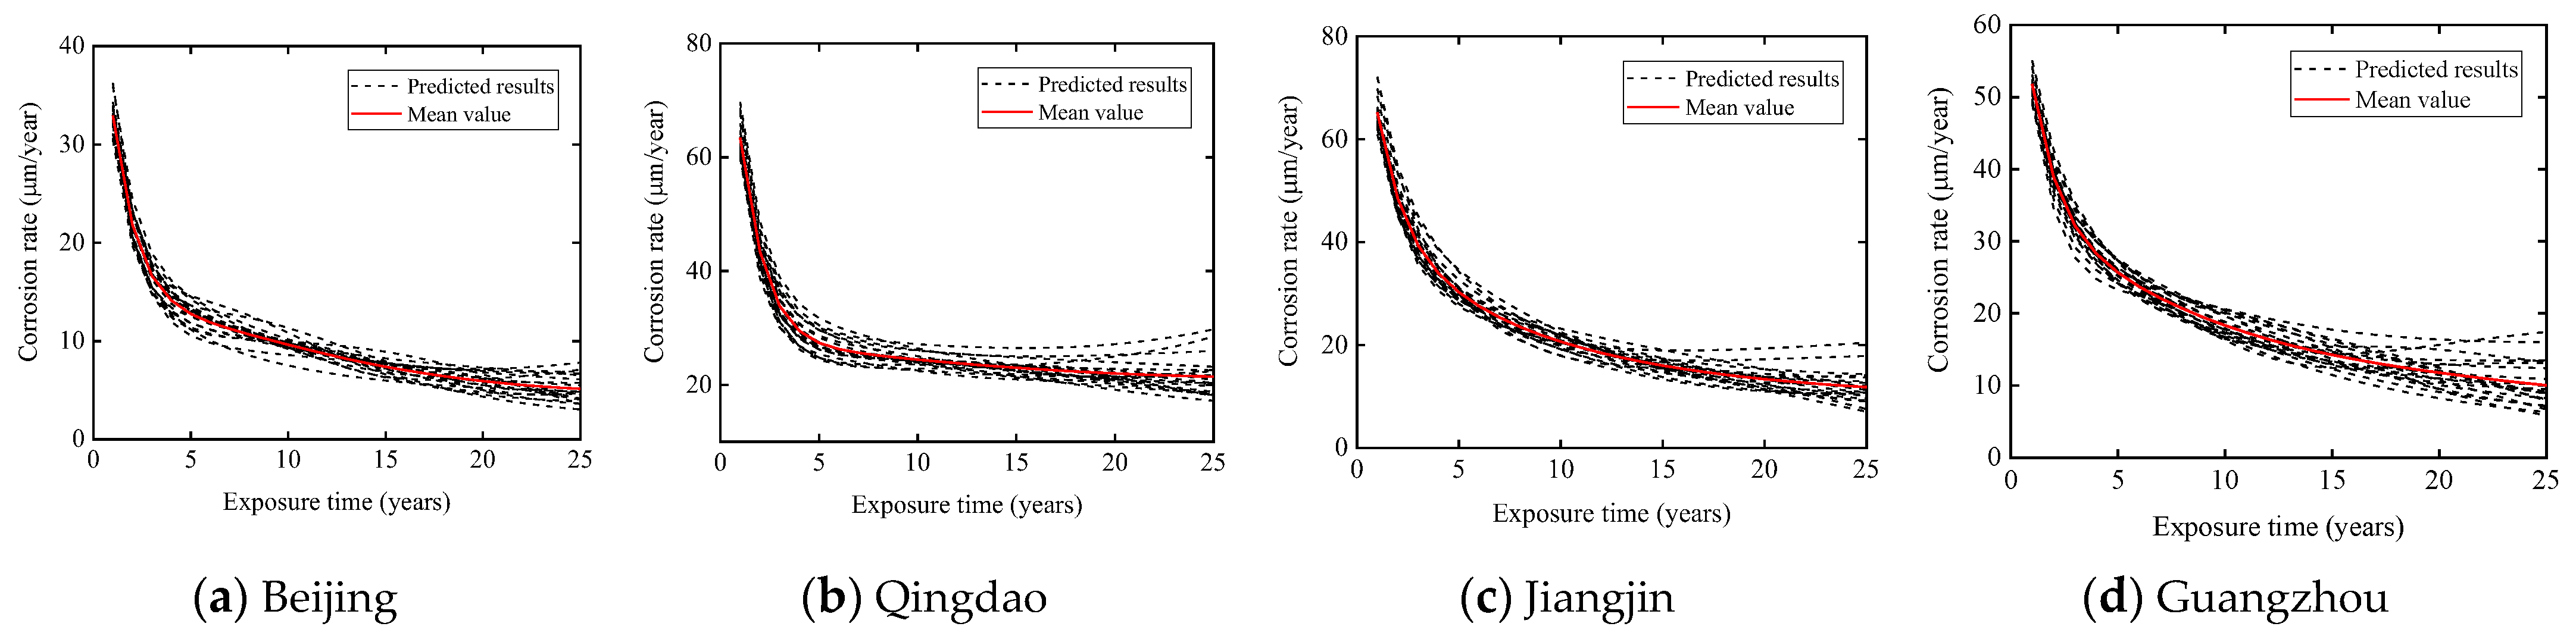
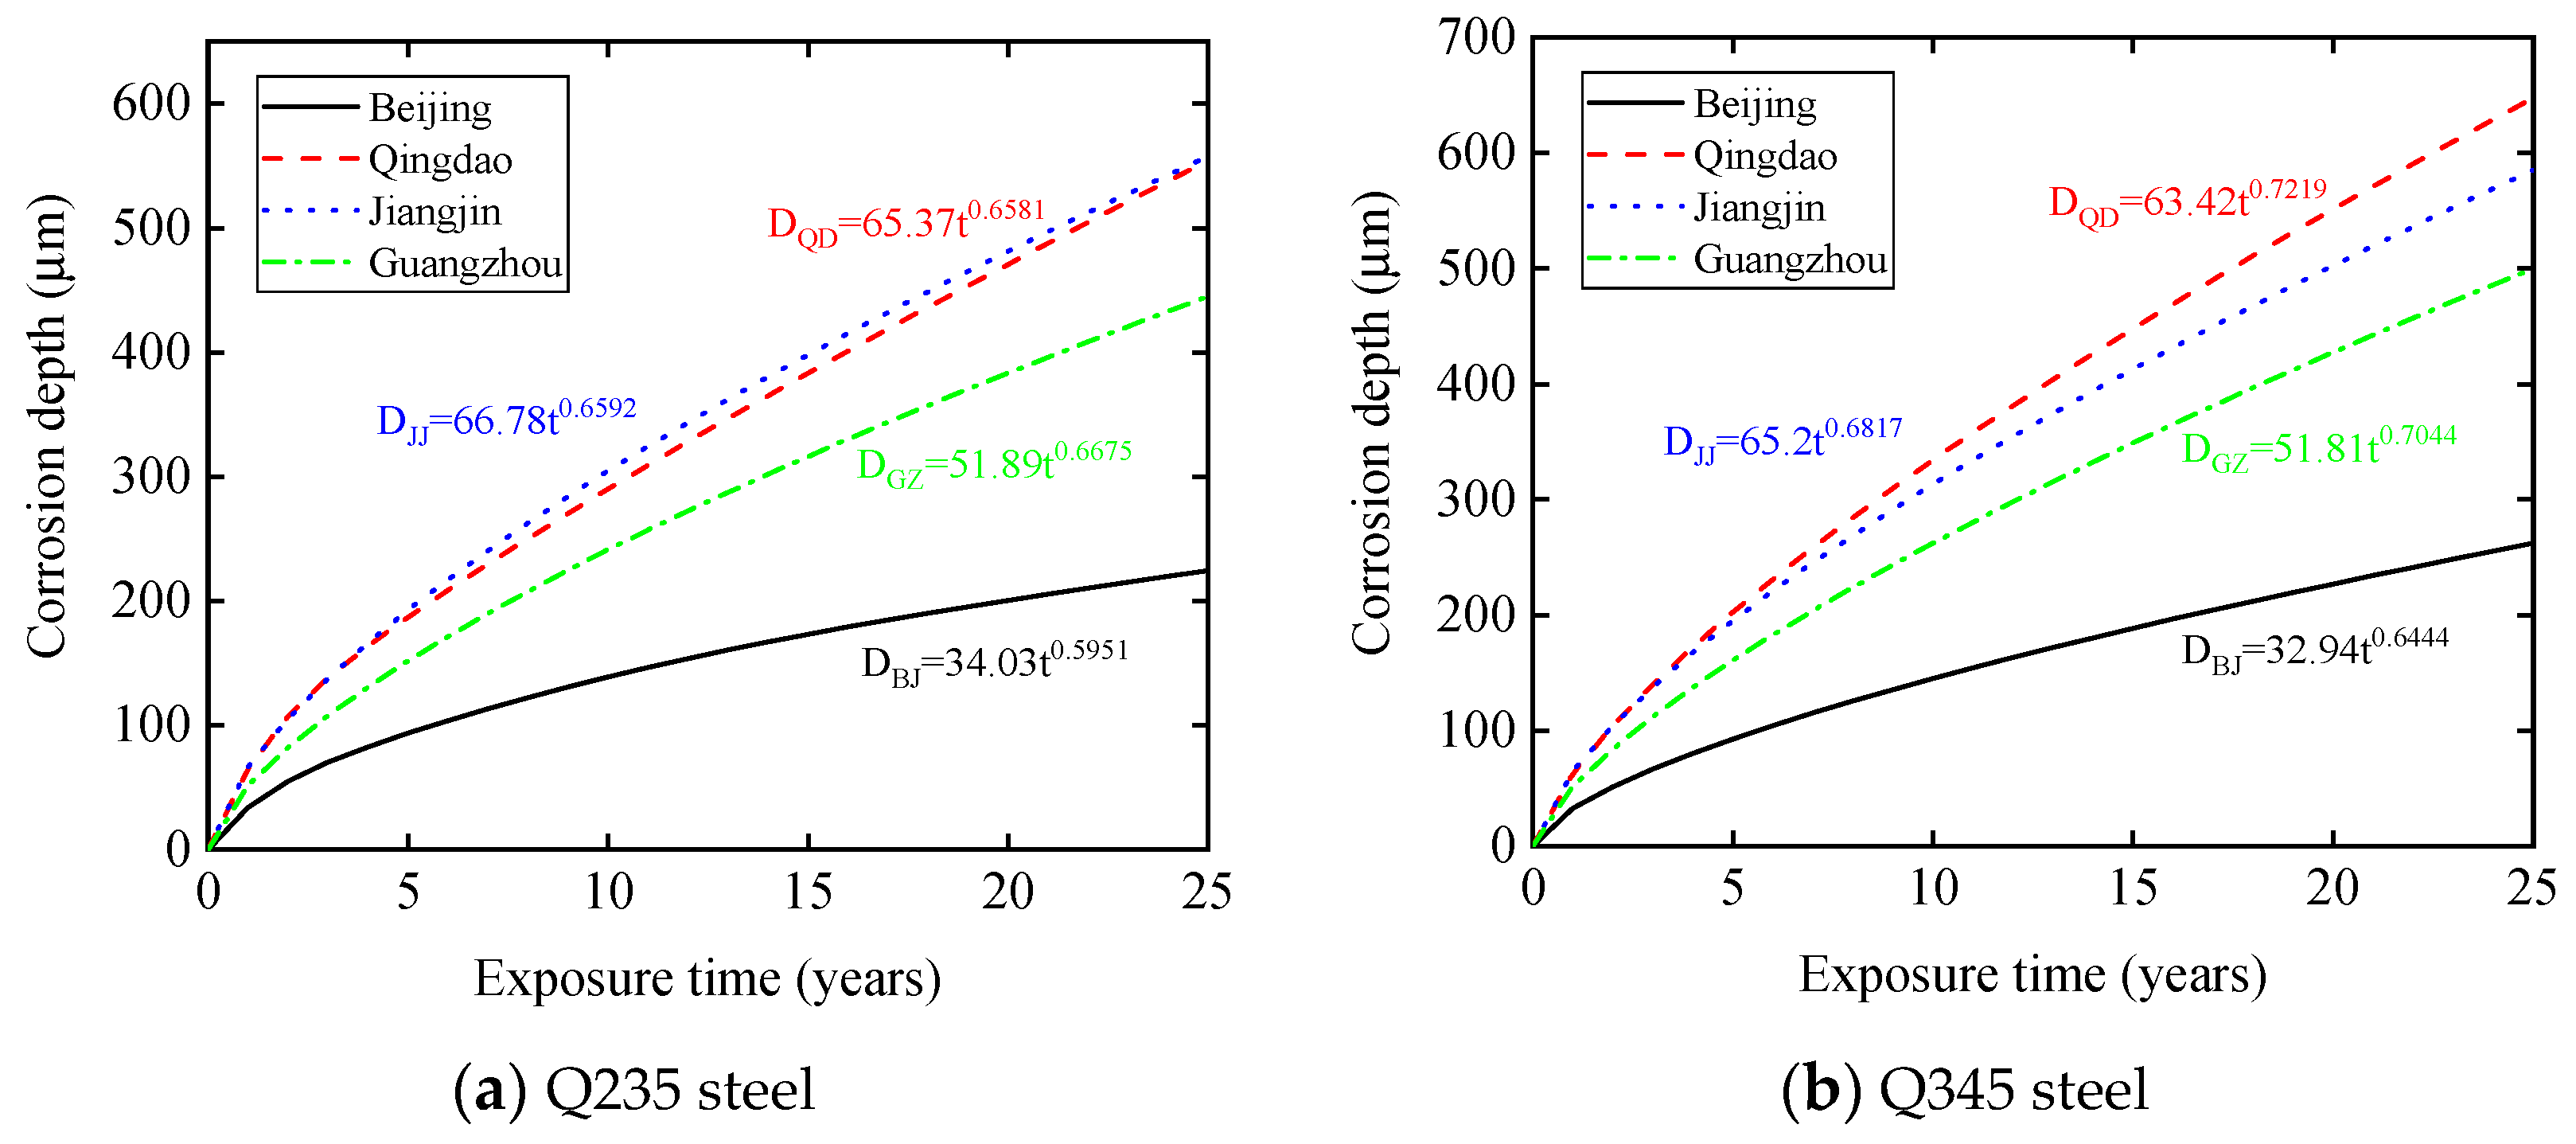
5.2. Corrosion Depth Prediction Results

Test samples were calculated using the generated model to evaluate the prediction accuracy of the artificial neural network. As shown in Figure 15a, the predicted results of the test samples were close to the measured values. The error analysis results for the test set are shown in Figure 15b to reflect the prediction accuracy of the model more intuitively. We observed that the relative error of almost all predicted values was less than 20%, the mean relative error between the predicted and measured values was 8.91%, and the correlation coefficient was 0.9849, which indicated that the prediction accuracy of the corrosion prediction model established by the BP artificial neural network was high.
Owing to the randomness of the prediction model generated by the BP neural network, 20 prediction models were generated in this study, and the average of the 20 prediction results was considered the final result. The transmission tower contained Q235 and Q345 steels; therefore, the corrosion rates of Q235 and Q345 steels in Beijing, Qingdao, Jiangjin, and Guangzhou were predicted in this study.
Through multiple attempts, we observed that the change trends of the prediction curves within 25 years were the same, and the results were relatively dense. However, when the exposure time exceeded 25 years, the dispersion of the predicted results was larger; therefore, the maximum exposure time was determined to be 25 years. Figure 16 and Figure 17 show the corrosion rate prediction results for Q235 and Q345 steels, respectively, in the four regions.
Based on the predicted corrosion rate, the corresponding variation law of the corrosion depth was obtained using integration, that is, the corrosion depth in the t year is the sum of the corrosion rates in the previous t years. The fitting function of the mean curve of the corrosion depth can be expressed as follows:
D = A t n
where D is the corrosion depth in t years, A is the corrosion depth in the first year, and n reflects the changing trend of the curve. The fitting results for the corrosion depth are listed in Table 7. The R-squared value represents the correlation between the power function and the predicted value. The R-squared value of each fitting result was close to 1, indicating that the effect of fitting the corrosion depth by the power function was good. The fitting curves for the corrosion depths are shown in Figure 18. We observed that the corrosion depth in Beijing was smaller, and the corrosion depths in Qingdao and Jiangjin were larger. By comparing the meteorological factors in different regions, we can consider that the relative humidity and SO2 concentration have a significant impact on the corrosion rate of steel. In addition, the corrosion depth of Q235 steel is greater than that of Q345 steel in a short exposure time, but with an increase in exposure time, the corrosion depth of Q345 steel exceeds that of Q235 steel. However, Q345 angle steel is used as the main leg member in the transmission tower; therefore, the section dimensions of Q345 angle steel are relatively large. Therefore, although the corrosion depth of Q345 steel is larger, its mass loss ratio is generally smaller than that of Q235 steel, indicating that the mass loss ratios of the diagonal members are greater during the operation of the transmission tower.

6. Uncertainty Analysis of Transmission Tower Considering Corrosion and Strong Wind Effects

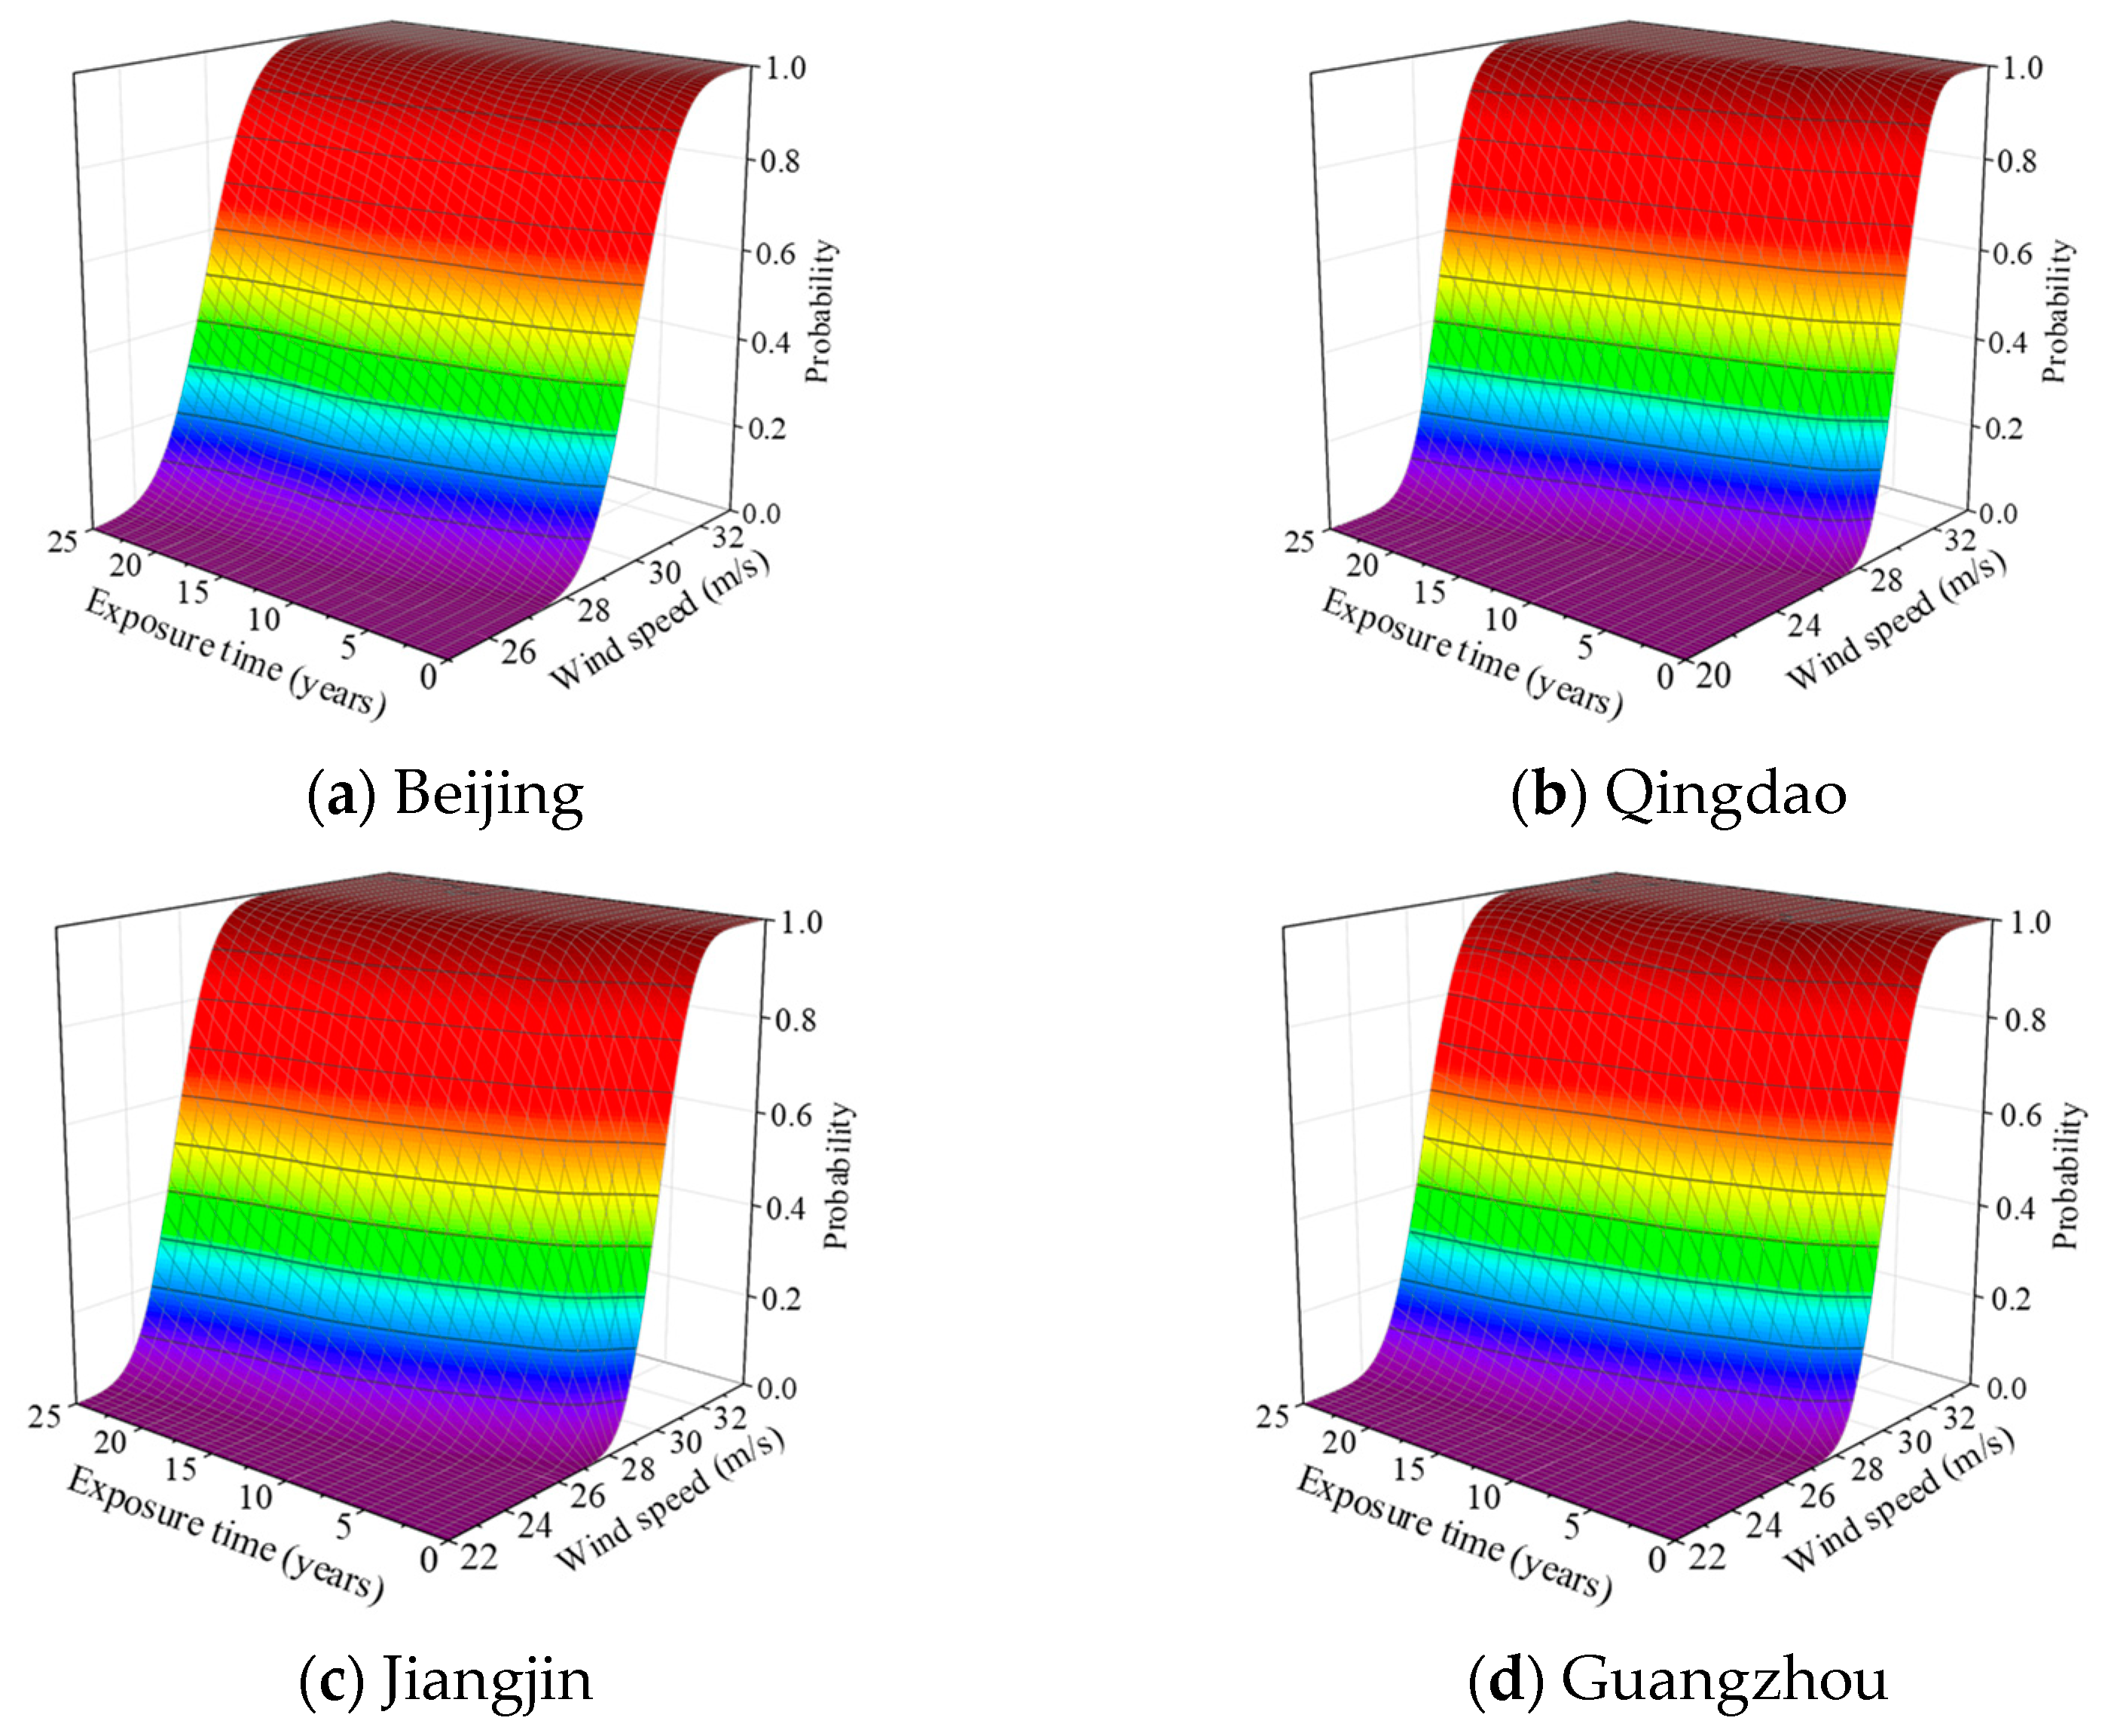
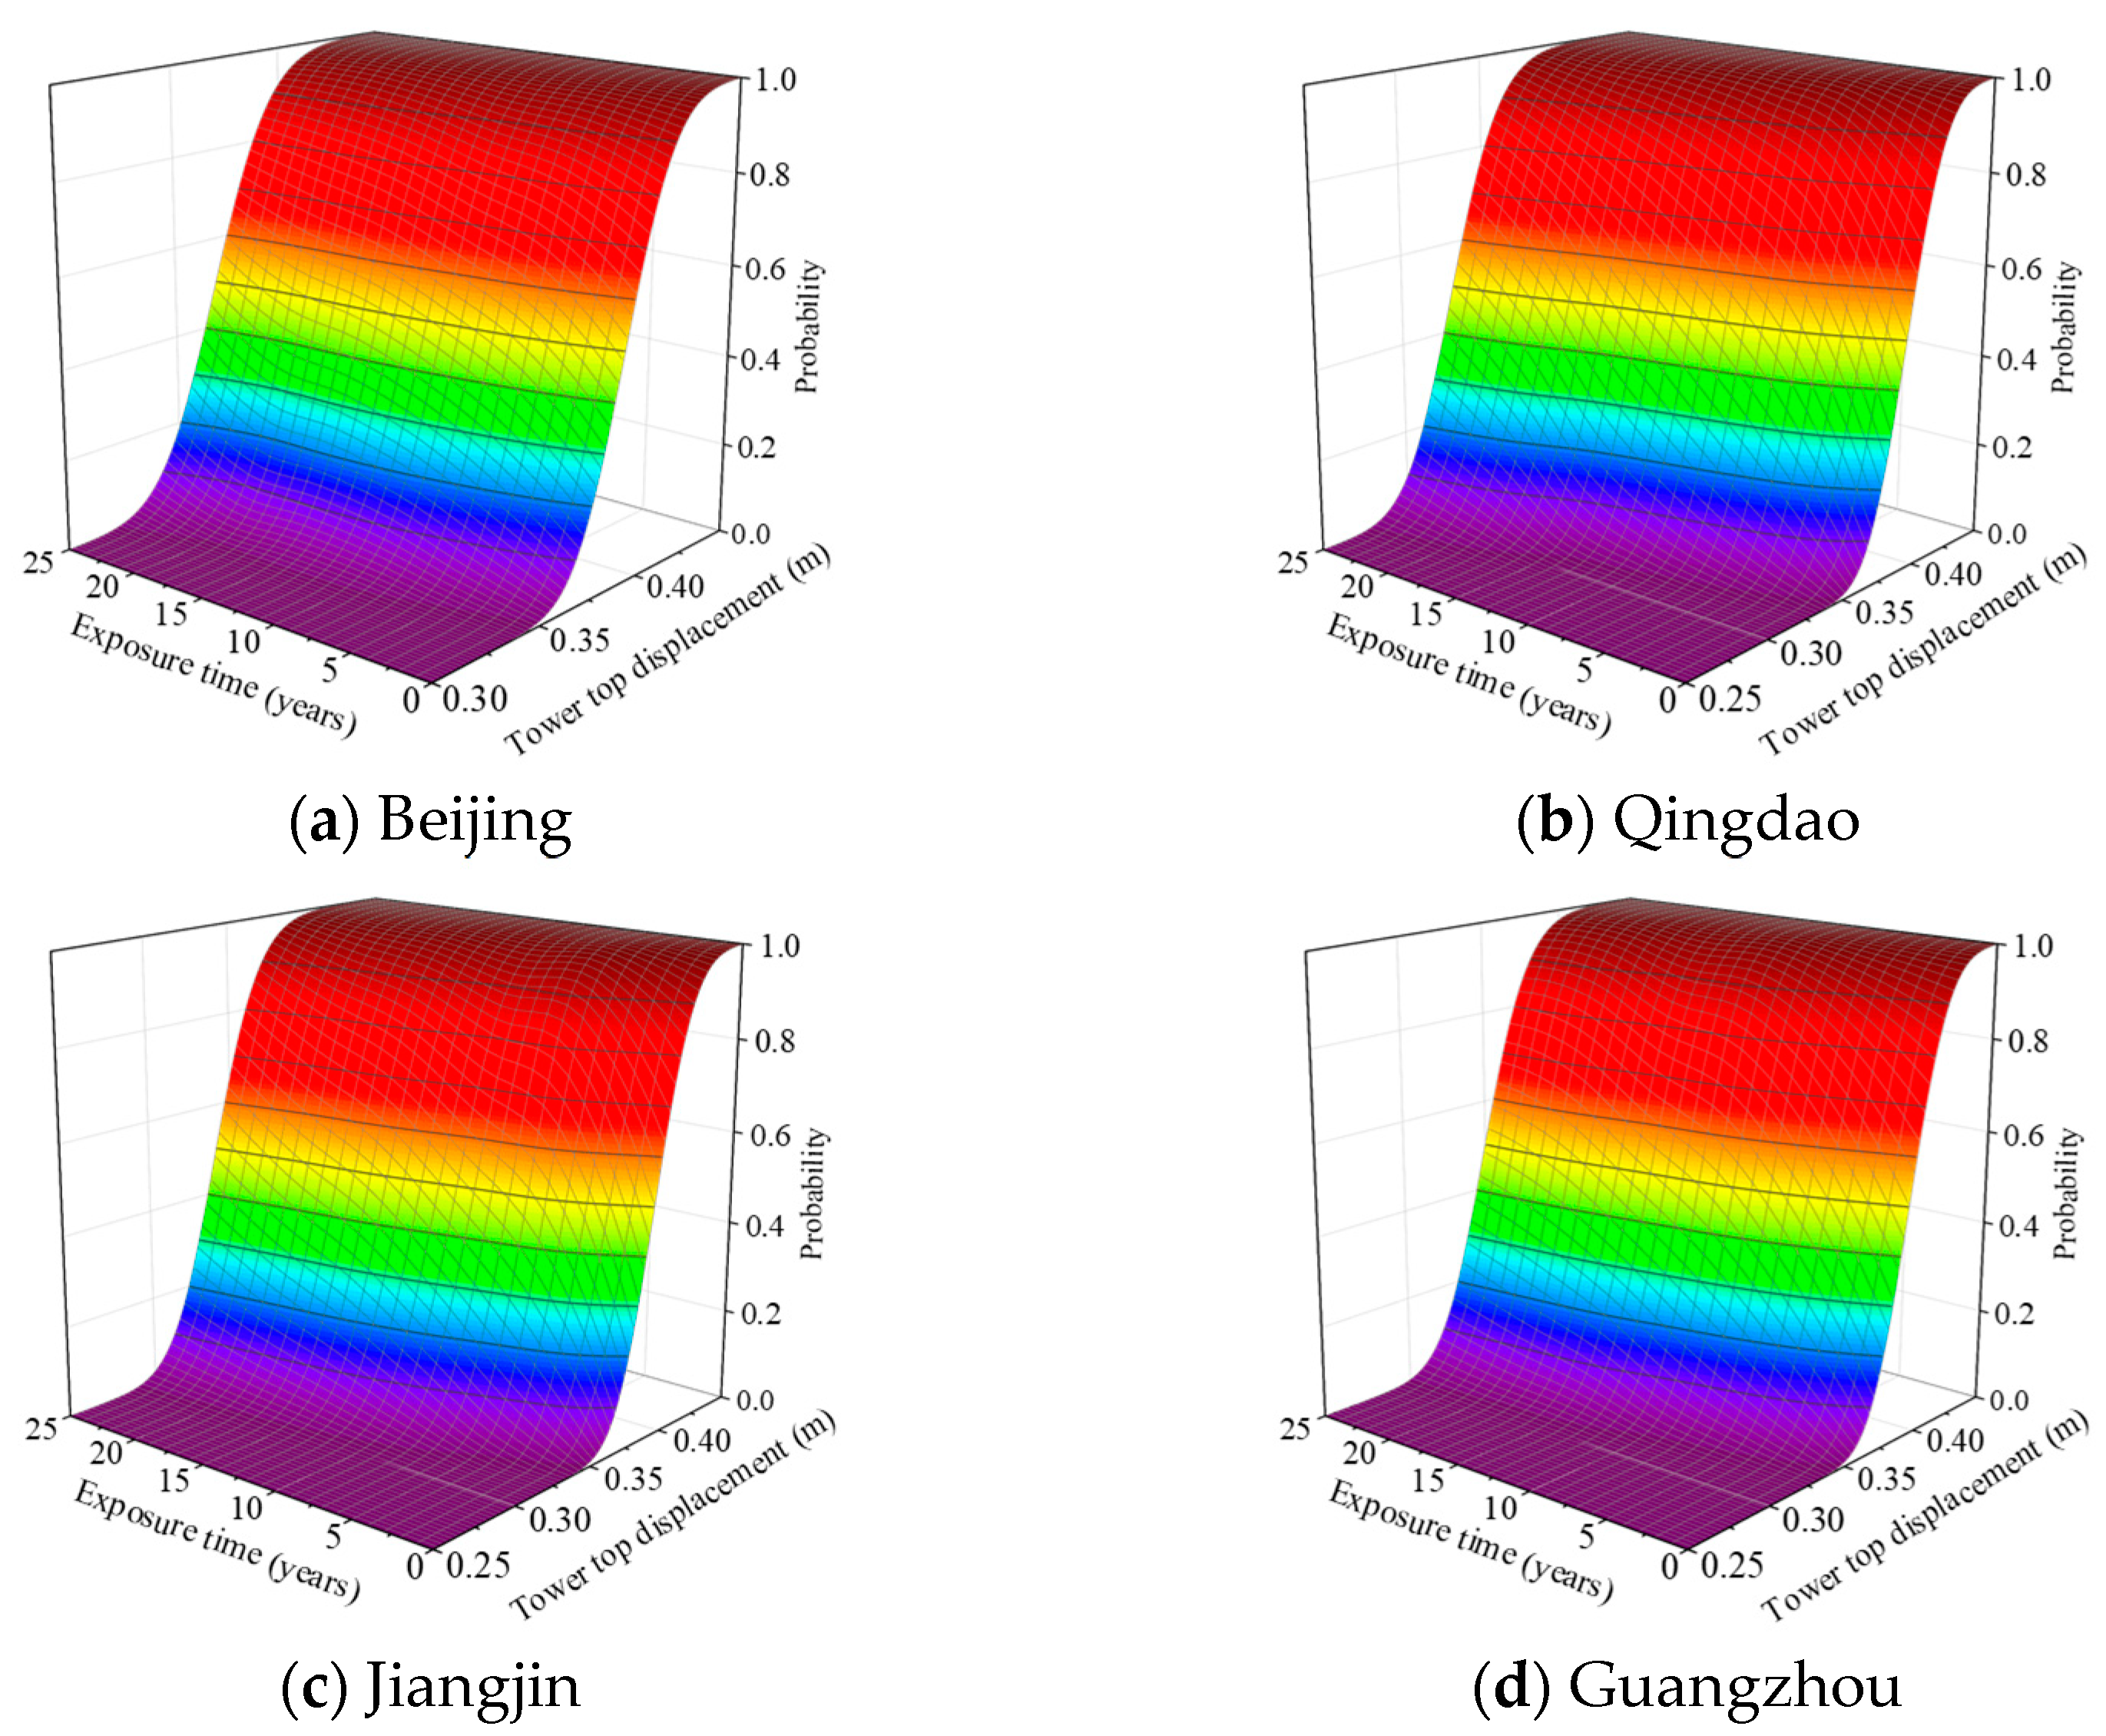
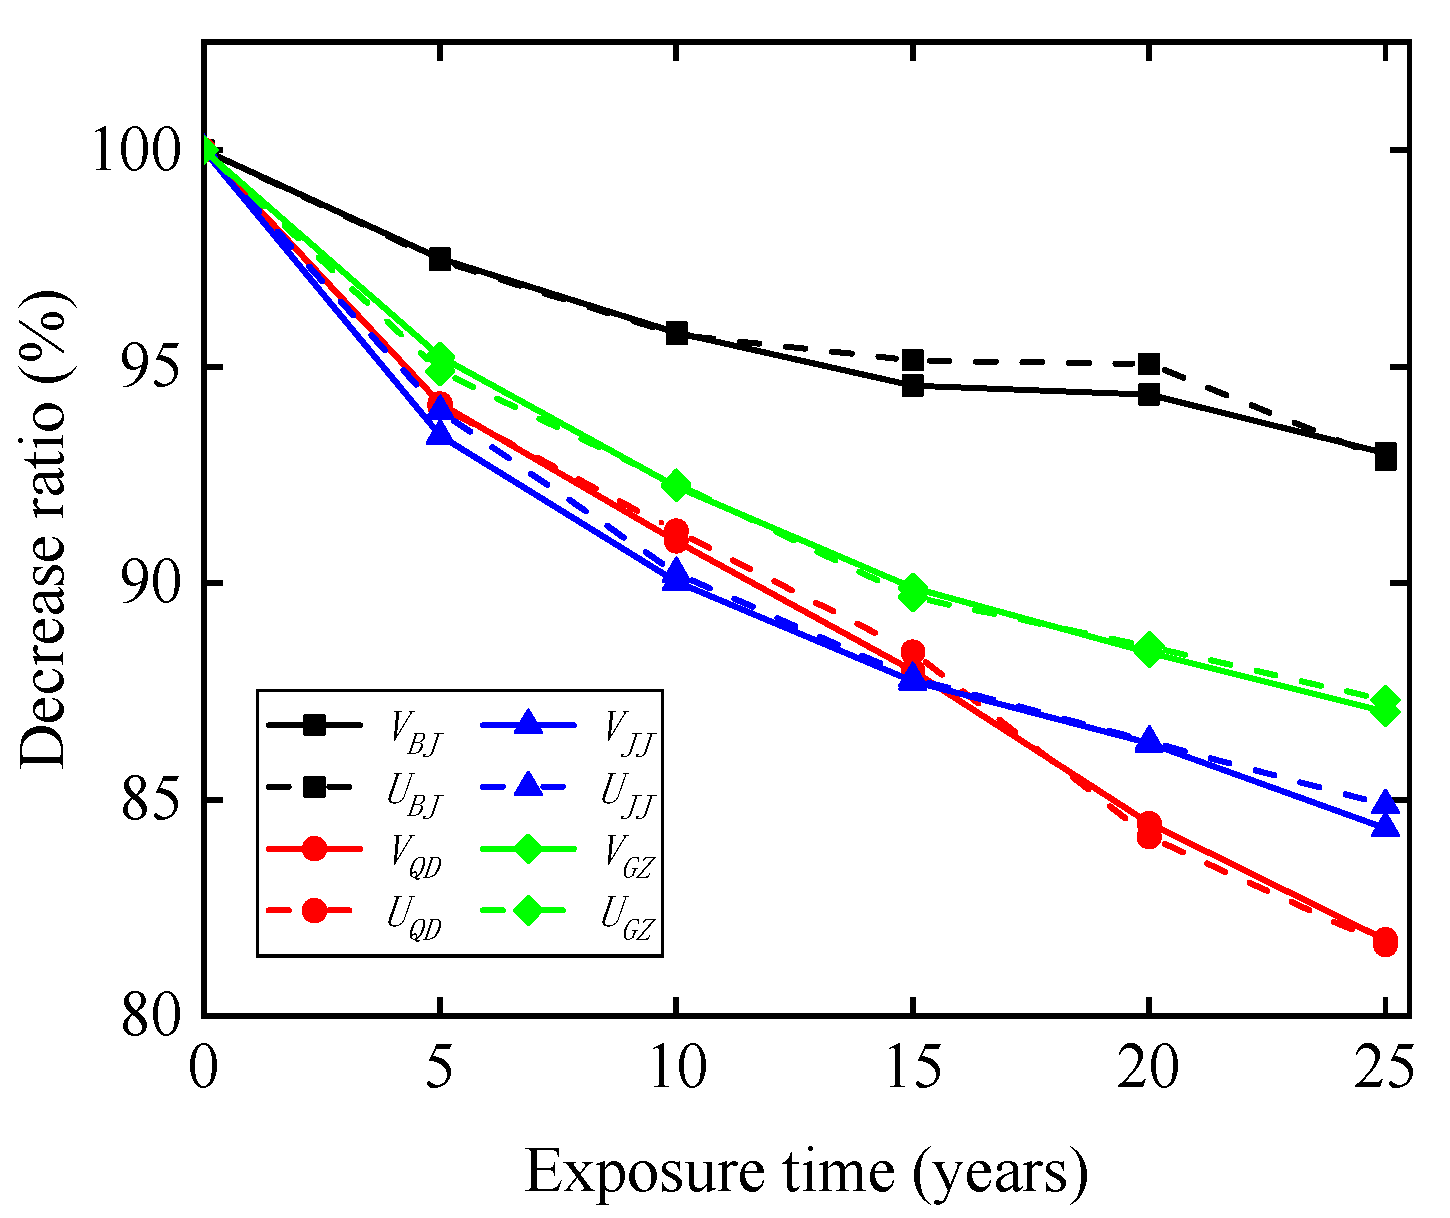
6.1. Results of Wind Resistance Degradation

According to statistics [38], the steel protective layer of the transmission tower in regions with severe acid rain and coastal regions will become invalid within a few years, and the transmission tower will be completely corroded. The material properties and geometric parameters of the steel also decrease noticeably because of corrosion. Therefore, in this paper, we converted the corrosion depth into the mass loss ratio of steel and analyzed the wind-resistant performance of corroded transmission towers. The mechanical properties of Q235 and Q345 steels before and after corrosion were compared in relevant research [20,21], and the variation law of the mechanical properties of Q235 and Q345 steels with the mass loss ratio was revealed based on the statistical results. The formula for the mechanical property degradation of the Q235 and Q345 steel is as follows:
  p p = 1 - c η
where p and   p are the mechanical property of the steel before and after corrosion. η is the mass loss ratio. c is the value of the reduction coefficient of mechanical properties as shown in Table 8.
The uncertainty of geometric parameters will affect the calculation results of the mass loss ratio, and further, it will affect the decline of material parameters. Therefore, it is necessary to consider the uncertainty of its structural parameters when analyzing the wind-resistant performance of corroded transmission towers. According to the obtained corrosion depth prediction results, the mass loss ratios of angle steel with different section dimensions in each uncertainty model were calculated, and the material properties of each angle steel after corrosion were calculated using the degradation formula. Considering the degradation of the mechanical properties and geometric parameters, an uncertainty analysis of the wind-induced collapse of the transmission tower was performed.
Figure 19 and Figure 20 show the relationship between the collapse probability of the transmission tower and the basic wind speed and the relationship between the collapse probability and tower top displacement in Beijing, Qingdao, Jiangjin, and Guangzhou at different exposure times, respectively. Table 9 and Table 10 show the basic wind speeds and tower top displacements corresponding to a 10% probability of the collapse fragility surface for different exposure times. The collapse wind speed and tower top displacement decreased significantly with the intensification of corrosion. Beijing and Jiangjin are both inland regions, but the collapse wind speed of the transmission tower in Jiangjin decreased faster than that in Beijing, which was due to severe acid rain caused by the high SO2 concentration in the atmosphere of Jiangjin. The decline in wind speeds in Qingdao and Guangzhou, which are coastal regions, was also greater than that in ordinary inland regions. In addition, the decline in tower top displacements in regions with severe acid rain and coastal regions was also greater than that in ordinary inland industrial regions.
To reflect the declining trend in the collapse wind speed and tower top displacement of the transmission tower with exposure time more intuitively, Figure 21 shows the decay curves of the wind-resistant performance of the transmission tower. The decrease ratio in Figure 21 was calculated as the reduction value of the collapse wind speed or collapsed tower top displacement divided by its initial value. We observed that the decay curves of the collapse wind speed and tower top displacement in the same region were almost coincident, indicating that the decrease ratios of the collapse wind speed and tower top displacement were synchronized. When the exposure time was less than 5 years, the wind resistance performance of the transmission tower decreased rapidly. With increasing exposure time, the decay rate gradually slows. When the exposure time was 25 years, the wind resistance performance of the transmission tower in the Beijing region could still be maintained at more than 90%. However, the wind resistance performance of transmission towers in regions with severe acid rain and coastal industrial regions decreased by 10% to 20%. In addition, the decrease ratios of the collapsed wind speeds of the transmission towers in Qingdao, Jiangjin, and Guangzhou were all greater than 10% when the exposure time was 10–15 years.

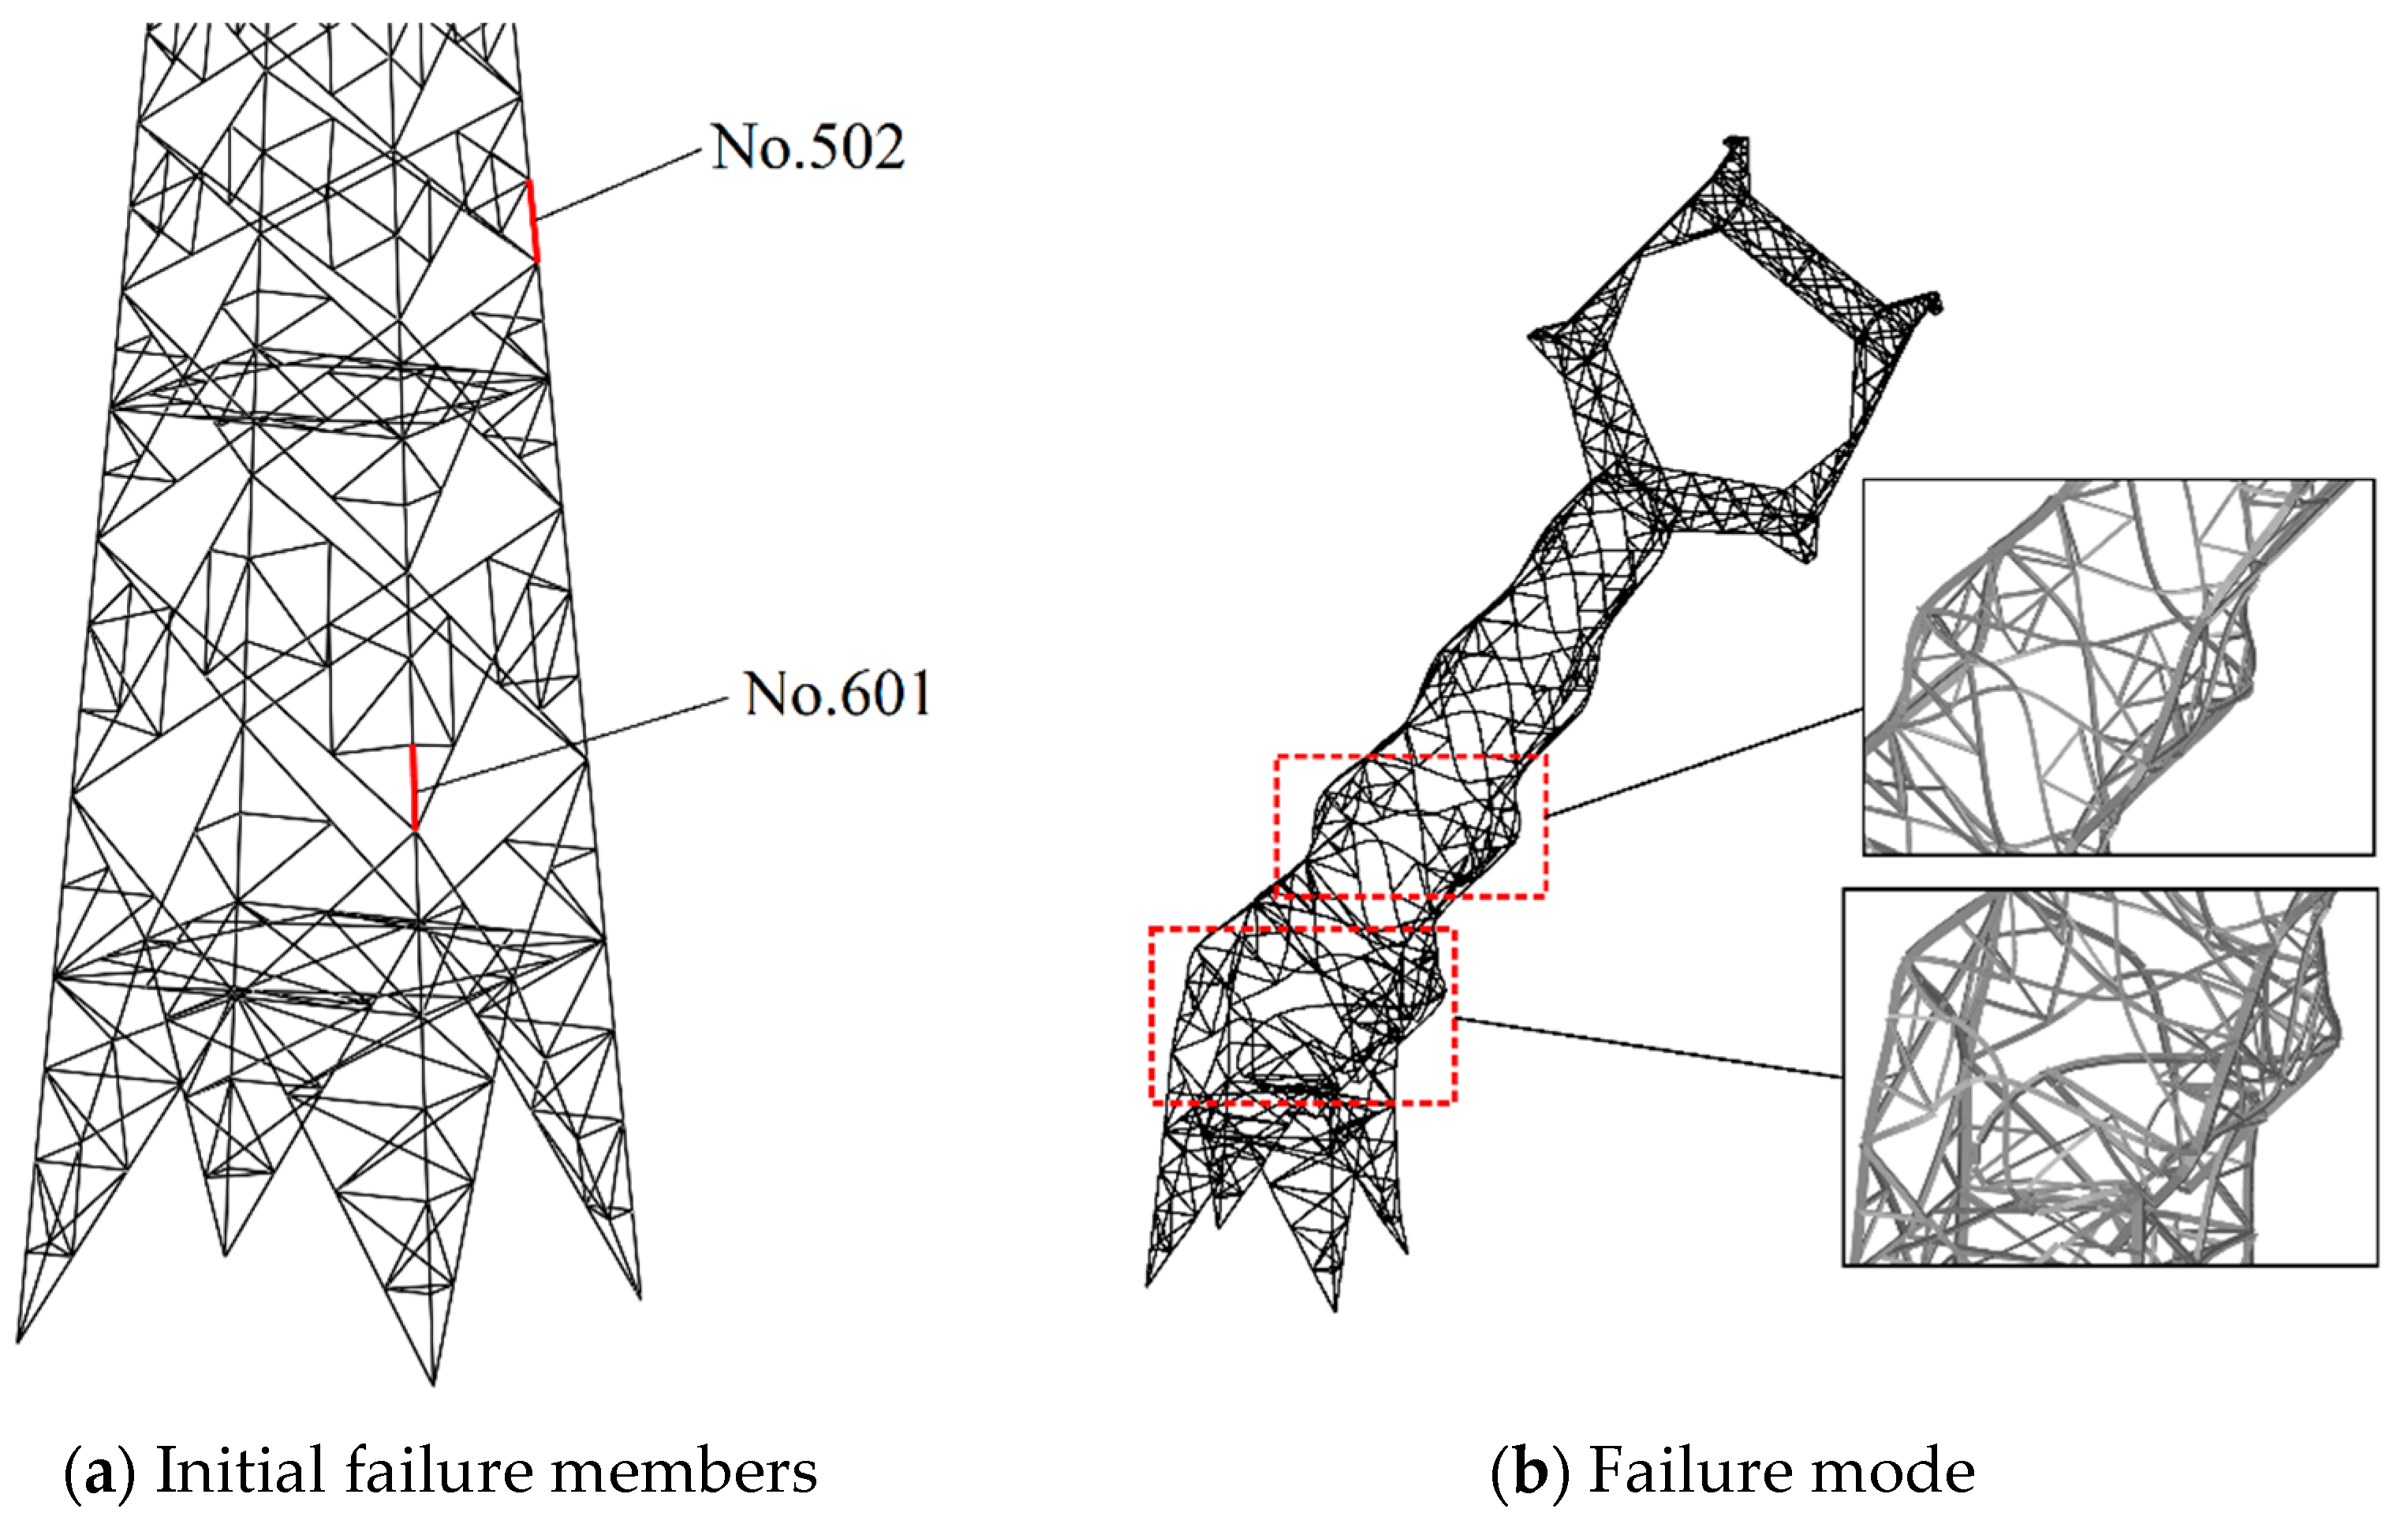
6.2. Variation in Transmission Tower Failure Modes

When tower members are corroded, in addition to the smaller collapse wind speed and tower top displacement, the failure mode of the tower also changes. Therefore, in this study, the failure members and modes of the transmission tower models with different exposure times were analyzed to study the impact of corrosion on the transmission tower more comprehensively.
The failure mode of the tower was observed through the nonlinear buckling analysis of the finite element model of the transmission tower. Firstly, the equivalent loads of the transmission tower and lines were applied to the corresponding nodes, and the eigenvalue buckling analysis was performed on the transmission tower model. Secondly, the vibration mode result of buckling analysis was applied to the tower as an initial defect. Finally, the nonlinear buckling analysis was carried out on the tower after updating the model. The results showed that vulnerable members in the studied tower complied with buckling failure. Additionally, the possible failure members of the transmission tower can be obtained through uncertainty analysis. As shown in Figure 22a, the possible failure members of the tower are the main leg members in the 5th and 6th panels and the failure mode of tower is shown in Figure 22b.
The changes in the failure members and modes of transmission towers in different regions with the exposure time are listed in Table 11. Without considering the effect of corrosion, when the transmission tower collapses, there was a 70% probability that the failure member was No. 502, and a 30% probability that the failure member was No. 601. The failure mode of the transmission tower is plastic instability, that is, the transmission tower undergoes plastic deformation before collapsing. However, with an increase in the exposure time, the failure mode of the structure changes, and the transmission tower is prone to elastic instability, which indicates that the failure mode of the transmission tower tends to be brittle failure. In addition, the failure probability of each member in the transmission tower also changes with increasing corrosion of the tower members. The failure probability of member No. 502 decreased, and the failure probability of member No. 601 increased. From the failure modes of transmission towers in different regions, we observed that in the Beijing region, elastic instability would not occur in the transmission tower until the exposure time is 25 years; however, the transmission towers in the Qingdao, Jiangjin, and Guangzhou regions may experience elastic instability when the exposure time is 10 years, which indicates that in ordinary inland industrial regions, the failure modes of transmission towers are less affected by corrosion. However, in regions with severe acid rain and coastal industrial regions, the collapse failure modes of transmission towers will change significantly with the increase in the exposure time.

7. Conclusions

In this paper, a wind resistance evaluation method for a transmission tower is proposed and taking a 220 kV transmission tower as an example, the sensitivity of the transmission tower to various uncertain parameters was studied. The fragility curves for the transmission tower were obtained by pushover and incremental dynamic analyses, respectively. The variation curves of the steel corrosion depth in the transmission tower with exposure time were obtained based on a BP artificial neural network, and by taking the collapse wind speed and tower top displacement as the evaluation indicators, the decline trend of the wind-resistant performance of the transmission tower with the increase in corrosion was evaluated. The conclusions drawn from this study are summarized as follows:
(1)
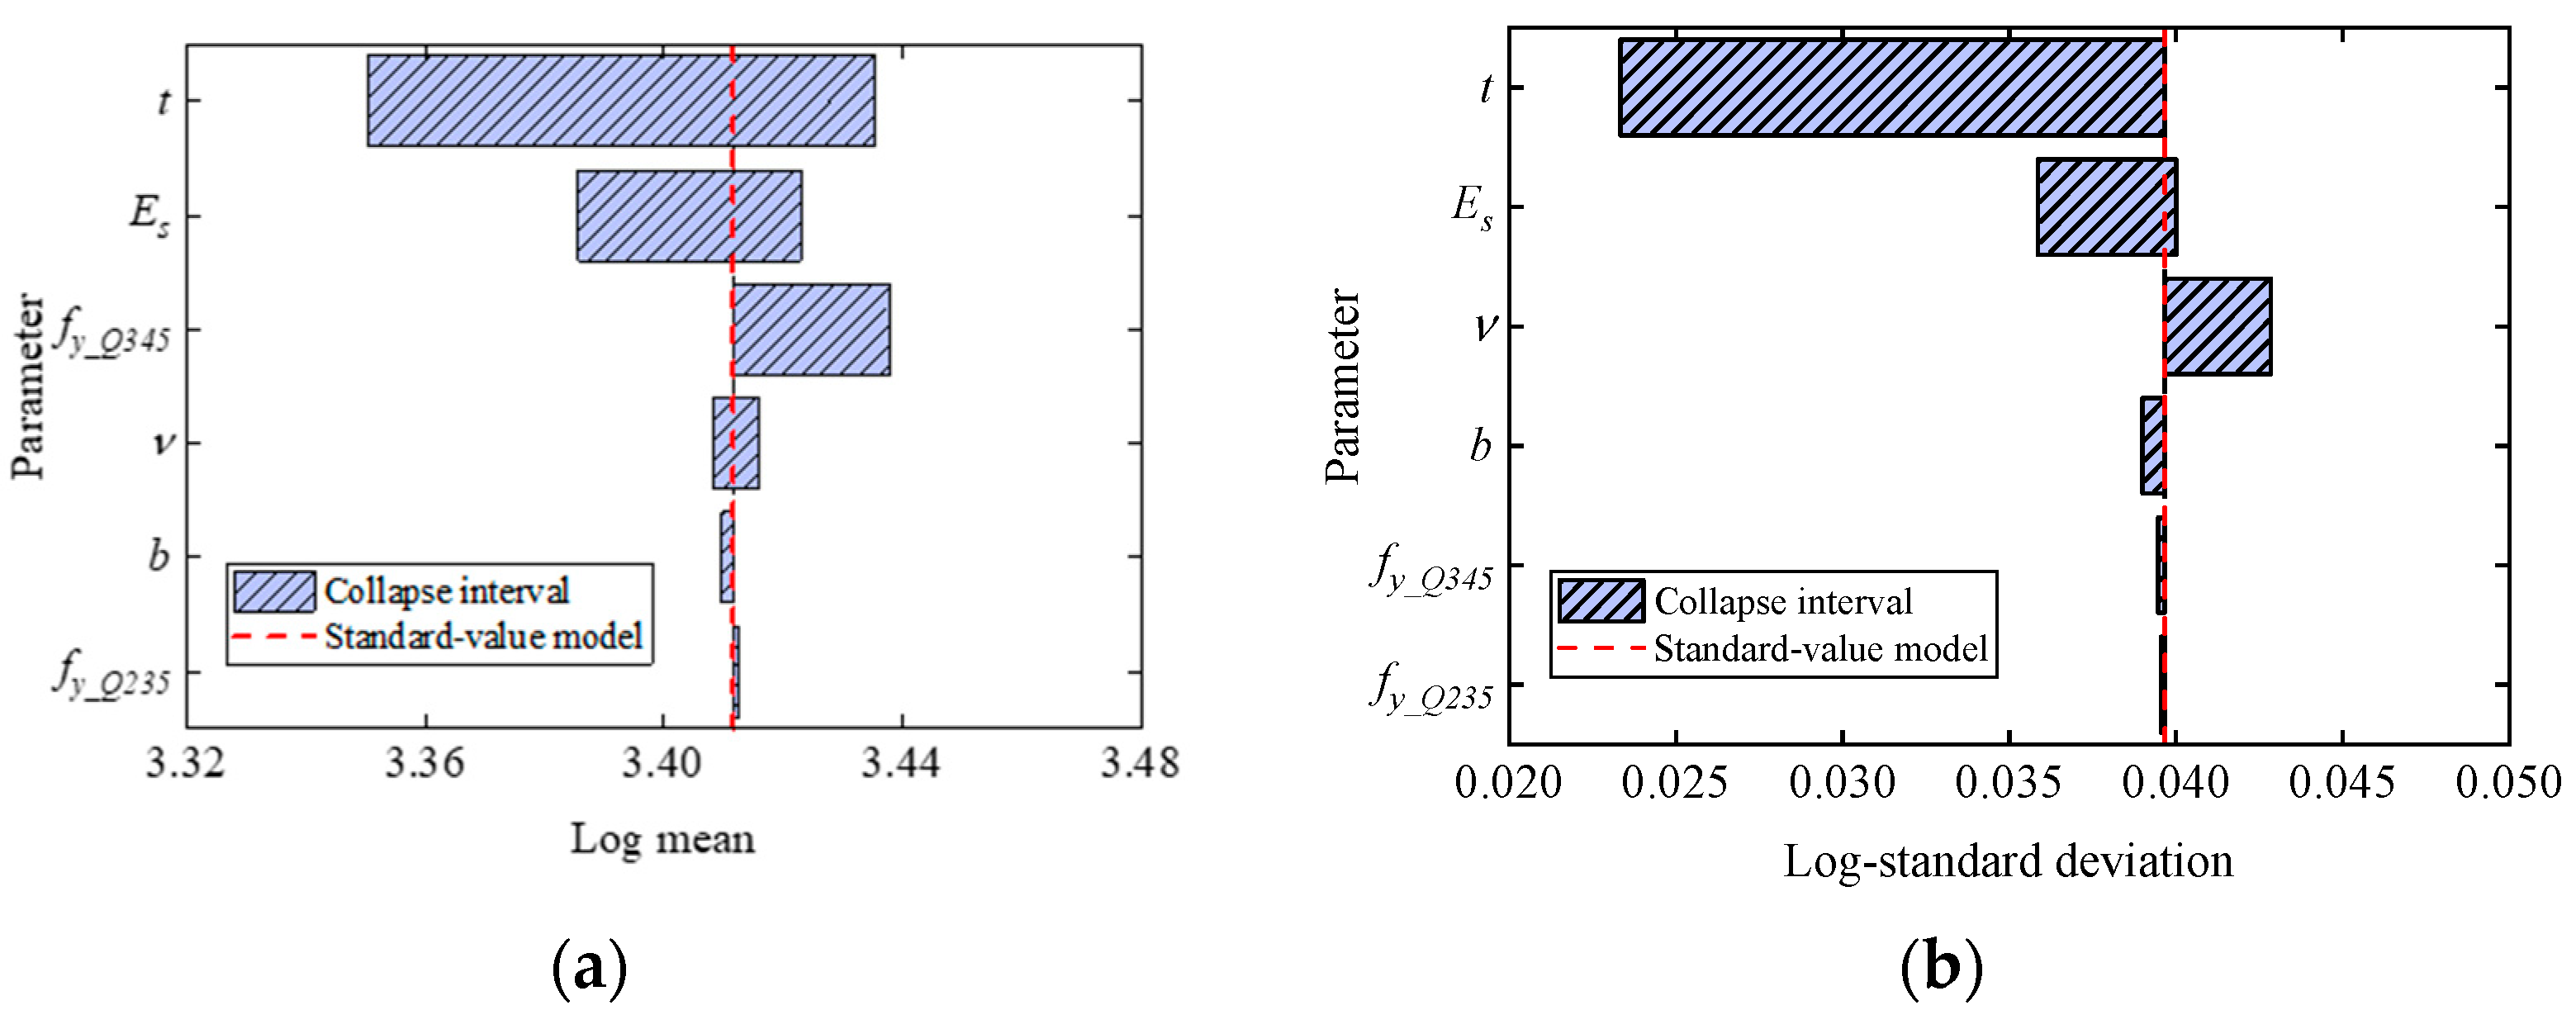
The sensitivity analysis of the transmission tower shows that the angle steel thickness has the greatest impact on the wind-resistant performance of the transmission tower when the tower is in operation, and the yield strength of Q345 steel and the elastic modulus also have a significant impact on the collapse wind speed. The change in geometric parameters reduces the log-standard deviation of the basic collapse wind speeds, and the variations in the elastic modulus and Poisson ratio can make the basic collapse wind speed results more dispersed. Therefore, more attention should be paid to the thickness of steel when designing and manufacturing transmission towers.
(2)
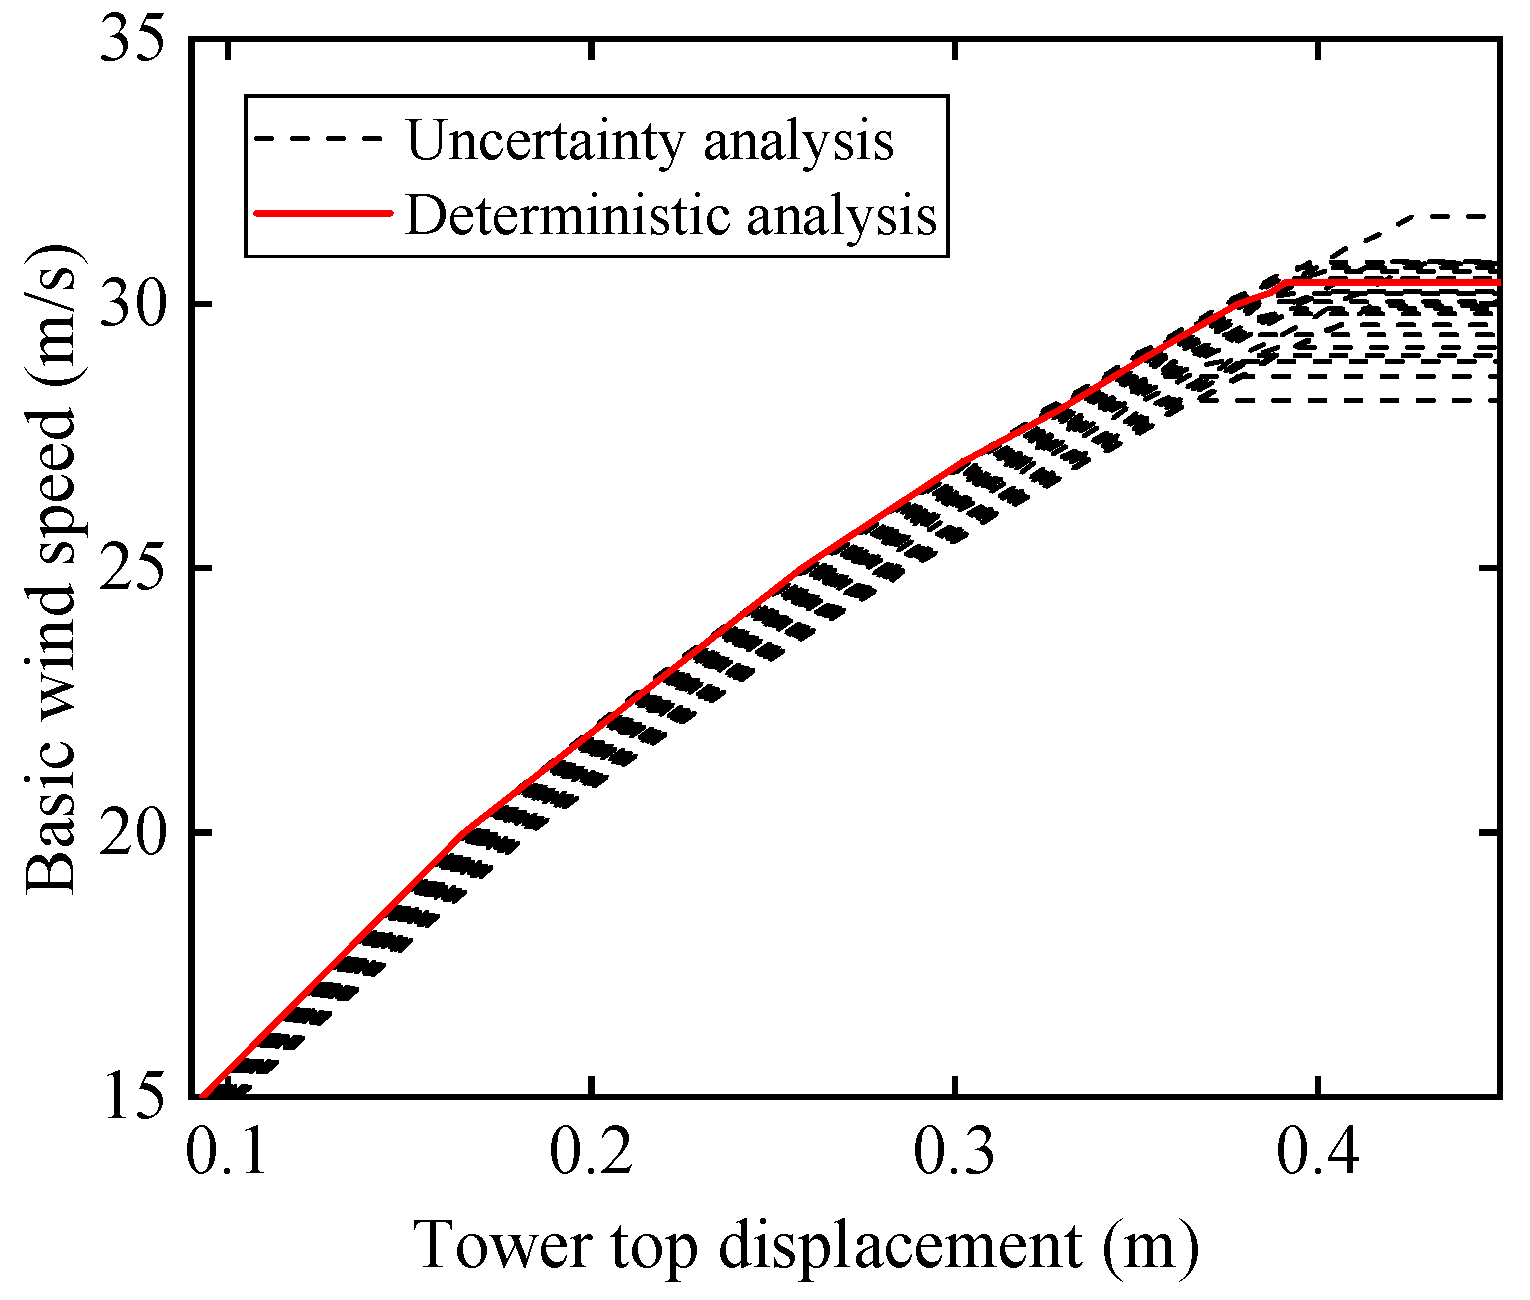
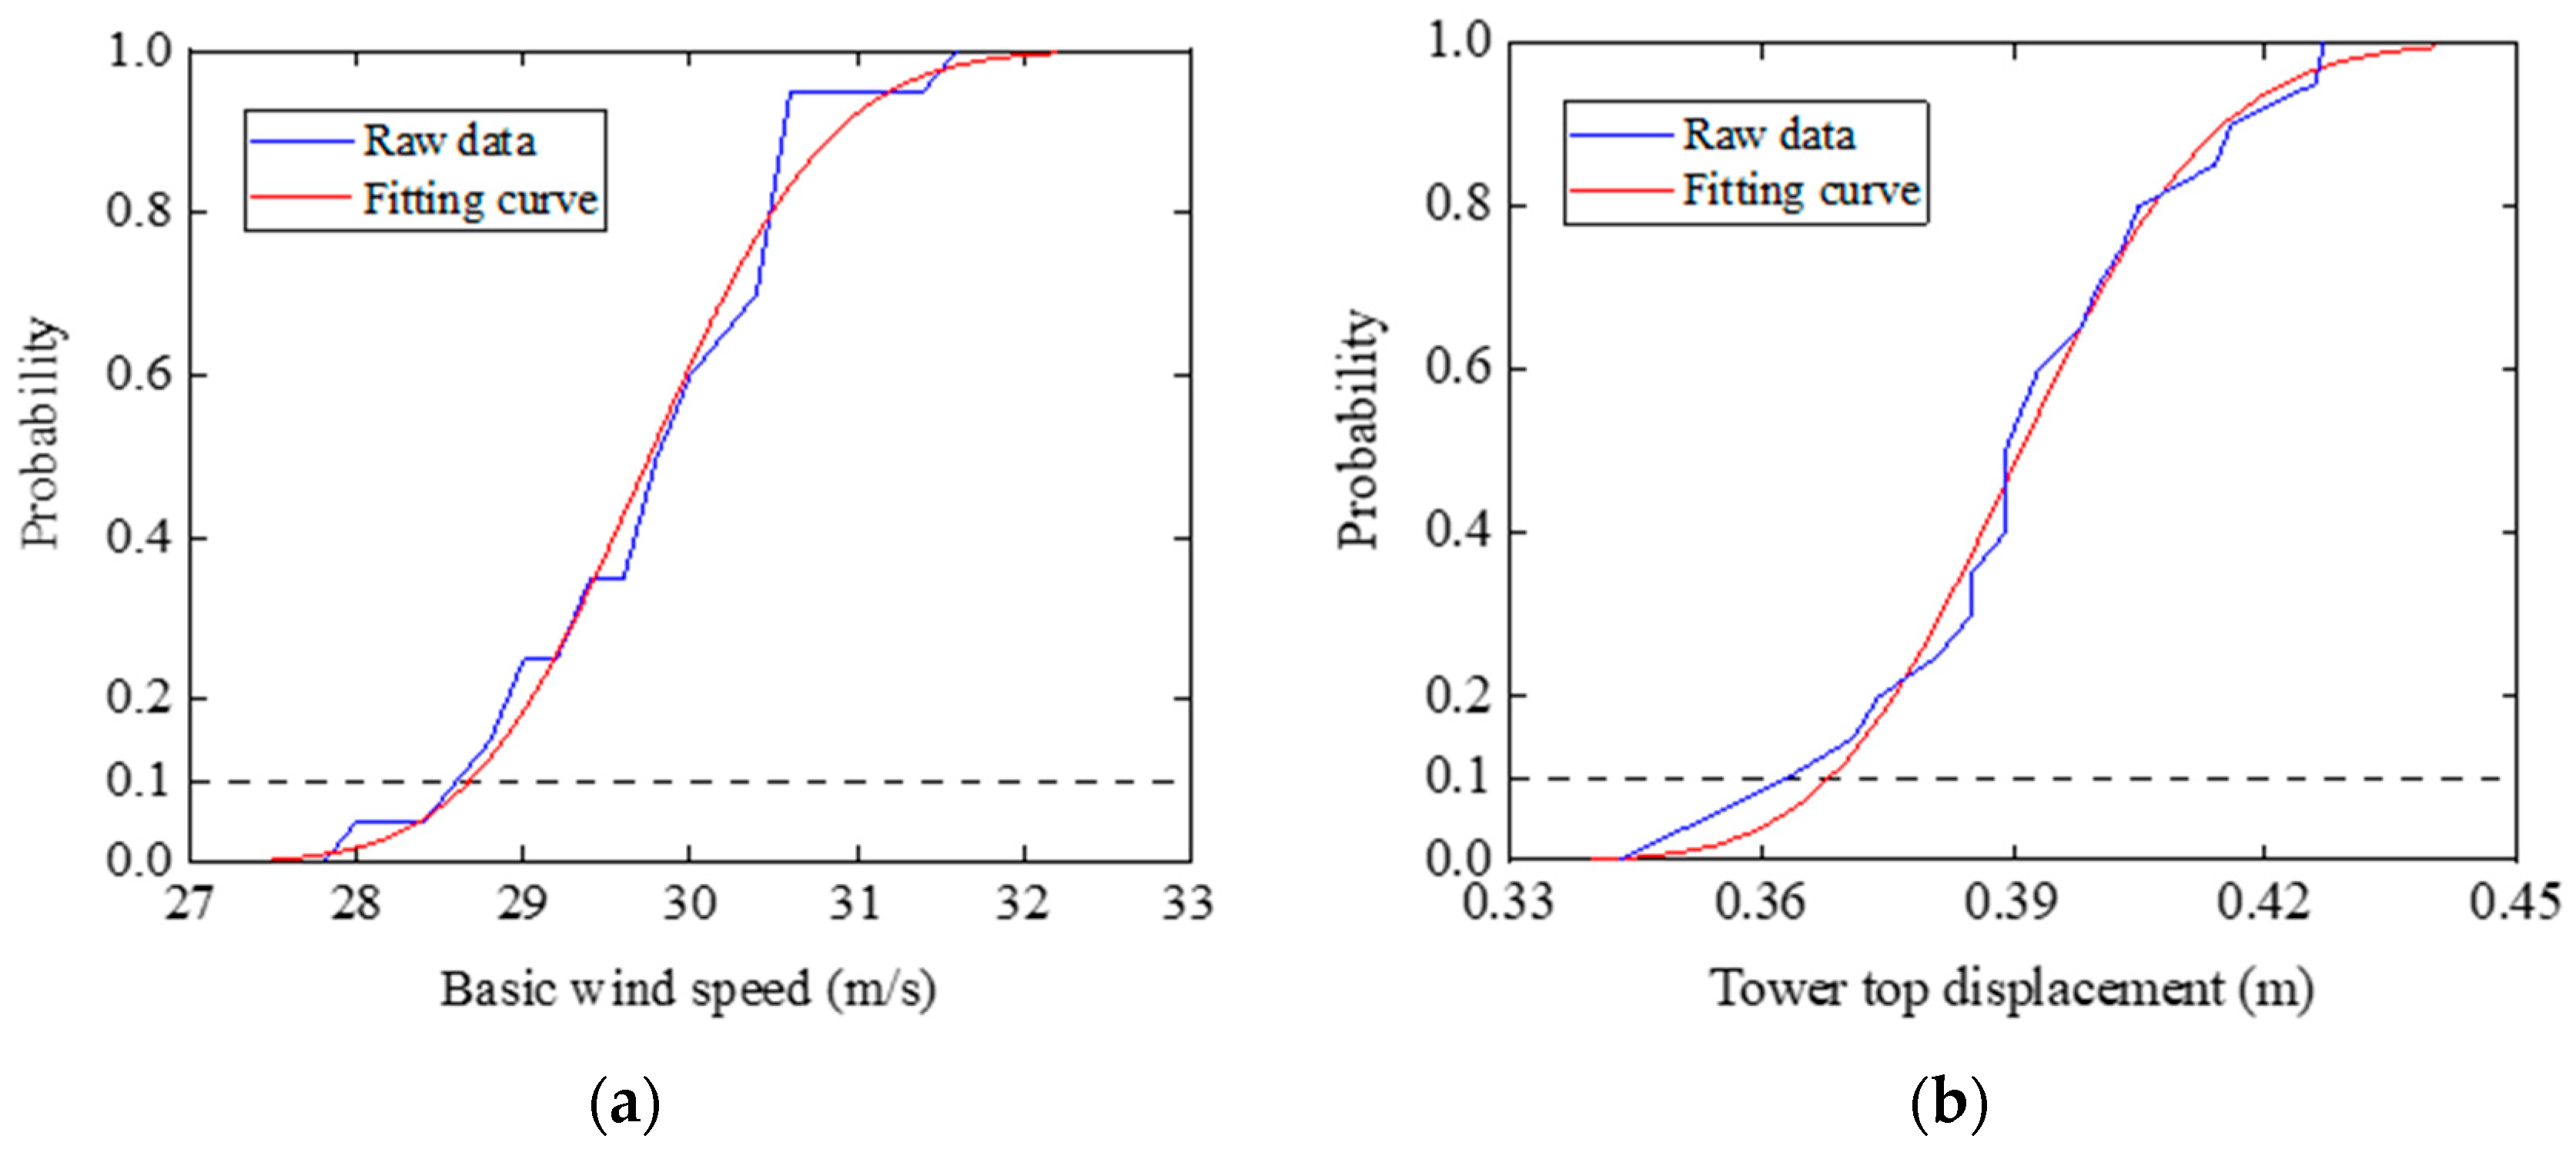
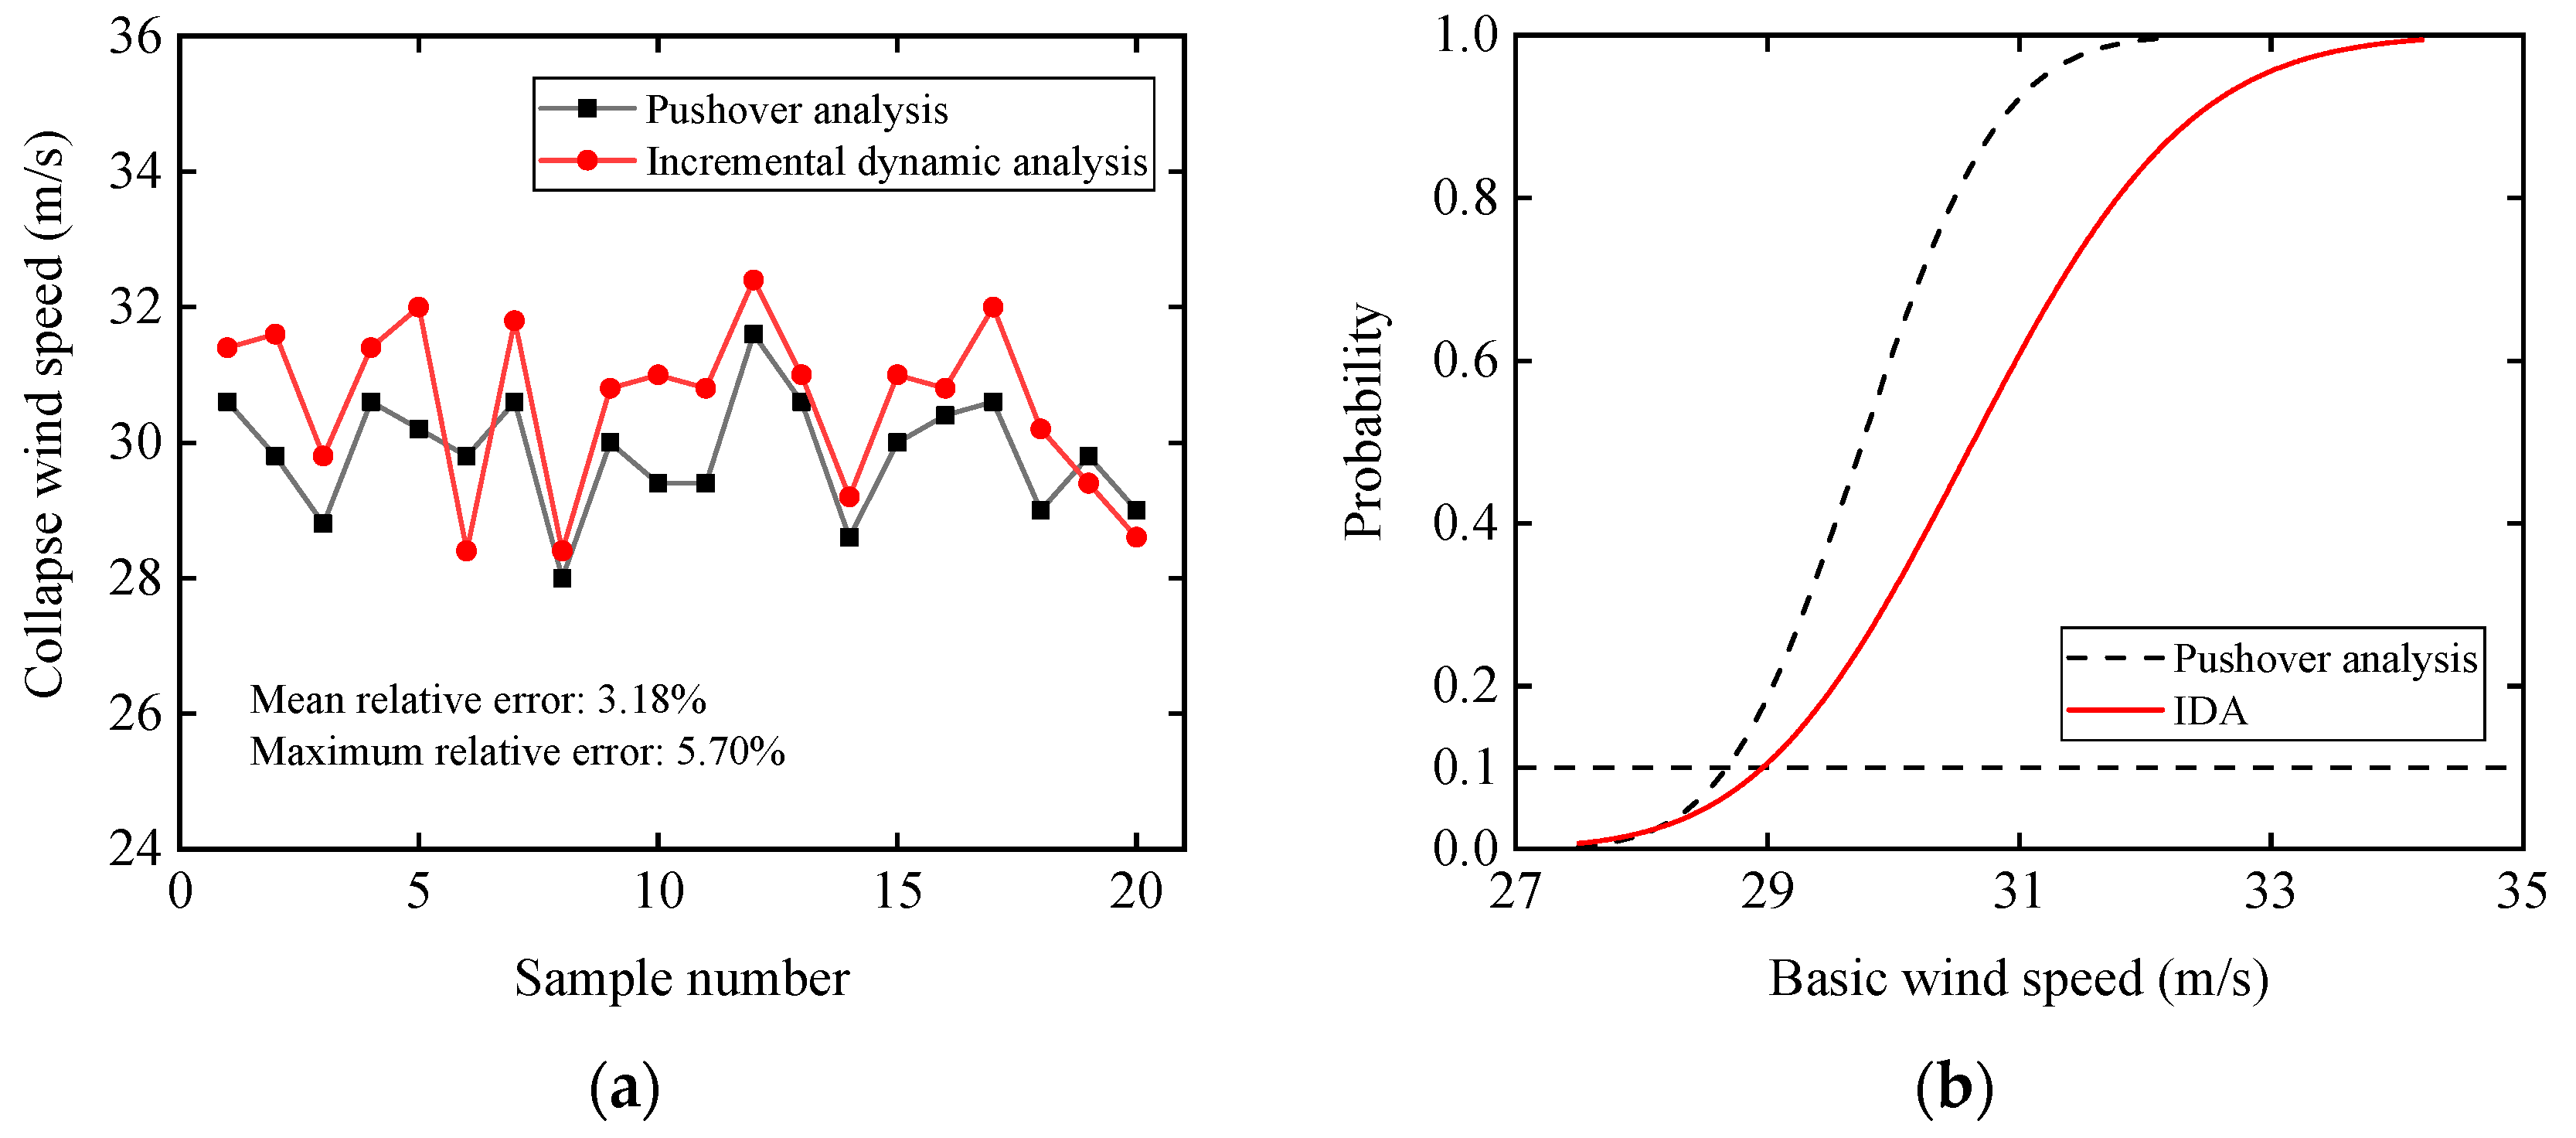
The collapse wind speed results obtained using the pushover analysis based on the load code for the design of the overhead transmission line [35] were close to those obtained by the incremental dynamic analysis. The maximum relative error was 5.7% and the mean relative error was 3.18%. The starting positions of the fragility curves obtained by the two methods were almost coincident, and the basic collapse wind speed results corresponding to a 10% probability differed by only 0.97%. Therefore, probability analysis method can improve the accuracy of the results.
(3)
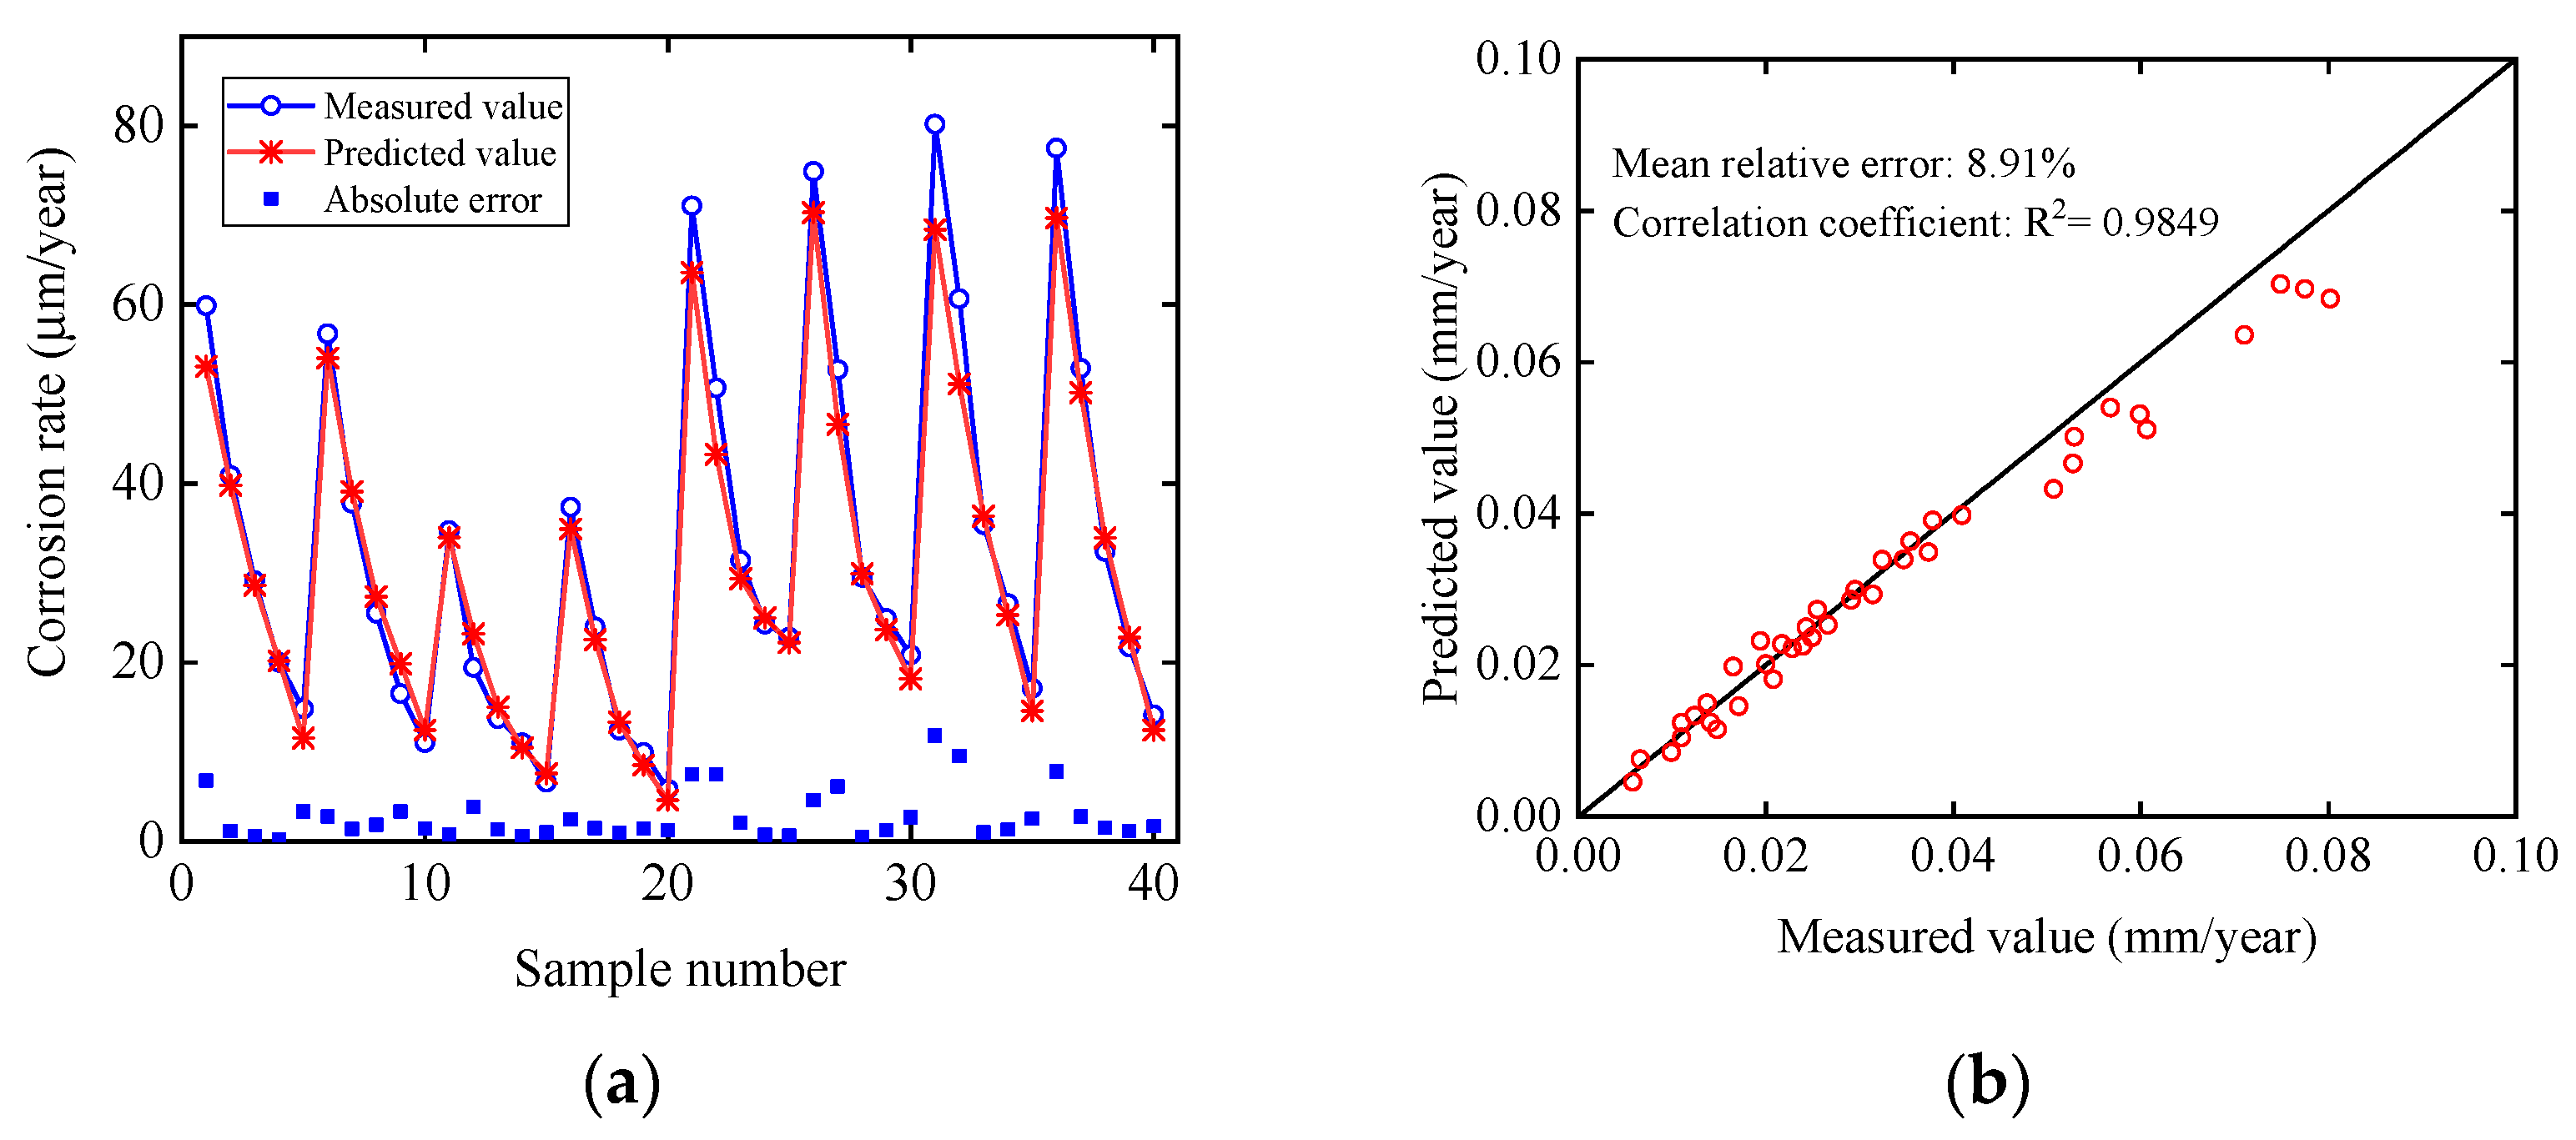
The accuracy of predicting the steel corrosion rate using a BP artificial neural network was high. The mean relative error between the predicted and measured values was 8.91% and the correlation coefficient was 0.9849. The mass loss ratios of the diagonal members were greater than those of the main leg members during the operation of the transmission tower, so in engineering design, it is feasible to use the artificial neural network method for corrosion prediction.
(4)
The corrosion of tower members will reduce the basic collapse wind speed of the tower and collapsed-tower top displacement, particularly in regions with severe acid rain and coastal industrial regions, and will result in variations in the failure mode and members of the transmission tower. With the increase in the exposure time, the possibility of brittle failure of the transmission tower increases; therefore, the transmission tower should be maintained in time according to the corrosion degree of the tower members in different regions.
This study evaluated, for the first time, the wind-induced collapse of a transmission tower with different corrosion degrees using the fragility analysis method, but we did not consider the texture characteristics of the steel surface after corrosion. In future research, more measured data and artificial intelligence methods should be combined to study the corrosion of transmission towers.

Author Contributions

C.L.: conceptualization, project administration, supervision, writing—review and editing, and funding acquisition. Z.Y.: methodology, investigation, software, data curation, and writing original draft. All authors have read and agreed to the published version of the manuscript.

Funding

This research was funded by the National Natural Science Foundation of China, grant number 51278091.

Institutional Review Board Statement

Not applicable.

Informed Consent Statement

Not applicable.

Data Availability Statement

The authors confirm that the data supporting the findings of this study are available within the article.

Acknowledgments

The authors sincerely appreciate the funding provided by the National Natural Science Foundation of China (Grant No. 51278091).

Conflicts of Interest

The authors declare that they have no known competing financial interests or personal relationships that could have influenced the work reported in this study.

References

  1. Roy, S.; Kundu, C.K. State of the art review of wind induced vibration and its control on transmission towers. Structures 2021, 29, 254–264. [Google Scholar] [CrossRef]
  2. Deng, H.Z.; Si, R.J.; Hu, X.Y. Wind Tunnel Study on Wind-Induced Vibration Responses of a UHV Transmission Tower-Line System. Adv. Struct. Eng. 2013, 16, 1175–1185. [Google Scholar] [CrossRef]
  3. Huang, M.F.; Lou, W.J.; Yang, L. Experimental and computational simulation for wind effects on the Zhoushan transmission towers. Struct. Infrastruct. E. 2012, 8, 781–799. [Google Scholar] [CrossRef]
  4. Prasad Rao, N.; Kalyanaraman, V. Non-linear behaviour of lattice panel of angle towers. J. Constr. Steel Res. 2001, 57, 1337–1357. [Google Scholar] [CrossRef]
  5. Zheng, H.D.; Fan, J. Progressive collapse analysis of a truss transmission tower-line system subjected to downburst loading. J. Constr. Steel Res. 2022, 188, 107044. [Google Scholar] [CrossRef]
  6. Zhang, J.; Xie, Q. Failure analysis of transmission tower subjected to strong wind load. J. Constr. Steel Res. 2019, 160, 271–279. [Google Scholar] [CrossRef]
  7. Yasui, H.; Marukawa, H.; Momomura, Y. Analytical study on wind-induced vibration of power transmission towers. J. Wind Eng. Ind. Aerod. 1999, 83, 431–441. [Google Scholar] [CrossRef]
  8. Battista, R.C.; Rodrigues, R.S.; Pfeil, M.S. Dynamic behavior and stability of transmission line towers under wind forces. J. Wind Eng. Ind. Aerod. 2003, 91, 1051–1067. [Google Scholar] [CrossRef]
  9. Yazdani, M.; Jahangiri, V.; Marefat, M.S. Seismic performance assessment of plain concrete arch bridges under near-field earthquakes using incremental dynamic analysis. Eng. Fail. Anal. 2019, 106, 104170. [Google Scholar] [CrossRef]
  10. Moazam, A.M.; Hasani, N.; Yazdani, M. Incremental dynamic analysis of small to medium spans plain concrete arch bridges. Eng. Fail. Anal. 2018, 91, 12–27. [Google Scholar] [CrossRef]
  11. Chen, D.H.; Yang, Z.H.; Wang, M. Seismic performance and failure modes of the Jin’anqiao concrete gravity dam based on incremental dynamic analysis. Eng. Fail. Anal. 2019, 100, 227–244. [Google Scholar] [CrossRef]
  12. Dolsek, M. Incremental dynamic analysis with consideration of modeling uncertainties. Earthq. Eng. Struct. D 2009, 38, 805–825. [Google Scholar] [CrossRef]
  13. Tian, L.; Zhang, X.; Fu, X. Fragility analysis of a long-span transmission tower-line system under wind loads. Adv. Struct. Eng. 2020, 23, 2110–2120. [Google Scholar] [CrossRef]
  14. Pan, H.Y.; Tian, L.; Fu, X. Sensitivities of the seismic response and fragility estimate of a transmission tower to structural and ground motion uncertainties. J. Constr. Steel Res. 2020, 167, 105941. [Google Scholar] [CrossRef]
  15. Lei, X.; Fu, X.; Xiao, K. Failure Analysis of a Transmission Tower Subjected to Wind Load Using Uncertainty Method. Proc. CSEE 2018, 38, 266–274. [Google Scholar] [CrossRef]
  16. Fu, X.; Wang, J.; Li, H.N. Full-scale test and its numerical simulation of a transmission tower under extreme wind loads. J. Wind Eng. Ind. Aerod. 2019, 190, 119–133. [Google Scholar] [CrossRef]
  17. Fu, X.; Li, H.N.; Li, G. Fragility analysis of a transmission tower under combined wind and rain loads. J. Wind Eng. Ind. Aerod. 2020, 199, 104098. [Google Scholar] [CrossRef]
  18. Fu, X.; Li, H.N.; Li, G. Fragility analysis and estimation of collapse status for transmission tower subjected to wind and rain loads. Struct. Saf. 2016, 58, 1–10. [Google Scholar] [CrossRef]
  19. Kenny, E.D.; Paredes, R.; Lacerda, L. Artificial neural network corrosion modeling for metals in an equatorial climate. Corros. Sci. 2009, 51, 2266–2278. [Google Scholar] [CrossRef]
  20. Kong, Z.Y.; Jin, Y.; Sabbir, H. Experimental and theoretical study on mechanical properties of mild steel after corrosion. Ocean Eng. 2022, 246, 110652. [Google Scholar] [CrossRef]
  21. Jia, C.; Shao, Y.S.; Guo, L.H. Incipient corrosion behavior and mechanical properties of low-alloy steel in simulated industrial atmosphere. Constr. Build. Mater. 2018, 187, 1242–1252. [Google Scholar] [CrossRef]
  22. Mccuen, R.H.; Albrecht, P. Effect of Alloy Composition on Atmospheric Corrosion of Weathering Steel. J. Mater. Civil Eng. 2005, 17, 117–125. [Google Scholar] [CrossRef]
  23. Wang, Z.F.; Liu, J.R.; Wu, L.X. Study of the corrosion behavior of weathering steels in atmospheric environments. Corros. Sci. 2013, 67, 1–10. [Google Scholar] [CrossRef]
  24. Feliu, S.; Morcillo, M. The prediction of atmospheric corrosion from meteorological and pollution parameters ―I. Annual corrosion. Corros. Sci. 1993, 34, 415–422. [Google Scholar] [CrossRef]
  25. Zhi, Y.J.; Fu, D.M.; Yang, T. Long-term prediction on atmospheric corrosion data series of carbon steel in China based on NGBM (1,1) model and genetic algorithm. Anti. Corros. Method. Mater. 2019, 66, 403–411. [Google Scholar] [CrossRef]
  26. Song, X.X.; Wang, K.Y.; Zhou, L. Multi-factor mining and corrosion rate prediction model construction of carbon steel under dynamic atmospheric corrosion environment. Eng. Fail. Anal. 2022, 134, 105987. [Google Scholar] [CrossRef]
  27. Mohammed, A.; Amer, M.; Ahmad, A. Predicting the Corrosion Rate of Medium Carbon Steel Using Artificial Neural Networks. Prot. Met. Phys. Chem. 2022, 58, 414–421. [Google Scholar] [CrossRef]
  28. Li, J.Y.; Men, C.; Qi, J.F. Impact factor analysis, prediction, and mapping of soil corrosion of carbon steel across China based on MIV-BP artificial neural network and GIS. J. Soil. Sediment. 2020, 20, 3204–3216. [Google Scholar] [CrossRef]
  29. Cai, J.P.; Cottis, R.A.; Lyon, S.B. Phenomenological modelling of atmospheric corrosion using an artificial neural network. Corros. Sci. 1999, 41, 2001–2030. [Google Scholar] [CrossRef]
  30. Halama, M.; Kreislova, K.; Van Lysebettens, J. Prediction of Atmospheric Corrosion of Carbon Steel Using Artificial Neural Network Model in Local Geographical Regions. Corrosion-US 2011, 67, 065004. [Google Scholar] [CrossRef]
  31. National Standards of the People’s Republic of China. Unified Standard for Reliability Design of Building Structures GB50068-2018; China Architecture & Building Press: Beijing, China, 2018. [Google Scholar]
  32. Chen, G.X.; Li, J.H. Statistical Parameters of material strength and geometric properties of shapes for steel members. J. Chongqing Jianzhu Univ. 1985, 1, 1–23. [Google Scholar]
  33. Alembagheri, M.; Seyedkazemi, M. Seismic performance sensitivity and uncertainty analysis of gravity dams. Earthq. Eng. Struct. Dyn. 2015, 44, 41–58. [Google Scholar] [CrossRef]
  34. Xu, Z.; Zhang, T.; Ge, X.D. Uncertainty analysis of transmission tower-line system under wind load. J. Shandong Univ. 2021, 51, 99–105. [Google Scholar]
  35. Power Industry Standards of the People’s Republic of China. Load Code for the Design of Overhead Transmission Line DL/T 5551-2018; China Planning Press: Beijing, China, 2018. [Google Scholar]
  36. National Materials Corrosion and Protection Data Center. Available online: https://www.corrdata.org.cn/index.php (accessed on 2 March 2022).
  37. Wang, R.B.; Xu, H.Y.; Li, B. Research on Method of Determining Hidden Layer Nodes in BP Neural Network. Comput. Technol. Dev. 2018, 28, 31–35. [Google Scholar]
  38. Chen, Y.; Qiang, C.M.; Wang, G.G. Corrosion and Protection of Transmission Towers. Elec. Power Constr. 2010, 31, 55–58. [Google Scholar]
Figure 1. Proposed procedure of the wind resistance evaluation method for the transmission tower.
Buildings 12 01500 g001
Figure 2. Segmentation of the tower and parameters of main leg members.
Buildings 12 01500 g002
Figure 3. The stress–strain relationship for angles in the FEM models.
Buildings 12 01500 g003
Figure 4. Finite element model of the structure.
Buildings 12 01500 g004
Figure 5. Sample distributions of uncertainty parameters. (a) Sampling result of elastic modulus. (b) Sampling result of yield strength of Q345 steel.
Buildings 12 01500 g005
Figure 6. Schematic diagram of simplified wind load points.
Buildings 12 01500 g006
Figure 7. Simulated wind speed results. (a) Wind speed at the top of the tower. (b) Comparison of the simulated and target spectrum.
Buildings 12 01500 g007
Figure 8. Stripe analysis results.
Buildings 12 01500 g008
Figure 9. Tornado chart of collapse wind speeds. (a) Log mean of basic collapse wind speeds. (b) Log-standard deviation of basic collapse wind speeds.
Buildings 12 01500 g009
Figure 10. Pushover curves for transmission tower models.
Buildings 12 01500 g010
Figure 11. Fragility curve for transmission towers. (a) Fragility curve of the basic collapse wind speed. (b) Fragility curve of collapsed-tower top displacement.
Buildings 12 01500 g011
Figure 12. Variation curve of the maximum tower top displacement. (a) One of the incremental dynamic analysis results. (b) Multiple incremental dynamic analysis results.
Buildings 12 01500 g012
Figure 13. Comparison of pushover analysis and IDA results. (a) Comparison results of the basic collapse wind speeds. (b) Comparison results of the basic collapse wind speed fragility curves.
Buildings 12 01500 g013
Figure 14. Schematic diagram of the BP artificial neural network.
Buildings 12 01500 g014
Figure 15. Evaluation results of the test set. (a) Comparison between measured values and predicted values. (b) Error analysis results of the test set.
Buildings 12 01500 g015
Figure 16. Predicted results of the Q235 steel corrosion rate.
Buildings 12 01500 g016
Figure 17. Predicted results of the Q345 steel corrosion rate.
Buildings 12 01500 g017
Figure 18. Fitting curves of corrosion depth.
Buildings 12 01500 g018
Figure 19. Fragility surface of the collapsed basic wind speed in each region.
Buildings 12 01500 g019
Figure 20. Fragility surface of the collapsed-tower top displacement in each region.
Buildings 12 01500 g020
Figure 21. Decay curves of the wind-resistant performance of the transmission tower.
Buildings 12 01500 g021
Figure 22. Initial failure members and failure mode of tower.
Buildings 12 01500 g022
Table 1. Material parameters of the conductor and ground wire.
Parameters2 × LGJ-400/35JLB20A-150
Diameter (mm)26.8215.75
Elastic modulus (GPa)65147.2
Cross-sectional area (mm2)425.24148.07
Weight (per unit length) (kg/km)1349989.4
Tensile breaking force (N)103900178570
Table 2. Probability distributions of material and geometric parameters.
ParameterVariableMean ValueCoefficient of VariationDistribution Type
Elastic modulus (GPa) E s 2060.03Lognormal
Poisson ratio ν 0.30.03Lognormal
Yield strength of Q235 steel (MPa) f y _ Q 235 263.70.07Lognormal
Yield strength of Q345 steel (MPa) f y _ Q 345 387.10.07Lognormal
Width of the angle steelb1.0010.008Normal
Thickness of the angle steelt0.9850.032Normal
Table 3. Wind load of each panel (basic wind speed at 25 m/s, wind incidence angle at 90°).
Panel NumberHeight above Ground (m)Height of Panel (m)Wind Pressure Height Variation Coefficient
μ Z
Wind
Vibration
Coefficient
β Z
Shape
Coefficient
μ S
Projected Area
A S   ( m 2 )
Standard Value of Reference Wind Pressure W 0   ( kN / m 2 ) Standard Value of Wind Load (kN)Design Value of Wind Load (kN)
137.02.31.4815.8602.2170.5280.3913.4324.805
233.15.91.4301.5372.2172.1540.3914.1005.740
329.41.81.3802.6422.2171.5960.3913.4414.817
424.96.31.3081.3162.3563.6350.3915.7588.061
518.07.51.1901.1162.3566.0180.3917.35210.293
610.86.91.0211.0592.3567.1200.3917.0839.156
73.67.51.0001.0122.3569.4670.3918.81812.345
Table 4. Wind load of conductor, ground line, and insulator.
Wind Speed (m/s)Wind Load Design Value of Middle
Conductor
P D 1   ( N )
Wind Load Design Value of Side
Conductor
P D 2 ,   P D 3   ( N )
Wind Load Design Value of Ground Wire
P B   ( N )
Wind Load Design Value of Middle
Insulator
P J D 1   ( N )
Wind Load Design Value of Side
Insulator
P J D 2 ,   P J D 3   ( N )
15456743441497314297
20811877202662558528
2512,67912,0564158871826
2613,71213,0394497942893
2714,78614,05948501016963
2815,90015,118521610931036
3018,24917,351598712551189
Table 5. Data selection for the artificial neural network model.
Network ParameterData Selection
Steel materialCarbon steel: 3C, 20, 15MnMoVN, 14MnMoNbB, 09MnNb(S), 08Al, 12CrMnCu, Q235;
Low-alloy steel: 16MnQ, 10CrMoAl, 10CrCuSiV, 09CuPTiRE, 09CuPCrNi, 09CuPCrNiA, Q345
RegionBeijing, Qingdao, Jiangjin, Guangzhou, Wuhan, Qionghai
Input factorMaterial parameters: Content of carbon, manganese, sulfur, phosphorus, silicon, and copper
Meteorological factors: annual average temperature, annual average relative humidity, annual sunshine hours, annual precipitation, SO2 concentration, Cl concentration, NO2 concentration, pH value of rainwaterExposure time
Table 6. Meteorological data of each region.
RegionAnnual
Average Temperature (°C)
Annual
Average
Relative
Humidity (%)
Annual
Sunshine Hours
(h)
Annual
Precipitation
(mm)
SO2
Concentration
(mg/cm3)
Cl
Concentration
(mg/cm3)
NO2 Concentration
(mg/100 cm2/d)
pH Value of Rainwater
Beijing12.8552368.6578.70.060.850.116.52
Qingdao12.8702199.9582.60.050.110.085.42
Jiangjin19.8771369.39980.220.000.085.44
Guangzhou21.5811582.92095.40.060.030.086.68
Wuhan17.1772092.51434.20.080.020.146.81
Qionghai24.6821743.12506.10.020.050.016.38
Table 7. Fitting results of corrosion depth prediction values.
Steel MaterialRegionAnR2
Q235Beijing34.030.59510.9953
Q235Qingdao65.370.65810.9988
Q235Jiangjin66.780.65920.9887
Q235Guangzhou51.890.66750.9886
Q345Beijing32.940.64440.9944
Q345Qingdao63.420.72190.9985
Q345Jiangjin65.200.68170.9877
Q345Guangzhou51.810.70440.9894
Table 8. Value of the reduction coefficient of mechanical properties.
Steel TypeYield StrengthUltimate StrengthElastic Modulus
Q2350.8750.8940.88
Q3450.960.990.98
Table 9. Collapsed basic wind speed statistics at different exposure times in each region.
Exposure Time (Years)VBJ (m/s)VQD (m/s)VJJ (m/s)VGZ (m/s)
028.6828.6828.6828.68
527.9627.0026.7927.31
1027.4726.0925.8226.45
1527.1225.2325.1625.78
2027.0624.2224.7525.35
2526.6723.4524.1924.96
VBJ, VQD, VJJ, and VGZ are the critical basic collapse wind speeds of the transmission towers in Beijing, Qingdao, Jiangjin, and Guangzhou, respectively.
Table 10. Collapsed-tower top displacement statistics at different exposure times in each region.
Exposure Time (Years)UBJ (m)UQD (m)UJJ (m)UGZ (m)
00.368 0.368 0.368 0.368
50.359 0.346 0.346 0.349
100.353 0.336 0.332 0.340
150.350 0.326 0.323 0.330
200.350 0.310 0.318 0.326
250.342 0.301 0.313 0.321
UBJ, UQD, UJJ, and UGZ are the critical collapse tower top displacements of the transmission towers in Beijing, Qingdao, Jiangjin, and Guangzhou, respectively.
Table 11. Collapse failure probability of the transmission tower in each region.
Exposure TimeInitial Failure MemberFailure Probability
(%)
Probability of Plastic Instability
(%)
Probability of Elastic Instability
(%)
Initial stateNo. 50270700
No. 60130300
5 to 20 years in BeijingNo. 50270700
5 years in QingdaoNo. 60130300
5 years in Jiangjin
5 years in Guangzhou
25 years in BeijingNo. 50270655
10 to 15 years in QingdaoNo. 60130300
10 to 15 years in Jiangjin
10 to 20 years in Guangzhou
20 years in JiangjinNo. 502705515
25 years in GuangzhouNo. 60130255
20 years in QingdaoNo. 502654520
25 years in JiangjinNo. 60135305
25 years in QingdaoNo. 502654520
No. 601352015
Publisher’s Note: MDPI stays neutral with regard to jurisdictional claims in published maps and institutional affiliations.

