Article

Continuous Reinforced Concrete Beams Strengthened with Fabric-Reinforced Cementitious Matrix: Experimental Investigation and Numerical Simulation

1
School of Civil and Environmental Engineering, Faculty of Engineering, Gardens Point Campus, Queensland University of Technology, Brisbane 4000, Australia
2
Department of Civil and Environmental Engineering, College of Engineering, Al Ain Campus, United Arab Emirates University, Al Ain 15551, United Arab Emirates
3
Seismic Solutions Ltd., Lower Hutt 5042, New Zealand
*
Author to whom correspondence should be addressed.
Buildings 2022, 12(1), 27; https://doi.org/10.3390/buildings12010027
Submission received: 28 November 2021 / Revised: 25 December 2021 / Accepted: 28 December 2021 / Published: 31 December 2021
(This article belongs to the Section Building Materials, and Repair & Renovation)

Abstract

:
This paper aims to examine the nonlinear flexural behavior of continuous RC beam specimens strengthened with fabric-reinforced cementitious matrix (FRCM) composites through experimental testing and numerical modeling. A total of nine two-span RC beam specimens were constructed and tested. Test parameters included the type of FRCM (carbon (C-FRCM) and polyparaphenylene benzobisoxazole (PBO-FRCM)), location of strengthening (sagging and hogging regions) and number of FRCM layers (two and four layers). Test results indicated that sagging strengthening resulted in a strength gain in the range of 17 to 29%, whereas hogging strengthening increased the load capacity by 9 to 17%. The use of C-FRCM resulted in a higher strength gain than that provided by PBO-FRCM composites. Specimens strengthened with PBO-FRCM exhibited, however, higher ductility and deformational capacity than those of their counterparts strengthened with C-FRCM. Doubling the number of FRCM layers resulted in no or insignificant increase in the load capacity but reduced the beam ductility. Specimens strengthened in the sagging regions exhibited moment redistribution ratios of 13 to 26% between the hogging and sagging regions. Insignificant moment redistribution was recorded for the specimens strengthened in the hogging region. Three-dimensional (3D) numerical simulation models, with and without an interfacial bond-slip law at the fabric–matrix interface, were developed. The inclusion of the bond-slip law in the modeling had an insignificant effect on predicted response. Although the models tended to underestimate the deflection, the predicted load capacities were within a 12% error band. Numerical findings were in agreement with those obtained from laboratory testing.

1. Introduction

The use of innovative composite-based strengthening solutions would prolong the service life of reinforced concrete (RC) structures, reduce the operational cost, and minimize the repair cycles. Fabric-reinforced cementitious matrix (FRCM) composites involve the use of nonmetallic fabrics and cement-based matrices. The inclusion of steel-free fabrics in the strengthening solution eliminates the risk of corrosion of the strengthening system, whereas the use of a cementitious matrix improves the heat resistance of the system and reduces the risk of debonding at the matrix–concrete substrate interface [1].
Fabric-reinforced cementitious matrix composites have the potential to improve the flexural capacity of RC beams to a level comparable or slightly less than that offered by epoxy-based composite systems [2,3,4]. Failure of the FRCM in strengthened RC beams is mainly due to debonding at the fabric–matrix interface. Other failure modes reported in the literature include debonding/slippage of the fabric from the matrix, detachment of the FRCM composite layer at the matrix–concrete substrate interface due to poor surface preparation, and sudden detachment of the FRCM composite layer with the fracture surface within the concrete, typically, at the level of the steel reinforcing bars [5]. The latter failure mode is also known as concrete cover separation/cover rip-off [6,7].
The strength gain and failure mode of FRCM-strengthened beams are highly dependent on mechanical properties of the fabric and matrix and the bond characteristics at the fabric–matrix interface. In the presence of an adequate bond at the fabric–matrix interface, the flexural capacity may be related to the ratio of the axial stiffness of the FRCM composite reinforcement to that of the steel reinforcing bars [8,9,10,11,12,13]. Nevertheless, an inadequate bond and adherence between the fabric and matrix may hinder any improvement in the flexural capacity [8,14]. Although increasing the number of FRCM layers results in a nonproportional increase in the strength gain, it reduces the beam ductility and deformational capacity [5,6,7,15,16,17,18,19,20]. Despite their potential to increase the flexural strength gain, additional FRCM composite layers could change the failure mode from concrete crushing after steel yielding (i.e., ductile mode of failure) or fabric slippage from the matrix to a premature, sudden failure due to intermediate crack debonding or sudden detachment from the concrete substrate [9,15,17].
Previous studies focused on examining the behavior of simply supported beams strengthened with FRCM, although practical applications would typically involve strengthening of continuous RC beams. The behavior of FRCM-strengthened continuous RC beams is different from that of simply supported beams. The load capacity of simply supported beams is directly proportional to the moment capacity of the midspan section. Simply supported beams fail once the midspan section reaches its moment capacity. Conversely, the load capacity of continuous RC beams is governed by the rotational and moment capacities of critical sections at both sagging and hogging regions [21,22,23,24,25,26]. When one of the critical sections reaches its moment capacity in two-span RC beams, the beam can still carry additional loads and sustain further deformations prior to complete failure. The extent to which an additional load can be carried by a two-span RC beam depends on the rotational capacity of the section that has yielded first and the moment capacity of the other section. As such, data reported in previous studies on flexural behavior of simply supported RC beams strengthened with FRCM composites in terms of the gain in load capacity and change in ductility are not valid for the case of continuous RC beams.
To the best knowledge of the authors, only two studies published recently examined the behavior of continuous RC beams strengthened with FRCM composites [25,26]. The beams tested in these two studies had two spans reinforced with the same amount of steel on both tension and compression sides and strengthened with the same type of FRCM (C-FRCM). The loading configuration rendered a shear span-to-effective depth ratio (a/d) of 2.5. Findings of these two studies indicated that strengthening of continuous RC beams with FRCM resulted in a negligible improvement in the load capacity and a severe ductility reduction. The poor performance of the FRCM strengthening was attributed in one of the studies to the poor surface preparation and insufficient impregnation of the carbon fibers into the matrix [25]. It was reported also that FRCM weakened the moment redistribution capacity between the sagging and hogging regions [25,26]; therefore, it resulted in a significant ductility reduction and an insignificant gain in the load capacity. It is believed that the small value of a/d adopted in these two studies did not allow for a meaningful assessment of the flexural behavior of continuous RC beams because of the possible development of an arch action effect. Further research is needed to better understand the behavior of continuous RC beams strengthened with FRCM composites.
This research focuses on studying the nonlinear flexural behavior of continuous RC beams strengthened with different types of FRCM. A total of nine two-span RC beam specimens were tested. The specimens’ geometry and steel detailing were designed in a way to ensure that a flexural mode of failure would dominate. The loading configuration adopted in the current study rendered an a/d ratio of 4.4 to avoid occurrence of an arch action effect, therefore, allowing for a proper assessment of each specimen’s flexural behavior. Test parameters included the type of FRCM (C-FRCM and PBO-FRCM), the amount of FRCM (two and four layers), and location of FRCM strengthening (sagging or hogging). The experimental investigation was supplemented by numerical modeling. A comparative analysis between predicted and measured results was conducted to examine the accuracy of the models. Due to the lack of knowledge on the subject, results of the present study would enrich the literature and help practitioners and researchers to better understand the nonlinear flexural behavior of continuous RC beams strengthened with FRCM composites.

2. Research Significance

Although previous studies provided interesting findings and conclusions on the flexural behavior of simply supported RC beams strengthened with FRCM composites, there is a lack of knowledge on the behavior of continuous RC beams strengthened with FRCM in either the sagging or the hogging region. Practical application would typically involve strengthening of continuous beams rather than simply supported beams. This research aimed to fill this gap through experimental testing and numerical modeling. The main aim of the study was to provide experimental evidence on the interactions between the type of FRCM composite, location of strengthening, gain in load capacity, ductility index, and moment redistribution between the hogging and sagging regions. The experimental investigation was supplemented by 3D numerical modeling to simulate the nonlinear flexural behavior of the tested continuous RC beam specimens. Outcomes of this research could contribute to an improved understanding of the nonlinear flexural behavior of continuous RC beams strengthened with FRCM composites. A comparison between numerical and experimental results verified the capability of the developed models to predict the nonlinear response of the tested specimens with good accuracy. The numerical models developed in the current study can be used in future research to study the effect of a wider range of parameters on the nonlinear flexural response of FRCM-strengthened continuous RC beams.

3. Experimental Program

The experimental study comprised testing of nine two-span RC beam specimens. Test variables included the type of FRCM used in strengthening (C-FRCM and PBO-FRCM), location of strengthening (sagging and hogging regions), and number of FRCM layers (two and four layers). A flowchart of the activities of the experimental program is shown in Figure 1. Flexural and shear design of the beam specimens was conducted in accordance with ACI 318-19 [27]. The characterization of concrete, steel, and mortar properties was conducted in accordance with the corresponding standards [28,29,30,31,32,33].

3.1. Test Matrix

The test matrix is given in Table 1. One beam was a control specimen without strengthening. Four beams (group A) were strengthened in the sagging region, whereas the remaining four beams (group B) were strengthened in the hogging region. The strengthening regime consisted of either two or four FRCM layers. The fabric used was either carbon or polyparaphenylene benzobisoxazole (PBO). The specimens were designated as X-YZ, where X refers to the strengthening location (sagging (S) or hogging (H) region), Y refers to the type of fabric (carbon (C) or PBO (P)), and Z refers to the number of FRCM layers applied to the beams (2 or 4). The load capacity of continuous RC beams is governed by the moment capacity of both sagging and hogging regions and more importantly, the ability of the first yielded section to distribute the moment to the other section until both sections reach their full moment capacity. Although hogging strengthening is anticipated to be less effective than sagging strengthening, it might be easier and quicker to apply in a practical setting because it does not require installation of the scaffolding necessary for the application of an overhead sagging strengthening. In contrast, hogging strengthening would delay the yielding of steel in the hogging region; therefore, it would limit the moment redistribution capacity between the hogging and sagging regions. The effects of strengthening in either the hogging and sagging region on the load capacity and moment redistribution index were investigated in this research. Specimens in the current study were strengthened with the same amount of FRCM in either the sagging or hogging region to isolate the effect of strengthening location on the nonlinear behavior of strengthened continuous RC beams and minimize the risk of ductility reduction due to strengthening of both regions simultaneously [26]. This study can, however, be extended in the future to investigate the behavior of continuous beams strengthened with FRCM in both sagging and hogging regions.

3.2. Test Specimens

Test specimens had a width of 150 mm, depth of 250 mm, and total length of 5200 mm (Figure 2). Each specimen comprised two equal spans, of 2400 mm each. The tension reinforcement consisted of three 12 mm diameter steel reinforcing bars in both sagging and hogging regions. The concrete cover to the center of the tension steel bars was 25 mm, rendering an effective depth of d = 225 mm. The corresponding tension steel reinforcement ratio (ρs) was 1%, which is typically used in practical settings, and also well below the balanced reinforcement ratio (ρb = 2%) calculated in accordance with ACI 318-19 [27] based on the cylinder compressive strength of the concrete and yield strength of the steel used in the current study. The sagging reinforcement stopped at a distance of 150 mm from the middle support. The hogging reinforcing bars had a total length of 1600 mm. They were extended inside each span for a distance equal to one third of the beam span. Two 6 mm diameter bars were used as hangers in the compression zone of both sagging and hogging regions. The stirrups, 8 mm in diameter, were distributed at a spacing of 75 mm along the beam length. The beams were adequately reinforced for shear, allowing the load capacity to be attained without shear failure.

3.3. Materials

Concrete—A readymix concrete was used in the current study. Ordinary Portland cement was used. The concrete mix proportions by weight were as follows (cement:fine aggregates:coarse aggregates:w/c; 1:1.94:2.69:0.43). A superplasticizer was added, at a dosage of 4.4 kg/m3, to improve the workability of the mix. The fine aggregates comprised a combination of crushed sand (70%) and dune sand (30%). The coarse aggregates were a blend of 10 mm (33%) and 20 mm (67%) crushed aggregates. Concrete cylinders (150 mm × 300 mm) and cubes (150 mm × 150 mm × 150 mm) were sampled during casting. The cube and cylinder compressive strength tests of the concrete were conducted in accordance with BS 12390-3 [28] and ASTM C39 [29], whereas the splitting tensile strength test was conducted as per ASTM C496 [30]. Based on the results of 5 replicate samples, the average cube concrete compressive strength, cylinder compressive strength, and splitting tensile strength were 40, 29, and 2.4 MPa, respectively.
Steel—Three replicate samples were tested for each steel bar diameter as per BS 4449:2005 [31]. The 12 mm diameter steel bars that were used as the main tension steel had average yield and ultimate strengths of 561 and 649 MPa, respectively. The yield strength of the 6 and 8 mm diameter steel bars were 525 and 524 MPa, respectively, whereas their respective ultimate strengths were 633 and 643 MPa, respectively.
FRCM—Carbon-FRCM (C-FRCM) and polypara-phenylene-benzo-bisthiazole-FRCM (PBO-FRCM) systems were used to strengthen the beams. The cementitious matrix used with each type of fabric was provided by the corresponding manufacturer. Mechanical properties tests were conducted as per ASTM standards [32,33]. Based on the results of three replicate specimen tests, the cube compressive strength, cylinder compressive strength, and splitting tensile strength of the cementitious matrix used in the C-FRCM system were on average 45, 35, and 3.4 MPa, respectively, whereas the Young’s modulus was 28 GPa. The respective values of the matrix used in the PBO system were on average 35, 28, and 4.0 MPa, whereas the Young’s modulus was 9 GPa. The carbon fabric used in this study consisted of unidirectional carbon fiber bundles with a center-to-center spacing of 17 mm (Figure 3a). The PBO fabric was bidirectional with a center-to-center spacing of 10 and 17.5 mm between bundles of the warp and weft directions, respectively (Figure 3b). Properties of the fabrics, as provided by the manufacturer [34,35], are listed in Table 2.

3.4. FRCM Strengthening Methodology

The strengthened part of the sagging region had a length of 2100 mm, whereas that of the hogging region had a length of 1600 mm (Figure 4). Sagging strengthening was conducted in the laboratory with the beams upside-down. Strengthened regions were marked on the concrete surface. A high-pressure waterjet was used to roughen the concrete surface of the designated areas. Formwork was installed on the sides to maintain the desired thickness of FRCM layers. The surface was then cleaned of dust and loose particles. The area was then moistened for 24 h using wet burlaps prior to the placement of mortar. The cementitious matrix was mixed according to the specifications provided by the manufacturer. A 4 mm thick mortar layer was first placed on the concrete surface. A single fabric sheet was then applied onto the matrix, then pressed gently with gloved hands to ensure impregnation of the fabric into the mortar. A second layer of matrix was then applied, rendering a total composite layer of approximately 8 mm. The process was repeated to apply other successive layers of FRCM composites. Following the application of FRCM composite layers, the strengthened regions were covered with burlaps and polyethylene sheets for 24 h, moisture-cured using wet burlaps for 7 days, then left to air-cure for a minimum of 28 days prior to testing. Figure 5 summarizes the strengthening process.
The application of FRCM in field situations would follow the same procedure adopted in the current study. Nevertheless, in practical settings, temporary shoring is typically applied prior to strengthening to release the applied stress in the steel reinforcement [36]. Overhead strengthening would require installation of scaffolding for the workers to prepare the surface of concrete [36]. The mortar layers of the FRCM are non-sag; therefore, they can be applied to an overhead surface in a way similar to that applied during conventional repair using a trowel or a similar tool [36]. Previous research indicated that installation of carbon fiber-reinforced polymer composite layers upward (i.e., against gravity) in overhead applications resulted in a maximum of 2.1% delaminated area with no or insignificant reduction in the bond and flexural strengths [37,38]. The researchers concluded that the upward application of composites is unlikely to cause any significant loss of bond between the composite layer and concrete substrate or the flexural capacity of the strengthened element [37,38].

3.5. Test Set-Up and Instrumentation

The specimens were placed on three supports. The center-to-center spacing between the supports was 2400 mm (span length). A 500 kN capacity MTS actuator was used to apply the load at the midpoint of the beam. A steel spreader beam was used to distribute the load on two points, one in each span. The load points were located at a distance 0.4 L (960 mm) from the middle support, where L = beam span. The support and load steel plates were 100 mm × 150 mm × 20 mm. A load cell was placed between the actuator and top surface of the steel spreader beam to measure the total applied load. Another load cell was placed between the middle support and the bottom soffit of the beam to measure the middle support reaction. Two linear variant displacement transducers (LVDTs) were used to measure the beam deflection at the bottom soffit below the load points. Strain gauges (SGs), with a gauge length of 5 mm, were bonded to the tension steel bars to measure the steel strain at locations of maximum moments in the sagging and hogging regions. The beams were tested under a displacement-controlled loading at a rate of 1.5 mm/min following the typical procedure adopted previously in testing two-span RC beam specimens [21,22,23,24]. A schematic showing test setup and instrumentation is given in Figure 6.

4. Experimental Results

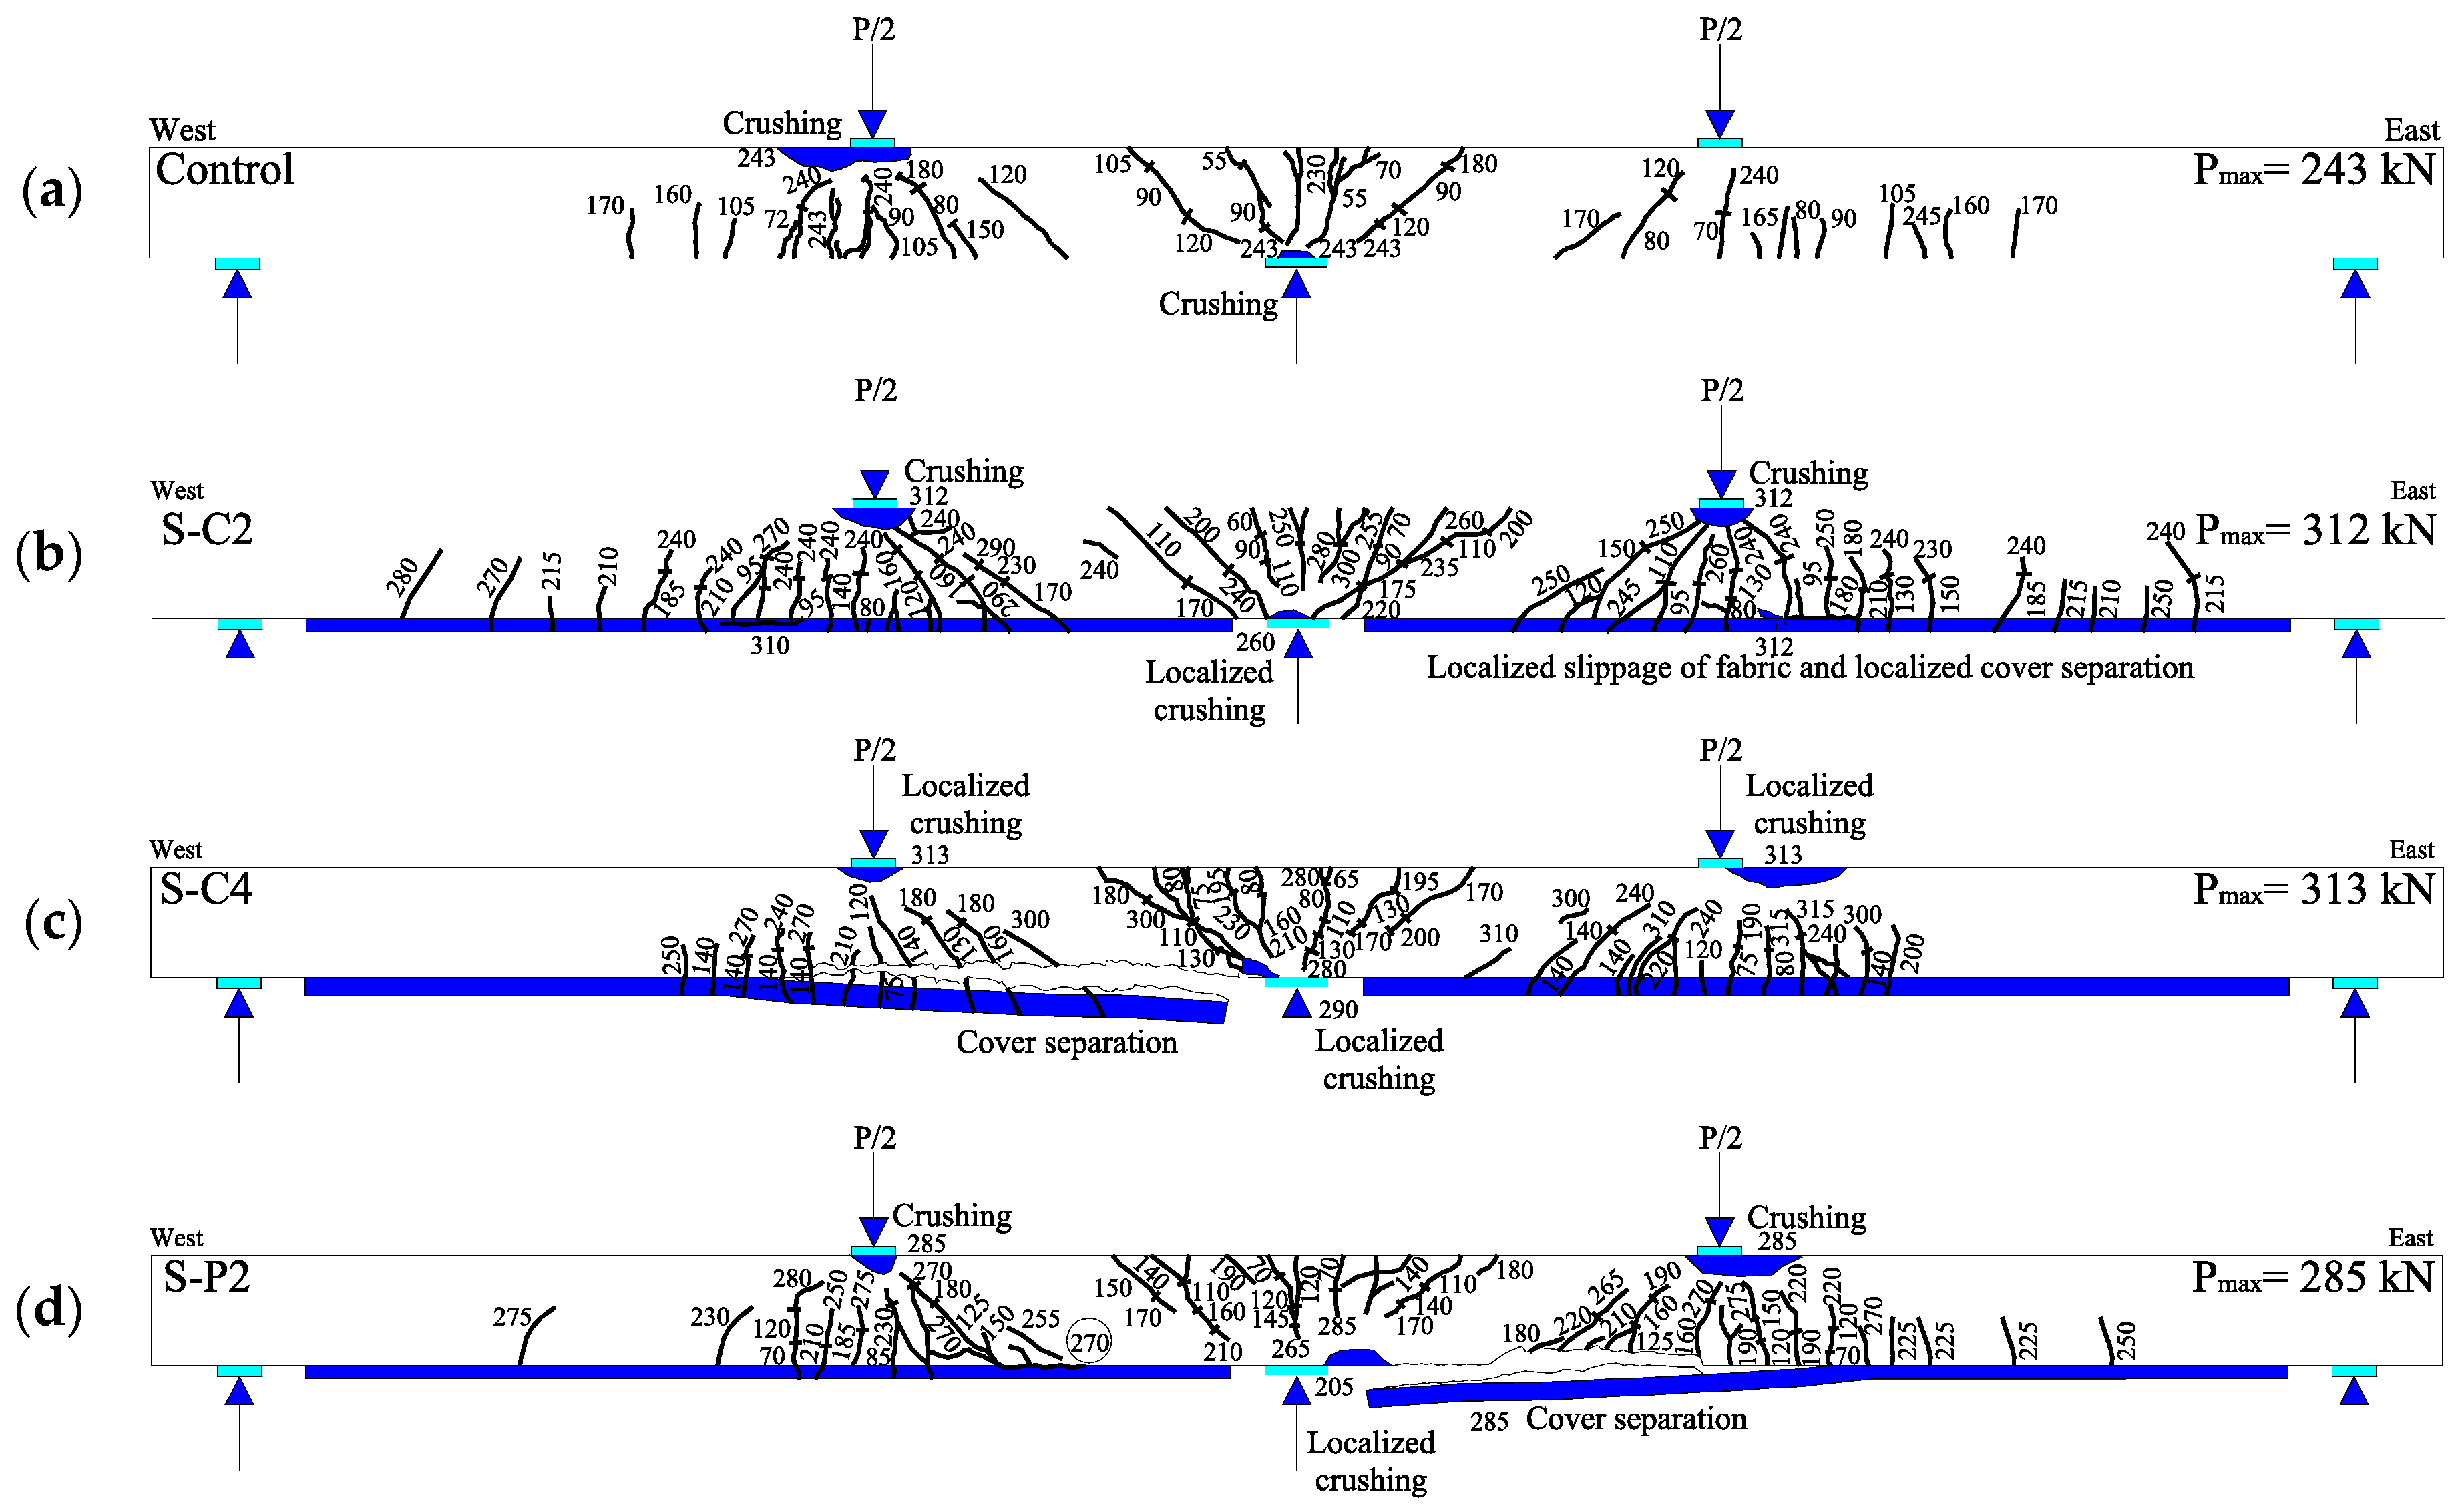
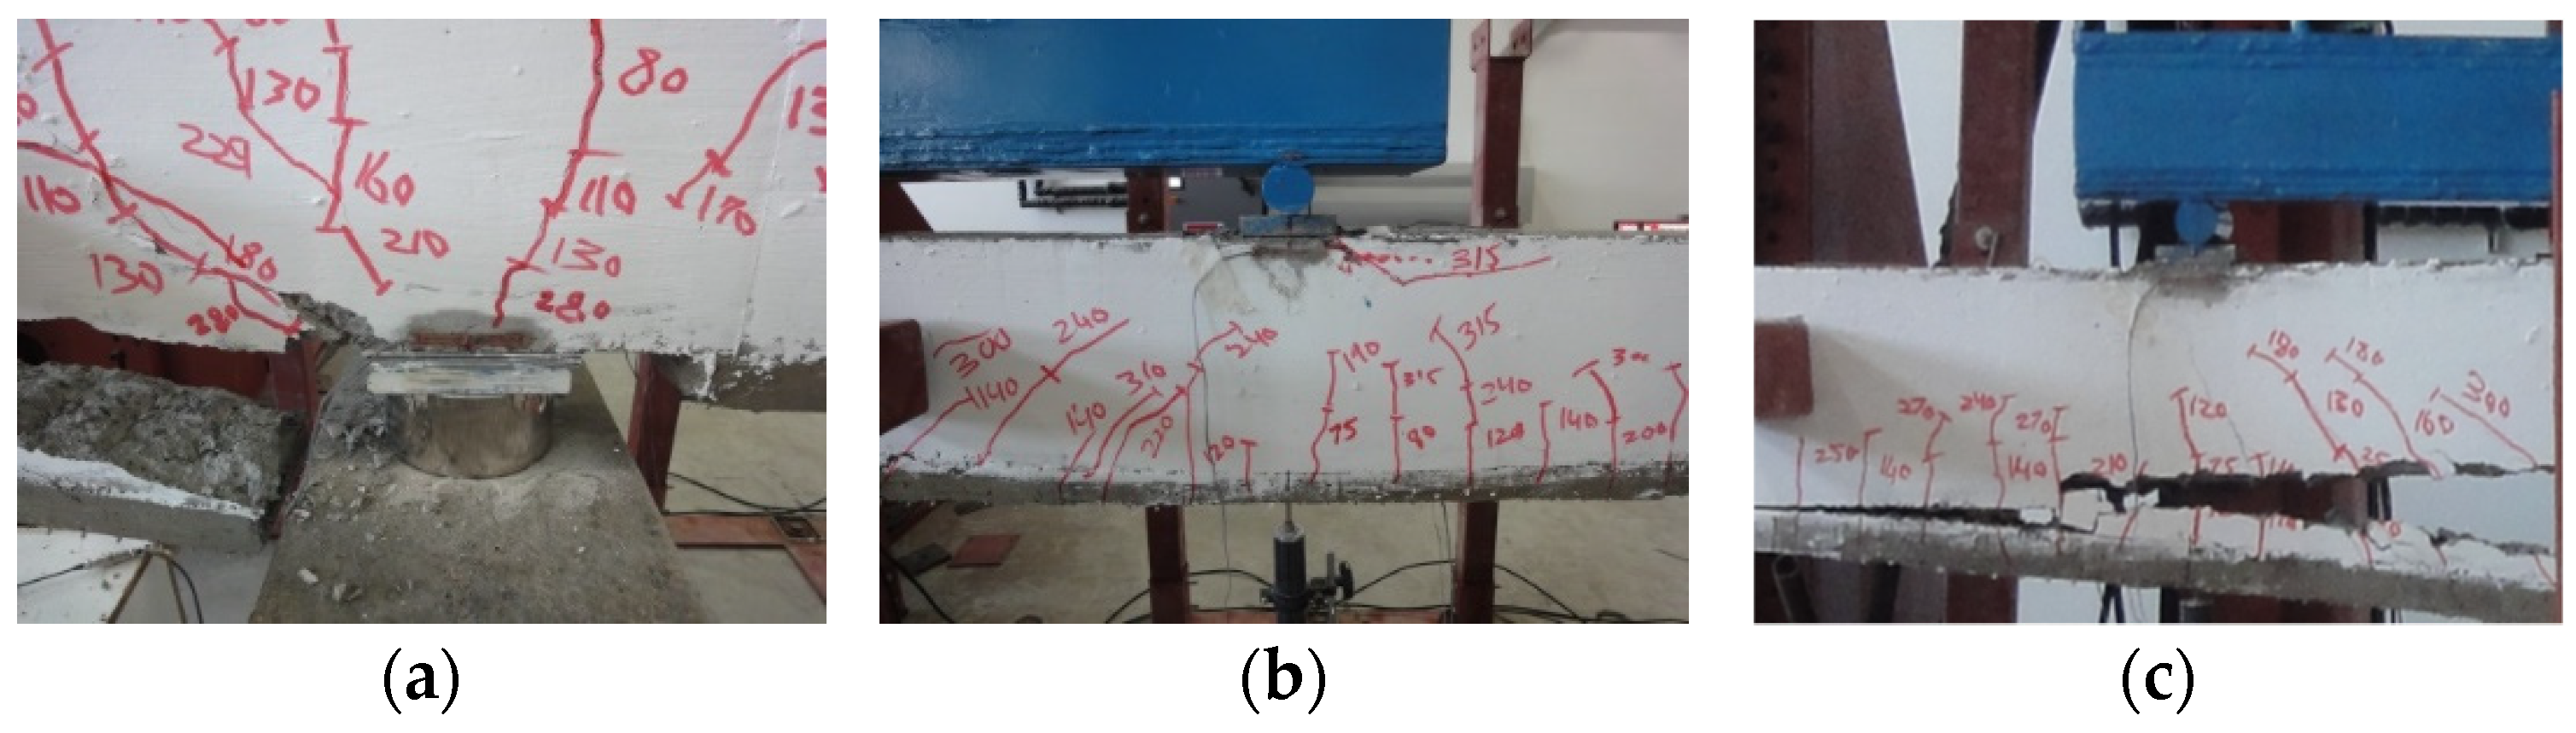
4.1. Crack Pattern and Failure Mode
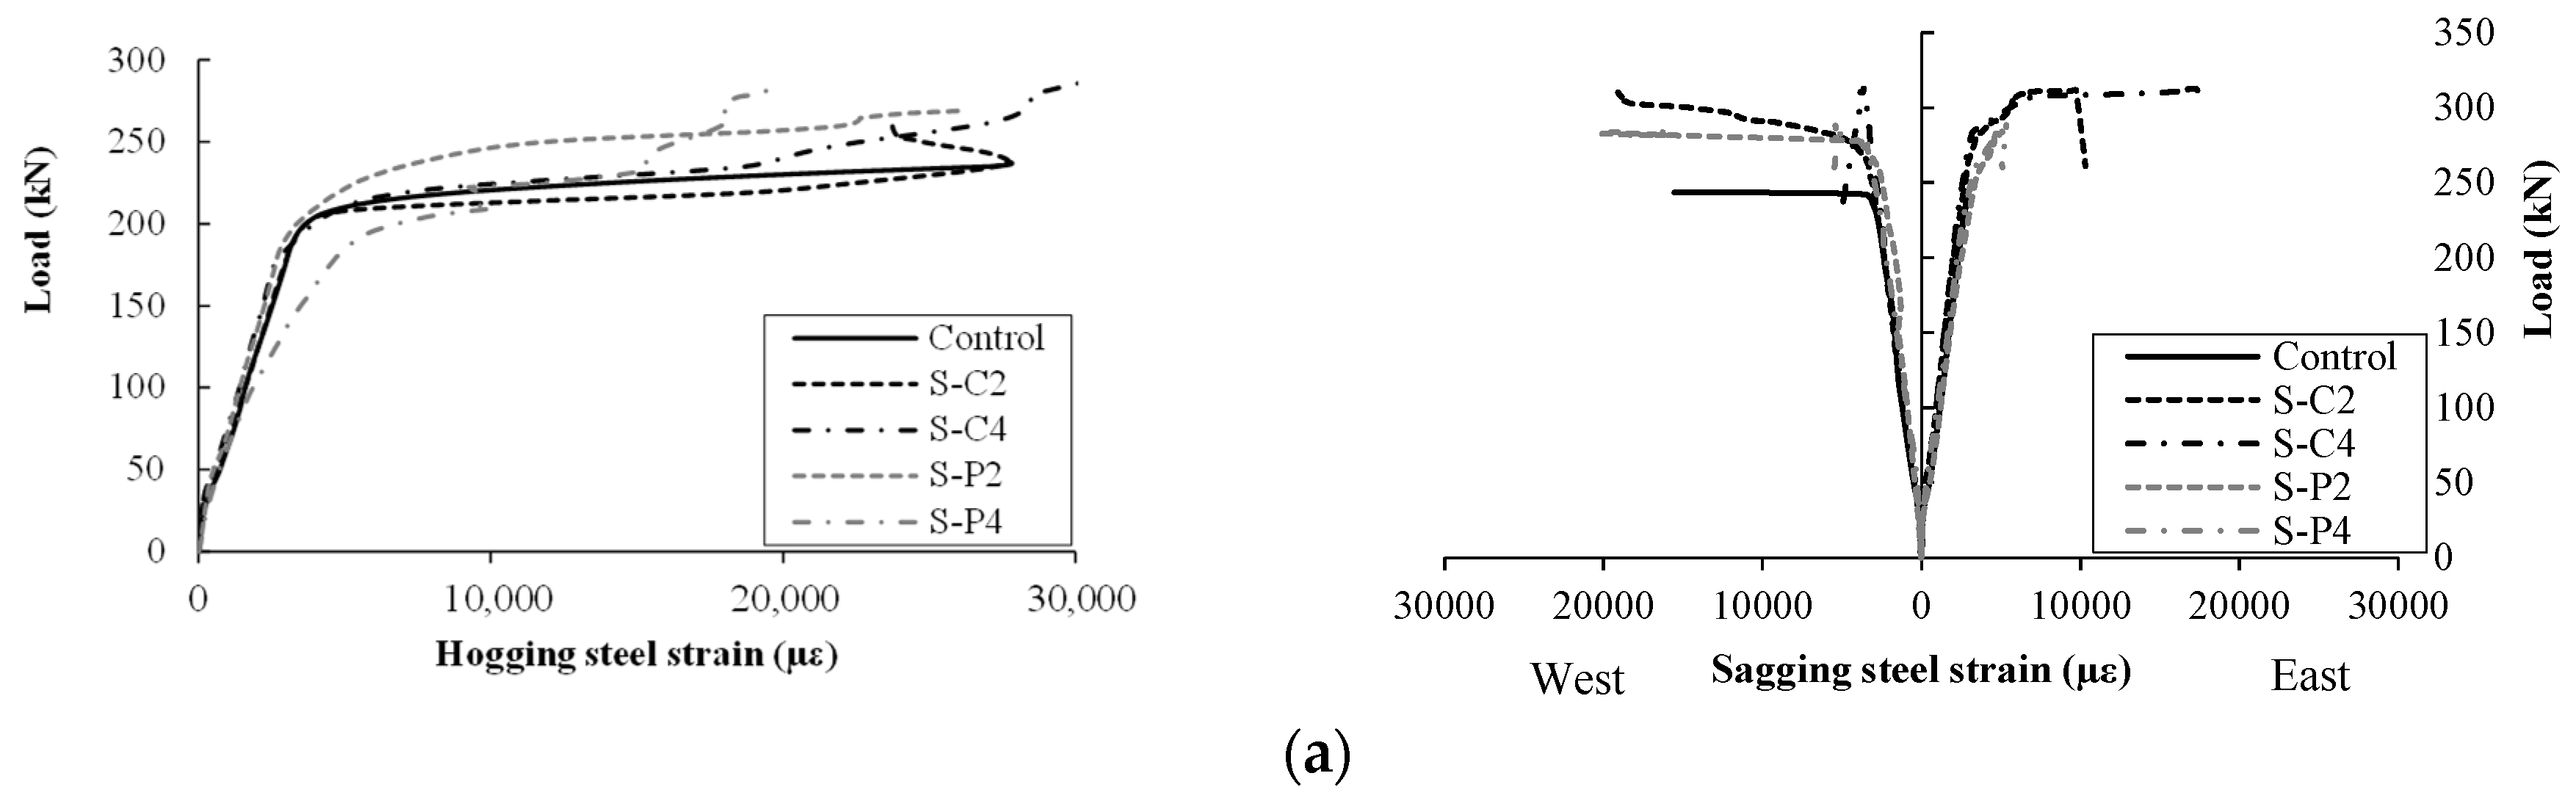
Schematics showing crack patterns of the tested specimens at failure are shown in Figure 7. Photos of typical specimens strengthened in the sagging and hogging regions at failure are shown in Figure 8 and Figure 9, respectively. None of the tested specimens failed in shear, as planned in the design. The control specimen exhibited yielding of the steel in both sagging and hogging regions followed by local concrete crushing in the hogging region at peak load. In the post-peak stage, the beam was able to sustain additional deformation until crushing of concrete occurred in the sagging region.
Failure of the specimens strengthened in the sagging region was initiated by the yielding of steel in the hogging region, then in the sagging region. Ripping off of the tension concrete cover in the sagging region (i.e., concrete cover separation) occurred at failure. Localized concrete crushing was observed on the compression side of the hogging and sagging regions. Specimen S-P2 exhibited localized slippage of fabric and localized ripping off of the tension cover in the sagging region. Specimen S-P4 exhibited interfacial debonding cracks at the fabric–matrix interface in the east sagging region.
The specimens strengthened in the hogging region with 2 layers of FRCM composites exhibited yielding of steel in the hogging and sagging regions, followed by slippage of fabric/interfacial debonding at the fabric–matrix interface accompanied by localized concrete crushing in the hogging and sagging regions. Specimen H-C4 with 4 layers of C-FRCM composites failed prematurely, shortly after steel yielding, without crushing of the concrete due to ripping off of the tension concrete cover in the hogging region. Although specimen H-P4 also exhibited a splitting crack parallel to the tension steel in the hogging region, failure was due to slippage of fabric/interfacial debonding at the fabric–matrix interface, followed by crushing of the concrete in the compression zones of the hogging and sagging regions.

4.2. Steel Strains

Figure 10a,b show the steel strains of specimens of groups A and B, respectively. The yield load values are given in Table 3. Yielding of steel in the control beam occurred first in the hogging region at a load value of approximately 190 kN, followed by yielding of steel in the sagging region at approximately 230 kN. Specimens of group A were strengthened in the sagging region. As such, the yield load in the hogging region of specimens of group A was almost the same as that of the control specimen. In contrast, the yield load in the sagging region of group A increased due to strengthening. Specimens of group B experienced yield load values in the hogging region higher than that of the control specimen due to the hogging strengthening. Yielding of the steel in the sagging region occurred almost at the same time or shortly after it happened in the hogging region. The difference between the yielding loads in the hogging and sagging regions of specimens of group B was within 10%.

4.3. Load–Deflection Response

Figure 11a,b show the load–deflection responses of specimens of groups A and B, respectively. A summary of test results is given in Table 3. First yielding had almost no effect on the slope of the load–deflection response of the tested specimens, whereas the second yielding resulted in a significant change in the slope of the curve. Flexural strengthening with two layers of FRCM had almost no effect on the stiffness compared with that of the control specimen. Nevertheless, the specimens strengthened with four layers of FRCM were slightly stiffer than the control specimen, and hence, they exhibited slightly less deflection in the pre-yield stage.
The response of the control specimen almost plateaued after the second yielding, whereas that of the strengthened specimens depended on the type, location, and number of FRCM layers. Flexural FRCM strengthening delayed yielding of the tension steel in the strengthened region, and hence, increased the beam load carrying capacity (i.e., ultimate load). Specimen H-C4 was an exception because it did not develop its full flexural capacity due to the presence of an initial vertical crack that developed in the east span close to the middle support during handling, which caused a premature and sudden ripping off of the tension concrete cover. Results for specimen H-C4 were excluded from the analysis. Specimens S-C2, with two layers of C-FRCM in the sagging region, exhibited a gain of 28% in strength and a reduction of 23% in its ductility index. Its counterpart specimen, S-P2 with two layers of PBO-FRCM, exhibited a strength gain of 17% without compromising the beam ductility. Doubling the number of FRCM layers in the sagging region resulted in no or insignificant increase in the strength gain but reduced the beam ductility index. Application of FRCM in the hogging region had a less pronounced effect on the ultimate load and strength gain. The ultimate loads and strength gains of the specimens strengthened in the hogging region were on average 93% and 63% of those of their counterparts strengthened in the sagging region, respectively. The ductility indices of the specimens strengthened in the hogging region were insignificantly different from those of their counterparts strengthened in the sagging region.

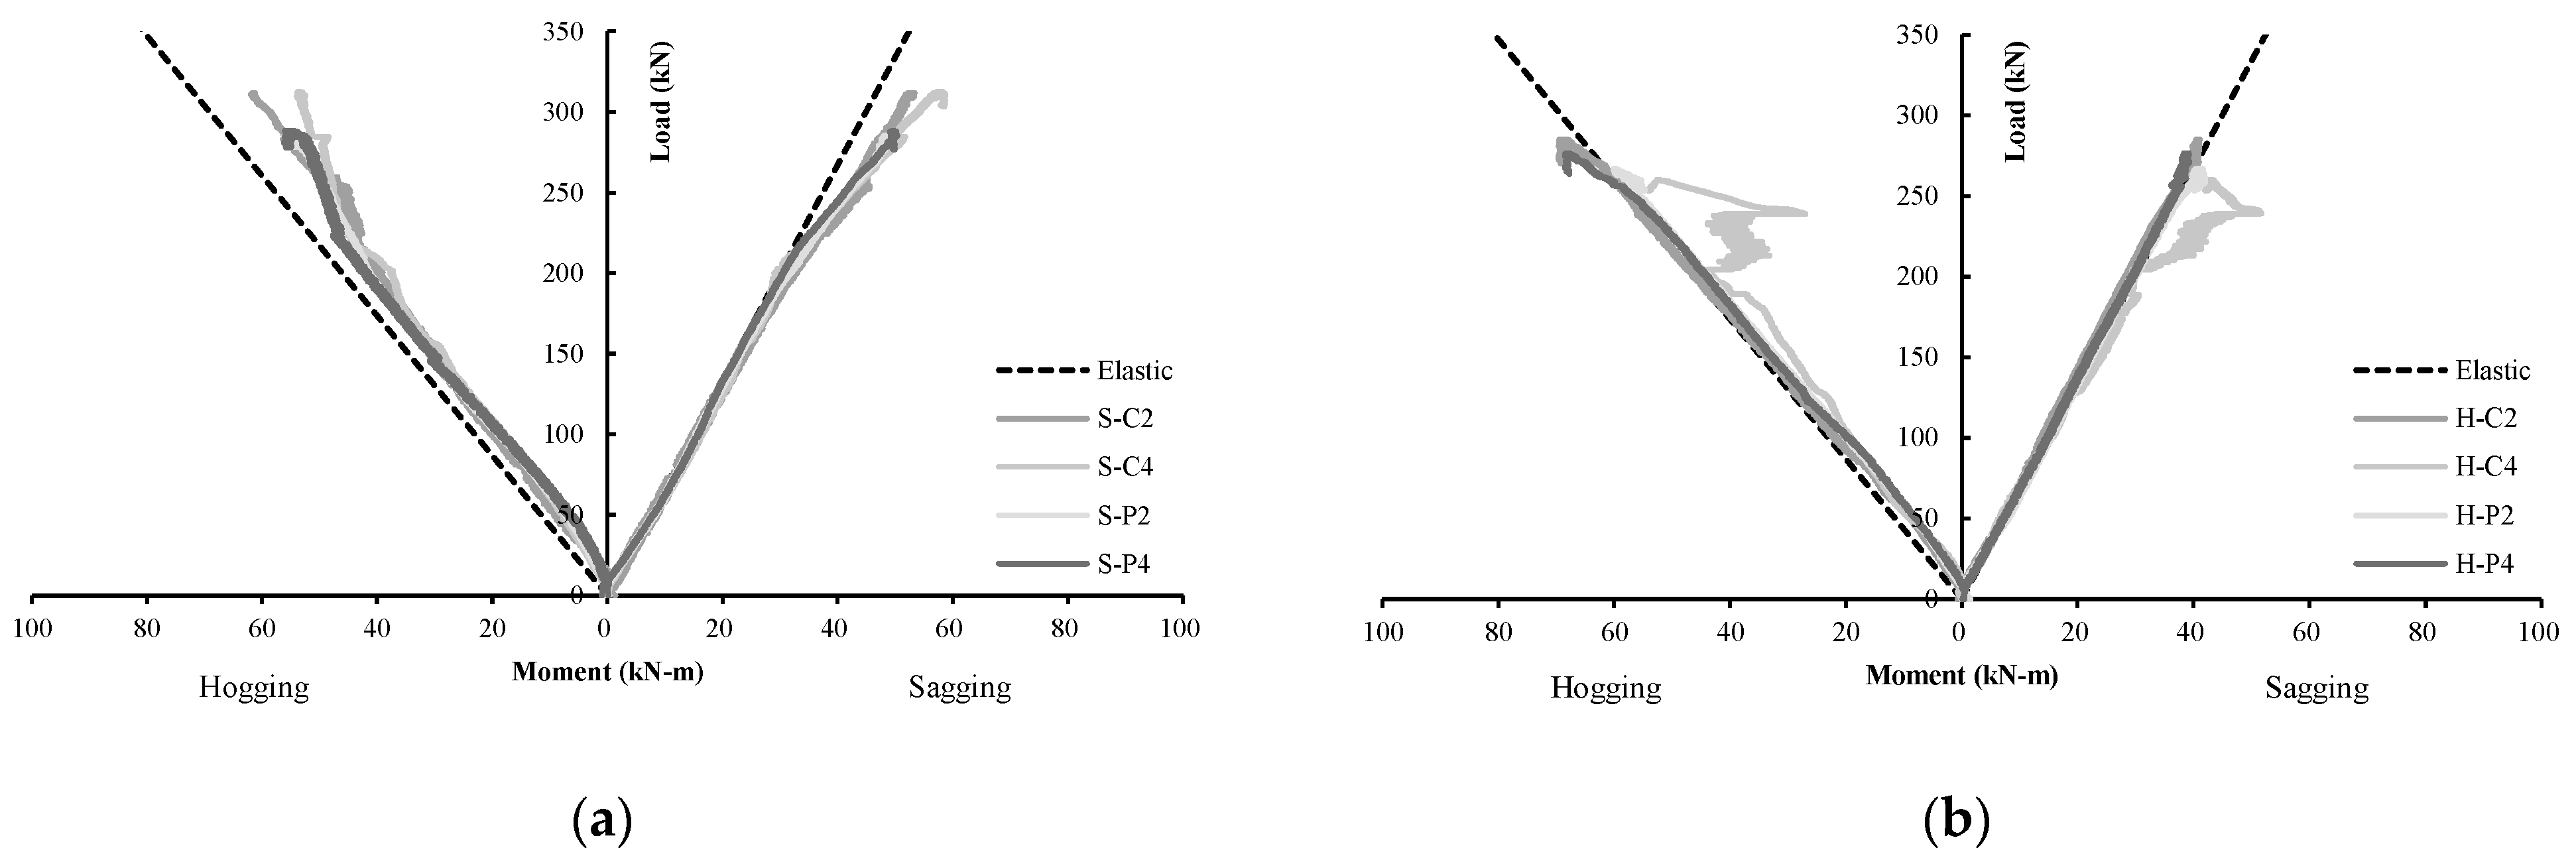
4.4. Moment Redistribution

The difference in flexural rigidity between the sagging and hogging regions in continuous beams results in a moment redistribution. Figure 12a,b show the load–moment relationships of specimens of groups A and B, respectively, whereas the moment redistribution ratios of the tested specimens at ultimate load are summarized in Table 4. The moment redistribution ratio, β, is calculated using Equation (1), where Mexp is the bending moment obtained from the test and Me is the bending moment obtained from an elastic analysis.
β = M e x p M e M e × 100
The moments from the test, Mexp, were calculated based on measured the middle support reaction and equilibrium of forces. The elastic moments, Me, were calculated based on structural analysis, assuming a uniform stiffness along the beam spans. From Figure 12, it can be seen that the response of the specimens strengthened in the sagging region almost coincided with the elastic response until yielding of steel in the hogging region. Following yielding in the hogging region, the sagging region gained additional moments due to the presence of FRCM layers, whereas the hogging region lost moments. The sagging moment redistribution ratios at ultimate load for specimens of group A given in Table 4 had a positive sign, confirming a gain in moment, whereas those of the hogging region had a negative sign, indicating a moment reduction. The load–moment relationships of specimens of group B coincided with the elastic response. This occurred because yielding of the hogging and sagging regions happened almost simultaneously, and hence, insignificant moment redistribution occurred between the hogging and sagging regions. Specimen H-C4, which had a vertical crack during handling, was an exception. At approximately 200 kN, a premature splitting crack occurred in the hogging region, causing ripping off of the tension concrete cover. This crack was connected to the vertical crack initiated earlier during handling. The premature cover separation in the hogging region resulted in a decrease in the hogging moment and a corresponding increase in the sagging moment. When yielding of steel occurred in the sagging region at about 230 kN, the sagging moment decreased rapidly, and a corresponding rapid increase in the hogging moment took place until the specimen failed at 256 kN.

5. Numerical Simulation

Numerical models were developed using ATENA 3D [39] to simulate the nonlinear behavior of the tested specimens.

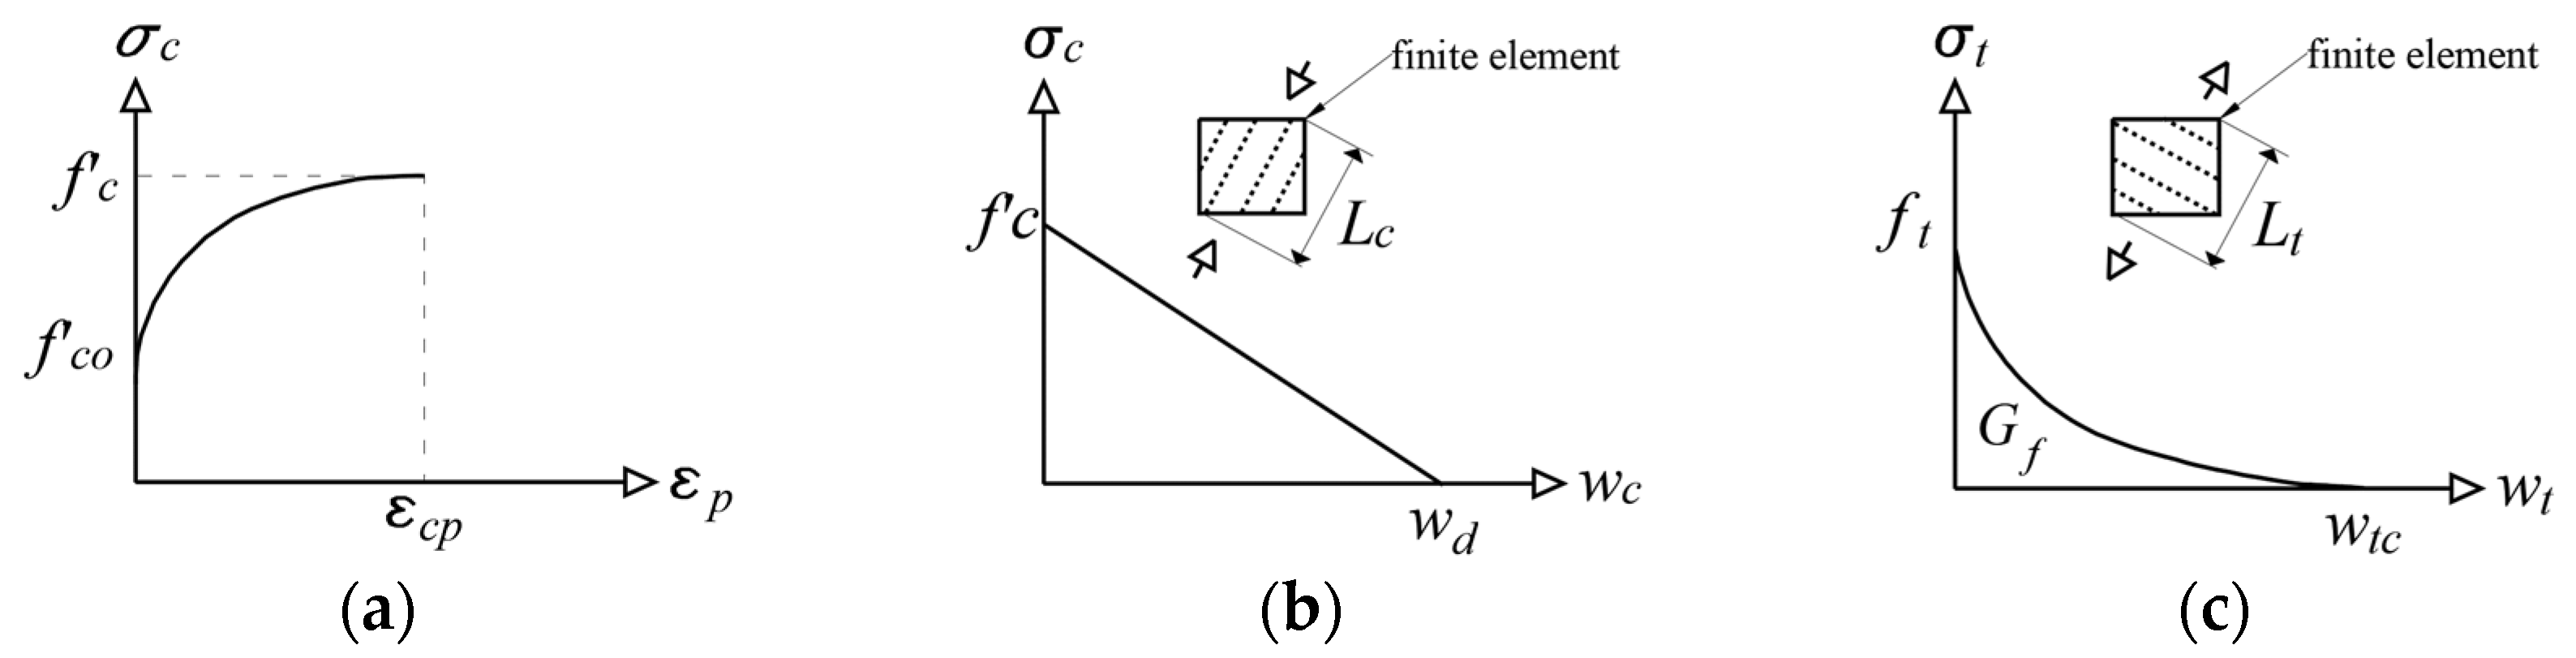
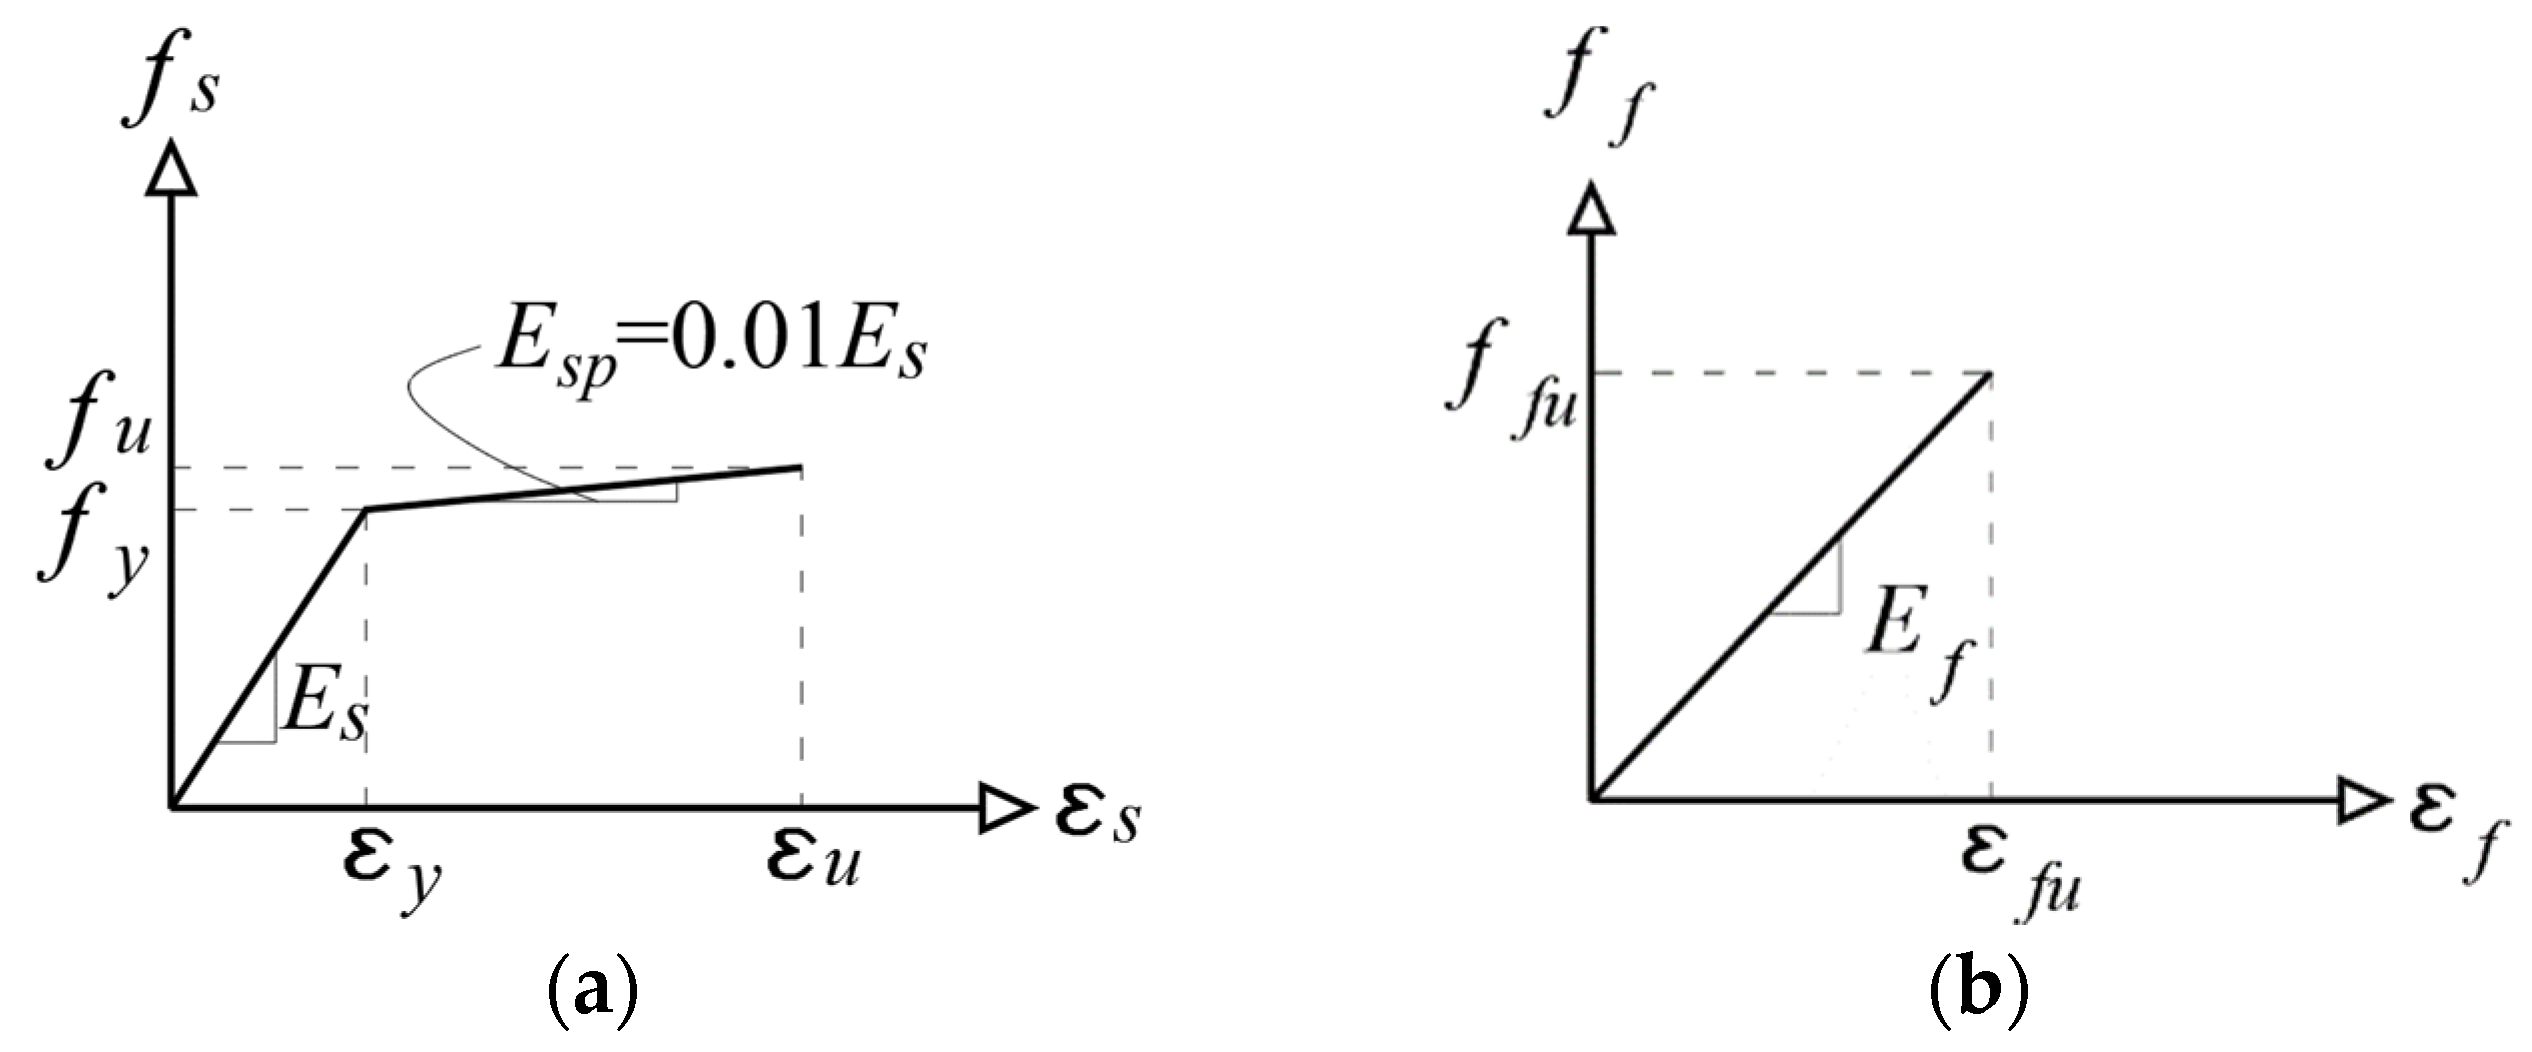
5.1. Material Constitutive Models

The built-in “CC3DNonLinCementitious2” material constitutive model was used to simulate the concrete and cementitious mortars. This constitutive model employs the Menétrey–Willam failure surface [40] for hardening and softening plasticity and Rankine failure criterion for concrete fracture. The compression stress–strain relationship of “CC3DNonLinCementitious2” begins by a linear relation with a slope equal to the modulus of elasticity (Ec) until reaching a compressive stress value of fco = 2 ft, where ft = uniaxial tensile strength. After that, the behavior is modeled by the compressive hardening relation and then compressive softening as presented in Figure 13a,b, respectively. In Figure 13a, the compressive stress (σc) in the compressive hardening phase is a function of the plastic strain (εp). The default value of the plastic strain at peak (εcp) is equal to 0.001. The stresses in the post-peak stage, i.e., during compressive softening, are inversely proportional to the displacement (wc) through the length scale (Lc). The stress reaches zero when the displacement is equal to a critical compressive displacement of wd = 0.5 mm [41]. The tensile stress–strain relationship begins by a linear segment with a slope equal to Ec until the tensile stress (σt) reaches the tensile strength (ft). The stress–strain relationship in the post-peak stage exhibits an exponential decay based on the crack opening displacement (wt) through the length scale (Lt) as presented in Figure 13c, where Lt is assumed to be equal to the size of the element projected into the crack direction. The fracture energy needed to create a unit area of stress-free crack (Gf) determines the value of crack opening at the complete release of stress (wtc). Table 5, Table 6 and Table 7 present the key properties of concrete and the cementitious matrices used with carbon and PBO.
The tension steel reinforcing bars (12 mm diameter) were modeled using a bilinear stress–strain relationship with a post-yield strain hardening as presented in Figure 14a. The Young’s modulus of steel (Es), yield strength (fy), and ultimate strength (fu) were 200 GPa, 561 MPa, and 649 MPa, respectively. The post-yield modulus (Esp) was assumed as 1% of Es (pre-yield modulus). This provided a tensile strain at ultimate strength (εu) of 0.05. An elastic perfectly plastic response was assigned to the steel hangers and stirrups. The stress–strain relationship of the carbon and PBO fabrics was assumed to be linear elastic up to failure as shown in Figure 14b, where ff = stress, εf = strain, ffu = ultimate strength, εfu = ultimate strain, and Ef = Young’s modulus. The values of these input parameters for the fabrics were listed earlier in Table 2. A linear-elastic behavior was assigned to the steel plates at the support and loading points.

5.2. Bond-Slip Model at Fabric–Matrix Interface

The bond between the fabric bundles and mortar in the PBO-FRCM and C-FRCM composite systems was modeled using the respective bond-slip constitutive laws published in the literature by Zou et al. [42] and Feras et al. [43]. The perfect bond condition at the fabric–matrix interface was also considered as an alternative for the purpose of comparison. The adopted bond-slip models are presented in Figure 15. A perfect bond was assumed at the matrix–concrete interface. The steel reinforcing bars were assumed to be perfectly bonded to the concrete.

5.3. Element Types

The concrete beam, cementitious matrix, and steel plates were modeled as solid 3D macro-elements. The steel bars and the fabric bundles were modeled as one-dimensional discrete elements embedded in the concrete and mortar macro-elements, respectively. Only half of the specimens were modeled, as the beams were symmetric around a vertical plane crossing the center of the middle support. A pilot mesh sensitivity analysis indicated an insignificant difference in the predicted results of numerical models with a mesh size of 20 and 15 mm. However, modeling half of the specimens utilizing the feature of ATENA software [39] enabled the authors to use the smallest possible mesh size of 15 mm for the software to operate on a high-performance computer. The maximum computational time for a typical model was approximately 17 h.

5.4. Boundary Conditions and Loading

Support and loading plates were modeled as perfectly connected with the concrete beam. The outer support plate was restricted from movement in the vertical direction only, whereas the middle support plate was restricted from movement in the vertical and horizontal directions. As half of the beam was modeled, the surface at the plane of symmetry was restrained from movement in the direction toward the other symmetrical part of the beam through the use of surface supports. The load was applied on the loading plate at the prescribed vertical displacement of 0.1 mm/step. Figure 16 demonstrates the numerical model elements and boundary conditions.

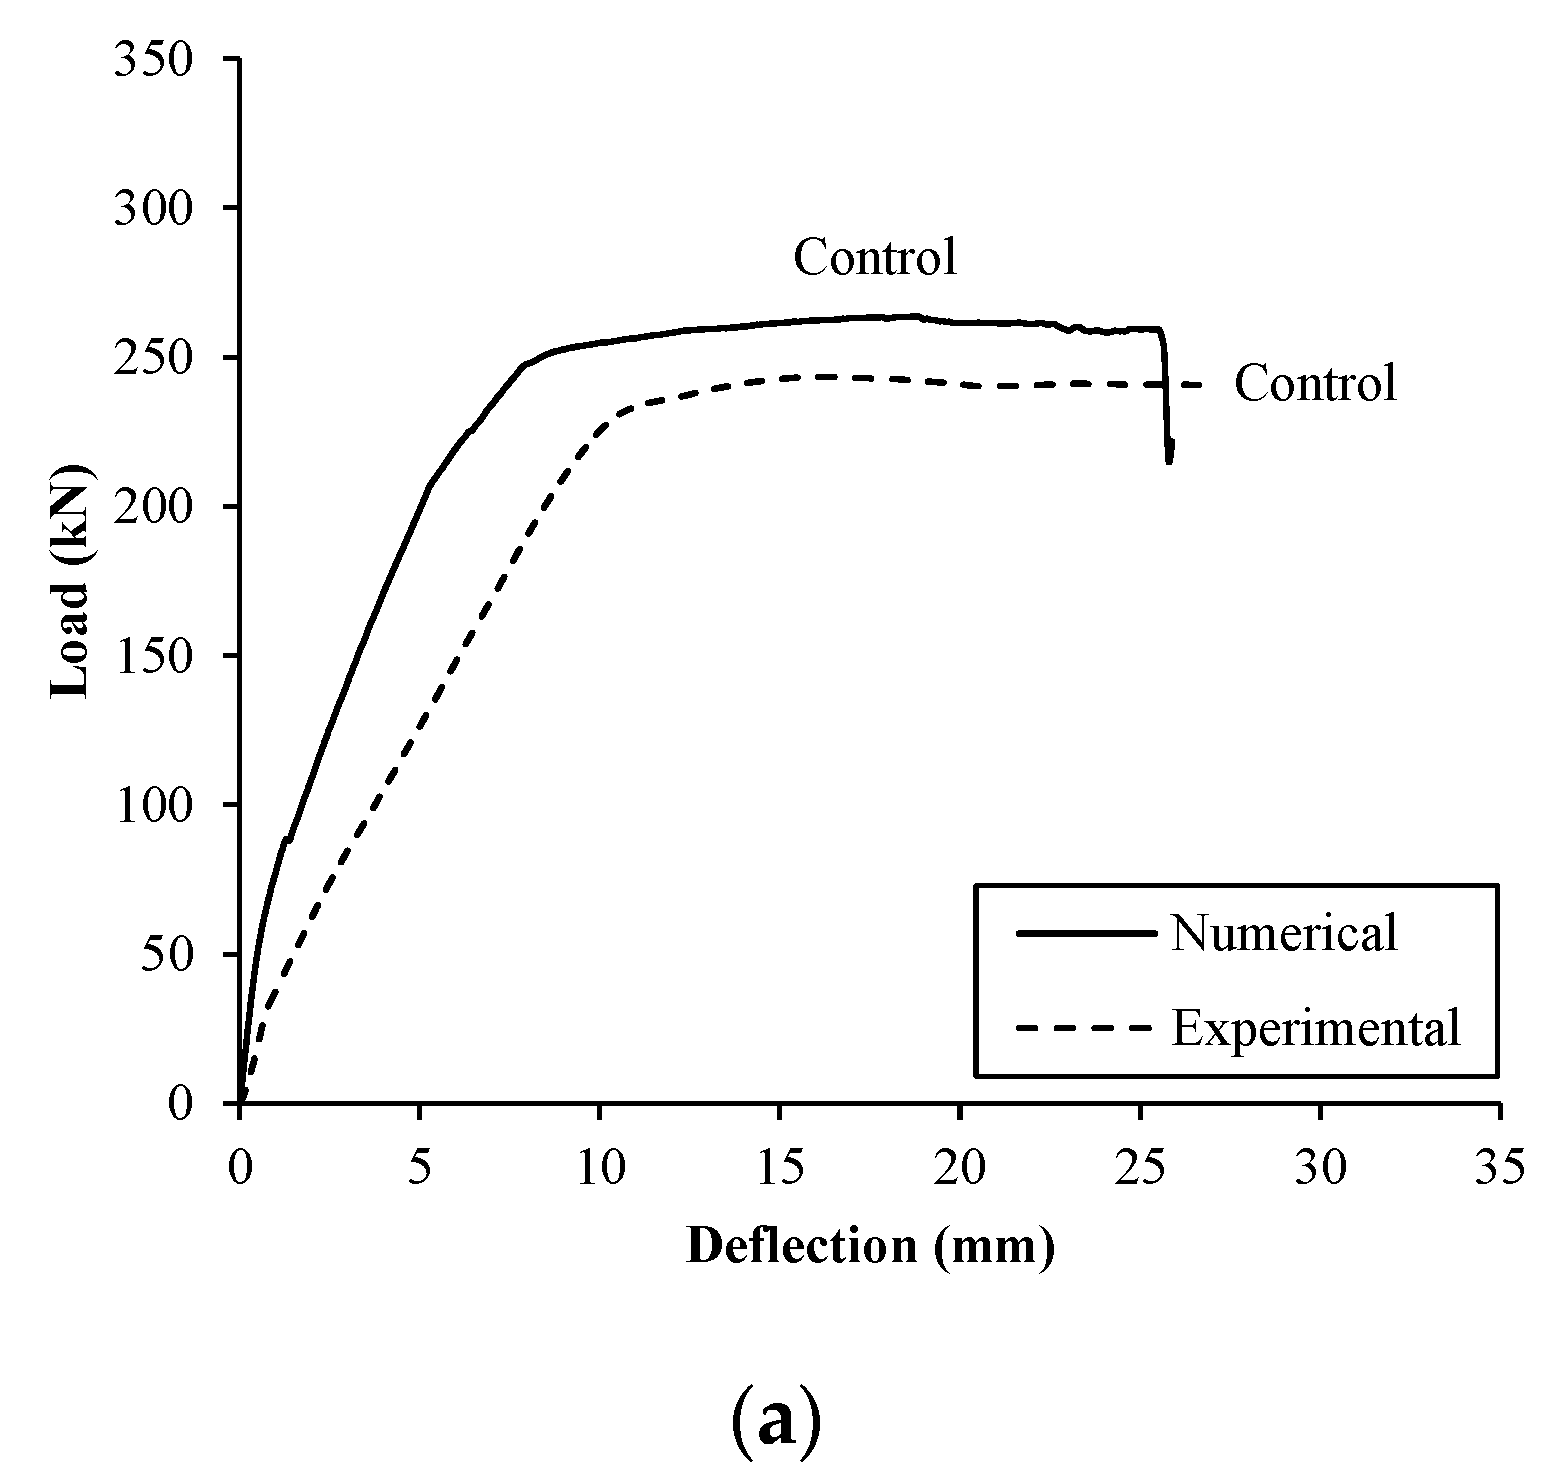
5.5. Numerical Results and Comparative Analysis

The load–deflection responses predicted numerically are shown in Figure 17. The deflection response and the ultimate load of the models with and without the bond-slip law at the fabric–matrix interface were significantly different. In some models, the inclusion of the bond-slip law resulted in a very minor reduction in the predicted ultimate load. A maximum strength reduction of 3% was recorded for specimen H-C2 strengthened in the hogging region with two layers of C-FRCM due to the inclusion of the bond-slip law at the fabric–matrix interface. In alignment with experimental observations, the first yielding resulted in an insignificant change in the slope of the deflection response, whereas the second yielding of steel caused a significant change in the slope of the deflection response. The models strengthened with the PBO-FRCM system exhibited a lower load capacity and a greater deformational capacity than those of the models with C-FRCM. This behavior can be ascribed to the reduced Young’s modulus of the mortar used in the PBO-FRCM system relative to that of the mortar included in the C-FRCM system.
The load–deflection responses predicted numerically are compared to those obtained from the tests in Figure 18. A comparison between predicted and experimental results is given in Table 8. Results for the models with bond-slip law are considered in the comparison. Although the deflection responses predicted numerically for the control specimen, beams of group A, and beams of group B tended to be stiffer than those obtained from experimental testing as shown in Figure 18a,b,c, respectively, the predicted and measured load–deflection responses exhibited a similar trend. The ratio of the predicted-to-measured deflections at ultimate load was on average 0.77. Reinforced concrete specimens are vulnerable to microcracks due to drying shrinkage or during handling prior to testing. This could explain why the tested specimens tended to exhibit lower stiffness and less deflection at ultimate load than those predicted numerically [44,45,46,47]. The predicted ultimate loads were within a 12% error band, which verified the ability of the models to accurately predict the load capacity of continuous RC beams strengthened with FRCM composites. Numerical results indicate that sagging strengthening had a more pronounced effect on the load capacity than hogging strengthening. Doubling the amount of FRCM composite layers did not result in a proportional increase in the strength gain. These findings are in alignment with experimental results.
The load versus moment relationships predicted numerically are shown in Figure 19. The corresponding key results are reported in Table 9. The predicted response of the models strengthened in the sagging region deviated from the elastic response at the onset of steel yielding in the hogging region, which was verified experimentally. The moment redistribution ratios at ultimate load of the sagging regions for these models have a positive sign indicating a gain in moment, which is in agreement with experimental findings. The load–moment relationship of the models strengthened in the hogging region almost coincided with the elastic response due to yielding of steel in the sagging region shortly after or at the same time as the yielding in the hogging region. This behavior is in alignment with experimental results.
The crack patterns predicted numerically at ultimate load are shown in Figure 20. In agreement with experimental findings, the specimens exhibited extensive flexural cracks in both sagging and hogging regions in addition to some inclined shear cracks prior to failure. The localized concrete crushing in the sagging and hogging regions was manifested by a localized horizontal crack on the compression side under the loading plate and over the middle support plate, respectively. Interestingly, most of the models strengthened in the sagging region exhibited horizontal splitting cracks at the level of the tension steel reinforcement, which is in agreement with the tension concrete cover rip-off observed experimentally in most of the specimens strengthened in the sagging region. The agreement between the crack pattern predicted numerically and those observed experimentally verified the capability of the models to predict the nonlinear response of continuous RC beams with good accuracy.

6. Discussion

Studies on the nonlinear flexural behavior of continuous RC beams strengthened with FRCM composites are scarce [25,26]. Su et al. [25] reported negligible load capacity gains of 3% and 6% that were due to strengthening with 2 layers of C-FRCM composites at the hogging and sagging regions, respectively. When both sagging and hogging regions were strengthened with 2 layers of C-FRCM simultaneously, a limited load capacity gain of 9% was recorded. In addition, the ductility of the continuous beam specimens was significantly reduced due to C-FRCM strengthening. The ductility of one of the beams strengthened in both sagging and hogging regions was only 20% of that of the un-strengthened control specimen. The poor performance of the strengthened continuous RC beam specimens was attributed to a premature peeling off of the C-FRCM composite plate caused by poor surface preparation and insufficient impregnation of the carbon fibers into the matrix [25]. The premature detachment of the FRCM composite plate seriously compromised the performance of the strengthened specimens. Therefore, the researchers recommended that more tests be conducted with improved workmanship during FRCM preparation and installation to better examine the performance of continuous RC beams strengthened with FRCM. Feng et al. [26] indicated that strengthening of both sagging and hogging regions with 2 layers of C-FRCM resulted in a very limited load capacity gain of 7%. Increasing the number of C-FRCM layers to 3 layers did not result in an additional increase in the load capacity. In fact, only a 6% gain in load capacity was recorded due to strengthening with 3 layers of C-FRCM composites. The researchers concluded that C-FRCM strengthening weakened the deformational capacity of the beam sections, and therefore, it significantly reduced the moment redistribution index. Although the inclusion of U-wraps slightly improved the behavior, the gain in load capacity was still limited. Only 10% and 14% increases in load capacity with respect to that of the control specimen were recorded, respectively, when 2 and 3 layers of C-FRCM composite plates were used along with U-wraps. In terms of ductility and deformability, the use of U-wraps was detrimental because it resulted in a brittle failure mode that compromised the beam ductility and deformational capacity.
Despite proper FRCM preparation and installation, the performance of FRCM-strengthened specimens tested by Feng et al. [26] was still inadequate because an insignificant gain in load capacity was reported along with a serious reduction in beam ductility. The significant reduction in ductility exhibited by the strengthened continuous beam specimens may be attributed to the increased amount of strengthening installed in both the hogging and sagging regions simultaneously. Additionally, specimens tested in previous studies [25,26] had an a/d ratio of 2.5. Such a small value for a/d promotes an arch action effect; therefore, tested specimens may not have adequately represented the typical flexural behavior of continuous RC beams that might be encountered in a practical setting. Varying the type and properties of FRCM may also affect the performance of continuous RC beam specimens.
The continuous beam specimens tested in the present study had an a/d value of 4.4. The value of a/d adopted in the current study was large enough to avoid the occurrence of the arch action; therefore, it allowed for a proper evaluation of the flexural behavior of continuous RC beams strengthened with FRCM. The specimens were strengthened in either the sagging or hogging region in an effort to reduce the risk of reduced ductility and isolate the effect of the strengthened locations on flexural behavior. Two different types of FRCM were used for strengthening (C-FRCM and PBO-FRCM) to investigate the effect of varying the type of FRCM system on the flexural performance of continuous RC beam specimens. The test results of the present study demonstrated that properly designed FRCM strengthening can improve the load capacity of continuous RC beams with no or insignificant reduction in beam ductility and deflection capacity. The use of 2 layers of C-FRCM composites in the sagging region increased the load capacity by 28% while maintaining 77% and 90% of the original beam ductility and deflection capacity, respectively. It was possible to achieve a 17% gain in the load capacity without any reduction in beam ductility or deflection capacity through the use of 2 layers of PBO-FRCM composites in the sagging region instead of C-FRCM. Increasing the number of C-FRCM layers in the sagging region to 4 layers was detrimental to beam performance irrespective of the type of FRCM used because it resulted in a negligible additional increase in load capacity but at the same time reduced beam ductility and deflection capacity. Hogging strengthening with 2 layers of C-FRCM increased the load capacity by 17% while maintaining 70% and 65% of the original beam ductility and deflection capacity, respectively. The use of 2 layers of PBO-FRCM in the hogging region instead of C-FRCM increased the load capacity by only 9% with no or insignificant reduction in the original beam ductility and deflection capacity. The use of 4 layers of PBO-FRCM composites in the hogging region increased the load capacity by 14% while maintaining 73% and 65% of the original beam ductility and deflection capacity, respectively. Specimens strengthened in the sagging regions experienced an appreciable moment redistribution ratio of up to 26% because yielding of steel occurred first in the hogging region, which had adequate rotational capacity to effectively transfer the moments to the sagging region until both sections reached their ultimate moment capacity. Conversely, specimens strengthened in the hogging region exhibited insignificant moment redistribution between the hogging and sagging regions because both sections experienced yielding of steel almost simultaneously.
Despite the use of the smallest possible mesh size of 15 mm, the numerical models developed in the current study tended to underestimate the deflection of the tested beams. This behavior has also been reported in previous studies [44,45,46,47] and is attributed to the vulnerability of the specimens to microcracking due to drying shrinkage or during handling prior to testing, which would result in a reduction in the actual beam stiffness and an increase in the beam deflection relative to those predicted numerically. The predicted load capacities, numerical findings, profiles of the load–deflection response, load–moment relationship, and crack pattern were, however, in good agreement with those obtained from the tests.

7. Implications and Limitations

Although practical application would involve strengthening of continuous RC beams, most of previous studies on FRCM flexural strengthening focused on studying the performance of simply supported RC beams strengthened with FRCM composites. The present study provided insight into the subject of strengthening indeterminate RC structures with FRCM composites. The outcomes of this study will contribute to an improved understanding of the nonlinear flexural behavior of undamaged continuous RC beams strengthened with two different types of FRCM composites. The strengthening of undamaged continuous RC beams is frequently required to accommodate an increase in the applied live load due to a change in a building function or an increase in traffic load in the case of bridge girders. The results of the present investigation were limited to undamaged beams having dimensions, reinforcement details, material properties, and strengthening regimes specified in the paper. The numerical models developed in the current study are considered to be valuable and cost-effective techniques to predict the nonlinear response of continuous RC beams strengthened with FRCM. Although the numerical findings and predicted load capacities were in good agreement with the corresponding experimental results, the models tended to underestimate the deflection of the tested specimens. Future research should focus on investigating the behavior of pre-damaged continuous RC beams strengthened with FRCM composites. The generation of new experimental data in future research would help to further validate the numerical models, thus allowing for investigating the effect of a wider range of parameters on the nonlinear response of continuous RC beams strengthened with FRCM composites.

8. Conclusions

The behavior of two-span RC beam specimens strengthened with FRCM composites in either the sagging or hogging region was examined numerically and experimentally. The effectiveness of FRCM composites in upgrading the response of continuous RC beams was dependent on the location of strengthening and the properties/amount of the FRCM composites used. The main conclusions of this work are summarized below.
  • Sagging strengthening with 2 layers of C-FRCM increased the load capacity by 28% while maintaining 77% and 90% of the original beam ductility and deflection capacity, respectively. The use of 2 layers of PBO-FRCM in the sagging region instead of C-FRCM increased the load capacity by 17% without compromising the original beam ductility and deflection capacity.
  • Hogging strengthening with 2 layers of C-FRCM resulted in 17% increase in load capacity while maintaining 70% and 65% of the original beam ductility and deflection capacity, respectively. The use of 2 layers of PBO-FRCM in the hogging region instead of C-FRCM increased the load capacity by only 9% with no or insignificant reduction in the original beam ductility and deflection capacity.
  • The use of 4 FRCM composite layers instead of 2 layers resulted in no or negligible additional increase in the load capacity but reduced the ductility and deflection capacity of the strengthened specimens.
  • Specimens strengthened in the sagging regions exhibited up to 26% moment redistribution between the hogging and sagging regions. In contrast, insignificant moment redistribution was recorded for the specimens strengthened in the hogging region.
  • The 3D numerical simulation models developed in the current study were capable of predicting the nonlinear response of the tested specimens. The inclusion of an interfacial bond-slip law at the fabric–matrix interface had an insignificant effect on the predicted response. Numerical findings were in agreement with those obtained from laboratory testing.
  • The numerical models accurately predicted the load capacity of the tested specimens but tended to underestimate the deflection. The ratio of the predicted-to-measured load capacity was in the range of 1.01 to 1.12 with an average of 1.08, whereas the ratio of the predicted-to-measured deflection at ultimate load was on average 0.77.

Author Contributions

Conceptualization, T.E.-M.; methodology, T.E.-M.; software, M.M., T.E.-M.; validation, N.K., T.E.-M.; formal analysis, N.K., M.M. and T.E.-M.; investigation, N.K., M.M., T.E.-M.; resources, T.E.-M.; data curation, N.K., M.M., T.E.-M.; writing—original draft preparation, N.K., M.M. and T.E.-M.; writing—review and editing, T.E.-M. and N.I.; visualization, N.K., M.M.; supervision, T.E.-M., N.I.; project administration, T.E.-M.; funding acquisition, T.E.-M. All authors have read and agreed to the published version of the manuscript.

Funding

This research was funded by United Arab Emirates University, grant number 12N004.

Institutional Review Board Statement

Not applicable.

Informed Consent Statement

Not applicable.

Data Availability Statement

The data presented in this study are available on request from the corresponding author. The data are not publicly available due to privacy issues.

Conflicts of Interest

The authors declare no conflict of interest.

References

  1. ACI Committee 549. Guide to Design and Construction of Externally Bonded Fabric-Reinforced and Steel-Reinforced Grout Systems for Repair and Strengthening of Concrete Structures; American Concrete Institute: Farmington Hills, MI, USA, 2020. [Google Scholar]
  2. Täljsten, B.; Blanksvärd, T. Mineral-based bonding of carbon FRP to strengthen concrete structures. J. Compos. Constr. 2007, 11, 120–128. [Google Scholar] [CrossRef] [Green Version]
  3. Hashemi, S.; Al-Mahaidi, R. Experimental and finite element analysis of flexural behavior of FRP-strengthened RC beams using cement-based adhesives. Constr. Build. Mater. 2012, 26, 268–273. [Google Scholar] [CrossRef]
  4. Elsanadedy, H.M.; Almusallam, T.H.; Alsayed, S.H.; Al-Salloum, Y.A. Flexural strengthening of RC beams using textile reinforced mortar–Experimental and numerical study. Compos. Struct. 2013, 97, 40–55. [Google Scholar] [CrossRef]
  5. D’Ambrisi, A.; Focacci, F. Flexural strengthening of RC beams with cement-based composites. J. Compos. Constr. 2011, 15, 707–720. [Google Scholar] [CrossRef]
  6. Jung, K.; Hong, K.; Han, S.; Park, J.; Kim, J. Prediction of flexural capacity of RC beams strengthened in flexure with FRP fabric and cementitious matrix. Int. J. Polym. Sci. 2015, 2015, 11. [Google Scholar] [CrossRef] [Green Version]
  7. El-Sherif, H.; Wakjira, T.G.; Ebead, U. Flexural strengthening of reinforced concrete beams using hybrid near-surface embedded/externally bonded fabric-reinforced cementitious matrix. Constr. Build. Mater. 2020, 238, 117748. [Google Scholar] [CrossRef]
  8. Jabr, A.; El-Ragaby, A.; Ghrib, F. Effect of the fiber type and axial stiffness of FRCM on the flexural strengthening of RC beams. Fibers 2017, 5, 2. [Google Scholar] [CrossRef]
  9. Ebead, U.; Shrestha, K.C.; Afzal, M.S.; El Refai, A.; Nanni, A. Effectiveness of fabric-reinforced cementitious matrix in strengthening reinforced concrete beams. J. Compos. Constr. 2017, 21, 994–1006. [Google Scholar] [CrossRef]
  10. Elghazy, M.; El Refai, A.; Ebead, U.; Nanni, A. Effect of corrosion damage on the flexural performance of RC beams strengthened with FRCM composites. J. Compos. Struct. Constr. 2017, 180, 04018039. [Google Scholar] [CrossRef]
  11. Elghazy, M.; El Refai, A.; Ebead, U.; Nani, A. Post-repair flexural performance of corrosion-damaged beams rehabilitated with fabric-reinforced cementitious matrix (FRCM). Constr. Build. Mater. 2018, 166, 732–744. [Google Scholar] [CrossRef]
  12. Elghazy, M.; El Refai, A.; Ebead, U.; Nanni, A. Corrosion-damaged RC beams repaired with fabric-reinforced cementitious matrix. J. Compos. Constr. 2018, 22, 04018039. [Google Scholar] [CrossRef]
  13. Hadad, H.A.; Erickson, B.; Nanni, A. Flexural analysis and design of FRCM-strengthened RC beams. Constr. Build. Mater. 2020, 244, 118371. [Google Scholar] [CrossRef]
  14. Escrig, C.; Gil, L.; Bernat-Maso, E. Experimental comparison of reinforced concrete beams strengthened against bending with different types of cementitious-matrix composite materials. Constr. Build. Mater. 2017, 137, 317–329. [Google Scholar] [CrossRef]
  15. Ombres, L. Flexural analysis of reinforced concrete beams strengthened with a cement based high strength composite material. Compos. Struct. 2011, 94, 143–155. [Google Scholar] [CrossRef]
  16. Schladitz, F.; Frenzel, M.; Ehlig, D.; Curbach, M. Bending load capacity of reinforced concrete slabs strengthened with textile reinforced concrete. Eng. Struct. 2012, 40, 317–326. [Google Scholar] [CrossRef]
  17. Babaeidarabad, S.; Loreto, G.; Nanni, A. Flexural strengthening of RC beams with an externally bonded fabric-reinforced cementitious matrix. J. Compos. Constr. 2014, 18, 04014009. [Google Scholar] [CrossRef]
  18. Loreto, G.; Leardini, L.; Arboleda, D.; Nanni, A. Performance of RC slab-type elements strengthened with fabric-reinforced cementitious-matrix composites. J. Compos. Constr. 2014, 18, A4013003. [Google Scholar] [CrossRef]
  19. El-Maaddawy, T.; El Refai, A. Innovative repair of severely corroded T-beams using fabric-reinforced cementitious matrix. J. Compos. Constr. 2016, 20, 04015073. [Google Scholar] [CrossRef]
  20. Aljazaeri, Z.R.; Janke, M.A.; Myers, J.J. A novel and effective anchorage system for enhancing the flexural capacity of RC beams strengthened with FRCM composites. Compos. Struct. 2019, 210, 20–28. [Google Scholar] [CrossRef]
  21. El-Refaie, S.; Ashour, A.; Garrity, S. Sagging and hogging strengthening of continuous reinforced concrete beams using carbon fiber-reinforced polymer sheets. ACI Struct. J. 2003, 100, 446–453. [Google Scholar]
  22. El-Maaddawy, T.; Alshawa, J.; El-Ariss, B. Strengthening of continuous concrete slab strips containing cutouts. ACI Struct. J. 2016, 113, 1243–1252. [Google Scholar] [CrossRef]
  23. Alkhalil, J.; El-Maaddawy, T. Nonlinear flexural response of continuous concrete slab strips strengthened with near-surface-mounted composites. J. Compos. Constr. 2017, 21, 04016071. [Google Scholar] [CrossRef]
  24. Alkhalil, J.; El-Maaddawy, T. Finite element modelling and testing of two-span concrete slab strips strengthened by externally-bonded composites and mechanical anchors. Eng. Struct. 2017, 147, 45–61. [Google Scholar] [CrossRef]
  25. Su, M.; Zeng, C.; Li, W.; Zhu, J.; Lin, W.; Ueda, T.; Xing, F. Flexural performance of corroded continuous RC beams rehabilitated by ICCP-SS. Compos. Struct. 2020, 232, 111556. [Google Scholar] [CrossRef]
  26. Feng, R.; Liu, Y.; Zhu, J.; Xing, F. Flexural behaviour of C-FRCM strengthened corroded RC continuous beams. Compos. Struct. 2020, 245, 112200. [Google Scholar] [CrossRef]
  27. ACI 318-19; Building Code Requirements for Structural Concrete—Commentary on Building Code Requirements for Structural Concrete (ACI 318R-19). American Concrete Institute (ACI): Farmington Hills, MI, USA, 2019.
  28. BS EN 12390-3; Testing Hardened Concrete—Compressive Strength of Test Specimens. British Standards: London, UK, 2009.
  29. ASTM C39/C39M-20; Standard Test Method for Compressive Strength of Cylindrical Concrete Specimens. ASTM International: West Conshohocken, PA, USA, 2020.
  30. ASTM C496/C496M-17; Standard Test Method for Splitting Tensile Strength of Cylindrical Concrete Specimens. ASTM International: West Conshohocken, PA, USA, 2017.
  31. BS 4449:2005 +A2:2009; Steel for the Reinforcement of Concrete—Weldable Reinforcing Steel–Bar, Coil and Decoiled–Product Specification. British Standards: London, UK, 2009.
  32. ASTM C109/C109M-20b; Standard Test Method for Compressive Strength of Hydraulic Cement Mortars (Using 2-in. or [50 mm] Cube Specimens). ASTM International: West Conshohocken, PA, USA, 2020.
  33. ASTM C469/C469M-14; Standard Test Method for Static Modulus of Elasticity and Poisson’s Ratio of Concrete in Compression. ASTM International: West Conshohocken, PA, USA, 2014.
  34. S&P—A Simpson Strong-Tie Company. S&P ARMO-Mesh Reinforcement Made from Carbon Fiber. Available online: https://www.sp-reinforcement.ch/en-CH (accessed on 10 December 2019).
  35. Ruredil. Ruredil X Mesh Gold PBO (Poliparafenilenbenzobisoxazolo) Mesh in A Stabilized Inorganic Matrix for Flexural and Shear Strength Reinforcement of Concrete. Available online: http://english.ruredil.it/ (accessed on 10 December 2019).
  36. Emmons, P.H. Concrete Repair and Maintenance Illustrated: Problem Analysis; Repair Strategy; Techniques; John Wiley & Sons: Hoboken, NJ, USA, 2020. [Google Scholar]
  37. Yazdani, N.; Riad, M.; Salloum, R.; Carr, R. Effect of surface defects on FRP-concrete interface bond strength. J. Civ. Eng. Struct. 2018, 2, 17. [Google Scholar]
  38. Yazdani, N.; Beneberu, E.; Riad, M. Nondestructive evaluation of FRP-concrete interface bond due to surface defects. Adv. Civ. Eng. 2019, 2019, 10. [Google Scholar] [CrossRef]
  39. ATENA [Computer Software]. (n.d.). Červenka Consulting s.r.o., Prague, Czech Republic. Available online: https://www.cervenka.cz/products/atena/ (accessed on 27 November 2021).
  40. Menétrey, P.; Willam, K. Triaxial Failure criterion for concrete and its generalization. ACI Struct. J. 1992, 92, 311–318. [Google Scholar]
  41. Van Mier, J.G. Multiaxial strain-softening of concrete. Mater. Struct. 1986, 19, 190–200. [Google Scholar] [CrossRef]
  42. Zou, X.; Sneed, L.H.; D’Antino, T.; Carloni, C. Analytical Bond-Slip Model for Fiber-Reinforced Cementitious Matrix-Concrete Joints Based on Strain Measurements. J. Mater. Civ. Eng. 2019, 31, 04019247. [Google Scholar] [CrossRef]
  43. Abu Obaida, F.; El-Maaddawy, T.; El-Hassan, H. Bond behavior of carbon fabric-reinforced matrix composites: Geopolymeric matrix versus cementitious mortar. Buildings 2021, 11, 207. [Google Scholar] [CrossRef]
  44. Ibrahim, A.; Mahmood, M. Finite element modeling of reinforced concrete beams strengthened with FRP laminates. Eur. J. Sci. Res. 2009, 30, 526–541. [Google Scholar]
  45. Obaidat, Y.; Heyden, S.; Dahlblom, O. The effect of CFRP and CFRP/concrete interface models when modelling retrofitted RC beams with FEM. Compos. Struct. 2010, 92, 1391–1398. [Google Scholar] [CrossRef]
  46. Chin, S.; Shafiq, N.; Nuruddin, M. Strengthening of RC beams with large openings in shear by CFRP laminates: 2D nonlinear FE analysis. Int. J. Civ. Environ. Struct. Construct. Archit. Eng. 2012, 6, 153–158. [Google Scholar]
  47. Mansour, M.; El-Maaddawy, T. Testing and modeling of deep beams strengthened with NSM-CFRP reinforcement around cutouts. Case Stud. Constr. Mater. 2021, 15, e00670. [Google Scholar] [CrossRef]
Figure 1. Activities of the experimental program.
Buildings 12 00027 g001
Figure 2. Details of steel reinforcement (dimensions are in mm).
Buildings 12 00027 g002
Figure 3. Fabric types: (a) carbon fabric; (b) PBO fabric.
Buildings 12 00027 g003
Figure 4. Strengthening regime (dimensions are in mm): (a) sagging strengthening (group A); (b) hogging strengthening (group B).
Buildings 12 00027 g004
Figure 5. Strengthening procedure: (a) water jetting; (b) roughened surface; (c) application of FRCM; (d) finished surface.
Buildings 12 00027 g005
Figure 6. Test set-up and instrumentation (dimensions are in mm).
Buildings 12 00027 g006
Figure 7. Crack pattern from the experiment (values are in kN): (a) Control; (b) S-C2; (c) S-C4; (d) S-P2; (e) SP-4; (f) H-C2; (g) H-C4; (h) H-P2; (i) HP-4.
Buildings 12 00027 g007aBuildings 12 00027 g007b
Figure 8. Typical failure modes of the specimens with sagging strengthening (S-C4): (a) Localized concrete crushing at hogging; (b) Localized concrete crushing at sagging; (c) Cover ripping off.
Buildings 12 00027 g008
Figure 9. Typical failure modes of the specimens with hogging strengthening (H-P2): (a) Close-up view of fabric–matrix interface debonding; (b) Interfacial debonding at fabric–matrix interface and concrete crushing at hogging; (c) Concrete crushing at sagging.
Buildings 12 00027 g009
Figure 10. Steel strains: (a) Group A (sagging strengthening); (b) Group B (hogging strengthening).
Buildings 12 00027 g010aBuildings 12 00027 g010b
Figure 11. Experimental load–deflection response: (a) Group A (sagging strengthening); (b) Group B (hogging strengthening).
Buildings 12 00027 g011
Figure 12. Experimental load–moment relationships: (a) Group A (sagging strengthening); (b) Group B (hogging strengthening).
Buildings 12 00027 g012
Figure 13. Constitutive laws of “CC3DNonLinCementitious2”: (a) compressive hardening; (b) compressive softening; (c) tensile softening.
Buildings 12 00027 g013
Figure 14. Reinforcement stress–strain response: (a) steel; (b) carbon and PBO fabrics.
Buildings 12 00027 g014
Figure 15. Bond-slip models adopted at the fabric–matrix interface data from [42,43].
Buildings 12 00027 g015
Figure 16. Numerical model elements and boundary conditions.
Buildings 12 00027 g016
Figure 17. Numerical load–deflection response: (a) Group A (sagging strengthening); (b) Group B (hogging strengthening).
Buildings 12 00027 g017
Figure 18. Numerical vs. experimental load–deflection response: (a) Control; (b) Group A (sagging strengthening); (c) Group B (hogging strengthening).
Buildings 12 00027 g018aBuildings 12 00027 g018b
Figure 19. Numerical load–moment relationships: (a) Group A (sagging strengthening); (b) Group B (hogging strengthening).
Buildings 12 00027 g019
Figure 20. Predicted crack pattern: (a) Control; (b) S-C2; (c) S-C4; (d) S-P2; (e) SP-4; (f) H-C2; (g) H-C4; (h) H-P2; (i) HP-4.
Buildings 12 00027 g020aBuildings 12 00027 g020b
Table 1. Test matrix.
GroupStrengthening RegimeDesignation
LocationFabric TypeNo. of FRCM Layers
Control---Control
ASaggingCarbon2S-C2
4S-C4
PBO2S-P2
4S-P4
BHoggingCarbon2H-C2
4H-C4
PBO2H-P2
4H-P4
Table 2. Fabric properties provided by the manufacturer [34,35].
PropertyCarbonPBO
Weight per unit area (g/m2)28188
Tensile strength (MPa)43005800
Modulus of elasticity (GPa)240270
Elongation at break (%)1.802.15
Cross sectional area (mm2/mm)0.1570.045 (0.012) 1
Spacing between fabric bundles (mm)1710 (17.5) 1
1 Values in parentheses belong to the weft direction.
Table 3. Summary of test results.
SpecimenLoads (kN)Deflection (mm)Strength Gain
(%)
Ductility Index 2
fy2)
Ductility Reduction 2
(%)
At 1st Yield
(Py1)
At 2nd Yield
(Py2)
At Ultimate
(Pu)
At 1st Yield
y1)
At 2nd Yield
y2)
At Peak Load
p)
At Failure 1
f)
Control1902302437.810.416.226.8-2.6-
S-C21902603127.511.924.024.0282.023
S-C41802803136.211.916.516.5291.446
S-P21902602857.311.726.128.8172.54
S-P41802602886.011.721.221.2191.831
H-C22302502848.49.517.317.3171.831
H-C4 32302302569.39.311.411.4N/AN/AN/A
H-P22302552669.211.125.027.092.48
H-P42502502769.49.417.517.5141.927
1 For specimens with a sudden drop in peak load, Δf = Δp, whereas for specimens with a plateaued or softened response after the peak load, Δf = maximum measured deflection, noting that corresponding loads at Δf are greater than 0.85 Pu. The value of Δf of represents the deflection capacity of the specimen. 2 With respect to results of the control specimen. 3 This specimen had an initial vertical crack in the east span close to the middle support, and hence, it did not develop its full flexural capacity due to a premature, sudden ripping off of the tension concrete cover.
Table 4. Moment redistribution at ultimate load.
SpecimenExperimental Ultimate Moment, Mexp
(kN-m)
Elastic Moment, Me
(kN-m)
Moment Redistribution Ratio, β
(%)
SaggingHoggingSaggingHoggingSaggingHogging
Control39.750.736.456.1+9.1−9.6
S-C253.161.146.771.9+13.7−15.0
S-C457.953.546.872.0+23.7−25.7
S-P248.156.842.765.8+12.7−13.7
S-P449.555.843.266.4+14.6−16.0
H-C240.070.442.765.7−6.3+7.2
H-C439.958.338.959.9+2.6−2.7
H-P241.460.140.361.9+2.8−2.9
H-P439.168.541.764.1−6.2+6.9
Table 5. Input data for concrete properties.
ParameterDescriptionValue
fcuCube compressive strength−40.0 MPa
f′cCylinder compressive strength−29.0 MPa
ftTensile strength2.4 MPa
EcElastic modulus2.5 × 104 MPa
μPoisson’s ratio0.2
GfSpecific fracture energy7.0 × 10−5 MN/m
wdCritical compressive displacement−5.0 × 10⁻⁴ m
εcpPlastic strain at compressive strength−1.0 × 10⁻³
Table 6. Input data for the cementitious matrix used with carbon.
ParameterDescriptionValue
fcuCube compressive strength−45.0 MPa
f′cCylinder compressive strength−35.0 MPa
ftTensile strength3.4 MPa
EcElastic modulus2.8 × 104 MPa
μPoisson’s ratio0.2
GfSpecific fracture energy7.6 × 10−5 MN/m
wdCritical compressive displacement−5.0 × 10⁻⁴ m
εcpPlastic strain at compressive strength−1.1 × 10⁻³
Table 7. Input data for the cementitious matrix used with PBO.
ParameterDescriptionValue
fcuCube compressive strength−35.0 MPa
f′cCylinder compressive strength−28.0 MPa
ftTensile strength4.0 MPa
EcElastic modulus9.0 × 103 MPa
μPoisson’s ratio0.2
GfSpecific fracture energy6.4 × 10−5 MN/m
wdCritical compressive displacement−5.0 × 10⁻⁴ m
εcpPlastic strain at compressive strength−9.2 × 10⁻⁴
Table 8. Comparison between predicted and experimental ultimate loads.
SpecimenUltimate Load
(kN)
Deflection at Ultimate Load
(mm)
Experimental
(Pu)
Numerical 1
(PFE)
Ratio
(PFE/Pu)
Experimental
p)
Numerical 1
FE)
Ratio
pFE)
Control2432641.0916.218.71.15
S-C23123151.012412.60.53
S-C43133341.0716.510.40.63
S-P22853021.0626.1180.70
S-P42883191.1121.216.10.76
H-C22843051.0717.312.20.71
H-C4 2256318N/A11.49.6N/A
H-P22662901.092520.20.81
H-P42763081.1217.515.10.86
Average 1.08 0.77
1 Results of the numerical models with bond-slip law at the fabric–matrix interface. 2 This specimen had an initial vertical crack in the east span close to the middle support, and hence, it did not develop its full flexural capacity due to a premature and sudden ripping off of the tension concrete cover. Experimental results for this specimen were not included in the analysis.
Table 9. Numerical moment redistribution at ultimate load.
Specimen Numerical Ultimate Moment, MFE
(kN-m)
Elastic Moment, Me
(kN-m)
Moment RedistributionRatio, β
(%)
SaggingHoggingSaggingHoggingSaggingHogging
Control46503961+16.0−17.3
S-C261504773+28.5−30.9
S-C466505077+32.3−35.0
S-P256514569+24.3−26.4
S-P462504873+29.5−31.9
H-C245724670−1.9+2.0
H-C444804873−7.8+8.5
H-P246634367+5.6−6.0
H-P445724671−1.3+1.4
Publisher’s Note: MDPI stays neutral with regard to jurisdictional claims in published maps and institutional affiliations.

