1. Introduction
Teaching construction among students of architecture is not an easy process. Most of the courses in architecture are limited and the time that can be devoted to teaching construction is very short. Another problem is the fact that construction subjects are often separated from design ones, which makes it difficult for students to relate real design problems with the issues of designing structures that they master during construction courses [
1]. An additional difficulty is the limitations in the skills of mathematical analysis [
2].
Most often, construction courses are based on the understanding of the basic theoretical issues where concepts such as vectors, forces, a moment of force, bending moments, shear forces, longitudinal forces, etc. are learned. Then a specific construction problem is analyzed. Its solution usually consists of manual, labor-intensive calculation of internal forces under the influence of external loads, which is finally presented in the form of graphs. The optimization of the structure consists in changing the geometry of the structure or the location of external forces, and then re-performing calculations and evaluating the results. If they are satisfactory, the elements of the structure are sized. This approach, although common, is ineffective in shaping the structural intuition of students [
1] and the effects of calculations in the form of diagrams of internal forces do not help in understanding the nature of the structure’s work [
2]. The use of a computer that improves the performance of calculations does not facilitate learning because, on the one hand, students do not have the skills to use specialized programs, and on the other hand, there is a problem called “garbage in, garbage out”, which means the principle that the quality of the results from structural analysis software depends on the operator and the validity of his or her assumptions and inputs [
3]. Teaching the structure only by discussing it is not a solution to the problem as it does not answer the problems that arise during architectural design [
1].
2. Graphical Methods
The teaching methods described in the introduction, also popular in construction studies, have been and are widely criticized not only by practitioners but also by teachers themselves. An example is Wacław Zalewski, Polish structural engineer, author of the structure of many buildings, professor at the Faculty of Architecture, M.I.T. He mentioned that “at the Polytechnics used to teach how to calculate structures with specific static schemes, and yet the essence of the problem lies elsewhere—how to shape a structure to achieve the best static and aesthetic effects. The form is a consequence of general considerations regarding the function of the object and the spatial distribution of the forces” [
4]. He strongly emphasized the importance of design intuition. He claimed that “it is derived from life and professional experiences and associations, located for years in the subconscious, and is not only a result of genetic predisposition, so it can be developed or suppressed” [
5].
The flow of forces method developed by him was a significant change in the qualitative approach to teaching and designing structural systems. Its name referred to the graphic visualization of the invisible network of internal forces, replacing their abstract algebraic description, which made it a helpful tool in the learning process. As he emphasized, structural behavior can only be represented by two types of internal forces: compression and tension, which, being mutually perpendicular to each other, create an orthogonal system of stress trajectories [
5]. Such presentation of the problems of the construction work significantly facilitates the qualitative assessment without losing the possibility of their quantitative determination. An orthogonal stress mesh can be transformed into a truss equivalent model by orienting the member directions along major tension or compression stress trajectories and then determining their values. The beginnings of this method, developed in the nineteenth century by N. Ritter, detailed by W. Zalewski, were popularized in the 1970s as the “strut and ties” (STM) method and are still known today under this name [
6].
The above solutions are based on a set of graphic methods called graphic statics. Its roots go back to the works of Leonardo da Vinci, Galileo, and the mathematician Simon Stevin, who was the first to present force as a vector and correctly interpret the parallelogram of forces. Graphical presentation of the distribution and values of forces by means of the form and force diagram was developed over the next centuries and its refined form was presented by J.C. Maxwell (1964), K. Culmann (1866), L. Cremona (1872), and H. Bow (1873), [
7] however, in a simplified way, these methods were already used in the Middle Ages during the construction of, for example, gothic cathedrals [
8]. This method was described in a particularly complete manner by the Italian mathematician L. Cremona, whose name is sometimes called the graphic statics method. The basic principle of graphic static is to relate the geometry of a structure represented by a form diagram to a graphical representation of its internal forces named force diagram. Thanks to it, it is possible to easily explain the relationship between geometry and the distribution of internal forces (compression and tension) in the structural system. Moreover, it requires neither specialized tools nor mathematical knowledge, but only the ability to prepare graphic diagrams as shown by T.v. Mele et al. [
9]. These advantages are undoubtedly advantages during education at architectural courses where students have significant drawing skills and graphic diagrams appeal to their imagination. Even among professional structural engineers who design and validate structures using finite element methods, graphic statics serves as an initial tool for evaluating the structural system. Its influence on education and subsequent projects can be seen in such famous designers as Felix Candela, Eduardo Torroja, or Santiago Calatrava [
7].
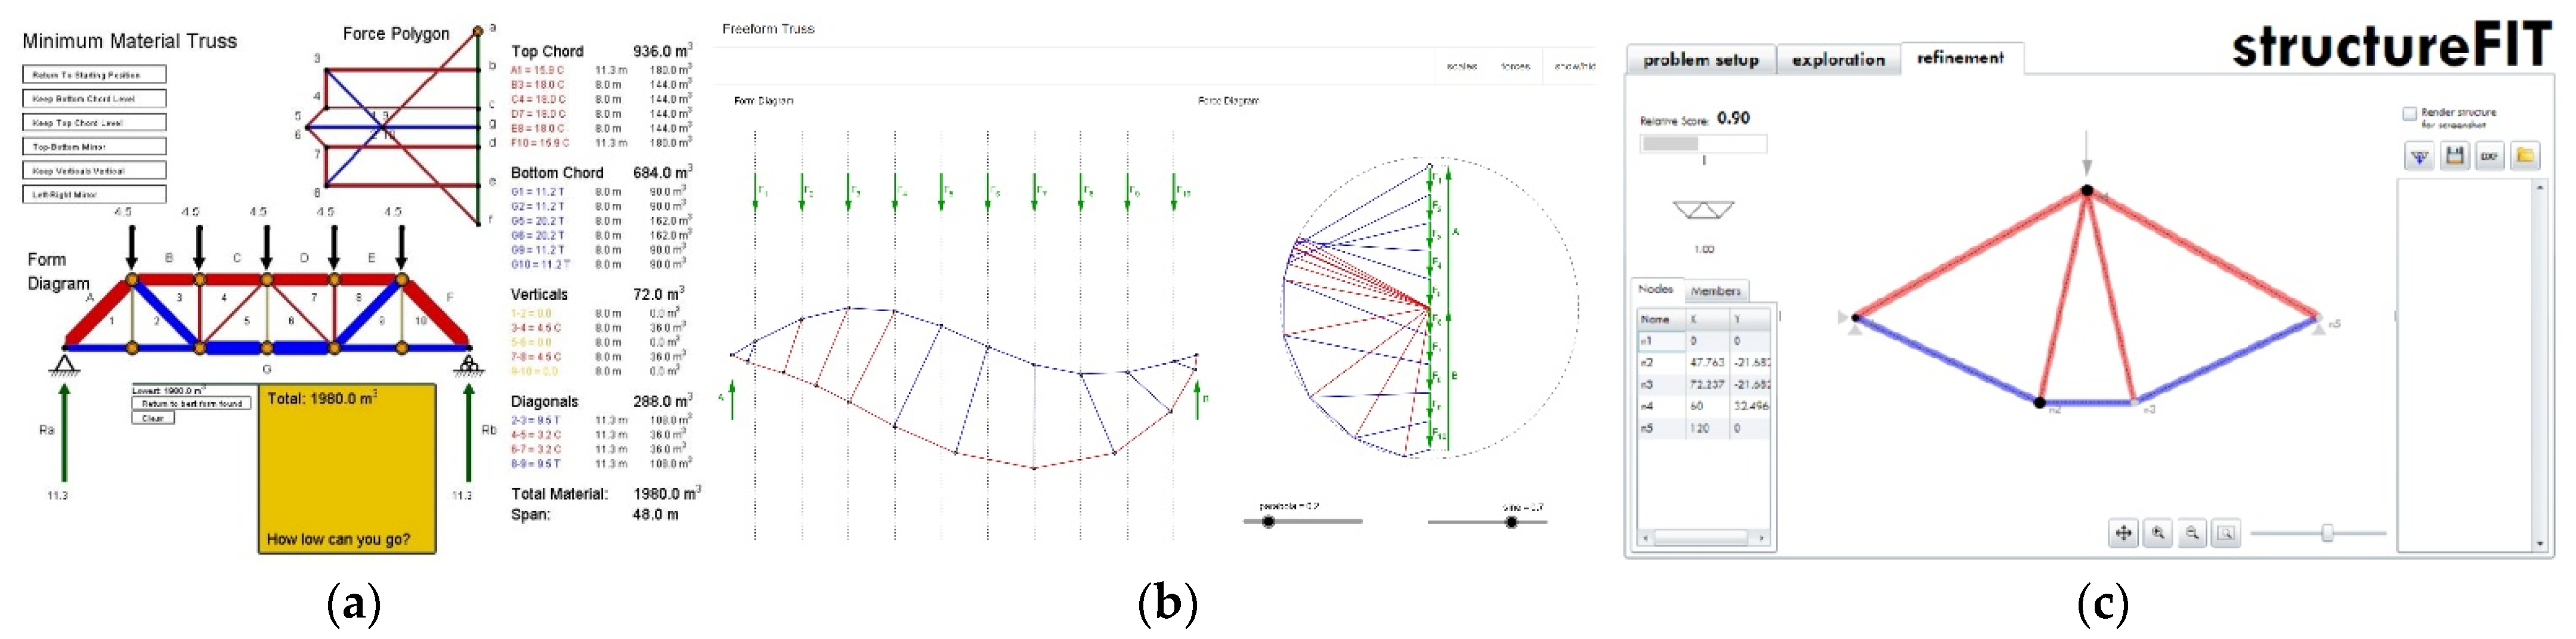
Since during the education process drawing diagrams for structures with complex and diverse geometry is laborious and then the necessity to modify them to search for the optimal form of the structure requires the creation of many such diagrams, the use of computers was natural. Simon Greenwold, in cooperation with Edward Allen and Wacław Zalewski, developed an easy-to-use program Active Statics [
3], thanks to which you can analyze the structural behavior of sample structures such as a simple truss, arch, cantilever truss, fan-like structure, overhanging truss. In the application, it is possible to change the geometry of the system and the automatically updated force polygon shows the force values in individual bars, also through a graphical representation with the color and thickness of the bar. The possibility of changing the geometry many times while observing the results at the same time makes it easier to understand the general rules of construction work, which makes it easier to learn an effective (and overtime intuitive) search for the most favorable force distribution in the bars. (
Figure 1a).
A similar example is the eQUILIBRIUM web application developed by Block Research Group and J. Schwarz in the GeoGebra and GeoStat environment, available to students of ETH in Zurich [
10]. It allows for intuitive learning by analyzing form and force diagrams by introducing changes in geometry or loads while observing changes in force values (
Figure 1b).
P. Block, together with J. Ochsendorf and T. Ciblac, also developed an interactive tool called InteractiveTHRUST [
11] for the flat calculation of masonry vaults in buildings using the well-known line of thrust method [
12]. P. Block and J. Ochsendrof later developed a method of computing a thrust network analysis in a spatial system based on the work of O’Dwyer [
13]. They also presented an interactive tool for finding the three-dimensional equilibrium of compression-only surfaces and systems, which enables a clear graphical representation of forces in the system (through the use of force diagrams, i.e., the dual grids), a high level of control, allowing the exploration of different possible equilibrium solutions and fast solving times because of the formulation as a simple linear optimization problem [
14].
A more advanced version of the program similar to eQUILIBRIUM is the StructureFIT developed by Caitlin Mueller, which allows not only optimization within the assumed topology of bars, but also the selection of the most appropriate one due to architectural conditions, which is often omitted when looking for an optimal solution due to e.g., the criterion of minimum stresses. Thanks to the use of an evolutionary algorithm, it is possible to explore various groups of designs, choose the most favorable ones and then generate next generations using mutation rate, the degree of randomness introduced when a new population of designs is generated [
15]. The operation of searching successive design spaces can be carried out until the most favorable version is selected for any quantitative or qualitative criterion (
Figure 1c).
3. Original Examples of Educational Methods
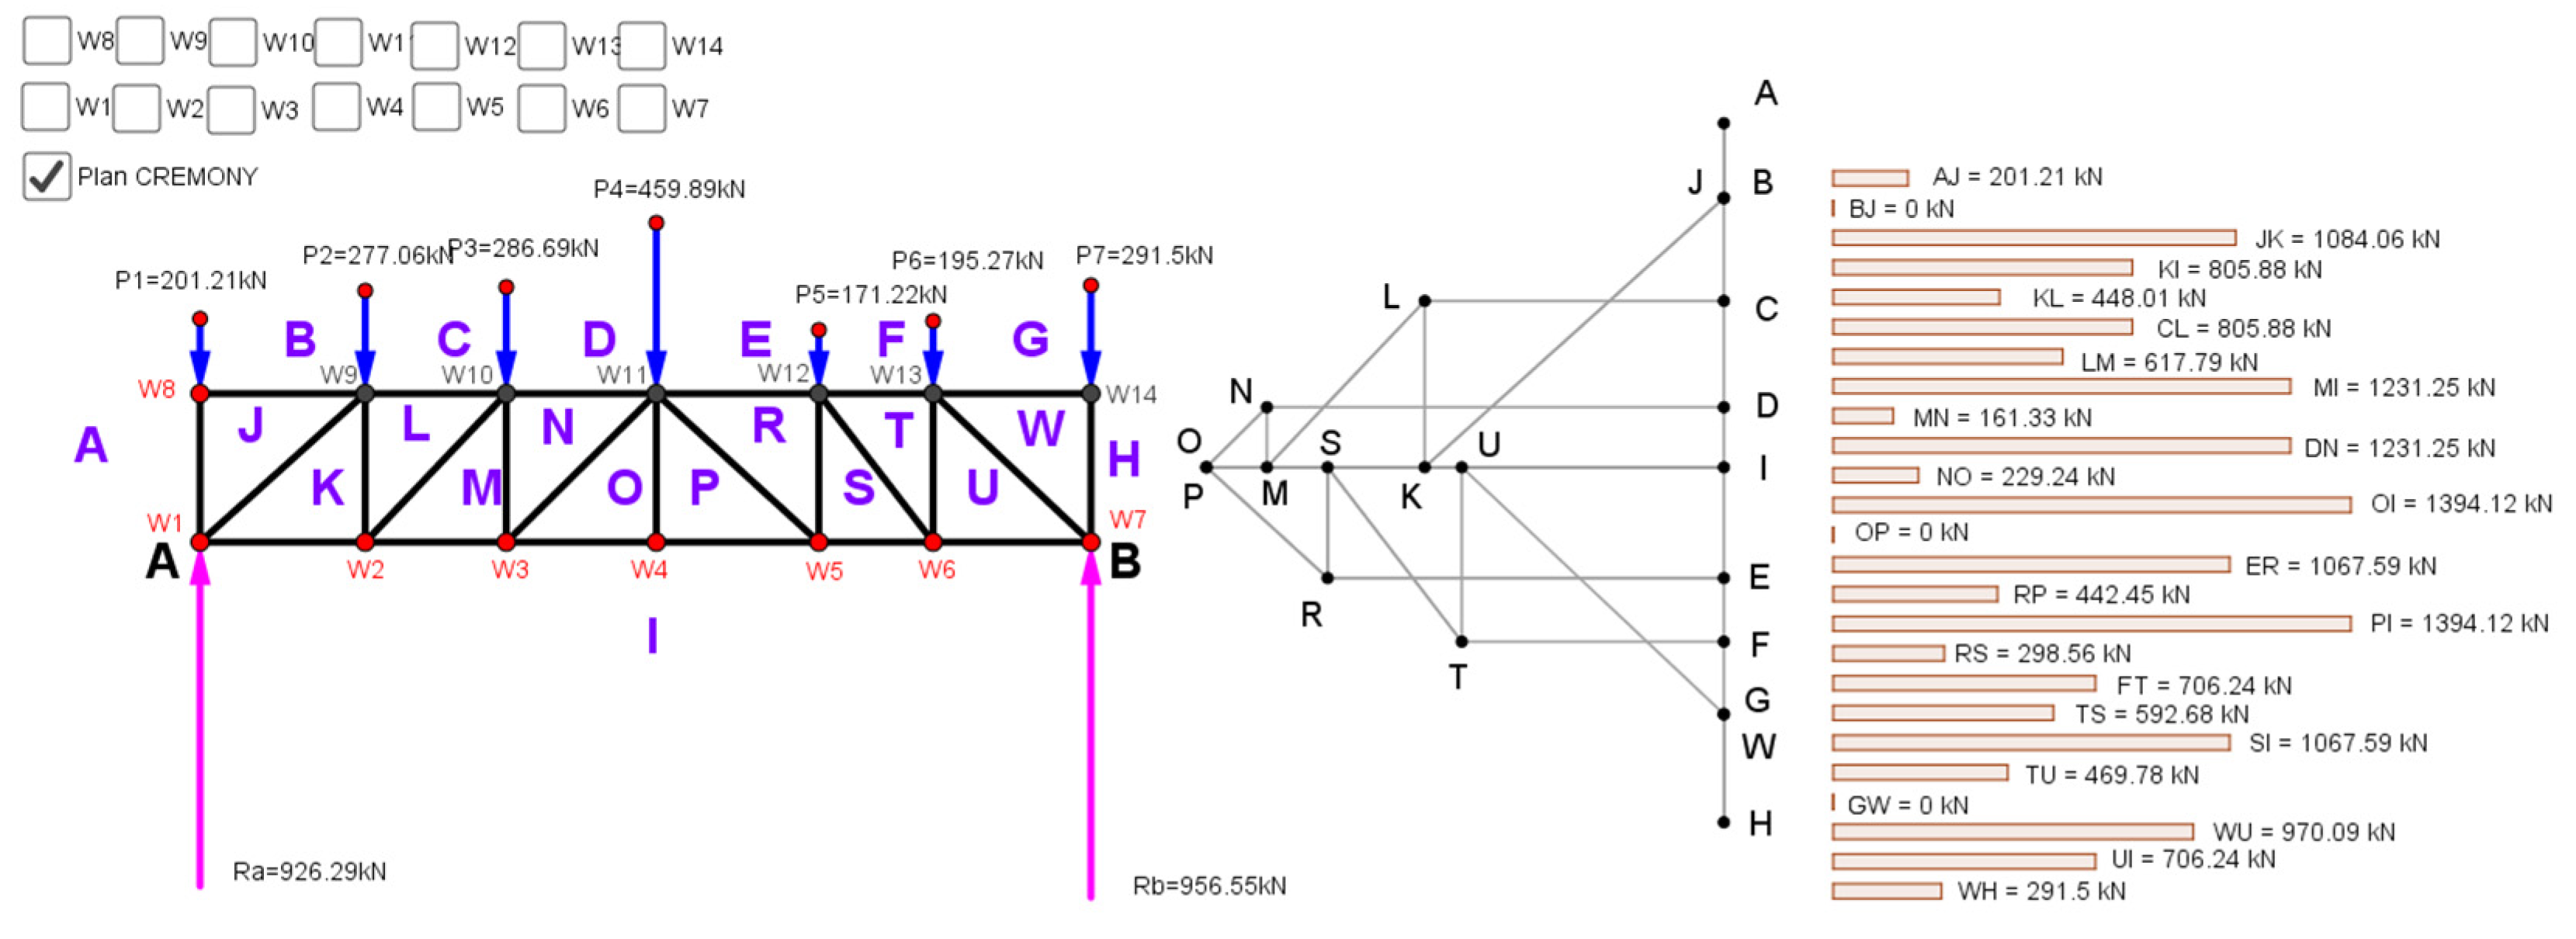
The author, during his educational practice, prepared for students of the Mechanics and Statics of Structures course at the Faculty of Architecture of the Wroclaw University of Science and Technology, interactive examples in the GeoGebra environment devoted to structural statics, e.g., vector systems in a flat convergent and free force system, diagrams of bending moments, shear and normal forces in simple beams and frames, as well as truss solutions using the Cremona method also known as a Maxwell-Cremona Diagram [
16,
17]. All examples are interactive and allow students to change selected parameters and observe the effects of the change. For example, in the presentation of the Cremona method, it was possible to change the size of the loads and the location of the truss nodes. While performing these operations, students can observe changes taking place in the Cremona plan (force diagram). It is easy to observe how the changes, for example in the geometry of the truss, affect the values of forces in the bars, which can be read from the Cremona plan and the table of forces. Additional functionality is the ability to observe force diagrams for any nodes (
Figure 2).
GeoGebra
Trusses are very helpful in visualizing internal forces. Firstly, due to their design properties, they theoretically only contain normal forces (compression or tension), and secondly, due to the discrete arrangement of the material by means of the rods, the forces “flow” through the rods in a directed manner. The only force parameters that cannot be seen are the value of the force and its nature (compression or tension). Usually, during the course, finding internal forces in a truss ends with a drawing showing the nature of the forces in the bars (e.g., through color) and their values (e.g., through the thickness of the bar). However, it always happens after the static system has been solved, so it is not possible to observe changes while changing the geometry of the truss or changing the loads.
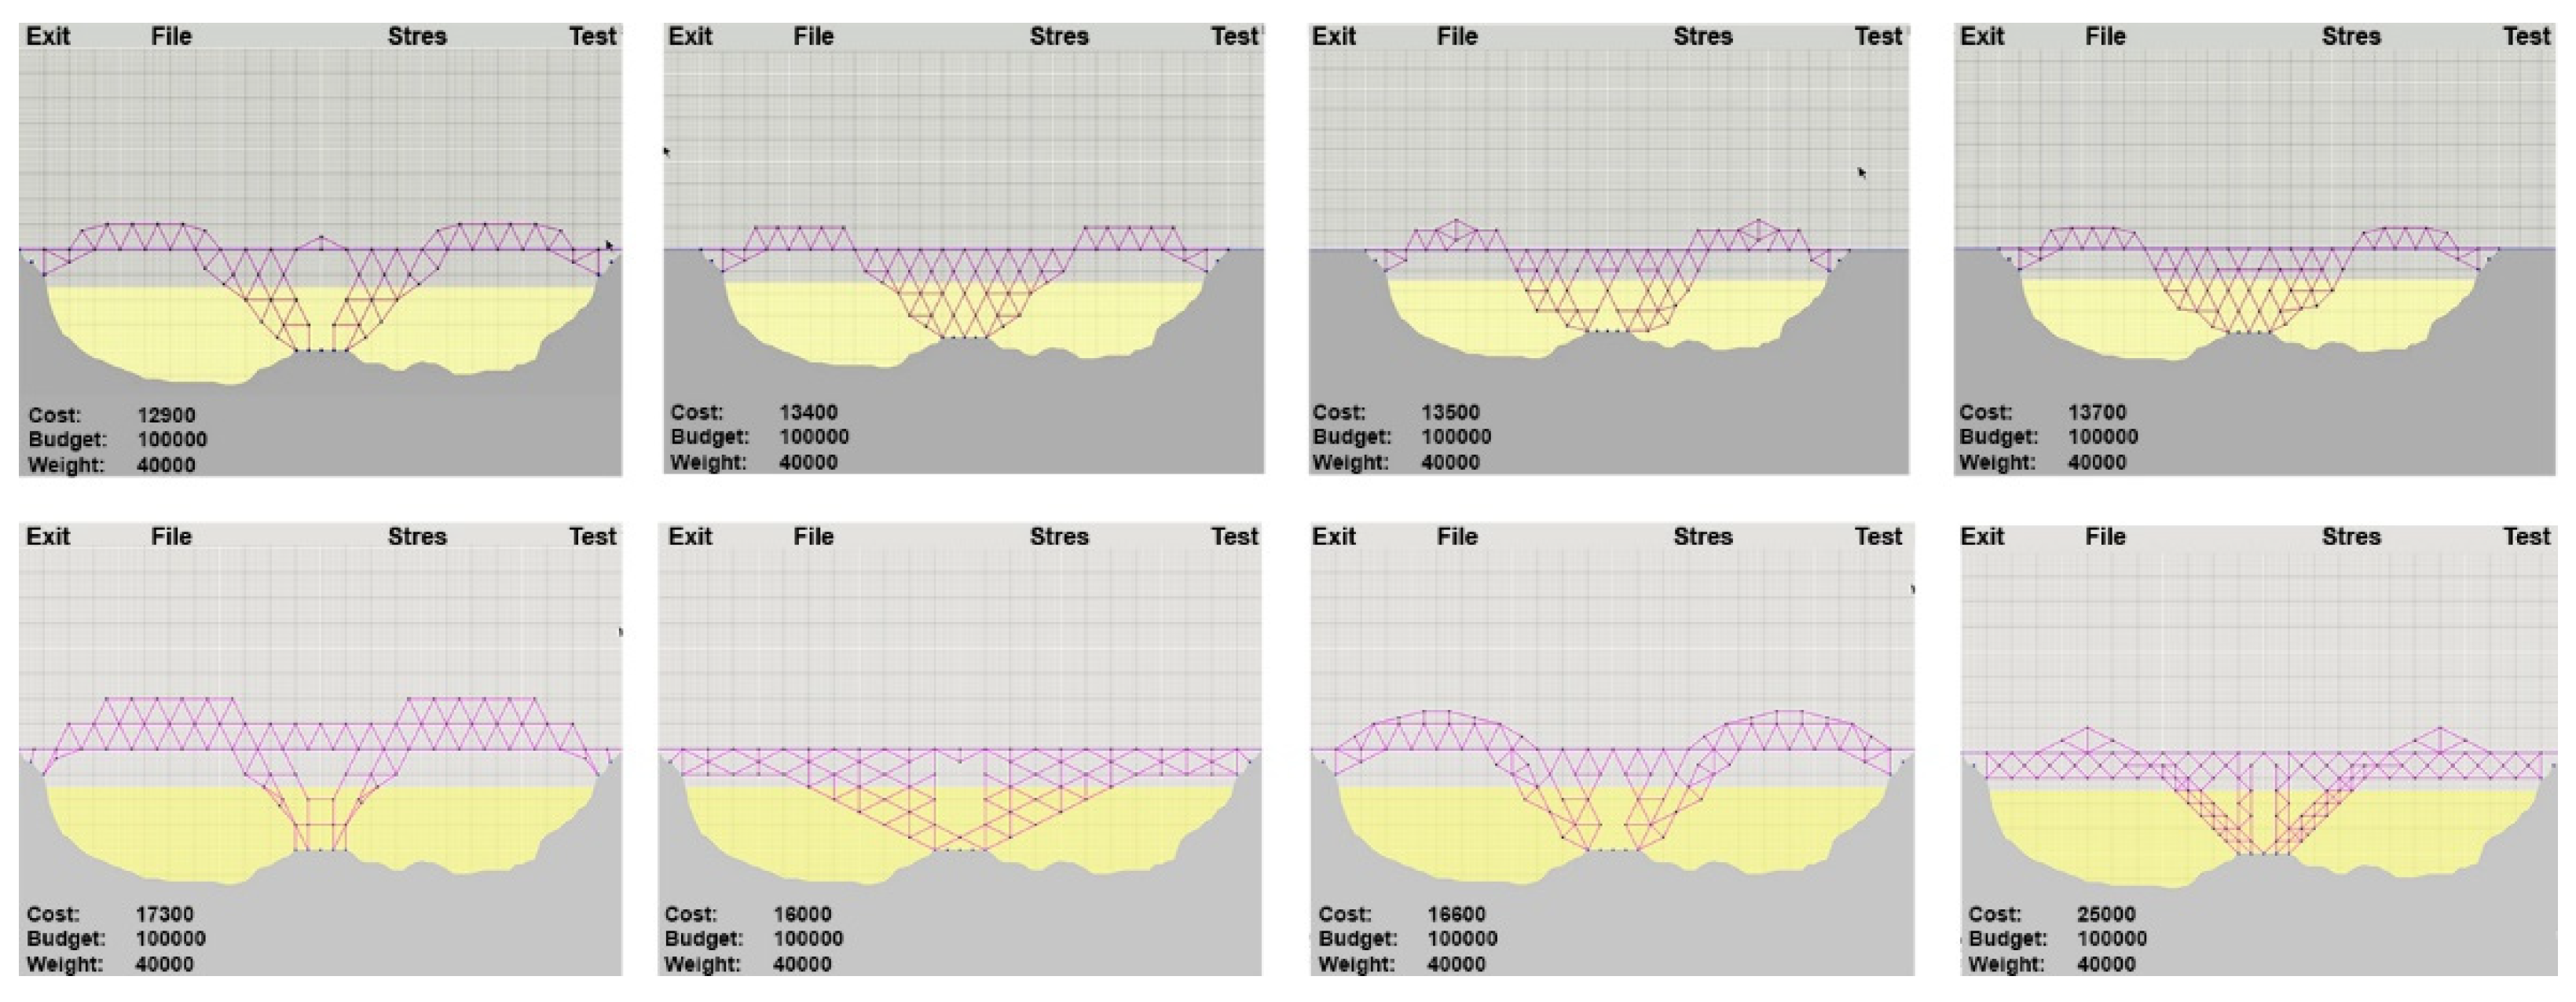
The lack of this possibility while performing calculations and drawings by hand encouraged the author to use a simple game called Bridge Builder, which aims to build flat truss bridges and then load them with a passing train. Live loads cause variable force values in bars, indicated by their color. Thanks to this procedure, it is possible to temporarily visualize the values of forces occurring in the bars. As each bar has its price, it is also possible to take into account the optimization criterion, which is the construction cost, assuming the maximum budget to be used or striving to construct the cheapest bridge. The program is very easy to use although the colors of the bars do not reflect the nature of the forces (compression or tension). As the game has more and more difficult stages, students must have more and more knowledge and experience to overcome them, which significantly helps in developing their structural intuition. For several years, the author encouraged course participants to take part in organized competitions for the construction of the cheapest bridge for specific boundary conditions. These competitions were very popular and their participants emphasized that apart from the educational value, the program also gave them a lot of fun (
Figure 3).
Using the BridgeBuilder game gave rise to the idea of creating a physical truss that would show the scale of the internal forces in the bars using, for example, built-in LED lighting. The idea of teaching construction with the use of physical models is successfully implemented at many universities and the possibility of working with real material and objects allows for a more intensive finding of relations between the form, material, construction details, and work of construction [
18].
4. Design and Implementation of a Physical Truss
The implementation of a small truss visualizing the type and value of internal forces or the possibility of such functionality on a real object (e.g., a bridge) would be an interesting didactic tool not only among students of architecture but also among people not related to design. The implementation of, for example, an interactive cladding on a bridge structure may not only have an educational or aesthetic value but also increase the interest in engineering problems among people not related to construction. The description and results of the project are presented below.
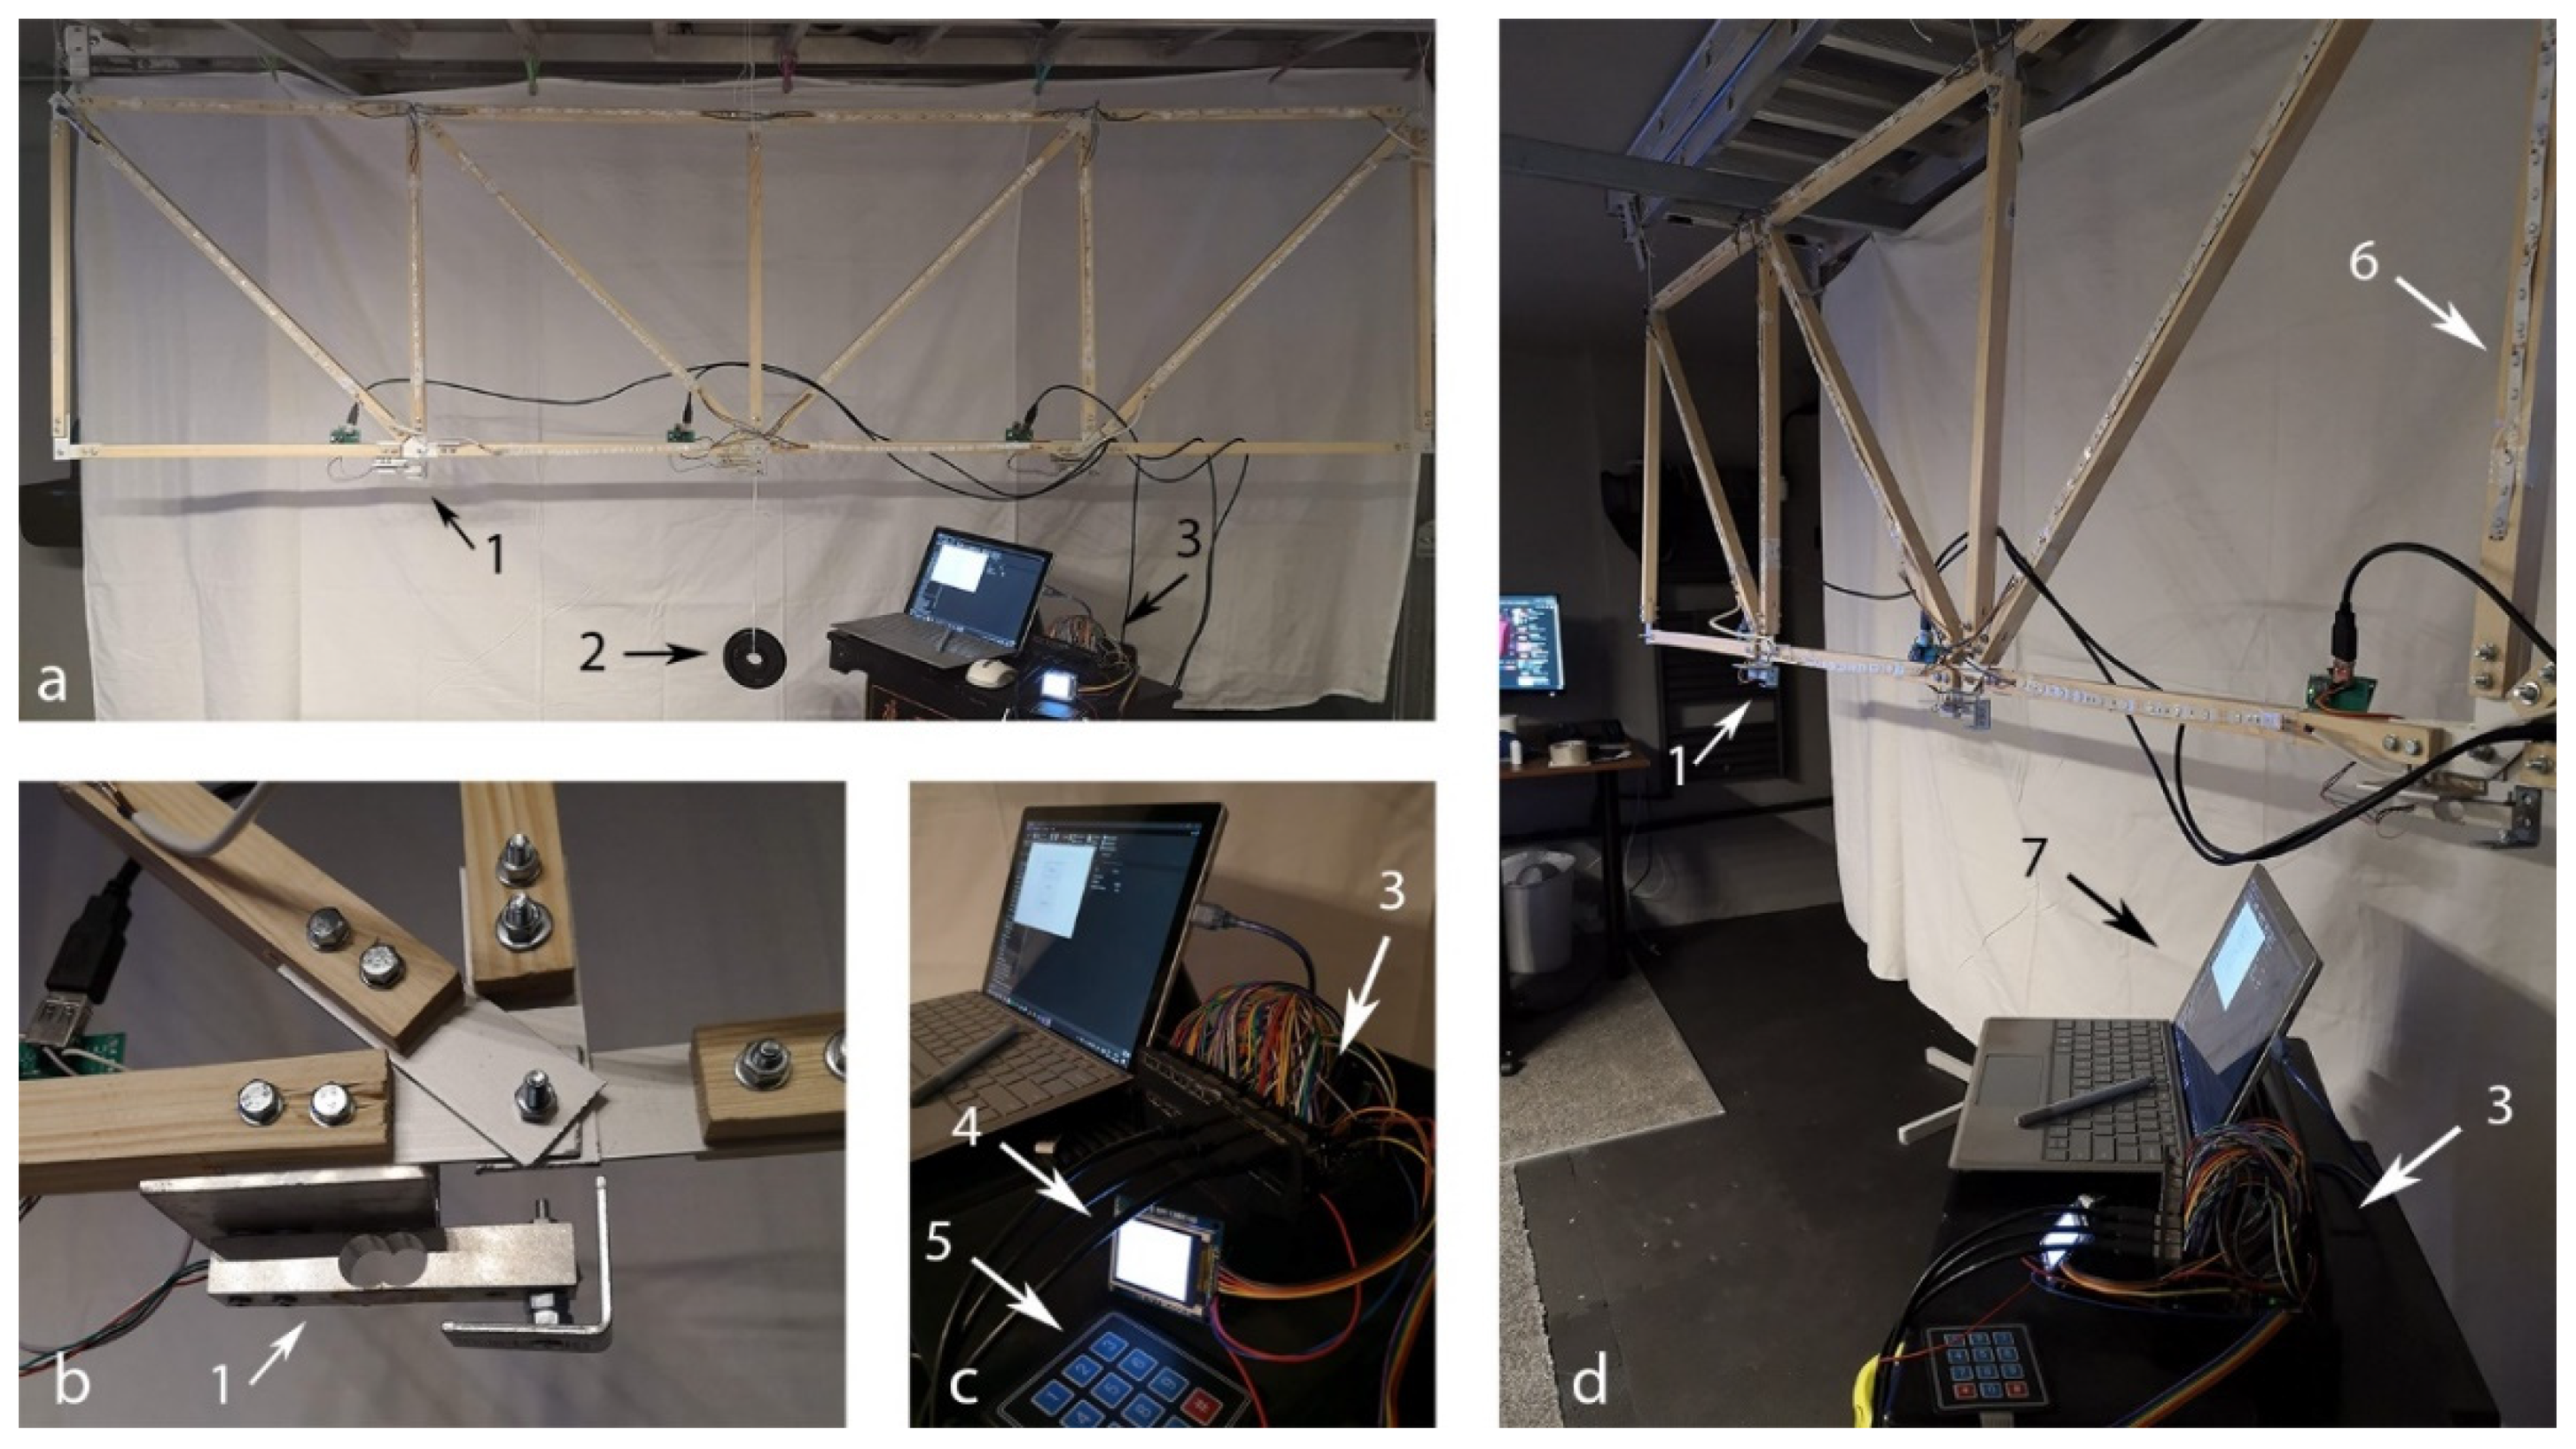
The truss measures 2.4 m by 0.6 m and is made of rectangular wooden slats with a cross-section of 1 × 1 cm. Bars are connected at nodes by means of bolted plates. The truss was supported by two supports in the external nodes and the loads were assumed in any other nodes. In the currently implemented project phase, the truss was loaded in three nodes of the lower chord.
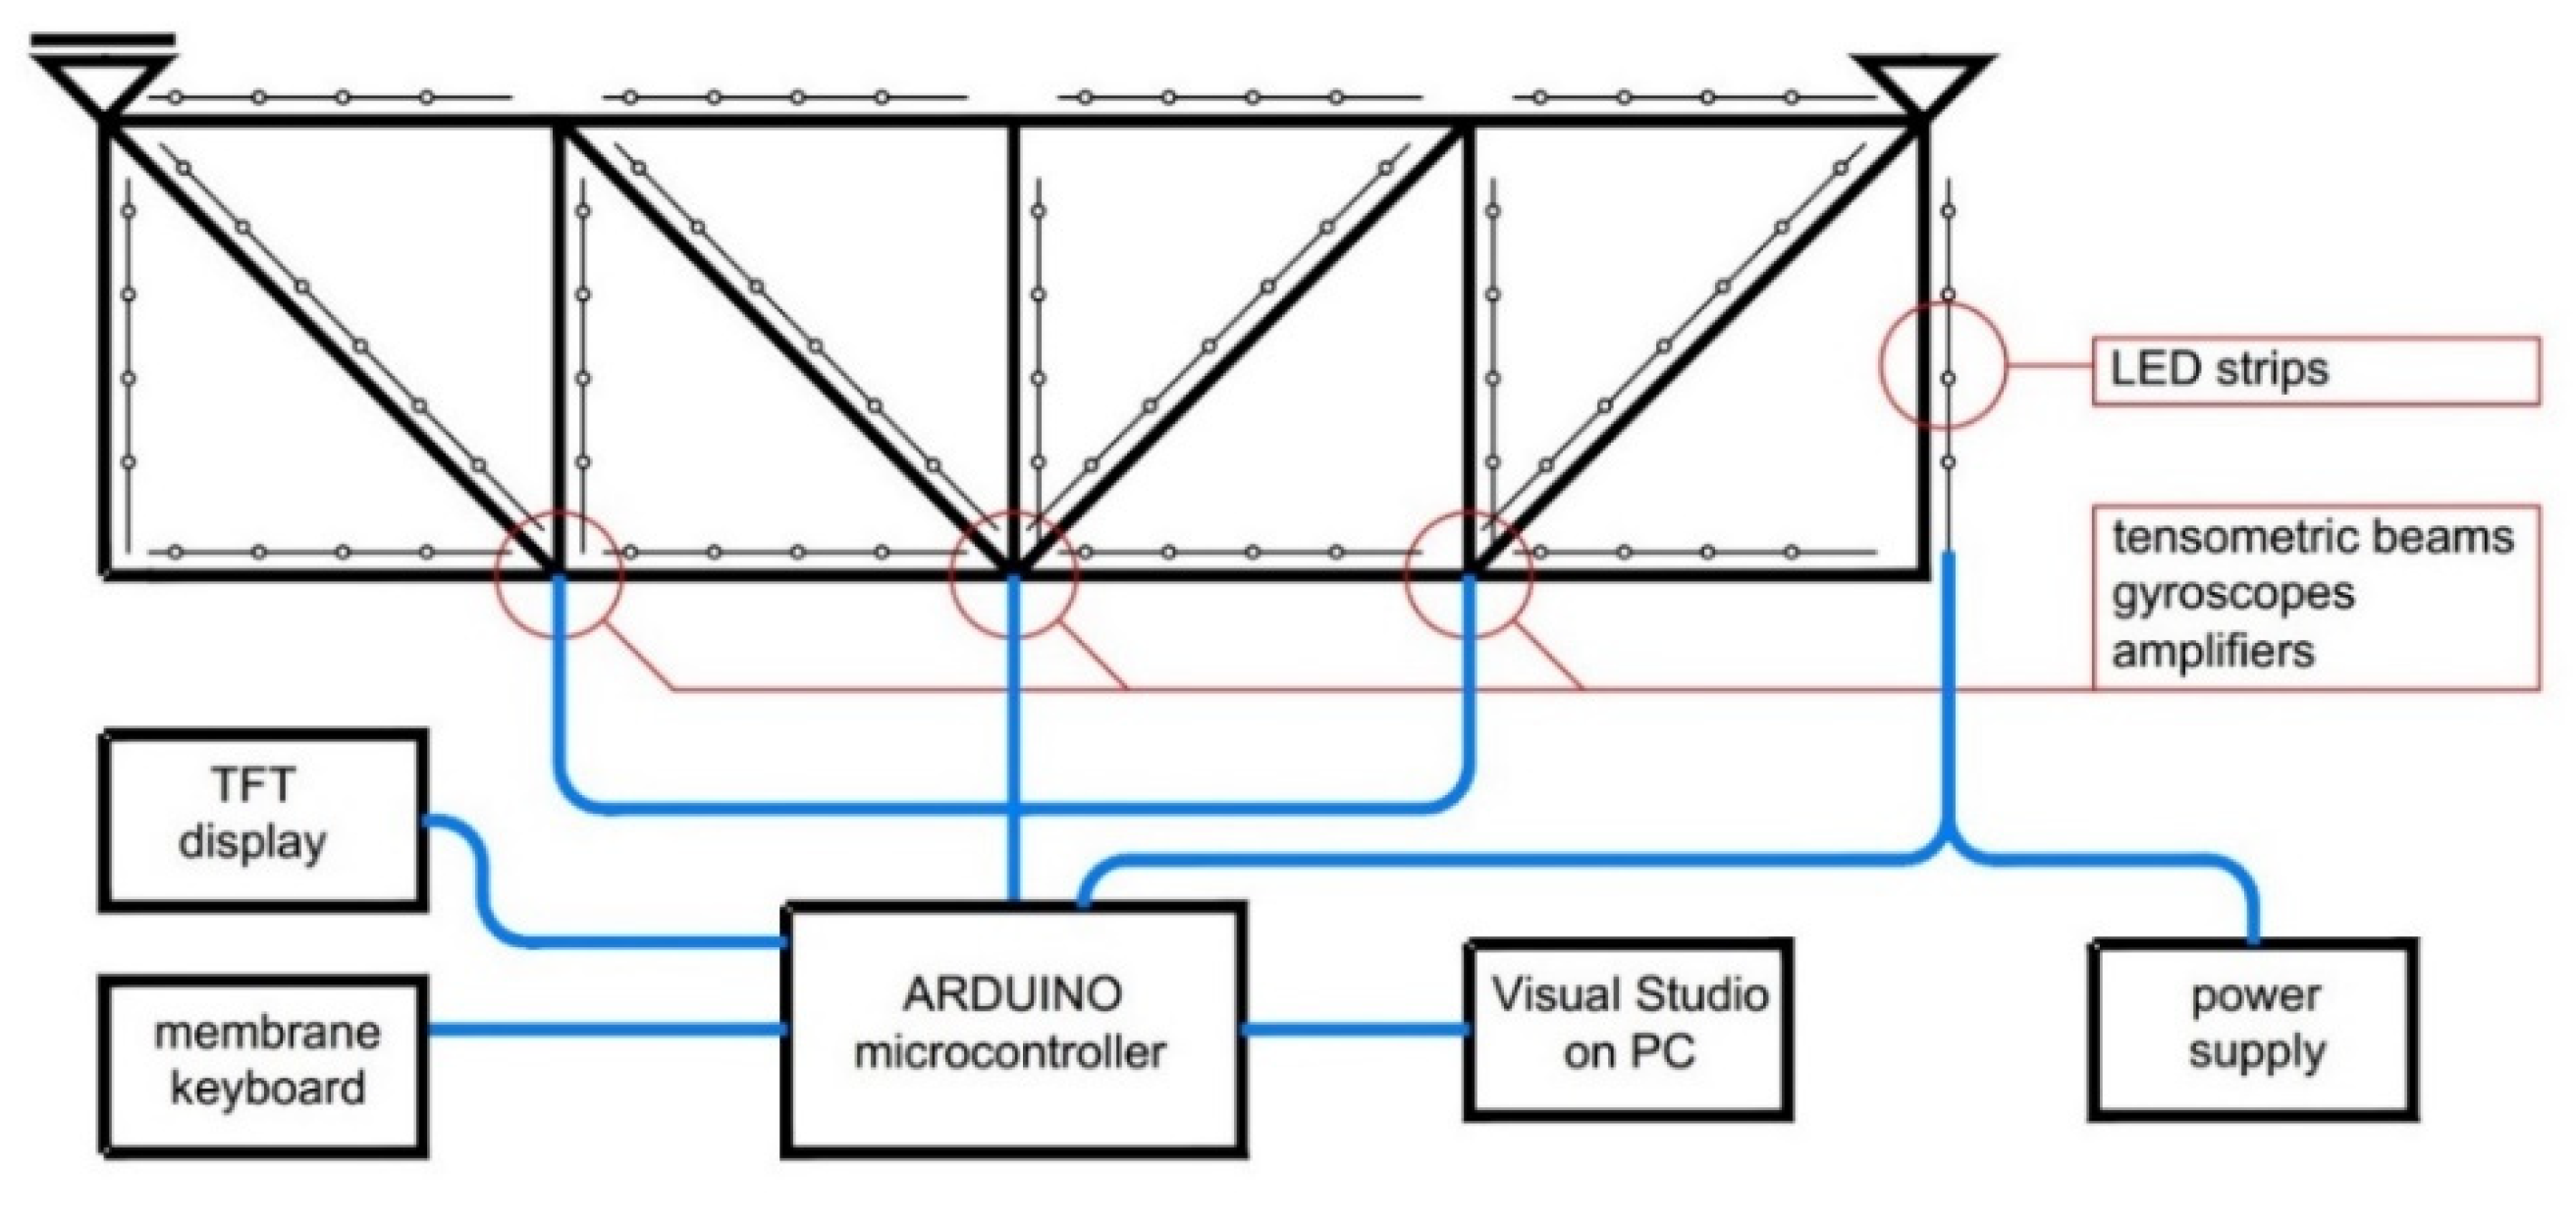
Tensometric beams, deforming under loads, are located under the nodes in a way that simulates the load on the truss at the nodes (
Figure 4b). The devices check the voltage of the current flowing through the electrical system inside. This voltage changes with the help of the Wheatstone bridge along with the microscopic deformation (which depends on the elastic parameters of material) of the beam geometry caused by external loads, and thus compression or stretching of the internal current-conducting paths, which in turn affects their own resistance and, further, the current intensity [
19]. Voltage changes are measured and then sent from the tensometric beam to the amplifier. The adopted model of a tensometric beam allows it to be loaded with a maximum force of 20 N, but it is possible to use other models of any strength (e.g., 50, 100, or 150 N). Ultimately, the only limitation is the strength of the truss itself. Tensometric beams are attached to gyroscopes, which together with the beams and amplifiers are responsible for reading the angle of inclination, and thus allow reading the direction of the forces applied to the truss. The amplified signal reaches the Arduino Mega2560 microcontroller and is recognized as the corresponding value of the force applied to the beam and further processed. Amplifiers, tensometric beams, and gyroscopes, due to the low power consumption, are powered directly from the Arduino microcontroller (
Figure 4).
The Arduino microcontroller is responsible for receiving, processing, and further sending data and is operated by a built-in program written in the Arduino language having many features in common with the C ++ language [
20]. The program has been divided into sub-programs that perform various functions. A mini TFT display with a resolution of 128 × 160 px is connected to the microcontroller, enabling the selection of a specific program using a connected membrane keyboard. Selecting a number on it corresponding to a subprogram will start the execution of the indicated part of the code.
The basic sub-program is used to analyze and present the forces in a truss of a selected shape. Two shapes of trusses were initially developed, supported by two consecutive sub-programs. For each bar in each of them, the partition coefficient by which the force in the node is multiplied was previously analytically determined. Once launched, the sub-program begins collecting data on the forces applied. The values measured in each node are multiplied according to the previously calculated partition coefficients and then individually summed for each bar, to obtain the forces occurring on the bars coming from all tensometric beams at once. The measurement results are presented on the mini TFT display in the truss diagram along with the colors corresponding to the nature of the force.
The data processed by the microcontroller is transmitted to LED strips attached to the truss. LED strips are divided into sections corresponding to the bars. The microcontroller sends them information about the intensity and color (blue for compression, red for tension, off for 0), which changes the light emitted by the LEDs (values from −256 to +256 are processed by Arduino into values from 0 to 256 with two different colors depending on the nature of the force). The loop of data collection, processing, and sending to the LED strip is performed with a frequency of 2 Hz to avoid overloading the microcontroller (
Figure 5).
The remaining sub-programs are auxiliary and are used to:
a sub-program that allows to create any shape of a truss based on a modular mesh, assign it supports and loads, and introduce coefficients of the applied force on each bar.
a load testing sub-program for tensometric bridges. After selecting it, the values on the beams are reset to zero, and then the collection of information from them and its processing into the values of individual diagrams for all beams begins. Graphs are made up of rectangles. Exceeding the scale is signaled by a color change of the entire graph.
a sub-program for testing gyroscopes. It is the same as the tensometric bridges sub-program.
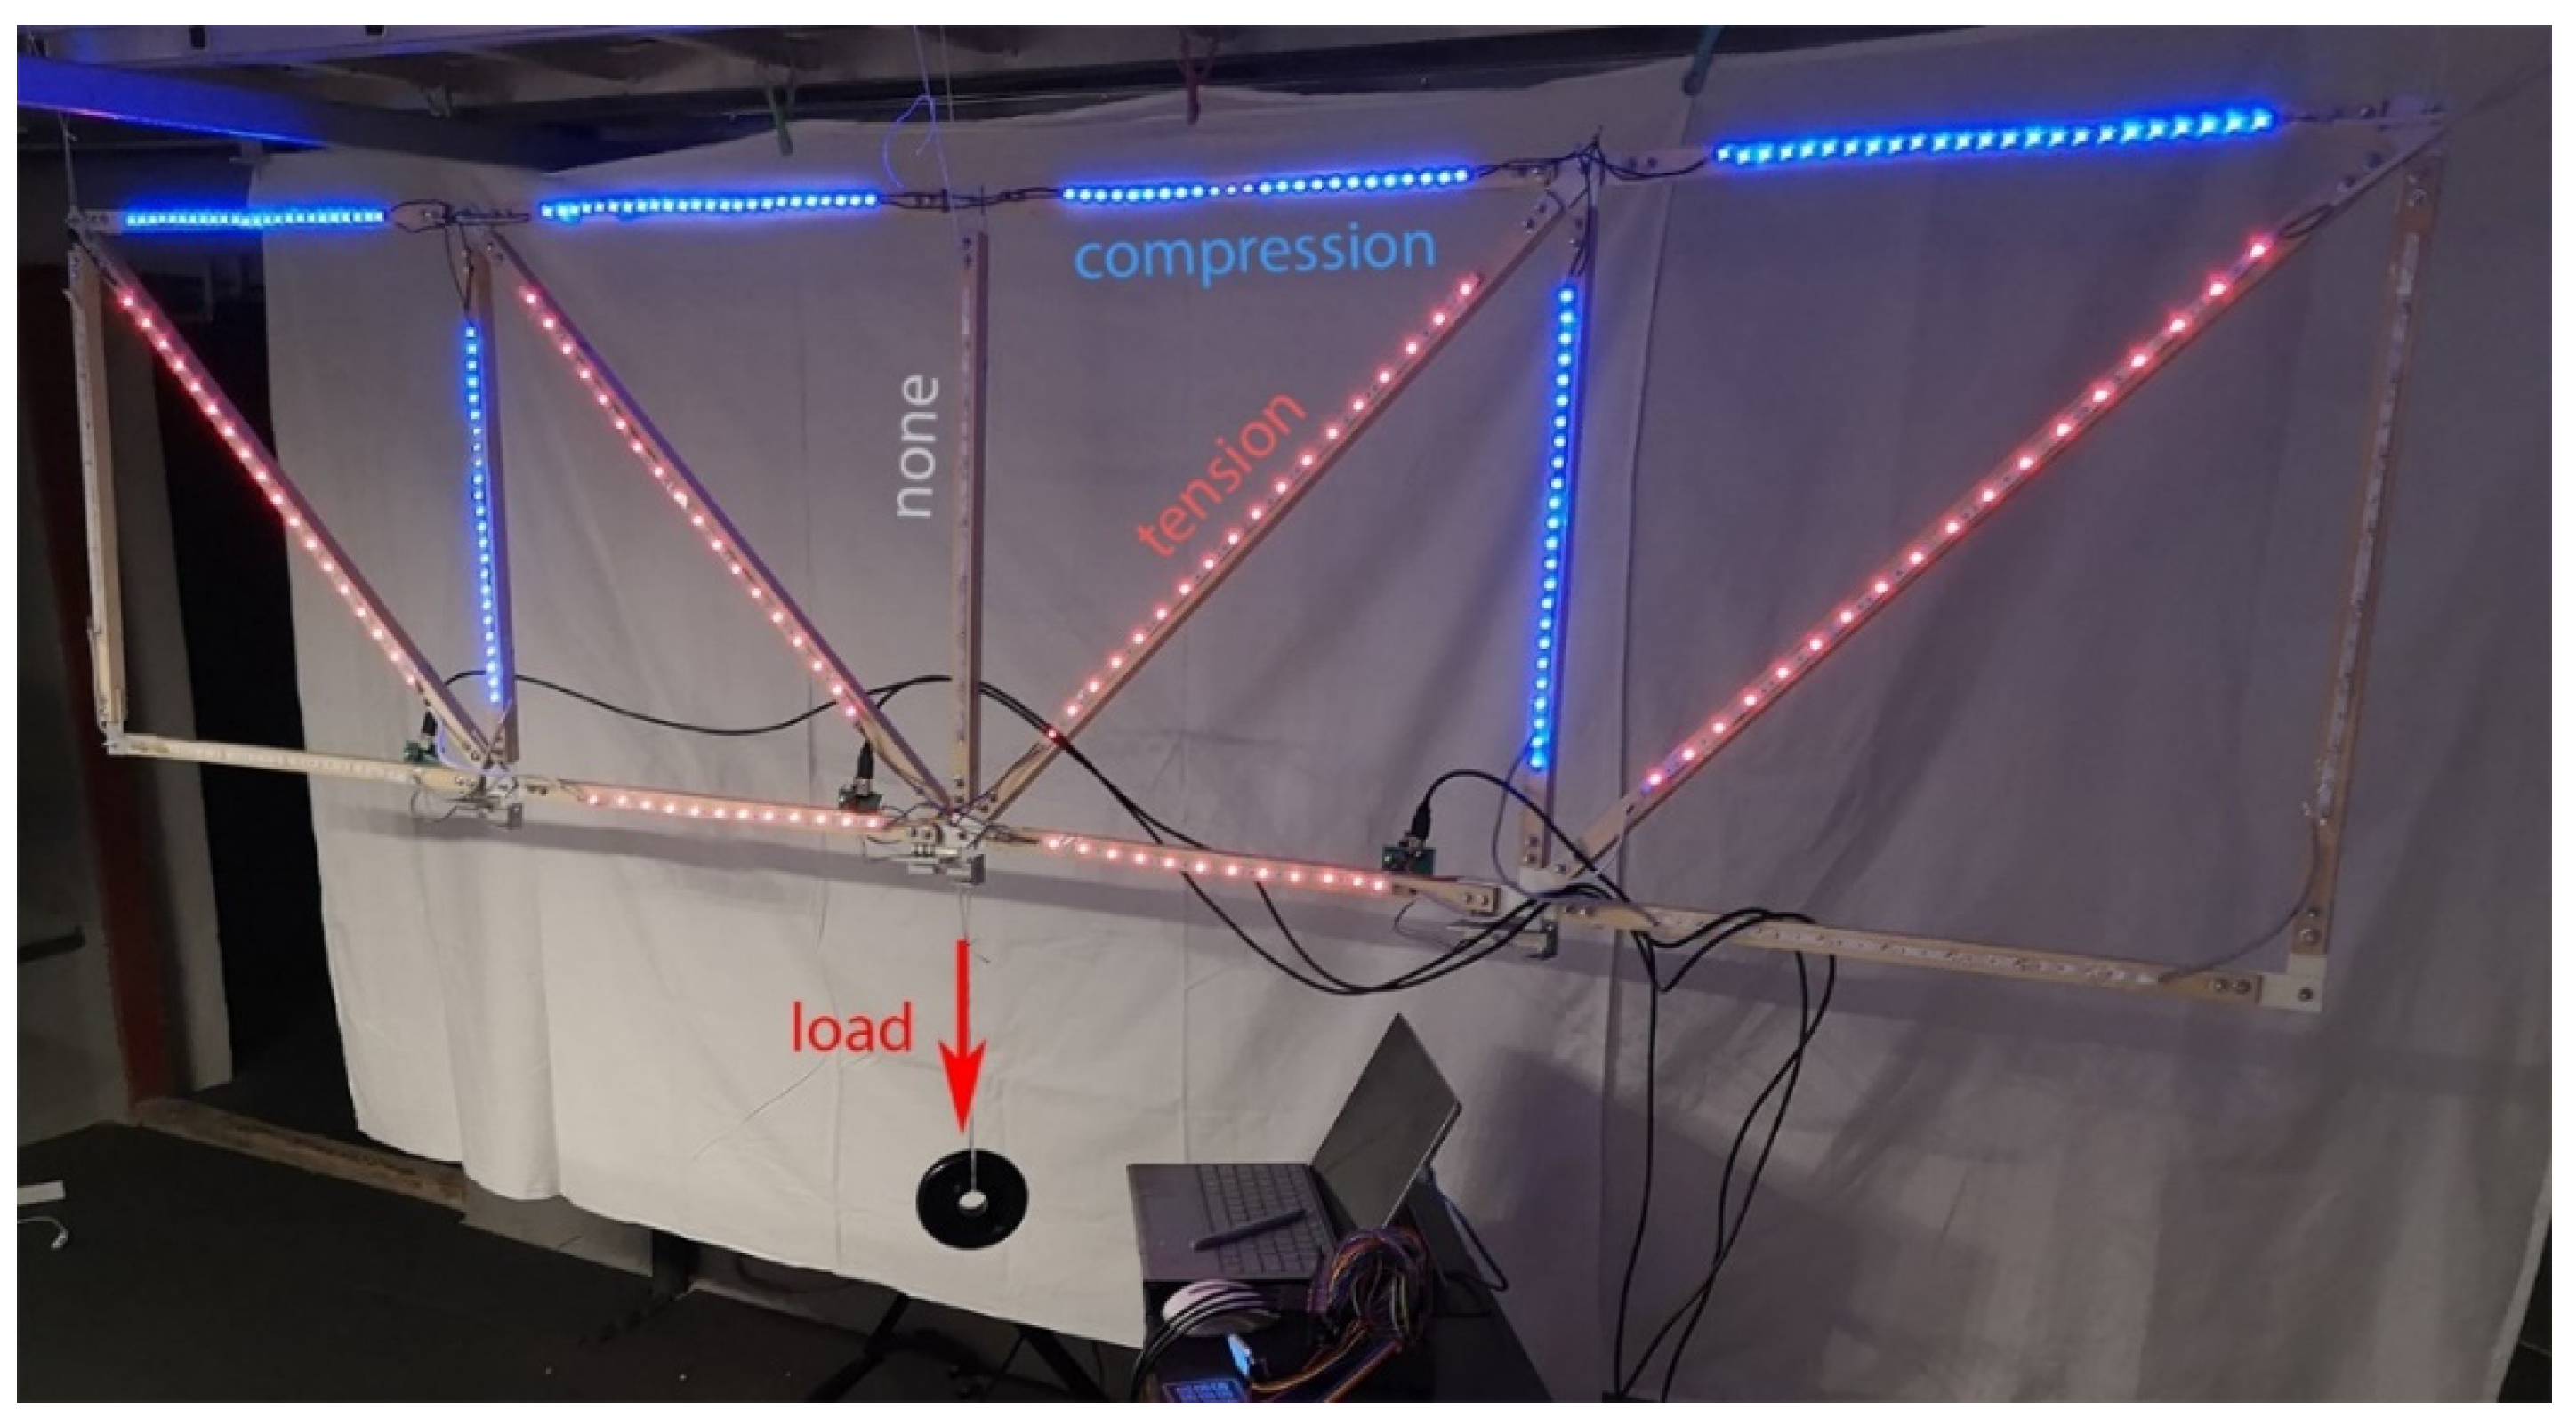
A truss loaded with a symmetrical force of 10 N in the central node is presented in
Figure 6.
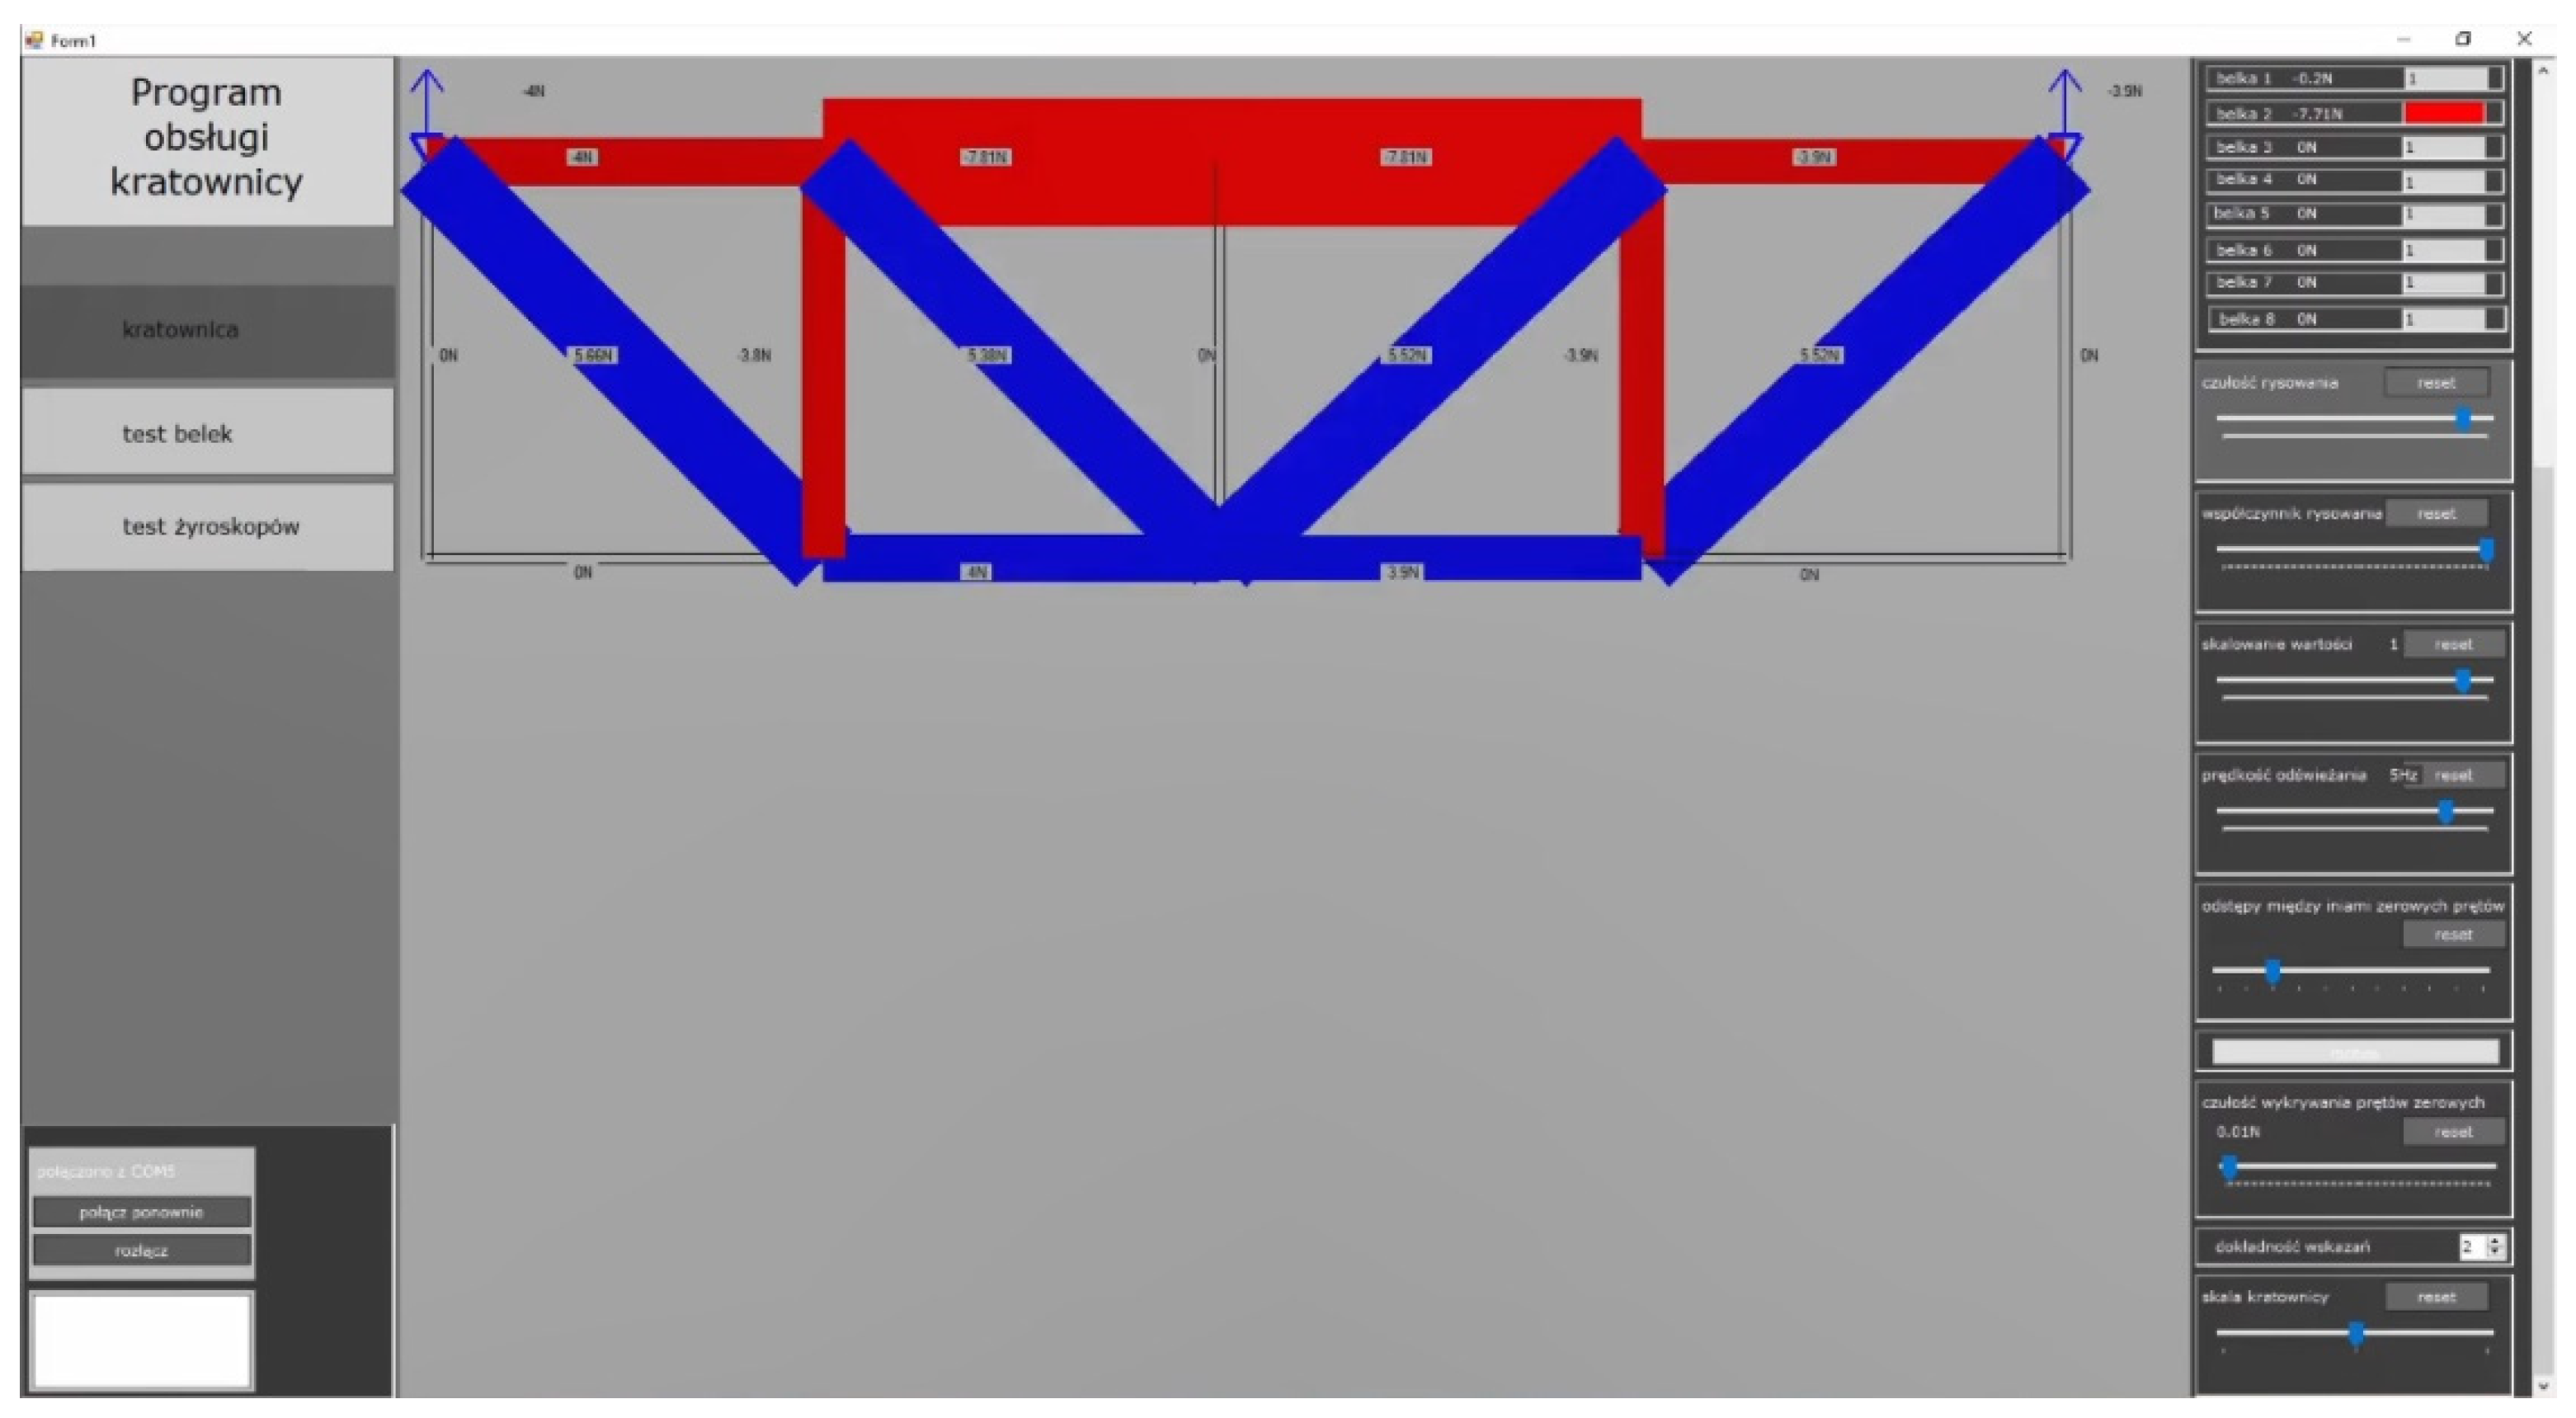
To present the results on the screen of any computer, a program was made in Visual Studio to receive data from the microcontroller and present it in real-time. After its launch, a window is displayed, where the truss is presented with the use of colors together with the collected values of forces in the bars. Each bar has an individual thickness and a suitable color (blue for compression, red for tension, off for 0). Both parameters depend on the force calculated on the bar. Additionally, it is possible to assign a cross-section to each bar and calculate the stress value in a given bar. The program also displays graphs from the tensometric beams test and the gyro test (
Figure 7).
5. Project Evaluation
The truss model enables real contact of students with the structure, material, and loads. By representing the value and type of internal forces by means of luminous LEDs, it is possible to observe the influence of the size and direction of external loads on the distribution of internal forces.
To evaluate the project in terms of its impact on the effectiveness of education, the model was presented to a wider group of architecture students. A survey conducted later with the help of a questionnaire was to answer two basic questions:
The presentation, recorded as a video [
21], was made available to a group of students. In the beginning, general information about trusses is presented, followed by a discussion of the principle of how a truss works using the discussed model. Then, it was presented how the model, subjected to loads changing in real-time, reacted and presented the values and nature of the stresses in the bars by means of LED lighting. Several variants of loading are presented, each time illustrating the work of the truss with changing lighting.
Later in the study, viewers were asked to complete a voluntary survey. 51 people participated in the study. In the survey, the questions were divided into two groups, in line with the expectations described above.
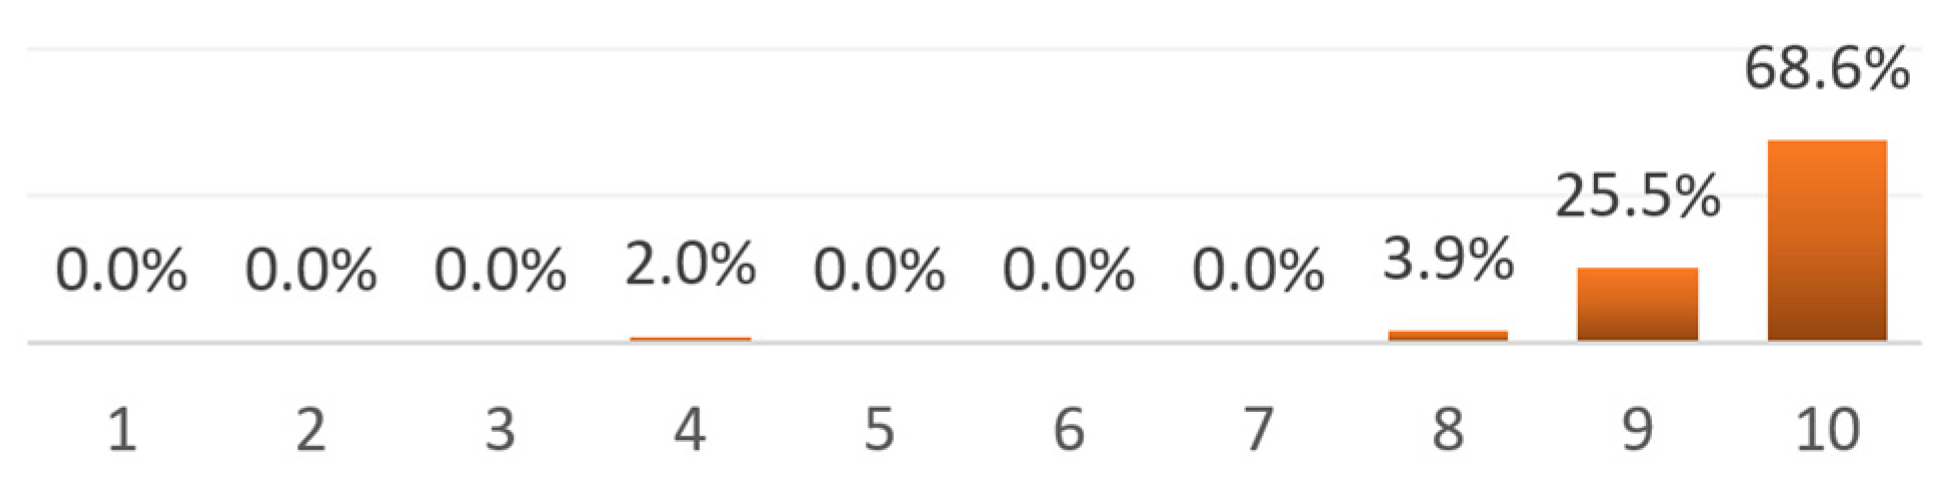
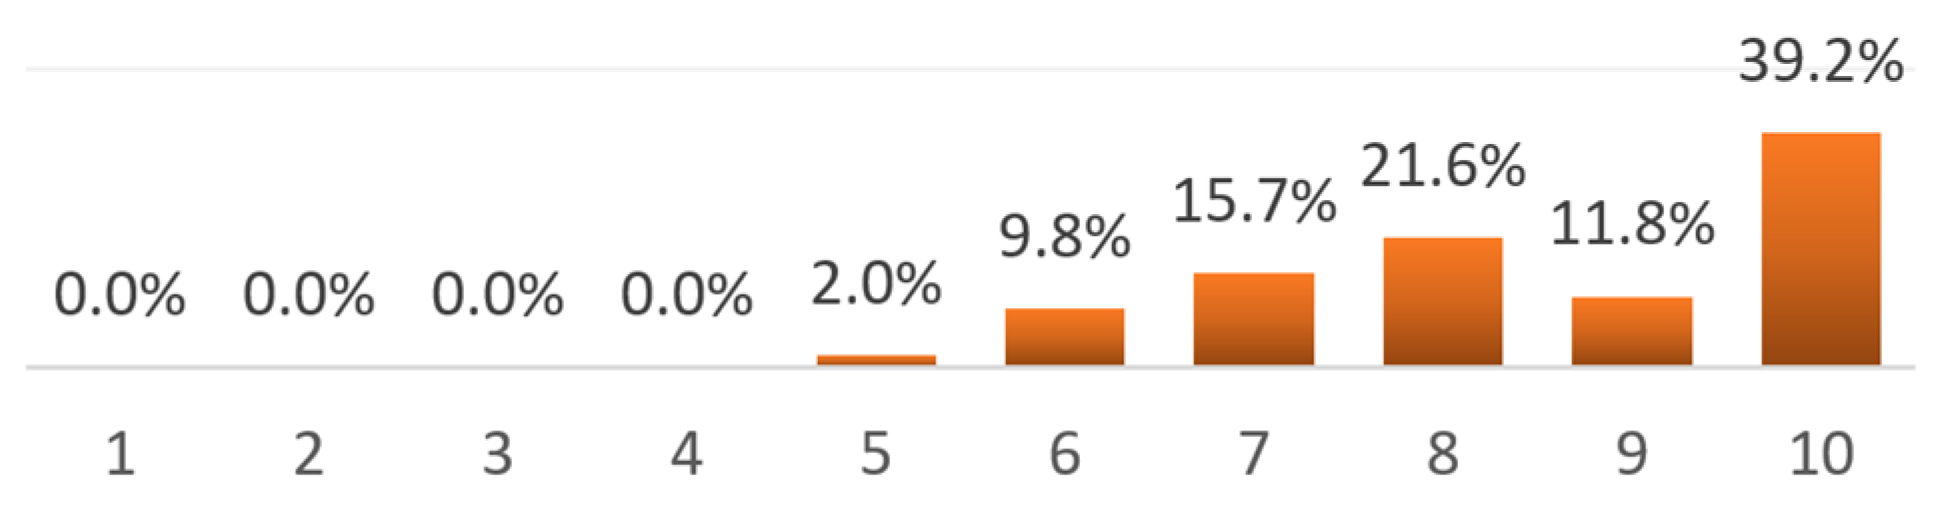
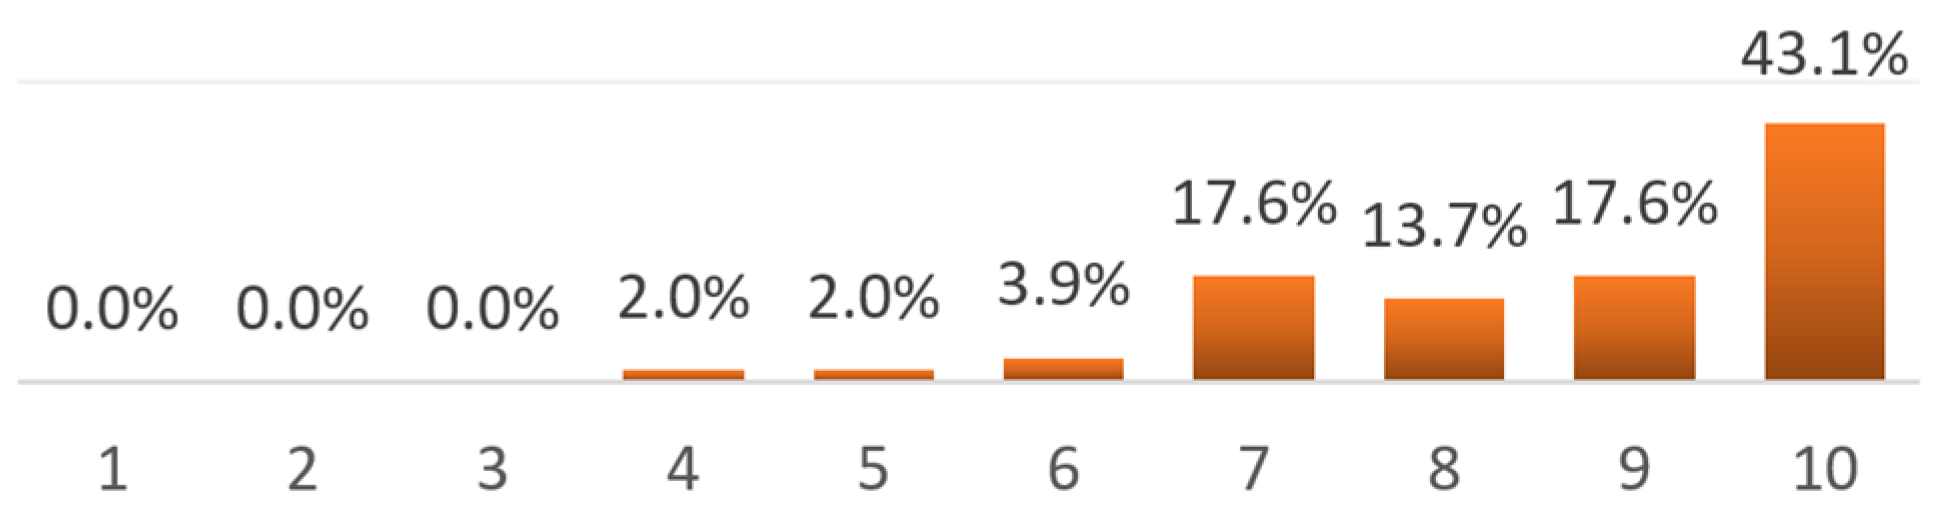
In the first group of questions related to the presentation itself and the effectiveness of explaining how the truss works, the answers were presented in
Figure 8,
Figure 9,
Figure 10 and
Figure 11.
In the second group of questions relating to the possibility of using the physical model to learn statics, the answers are presented in
Figure 12,
Figure 13,
Figure 14 and
Figure 15.
In addition, students making the truss model determined the impact (on a scale of 0–10: 1—minimal, 10—very high) of taking part in the project on their skills in the following areas:
learning programming—9 points
learning the basics of electronics—7 points
improving the ability to analyze structures—5 points
ability to manage a complex project—8 points
Although the project participants rated its impact highly on their skills, it was surprising that the assessment of the impact on their ability to analyze structures was low (5 points). After additional discussion, the explanation was the fact that the participants of the project were outstanding students with extensive knowledge, and the work on a simple in terms of static calculations truss did not bring new knowledge to their analytical skills.
6. Conclusions and Future Works
The physical truss model described above is still being tested and the verification of its educational value has been suspended by online teaching. However, after the survey, it can be concluded that her contribution to an intuitive understanding of the distribution of internal forces in the truss among students of Architecture is significant. The conducted survey showed a significant didactic potential of the experiment. The applied method of visualizing the forces by means of LED lights was clear (
Figure 9), enabling the understanding of the work of individual elements of the truss (
Figure 10). The surveyed students showed great interest in the project (
Figure 8) as well as recommended its use in further teaching (
Figure 15). Some surprise was the results of the survey showing a smaller than expected influence of the model on the understanding of the structure work (
Figure 11 and
Figure 13). We believe that this is due to the video presentation of the model without the possibility of independent experimenting with forces, which is a consequence of distance learning. In the future, after the presentation of the model at stationary courses, it will be possible to verify this statement.
This experiment can also be useful in teaching structural engineering students because it can shape their awareness of the relationship between subjective beautiful shape (enhanced with colors representing internal forces, which can be especially evident in the case of large structures with a large number of bars) and the optimal form of structure.
The project will be further developed and then it is planned to design a bar with internal force sensors measuring in real-time, which would enable the implementation of trusses of any geometry without the need to program it in a microcontroller. The realization of spatial bar structures with complex geometry showing the distortion of internal forces would be an attractive teaching tool and it can even be made in the form of an interactive façade on any bar structure, e.g., a dome, or as a cover for a bridge structure. Such a facade can strengthen the aesthetic message of the building and at the same time cause the interest of recipients in engineering problems.


