1. Introduction
Climate change has severe and increasing effects on the environment. Anthropogenic greenhouse gas emissions are, inter alia, driving sea level rise, rising global temperatures, and recurring heatwaves of high intensity [
1]. There is a need to address the root causes of climate change to mitigate its negative outcomes. The operation of buildings alone is responsible for ~35% of global energy use [
2] and associated greenhouse gas emissions. Moreover, the global use of electricity in buildings has grown on average by 2.5% per year since 2010 [
3]. These facts make it essential to improve the energy efficiency of buildings. To date, the overwhelming majority of scientific evidence has been focused on buildings in developed economies, such as the European Union, North America and Australia and New Zealand. Comparatively few studies have focused on hot and arid climates in the Arabian Peninsula.
Bahrain is an island situated in the Arabian Peninsula and is known for its extremely hot climatic conditions. Temperatures often reach 50 °C during the summer months (June to August). According to the Köppen climate classification, its climate is classified as “BWh”—Arid, Desert and Hot [
4]. Being an island with high heat intensity, the seas heat up quickly during summer, resulting in high evaporation and humidity levels. This intense weather has driven the widespread installation of air-conditioning equipment, which requires a significant amount of electricity.
In Bahrain, 65% of the electricity demand during summer is driven by air conditioning [
5]. According to electricity supply and demand data in the peak summer month of July, the percentage difference between the electricity generation and the peak load is only around 7.8% [
6]. This demonstrates the burden that cooling loads impose on power grids. This is partly due to the poor operational energy efficiency of the Bahraini building stock. Most residential buildings in Bahrain are built using reinforced concrete structures, with their external walls constructed using hollow concrete blocks. Many of these houses do not integrate any form of insulation in the exterior walls, as it was not considered a necessity according to the local building regulations until 1999 [
5]. The ministerial order that was issued in 1999 stated that the R-value for external walls must comply with a minimum of 1.33 (m
2·K)/W (U
max = 0.75 W/(m
2·K)) [
5]. This value is much lower than the minimum requirements in other countries like Australia (R
min = 2.8 (m
2·K)/W; U
max = 0.357 W/(m
2·K) [
7] or the UK (R
min = 5.55 (m
2·K)/W; U
max = 0.18 W/(m
2·K) [
8]. In parallel, between 2016 and 2019, the price of electricity in Bahrain gradually increased on an annual basis for expatriates (constituting about 53.3% of the total population as per a 2017 report issued by the Central Bank of Bahrain [
9]) and locals owning more than one house. The annual increase rate is very high, i.e., around 500%. This measure was implemented as part of a government policy to offset a drop in oil revenue [
5]. The combination of a low-energy-efficiency building stock, a hot arid climate resulting in significant cooling loads and energy demand, and higher electricity prices results in a situation where occupants are charged significantly more to maintain a comfortable environment indoors.
Studies have shown that Structural Insulated Panels (SIPs) can be successfully used for external walls to improve the energy efficiency of dwellings in a cost-effective manner. These studies were typically performed by comparing them with stud-frame houses, and the overall efficiency was mainly attributed to a reduction in operational energy and construction time, minimised waste, and airtightness [
10,
11]. We wanted to evaluate the feasibility of using SIPs in a Bahraini context, to improve energy efficiency and reduce the cooling energy demand and load.
1.1. Aim and Scope
The aim of this paper is to quantify the life cycle cost (LCC) and operational energy savings associated with using SIPs for external walls and roof, as an alternative to hollow concrete blocks, in residential houses in Bahrain. This study considers three main aspects—operational energy, operational cost and construction cost.
This paper provides insights into the potential cost and energy use benefits associated with using SIPs, to the housing sector in Bahrain and neighbouring countries with similar geographical, climatic and economic conditions.
1.2. Structure
This paper is structured into five sections.
Section 2 reviews the existing literature that is relevant to the life cycle assessment of Structural Insulated Panels.
Section 3 describes the case study, the simulation software used, the methods of data collection, and how the data is analysed.
Section 4 presents the results of the energy simulations and cost analysis of the case study building. A sensitivity analysis is conducted to mitigate errors and uncertainty.
Section 5 discusses the findings of the paper, and
Section 6 includes the conclusions and recommendations.
2. Literature Review
Prefabrication has been used for decades to improve safety on construction sites, reduce construction times, reduce overall costs and improve environmental performance through reduced wastage and improved construction quality [
12]. Within the range of prefabricated solutions, panelised prefabrication consists of two-dimensional panels, which are typically lightweight and easy to connect on-site. Panelised prefabrication can be used for vertical elements, such as outer and inner walls, as well as slabs and roofs.
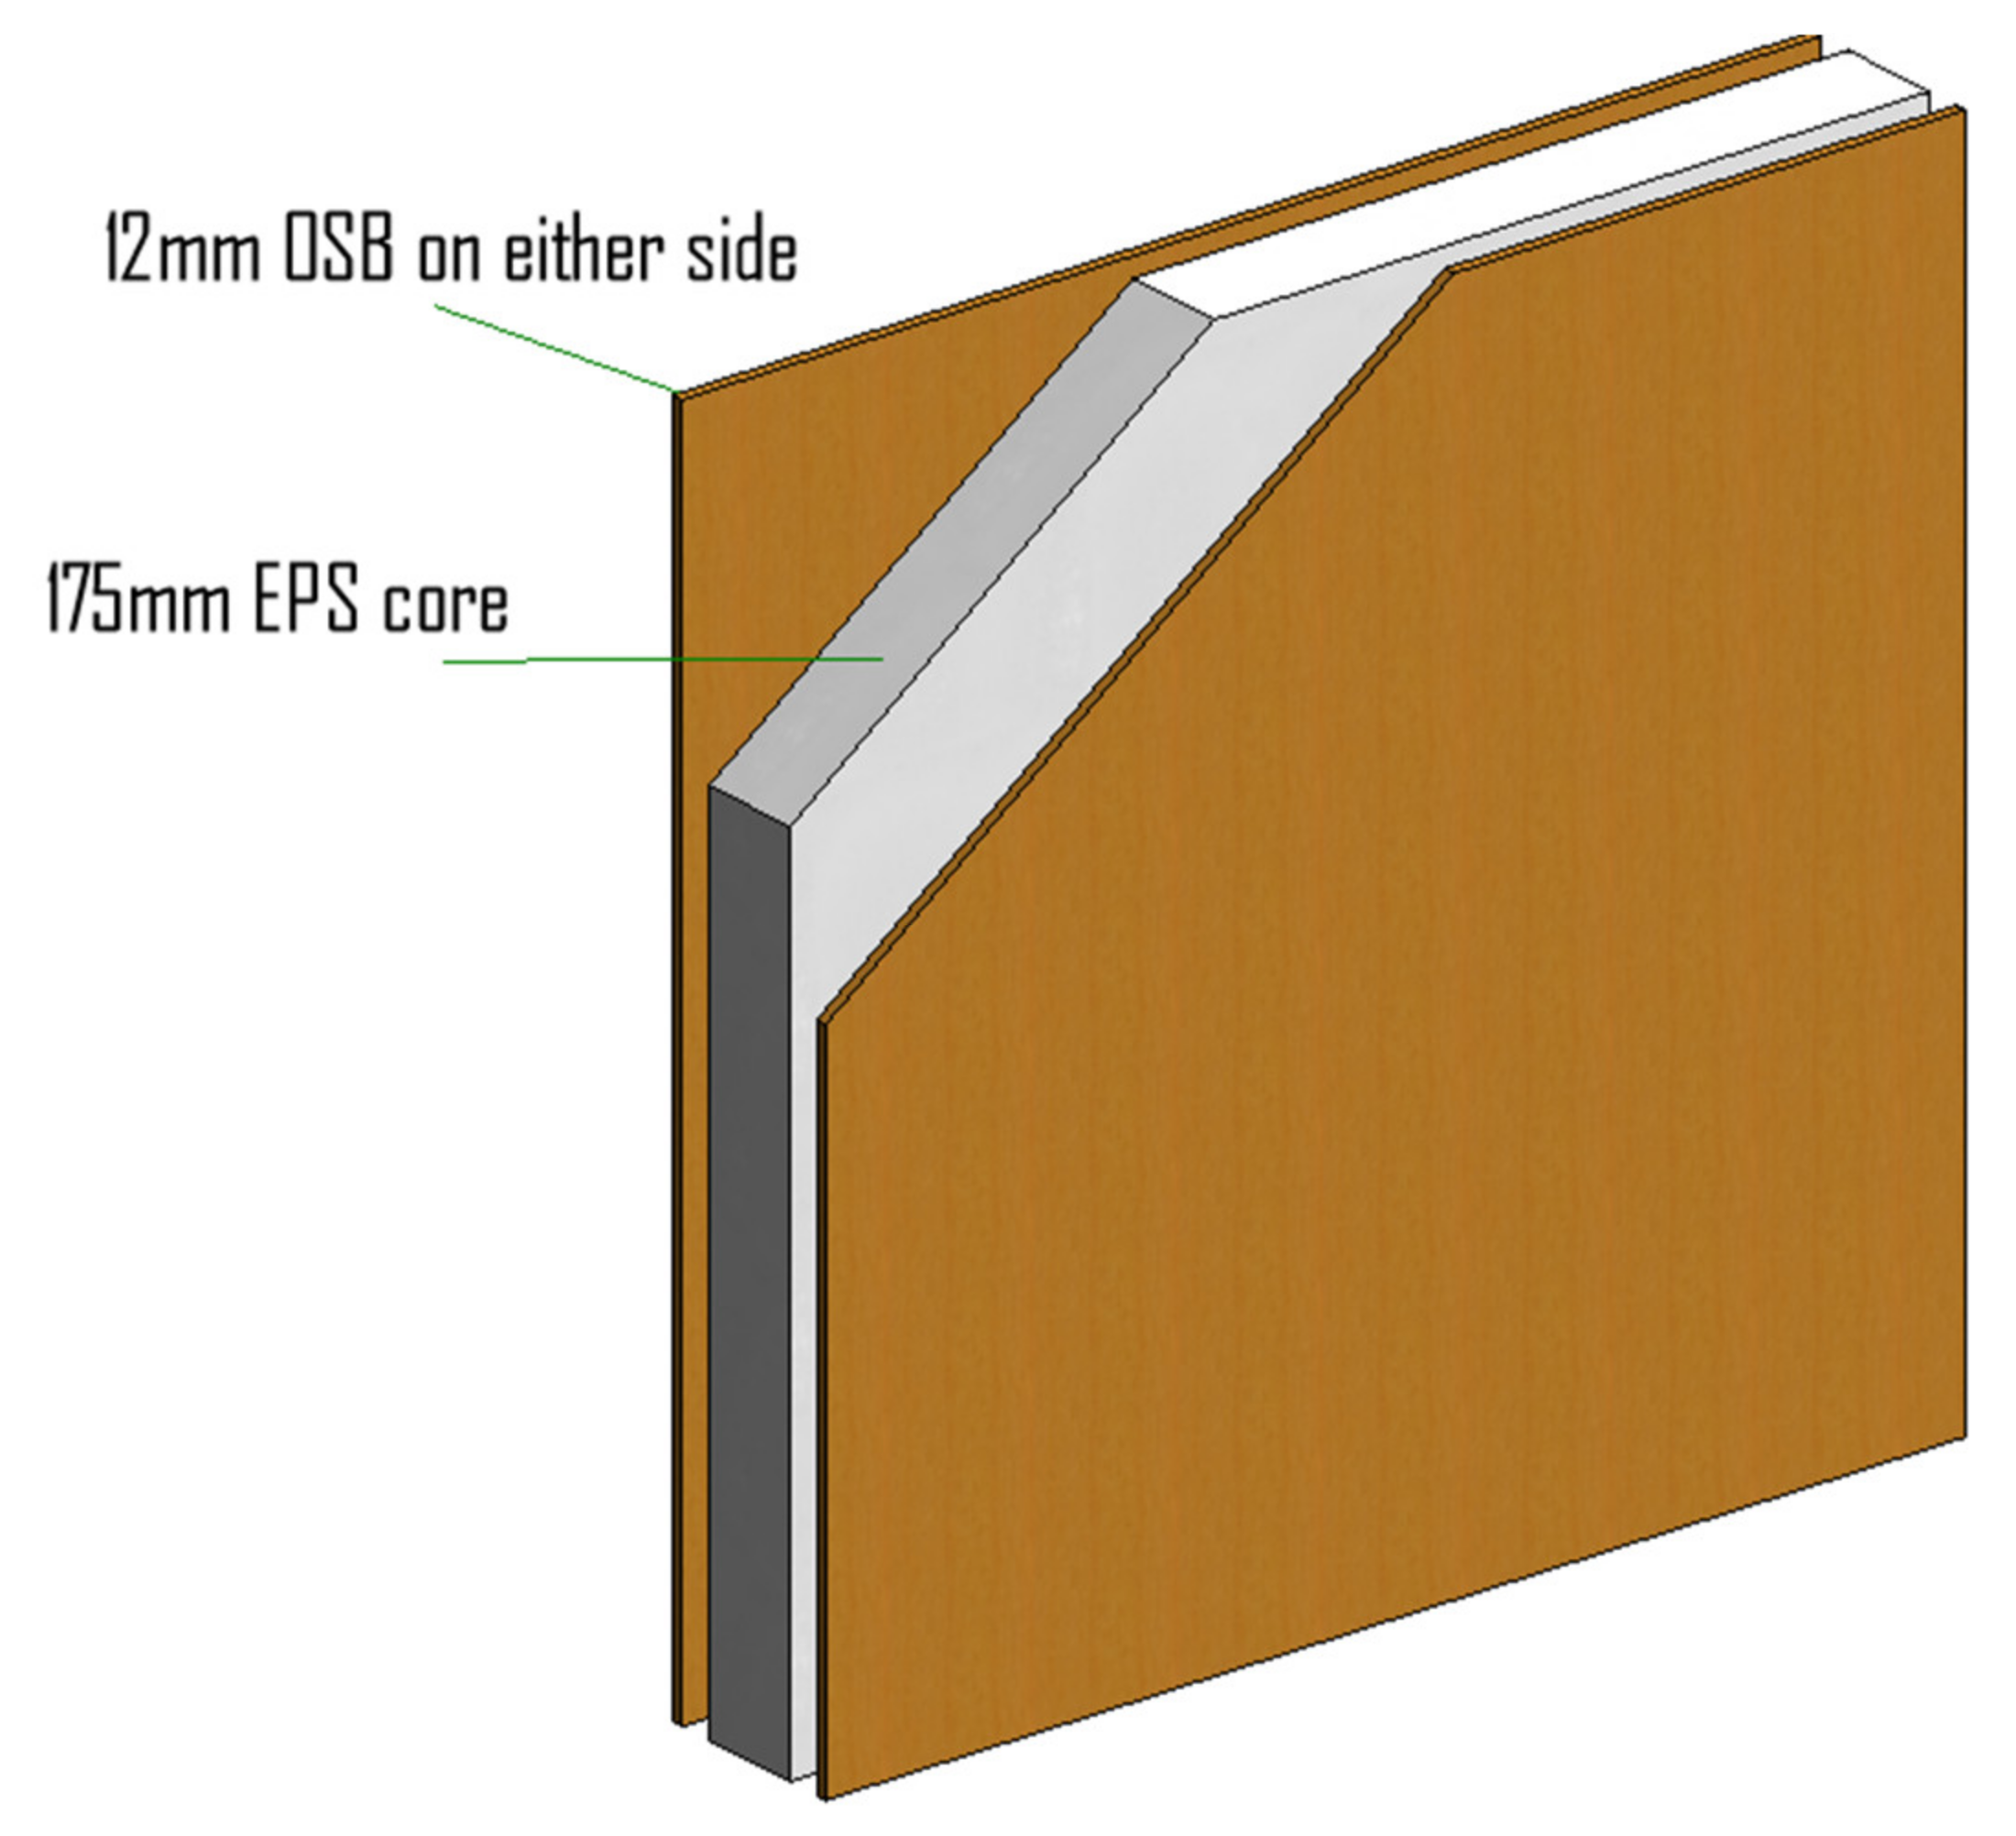
Structural Insulated Panels can be used as an alternative to a reinforced concrete superstructure (which is typical in Bahrain), to help reduce environmental effects. According to Mullens and Arif (2006), SIPs are lightweight panels consisting of an insulating core (foam) sandwiched between two outer skins of engineered timber, typically oriented strand board (OSB) (see
Figure 1). OSB is formed by layering strands of wood in specific orientations and gluing and compressing them. The inner core is usually made of extruded polystyrene, expanded polystyrene or urethane foam. These panels are manufactured off-site in standardised sizes and are used mainly for external walls and roofs [
13].
While there are no studies comparing SIPs and hollow concrete blocks for external walls, many compare SIPs to traditional stud-framed houses. Results show that SIPs have superior R-values as compared to stud-framed walls, thereby providing better insulation, which is beneficial in extremely hot climates [
14]. The R-value of SIPs ranges between 2.7 (m
2·K)/W (U = 0.37 W/(m
2·K)) and 6 (m
2·K)/W (U = 0.167 W/(m
2·K)), depending on the panel thickness [
15]. Since SIPs are manufactured off-site in controlled environments, they benefit from improved material quality, reduced on-site construction times, ease of construction and increased site safety [
10]. SIP-built houses are typically more airtight compared to conventional stud-framed houses. This allows the occupants to have a better control over the indoor environment by minimising air infiltration. In the USA, SIP-built houses save 12–14% in energy use, compared to stud-framed houses [
13].
However, the construction cost associated with SIPs can be high, depending on the availability of supply, shipping, and customs duties. In addition, the operational energy savings of SIPs result in varying operational cost savings, depending on the cost of energy. As such, a life cycle perspective is needed to quantify the performance of SIPs and their net benefits.
Few existing studies have conducted life cycle assessments (either environmental and financial) on SIP-built houses.
Table 1 lists the relevant studies that have been conducted using an LCA and/or LCC approach for residential houses.
Table 1 demonstrates that very few studies have conducted a life cycle assessment or life cycle cost analysis of SIPs, globally. Most existing studies focus on environmental performance [
16,
17] or on indicators associated with construction management (e.g., construction time) [
10]. Numerous studies, such as [
18] compare different wall compositions and their life cycle cost or environmental implications, but none have focused specifically on SIPs. Importantly, could not find studies on SIPS in hot and arid climates.
Hundreds of millions of people live in hot and arid climates, globally [
19]. Notably, in the Arabian Peninsula, booming populations have resulted in significant construction activity in the last decades (for example in Dubai, United Arab Emirates [
20]). Residential construction practices are typically characterised by reinforced concrete structures with hollow block concrete walls. These walls have poor thermal energy efficiency and often result in significant embodied environmental flows [
21]. Substituting these inefficient construction assemblies in hot and arid climates with prefabricated SIPs could improve energy efficiency, reduce construction time, and improve health and safety on-site. There is a need to conduct an LCC and operational energy analysis of SIPs as compared to traditional hollow concrete blocks a hot and arid climate, such as that of Bahrain.
3. Materials and Methods
This section presents the general research design and the case study. The methods used for the quantification of operational energy, operational costs, construction costs and LCC for the SIPs type and the concrete types are also described.
As recommended by Yin [
22], a case study approach was implemented in this study due to its exploratory nature and lack of existing data regarding the use of SIPs in the Bahraini context. This case study is described in detail in
Section 3.2.
3.1. Overall Research Design
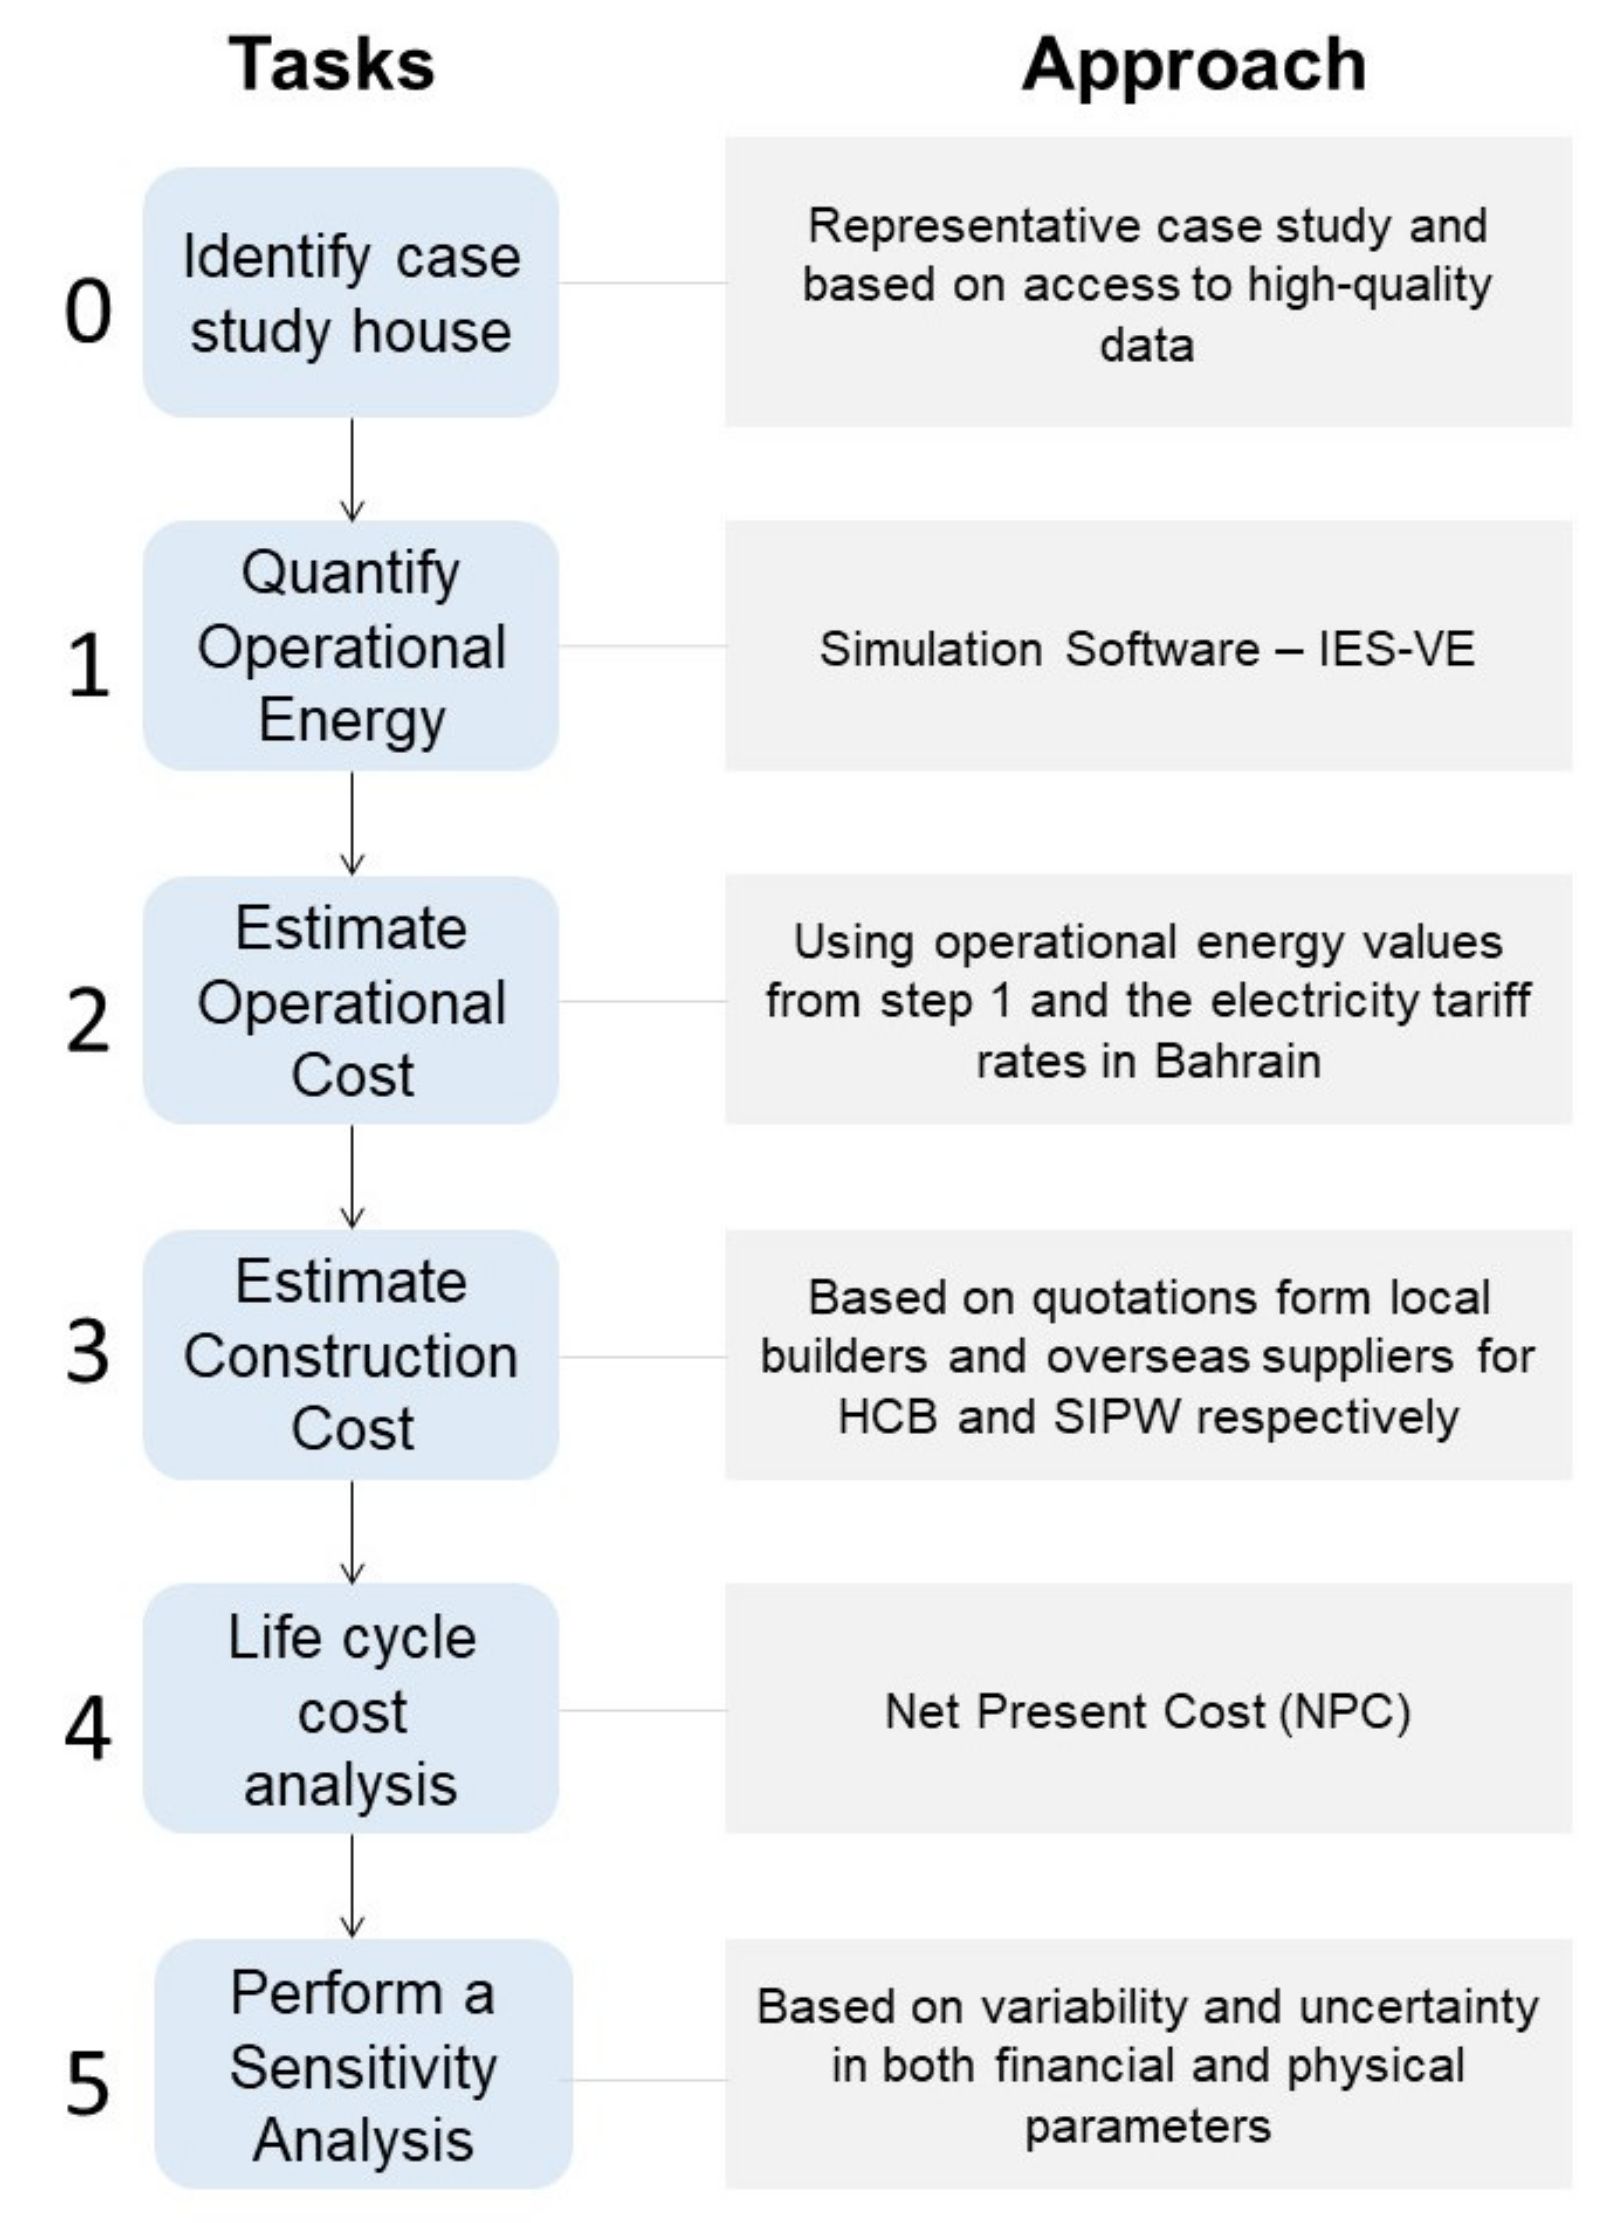
Figure 2 depicts the research design implemented in this study. The research relies on a case study approach, using a typical single-floor residential house in Bahrain (refer to
Section 3.3 for the case study house details). The research considers three types of external materials for the case study house, thereby forming the three house types—the first type uses hollow concrete blocks for the external walls and is referred to as “HCB” (and is considered to be the baseline case scenario), the second type uses insulated concrete blocks for the external walls and is referred to as “HCBI”, and the third is where SIPs are used instead of concrete blocks for the external walls and is referred to as “SIPWR”. The software tool that is used for running the simulations is Integrated Environmental Solutions—Virtual Environment (IES-VE). Details on the software are provided in
Section 3.4.
It is important to note that thermal requirements were recently changed for external walls and roofs for residential houses in Bahrain [
5]. This change came into effect on the 1st of March 2019, and hence, two variations of concrete blockwork (with the minimum thermal requirements) were considered in the simulations to assess the changes pre (HCB) and post (HCBI) 2019. Details on the new thermal requirements are shown in
Table 2.
Figure 2 depicts the main tasks involved in undertaking this research by highlighting the approach used for the individual tasks. More details on the respective steps are described in the relevant sections below.
3.2. Case Study House
As mentioned earlier, this paper considers a case study approach for running the simulations across the three house types. A case study approach was used for two reasons. Firstly, the study relied on a single representative case due to its exploratory nature and the lack of data in Bahrain [
23]. Secondly, having a case study modelled using a simulation tool is beneficial for this type of approach. It allows us to modify individual variables to assess their effects on the overall results, as well as to combine two or more changes to produce a more comprehensive understanding of the effects of combined variable changes.
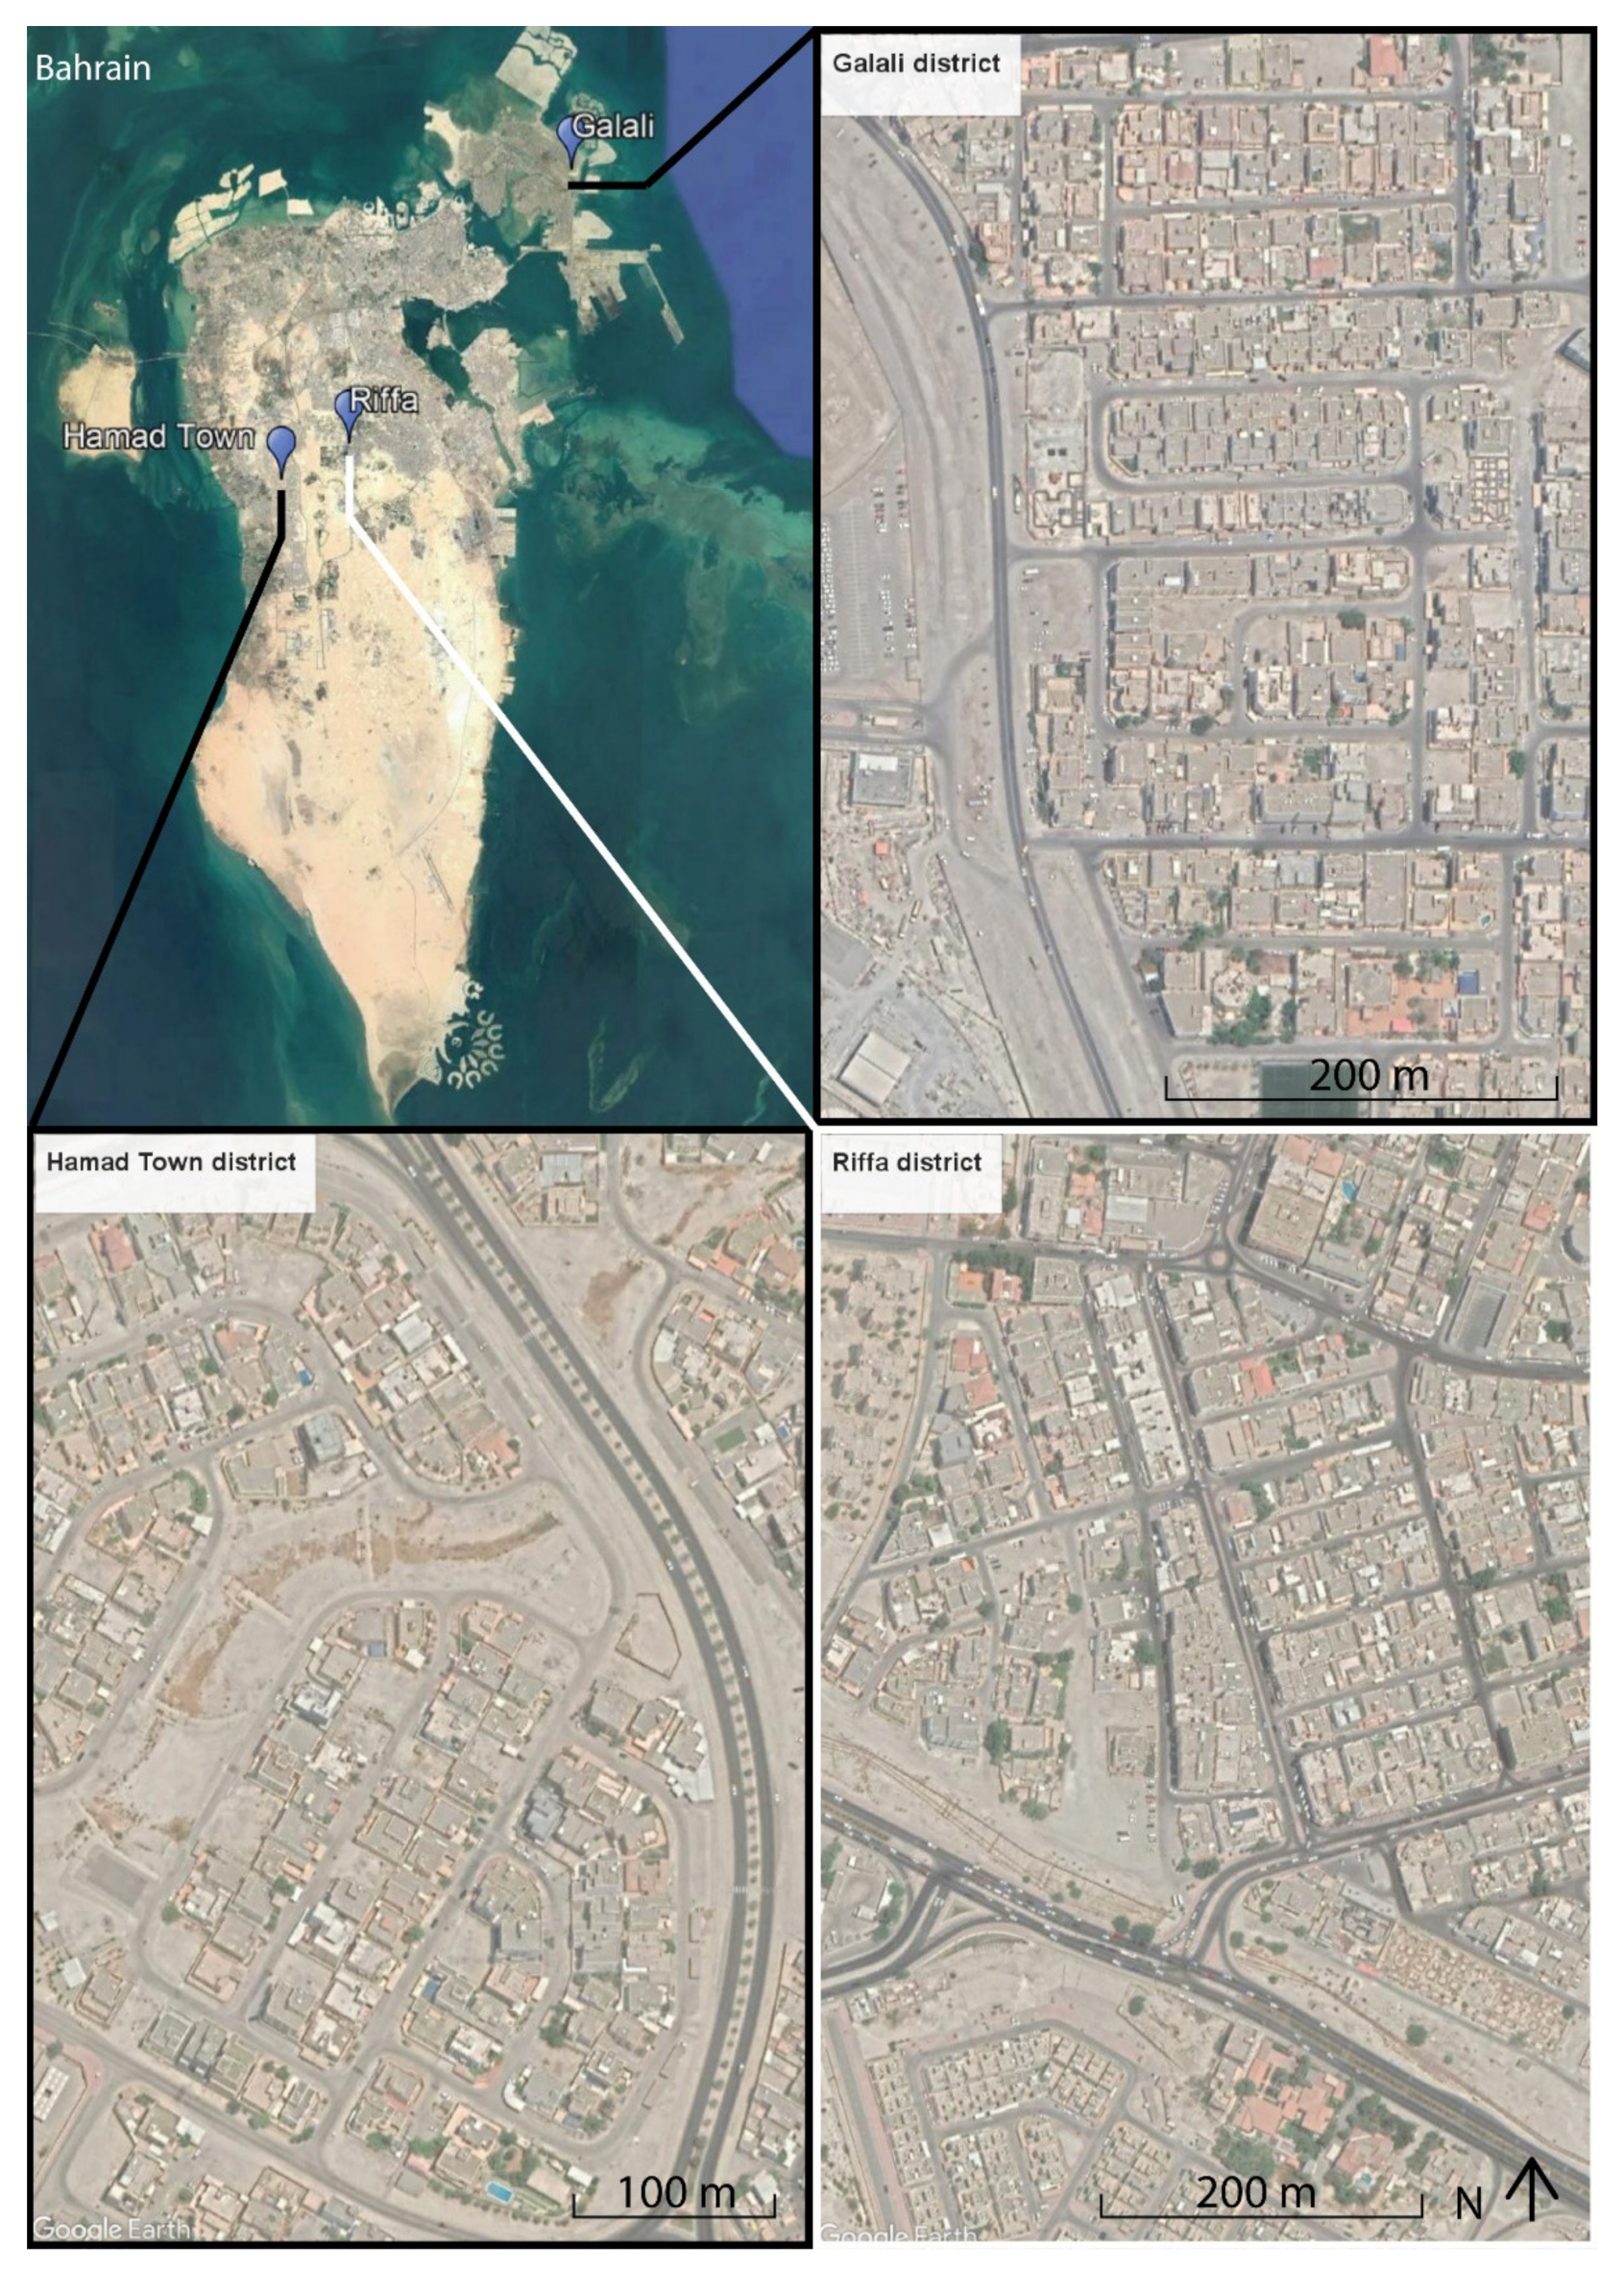
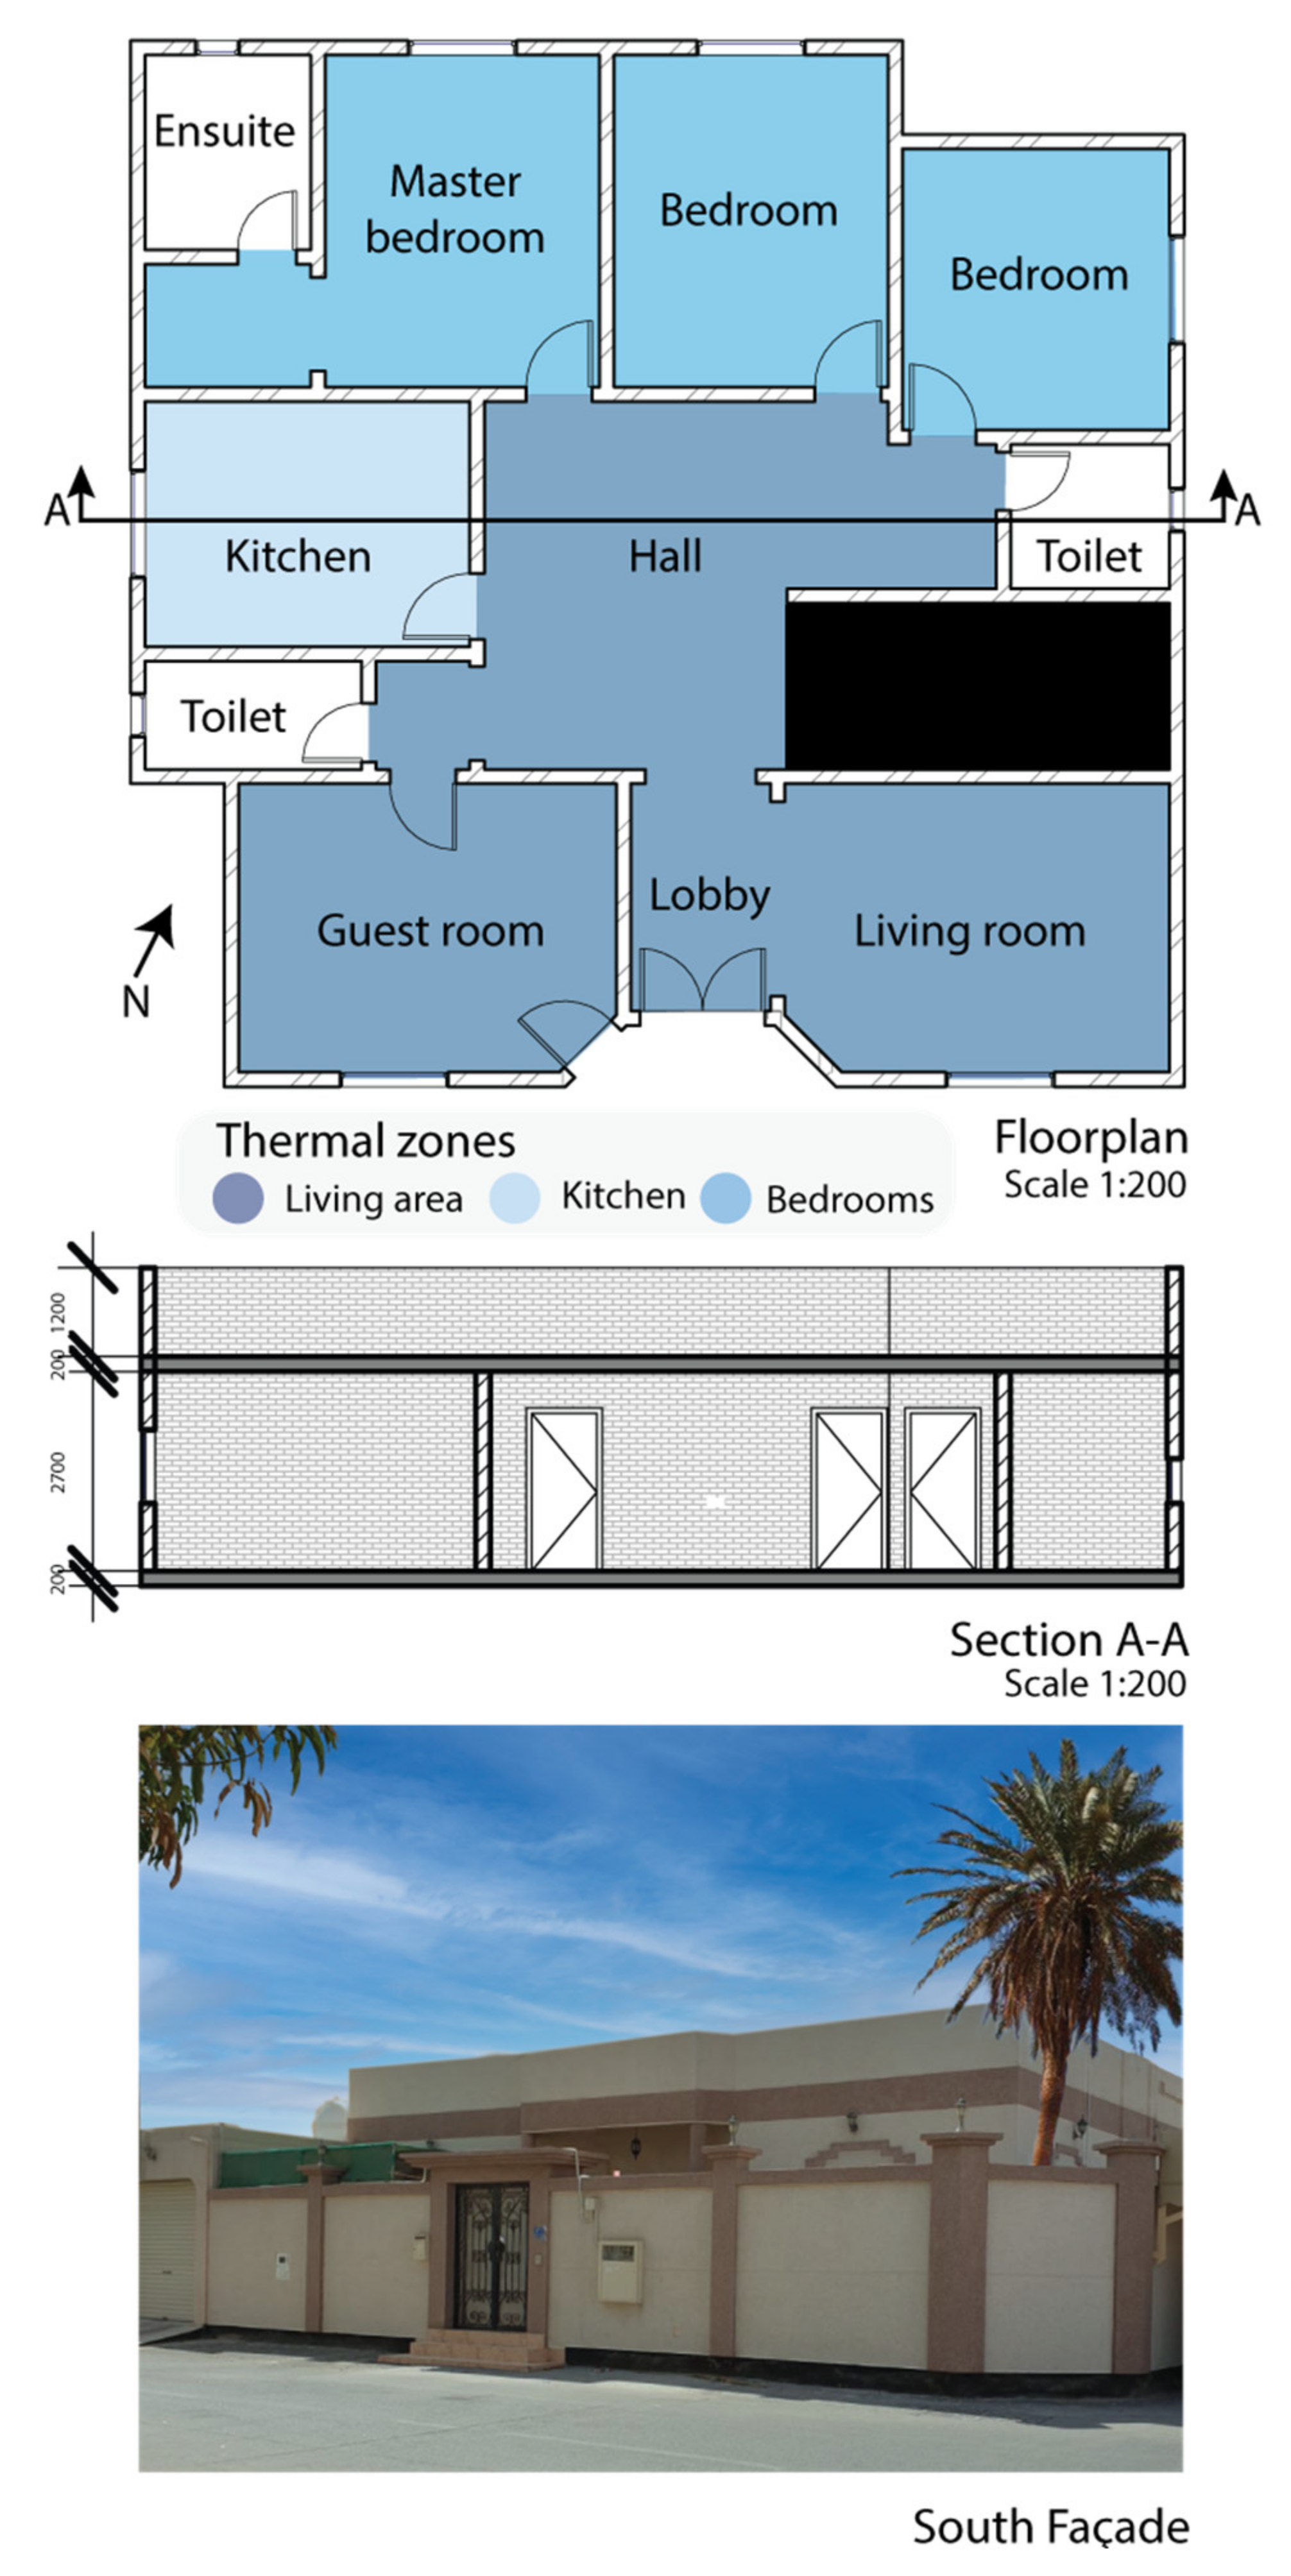
The case study is a single-story house representative of a typical residential house in Bahrain (see
Figure 3). It was built in 2002 and is located in East Riffa in the Southern Governate of Bahrain. The house consists of three bedrooms, three bathrooms, a family hall, a guest room, a hall and a kitchen, totalling 180 m
2 of gross floor area. This area is not inclusive of the front porch and the garage which is located next to the guest room. The staircase was built as a provision for a potential future expansion of the house through a second storey. A single-storey house was selected for the purpose of this study as it is the most representative housing type in Bahrain. Limitations associated with this selection are discussed in
Section 5.3. Future research on the topic will address double-storey houses, as discussed in
Section 5.4. The floor plan, thermal zoning, a section and a photo of the case study house are presented in
Figure 4.
Table 3 summarises the characteristics of the case study house.
As mentioned in
Table 3, the period of analysis was set at 50 years for two reasons. First, this aligned our study with similar LLC studies of buildings and building components that adopt a period of analysis between 40 and 75 years (e.g., [
24,
25,
26,
27]). Secondly, a timeframe of 50 years allows the reader to evaluate the results and potential benefits at any given point beforehand using the results outlined in
Section 4. This helps understand the effects of using SIPs as compared to HCB at various points in time to better assess the feasibility of implementing such a construction methodology in the Bahraini context.
3.3. Quantifying Operational Energy
The building simulation software used in this study is Integrated Environmental Solutions—Virtual Environment (IES-VE). The software is accredited according is certified with
BEST TEST [
28]. In this study, IES-VE was used to estimate the annual operational energy for the case study house types involving three materials for external walls and the roof. To conduct this analysis, the house was modelled in IES-VE, considering parameters like its 3D design, the geographical location, weather file, orientation, number of occupants, building materials, heating, ventilation and air conditioning (HVAC) systems, internal gains, air infiltration and others. The cooling load was calculated based on the occupancy schedule of the house, internal gains, solar gains and ventilation and infiltration/exfiltration rates.
The simulations were conducted using an hourly timestep and only cooling systems were considered with a setpoint of 23 °C. Thermal profiles were scheduled based on a weekday/weekend basis, and external variables like air infiltration were accounted for in all the types in a realistic manner (see data in the Data Availability Section).
After modelling the case study house in IES and assigning values to all the variables, simulations were run to determine the annual operational energy use for all three house types. Details on the thermal profiles and the values assigned to the various parameters in IES-VE are provided in the open-access supporting data (see link in the Data Availability statement at the end).
3.4. Quantifying Operational Cost
Once operational energy is quantified, operational costs are obtained by multiplying electricity use by the official electricity tariff rates shown in
Table 4 and
Table 5 for different user categories. The operational costs and the life cycle costs were estimated on the basis of the second user category, for 2019 (Bahrainis with more than one account and non-Bahrainis). Since the operational energy results are only for the first year; and the analysis period is 50 years, external variables like inflation rates and discount rates were considered to estimate the operational costs for subsequent years and is explained in
Section 3.6.
3.5. Quantifying Construction Cost
Construction costs are estimated for the three types of materials used for the external walls. For the HCB and HCBI house types, quotations from local construction companies and suppliers were requested and the average and median prices were calculated, in addition to the standard deviation. This was done as there is no established cost database of materials in Bahrain, like in other countries, e.g., Rawlinsons in Australia.
Regarding the SIPWR type, since there are no SIP suppliers/manufacturers in Bahrain, it was more challenging to estimate construction cost. Multiple online quotations were requested from suppliers based in China, and eight were considered for estimating the material cost. This was done to provide a realistic and pragmatic pricing. After receiving the quotations, outliers were disregarded, and the average construction cost of the remaining quotations was calculated. In addition to the material cost, quotations for shipping costs were also requested and included in the construction cost. In this research, the shipping cost is modelled in two ways. Firstly, we calculate the pro rata shipping cost to the case study house (SHPRO scenario). Secondly, we include the shipping cost in the construction cost per m2, which is typical for a scenario with an established SIPs supplier in Bahrain (SHLCL scenario). The two scenarios provide a more realistic estimation.
Since Value Added Tax (VAT) was introduced for the first time in Bahrain in 2019, all construction materials incurred a tax equivalent to 5% of the material cost. This was added to all three types when estimating the capital expenditure.
Despite the effort to establish a reliable cost for SIPs, the construction costs of the HCB and HCBI types have a much higher degree of certainty than the SIPWR type. The sensitivity analysis aims at reducing this uncertainty as shown in
Section 4.3. The thickness of SIPs was assumed to be 200 mm, the same as that of the hollow concrete blocks used for the external walls. This avoids modifying the useful floor area, and thus the financial value of the building, and has minimal effects on construction practices.
3.6. Life Cycle Cost Analysis
Life cycle costing consists of quantifying the costs associated with a building throughout its various life cycle stages. It can also serve as a comparative tool/method between different buildings models [
29]. To determine the life cycle cost, a streamlined Net Present Cost (NPC) model is used. It incorporates the capital expenditure as well as ongoing operational costs (and potential savings) associated with energy use. It is important to flag that we do not include the cost of risk nor the cost of environmental damage in our model, as these fall outside the scope of this research. The NPC is calculated using Equation (1), given below, which is computed over a period of 50 years, as done previously in multiple studies, e.g., [
27,
30]. A lower NPC for SIPWR implies that using SIPWR is more beneficial and economically rewarding than the HCB types over the life cycle of the house.
where
NPCt = the net present cost of a type
t over a period of 50 years in USD;
y = a specific year;
CAPEXy,t = the capital expenditure in year
y for type
t (i.e., HCB, HCBI or SIPWR), in USD;
ECy,t = the energy cost in year
y, for type
t (i.e., HCB, HCBI or SIPWR);
CPI = the considered inflation rate in Bahrain (1.69%), computed as the average of the inflation rates for the last 20 years, based on data from IMF (2018); and
r = the discount rate estimated as 3% based on data obtained from multiple sources [
31,
32,
33].
For this study, we assume that the materials used in all cases will not be replaced (module B4 in EN15978 [
34]) over the lifetime of the house (50 years). This is done to ensure no variation in operational cost, other than that caused by the thermal properties of materials.
4. Results
Section 4.1 contrasts the life cycle operational use of the HCB, HCBI and SIPWR house types. Life cycle cost results are presented in
Section 4.2.
Section 4.3 conducts a comprehensive sensitivity analysis on multiple parameters, including shipping costs, material costs, orientation, number of occupants, electricity tariffs rates, temperature setpoints, coefficient of performance of the cooling system and inflation and discount rates.
4.1. Life Cycle Operational Energy
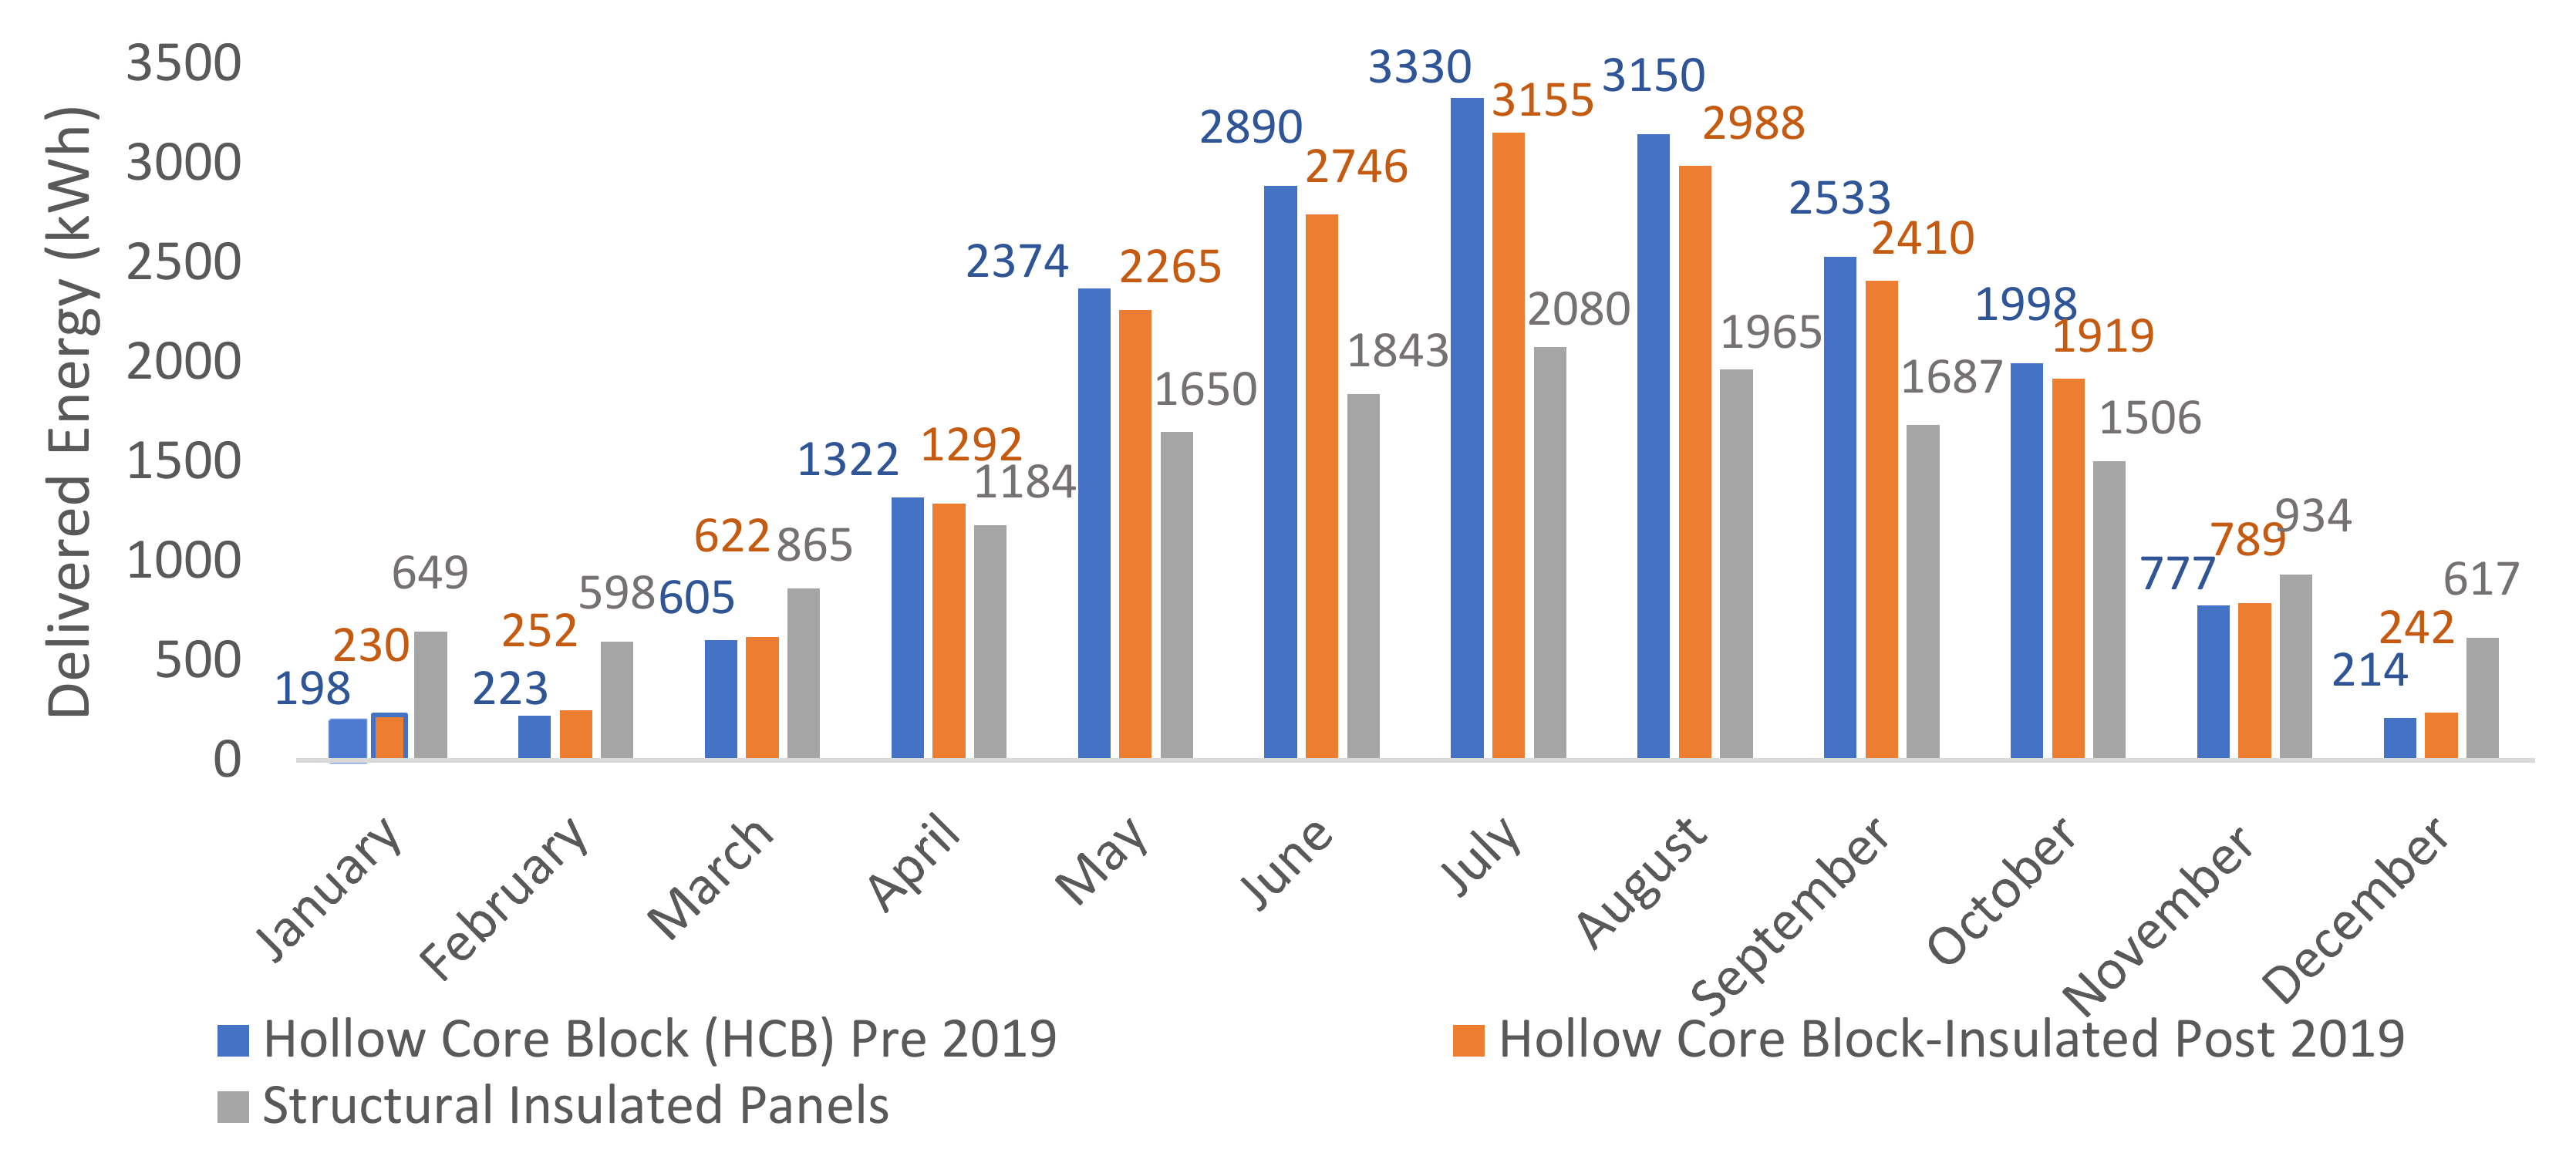
Figure 5 shows the monthly cooling energy demand across the three types. The annual cooling energy demand is the highest for HCB (19,614 kWh) and the lowest for SIPWR (15,577.9 kWh). This is attributed to the better thermal insulative properties of the structural insulated panels as opposed to the concrete blocks (−76% in U-value; see
Table 1), as well as the lower air infiltration rate for SIPWR. Considering that HCB is the base case house type, there is a reduction of 703.3 kWh per year for HCBI and 4056.1 kWh per year for SIPWR. This equals a cooling energy demand percentage reduction of 3.59% and 20.58%, respectively.
The main benefits of SIPs are observed in the peak summer months (July and August), where the difference in energy use is over 1000 kWh compared to HCB. The results show that SIPWR uses more energy during the winter months (November to February), as it is more airtight and does not allow free heat to escape. However, it is safe to assume that during these months, the cooling system is not in operation as the outdoor temperature is within the comfortable range assumed (18 °C to 23 °C). Hence, the chiller’s load can be considered only from March to October. Ignoring the winter months, again with HCB being the base case, there is a reduction of 805.2 kWh for HCBI and 5422.4 kWh for SIPWR. This equals a cooling energy demand percentage reduction of 4.42% and 29.79%, respectively. This shows the effect of implementing SIPs on the cooling energy demand, particularly during the warmer months.
4.2. Life Cycle Cost
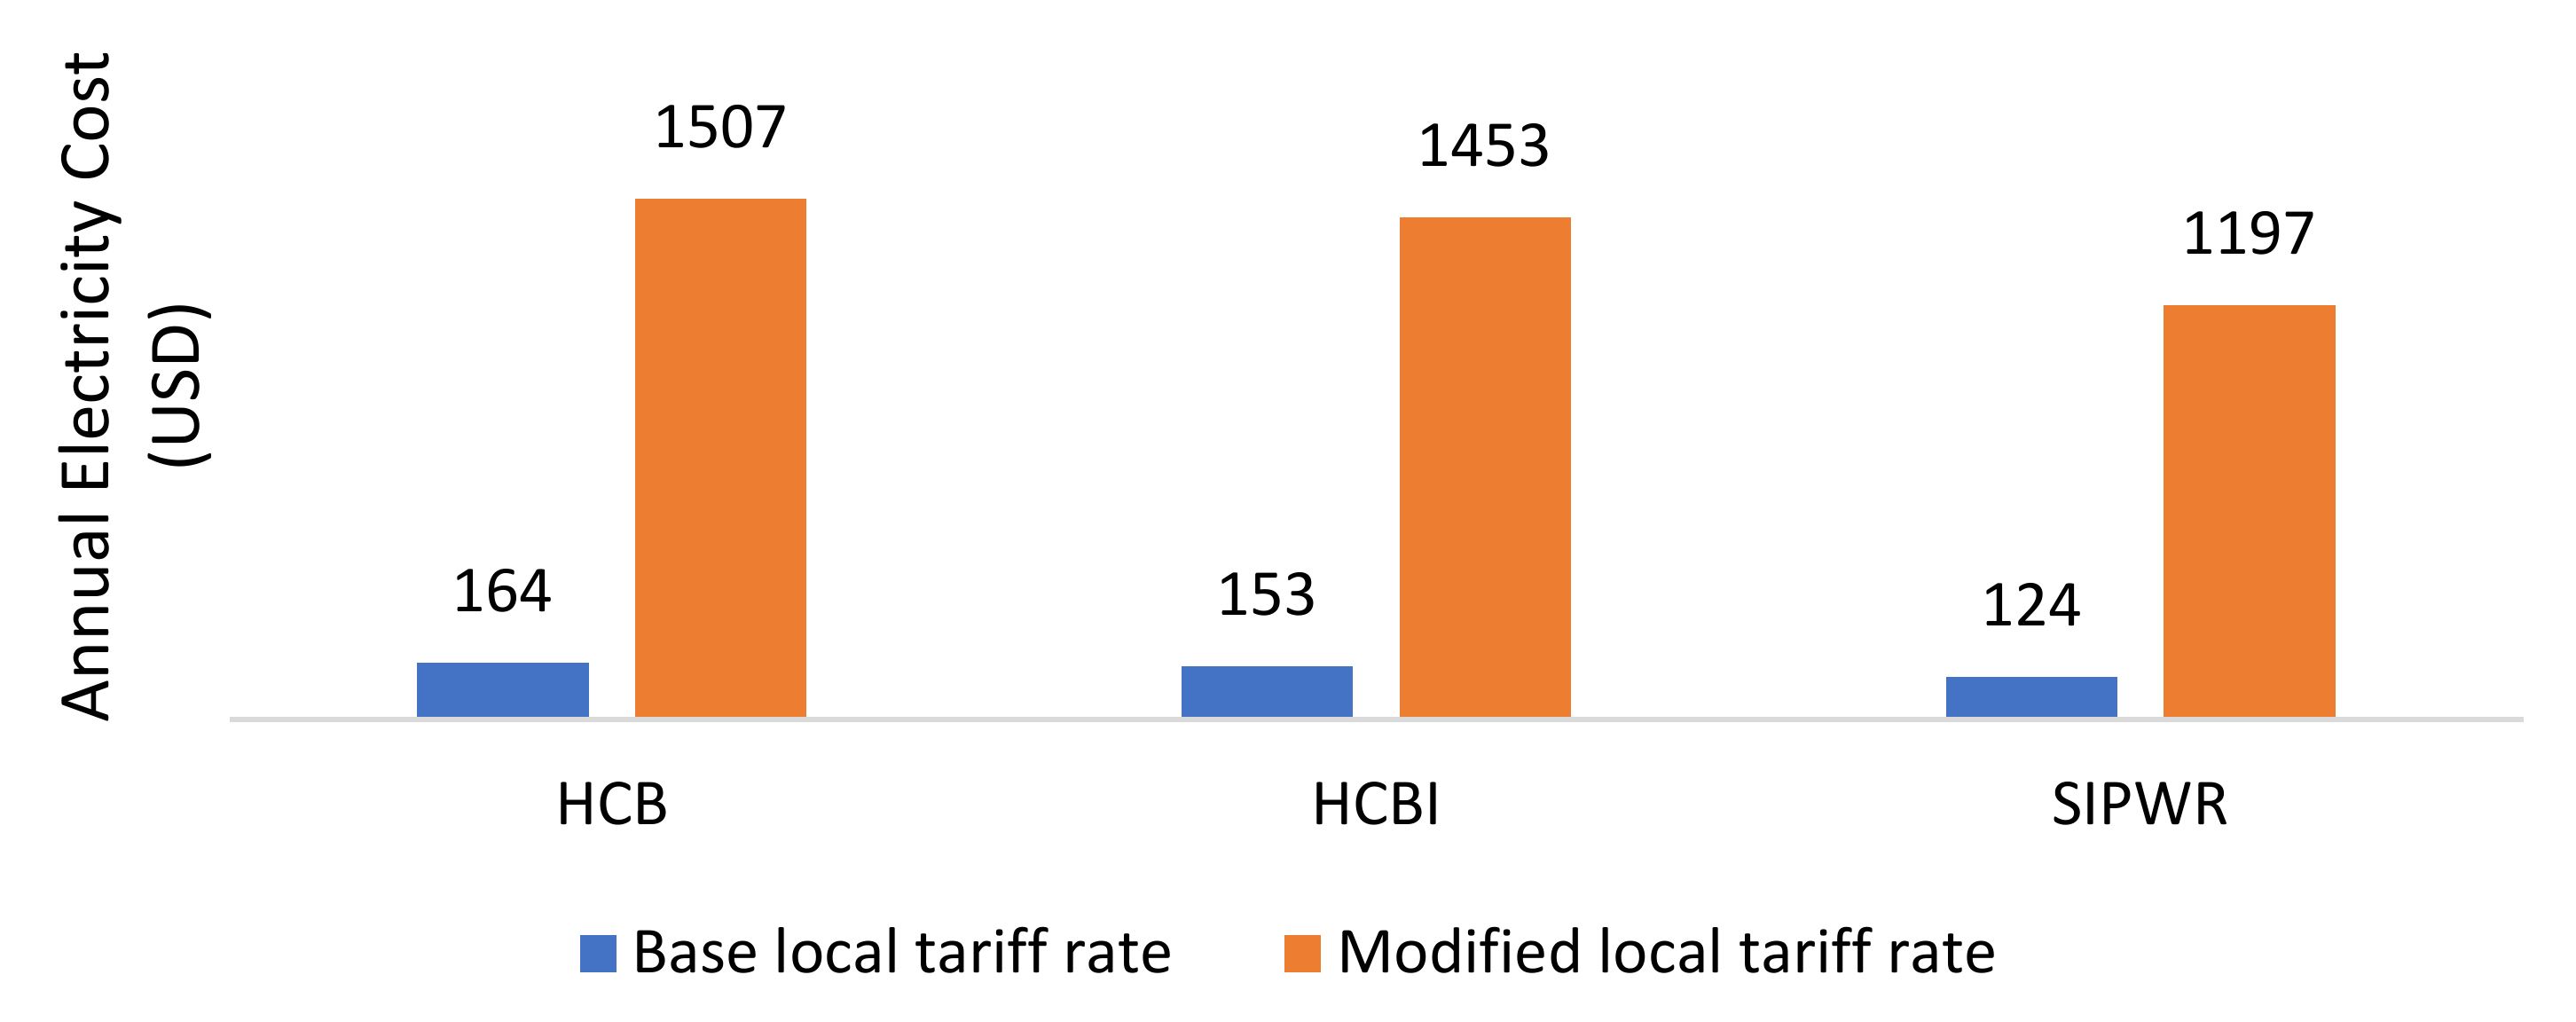
The annual operational cost (for the first year) was estimated across all three house types for the two tariff categories, as shown in
Figure 6. The first category (Bahrainis with one account—also known as ‘base local tariff rate’) had an annual electricity cost of 164 USD, 153 USD and 124 USD for HCB, HCBI and SIPWR, respectively. In this category, SIPWR had a percentage reduction in the annual electricity cost of 32.1% when compared to HCB, and 23.4% when compared to HCBI. The second category (Bahrainis with more than one account and non-Bahrainis—also known as ‘modified local tariff rate’) had an annual electricity cost of 1507 USD, 1453 USD and 1197 USD for HCB, HCBI and SIPWR, respectively.
There is a significant increase in the operational cost for the second category compared to the first. This is mainly due to the higher tariff rates for this category (see
Table 5). As shown in
Figure 6, implementing the SIPWR type can yield significant reductions (18%), particularly for high tariff rates.
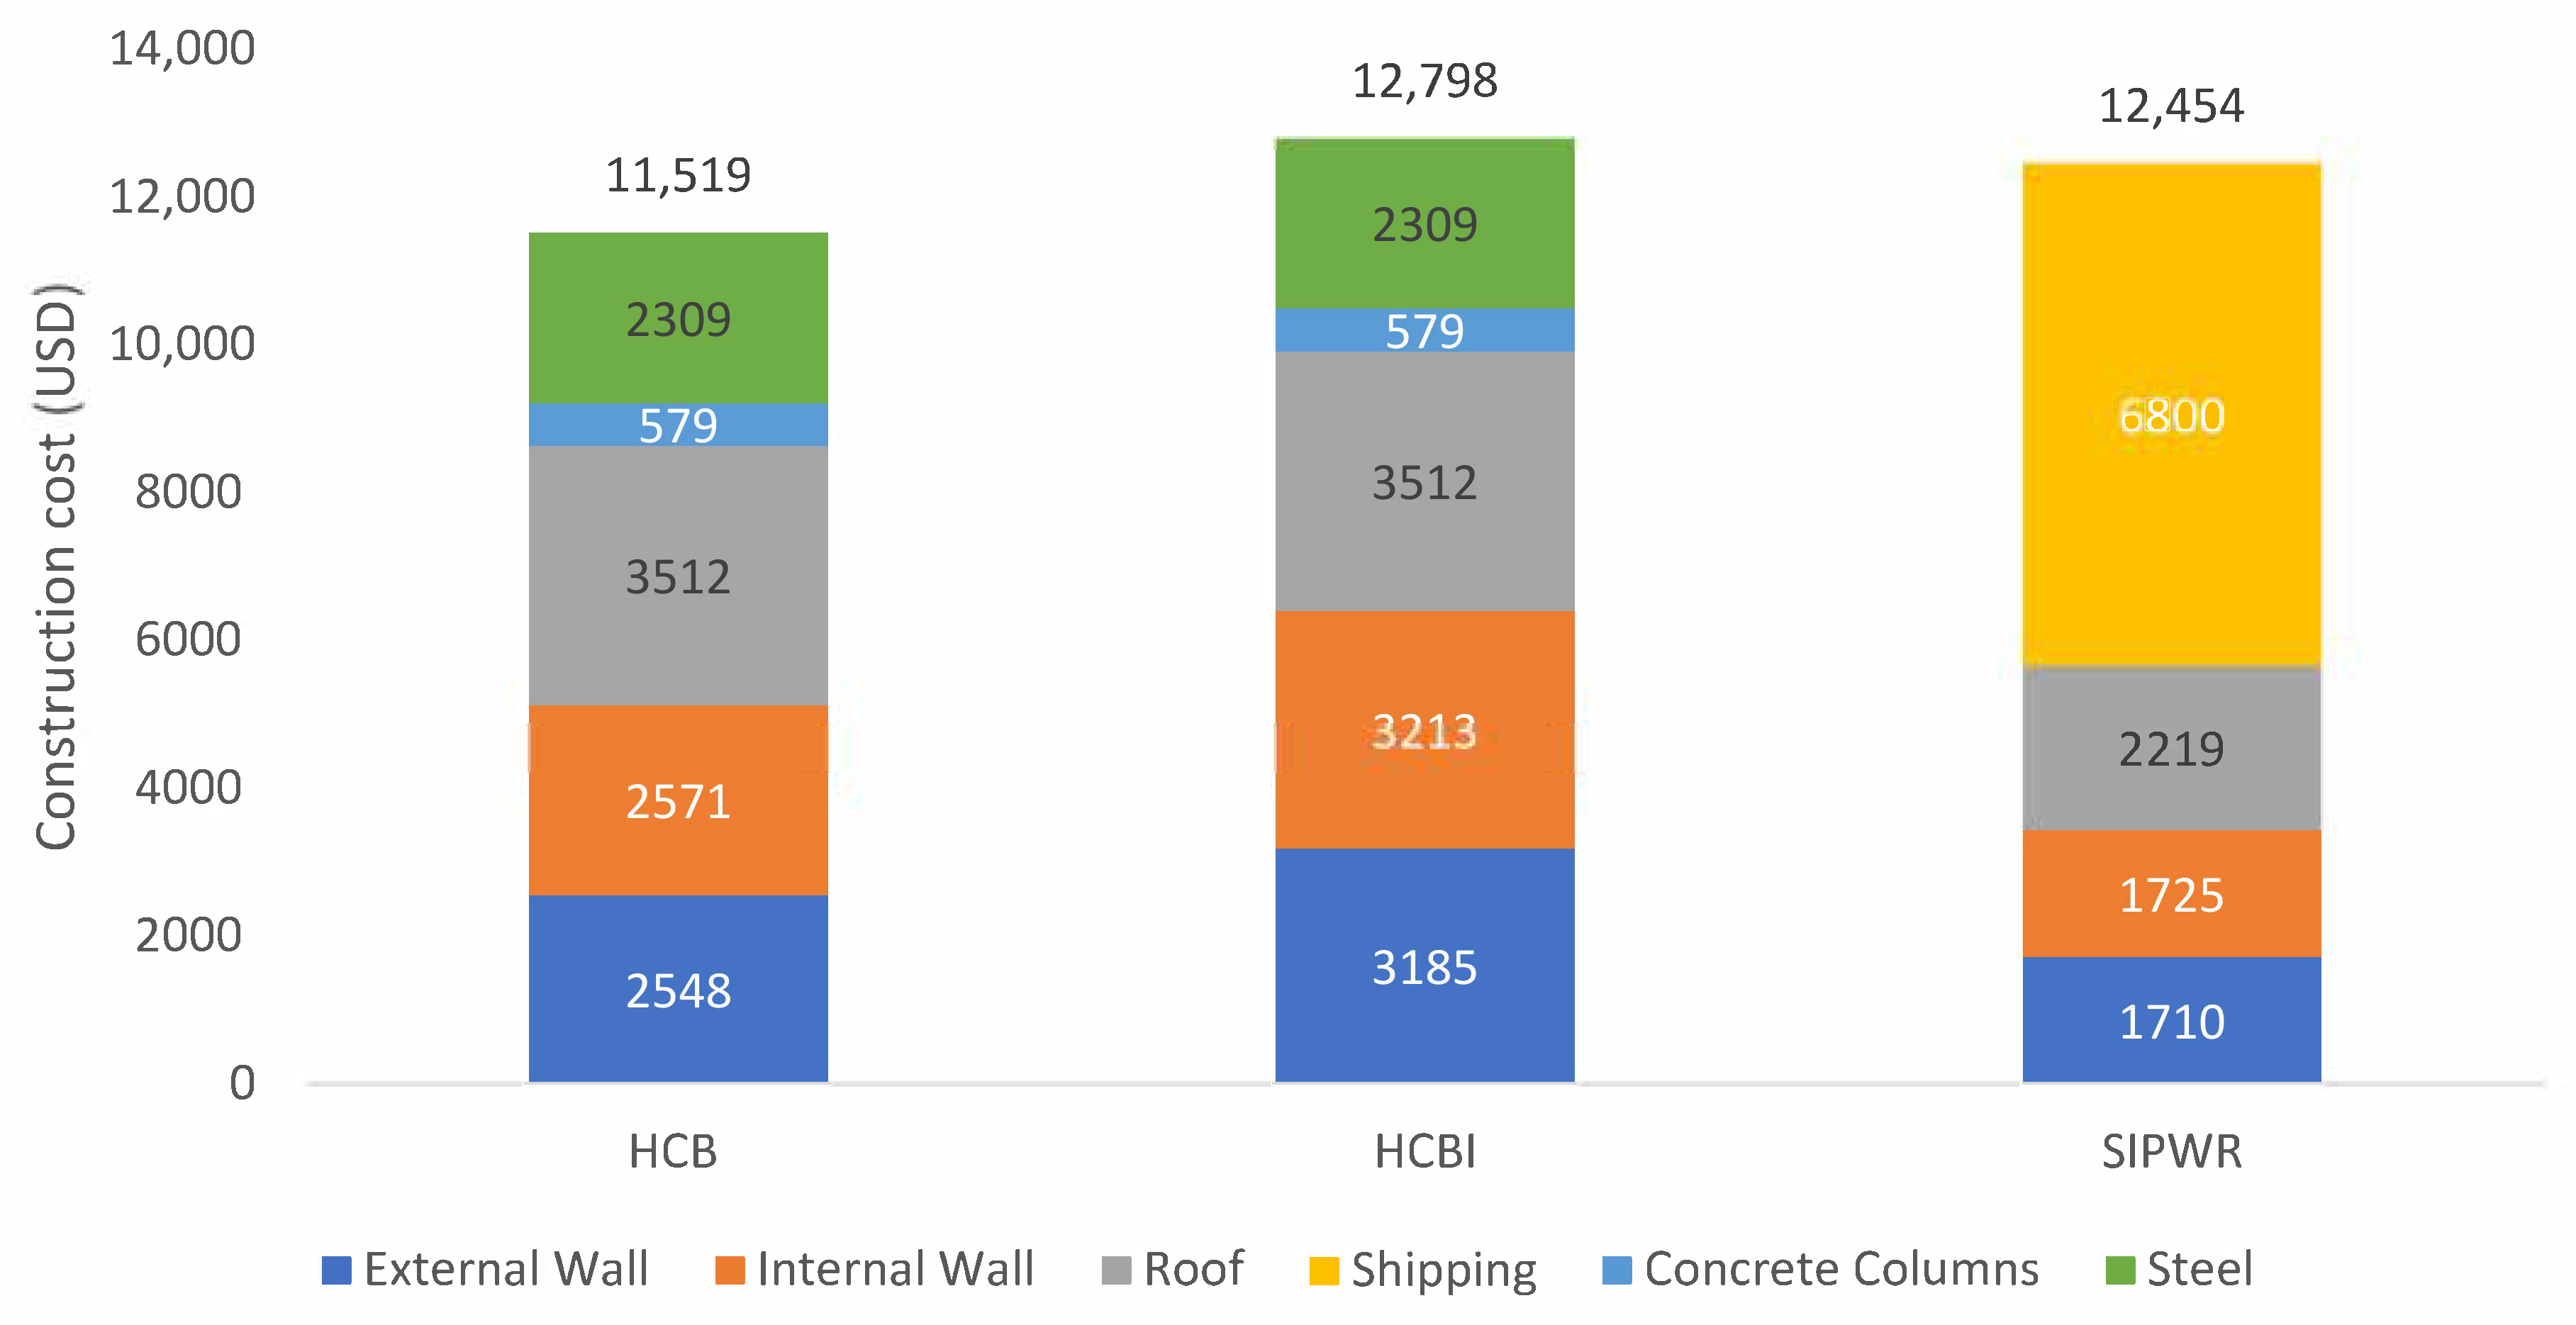
Construction costs are as significant as operational costs for SIPWR. After disregarding the outliers, the average price obtained from the quotations was 12.23 USD/m
2. For the shipping costs, the quotation obtained was priced at 1700 USD for a 20-feet container. Based on the quotations for SIPWR and the local market prices for HCB and HCBI, the breakdown of the construction costs across the three types is shown in
Figure 7 (using the pro rata shipping model-SHPRO). Considering HCB to be the base case (with a total cost of 11,518.5 USD), the total construction cost for HCBI and SIPWR are 11.1% and 8.1% higher, respectively. This increase is attributed to the increased insulated blockwork cost for HCBI and the material and shipping price for SIPWR. The construction cost of HCBI is 2.6% higher than that of SIPWR.
Combining the results for the construction costs and operational costs shown earlier in this section, the LCC was graphed across HCB, HCBI and SIPWR as shown in
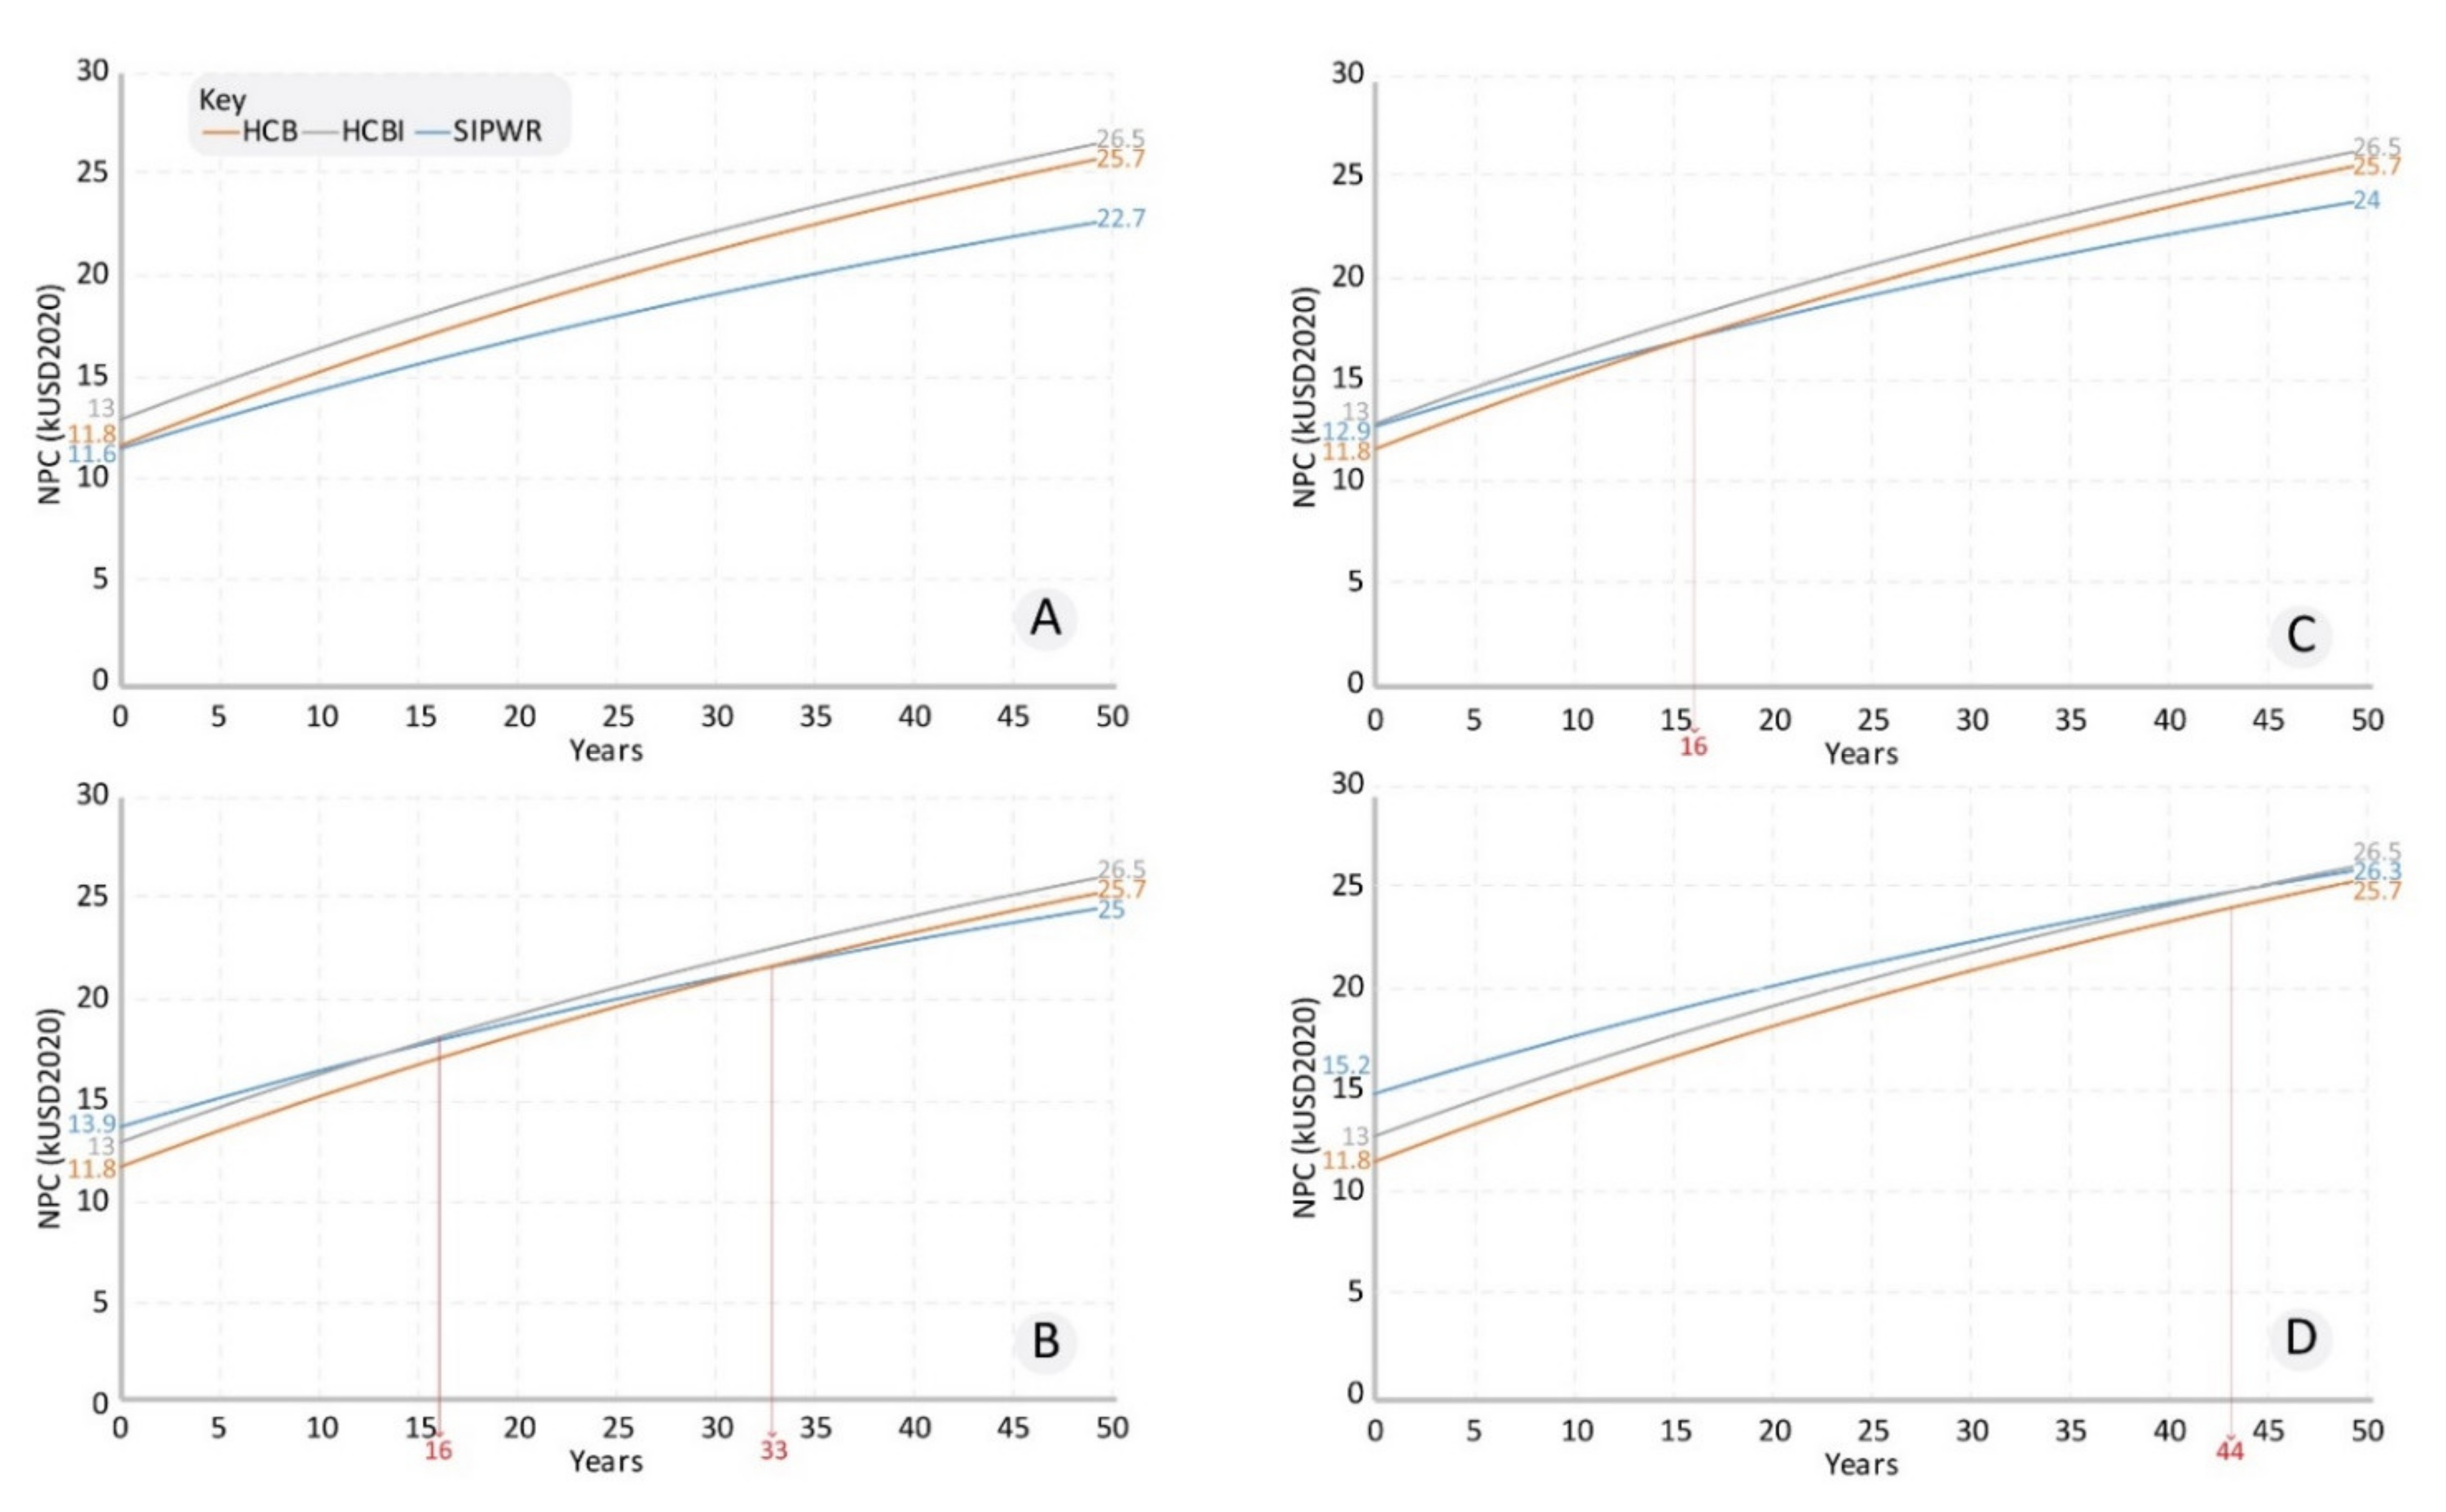
Figure 8.
Figure 8A shows that for the SHLCL case with a material cost of 12 USD/m
2, SIPWR has a lower construction cost (at year zero), and an overall lower operational cost for the period of analysis.
4.3. Sensitivity Analysis
LCC studies can suffer from high degrees of uncertainty due to unexpected changes in the financial context overtime [
29,
35]. To mitigate uncertainty in this research, a sensitivity analysis was performed on multiple financial and physical variables (individually and combined). It is worth noting that the variables described in
Section 4.3.1,
Section 4.3.4 and
Section 4.3.5 were selected due to their significant effects on the LCC results, as per Equation (1).
Section 4.3.2 was included to assess the effect of the orientation of the house on the energy use specifically and the overall LCC results. Lastly,
Section 4.3.3 was included to analyse the occupant’s behaviour regarding their preferred setpoint temperatures as well the performance of the cooling units installed as these two factors can affect the total energy used to cool an indoor space, and the associated LCC.
4.3.1. SIPs Material Cost and Shipping Costs
Shipping costs refer to the total costs associated with importing the structural insulated panels from China (supplier) to Bahrain (user). The process of pricing the construction costs of the SIPWR type can be less uncertain when considering the highest quotation received from all the suppliers. The highest quotation obtained for SIPs was 17.23 USD/m
2. This helps provide the worst-case scenario to assess the effects on the construction cost and the overall LCC analysis, in combination with the two shipping models—SHLCL and SHPRO—(discussed in
Section 3.5), and as described in
Table 6.
Figure 8A shows that for the SHLCL12 model, SIPWR has a lower initial construction cost and a lower life cycle operation cost compared to HCB and HCBI. The reduction in operational cost for SIPWR can be attributed to the better thermal resistance of the panels compared to the hollow concrete blocks.
Figure 8B shows that for the SHLCL17 model, SIPWR has an initial higher construction cost as compared to HCB and HCBI, but due to the lower operational cost, SIPWR breaks even with HCB and HCBI at years 33 and 16, respectively.
Figure 8C shows that for the SHPRO12 model, SIPWR has an initial higher construction cost as compared to HCB, but lower than HCBI. Moreover, SIPWR breaks even with HCB at year 16.
Figure 8D shows that for the SHPRO17 model (which is considered the worst-case cost scenario and is typically applicable to a pilot case study house), SIPWR has a significantly higher initial construction cost as compared to HCB and HCBI. This is mainly due to the higher shipping and material costs for SIPWR in this analysis. The results show that SIPWR breaks even with HCBI at year 44 and does not break even with HCB over 50 years.
4.3.2. Orientation
Orientation refers to the position of a house with respect to seasonal variables like the path of the sun, wind patterns, and other variables [
36]. The house orientation is changed for SIPWR to investigate its effect on the annual cooling energy demand [
37]. This helps in improving the representativity of the results to similar houses with different orientations. The North-facing, West-facing, South-facing, and East-facing cases have annual cooling energy demands of 15,577.9 kWh, 15,705 kWh, 15,482.6 kWh, and 15,415 kWh, respectively. This shows that the orientation has no significant impact on the cooling performance for this house design. This could be due to the very low window-to-wall ratio of 9–10% in the case study house.
4.3.3. Change in Temperature Setpoint and Coefficient of Performance
The temperature setpoint is the temperature/point at which an area is set. The HVAC system in that area would operate to maintain the room temperature to the setpoint. Coefficient of performance refers to the ratio of heating/cooling provided by a unit to the amount of electrical input required to generate it. The temperature setpoint is changed for SIPWR from 23 °C to both 21 °C and 25 °C. This is done to assess the implications of having a higher and/or lower setpoint on the annual cooling energy demand for SIPWR. For a base cooling setpoint of 23 °C, the annual cooling energy demand is 15,577.9 kWh. For a cooling setpoint of 25 °C, the annual cooling energy demand is reduced to 14,227.1 kWh (−9.5%). For a cooling setpoint of 21 °C, the annual cooling energy demand increases to 16,935.9 kWh (+8.7%). As expected, the temperature setpoint has a strong influence on the cooling energy demand.
The coefficient of performance (COP) of the cooling equipment for the base case is set at 4 kW/kW. This yields an annual cooling energy demand of 15,578 kWh. Upon changing the COP to 6 kW/kW, the annual energy demand reduces to 13,745 kWh (−13.3%). When the COP was changed to 2 kW/kW, the annual energy demand increases to 17,974 kWh (+15.4%). The COP of the cooling equipment is thus very significant in determining the annual cooling energy demand.
A best-case and worst-case scenarios (for SIPWR) are considered in the analysis. For the best case, the temperature setpoint is set as 25 °C with a COP of 6 kW/kW. The results show that the new annual cooling demand reduces to 12,553 kWh as compared to 15,578 kWh (−24.1%). In the worst case, the temperature setpoint was set as 21 °C and the COP at 2 kW/kW. Results show that the new annual cooling demand increases to 19,541 kWh, (+25.4%).
4.3.4. Tariff Rates
A tariff rate refers to the price a user is charged for the energy they use. We modelled various scenarios of tariff rates, following their recent increase in Bahrain. In the first scenario, electricity bills are studied by comparing the tariff rates to countries like Japan, Australia and the United States. These countries were selected as examples of locations with much higher electricity tariffs and their respective rates per kWh are shown in
Table 7. These were applied to both categories (base local tariff rate and modified local tariff rate) to assess the effect of subsidising the tariff rates (current practice) on the affordability to the end user and the financial obligations of the government.
Please note that in Japan, the breakdown of the tariff categories is very narrow compared to the Bahraini tariff breakdown. The highest tariff rates are implemented after exceeding 300 kWh, whereas in Bahrain, the lowest rates in the categorisation cover 3000 kWh. This is 10 times more than the highest rate in Japan.
Section 5.2 further discusses this aspect.
The second scenario considers the possibility that the Bahraini government re-subsidises the rates again to the pre-2016 rates for the second category (modified local tariff rate) to match the rates of the first category (base local tariff rate). The annual electricity costs in this case are estimated as 164 USD, 153 USD and 1234 USD for the HCB, HCBI and the SIPWR types, respectively.
The third scenario involves increasing the 2019 rates even further using uniform increments of 20%, 40%, 60%, 80% and 100%, to reach costs per kWh similar to those in the USA and Australia. The results are shown in
Table 8.
Table 9 compares the annual electricity bills across multiple countries, considering the ‘base local tariff rate’ to be the base case. The approximate percentage increase is also demonstrated. Implications of these changes are discussed in
Section 5.2.
4.3.5. Discount Rate
Discount rate refers to the interest rate at which the central bank lends money to commercial banks to meet their liquidity needs [
41]. This analysis is aimed at assessing the impact of change of the discount rate (from 3% to 8%, which is assumed to be the worst-case scenario) on the overall LCC across the different house types and shipping models (shown in
Table 6).
In the case of the SHLCL12 model, changes in the discount rate do not have a major impact across the three house types, as the SIPWR type has a lower net present cost starting from year 0. This means that any change in these rates have a similar effect on all house types. In the SHLCL17 model, it is demonstrated that due to the higher discount rate, the curve across all the types becomes steeper. Due to the combination of the high construction cost of the SIPWR type and the steeper LCC graph, SIPWR breaks even with HCBI at year 27. For the SHPRO12 model, since the initial construction cost at year 0 for SIPWR is lower than that of HCBI, SIPWR breaks even with HCB at year 36. Finally, for the SHPRO17 model, due to the higher initial cost of SIPWR and the higher inflation rate, the LCC of SIPWR stays higher than HCB and HCBI for the entire period of analysis.
Table 10 compares the LCC relationships and the breakeven periods between SIPWR and HCB and HCBI, for discount rates of 3% (base case) and 8%. The colour coding depicts the initial construction costs with green being the least and red being the highest. The breakeven periods for SIPWR are noted for each shipping model. It is noticed that the overall initial construction cost remains the same for both the discount rates, across all house types. However, the breakeven points of SIPWR vary with the changes in discount rates. The general trend noticed is that as the inflation rate increased, either the breakeven period increases or is not achieved for the analysis period. In other words, for a lower discount rate, SIPWR breaks even sooner with HCBI and/or HCB.
Table 11 shows the results of the entire sensitivity analysis across the three house types. A color-coded representation is used to visually differentiate between the results. Red cells show the higher costs/energy use, green cells show the least costs/energy use and yellow cells represent the intermediate results. As a general trend across the table, it is noticed that the NPC is the lowest for SIPWR compared to HCB and HCBI, across all scenarios except for the SHPRO17 model. This is primarily due to the increased material and shipping cost for the SHPRO17 model. For a higher discount rate (8%), SIPWR typically breaks even with one of the types except for the SHPRO17 model due to the same reason mentioned above.
Due to the high thermal efficiency of SIPWR, its annual cooling energy demand is the lowest across all the models when compared to HCB and HCBI. Considering only the construction costs, the SIPWR type is the lowest only in the SHLCL12 model.
5. Discussion
5.1. Contribution of the Study
This study contributes to the analysis of life cycle cost and operational energy for residential houses in hot and arid climates. The approach focused on comparing two main house types—concrete houses and structural insulated panel houses. In comparison, other existing studies focused on the life cycle assessment of multiple structural insulated panel houses [
17] or the comparison between structural insulated panel and timber houses [
10,
42]. While this research focused particularly on a case study house in Bahrain modelled in the simulation tool (IES-VE), the results can be applied to residential houses in a similar geographical, climatic and financial context, like the eastern part of Saudi Arabia, Qatar, the United Arab Emirates, Kuwait and Oman.
The life cycle cost estimation took into consideration multiple variables such as material costs, shipping costs, inflation rates and the discount rates. The sensitivity analysis aimed to reduce the effect of uncertainty and helped provide a more comprehensive understanding of energy savings, payback periods and a comparison of tariff rates with the international rates.
From a life cycle cost perspective, and as shown in
Figure 8, the study demonstrated that SIPWR would perform better over the analysis period as compared to HCB and HCBI, except in the SHPRO17 model, which represents high shipping costs and a high discount rate. This implies that using structural insulated panels for walls and roofs in single-storey housing in Bahrain could be cost-competitive, as compared to current housing practices. Further discussions on the life cycle operational energy are presented in
Section 5.2.
Within the Bahraini context, this study complements existing government sustainable development goals (aimed to be achieved by 2030), which include implementing sustainable cities and communities, climate change control measures and industry innovation and infrastructure [
43]. This is associated with the innovative and sustainable approach achieved by implementing structural insulated panels for residential houses and the positive effect it has on the environment by reducing energy use and associated greenhouse gas emissions.
5.2. Reducing the Overall Life Cycle Operational Energy Demand of Residential Houses: Practical Guidelines
This study established a relationship between using structural insulated panels and life cycle operational energy reduction. On a life cycle basis, using structural insulated panels can reduce the energy demand. However, this must be supported by an increase in electricity tariffs.
In
Section 4.3, a comparison was made between the current tariff rates in Bahrain and rates from Japan, Australia and the United States. These rates were used to compare the annual electricity bills as shown in
Table 9. The results indicate that the current rates in Bahrain, particularly for the first category (base local tariff rate), are extremely low when compared to those of other countries. As such, there is very little incentive for the end-user to use structural insulated panels. In fact, the base local tariff rate is so cheap when compared to the other tariff rate categories that the payback period exceeds the period of analysis (50 years).
Moreover, as mentioned in
Section 4.3, the breakdown of the electricity tariff rates into the three categories is very different across Japan and Bahrain. Japan uses tariff bands in the range of 120–180 kWh, compared to 2000–3000 kWh in Bahrain. In the Bahraini context, the bands provide less incentive for the end user to implement energy saving strategies to reduce annual electricity usage.
To render structural insulated panels cost-competitive, we propose two practical approaches. Firstly, the government may subsidise the total cost of importing the structural insulated panels (both material and shipping costs) to encourage the current and future house owners to invest in a more energy efficient house with an improved environmental performance. For example, considering the worst-case scenario (SHPRO17 with 8% discount rate), it was found that a 20% reduction of construction cost for the SIPWR type resulted in a lower construction cost at year zero when compared with the HCBI type. Moreover, the breakeven period was recorded at year 7 when compared to the HCB type. Subsiding 20% of the construction cost of SIPs housing would therefore probably guarantee their cost-effectiveness in a Bahraini context. Secondly, the government may opt to further increase the electricity tariff rates (including the first category of users) to increase the awareness of the true cost of energy, notably energy from fossil fuels. This will encourage house owners to invest both time and money in improving housing energy efficiency for a better performance in Bahrain’s hot and dry climate. A tariff of 12.3 US cents/kWh results in a SIPWR house saving ~500 USD per year, compared to ~300 USD per year with a tariff of 7.7 US cents/kWh.
It is worth noting that all the stakeholders involved in the construction of a residential house in Bahrain—owners, designers, builders, etc.—are restricted by the material options available on the construction market and the construction practice. This restriction and inertia in practice can be problematic, as they do not promote potential construction alternatives that could have both cost and environmental benefits for the end user and the government.
5.3. Limitations
This study, like any other, is restricted by a few limitations. Firstly, it relies on a case study approach to obtain the results, over an assumed analysis period of 50 years. During that period, external factors, such as the inflation and discount rates, material prices and shipping costs can vary, affecting the results. While the sensitivity analysis has broadened the applicability of findings and considered changes of these external variables over time, results are valid for the case study house, representing single-storey houses. However, it is worth noting that capital expenditure results are applicable to multi-storey residential houses with a potential reduction in costs as larger quantities are purchased. Moreover, regarding multi-storey buildings, there will be no losses through the roof (except for the top apartment). Secondly, since there are no local manufacturers/suppliers of structural insulated panels in Bahrain, the estimation is performed based on quotations from suppliers located overseas, and this creates uncertainty in estimating the actual construction cost. Thirdly, the occupants’ behaviour can vary greatly from one household to another, and this can affect operational energy use in the case study house. Studies show that there can be a difference in the operational energy demand across two occupants living in the same house by over 300% [
44]. Fourthly, this study focuses mainly on operational energy and does not include embodied energy, which is significant [
45]. Fifthly, the study considered a fixed number of five occupants while running the simulations. It is expected that changing the number of occupants will affect the annual cooling demand. For example, for the SIPWR type, a minimum of two occupants and a maximum of seven occupants were considered. The simulations resulted in yearly cooling demands of 10,997.8 kWh and 18,667.3 kWh, respectively. These account for a 29.4% reduction in the annual cooling demand (in the case of two occupants) and a 19.83% increase in the annual cooling demand (in the case of seven occupants). Therefore, further research is required to test the payback times using different occupancy scenarios across the different types.
5.4. Future Research
Future research directions include conducting research to include double and multi-storey residential houses to provide a more holistic approach on the residential housing sector in Bahrain. A comprehensive environmental life cycle assessment (LCA) covering the same scope could be considered. This could be achieved by analysing and assessing embodied energy because energy use is a good approximation of the total environmental effect [
46]. To conduct an LCA, ideally, a hybrid life cycle inventory [
47,
48] (LCI) that includes the inputs and outputs associated with each item used in the project’s life cycle should be compiled using geographically specific data.
Social aspects could also be the focus of future research. This can be related to the societal acceptance of a timber-framed house in Bahrain, and the willingness of occupants to invest in one. Built environment professionals could also be interviewed about their views on using SIPs in Bahrain.
6. Conclusions
This study quantified the life cycle cost and operational energy using structural insulated panels as a possible replacement for concrete hollow blocks as a building envelope. This was done across the Hollow Core Block (HCB), Hollow Core Block-Insulated (HCBI) and the Structural Insulated Panel Wall (SIPWR) case study house types and modelled in the dynamic building energy simulation tool IES-VE. It was established that the Structural Insulated Panel Wall house type, with its higher thermal resistance, had a lower annual cooling energy demand by 21.4% and 25.9% when compared to the Hollow Core Block-Insulated and the Hollow Core Block house types, respectively. However, with respect to the life cycle cost, various variables affected the performance of the Structural Insulated Panel Wall type across the life cycle of the project and a period of 50 years, as detailed in
Section 4.3. The study aimed at targeting these variables, including shipping and material costs, discount rate, cooling setpoint, orientation, and coefficient of performance of the cooling system, by performing a broad sensitivity analysis on the results obtained from the base analysis. This helped in understanding the impact of the individual variables on the overall life cycle cost and possible strategies that can improve the overall outcome. By focusing on current key developments in Bahrain like increasing electricity prices and thermal performance requirements of the building envelope, the study demonstrated various results relating to the operational costs and the subsequent life cycle cost. Comparing the current rates in Bahrain with the international context helped develop an understanding of the current government strategy in this field, and the possible measures that can be taken to implement such an approach. These include subsiding the construction cost of structural insulated panels by 20% and/or increasing the electricity tariff rate to at least 12.3 US cents/kWh. This will help improve the uptake of structural insulated panels and reduce the cooling energy demand of residential buildings, while improving comfort.


