Article

CAD Tools and Computing in Architectural and Urban Acoustics

Faculty of Architecture, Wroclaw University of Science and Technology, 50-317 Wroclaw, Poland
*
Author to whom correspondence should be addressed.
Buildings 2021, 11(6), 235; https://doi.org/10.3390/buildings11060235
Submission received: 3 May 2021 / Revised: 20 May 2021 / Accepted: 27 May 2021 / Published: 30 May 2021
(This article belongs to the Special Issue Computer Aided Architectural Design)

Abstract

:
Contemporary architectural and urban planning aims at optimal development of the environment, including in terms of acoustics. As such, support with computer-aided design (CAD) tools is, nowadays, obligatory. The authors present investigation outcomes of three different CAD and computing methods extracted for the study. The scope covers different scales of considerations from architectural acoustics to the urban level, which relates to the standard architect’s commissions field. The described approaches are applicable for both academics and professionals in the broadly understood building industry There were analysed and synthesized experiences from the use of two-dimensional and three-dimensional simulations, computing based on standardized formulas, and an acoustic meter (here: the SVAN 979 for RT60, LAeq measurement). The article concludes with an assessment, which shows possible uses of methods and confirmations of their usability.

1. Introduction

The computer-aided design (CAD) based on designer-software relation, has nowadays expanded in a significant manner. There are several digital tools for gathering, transforming, and supplying data. The list starts with video cameras, humidity, temperature, and laser distance meters, ending with thermal cameras, three-dimensional spatial scanners, or acoustic and vibration meters. This transformation is characteristic of architecture, building, and civil engineering, as well as urban design. Digital tools and diverse computer software can become engaged at all project phases, from conceptual schemes to final documents. Supplied information is becoming more detailed with each technological advancement—advanced and sophisticated—and as such it requires expert knowledge and particular computer applications.
Computer tools are willingly (and successfully) used in all branches of the built engineering environment, such as the modelling of energy efficiency or user behaviour [1], and the application of numeric processes for structure [2]. On occasion, the aforementioned equipment and software go far beyond the standard work for a single professional. Hearn [3] argues that within creative professions, the currently observed trend of an increasing number of digital tools will continue, resulting in the necessity of forming interdisciplinary expert teams for every type of design. The process is transformative and dynamic and should undergo constant evaluation.

1.1. Aim of Research

Hence, the study focuses strictly on acoustical measurements and related computer-based calculations assessments. There were application possibilities evaluated in architectural, building, civil engineering, and urban design. According to the project stages, it was possible to extract three phases, as presented below. For each, there were different digital tools proposed. The authors argue that generally accessible information and data concerning environmental and room acoustics—like acoustic urban maps [4], currently used standards ISO/TC 43/SC 2 [5], or for national-level norms PN-B-02151-2:2018-01 [6]—can be insufficient. Architectural project development, responding to sustainability, or user health, will benefit from engaging certain graphical simulation methods based on CAD tools or specific computing methods, fulfilled by the acoustic data gathering process.
The authors claim that the use of comparative material and on-site measurements can substantially influence the built environment. It supplements precise and correct assumptions for parameters regarding the planned sound field of future investment. Designers working in construction professions are responsible for many issues: spatial and functional, program, material, construction, the safety of use, fire protection, sanitation, and greenery. They must ensure the balance of each element and the documentation consistency in each phase. They are also responsible for architectural and construction acoustics solutions. Therefore, the idea of this article is to explain the issues of architectural and building acoustics simply and clearly. There are many great expert articles on acoustics, but their connection to the built environment covers rather specific aspects. Engineers in the field deal with detecting microstructure cracks in different materials, as recalled in the works of Climent, Miró, Carbajo, Poveda, de Vera, and Ramis [7], or other publications on specific features of materials, i.e., on the absorption of porous concrete [8], green walls [9], and insulation qualities [10,11]. A different example would be regarding studies on building acoustic performances in exceptional external conditions, for example, in publications by Bullová, Kapalo, Katunský [12], or linked to music performances in concert halls or rehearsal spaces [13,14]. There is not enough said on the mutual influence between sound and space [15], and there has been very little published on CAD tools in practical building acoustics (see more in Materials and Methods).
The article addresses architects and civil engineers, by giving them knowledge on using accessible tools to address acoustic problems. It offers a novel approach to using well-known tools. Nowadays, offices have a substantial cyber environment, but they use only selected possibilities. Meanwhile, architectural and urban acoustics still stay substantially neglected and omitted in a majority of designs. In Europe, Lden over 55 dB—the threshold of annoyance—affects 25% of the population, and one in six people experience an Lnight over 50 dB so-called sleep disturbance threshold during the night. These data prove negligence in noise reduction by professionals responsible for sustainable and quiet built environment design [4,16].
Our goal is to supply architects, urban planners, and civil engineers with knowledge on the use of tools, which they already own, to design the built environment with more optimal acoustics. Thus, the elaboration fills the gap in the scientific literature with new, proposed systematics. As a result, three CAD methods in the acoustic design of buildings and architecture are specified, described, and evaluated (see: Results Section with the Matrix I and II). The graphic typology is applicable for theory and practice in the disciplines of architecture and urban studies.

1.2. Timeline

Our initial research on architectural acoustics supported with CAD tools started in 2004. It concerned architectural acoustics of shoe-box shaped concert halls in comparison to the vineyard configuration. The study was a graphical analysis of two-dimensional plans and sections in the CAD environment supplemented with three-dimensional virtual modelling. The latter enabled the visualisation of direct and reflected sound wave propagation. Spatial modelling also proved RT differences due to volume and links between architecture (geometry) and acoustics (intentional wave propagation).
In 2010, the graphical analysis on architectural acoustical solutions was expanded by computing. Required by professional practice, these analyses concerned built environments. Based on national and international standards, they allowed planning rooms conditions. In 2020, the studies supplemented on-site measurements, focused on real-live, or the equivalent, sound level, with aberrations and changes. Results, conclusions, and manuscript elaboration launched in January and lasted until May of 2021. Thus, the article reflects both research and practice, covering all three aspects of acoustics related to design encountered in the built environment.

2. Materials and Methods

The presented study is based on specialist literature, law documents, and official online sources and platforms. They considered the following problematics:
  • The connection of architecture and acoustics, roles, competencies, and responsibilities of each in the built environment [15],
  • Noise pollution in urban and internal space—monitoring and observation—world-wide [17], including in the USA [18], and in the European Union [4,19],
  • Noise prevention on international [4,5,18,20] and national [6,21,22] levels,
  • Studies on the architect’s profession in the European Union [23],
  • The acoustics:
    Definitions and formulas based on standards [6,21,22] and recent writings, i.e., on the weighted sound reduction index by Granzotto and Di Bella [24] or features of the in-room acoustic field by Torresin, Albatici, Aletta, Babich, Oberman, Siboni, and Kang [25],
    Descriptions of sound phenomena and their basic parameters: ArAc Multibook [15], and Everest and Pohlmann [26],
    In-room occurrences like acoustic field blend based on Kulowski [27], or clarity after Barron [28],
  • Examples of architectural and acoustic analyses with graphics and calculations:
    In books, e.g., by Beranek [29], Boulet, Moissinac, Soulignac [30], Cavanaugh, and Wilkes [31],
    In articles with a focus on computer tools, e.g., by Katunsky, Katunska, Germanus [32], Naylor and Rindel [33], or Ciaburro, Iannace, Lombardi, Trematerra [34], Jablonska [35] Trocka-Leszczynska E., and Jablonska [36],
    In articles with a special focus on graphic methods, such as by Jablonska [37] and Jablonska, Furmanczyk [38].
Literature organised as mentioned served as a general overview and in the case studies’ selection. Critical references reviews aided the statement of gaps in acoustical publications designated to the building environment professionals. It inspired the scope of research and extraction of three methods presented in Section 2.2, Section 2.3 and Section 2.4. The case studies responded to extracted stages of building and architectural design: firstly, through graphical analysis in planning sound interior propagation concerning architectural layout; secondly, through calculations for in-room acoustic sound field parameters; and finally, through on-site measurements for optimal data gathered from the environment. Results from each part of the case studies were double-checked and compared to literature examples and standards. The methods used consisted of a critical review and comparative analysis. In each of the three groups, there was an additional comparison between the cases conducted. The scientific method of comparative synthesis allowed us to draw out conclusions and prepare summary matrixes.
Measurement apparatus:
  • The SVAN 979 Class 1 Sound & Vibration Analyser, SVANTEK, Warsaw, Poland [39]—certified acoustic meter, calibrated before and after each measurement, used for on-site measurements of reverberation time (RT60 and RT30), and equivalent sound level A (LAeq).
  • The acoustic calibrator model SV 33B, SVANTEK, Warsaw, Poland –emitting 114 dB established LAeq used for mentioned calibration.
Software:
  • SVAN PC++, SVANTEK, Warsaw, Poland—integrated computer application for SVAN 979, enabled acoustic parameters analysis with graphic representations and calculations,
  • Excel, Microsoft, Redmond, WA, USA—computer application used for computing and statistic data elaboration,
  • The Rigips Saint-Gobain Calculator, Saint-Gobain Construction Products, Gliwice, Polska [40]—an online application used for acoustic modelling and parameter calculations,
  • AutoCAD, Autodesk, San Rafael, CA, USA and 3dMax, Autodesk, San Rafael, California, USA—computer software for two-dimensional and three-dimensional modelling, analysis, and graphic representations,
  • Photoshop CS3, Adobe, San Jose, CA, USA—computer software used for graphic representations.

2.1. Problematics Outline

The built environment produces and receives unwanted [4,16], and dangerous to one’s health, sound [17,18,19,20]. Such a phenomenon decreases sustainability in both urban and interior design. Thus, on architects, civil engineers, city planners, and national and local authorities, there is an obligation [5,6,20,21,22] to prevent: material, air-borne, and reverberation noise, as well as vibration propagated by structure and building compartments [3,4,5,6,16,20,21,22]. To fulfill assumed aims, the professionals must perform many simulations and calculations. An analysis of broad applications of CAD methods and professional architectural practice allows us to extract three types of project phases. They relate to architecture commission fields for both minor and large offices. In the standard design, all three scales–architecture (building, structure), interior and urban—must be addressed, as listed:
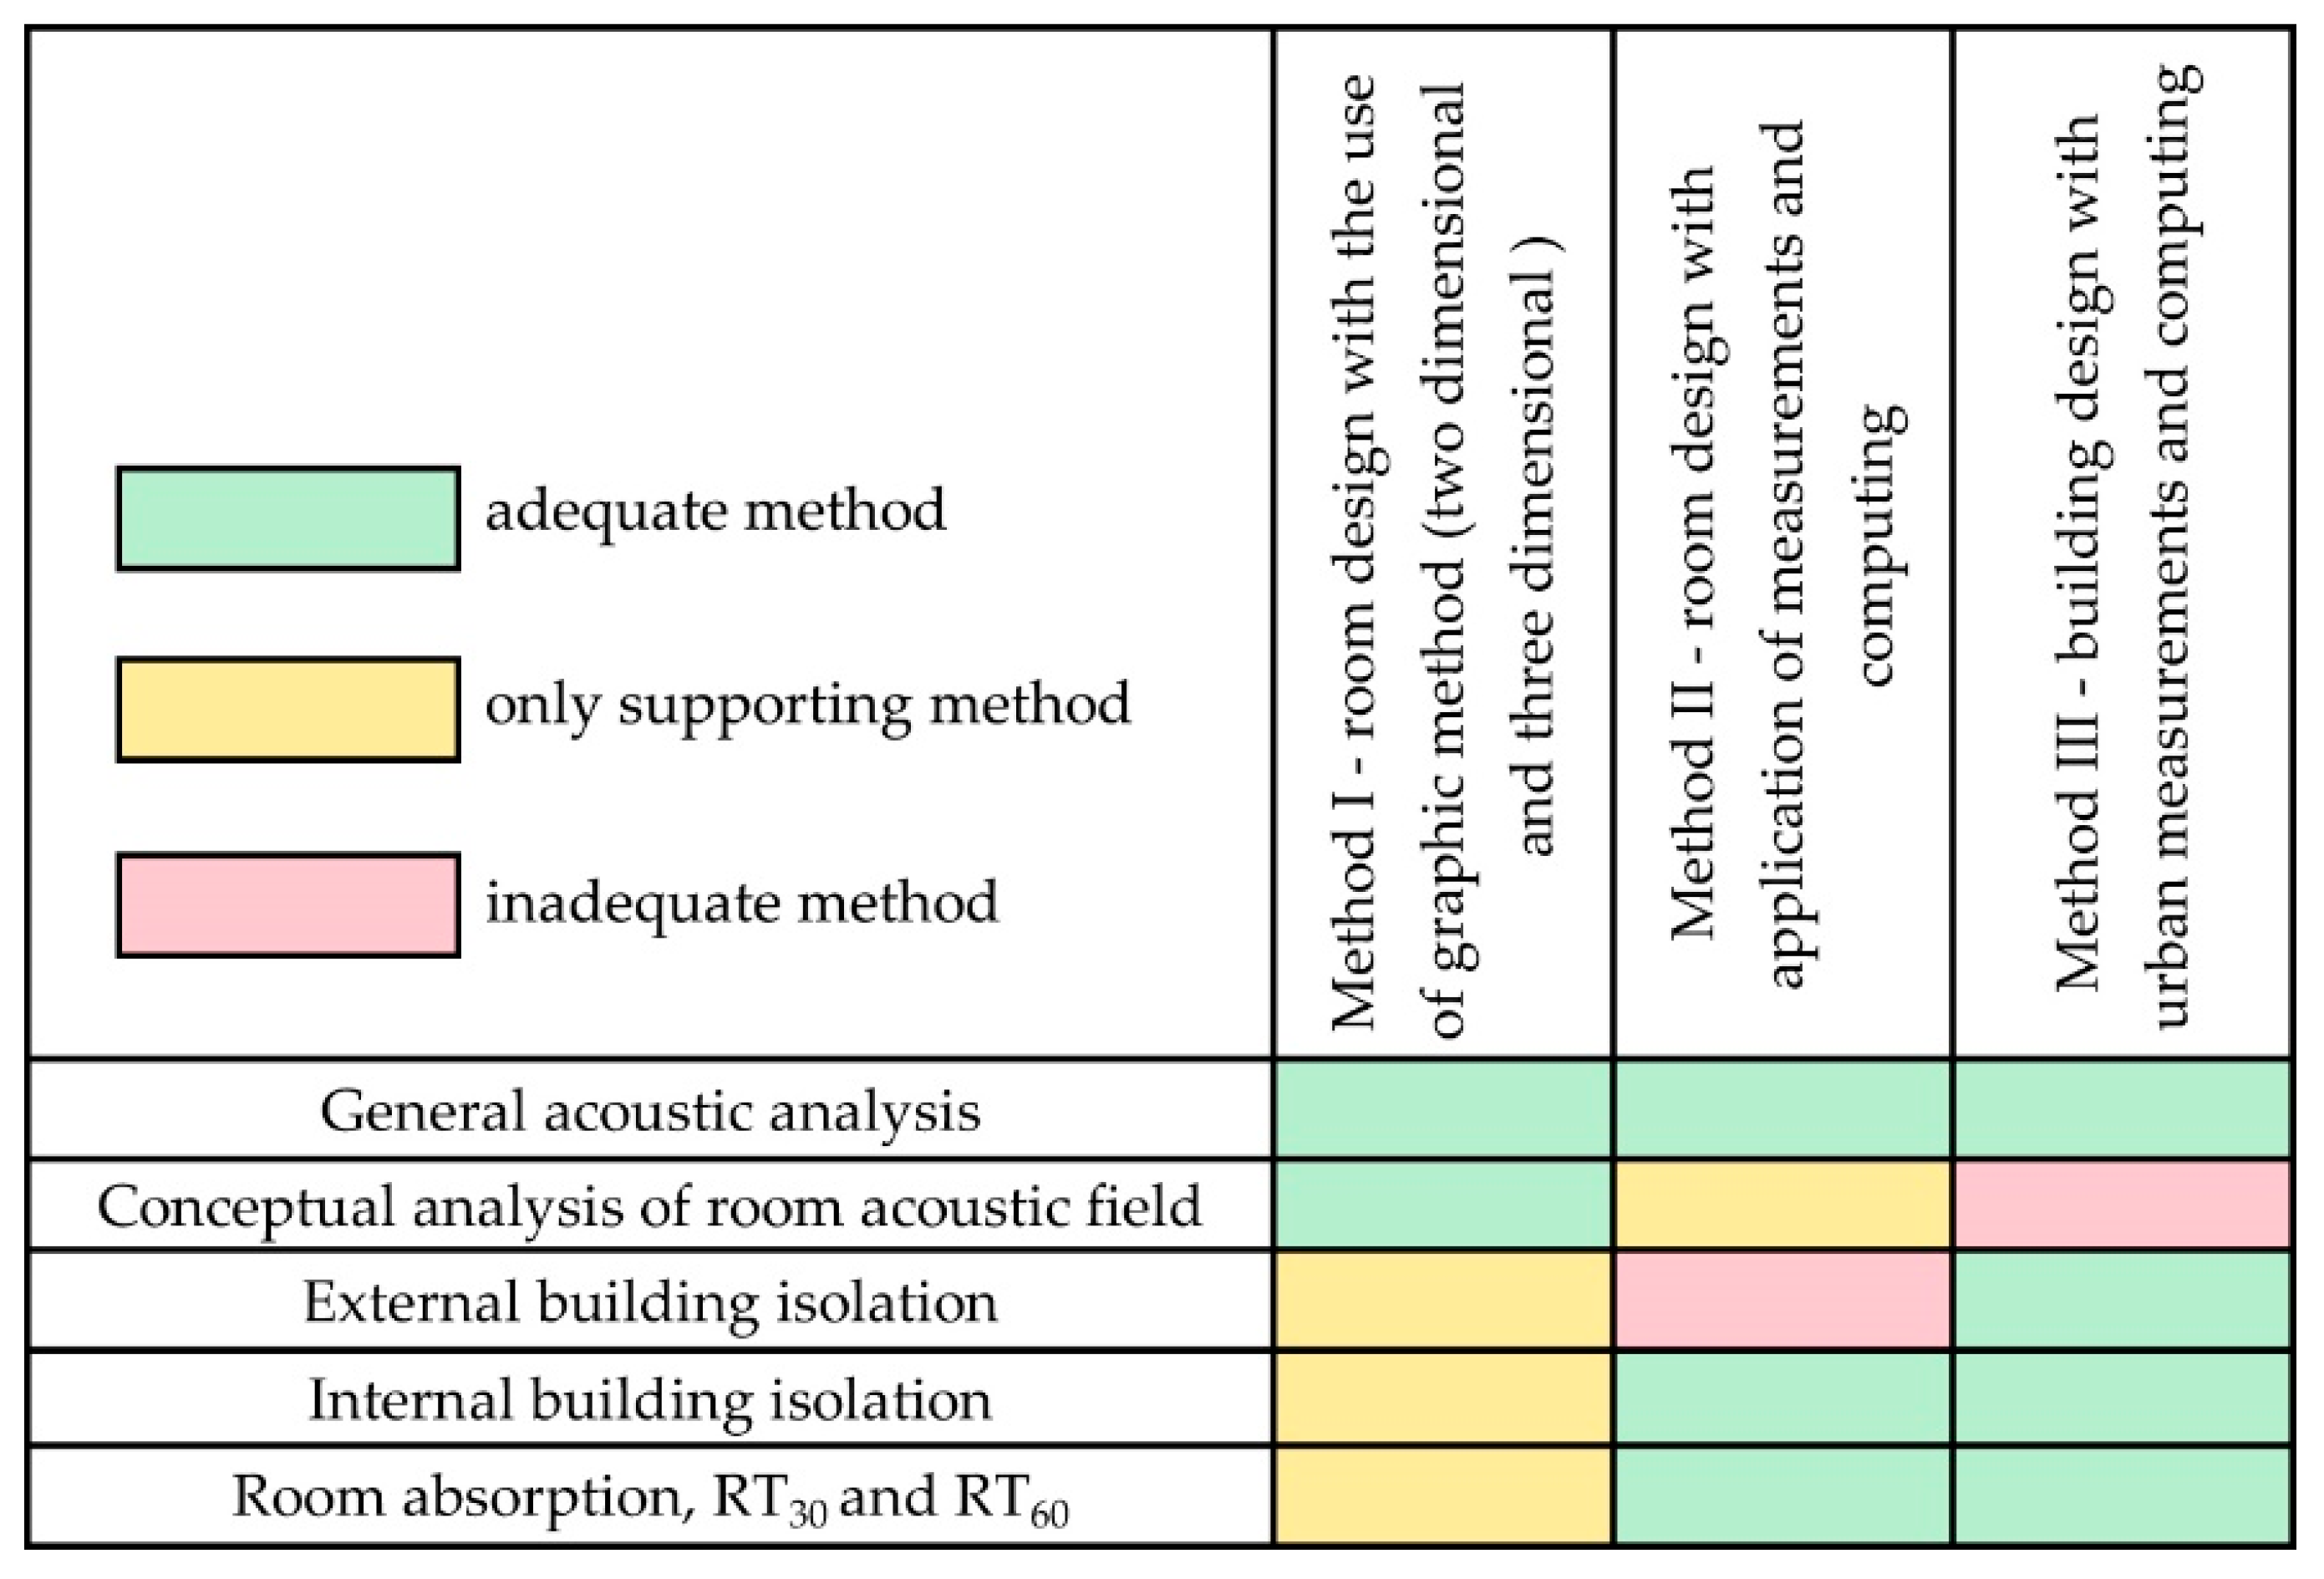
  • initial spatial geometry planning and optimization, followed by in-room finishing and fixtures selection. The design ought to result in desired reverberation time (RT30 and RT60). The problem is addressed in Section 2.2. Method I is called: room design, with the use of a graphic method (two-dimensional and three-dimensional).
  • detailed spatial geometry planning and optimization, followed by reverberation time reduction causing long-lasting so-called background noise (with overall room acoustic absorption A). The problem is addressed in Section 2.3. Method II is called: room design with the application of measurements and computing.
  • building design, with urban measurements and computing—assessing an average, equivalent external sound level LAeq—from the road, air traffic, industry, and so on, during the day and nighttime [4,16]. This is required to calculate and design external compartments of a building with optimal air and material bore sound isolation (massive isolation if needed, weighted sound reduction index from airborne sound transition Rw [22,24] for building external elements). The problem is addressed in Section 2.4. Method III is called: building design with urban measurements and computing.
For especially acoustic-sensitive projects like concert halls or recording studios [32], advanced parameters are solved, like sound clarity, intimacy and colouration, acoustic field blend, and inter-aural cross-correlation, and the issue is purposely omitted (for the clarity of the paper).

2.2. Method I

Method 1 refers to room design with the use of the graphic method (two-dimensional and three-dimensional). Software, designated to acoustic engineering like Odeon, CATT (interiors), or IMMI (acoustic maps), retires advanced expertise. Applications allow for complex room acoustic studies at facilities designated for music performances, like concert halls. Here, examples are publications by Neylor and Rindler ‘Predicting room acoustical behaviour with the ODEON computer model’ [33] or Ciaburro, Iannace, Lombardi, and Trematerra’s deep analysis in the article ‘Acoustic Design of Ancient Buildings: The Odea of Pompeii and Posillipo’ [34]. Such a level of specialization is not necessarily required or popular among a majority of architects or civil engineers. However, they are legally bound to handle urban, building, and room acoustics effectively to protect from unwanted noise and long reverberation time.
Thus, instead of advanced modelling of direct sound and reflection, these professionals may apply the graphic method. In this case, a professional using CAD tools (AutoCAD, Archicad) can draw the exact path of wave propagation. This method proved successful for experiments, planning, and teaching, and it has been used willingly in the mentioned e-books [15], books [27,28,29,30,31], and articles [32,33,37,38].
To use the method, a designer must specify three types of materials and forms. Materials can reflect, diffuse, or absorb acoustic energy due to their density and structure. Flat and convex shapes will diffuse acoustic wave bounces while concaves are focusing. In contact, an acoustic wave will reflect in a mirror manner, and be scattered, diffused, or absorbed (partially or fully). Precise graphic modelling of this two-dimensional or three-dimensional phenomena gives a firm base for architectural acoustic predictions. This method is especially effective in closed spaces (Table 1 and Table 2). An exemplary matrix has been prepared showing possible acoustic phenomena.
Late sound, from second and higher sound bounces, disturbs clarity. Namely, a balance between direct sound energy and energy from its reflections should reach a listener in 80 ms after the direct sound [28]. With simplification, acoustic energy must come fast, and their propagation way ought to be short. Valuable are lateral bounces, for our ears are on the side of a head [15,27,29]. Combining this information with knowledge from Table 1 and Table 2 is enough to architecturally plan a room designated for listening (music, lecture, or talk). An architect can design geometry and materials for walls, ceilings, floors, and interior fixtures. Next, simple calculations are enough to plan volume, RT, and audience arrangement (Figure 1). In addition, there is a modelling possibility for graphical representation of direct sound and all reflections (only for the mirror reflection type). This method also serves planning a blend of acoustic field blend [27], and if needed, re-design. It is applicable in eliminating so-called fluttering echo or focusing sound wave bounces in one place. The user plans the received sound, with areas of walls, ceilings, or floors, from which reflection is unwanted. Building models and acoustic processes are programed as two-dimensional (plans or sections) or three-dimensional drawings. More accurate visualization is possible in axonometric views and perspectives (also animations), (Figure 1, Figure 2 and Figure 3).
The graphic method for modelling architectural acoustics in two-dimensional or three-dimensional propagation of sound waves was applied successfully in our studies on concert halls. It allows one to plan, check, or correct the blend of the acoustic field. In this aspect, it is crucial to provide an even spread of first side reflections and occasionally enhance acoustic energy in specific areas. A blending of the sound field takes place in interiors with elements that disperse acoustic waves. With the scattering of different frequencies, the effect of a subjectively soft sound occurs. The phenomenon is especially beneficial in rooms for music perception. So far, the phenomenon does not have a mathematical formula [27]. Currently, it is determined using graphical methods. In concert halls with a vineyard configuration, researchers observed a higher blend than in classic box systems. To investigate, we prepared wave scattering graphs (Figure 1). They use the organic template of the vineyard concert hall compared to a shoebox-shaped hall layout. For clarity, there are direct sound waves and perfect (mirror) early reflections shown. The diagram proves a vast diversity of reflected waves directions received by a single listener in the vineyard configuration. There are also several multiple reflections. Therefore, in a terrace room, the sound field will be well-blended, and the sound will seem softer than in the box room. CAD tools that were adjusted substantially facilitated the process (a mirror, tangent, or offset functions). The timeline of examining these particular cases is hundreds of hours shorter in comparison to manual methods.
Another example of this type is the analysis of convex and concave shapes performance in the first acoustic wave propagation. In the room with concave forms, the acoustic energy focuses on the layout’s centre. The phenomenon is beneficial for the musicians on the stage who need to hear one another. In the audience, however, the focusing of acoustic waves completely disrupts the music experience. The graph also shows a significant and very unfavourable lack of side reflections. In a room with convex arched elements, acoustic wave reflections in the stage come in a dispersed array. The effect is undesirable due to the lack of sound energy around musicians and cross reflections. However, the diffusion of acoustic waves in the audience contributes to the good audibility of sound and field blend. As an outcome of the graphical analysis, the combined solution is best. The experiment allowed researchers to choose an initial concept for further development with optimal architectural acoustics (Figure 2).
CAD programs (Figure 1 and Figure 2) and parametric design computer applications (Rhino’s Grasshopper) are sufficient for such models (Figure 3). Popular BIM systems (over 80% of European architects declare knowledge of these tools [23]) also allow such programming. In parametric modelling tools based on two-dimensional and tree-dimensional graphic analyses, users operate on acoustic waves represented with points rather than lines. These applications, as well as BIM systems, require a user to define material types and allow the programming of their acoustic parameters. The rule of obtaining the designed acoustic field features is the same as for the mentioned graphic method. However, analysis can be more complex, and computing time is faster than in the CAD tools process (Figure 3). Nevertheless, two or three-dimensional model programming requires more time than a CAD tools analysis. In some cases, the linear sound wave representation is more transparent and understandable than the point one. The above-mentioned times are relative, depending on the task and user abilities.
Katunsky, Katunska, and Germanus [32] present a complex room acoustics study with the CAD tools application to three-dimensional modelling and two-dimensional representation. The authors tested a music rehearsal room for several players (a part of a larger complex), where excellence in mutual musicians hearing and maximal possible reverberance limitation is obligatory. Assumed architectural conditions arose from musicians’ comfort of movement, the need for optimal room sound isolation, and the pursuit for the high level of acoustic absorbance. With several digital models, the authors extracted and proved architectural conditions that affect acoustic in-room performance desirably.
The method application is widespread in literature and online platforms [15,28,29,32]. Yet, it is better for initial design and general representations. Calculations are more feasible to plan architectural acoustic. Parameters like:
  • reverberation time (RT),
  • room total acoustic absorption (A),
  • are basic and influence final and speech intelligibility (STI).
All three sound parameters connect to architecture in terms of spatial and material building design. Any change in the latter affects the in-room acoustic field. The issues are addressed in Section 2.3, which is devoted to method II: room design with the application of measurements and computing.

2.3. Method II

Method II involves room design with the application of measurements and computing. The RT value is dependent on a room function and is defined for each interior separately. To illustrate, a concert hall with a capacity of over 1800 viewers requires an RT value between 2.0–2.3 s [29,37]; however, a conference or lecture room with a volume in a range of 120–250 m3 needs an RT below 0.6 s [6]. The parameter is dependent on volume, absorbing elements ratio, air intake, and other factors [15,16,17,18,19,20,21] (see Formula (1)). Reaching the desired RT needs a definition of room absorption A. The Formula (1) for the parameter is simple and as follows [21]:
A   = i   = 1 n i S i + j   = 1 o A obj , j + A air
where:
n—stands for surfaces number i,
o—stands for objects number marked as j,
α—stands for absorbing coefficient of surfaces i,
Si—is a field of areas i, given in (m2),
Aobj,j—is an acoustic absorption of singular object j, in (m2),
Aair—is an acoustic absorption in (m2) of an air absorption j, given in (m2). The Aair is (2) expressed in the following formula (see Formula (2)) [21]:
A air = 4   mV
where:
m—is the power coefficient for sound absorption by air,
V—is room volume in m3.
The model reference values are a subject of law and standards [5,6,20,21,22]. The design calculations require mathematical software like Excel, Microsoft, Redmond, WA, USA or MatLab, MathWorks, Natick, MA, USA [6,21] or online calculators [40]. The latter serves as a comfortable tool in which an architect can model basic room features (material amount and placement). The software computes given data, according to the mentioned formula, in less than a minute. If the design requires corrections, those are implemented and recalculated on the same model basis.
A good example is the calculation of parameters A calculation for the conference room of volume 480 m3 w (x = 12 m, y = 8 m, z = 5 m). The first room design variant (A) is more reverberant with so-called reflecting materials. In the second example, (B) interior is suited for short reverberation time. The comparison shows substantial differences in obtained parameters, where variant A is more suitable for music and B for speech (Table 3).
For a better visibility scheme (Figure 4) shows both mentioned cases in an axonometric view. For each scenario, there is a graphic representing horizontal sound transmission at 1.25 m level. The direct sound represented by the red line reflects (green line) from the brick wall for the first time. The second bounce marks a blue length. The AutoCAD drawing visualises the decrease of acoustic energy in a room with walls covered by absorbing panels.
Inadequate values for A with misplaced absorbent material leads to fluttering echo and echo occurrence. Below there is a study of the phenomena performed with CAD tools and three-dimensional graphic software (Figure 5) for a balcony in an auditorium.
Incorrect RT and A effects the speech intelligibility and the speech transmission index (STI) measured after projects implementation. In this case, the method is highly feasible. A good example is an investigation of university rooms of volumes, accordingly 360 and 210 m3. These rooms required acoustical tuning aiming at increasing speech intelligibility. In both interiors, RT60 was excessively elongated, and our goal was to design refurbishment with the use of sound-absorbing suspended panels and wall fixtures. Examination of initial sound parameters was for RT30 with calibrated SVAN979, SVANTEK, Warsaw, Poland. Along the way were calculations made with an online calculator based on these room models. A comparison of both outcomes was assuring, so we could design refurbishment basing on a selected online calculator (for further study, this case is published in [35]), with a certainty of the final result.

2.4. Method III

Method III refers to building design with urban measurements and computing. The noise urban environment is hard to predict or control, while the influence on building acoustical performance is direct (acoustic insulation of windows, doors, walls, and roofs). The design data usually come from acoustic maps (each EU country must make up and update them [4,20]). Yet, during our practice, there were many cases where this information was insufficient. Firstly, maps are available for cities and consider only a specific, long time. Secondly, temporary construction sites, namely, newly raised investments producing high levels of LAeq like schools, children’s playgrounds, dog parks, or occasional events like open-air concerts will be invisible. Thirdly, maps inform on average year-long sound pressure; therefore, changes of traffic cycles (rush hours, detours), and local vibrations are omitted.
The measuring device is certified according to the following definition:
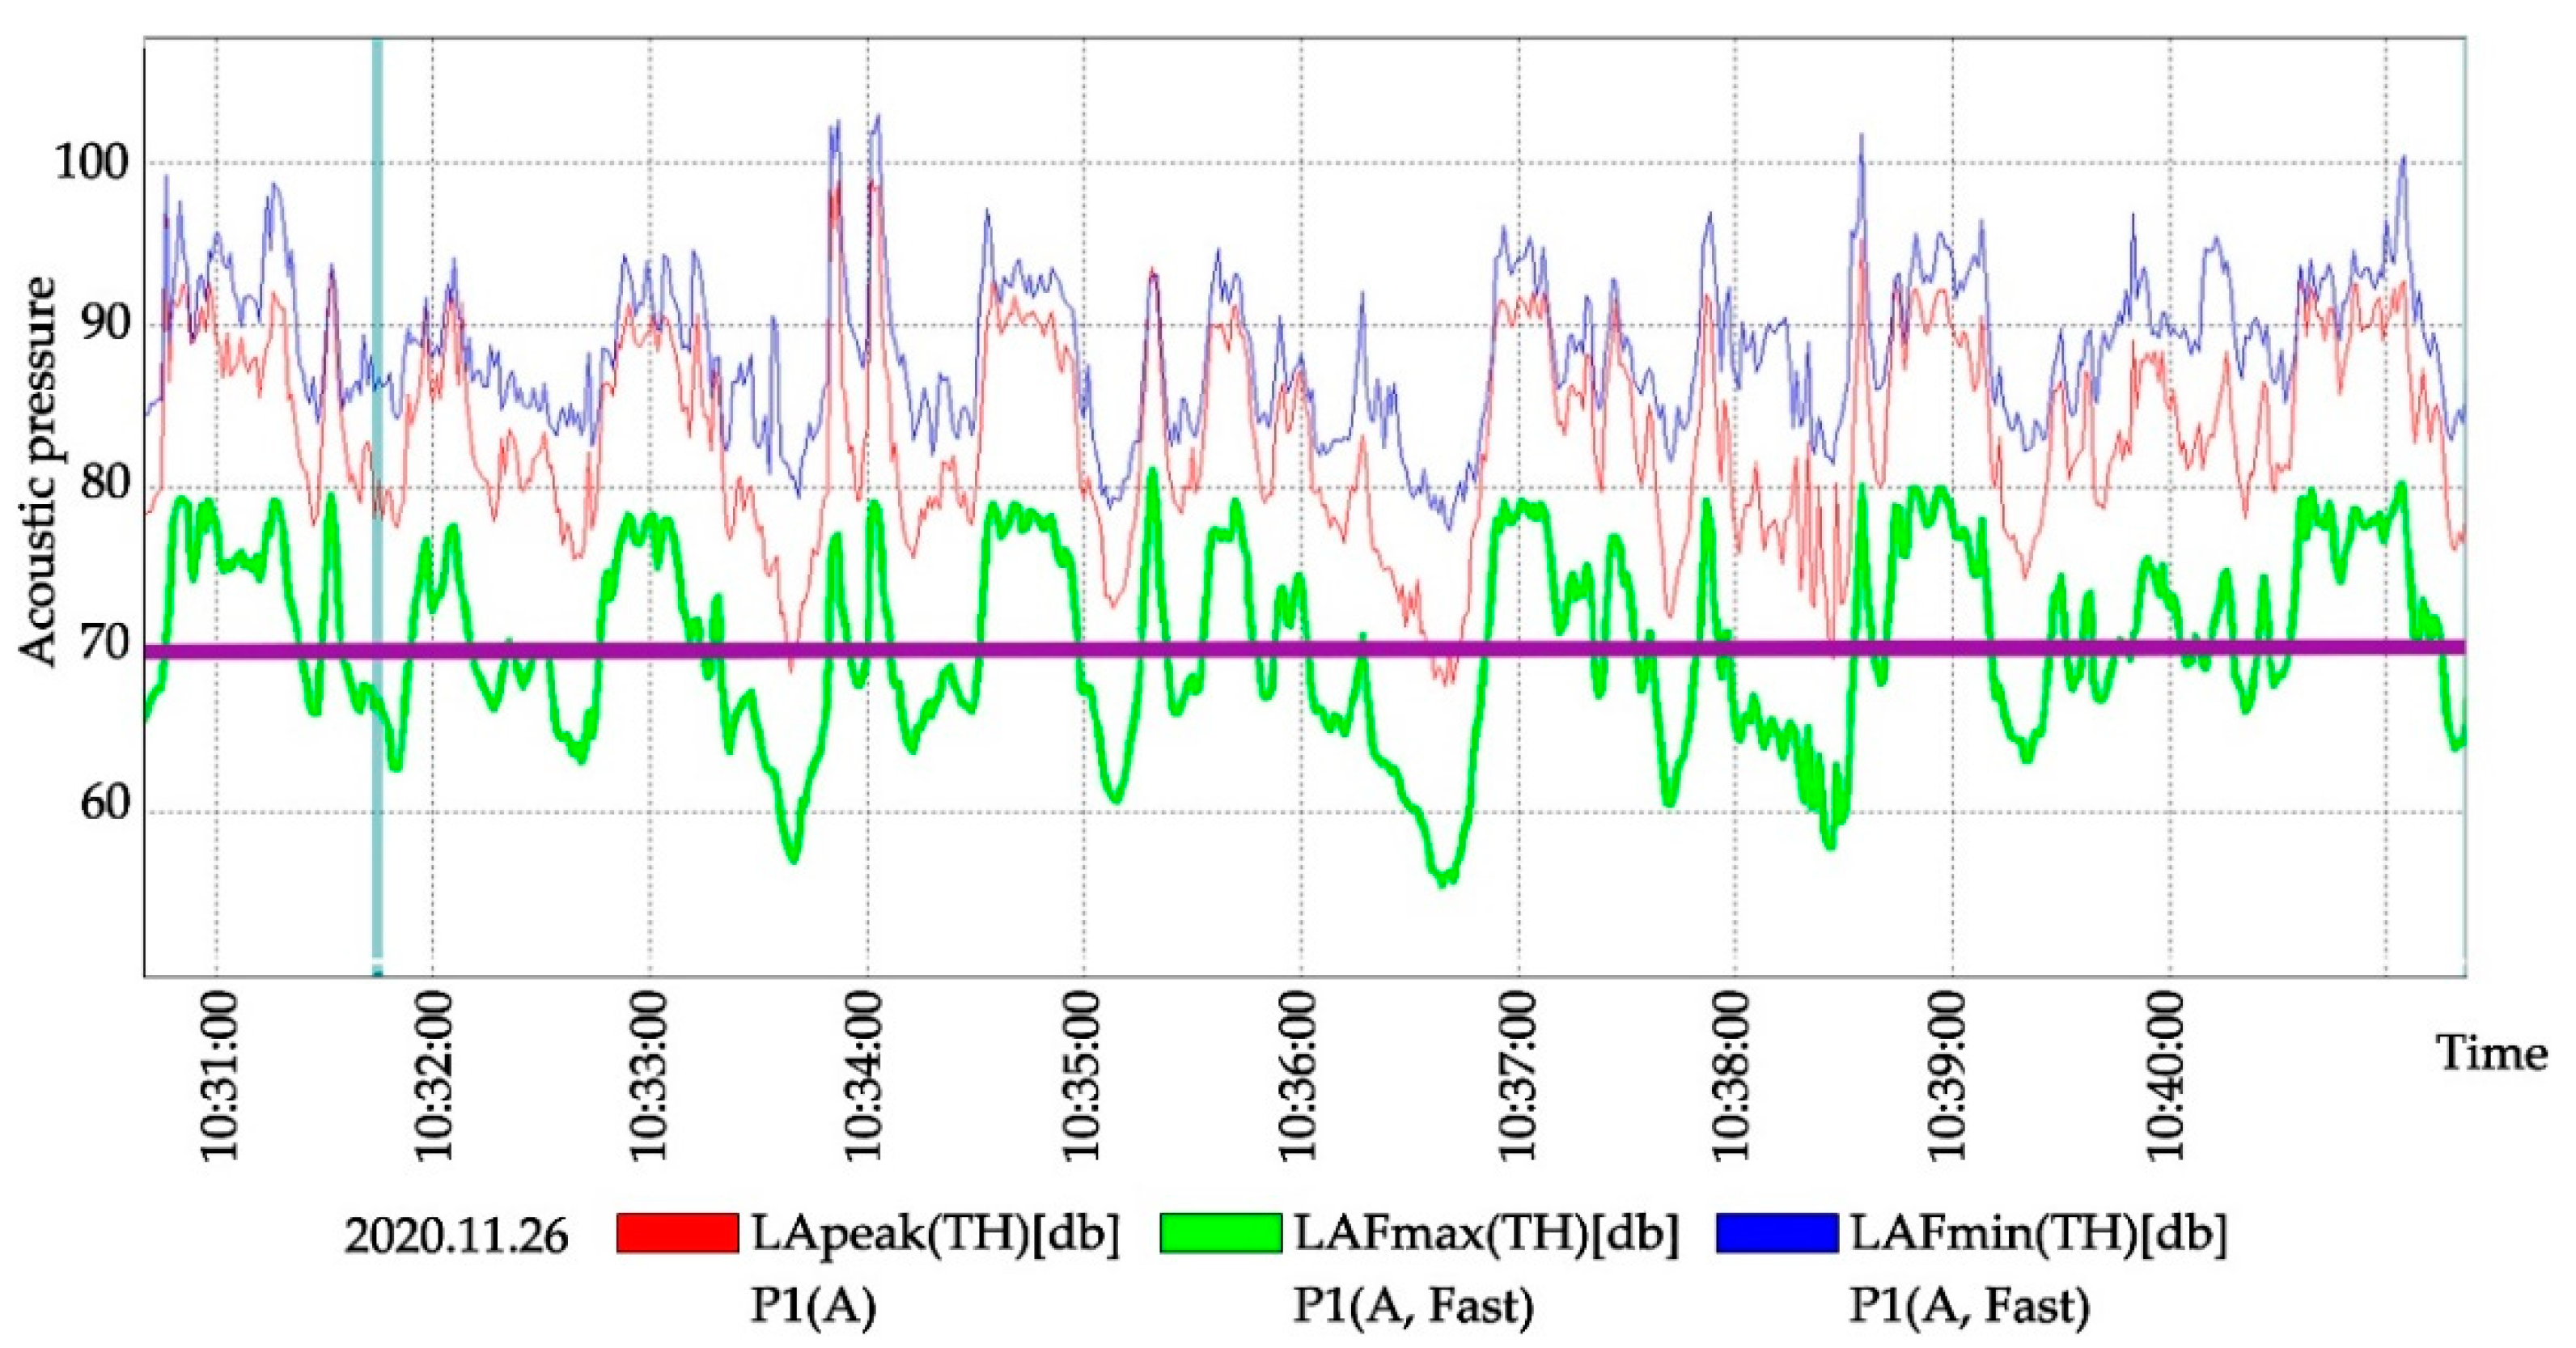
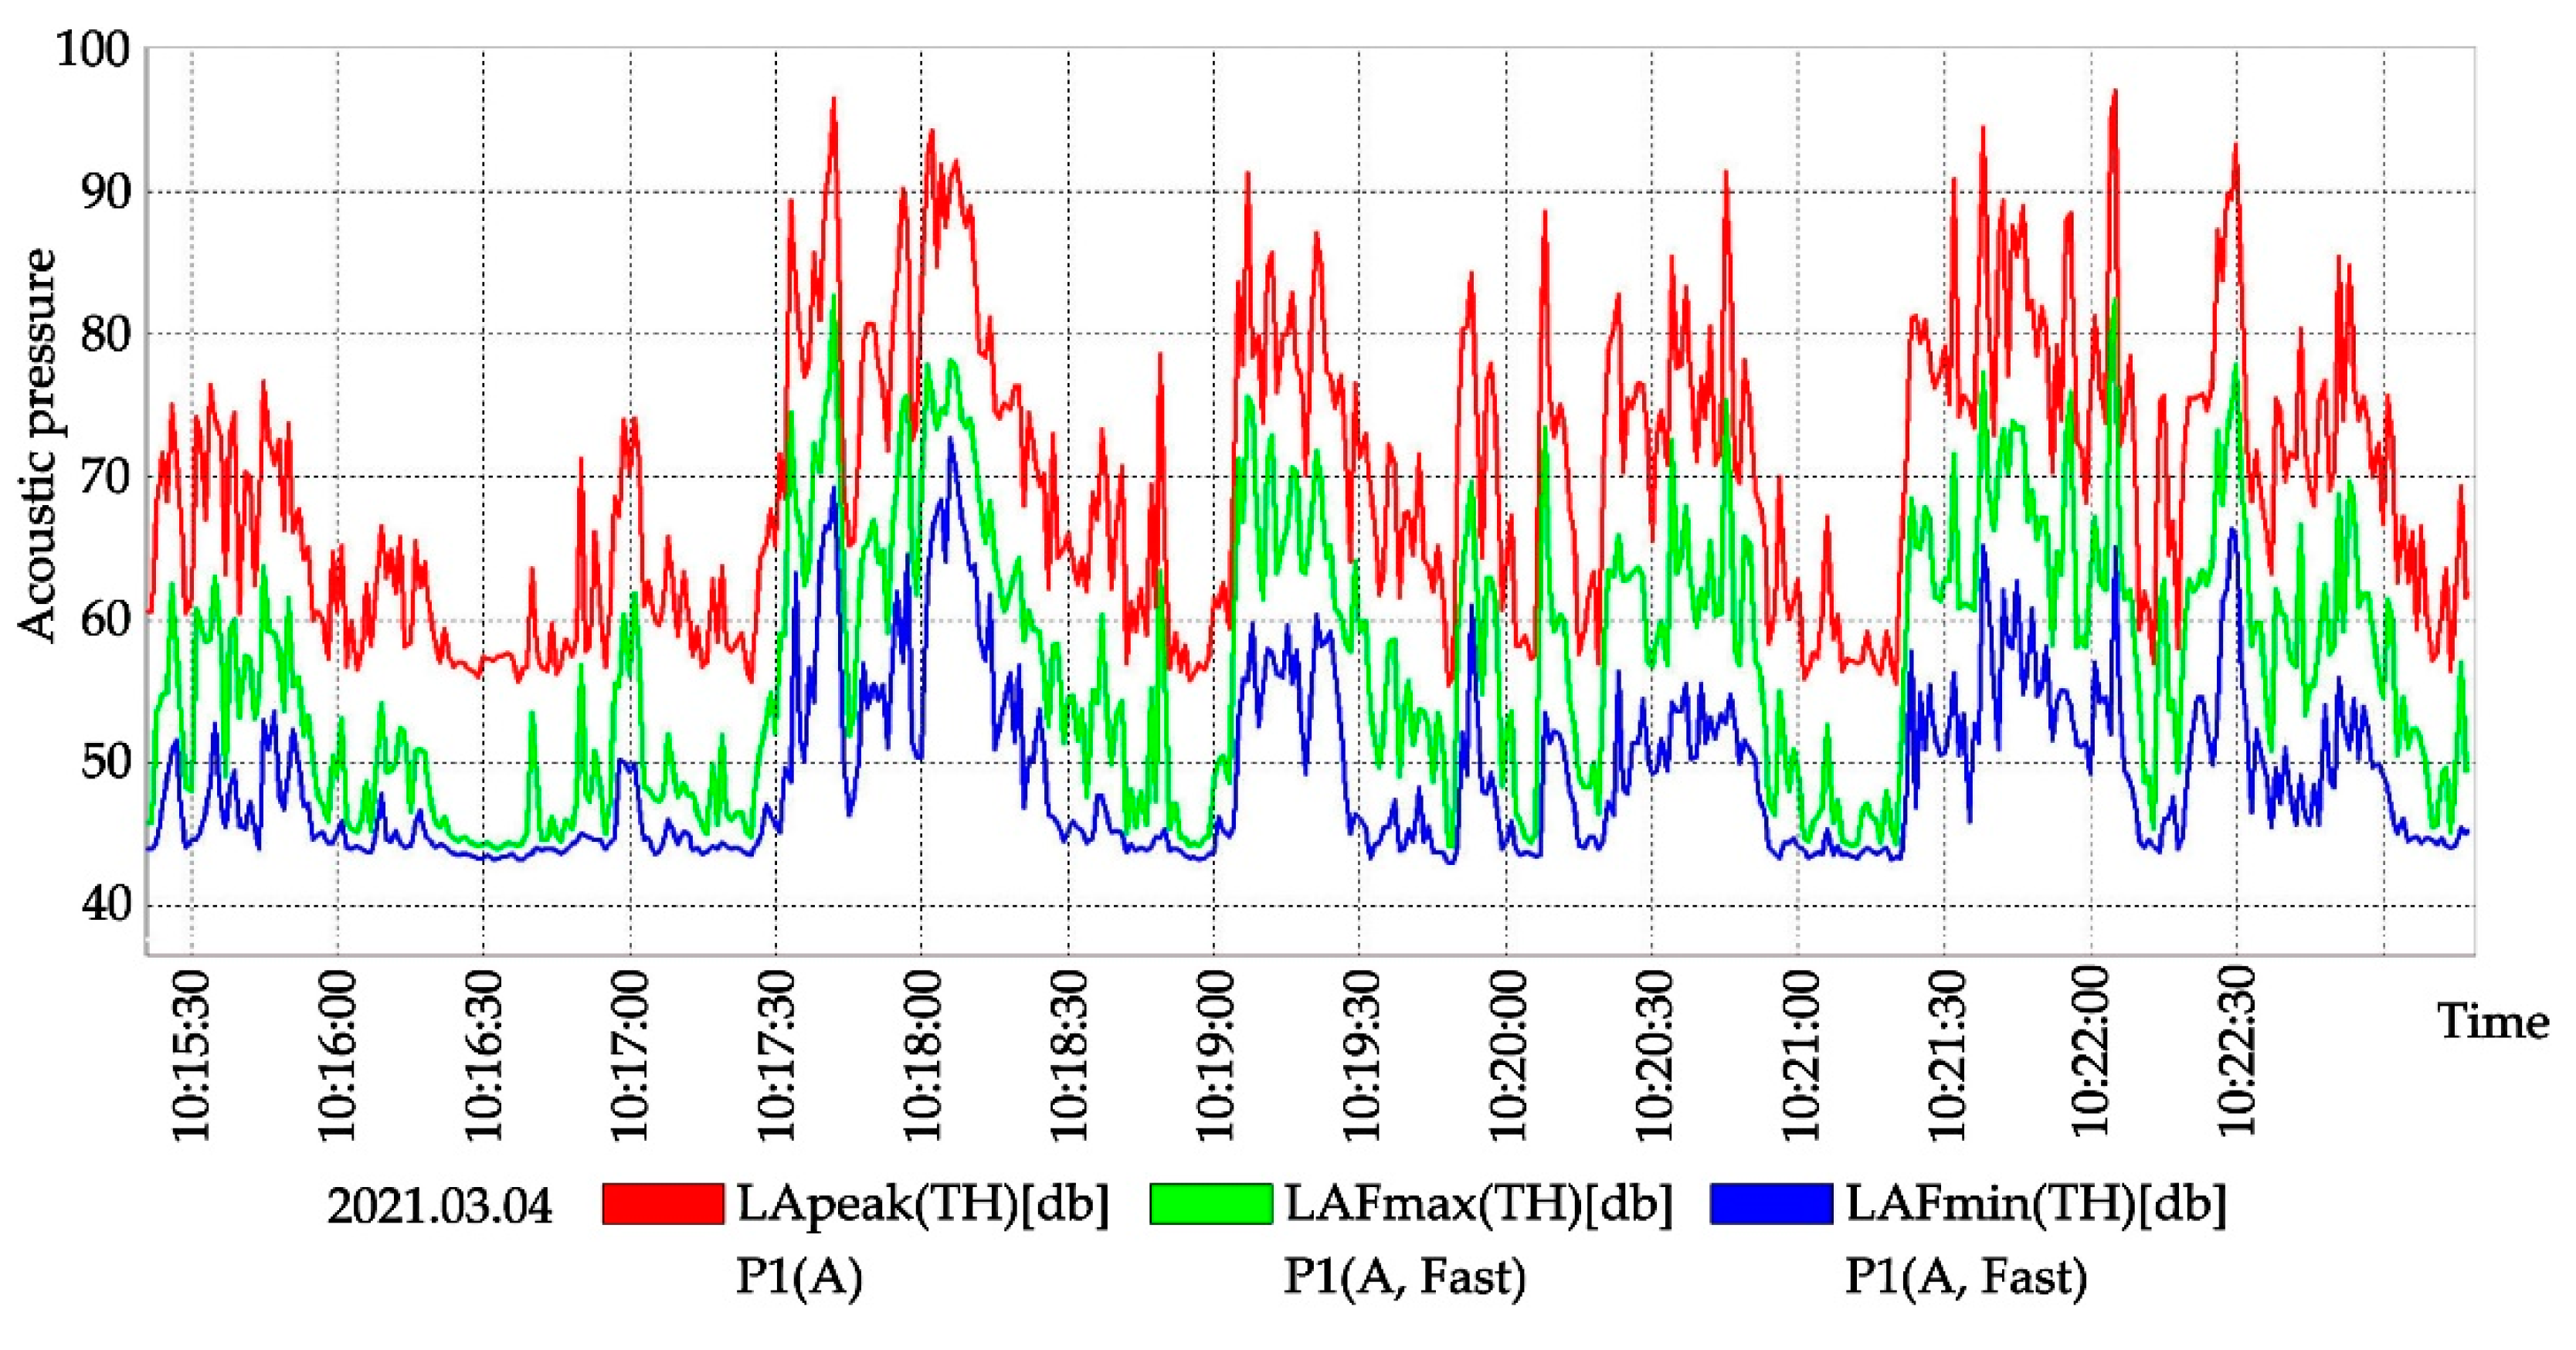
  • Equivalent sound level A, marked as LAeq: ‘is a sound level A, averaged for the observation time equal to the operating cycle of the device operation, defined in PN-EN ISO 10052 or PN-EN ISO 16032′ (self-translation) [6].
  • The maximum A-weighted sound level LApeak is: ‘the maximum A-weighted sound level measured with the time correction characteristic of the device during operation, defined in PN-EN ISO 10052 or PN-EN ISO 16032′ (self-translation) [6].
  • The maximum C-sound level LCpeak is: ‘the maximum C-sound level measured using the temporal correction characteristic, which occurs during the operation of the device, defined in PN-EN ISO 10052 or PN-EN ISO 16032′ (self-translation) [6].
The example illustrates online case studies. Residents of suburban village Kąty Wroclawskie, Poland, complained about noise from highway A4 (connecting Poland to Germany and Ukraine). The houses stand at a 500 m distance from the road, and there is no shield from noise. In the void, there is a field and some scattered greenery. The measurements on 10 November 2020 show LAeq of 55.5 dB by the house in the daytime which is an average nuisance. In the empty house with closed doors and windows, the LAeq raised to 24.9 dB in the daytime, which meets the norm [6]. However, the outside data indicate that the levels are high enough to cause user nervousness [17]. Houses in the area have gardens on this noisy side. The sound analysis in Kąty Wrocławskie proves that even following design norms may not provide residents comfort.
The second example is the on-site case studies at a commute (trams, busses, pedestrian crossings, gas station) and traffic node (transit excluded) in the city of Wroclaw (Poland, central EU). The area was busy even during the COVID-19 pandemic lockdown. Data from an acoustic map of road traffic (daytime average in a year-long period) state that LAeq for the area ranges between 70–75 dB. Levels confirm measurements carried during November and December of 2020. Interestingly, the LAeq over 70 dB lasted 50% of the measured time (Figure 6), and peak values ranged between 78–80 dB. LApeak and LCpeak were even higher and ranged between 80–100 dB. To supplement the information with a reference, LAeq over 40 dB in the city environment is unwanted [17]. The study showed that building and architectural design should not be based only on data from acoustic maps.
The third case that shows the necessity for on-site acoustic analysis and measurements comes from 9 April 2021. Work started with a pre-design study for the university building (the headquarters of Wroclaw University of Science and Technology). It concerned a roofless courtyard shielded from four sides by a massive building substance. The city’s acoustic map does not cover such spaces, showing only general information of emissions of road, tram, train, and air traffic. Thus, the map data were irrelevant for the planned design. There was an external noise coming from traffic at LAeq over 71 dB (it was higher than data from the acoustic map, though Poland was under a third pandemic lockdown). Theoretically, the LAeq should be significantly lower inside the courtyard. However, measured data revealed the level of 53 dB and a sound source that imitates a nuisance sound, possibly from an electrical transformer (Figure 7). The analysis will influence planned design substantially.
All three case studies show that building and architectural design should not be based only on data from acoustic maps. Conditions must include real-life situations, for soundscape is alive and ever-changing. Only measurements on-site and computational analysis give a base for introducing a project.
Worth mentioning is that equipment and applications for acoustics are complex. Thus, it is advised to support a project with expertise knowledge [15]. Interdisciplinary collaboration is a base for architectural or building design, so sound engineers should be present in a team from the conceptual project phase. In this method, the isolation factor (Rw) of each compartment (walls, roof, doors, windows) is computed with the use of normalized formulas or calculators for the real-life environment conditions, measured for the worst possible noise scenario. Accordingly, the building will be acoustically safe all day long.

3. Results

The summary illustrates the use for each method referring to design stages (Figure 8). The proposed matrix is not an evaluation but serves to highlight practicality and purpose. This matrix addresses professionals and academics interested in CAD tools and computing. It is valid for both design and post-investment tasks related to architectural and building acoustics. As a next step, a second matrix shows links between computer tools and design stages (Figure 9).

4. Conclusions

The leading conclusion states that architecture and building geometry, and material solution directly connect to room acoustics. Space and sound mutually influence one another. Architects and civil engineers can and are legally bound to provide optimal and safe acoustic conditions. Failure to use the graphic method supported with CAD tools in the first phase of the project results in incorrectly planned geometry and poorly spaced or erroneously selected materials. Interiors designed without the awareness of direct sound and its first reflections propagation usually have a too long reverberation time. In such rooms, speech is illegible, and music misses the articulation. When the reflected acoustic wave does not enhance the direct sound, conversation or speech is hard to follow (STI requirement is not met). When the designer omits the basic computing of the room’s acoustic field, the reverberation time (RT) and acoustic absorption (A) will be incorrect. The problem is registered frequently in kindergartens and schools, sports halls, and health care posts, namely all places where acoustics seems less crucial than sanitary restrictions and ease of cleaning. Yet, elongated RT and insufficient A are a direct cause of reverberation noise and excessive multiplication of air-borne sounds. In effect, children suffer from noise during their learning process, and patients require a longer recovery time. Finally, improper analysis of external LAeq effects in incorrect building sound isolation deepens all mentioned problems.
All these health and wellbeing threats will decrease if the design process, at all its phases, includes acoustic planning supported with CAD tools and computing. The investigation proves the great applicability of computer-aided design (CAD) tools, software computing, and acoustic measurements in architectural and building design. Importantly, most professional practices already use the CAD tools needed for the process.
There are three basic methods for architectural and built acoustic study for designers according to available digital platforms. They are based on CAD graphic representations supported with standardised calculations. Their applicability in proposed forms confirmed our case studies presented in paragraph 2 and Figure 1, Figure 2, Figure 3, Figure 4, Figure 5, Figure 6 and Figure 7. Their scientific and standardised correctness and usefulness will be proven through real-environment practice. Two graphic matrixes visualise the process and enable easy methods and tool selection. The first one involves combining CAD and computing methods with architectural and building acoustics applications: Matrix I (Figure 8). The second one links the CAD and computing tools with applications in architectural and building acoustics design phases: Matrix II (Figure 9).
As mentioned in the introduction predicted by Hearn [3], specialisation is the reality of contemporary architectural, urban, and civil engineering offices. The building market requires a vast amount of expert-level knowledge in design and acoustics among others. Thus, the last conclusion is that architecture, building, and civil engineering professionals can successfully use owned digital tools for acoustic solutions. The article provides scientific knowledge for existing CAD and computing tools, presenting proven and sound methods that are easily applicable. The article contributes to optimal acoustic solutions’ popularisation among the built environment professionals and aims at educating interdisciplinary researchers. It is also designated for those scientists who work on the meeting of acoustics and architecture. Ergo, there is a chance for building environment professionals to positively affect human health and the natural environment, providing a safe and popular soundscape on a daily basis. The use is simple, and the correctness of the methods is confirmed and highlighted in the article.

Author Contributions

J.J. and R.C.: conceptualization, methodology, software, validation, formal analysis, investigation, resources, data curation, writing—original draft preparation, writing—review and editing, visualization, supervision, project administration, funding acquisition. All authors have read and agreed to the published version of the manuscript.

Funding

The Polish Ministry of Education and Science.

Institutional Review Board Statement

Not applicable.

Data Availability Statement

Not applicable.

Conflicts of Interest

The authors declare no conflict of interest.

References

  1. Jia, M.; Srinivasan, R.; Ries, R.J.; Bharathy, G.; Weyer, N. Investigating the Impact of Actual and Modeled Occupant Behavior Information Input to Building Performance Simulation. Buildings 2021, 11, 32. [Google Scholar] [CrossRef]
  2. Feng, D.-C.; Xiong, C.-Z.; Brunesi, E.; Parisi, F.; Wu, G. Numerical Simulation and Parametric Analysis of Precast Concrete Beam-Slab Assembly Based on Layered Shell Elements. Buildings 2021, 11, 7. [Google Scholar] [CrossRef]
  3. Hearn, G. The Future of Creative Work: Creativity and Digital Disruption; Edward Elgar Publishing: Cheltenham, UK, 2020. [Google Scholar]
  4. The NOISE Observation & Information Service for Europe. European Environmental Agency (EEA). Available online: https://noise.eea.europa.eu/ (accessed on 25 January 2021).
  5. ISO/TC 43/SC 2. Building Acoustics. Available online: https://www.iso.org/committee/48558.html (accessed on 25 January 2021).
  6. PN-B-02151-2:2018-01. Polish Norm. Requirements regarding acceptable sound level in rooms determines the maximum noise levels A of noise in rooms intended for human stay—In residential buildings, residential buildings and public buildings, manufactured by technical equipment of buildings, flats and service rooms and caused by the operation of service premises. In Building Acoustics; PKN: Warsaw, Poland, 2018. [Google Scholar]
  7. Climent, M.Á.; Miró, M.; Carbajo, J.; Poveda, P.; de Vera, G.; Ramis, J. Use of Non-Linear Ultrasonic Techniques to Detect Cracks Due to Steel Corrosion in Reinforced Concrete Structures. Materials 2019, 12, 813. [Google Scholar] [CrossRef] [PubMed] [Green Version]
  8. Pereira, M.; Carbajo, J.; Godinho, L.; Amado-Mendes, P.; Mateus, D.; Ramis, J. Acoustic behavior of porous concrete. Characterization by experimental and inversion methods. Mater. Construcción 2019, 69, e202. [Google Scholar] [CrossRef]
  9. Bullová, I.; Kapalo, P.; Katunský, D. Quantification of Air Change Rate by Selected Methods in a Typical Apartment Building. Buildings 2021, 11, 174. [Google Scholar] [CrossRef]
  10. Azkorra, Z.; Pérez, G.; Coma, J.; Cabeza, L.F.; Bures, S.; Álvaro, J.E.; Erkoreka, A.; Urrestarazu, M. Evaluation of green walls as a passive acoustic insulation system for buildings. Appl. Acoust. 2015, 89. [Google Scholar] [CrossRef] [Green Version]
  11. Persson, P.; Flodén, O.; Danielsson, H.; Peplow, A.; Andersen, L.V. Improved low-frequency performance of cross-laminated timber floor panels by informed material selection. Appl. Acoust. 2021, 179. [Google Scholar] [CrossRef]
  12. Nurzyński, J. Sound insulation of bulkhead panels. Appl. Acoust. 2021, 179. [Google Scholar] [CrossRef]
  13. Katunský, D.; Katunská, J.; Bullová, I.; Germánus, R. Problems in the Designing of Acoustic Properties of Musical Rehearsals. Appl. Mech. Mater. 2017, 861, 519–526. [Google Scholar] [CrossRef]
  14. Cerdá, S.; Segura, J.; Giménez, A.; Barba, A.; Cibrián, R. Optimal Volume for Concert Halls Based on Ando’s Subjective Preference and Barron Revised Theories. Buildings 2014, 4, 60–68. [Google Scholar] [CrossRef] [Green Version]
  15. ArAc Multibook, International Partnership ArAc Multibook 2015. Available online: https://arac-multibook.com/ (accessed on 28 January 2021).
  16. Gray, A. These Are the Cities with the Worst Noise Pollution. World Economic Forum. 2017. Available online: https://www.weforum.org/agenda/2017/03/these-are-the-cities-with-the-worst-noise-pollution/ (accessed on 23 November 2019).
  17. Noise. WHO 2021. Available online: https://www.euro.who.int/en/health-topics/environment-and-health/noise/noise (accessed on 4 January 2020).
  18. Occupational Safety and Health Standards no. 1910.95. Occupational Noise Exposure. OSHA 2008. Available online: https://www.osha.gov/laws-regs/regulations/standardnumber/1910/1910.95 (accessed on 22 October 2019).
  19. Traffic Noise: Exposure and Annoyance, European Environment Agency. EEA 2001. Available online: https://www.eea.europa.eu/data-and-maps/indicators/traffic-noise-exposure-and-annoyance/noise-term-2001 (accessed on 4 September 2019).
  20. Directive 2002/49/EC of the European Parliament and of the Council of 25 June 2002 Relating to the Assessment and Management of Environmental Noise—Declaration by the Commission in the Conciliation Committee on the Directive relating to the Assessment and Management of Environmental Noise. Off. J. L 2020, 189, 12–26. Available online: https://eur-lex.europa.eu/legal-content/EN/TXT/HTML/?uri=CELEX:32002L0049&from=EN (accessed on 4 September 2019).
  21. PN-B-02151-4 Polish Norm. Protection from Noise in Buildings, Part 4: Requirements for reverberation conditions and speech intelligibility in rooms with guidelines for conducting research—self-translation from Polish. In Building Acoustics; Polish Committee for Standardization (PKN): Warsaw, Poland, 2015. [Google Scholar]
  22. PN-B-02151-3:2015-10 Polish Norm. Part 3: Requirements for sound insulation of partitions in buildings and elements. In Building Acoustics; Polish Committee for Standardization (PKN): Warsaw, Poland, 2015. [Google Scholar]
  23. ACE Observatory—Home—Europe 2018. ACE 2018. Available online: https://aceobservatory.com/Home.aspx?Y=2018&c=Europe&l=EN (accessed on 27 January 2021).
  24. Granzotto, N.; Di Bella, A. Analysis Between Weighted Sound Reduction Index according to ISO 717-1 and Indices according to ISO 16717-1. In Proceedings of the Conference A.I.A.—D.A.G.A., Merano, Italy, 15–17 March 2013; Available online: https://www.researchgate.net/publication/255721694 (accessed on 16 June 2020).
  25. Torresin, S.; Albatici, R.; Aletta, F.; Babich, F.; Oberman, T.; Siboni, S.; Kang, J. Indoor soundscape assessment: A principal components model of acoustic perception in residential buildings. Build. Environ. 2020, 182, 1–16. [Google Scholar] [CrossRef]
  26. Everest, A.F.; Pohlmann, C.K. Master Handbook of Acoustics; McGraw-Hill Education TAB: New York, NY, USA, 2014. [Google Scholar]
  27. Kulowski, A. Akustyka sal; Publishing house of the Gdańsk University of Technology: Gdansk, Poland, 2011. [Google Scholar]
  28. Barron, M. Auditorium Acoustics and Architectural Design; Taylor & Francis: London, UK, 1993. [Google Scholar]
  29. Beranek, L. Concert and Opera House. How They Sound; Acoustical Society of America: Woodbury, NY, USA, 1996. [Google Scholar]
  30. Boulet, M.-L.; Moissinac, C.H.; Soulignac, F. Auditoriums; Editions du Monitour: Paris, France, 1990. [Google Scholar]
  31. Cavanaugh, W.J.; Wilkes, J.A. Architectural Acoustics: Principles and Practice; John Wiley & Sons: New York, NY, USA, 1999. [Google Scholar]
  32. Katunsky, D.; Katunska, J.; Germanus, R. Protecting the Internal Environment of the Music Rehearsal. In Proceedings of the 16th International Multidisciplinary Scientific GeoConference SGEM 2016, Albena, Bulgaria, 30 June–6 July 2016; pp. 635–642. [Google Scholar] [CrossRef]
  33. Naylor, G.; Rindel, J.H. Predicting room acoustical behavior with the ODEON computer model. J. Acoust. Soc. Am. 1992, 92. [Google Scholar] [CrossRef] [Green Version]
  34. Ciaburro, G.; Iannace, G.; Lombardi, I.; Trematerra, A. Acoustic Design of Ancient Buildings: The Odea of Pompeii and Posillipo. Buildings 2020, 10, 224. [Google Scholar] [CrossRef]
  35. Jablonska, J. Architectural acoustics and speech legibility in university environment—case study. Appl. Acoust. 2021, 177, 107917. [Google Scholar] [CrossRef]
  36. Trocka-Leszczynska, E.; Jablonska, J. Contemporary architectural design of offices in respect of acoustics. Appl. Acoust. 2021, 171, 107541. [Google Scholar] [CrossRef]
  37. Jablonska, J. Architectural acoustics in vineyard configuration concert hall. J. Archit. Eng. Technol. 2018, 7, 1–6. [Google Scholar] [CrossRef]
  38. Jablonska, J.; Furmanczyk, J. Concert halls development in respect of architectural acoustics. In Architecture in Perspective 2020, 12th ed.; Peřinková, M., Jüttnerová, S., Videcká, L., Eds.; Technicka Univerzita: Ostrava, Czech Republic, 2020; pp. 345–350. [Google Scholar]
  39. SVAN 979 Class 1 Sound & Vibration Analyser. Available online: https://svantek.com/products/svan-979-class-1-sound-vibration-level-meter/ (accessed on 16 June 2020).
  40. The Rigips Saint-Gobain Calculator, for Computing Online Calculator Was Used Provided by Rigips Saint-Gobain Platform Referring Directly to Polish Standard: PN-B-02151-4. Available online: https://poglos.rigips.pl/ (accessed on 16 June 2020).
Figure 1. Two-dimensional graphical analysis of the acoustic field blend (left—shoebox shape hall, right—vineyard configuration) with the CAD tools (own elaboration, AutoCAD, Autodesk, San Rafael, CA, USA).
Buildings 11 00235 g001
Figure 2. Geometric room optimization in respect of graphic architectural acoustical analysis with the CAD tools (own elaboration, AutoCAD, Autodesk, San Rafael, CA, USA).
Buildings 11 00235 g002
Figure 3. Sound propagation simulation in an acoustic mirror. Three phases, from pulse activation, wave reflection, to reflected wave propagation (elaboration by Dawid Szewczuk, Pachyderm Acoustic Simulation, Arthur, for Rhino, Robert McNeel & Associates, Seattle, WA, USA).
Buildings 11 00235 g003
Figure 4. Representation of acoustic energy reduction in a room with absorbing panels (self-elaboration, AutoCAD, Autodesk, San Rafael, CA, USA).
Buildings 11 00235 g004
Figure 5. Representation of fluttering echo and echo for a balcony in an auditorium due to insufficient A and specific geometry (self-elaboration, AutoCAD, Autodesk, San Rafael, CA, USA and 3dsMax, Autodesk, San Rafael, CA, USA).
Buildings 11 00235 g005
Figure 6. LAeq (green line) with 70 dB level cut off (purple line) on 26 November 2020 at point 51°07’53.4′′ N 17°03’44.0′′ E (own elaboration, SvanPC++, SVANTEK, Warsaw, Poland, Photoshop CS3, Adobe, San Jose, CA, USA).
Buildings 11 00235 g006
Figure 7. LAeq (green line) on 9 April 2021 at a university courtyard for an approximately eight minute timeline (own elaboration, SvanPC++, SVANTEK, Warsaw, Poland, Photoshop CS3, Adobe, San Jose, CA, USA).
Buildings 11 00235 g007
Figure 8. Matrix I, combining CAD and computing methods with applications in architectural and building acoustics (self-elaboration).
Buildings 11 00235 g008
Figure 9. Matrix II, combining CAD and computing tools with applications in architectural and building acoustics design phases (self-elaboration).
Buildings 11 00235 g009
Table 1. The relation of material and form affecting an acoustic wave behaviour after wave bounces into the obstacle (self-elaboration, based on data [15,26,27]) 1.
Material DensitySurface TypeAcoustic Phenomenon
concrete—dense, consistent (density 2000–2600 kg/m3)Evenmirror (the angle of incidence equals the angle of reflection)
concrete—dense, consistent (density 2000–2600 kg/m3)even, concavediffused in a mirrored manner (as aforementioned)
concrete—dense, consistent (density 2000–2600 kg/m3)uneven (irregularities)scattered (energy of wave is spread in varied directions)
mineral wool—soft, porous, light (density 70–120 kg/m3)soft, fibrousweak or none (wave energy absorbed by in-material tension)
1 The table does not present complex phenomena like maximum length sequence diffusers or Helmholtz resonator systems (due to article clarity and quantity limitations).
Table 2. Surface geometry and acoustic wave reflections (self-elaboration, based on data [15,26,27] and Table 1) 1.
ShapeAcoustic Wave ReflectionAcoustic Phenomenon
convex arcspread evenlyblended, even acoustic field
linearspread evenlyeven acoustic field
concave arcfocused on one pointuneven: weak or enhanced (usually unwanted)
straight anglespread evenlyblended, even acoustic field
Bezier curve, convexspread evenlyblended, even acoustic field
Bezier curve, concavefocused in a certain areauneven: weak or enhanced (usually unwanted)
1 The table presents general rules, not complex phenomena like fluttering echo or compound spatial arrangements.
Table 3. Room absorption A. The comparison of room absorption A for the conference room (volume 480 m3)—design variant A and design variant B (self-elaboration, computing with online calculator [40]).
ParameterDesign Variant ADesign Variant B
Floorwooden parquetwooden parquet
CeilingSuspended absorbent panels with 0.5 mm of mineral woolSuspended absorbent panels with 0.5 mm of mineral wool
The front wall of 40 m2Raw brickRaw brick
The sidewall of 60 m2Raw brickAbsorbent wall panels with 0.5 m of mineral wool
The back wall of 40 m2Raw brickAbsorbent wall panels with 0.5 m of mineral wool
The sidewall of 60 m2GlazingGlazing
Acoustic absorption A for frequency of 125 Hz76.44 m2115.44 m2
Acoustic absorption A for frequency of 1000 Hz85.36 m2141.36 m2
Acoustic absorption A for frequency of 4000 Hz103.20 m2136.20 m2
Average RT600.92 s0.57 s
RT60 for frequency 125 Hz0.99 s0.67 s
RT60 for frequency 1000 Hz0.90 s0.54 s
RT60 for frequency 4000 Hz0.74 s0.56 s
Publisher’s Note: MDPI stays neutral with regard to jurisdictional claims in published maps and institutional affiliations.

