Article

Mean Operating Temperature (MOT) of Commercial Roof Assembly and Its Impact on the Energy Performance

National Research Council Canada, Ottawa, ON K2J5N8, Canada
*
Author to whom correspondence should be addressed.
Buildings 2021, 11(5), 216; https://doi.org/10.3390/buildings11050216
Submission received: 8 April 2021 / Revised: 6 May 2021 / Accepted: 10 May 2021 / Published: 20 May 2021

Abstract

:
In the thermal design of low sloped roofing assemblies, two parameters are overlooked, one is the surface temperature of the roof assemblies which provides the required temperature gradient for heat flow, and the other is the mean operating temperature of the roof assembly, which has direct implications on the thermal performance of the insulation. An in situ field study was conducted in collaboration with Alberta Roofing Contractors Association (ARCA) on their headquarters building located in Calgary, to generate data on the mean operating temperature of the roof assemblies and to determine whether the thermal design of roofing assemblies using conventional methods is an accurate portrayal of in-service thermal performance. For the present study, two roof assemblies insulated with polyisocyanurate insulation, one with a white reflective roof membrane and the other with the black membrane were selected and instrumented. During the monitoring period, the mean operating temperature (MOT) of the roof assembly whether it is calculated as the average of interior and exterior ambient (MOTAIR,) or the average of surface temperatures (MOTSurface), was found to be below 24 °C (75 °F), which opposes the current roof thermal designs that are being designed using label R-value (thermal resistance) of the insulation reported at the mean temperature of 24 °C (75 °F) rather than temperature-dependent thermal resistance. The comparison of two energy transfer theoretical models, QConvention and QMOT, with the measured data indicated that the conventional approach of roof thermal design underestimates the energy performance of the roof assembly on average by 30%. The use of roof surface temperatures and the corresponding temperature-dependent thermal resistance of the insulation as in QMOT has been demonstrated to improve predictions of the energy performance. In addition the loss in thermal resistance due to blowing agent diffusion in polyisocyanurate was evaluated after two years of in situ installation.

1. Introduction

With the advent of anthropomorphic climate change caused by GHG emissions resulting in increased global temperatures there has been an increased effort to reduce GHG emissions by reducing energy consumption in the building sector and an increased demand to make building envelopes more resilient to worsening thermal conditions [1,2]. Roofs typically represent a large portion of the commercial building envelope, particularly in low-rise construction. In light of the declining energy resources concurrent with escalating energy costs, their effect on energy consumption and environmental control is very important. Therefore, when it concerns the roofing component of the building envelope the current and still most effective way of reducing the building energy demand remains to be the effective use of insulating materials, however alternative approaches including green rooftops, reflective rooftops “cool roofs,” smart buildings, and others have shown promise as supplementary methods of reducing energy consumption [3,4,5]. As far as codification systems for building construction most countries have relatively developed codes in terms of envelope performance insulating targets [6]. Most of these codes recommend using thicker layers of insulation which leads to larger volumes of low thermal conductance. In order to select the appropriate thickness of insulation, the effective operating behavior of common insulation materials needs to be properly reflected in the design procedures.
Thermal performance building assemblies is evaluated using the concept of thermal conductivity which can be derived using the Fourier’s law of heat transfer:
Q = λ   T X
where Q is the heat flux (W·m−2), T X   is the temperature gradient across a material layer (K·m−1), and λ is thermal conductivity (W·m−1·K−1). The inverse of thermal conductivity is thermal resistivity (m·K·W−1), which illustrates a material’s property in slowing the transfer of heat. Thermal resistance (m2·K·W−1) is commonly reported as RSI or more commonly in North America in I-P units as the “R-value” in units °F ft2 h BTU−1, that is degrees Fahrenheit square feet hours per British Thermal Unit.

1.1. Polyisocyanurate Insulation

In North America, the most common commercial insulating material for roofing is polyisocyanurate, with an estimated 50% market share due to its relatively high thermal resistance compared to common alternatives like fiberglass or rock wool insulations. Polyisocyanurate is a closed-cell insulation material. It is comprised of a polymer matrix of cells and a gaseous mixture within those cells.
In this captive blowing agent insulation, decreasing temperature causes blowing agent condensation which leads to decreased thermal resistivity [7,8]. This characteristic leads to a local maximum of thermal resistance at standard operating temperatures for polyisocyanurate (typically around 24 °C [75 °F]) and lower thermal resistances at colder and hot temperatures, which has been demonstrated in the literature [9].
Most standards and energy codes such as ASHRAE and NECB, used in North America, use a mean temperature of 24 °C (75 °F) as the design thermal resistance for selecting an insulating material type and thickness. The actual environmental conditions of most buildings rarely allow them to stay at a consistent 24 °C (75 °F) for all climatic zones and the duration of the year. This has led to discrepancies between the predicted thermal performance of buildings and the measured thermal performance. A paper from the consulting firm RDH Building Science studying conventional roof performance performed a field monitoring experiment and found that energy transfer through roof and exterior insulated wall assemblies was not being modeled accurately and may not be adequately represented by conventional labeled R-values [10]. A more effective means of expressing the thermal conductivity of polyisocyanurate would be using a third-order polynomial equation as shown in ASTM C1045 [11]:
λ ( T ) = a 0 + a 1 T m + a 2 T m 2 + a 3 T m 3
where λ ( T ) is the thermal conductivity as a function of temperature, a 0 , a 1 , a 2 , and a 3 are coefficients to be determined experimentally and T m is the mean temperature.

1.2. Mean Operating Temperature (MOT)—Ambient and Solar

Furthermore, prominent construction associations like the Polyisocyanurate Insulation Manufacturers Association (PIMA) have released reports on calculating the effective mean operating temperature (MOT) [12]. Their conventional method utilizes the indoor and outdoor air for determining the mean temperature by:
M O T a i r = T a i r , i n + T a i r , o u t 2  
where M O T a i r is the mean operating temperature according to air temperature, T a i r , i n is the ambient indoor air temperature, and T a i r , o u t is the ambient outdoor air temperature. In PIMA’s report, they used outdoor temperatures from climatic data for a variety of climate zones to determine the average mean temperature over a year, finding that it ranged from 7–22 °C (45–72 °F). This, however, neglects a major contribution to heat for most roofing systems that is the absorption of solar irradiance, and the PIMA report acknowledges as much stating that it would raise the mean temperature in all climate zones. In commercial roofing several different roofing membranes are commonly utilized including 2-ply membranes (SBS, APP), single-ply membranes (EPDM, PVC, TPO), multi-ply built-up asphalt/tar (BUR), and liquid membranes (urethanes, polyurethanes) [13]. The effectiveness of emissivity in Northern climates is contentious as the number of cooling days is typically lower and the low emissivity membranes could be considered to be increasing the cooling load. During peak solar radiation in the summer, the outer surface temperature of an average emissivity membrane can easily reach 50 to 60 °C (122 to 140 °F [3]). Due to the transient nature of solar radiation, the assembly profile probably does not reach a steady-state with these elevated surface temperatures. But given the significant portions of the day see increased surface temperatures during solar hours it is conceptual that a better means of estimating the MOT would be:
M O T s u r f = T e x t , s u r f + T i n t , s u r f 2  
where M O T s u r f is the mean operating temperature according to the surface temperature, T e x t , s u r f is the exterior roofing membrane temperature, and T i n t , s u f is the roofing interior steel deck temperature. It should be noted that the characteristics of other materials in the roof assembly will be impacted by the MOT. Since, however, the thermal resistance of the assembly is provided primarily by the insulation this will not be considered.
For poorly conditioned spaces where the conditioned space surface temperature is significantly influenced by the climate side, the MOT could be a good indicator of the influence of outdoor climate on the thermal comfort inside. Effects on mean radiant temperature correlating to thermal comfort have been investigated and shown that the mean radiant temperature is a good indicator of thermal comfort such as where un-insulated walls and ceilings exposed to strong irradiance reach high radiant temperatures resulting in thermal discomfort for occupants [14,15]. Theoretically, high MOT values corresponding to increased solar irradiance and low MOT values caused by extreme cold may be correlated to the mean radiant temperature and thus the resulting thermal comfort. Currently the European Directive requires not only energy savings but to maintain a threshold of indoor environmental quality (IEQ) and research is starting to try and address both criteria, pertinently thermal comfort [16,17]. The present study did not look into any links between MOT values and mean radiant temperature values, but recognizes it as an area for possible future research.

1.3. Aging of Insulation (LTTR)

Due to the permeable nature of the polymer matrix in the polyisocyanurate insulation, the blowing agent gas effuses out of the cells as a function of time, continually replacing the cells with air resulting in reduced thermal resistance properties in “aged” insulation boards [18]. Research at the NRC has included work on the long-term performance of polyisocyanurate boards with impermeable faces and their impact on the LTTR [19,20].
Standards have been developed to measure this effect using an accelerated aging “slicing and scaling” method [21,22,23] termed as long-term thermal resistance (LTTR), whereby thin slicing of foam specimens is used to accelerate gas diffusion. LTTR is a 15-year time-weighted average of an insulation’s thermal resistance derived from 5 years of relative laboratory-controlled aging. At present, these standards specify that thermal resistance be determined at one mean temperature only. In 2005, the National Roofing Contractors Association (NRCA) conducted a limited study with the Canadian Roofing Contractors Association (CRCA) and the Extruded Polystyrene Foam Association with naturally aged (5 years) polyisocyanurate in laboratory conditions that exhibited thermal resistances lower than the LTTR [24]. Further studies by the Roofing Contractors Association of British Columbia (RCABC) in collaboration with the RDH Building Science further showed that in-service aged polyisocyanurate measures even lower thermal resistance than lab-aged specimens [25].

2. Methodology

The focus of this study is to compare the relative accuracy of different thermal parameters in predicting energy transfer through a roof assembly by validation and comparison with field measurements in different Canadian climatic zones. This study will focus on the following parameters:
  • Impact of MOT, considering both ambient and surface temperatures, on the energy performance of in situ roofing systems;
  • Impact of changing thermal resistance over time (LTTR).
In collaboration with Alberta Roofing Contractors Association (ARCA), two in situ field monitoring experiments to evaluate the thermal performance of conventional roof assemblies were conducted on ARCA’s headquarters building (Figure 1) located in Calgary. For each experiment roofing assembly material was retrieved from the site and brought back to NRC facilities for laboratory-scale thermal conductivity testing.

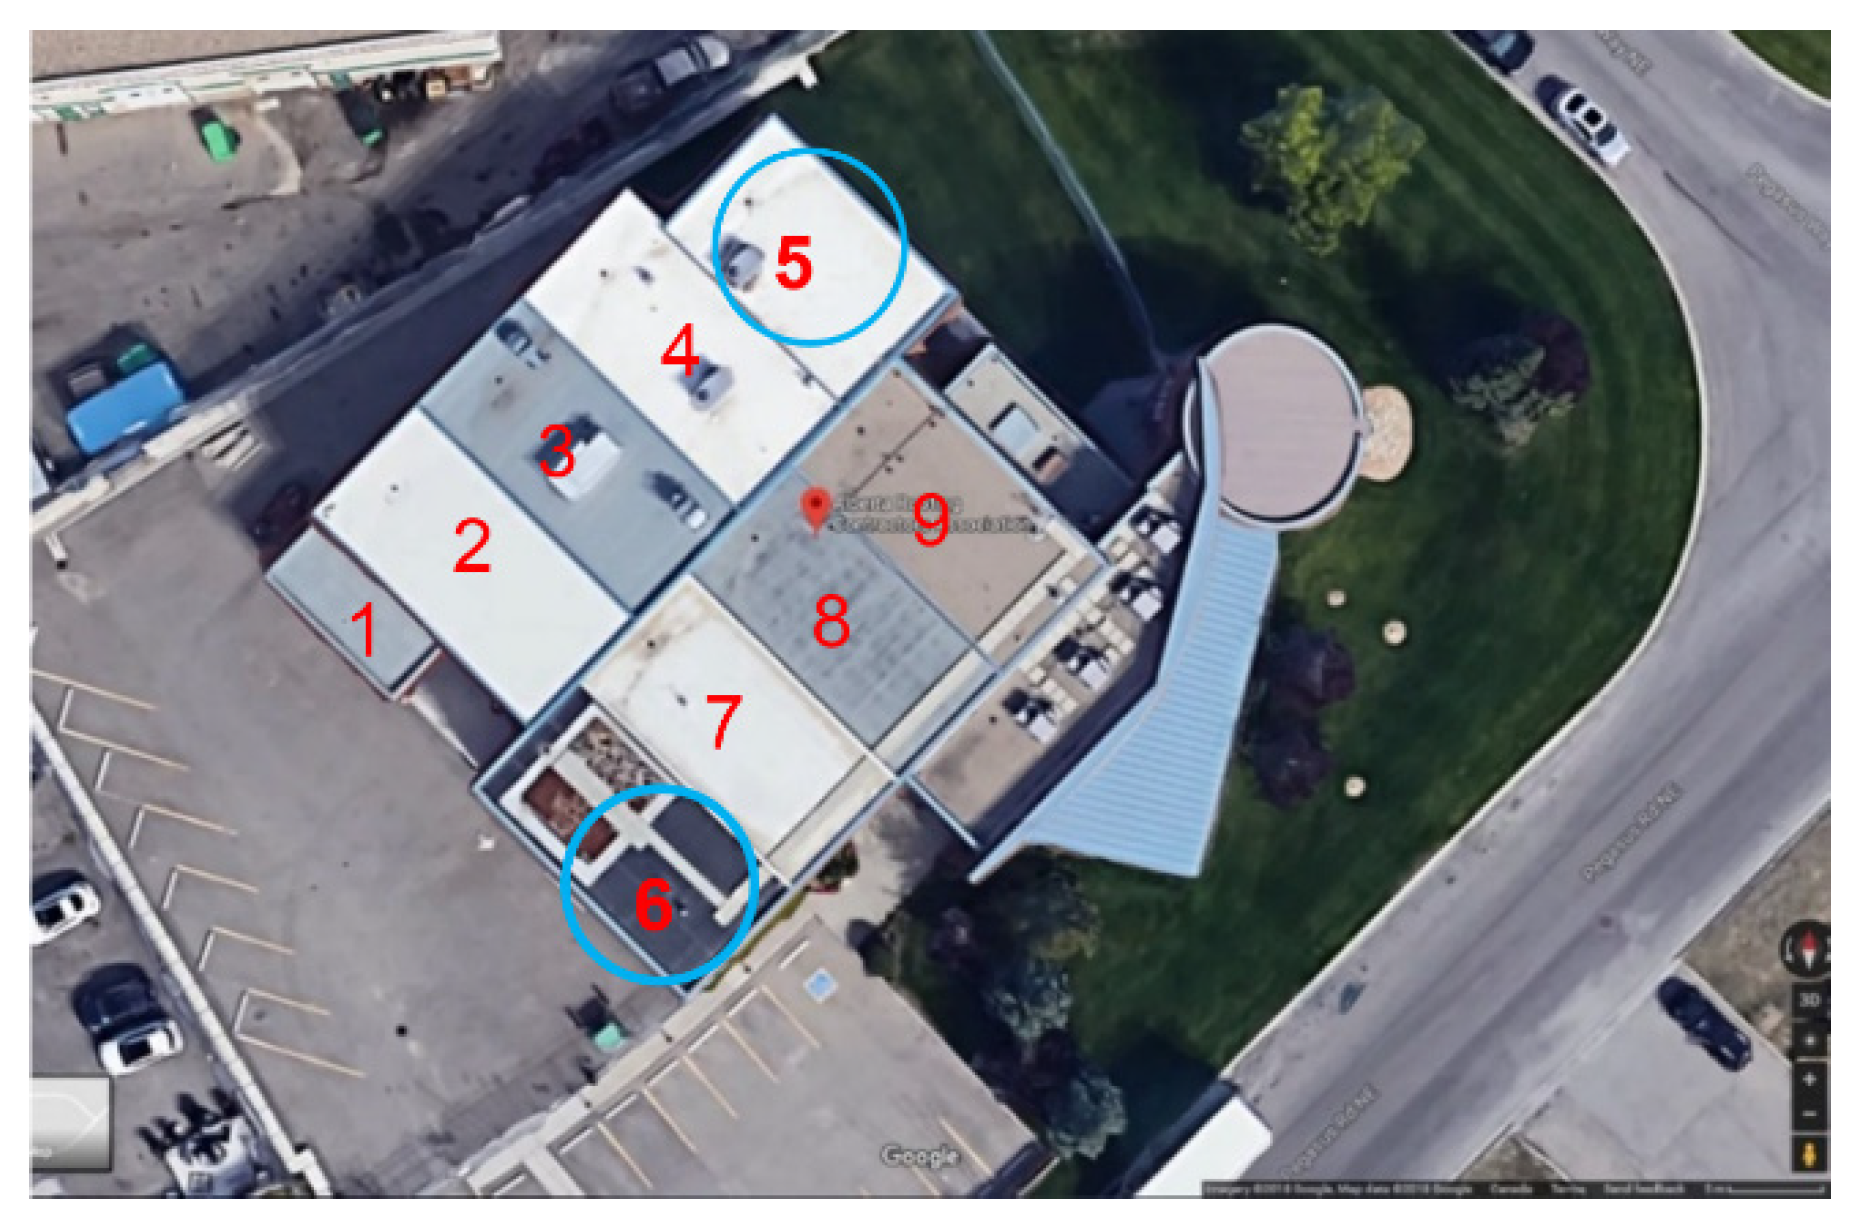
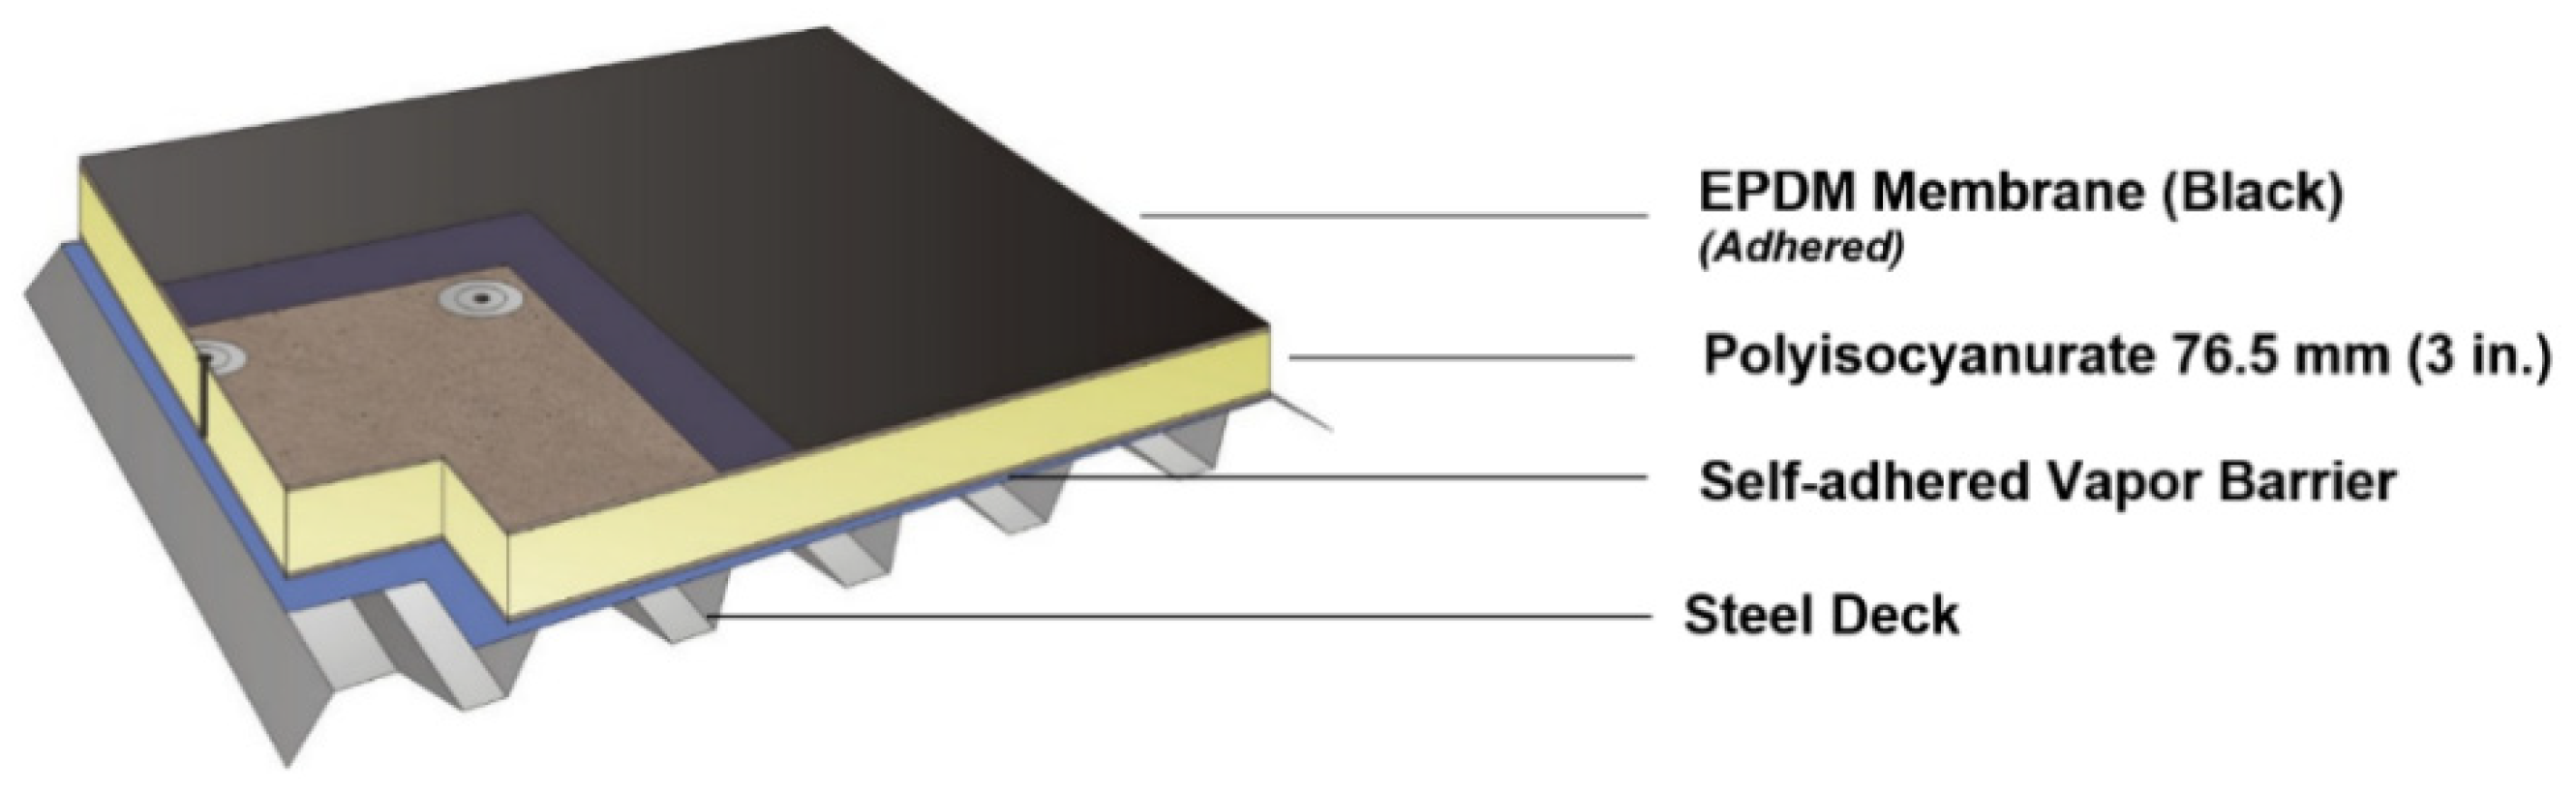
2.1. Field Monitoring

The ARCA headquarters’ building has nine different types of conventional roof assemblies with different configurations. For this study only two roofs, labeled Roof #5 and Roof #6 in Figure 1, were selected for the following properties: same polyisocyanurate insulation board material, limited thermal bridging, and contrasting white and black membrane emissivity values.
Roof #5 (Figure 2) is an induction welded mechanically attached system comprising steel deck as the structural substrate, self-adhered vapor barrier, two layers of polyisocyanurate insulation (thickness = 140 mm [5.5 in.]), and a white thermoplastic olefin (TPO) membrane as the waterproofing layer. The fasteners used in the attachment were #14 with a layout of 2.70 per m2 (0.25 per ft2). The roof was constructed in 2010–2011, and the interior occupancy type is a classroom which is an addition to the original building.
Roof #6 (Figure 3) is a partially adhered roof system (PARS) comprising steel deck as the structural substrate, self-adhered vapor barrier, one layer of polyisocyanurate insulation (thickness = 76.2 mm [3.0 in.]), and a black ethylene propylene diene monomer (EPDM) membrane as the waterproofing layer. The fasteners used in the attachment were #14 with a layout of 2.70 per m2 (0.25 per ft2). The roof was constructed in 1998, and the interior occupancy type is a shop that is used for training the roofing professionals that are part of the ARCA training program.
Two weather stations (Figure 4a,b) were installed on each roof. At each station, two test specimens were created by cutting out 0.91 by 0.61 m (36 by 24 in.) areas and instrumenting the roof assembly. For each roof station, one insulation specimen was not replaced but the existing “old” polyisocyanurate insulation boards were maintained (OI) while the other specimen was refurbished with new polyisocyanurate insulation boards (NI). Thus the four sites were created (Table 1).
For S1, the thickness of the new insulation board could not be identical to the old board. The old boards were 76.5 mm (3 in.), while the new board was close to 63.7 mm (2.5 in.). At S3, the overall thicknesses of the new insulation boards were the same as the old boards’ i.e., 127 mm (5 in.).
Each station was furnished with four solar radiation shields to house the external thermocouples at stratified distances from the surface of 0.30, 0.53, 0.86, and 1.47 m (11.8, 20.9, 33.9, and 57.9 in.). To measure temperatures through the roof assembly Type-T thermocouples were installed on the exterior surface, below the insulation, and on the interior of the steel deck. To measure the heat flow going through the roof assembly a Hukseflux Thermal Sensor HFP01 (60 µV m2 W−1 sensitivity) was installed inside the roofing assembly at the bottom of the insulation in S1 and S2, and between the insulation layers in S3 and S4 (Figure 4c).

2.2. Laboratory Testing

In order to determine the in situ thermal resistance of the roof assembly, transient conditions and many external variables (wind, sunlight, moisture, erosion, etc.), would obscure the measurement, thus a laboratory test was performed to accurately measure the thermal resistance of the insulation according to ASTM C518 [26]. Two different ASTM C518 compliant heat flow meters from TA Instruments were utilized: FOX 314 and FOX 600.
As per industry standards, the typical practice is to perform the thermal resistance measurement at a mean temperature 24 °C (75 °F) with a temperature differential of 28 K (50 °F) across the specimen. However, since the objective of this study is to understand the temperature dependency performance of the insulation and roof assembly, the test was conducted at the four mean temperature set points of 2, 12, 24, and 42 °C (36, 54, 75, and 108 °F), and at a greater temperature difference of 40 °C (72 °F).

3. Results

3.1. Laboratory Test Results—Characterization of Insulation
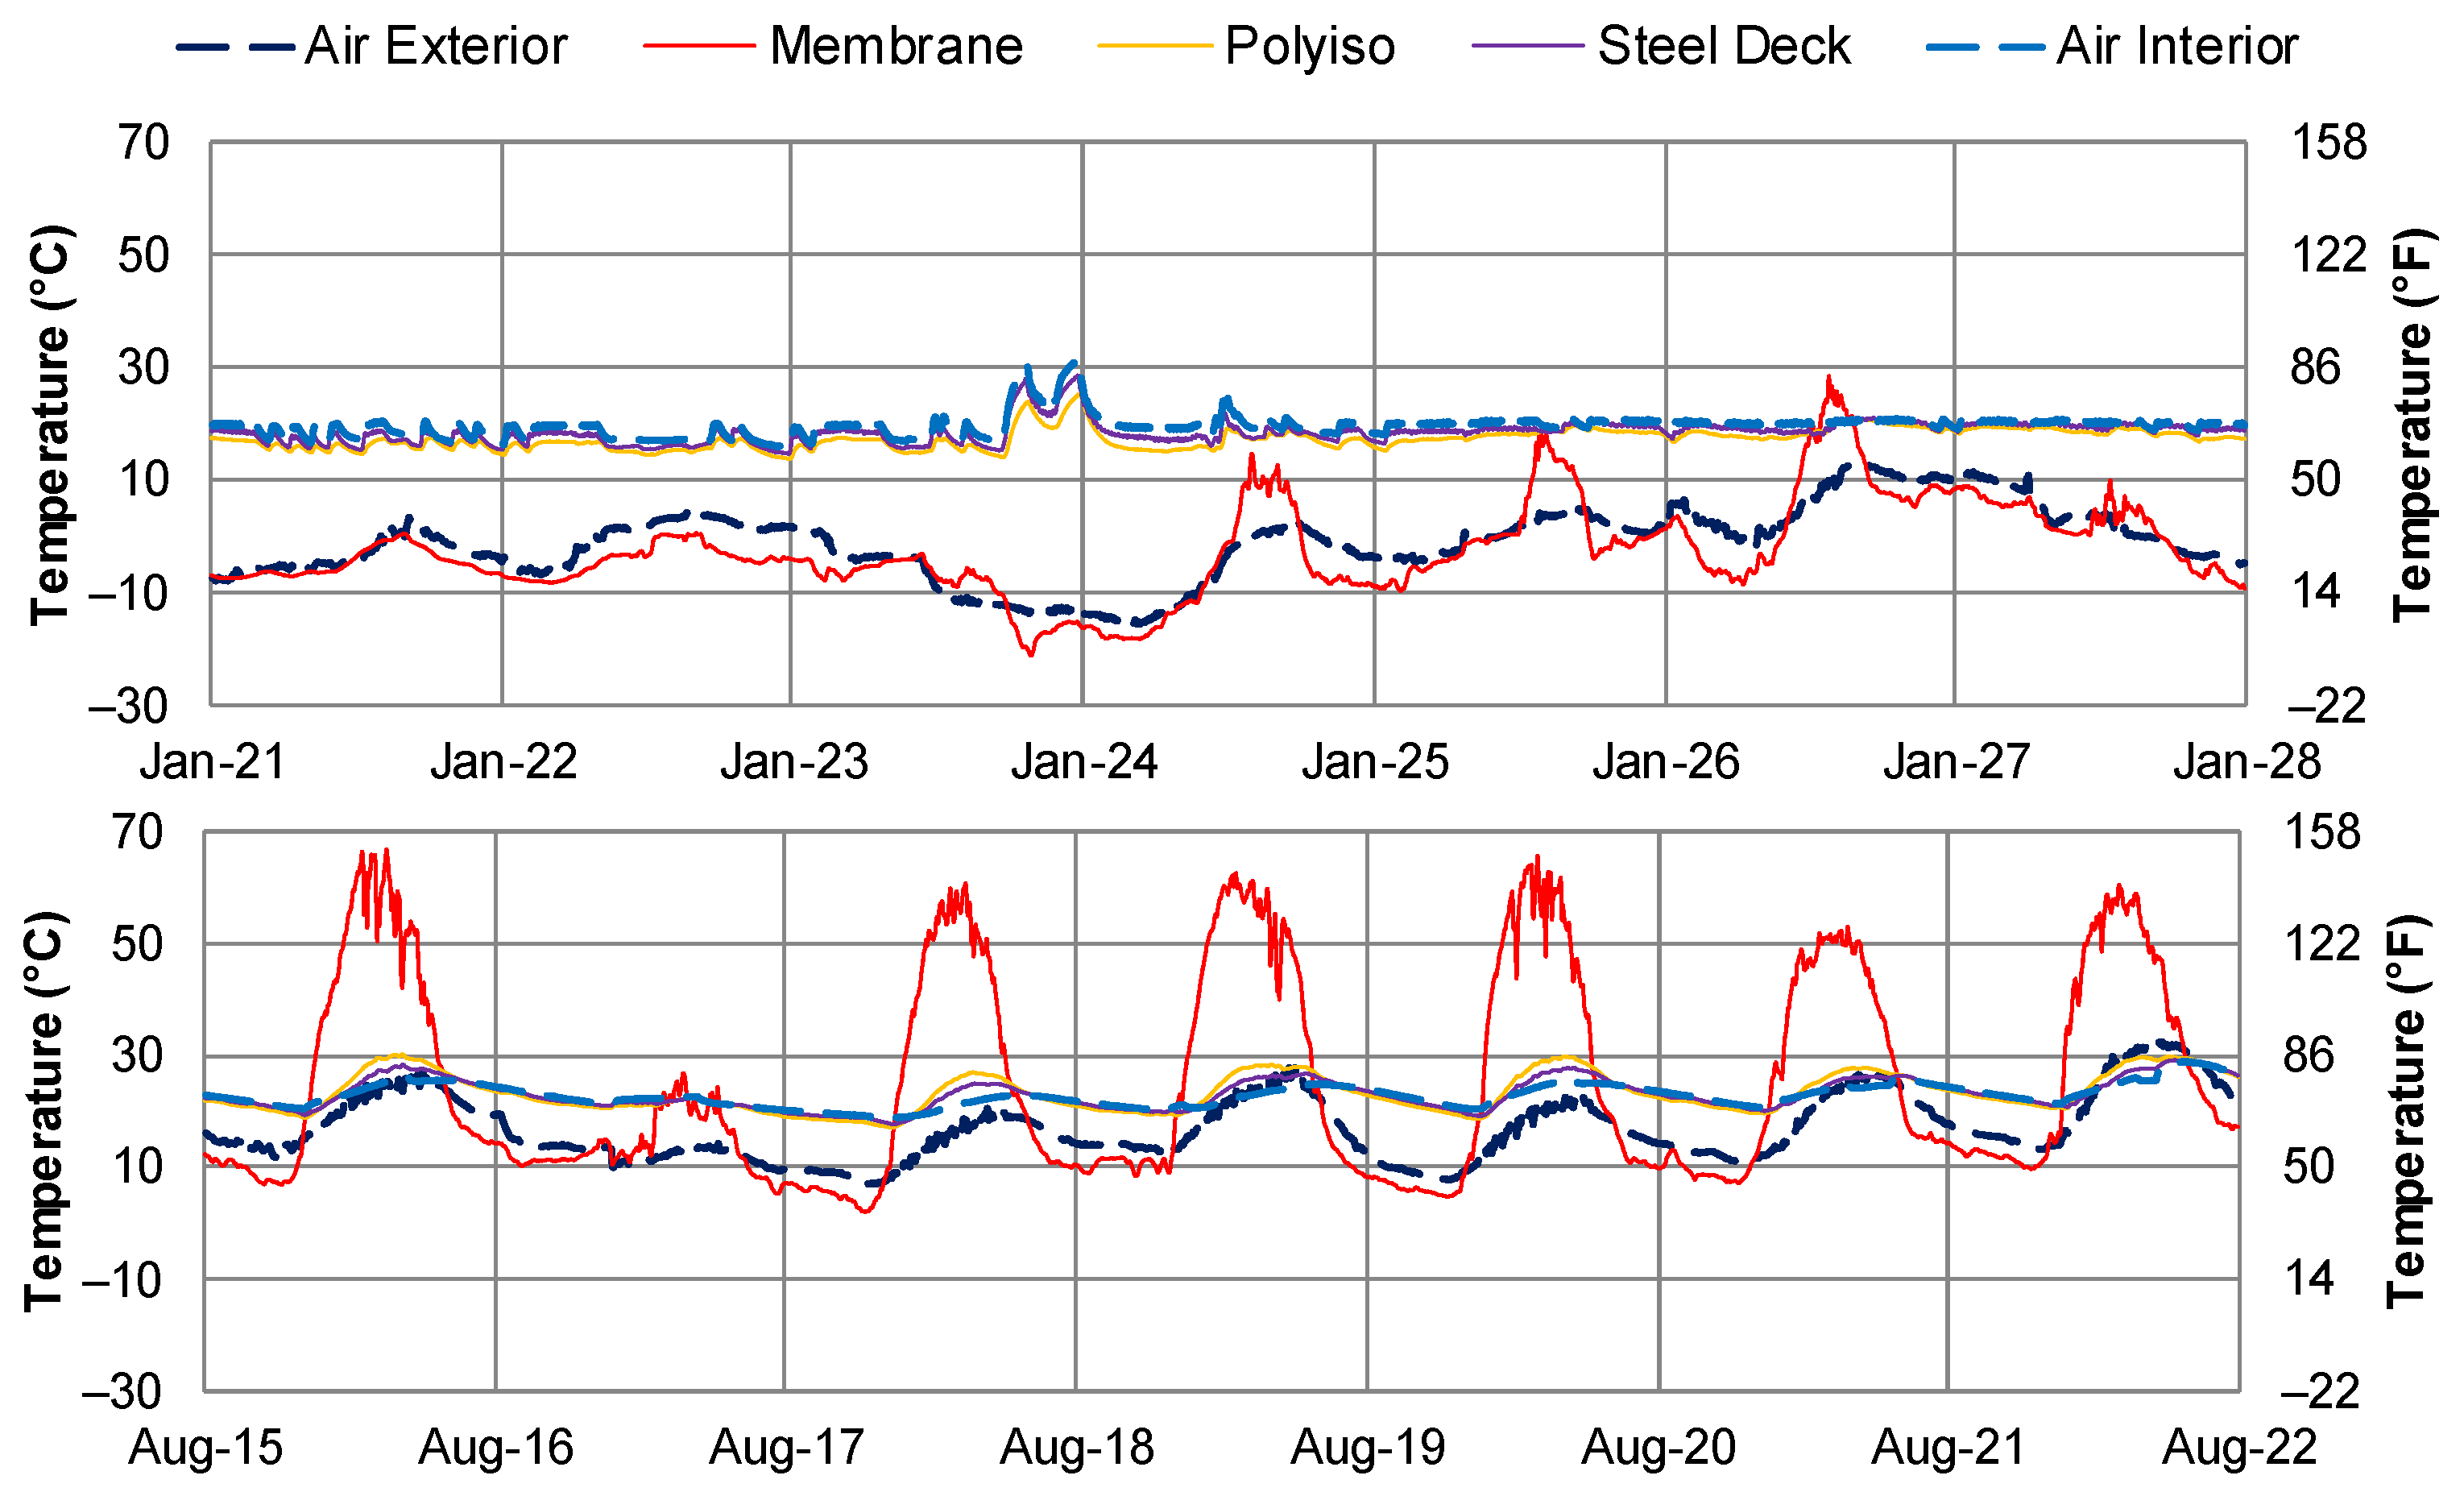
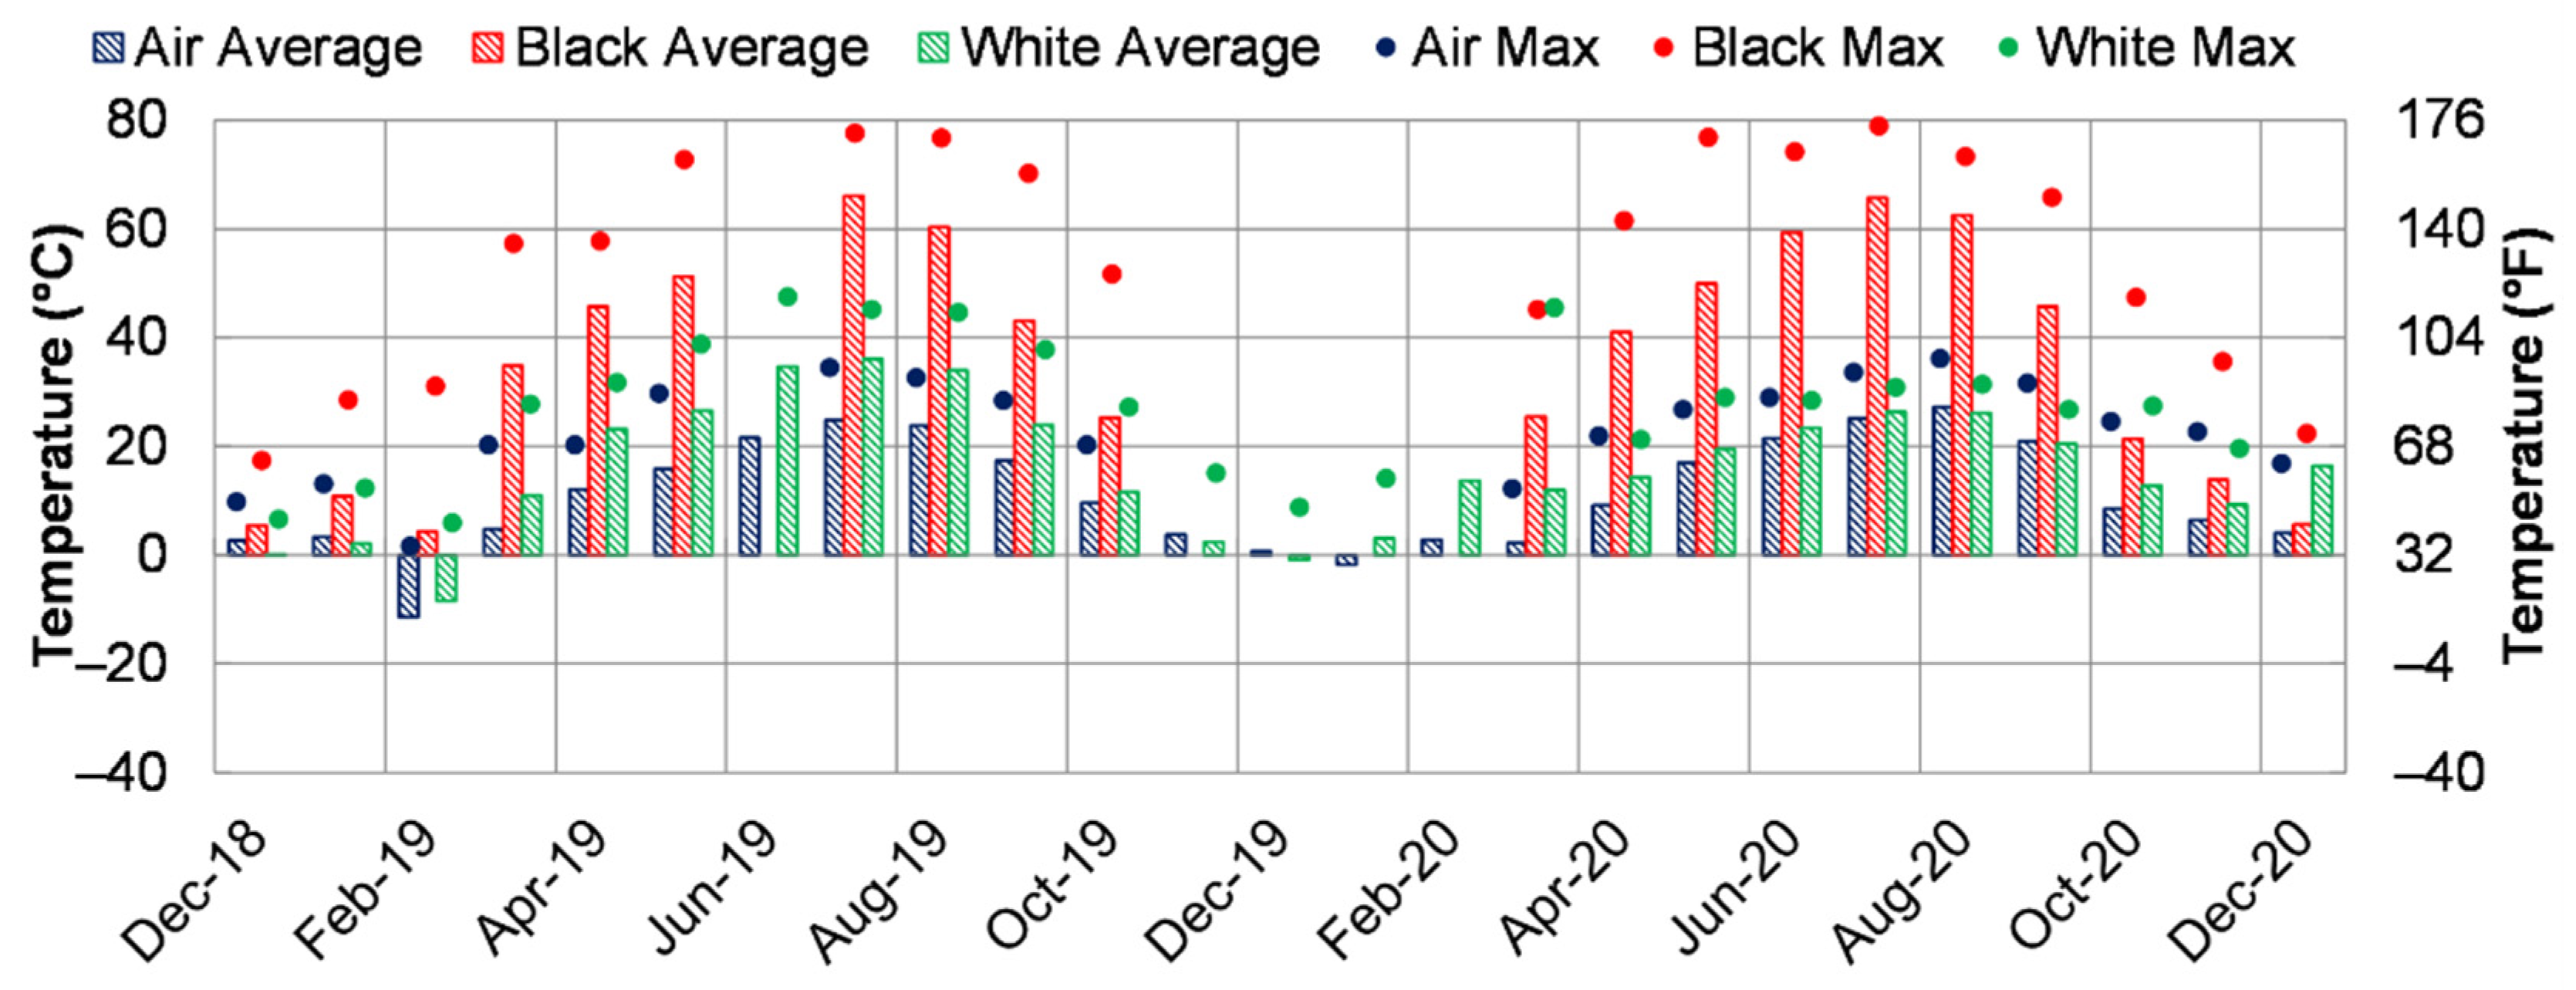
Following ASTM C518 procedure thermal conductivity, heat flux, thickness, and plate temperatures were measured and used to calculate the thermal resistance of each specimen for multiple mean temperatures, as shown in Figure 5.
Because insulation thickness S1 and S2 had significantly lower thermal resistance than S3 and S4, similarly, S1 was thinner than S2. In contrast to other sites, the thermal resistance of insulation at S3 shows significant variation when measured at different mean temperatures. The measured peak thermal resistance was 5.49 m2·K·W−1·mm−1 (31.2 °F·ft2·h·BTU−1) at the reference Tm = 24 °C (75 °F), and at Tm = 2 °C (36 °F) there was a steep drop in thermal resistance of about 22% from the reference Tm and at Tm = 42 °C (108 °F) the decrease was 9%, in contrast to S4 where the measured peak resistance of 5.19 m2·K·W−1·mm−1 (29.5 °F·ft2·h·BTU−1) at Tm = 12 °C (54 °F), and only experienced a drop in thermal resistance of about 2%. Comparing S1 and S3, the thermal resistance of S1 followed a linear profile similar to open cell insulations like EPS, and XPS. Table 2 reports the measured thermal resistance values at the standard reference temperature of 24 °C (75 °F).
Using the measured thermal resistance values, an empirical equation for thermal conductivity of each insulation board was determined in the following form:
λ ( T ) = a 0 + a 1 T m + a 2 T m 2 + a 3 T m 3 . ​  in ​  W · m 1 · K 1
The equations were determined by conducting a third-order polynomial fit to the thermal conductivity test data. Table 3 shows the determined polynomial coefficients for the four insulation samples. Since S1 and S3 are new insulation boards with a minimal amount of variability from weathering, aging, etc., these will be the focus of comparison with the energy transfer models in Section 3.3.

3.2. Field Results

Figure 6 provides the ambient exterior and interior temperature data as measured by both weather stations during a typical day in winter (24 January 2019) and summer (14 August 2019). Historical data from Environment Canada’s weather station at Calgary International Airport, Alberta (51°07′21.000″ N 114°00′48.000″ W, 1099.10 m ASL) was used to verify the data.
To see the effect of solar radiation on the temperature profiles of the roofing assembly the temperature data at different levels of the roofing assembly from exterior air to interior air were measured (Figure 7 and Figure 8) during a typical week in winter (21–27 January 2019) and summer (15–21 August 2019). This temperature data are from the test sites S1 and S3 that have new insulations in their layout to better represent the behavior of the roof assemblies without as much influence from thermal drift.
At S1, the effect of membrane reflectance is most notable during sunlight hours on days of high direct solar radiation prominent in summer but can be seen in winter during a small frame with direct solar radiation. For the assembly profile at S3 (White NI), there is a noticeable stratification of temperature through the assembly with the two-layered polyisocyanurate insulation attaining temperatures nearly average of the steel deck and membrane. During overcast days or non-sunlight hours (i.e., night), there is a sharp decline in the surface temperatures to even below the ambient air as it loses heat through radiative cooling to the night sky.
There is a clear difference of about 30 °C (86 °F) in the surface temperatures between white and black membranes for the same period of intense direct solar radiation (e.g., 15 August 2019). These differences are highlighted in Figure 9 which contrasts the black and white membrane temperatures of S1 and S3 with the ambient air conditions during a typical week in January and August.
To better compare the differences in surface temperatures and the effect of membrane reflectance, the peak temperatures were compared over a monthly period. Figure 10 and Figure 11 show the monthly average and monthly maximum and minimum temperatures of the exterior air versus either the black or white membranes. The bars representing the average temperatures in Figure 10 are calculated by taking the daily maximum temperatures and averaging it for the whole month. Similar is the case for average minimum temperature calculated in Figure 11. The minimum and maximum temperatures shown in Figure 10 and Figure 11 are the minimum and maximum temperatures recorded for the month. During winter months the maximum temperatures of the black membrane are only slightly higher than either the exterior air or the white membrane because of snow coverage. As seen previously the average daily maximum surface temperatures of the black membrane are significantly higher than the white membrane (approximately 25 °C [77 °F]) while the monthly maximum has an even greater difference (approximately 30 °C [86 °F]).
The peak minimum temperatures are not affected by direct solar radiation but rather a function of heat lost to radiative cooling at night and to the heat of fusion for moisture condensation. However, the difference between black and white membranes is very slight in this regard.
In the thermal design of roofing assemblies, the insulation is designed based on the assumption of a mean operating temperature of 24 °C (75 °F). The energy codes such as ASHRAE and NECB follow this design procedure and provide the thermal resistance value of different insulations determined at Tm = 24 °C (75 °F), measuring the MOT using the ambient exterior and interior air temperatures as MOTair. From Figure 10 and Figure 11, it was seen that the membrane surface temperatures reach much higher temperatures due to direct solar radiation as literature predicted. Thus it suggests a more accurate measure of the real mean temperature of the assembly should use the membrane surface temperature and steel deck temperature in calculating the MOT as MOTsurf.
Figure 12 shows the calculated MOTair and MOTsurf of the roofing assembly during a typical week in January and August. The pink line designates the value of 24 °C (75 °F). In the winter days, it is clear that the average for MOTair and MOTsurf is well below 24 °C (75 °F). Also, the difference between the values of MOTair and MOTsurf is relatively minimal, as surface and air temperatures are mostly similar during these months. The only exception is that the MOTsurf of the black roof assembly can substantially deviate on sunny winter days. When using the surface temperatures, the MOTsurf for black membrane assemblies can be significantly higher than the roofing assemblies with a white membrane, especially on clear sunny days. During the summer the MOTsurf of both the assemblies follow a similar pattern with the values regularly reaching above and below 24 °C (75 °F).
A better way to summarize the MOTair and MOTsurf would be to compare the average daily maximums and monthly maximums, as shown in Figure 13. Regardless of which MOT calculation is used, the average MOT of the roof assembly is below 24 °C (75 °F) for the majority of months. To understand the impact of the temperature gradient and MOT on the thermal performances of roof assemblies, the energy transfer, namely the one-dimensional heat flux through the roof assembly is compared between all four test sites. Using the instantaneous heat transfer measured directly using heat flux sensors implanted within the roof assemblies, Figure 14 provides sample data of the measured heat flux for the example week in January and August. The convention here shows heat transfer with positive values as representing heat flow out of the building or heat loss, and the negative values as heat flow into the building or heat gain.
There are two principal effects shown, one is the effect of roof membrane reflectance, and the other is the effect of insulation age and thermal resistance. The relative thermal resistance of each board is in different orders of magnitude between the four test sites (see Figure 5). Therefore a direct comparison of heat flux between black and white sites is inconclusive, but a qualitative comparison of relative peak variations is still valid. In this context the heat flux data agree with the previous thermal performance indicators (solar reflectance and temperature profile) as roof assemblies with black membranes tend to increase heat gain at peak sunlight hours significantly and roof assemblies with white membranes have smaller variations between sunlight and non-sunlight hours. A clear example of this is on 15 August where the black membrane sites heat transfer was 5 W·m−2 (1.58 Btu·h−1·ft−2)during the night and gaining 300% as much during peak sunlight hours (−15 W·m−2 [−4.75 Btu·h−1·ft−2]) while white membrane sites were only gaining 30% (−1 W·m−2 [−0.32 Btu·h−1·ft−2]) of heat lost during the hours without sunlight (3 W·m−2 [0.95 Btu·h−1·ft−2]).

3.3. Thermal Performance—Energy Transfer

The main focus of this study was to determine whether the thermal design of roofing assemblies using conventional methods is an accurate portrayal of in-service thermal performance. In the following section, only the test sites S1 and S3 constructed with new insulation will be analyzed as they should have a minimal amount of variability (from weathering, aging, etc.), and be approximate to thermal design values for comparison. In this section, two different theoretical models for energy transfer will be compared to the measured energy transfer (from heat flux sensors). The first theory is based on conventional methods that use the ambient air temperatures for the temperature differential and thermal resistance of the insulation given at the Tm = 24 °C (75 °C):
Q C o n v = Δ T a i r R T m = 24 ° C = T E x t e r i o r   A i r T I n t e r i o r   A i r R T m = 24 ° C
The second theory uses the actual roof surface temperatures instead of the ambient temperatures and uses the thermal resistance of the insulation calculated from empirical equations derived from heat flow meter data acquired according to ASTM C518 at the respective measured MOT of the roof assembly:
Q M O T = Δ T s u r f R M O T = T M e m b r a n e T S t e e k   D e c k R M O T
Figure 15 shows the measured average daily energy transfer contrasted with theoretical values calculated according to these four models for both S1 and S3. For S1, the roof assembly with the black membrane, the inaccuracy of the conventional method is less pronounced during the winter months as the surface temperatures are close to ambient conditions on average, and the thermal resistance of the polyisocyanurate insulation at S1 does not substantially change from 24 °C (75 °F) to 2 °C (36 °F) (Figure 5), which is the rough MOTsurf of the roof assembly in winter. There seems to be more accuracy in using ∆Tair versus ∆Tsurf. For the overall month it is slightly more accurate, this could be because of the surface thermocouples residing underneath a layer of snow and thus not taking into account the true temperature profile of the roofing assembly including an insulating layer of snow.
However, during the summer the roof assembly with the black membrane was extremely heated by the solar radiation, and the surface temperatures of the membrane were much higher than the ambient conditions which resulted in a considerable discrepancy between the measured and ∆Tair models. For example, on the Day 21 August, QConv predicts positive heat flow (loss of heat from the roof) while QMOT shows a large negative heat flow matching with the measured data. This discrepancy shows the ineffectual use of air temperatures at predicting the effective heat flux across of roofing system as it ignores the effects of solar heat absorption.
In contrast to the energy transfer results from S1, the white membrane roof assembly S3 shows the inaccuracies of using Tm = 24 °C (75 °F) versus MOT. The average surface temperatures during winter and summer were not different from the ambient conditions as much of the heat was reflected away by the low emissivity membrane. Instead, due to S3 having insulation with a higher dependency on the MOT, the inaccuracy of the conventional method is more pronounced during the winter months as the MOT of the roof assembly in these months is very low (closer to 2 °C [36 °F]). From Figure 5, the thermal resistance of the S3 polyisocyanurate at this low MOT is 22% lower than the value at MOT of 24 °C (75 °F). For example on Day 25 January, QConv predicts significantly less heat loss than QMOT. This discrepancy shows the ineffectual use of the thermal resistance at a mean temperature of 24 °C (75 °F) for all scenarios, especially with highly temperature-dependent materials. However, during summer months the MOT is close to an average of 24 °C (75 °F) and thus differences in thermal resistance are diminished (5.46 versus 5.49 m2·K·W−1 [R-values of 31.0 versus 31.2 °F·ft2·h·BTU−1]).
To summarize these findings Figure 16 shows the total monthly energy expenditure between the roof and the environment for each of the measured months (December 2018 through to October 2019) for both test sites. The results here corroborate and highlight the results seen in Figure 15, with energy transfer models using ambient temperatures being considerably inaccurate for the roof assemblies with black membrane while energy transfer models using thermal resistance of insulation at MOT values of 24 °C (75 °F) being inaccurate for roof assemblies with a white membrane.
To see the degree of inaccuracy of each model relative to the measured data, the relative error of the model was calculated:
E r r o r = | Q m e a s u r e d Q m o d e l | Q m e a s u r e d
Figure 17 shows the average relative error of each of the two models for both the S1 and S3 for the cumulative six-month period from December 2018 to October 2019. This figure clearly shows that the conventional model (ambient conditions, with thermal resistance at MOT 24 °C (75 °F) has the highest error for both the test sites S1 and S3 reaching 45% and 29% respectively. As QMOT considers both the surface temperature and temperature-dependent thermal resistance of the insulation, this model yielded the best results with errors of 14% and 15% for S1 and S3 respectively.

3.4. Aging of Insulation

In addition to the influence of surface temperatures on the energy performance of the roofing assembly the aging of the insulation must also be considered. Through the examination of the heat flow and temperature data, the thermal resistance of the insulation can be estimated using the procedures found in ISO 9869-1.
For the evaluation of the thermal resistance of the roofing assembly, the resistance of the roofing assembly was determined on a daily basis based on the average of thermal resistance measurements made overnight during a period of relatively stable heat flows from 1:00 AM to 5:00 AM). For each of the sites, S1 and S3, the MOTsurface was plotted vs. the thermal resistance (Figure 18). For site 3, the thermal resistance is also compared to the results for the heat flow meter for the month of December 2018 (the earliest data available) vs. December 2020 (the latest data available) (Table 4). Over the study period there has been an approximate drop in thermal resistance of 11%. Further testing of laboratory samples and further in situ testing data are required to confirm this apparent drop in thermal resistance and determine if the loss in thermal resistance is a result of a loss in blowing agent or the result of moisture ingress into the insulation. In addition it will be necessary to further assess the implications of the estimates of thermal performance presented in this paper.

4. Conclusions

In collaboration with Alberta Roofing Contractors Association (ARCA) an in situ field study was conducted on the ARCA’s headquarters building located in Calgary to generate data on mean operating temperature of the roof assemblies and to determine whether the thermal design of roofing assemblies using conventional methods is an accurate portrayal of in-service thermal performance. Two roof assemblies, one with black EPDM membrane and the other with white TPO membrane were selected. Two small test areas within these roofs were replaced with new insulation boards, and the test areas were reconstructed and instrumented with temperature and heat flux sensors.
Field monitoring for ten months of this ongoing study is presented in this study. The measurements indicated that the mean operating temperature (MOT) of the roof assembly was found to be below 24 °C (75 °F) for all winter months and most spring months, which opposes the current roof thermal designs that are being designed based on the assumption that across the roofing assembly the mean temperature is 24 °C (75 °F). The conventional approach (ambient conditions, with thermal resistance at MOT 24 °C [75 °F]) of roof thermal design underestimates the energy performance of the roof assembly. It identifies and demonstrates how insulated roofs exhibit thermal performance that is different from what is assumed by designers. The use of roof surface temperature and the corresponding temperature-dependent thermal resistance of the insulation have been demonstrated to improve predictions of the energy performance by reducing errors on an average (two years of data) from 48% and 33% to 15% and 18% for the two membrane roof systems.

Author Contributions

Conceptualization, S.M.; methodology, S.M.; software, L.C.; validation, S.M., L.C. and D.v.R.; formal analysis, L.C. and D.v.R.; investigation, L.C. and D.v.R.; resources, S.M.; data curation, L.C. and D.v.R.; writing—L.C., S.M. and D.v.R.; visualization, S.M.; supervision, S.M.; project administration, S.M.; funding acquisition, S.M. All authors have read and agreed to the published version of the manuscript.

Funding

This research received no external funding.

Institutional Review Board Statement

Not Applicable.

Informed Consent Statement

Not Applicable.

Data Availability Statement

Not Applicable.

Acknowledgments

This project is being conducted with the support of NRC’s Codes Canada who play a vital role in the development of the national codes for Canada. The authors would like to acknowledge Kevin Kramers, Technical Manager of Alberta Roofing Contractors Association (ARCA) for providing the headquarters building for the study and their assistance in the installation.

Conflicts of Interest

The authors declare no conflict of interest.

References

  1. Communication from the Commission to the European Parliament and the Council. Energy Efficiency and Its Contributions to Energy Security and the 2030 Framework for Climate and Energy Policy; European Commission: Brussels, Belgium, 2014. [Google Scholar]
  2. Rajkovich, N.B.; Okour, Y. Climate Change Resilience Strategies for the Building Sector: Examining Existing Domains of Re-silience Utilized by Design Professionals. Sustainability 2019, 11, 2888. [Google Scholar] [CrossRef] [Green Version]
  3. Liu, K.; Baskaran, B. Thermal performance of green roofs through field evaluation. Greening Rooftops for sustainable communities. In Proceedings of the First North American Green Roofs Infrastructure Conference, Awards and Trade Show, Chicago, IL, USA, 29–30 May 2003. [Google Scholar]
  4. Moreno, M.V.; Zamora, M.A.; Skarmeta, A.F. User-centric smart buildings for energy sustainable smart cities. Trans. Emerg. Telecommun. Technol. 2014, 25, 41–55. [Google Scholar] [CrossRef]
  5. Hosseini, M.; Akbari, H. Effect of cool roofs on commercial buildings energy use in cold climates. Energy Build. 2016, 114, 143–155. [Google Scholar] [CrossRef]
  6. Berardi, U.; Naldi, M. The impact of the temperature dependent thermal conductivity of insulating materials on the effective building envelope performance. Energy Build. 2017, 144, 262–275. [Google Scholar] [CrossRef]
  7. Berardi, U.; Madzarevic, J. Microstructural analysis and blowing agent concentration in aged polyurethane and polyisocy-anurate foams. Appl. Therm. Eng. 2020, 164, 114440. [Google Scholar] [CrossRef]
  8. Kumaran, M.K.; Bomberg, M.T.; Marchand, R.G.; Ascough, M.R.; Creazzo, J.A. A method for evaluating the effect of blow-ing agent condensation on sprayed polyurethane foams. J. Therm. Insul. 1989, 13, 123–137. [Google Scholar] [CrossRef] [Green Version]
  9. Graham, M.S. Testing R–Values, Professional Roofing; ASTM International: West Conshohocken, PA, USA, 2015. [Google Scholar]
  10. Schumacher, C.; Ricketts, L.; Finch, G.; Straube, J. The Effect of Temperature on Insulation Performance: Considerations for Optimizing Wall and Roof Designs; RDH Building Engineering Ltd.: Vancouver, BC, Canada, 2014. [Google Scholar]
  11. ASTM International. ASTM Standard C1045–07: Standard Practice for Calculating Thermal Transmission Properties Under Steady–State; Conditions, Annual Book of ASTM Standards: West Conshohocken, PA, USA, 2008. [Google Scholar]
  12. Polyisocyanurate Insulation Manufacturers Association. Thermal Resistance and Mean Temperature: A Report for Building Design Professionals; Polyisocyanurate Insulation Manufacturers Association: North Fillmore Street, WA, USA, 2015. [Google Scholar]
  13. Dell, M.; Finch, G. Monitored Field Performance of Conventional Roofing Assemblies–Measuring the Benefits of Insulation Strategy; RCI Symposium on Building Envelope Technology: Minneapolis, MN, USA, 2013. [Google Scholar]
  14. Atmaca, I.; Kaynakli, O.; Yigit, A. Effects of radiant temperature on thermal comfort. Build. Environ. 2007, 42, 3210–3220. [Google Scholar] [CrossRef]
  15. Gan, G. Analysis of mean radiant temperature and thermal comfort. Build. Serv. Eng. Res. Technol. 2001, 22, 95–101. [Google Scholar] [CrossRef]
  16. Bellia, L.; Alfano, F.R.D.; Fragliasso, F.; Palella, B.I.; Riccio, G. On the interaction between lighting and thermal comfort: An integrated approach to IEQ. Energy Build. 2021, 231, 110570. [Google Scholar] [CrossRef]
  17. Alfano, F.R.D.; Olesen, B.W.; Palella, B.I.; Riccio, G. Thermal comfort: Design and assessment for energy saving. Energy Build. 2014, 81, 326–336. [Google Scholar] [CrossRef]
  18. Bhattacharjee, D.; Booth, J.R. Effective Diffusion Coefficients of CO2 and HCFC-22 in Polyurethane and Polyisocyanurate Foams. J. Cell. Plast. 1995, 31, 244–259. [Google Scholar] [CrossRef]
  19. Mukhopadhyaya, P.; Kumaran, M.K. Long–term thermal resistance of closed–cell foam insulation: Research update from Canada. In Proceedings of the 3rd Global Insulation Conference and Exhibition, Barcelona, Spain, 16 October 2008. [Google Scholar]
  20. Phalguni, M.; Michel, D.; Nicole, N.; David, V.R.; John, L. Long–term thermal performance of imper-meably faced polyiso foam boards: Field and laboratory observations. J. Cold Reg. Eng. 2014, 28, 04014005. [Google Scholar]
  21. ASTM International. ASTM C1303. Standard Test Method for Predicting Long–Term Thermal Resistance of Closed–Cell Foam Insulation; ASTM International: West Conshohocken, PA, USA, 2012. [Google Scholar]
  22. Underwriters Laboratories of Canada. CAN/ULC S770. Standard Test Method for Determination of Long–Term Thermal Resistance of Closed–Cell Thermal Insulating Foams; Standards Council of Canada: Ottawa, ON, Canada, 2015. [Google Scholar]
  23. International Standards Organization. ISO 11561. Ageing of Thermal Insulation Materials–Determination of the Long–Term Change in Thermal Resistance of Closed–Cell Plastics (Accelerated Laboratory Test Methods); International Organization for Standardization: Geneva, Switzerland, 1999. [Google Scholar]
  24. Graham, M. Testing LTTR–Research reveals the LTTR method may be over–reporting results, Professional Roofing; ASTM International: West Conshohocken, PA, USA, 2006; pp. 30–31. [Google Scholar]
  25. Stiffman, A.; Ricketts, L.; Finch, G. Long Term Monitoring Study of Polyisocyanurate Roof Insulation Movement and Thermal Performance–6 Year Report; RDH Building Science Inc.: Vancouver, BC, Canada, 2016. [Google Scholar]
  26. ASTM International. ASTM Standard C518: Standard Test Method for Steady–State Thermal Transmission Properties by Means of the Heat Flow Meter Apparatus; ASTM: West Conshohocken, PA, USA, 2015. [Google Scholar]
Figure 1. Satellite view of ARCA building.
Buildings 11 00216 g001
Figure 2. Roof #5—Induction welded mechanically attached roofing system.
Buildings 11 00216 g002
Figure 3. Roof #6—Partially adhered roofing system (PARS).
Buildings 11 00216 g003
Figure 4. Field measurement station showing (a) Roof #5; (b) roof #6, (c) heat flux sensor, (d) surface thermocouples.
Buildings 11 00216 g004
Figure 5. Thermal resistance of the insulation specimens taken from the test sites S1–S4.
Buildings 11 00216 g005
Figure 6. Typical daily ambient air temperature data for winter (24 January 2019) and summer (14 August 2019).
Buildings 11 00216 g006
Figure 7. Roof assembly temperature profile of S1 (Black NI) during 21–27 January 2019 and 15–21 August 2019.
Buildings 11 00216 g007
Figure 8. Roof assembly temperature profile of S3 (White NI) from 21–27 January 2019 and 15–21 August 2019.
Buildings 11 00216 g008
Figure 9. Comparison of black and white membrane temperatures (S1 and S3) from 21–27 January 2019 and 15–21 August 2019.
Buildings 11 00216 g009
Figure 10. Monthly average of the daily maximum surface temperatures of both black and white membranes (S1 and S3) and their monthly maximum.
Buildings 11 00216 g010
Figure 11. Monthly average of the daily minimum surface temperatures of both black and white membranes (S1 and S3) and their monthly minimum.
Buildings 11 00216 g011
Figure 12. Mean operating temperatures (MOT) as calculated by using air or surface temperatures for both black and white roof membranes (S1 and S3) during 21–27 January 2019 and 15–21 August 2019.
Buildings 11 00216 g012
Figure 13. Monthly average of the daily maximum mean operating temperatures (MOT) for both black and white roof membranes (S1 and S3).
Buildings 11 00216 g013
Figure 14. Measured heat flux from S1 through S4 from 21–27 January 2019 and 15–21 August 2019.
Buildings 11 00216 g014
Figure 15. Average daily energy transfer through S1 Black NI and S3 White NI roof assemblies for a typical day, typical week, and cumulative month for the months of January 2019 and August 2019.
Buildings 11 00216 g015
Figure 16. Average daily energy transfer through S1 (Black NI) and S3 (White NI) roof assemblies for a six-month period between December 2018 and May 2018.
Buildings 11 00216 g016
Figure 17. Average relative error of the two theoretical models relative to the measured data (December 2018 to October 2019 and February to December 2020).
Buildings 11 00216 g017
Figure 18. Thermal resistance of S1 and S3 assembly in December 2018 and December 2020.
Buildings 11 00216 g018
Table 1. Description of test sites.
SiteMembraneInsulationSite Abbreviation
S1Black EPDMNew InsulationS1 Black NI
S2Black EPDMExisting InsulationS2 Black OI
S3White TPONew InsulationS3 White NI
S4TPOExisting InsulationS4 White OI
Table 2. Measured values of the thermal resistance at a mean temperature of 24 °C (75 °F).
SpecimenTotal Thermal ResistanceThermal Resistivity
RSI
(m2·K·W−1)
R-Value
(°F·ft2·h·BTU−1)
RSI per 25 mm
(m2·K·W−1)
R-Value per Inch
(°F·ft2·h·BTU−1)
S1 Black NI2.2813.00.9045.24
S2 Black OI2.5014.20.8825.05
S3 White NI5.4931.20.9835.63
S4 White OI5.1028.90.9135.23
Table 3. Thermal conductivity polynomial coefficients for insulation specimens.
SpecimenPolynomial Coefficient
a0
(W·m−1·K−1)
a1
(W·m−1·K−2)
a2
(W·m−1·K−3)
a3
(W·m−1·K−3)
S1 Black NI2.962 × 10−2−3.803 × 10−41.712 × 10−5−1.800 × 10⁻⁷
S2 Black OI2.622 × 10−24.096 × 10−53.396 × 10−6−4.125 × 10⁻⁸
S3 White NI3.447 × 10−2−8.709 × 10−42.610 × 10−5−2.142 × 10⁻⁷
S4 White OI2.786 × 10−2−1.247 × 10−45.271 × 10−6−2.216 × 10⁻⁸
Table 4. Drop in thermal resistance of S3 assembly in December 2018 and December 2020 as compared to HFM characterization.
TestThermal Resistance%Loss
RSI
(m2·K·W−1)
R-Value
(°F·ft2·h·BTU−1)
HFM4.2924.4-
Dec-184.2224.02%
Dec-203.8321.711%
Publisher’s Note: MDPI stays neutral with regard to jurisdictional claims in published maps and institutional affiliations.

