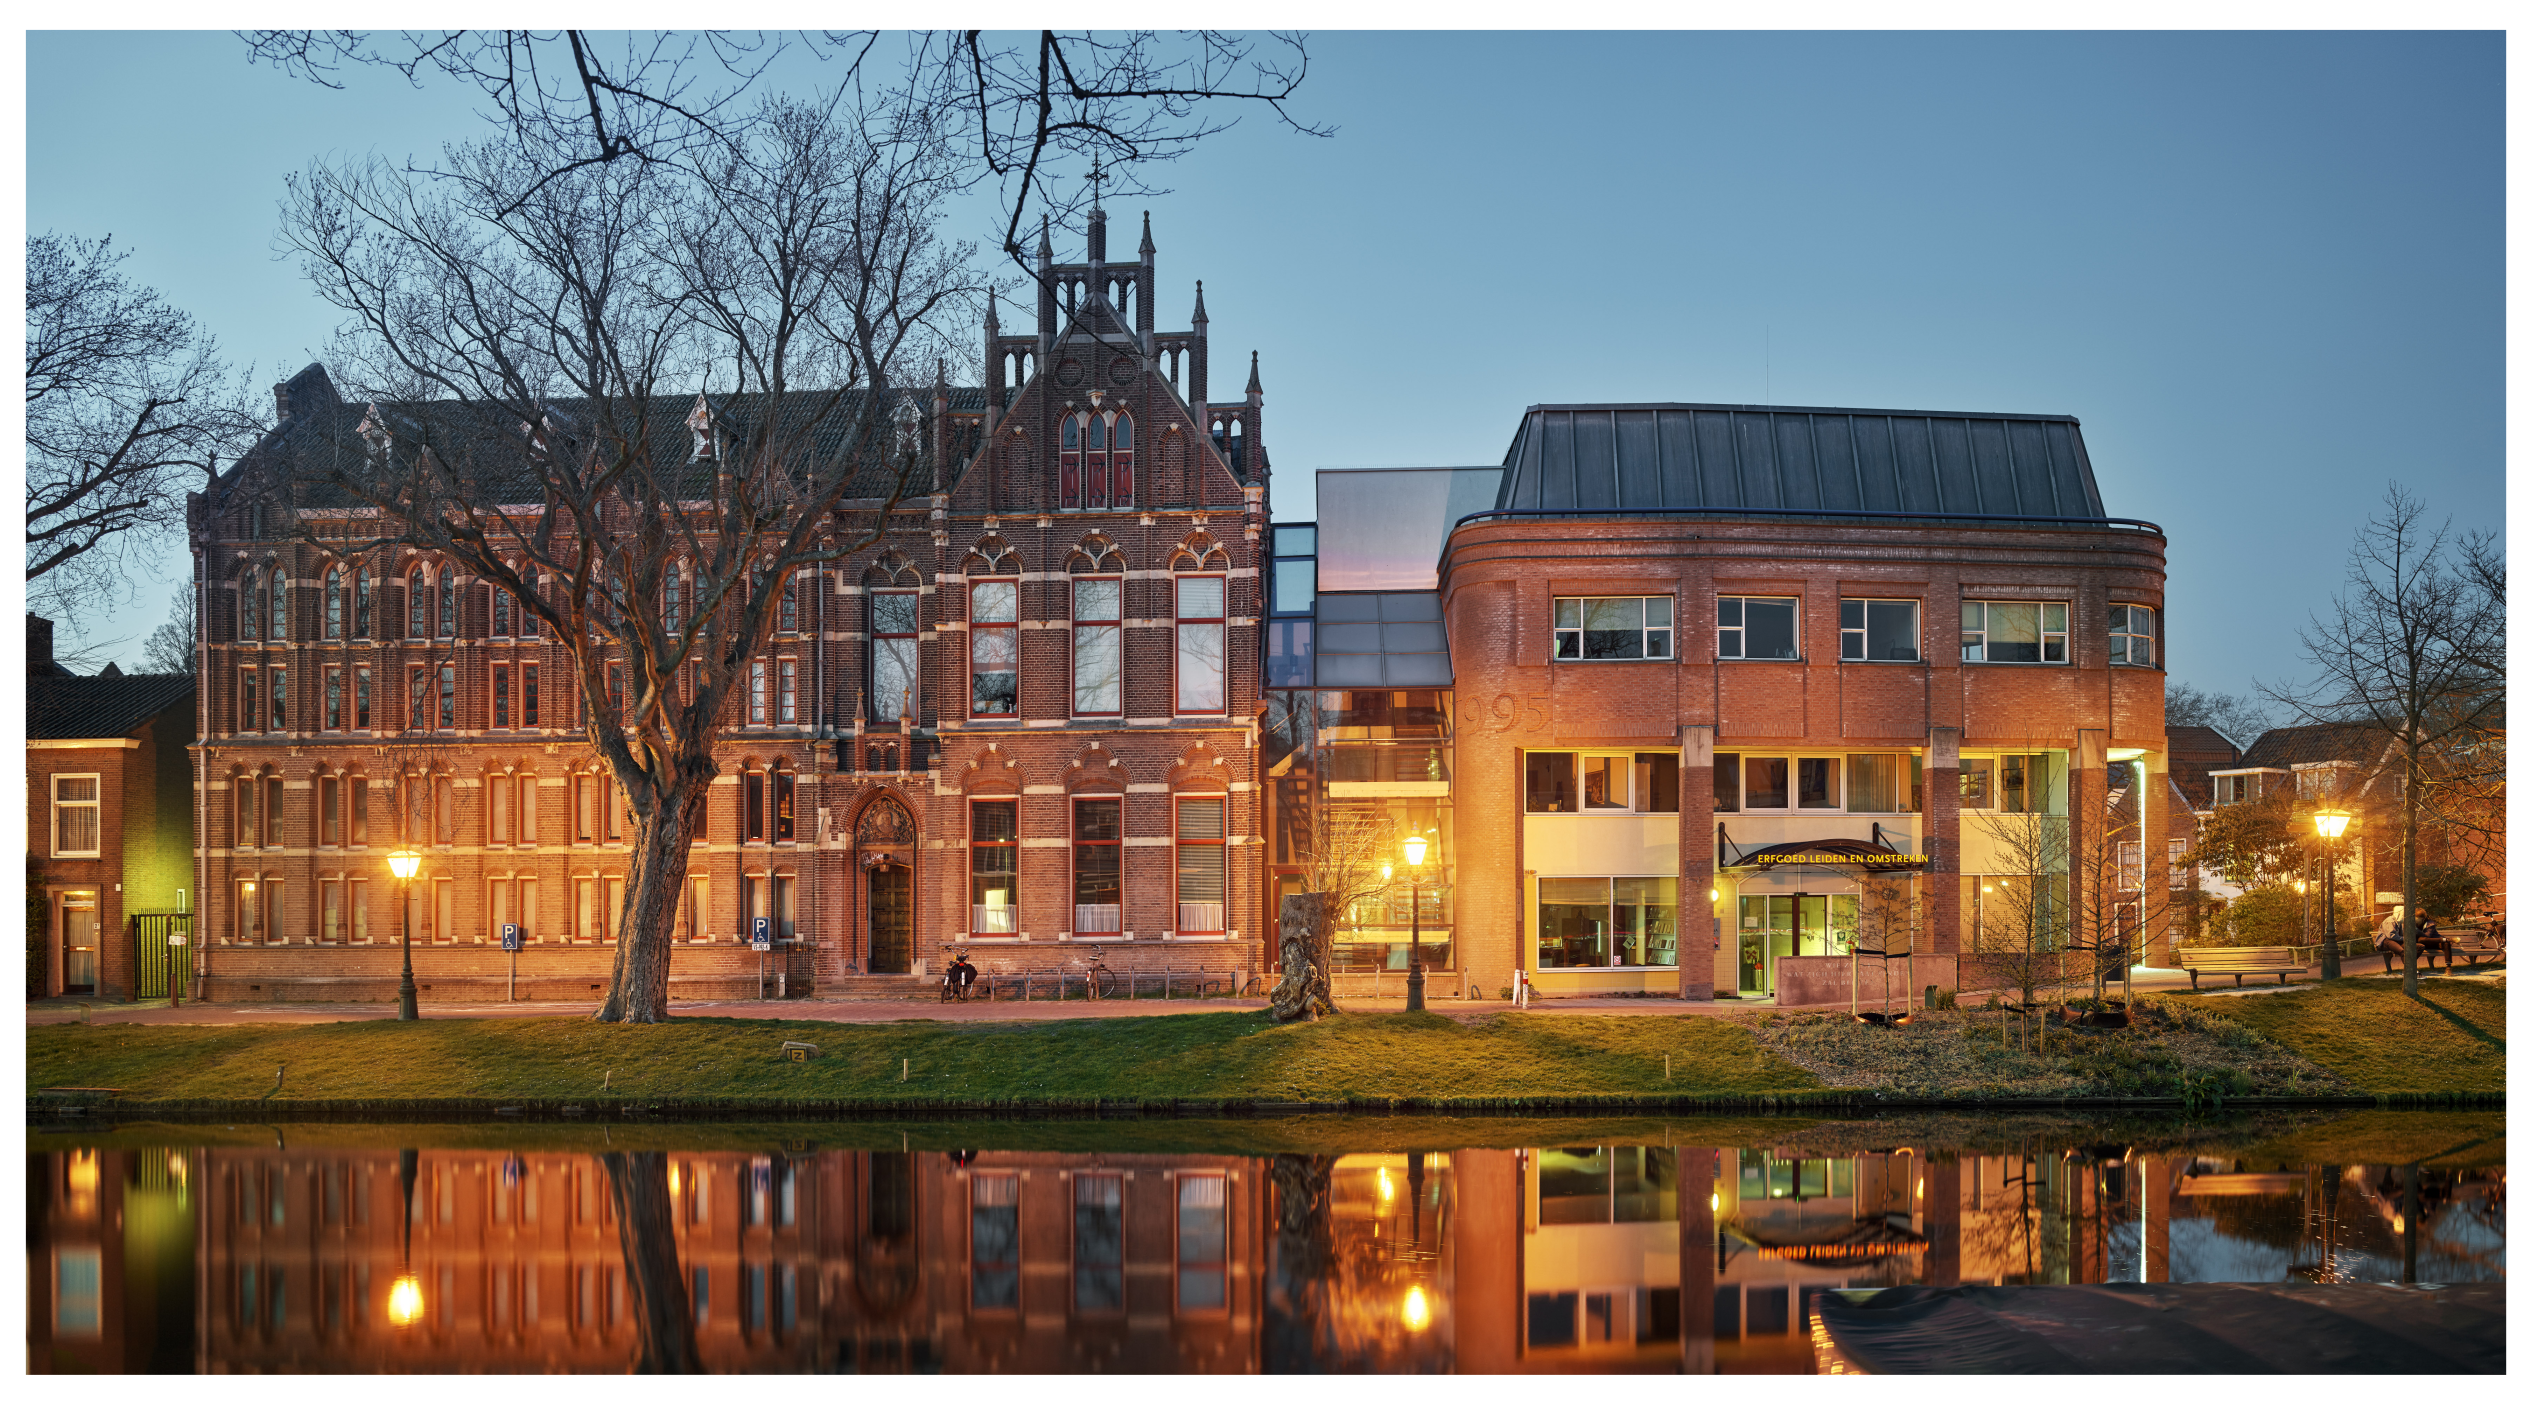
1. Introduction
Archives, libraries and museum storage preserve the majority of cultural heritage: for a typical museum, around 90% of the collection is placed in storage and 10% is on display (
https://www.bbc.com/news/uk-england-london-12214145 accessed on 20 February 2021). The indoor climate conditions in these buildings are important to ensure the longevity of objects and reduce degradation risks such as biological, chemical and mechanical degradation. In addition to many other factors, indoor temperature and relative air humidity play a vital role in collection conservation. Compared to archival buildings, indoor climates in museum galleries with objects on display are frequently researched. In exhibition galleries, the indoor climate parameters can be disturbed by visitor presence acting as a heat and moisture source [
1] and in archives, thermal and hygric inertia of the stored objects could be of influence [
2]. The current paradigm on environmental conditions in archives includes the preference for a low temperature (
T) and a relative humidity (
) that is more or less stable around the midrange [
3,
4,
5]. A high incorrect
T can accelerate the chemical degradation of organic material (e.g., cracking of leather bindings, yellowing of paper). Fluctuations in
T result in fluctuations in
which might, in case of continuous high
, accelerate mold growth, and the warping and curling of susceptible paper materials [
6,
7,
8]. In a recent study, the effect of cleaning procedures in a museum building on the variability of
was found. The use of water in the cleaning procedure should be minimized to prevent fluctuations [
9].
Guidelines and legislation often provide ideal values for ambient indoor climate parameters to ensure low degradation risks, i.e., strict prescriptive values resulting in a strictly controlled indoor climate. Meeting the requirements often means that archives are needed to implement a heating, ventilation and air-conditioning (HVAC) unit to compensate incorrect indoor T and conditions caused by, among other factors, the poor quality of the building envelope.
British legislation adjusted its storage requirements in recent decades from strict setpoints for
T and
[
10] towards more tolerant setpoints [
11]. Dutch archival legislation is, compared to the current British legislation, very prescriptive and strict about the permissible indoor climate [
12]. In recent years, two types of storages have been distinguished in the Dutch archival legislation: long-term, i.e., for over twenty years, and short-term, i.e., up to twenty years. The specifications for
T and
are less strict for short-term storage spaces. Instead of an 18
C setpoint with an allowed fluctuation of ±2
C for long-term preservation, a bandwidth is allowed for short-term preservation as long as the temperature stays within the range of 16–20
C and the permissible fluctuations for
have been doubled from ±5% to ±10%. Long-term specifications require more energy to maintain than the short-term specifications, even though the minimum and maximum values for
T are similar.
Archives and libraries house a bulk of hygroscopic materials (i.e., large paper collections). The limited occupancy of staff and visitors results in less need for ventilation and thermal comfort. This has resulted in a new way of thinking about ventilation purposes in archives and opened opportunities for possible energy savings. Several studies investigated possibilities such as intermittent conditioning [
13,
14], increasing building envelope quality [
15] and seasonal setpoint adjustment [
6,
16].
In addition to the adjustment of the climate control in archives, multiple building physics-related measures have been investigated in the literature. Limiting external factors such as the external climate is required for a storage environment. Passive measures are pursued such as reducing air infiltration by sealing cracks and increasing the thermal insulation of walls. Optimizing ways to limit the impact of the outdoor climate has resulted in a plethora of studies on passive and low-energy museum storage and archive buildings [
17,
18,
19,
20,
21,
22,
23]. The underlying thought is that the storage facility needs a large hygrothermal storage capacity and an airtight building envelope to reach a stable
T and
for preservation purposes. Thermal buffering is also a result of the ground and building envelopes’ thermal capacity. External seasonal fluctuations are delayed and mitigated through buffering. In addition to a stable (and low)
T,
buffering is mainly caused by the collection materials and the building’s walls. Small HVAC systems with limited capacity may be needed to provide (de)humidification and pollutant filtering. The limited energy demand may be provided by renewable energy sources such as solar panels. Holl et al. [
24] suggested that a newly built depot building should consider passive measures to reduce energy demand—ideally, with the so-called archival concrete which has high water retention properties and low initial moisture levels. Another study advocates passive measures whilst noting that infiltration needs to be kept low. This would maintain a low level of daily fluctuations and may reduce investments in air-conditioning systems [
25]. Smedemark et al. compared spatial distributions for
T/
between a semi-passive repository without mechanical ventilation compared to a repository with an HVAC system [
23]. The study showed, with data collected from an extensive grid measurement, that both repositories upheld an acceptable climate performance. The study was performed in a purpose-built building for safekeeping heritage. The investigated repositories have no external walls but are connected to service areas [
23].
The deterioration mechanisms of unstable objects highly depend on environmental conditions [
26]. In order to increase the longevity of archival collections, enclosures such as archival boxes or envelopes have been largely adopted in this field. These enclosures form an extra layer that mitigates disruptive ambient climate variations. Studies based on laboratory experiments exist and a number of in situ measurements in operational archives have been performed. Wilson et al. [
27] showed the effect of objects in enclosures in open shelves based on risk mitigation and dust transfer. Limited research has been found on in situ hygrothermal measurements in archival boxes. The National Archives in the UK showed that relative humidity in an archival enclosure, such as an archival box or envelope, can have different values compared to the ambient conditions in the used environmental test chamber [
28]. Clare et al. described that under certain circumstances, the
in a box increases beyond the ambient
conditions. Such a circumstance is, for example, a quick drop in ambient
conditions. Humidity is being delayed in the archival box even if the levels are higher than ambient conditions. The microclimate shows fluctuations even when it has not reached the ambient level. This study showed that it would take approximately over a week to reach an equilibrium inside the box when ambient conditions have changed significantly [
28]. In a white paper, the Image Permanence Institute disclosed several conclusions drawn from a large study where photographs, paper, books and the use of different enclosures were tested in laboratory settings [
29]. Intentional temperature set-backs, based on energy saving potential, showed that the temperature change was distributed quite fast through the used samples. Only hours passed for the core of the test sample to reach thermal equilibrium. Moisture variations seemed to be mitigated due to the used enclosures. The test samples showed a distinct difference between the surface and the core. One of the major conclusions was that the
fluctuations in the test samples in the box were less dependent on change in ambient
, but more on temperature change.
Given the current trends in designing and developing low-energy storage facilities and the more traditional required climate specifications in Dutch Archives, the question is to what extent the dependence on technology (i.e., HVAC) can be reduced while still maintaining appropriate conditions for collection preservation. Smedemark et al. [
23] showed that semi-passive climate control is promising, however, the conclusions are valid for repositories in purpose-built storage facilities with limited external walls. External temperatures of below 0
C during wintertime and above 25
C during summer were present. Indoor conditions of archival or library facilities housed in existing or even historic buildings are more likely to be affected by conditions in adjacent rooms or external climate conditions [
14]. Storage spaces are often packed with archival collections in special archival racks. The large amounts of hygroscopic material is able to stabilize
when ventilation flows are reduced [
2,
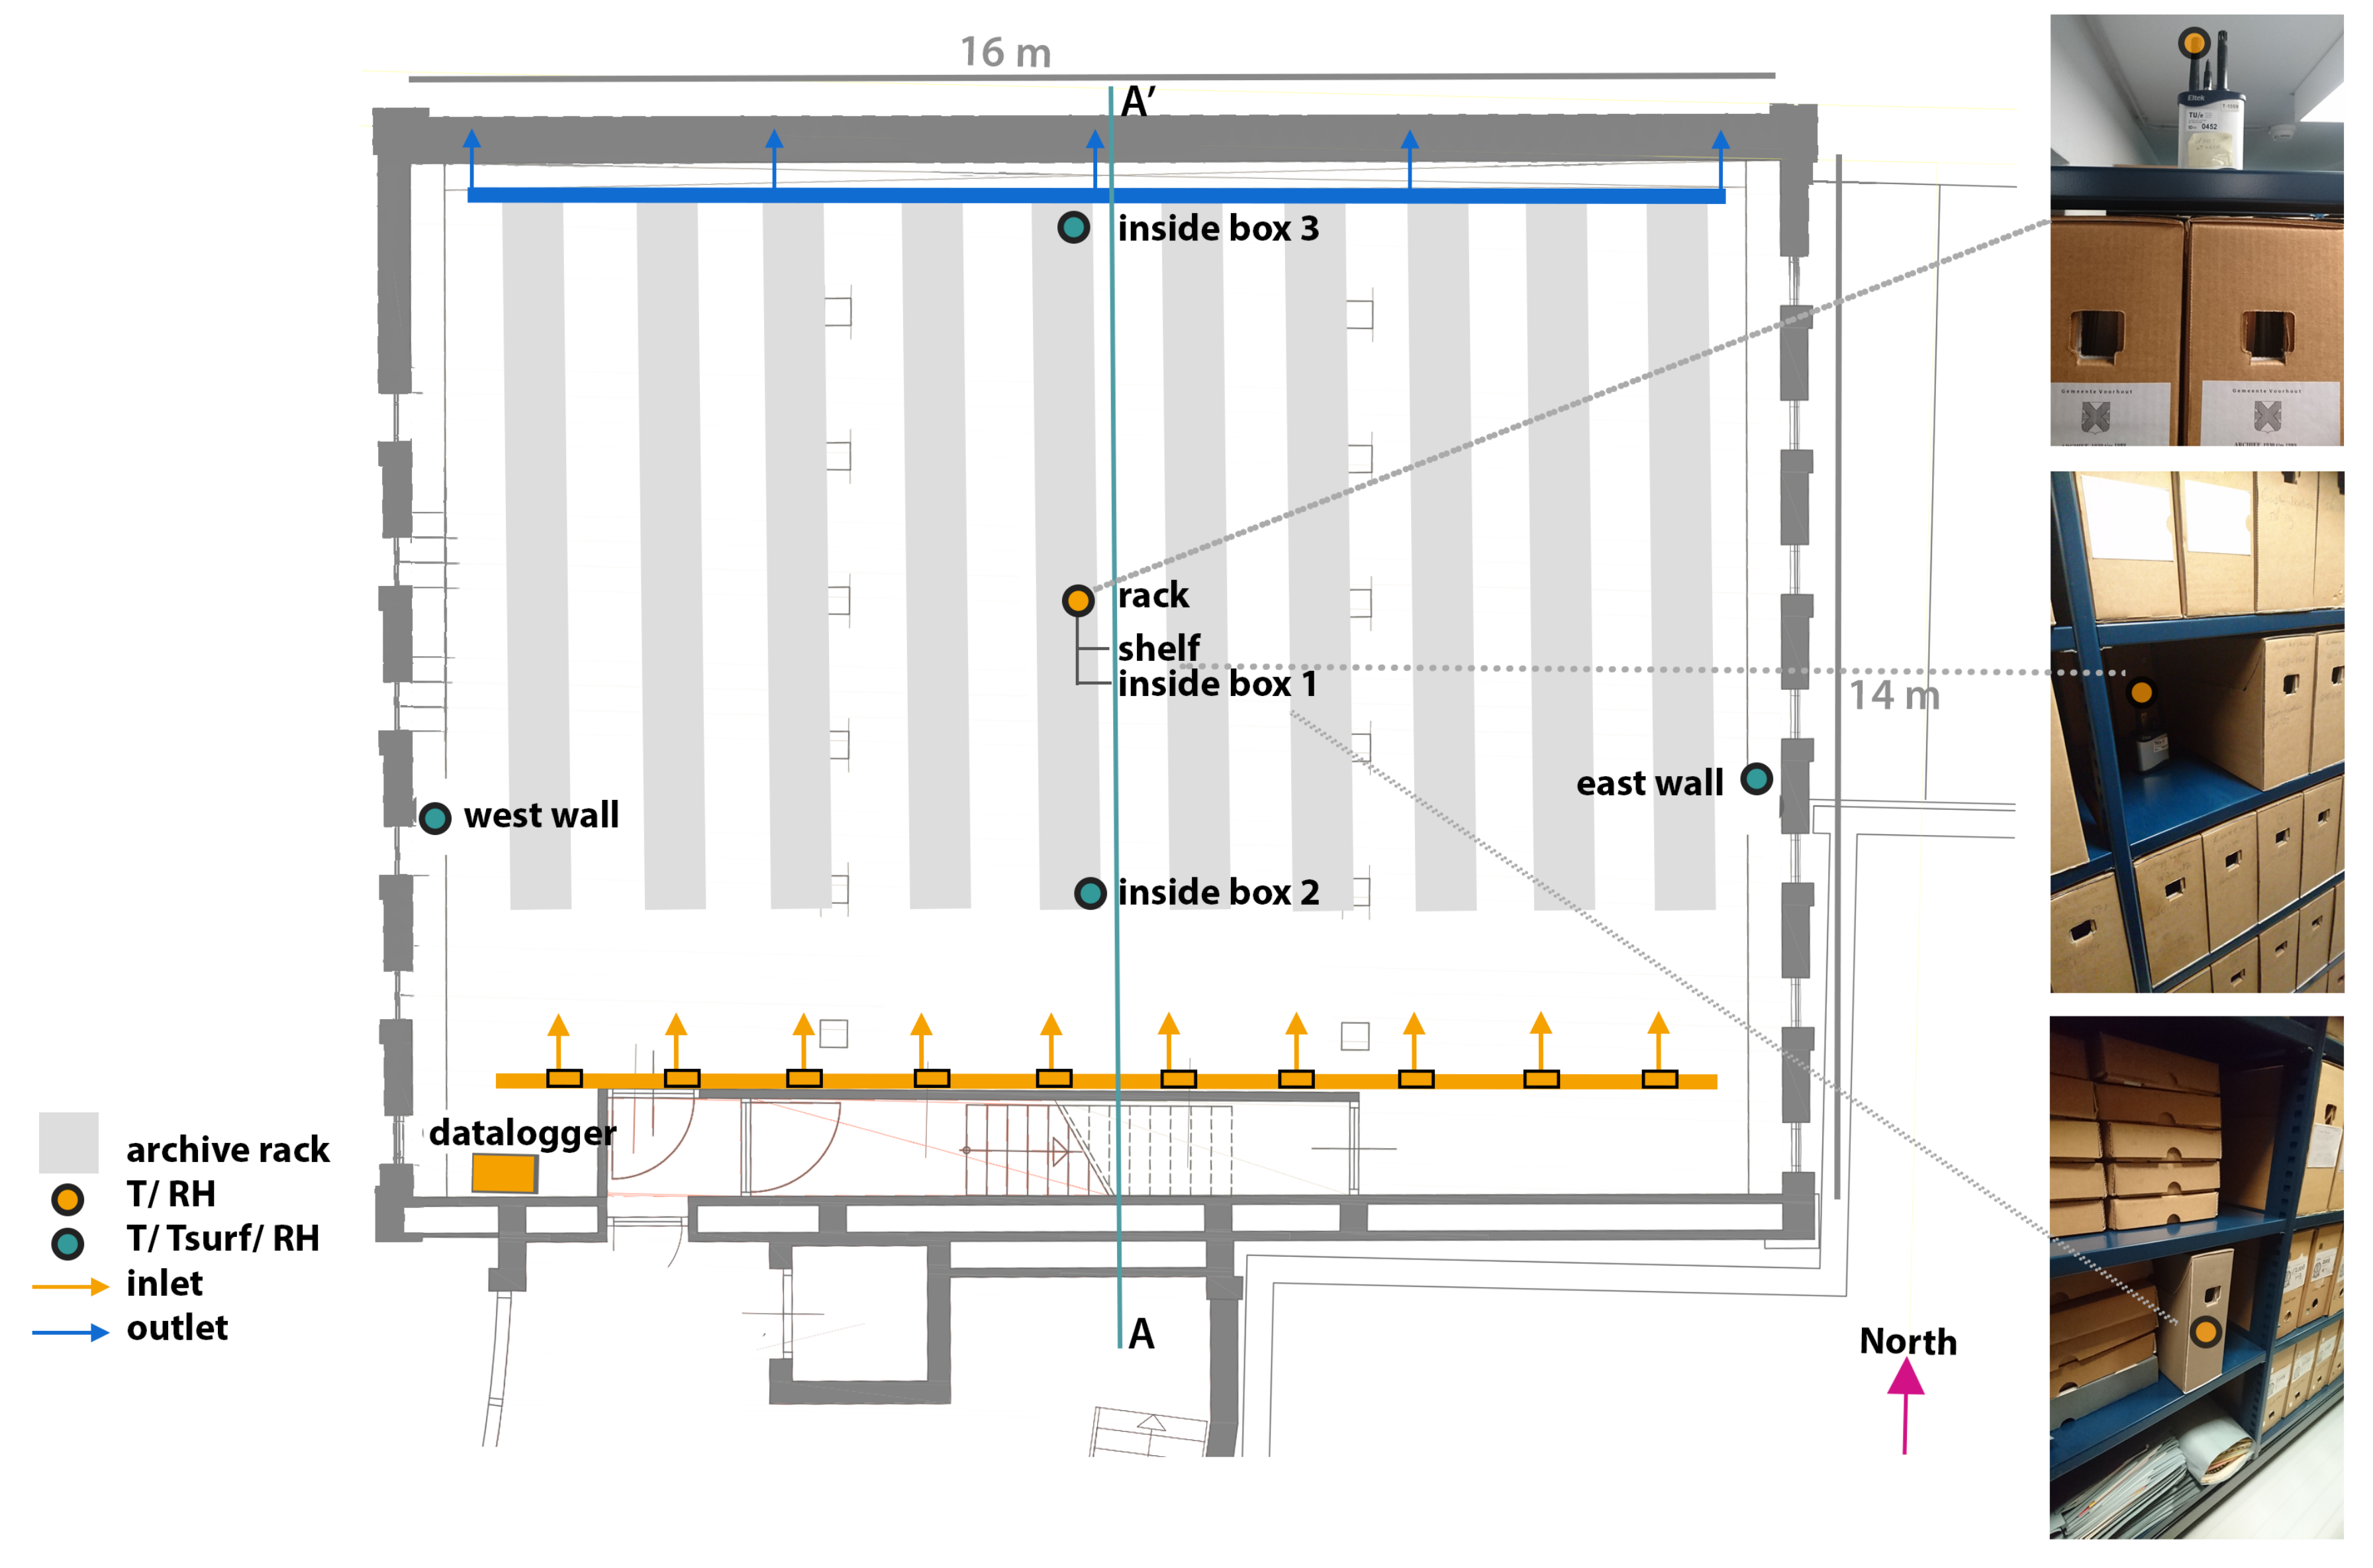
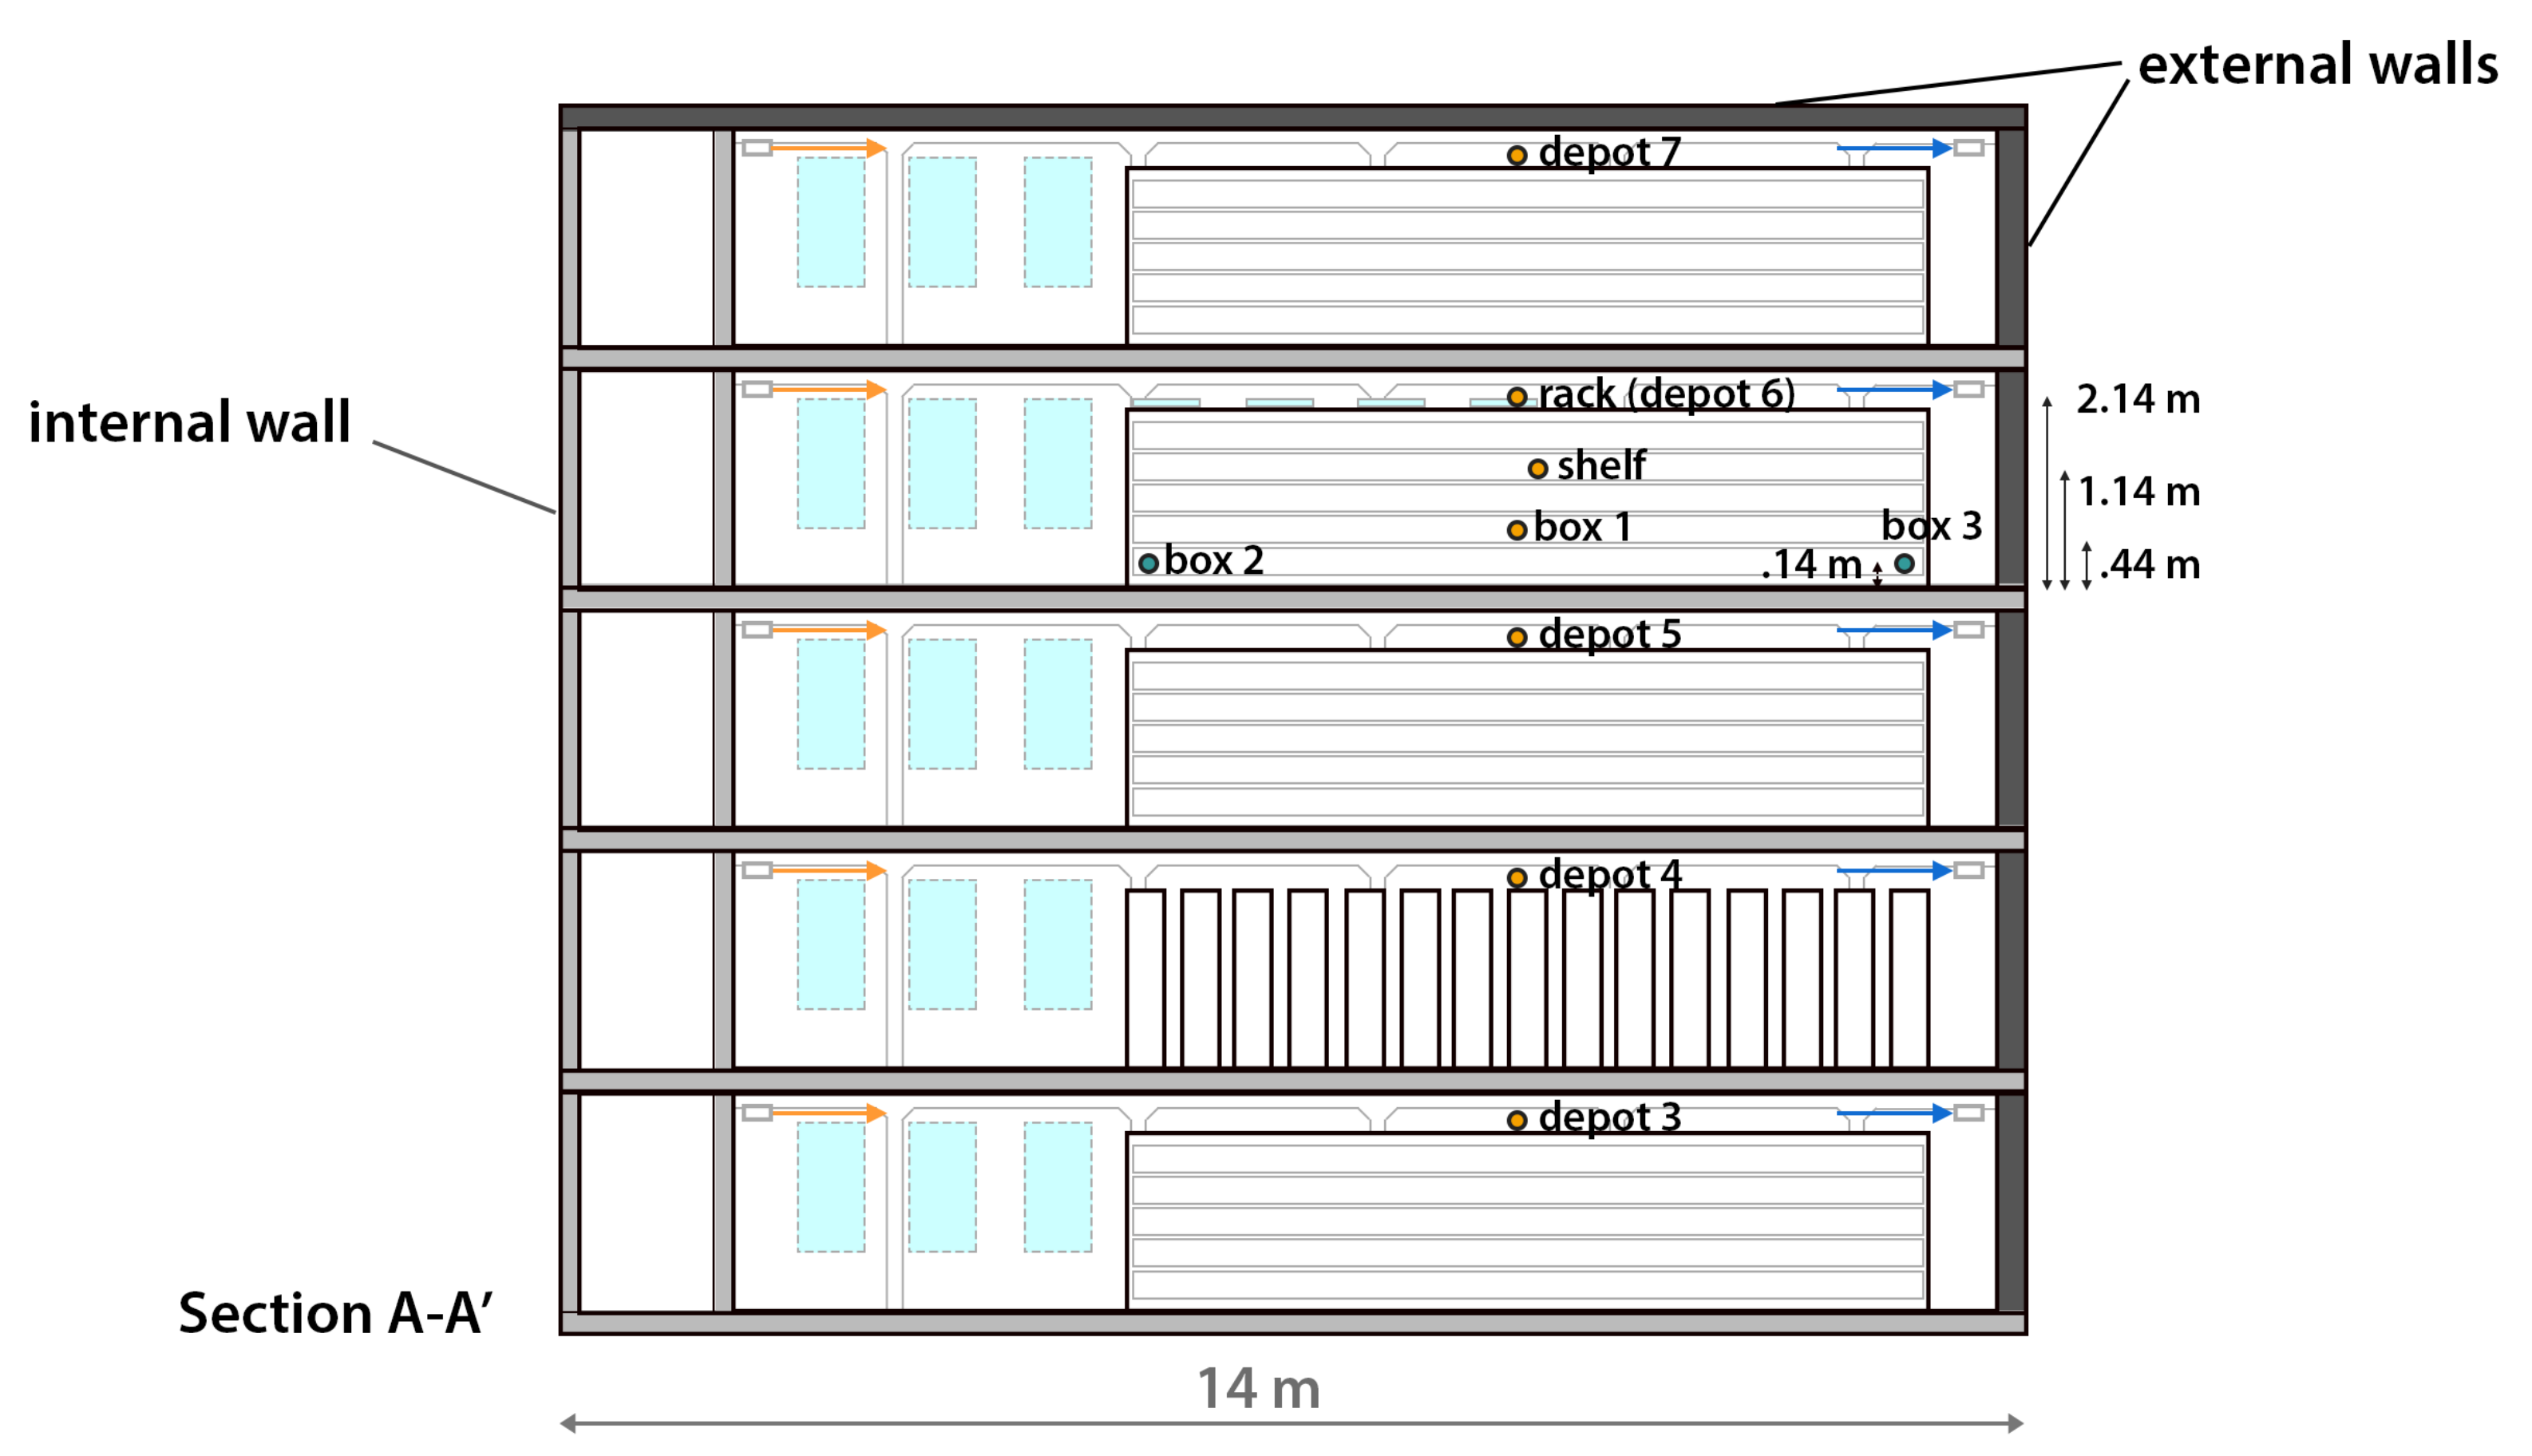
30]. The archival racks form bluff bodies meaning they separate airflow and stagnant air zones might occur resulting in microclimates. Stable and homogeneous conditions are largely dependent on the airflow distribution in a room. In repositories, an air handling unit (AHU) is to a large extent responsible for the distribution and good mixing of air. It is therefore important to understand to what extent airflow is influenced by the repository design. Guidelines and legislation provide requirements for ambient indoor climate parameters, however, they do often not consider other factors that influence the near-object environment such as the use of archival boxes, airflow distribution and archival rack placement.
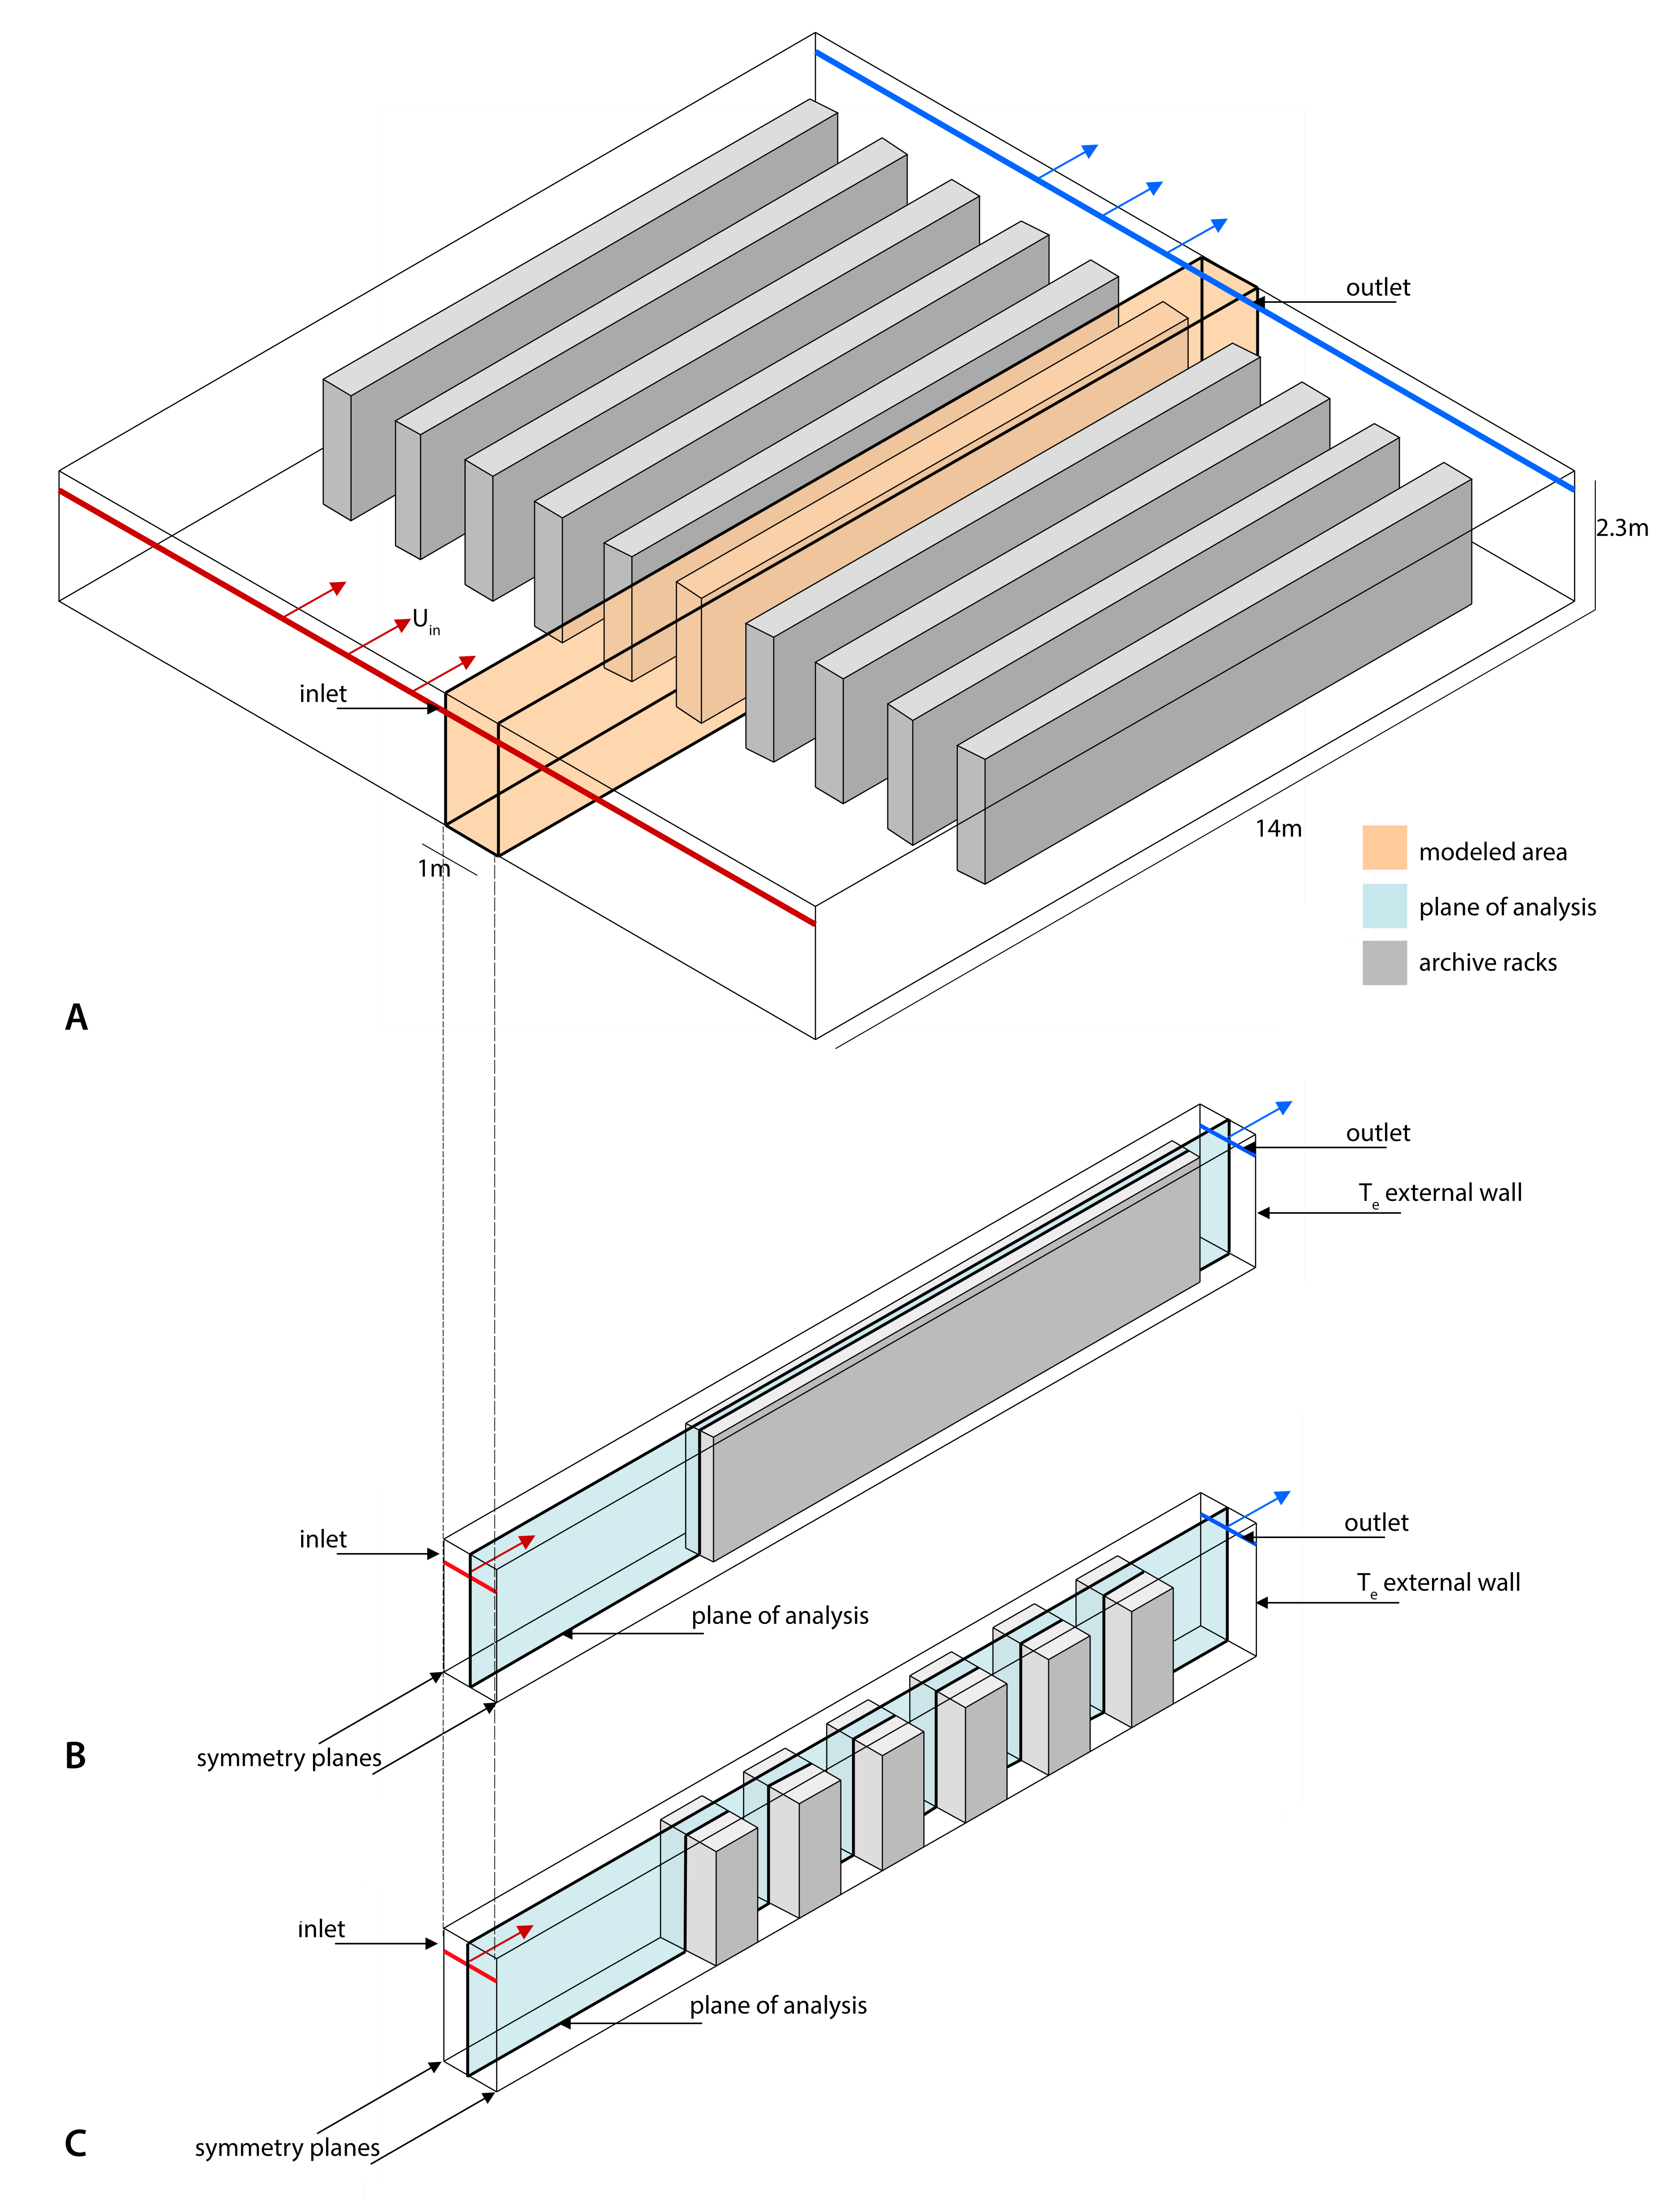
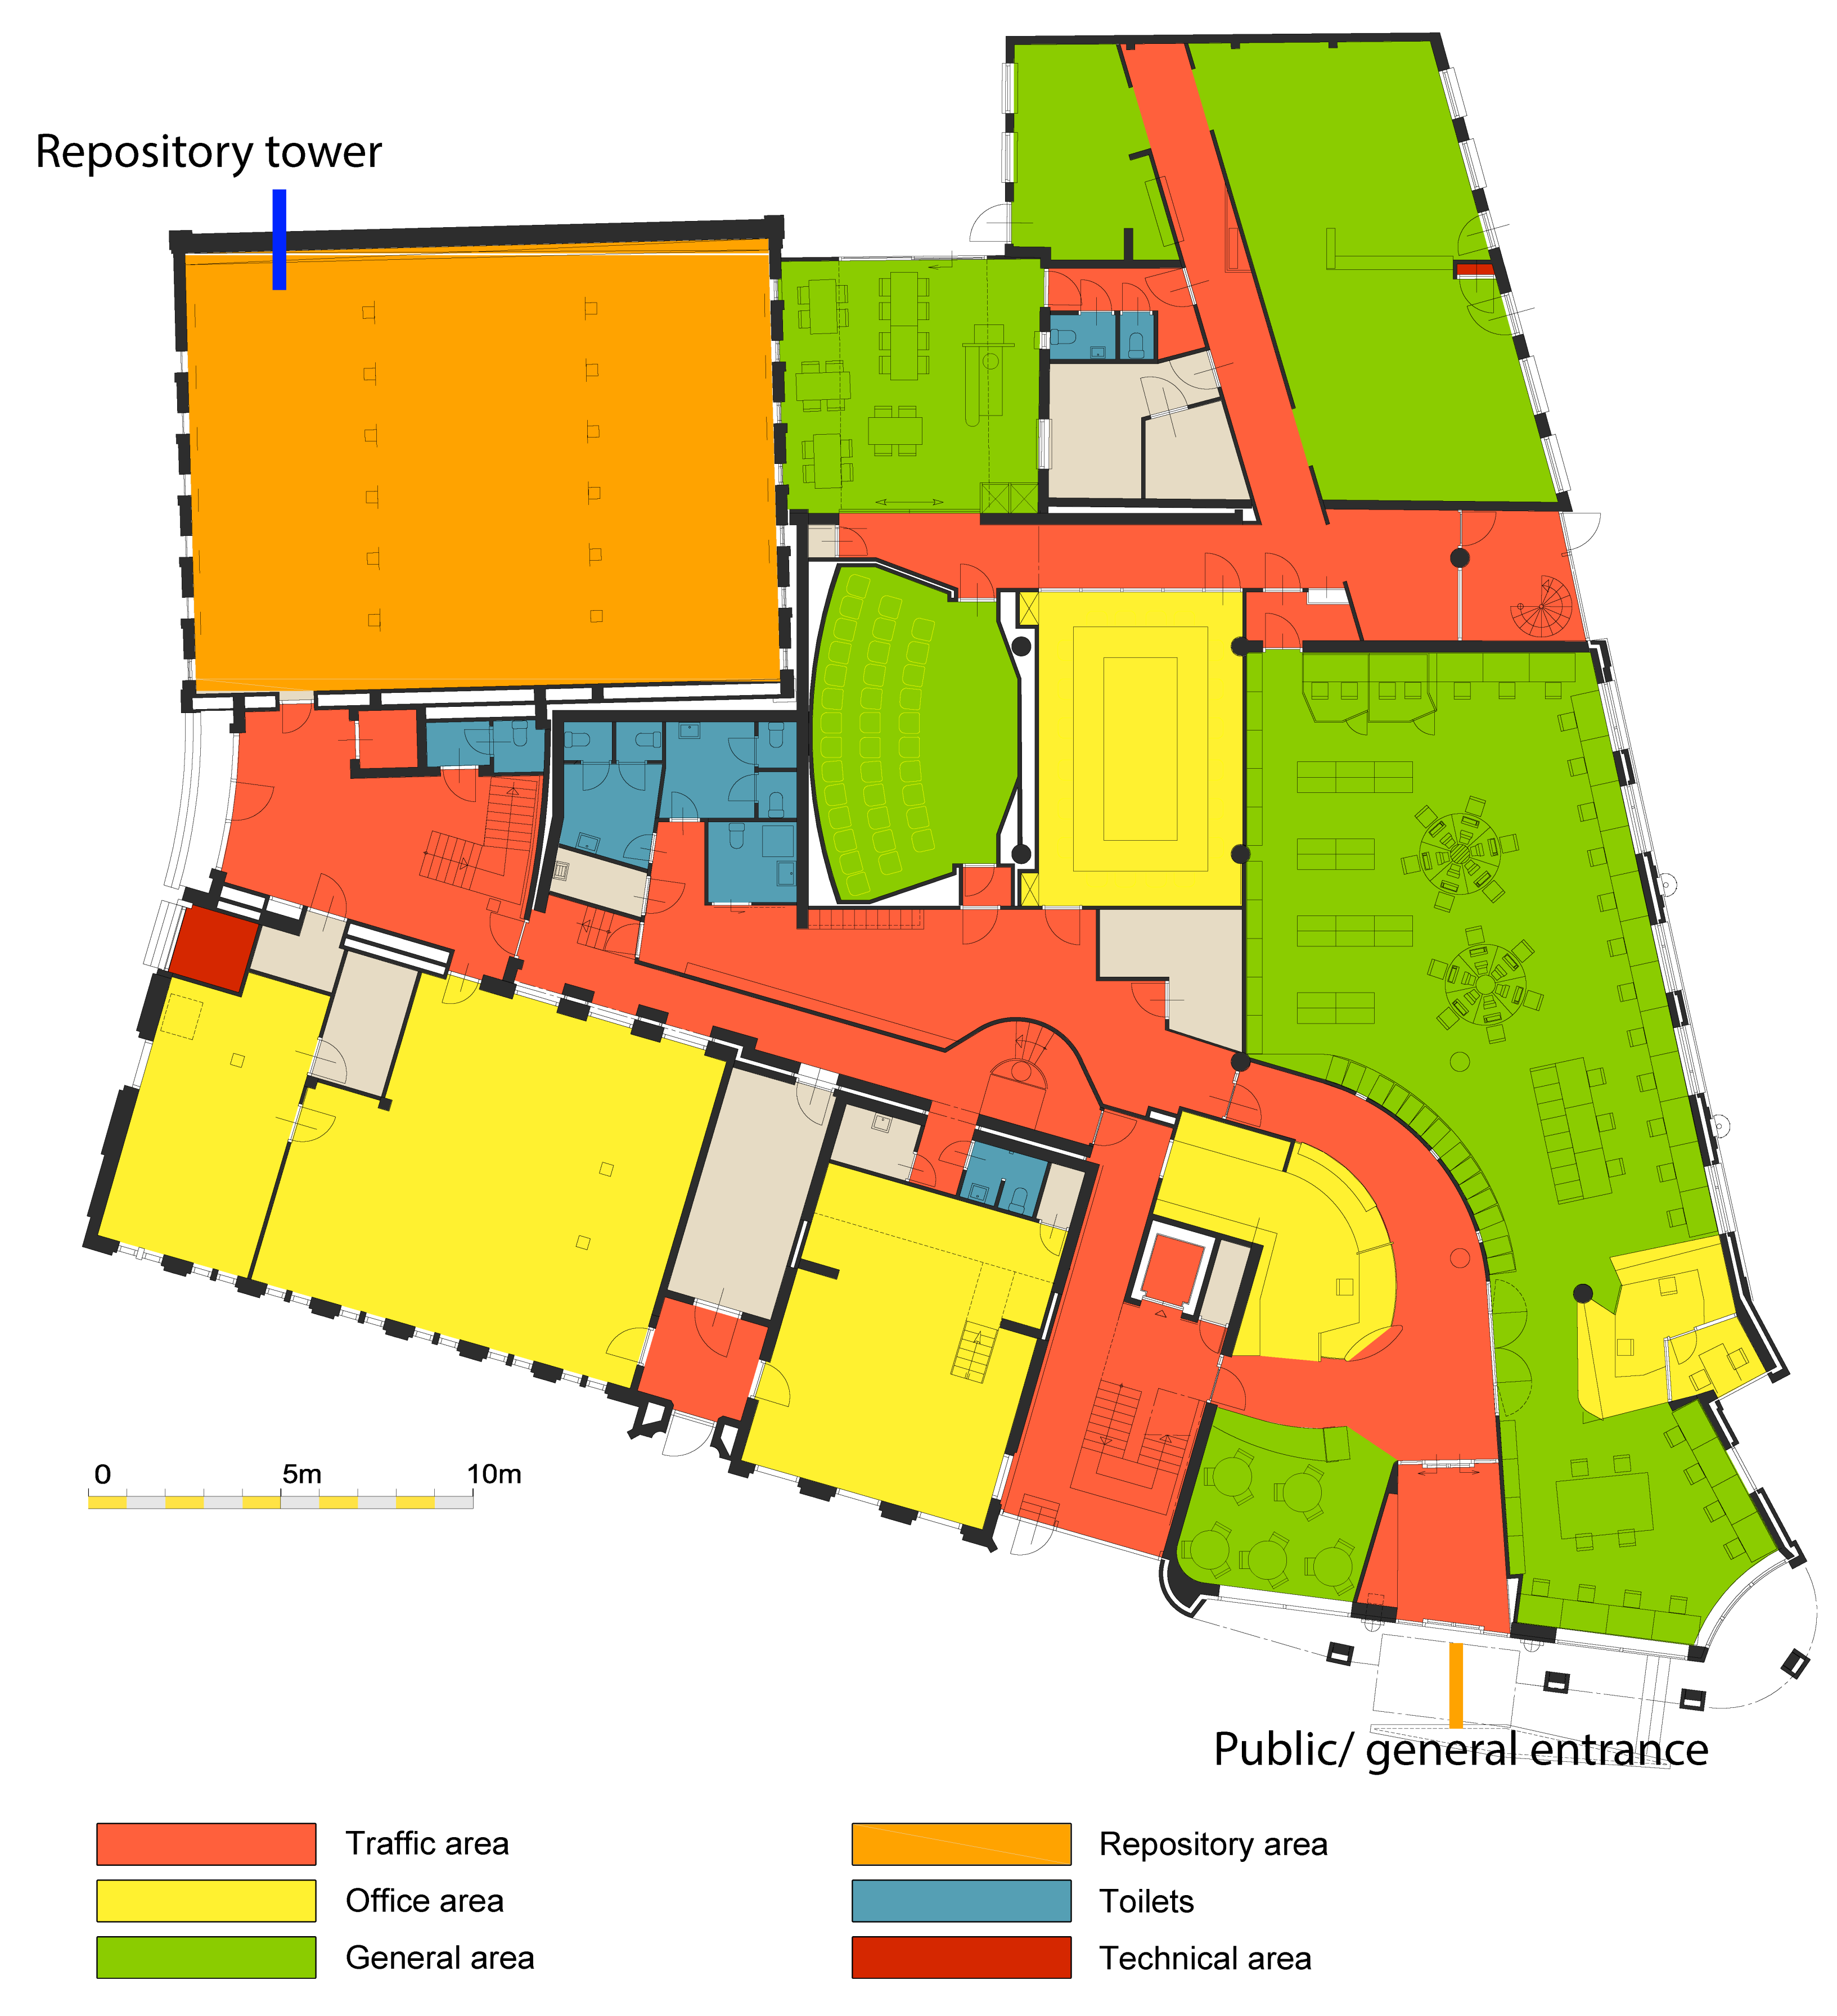
This study aimed to provide more insight into the relation between the ambient indoor conditions in repositories and the hygrothermal conditions surrounding the collection. Through an experimental campaign, hygrothermal indoor conditions provided insight into the use of archival boxes to create a favorable preservation microclimate. A numerical study was conducted to help investigate whether the HVAC air supply and extraction and the archival rack placement had an influence on the indoor airflow distribution. Without increasing the risk to the archival collection, computational modeling provided quantitative means to investigate the results from the measurements and whether reducing the air supply during a limited amount of time had influence on stable indoor conditions suitable for the preservation of heritage collection.
The following research questions have been formulated to structure the current study:
How do the ambient hygrothermal conditions of the repository affect archival box hygrothermal conditions?
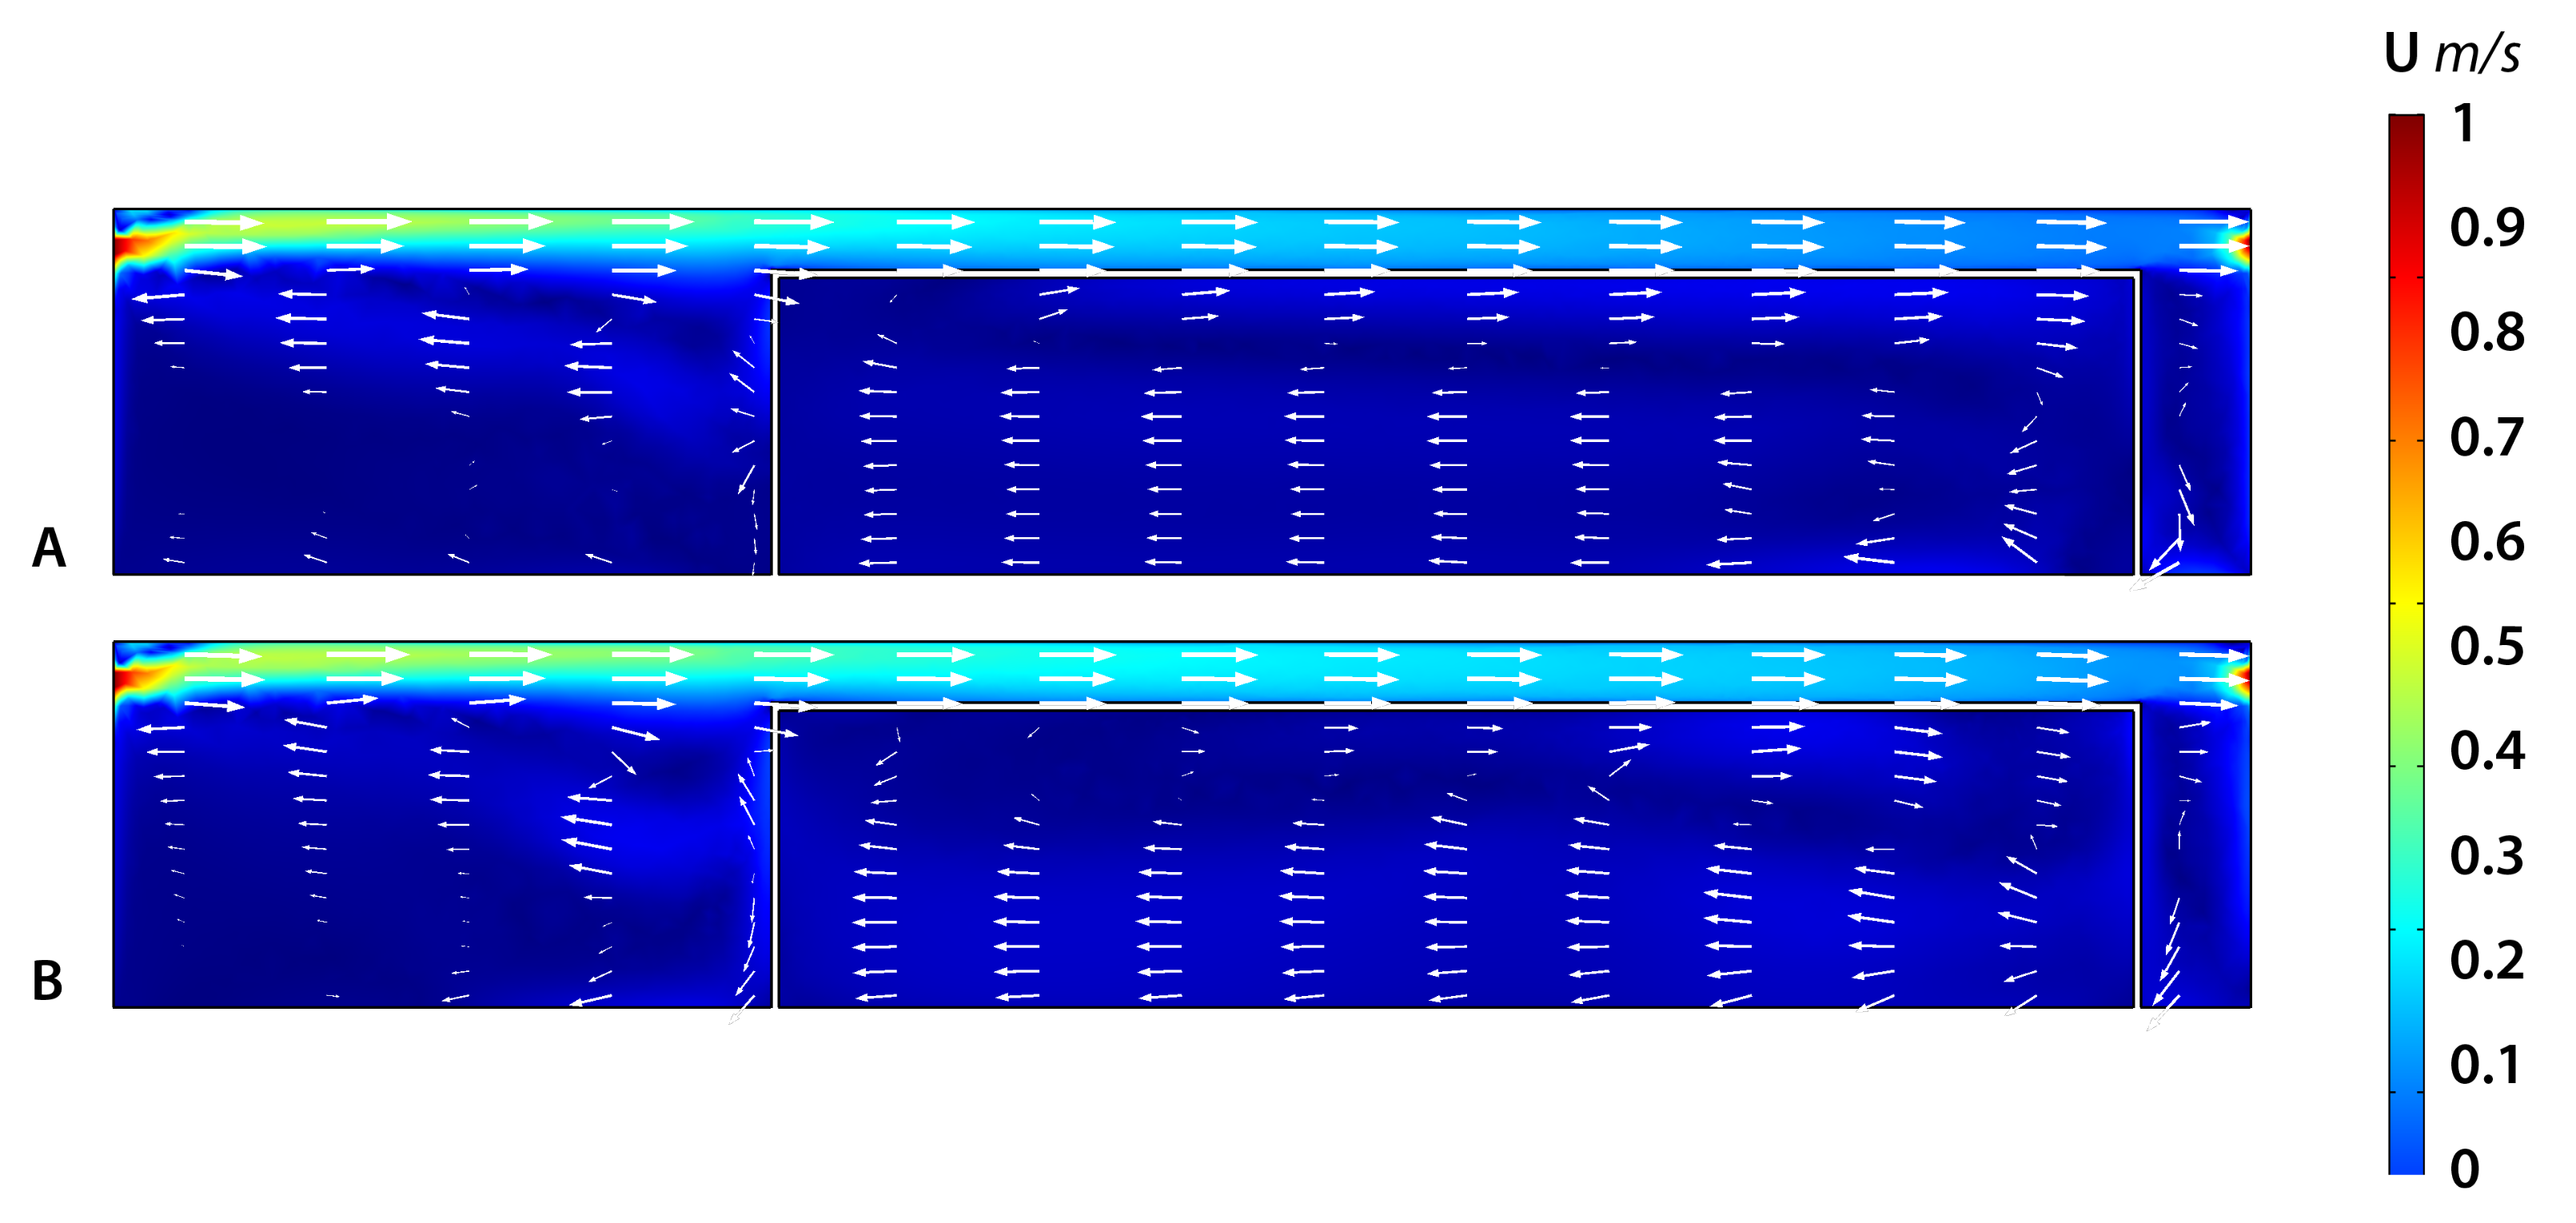
In what way does the orientation of archival racks influence the air distribution of the supplied air and therefore the homogeneity of ambient air conditions?
What is the effect of a reduction in ventilation at night on the hygrothermal conditions and air distribution throughout the repository?
This paper is structured as follows: in the next section, the used methodology of the experimental and numerical research is described in detail. Results are discussed in the section thereafter and lastly, the discussion section will end with the conclusions drawn.
5. Discussion
While legislation provides normative indoor climate requirements, meeting these proves difficult. The influence of the building envelope design and building system design on indoor climate parameters is significant. It is recommended that collection placed near external walls is monitored closely. This is mainly the case when low thermal quality walls are present in the building. While Dutch archival legislation mentions to be careful of placing objects near the floor and ceiling, no mention of adjacent areas with different climate conditions was mentioned [
12]. A solution to overcome this would be to increase the thermal insulation of the building envelope, for passive buildings a U-value of 0.10–0.15 W/m
K is recommended. Increasing thermal insulation would create a buffer between external climate and indoor climate in which a low
T would be maintained. Another option would be to look into the sufficient airflow distribution in the repository, however, this seems the less energy conserving option which, without innovative solutions, would result in an increase in the dependency on (climate control) systems. This research could be of help for arranging the archival racks to optimize the airflow mixing of inlet conditions. The research provides interesting information for “closed” archive systems (i.e., rolling rack storage) where the racks are placed against each other with a limited form of airflow in between and the investigated fixed archival racks. Dutch archival legislation provides requirements per type of rack set-up and how much air-circulation needs to be present [
12]. Further research could be performed tp optimize the filling ratio of shelves in different rack configurations for increased buffering capacity.
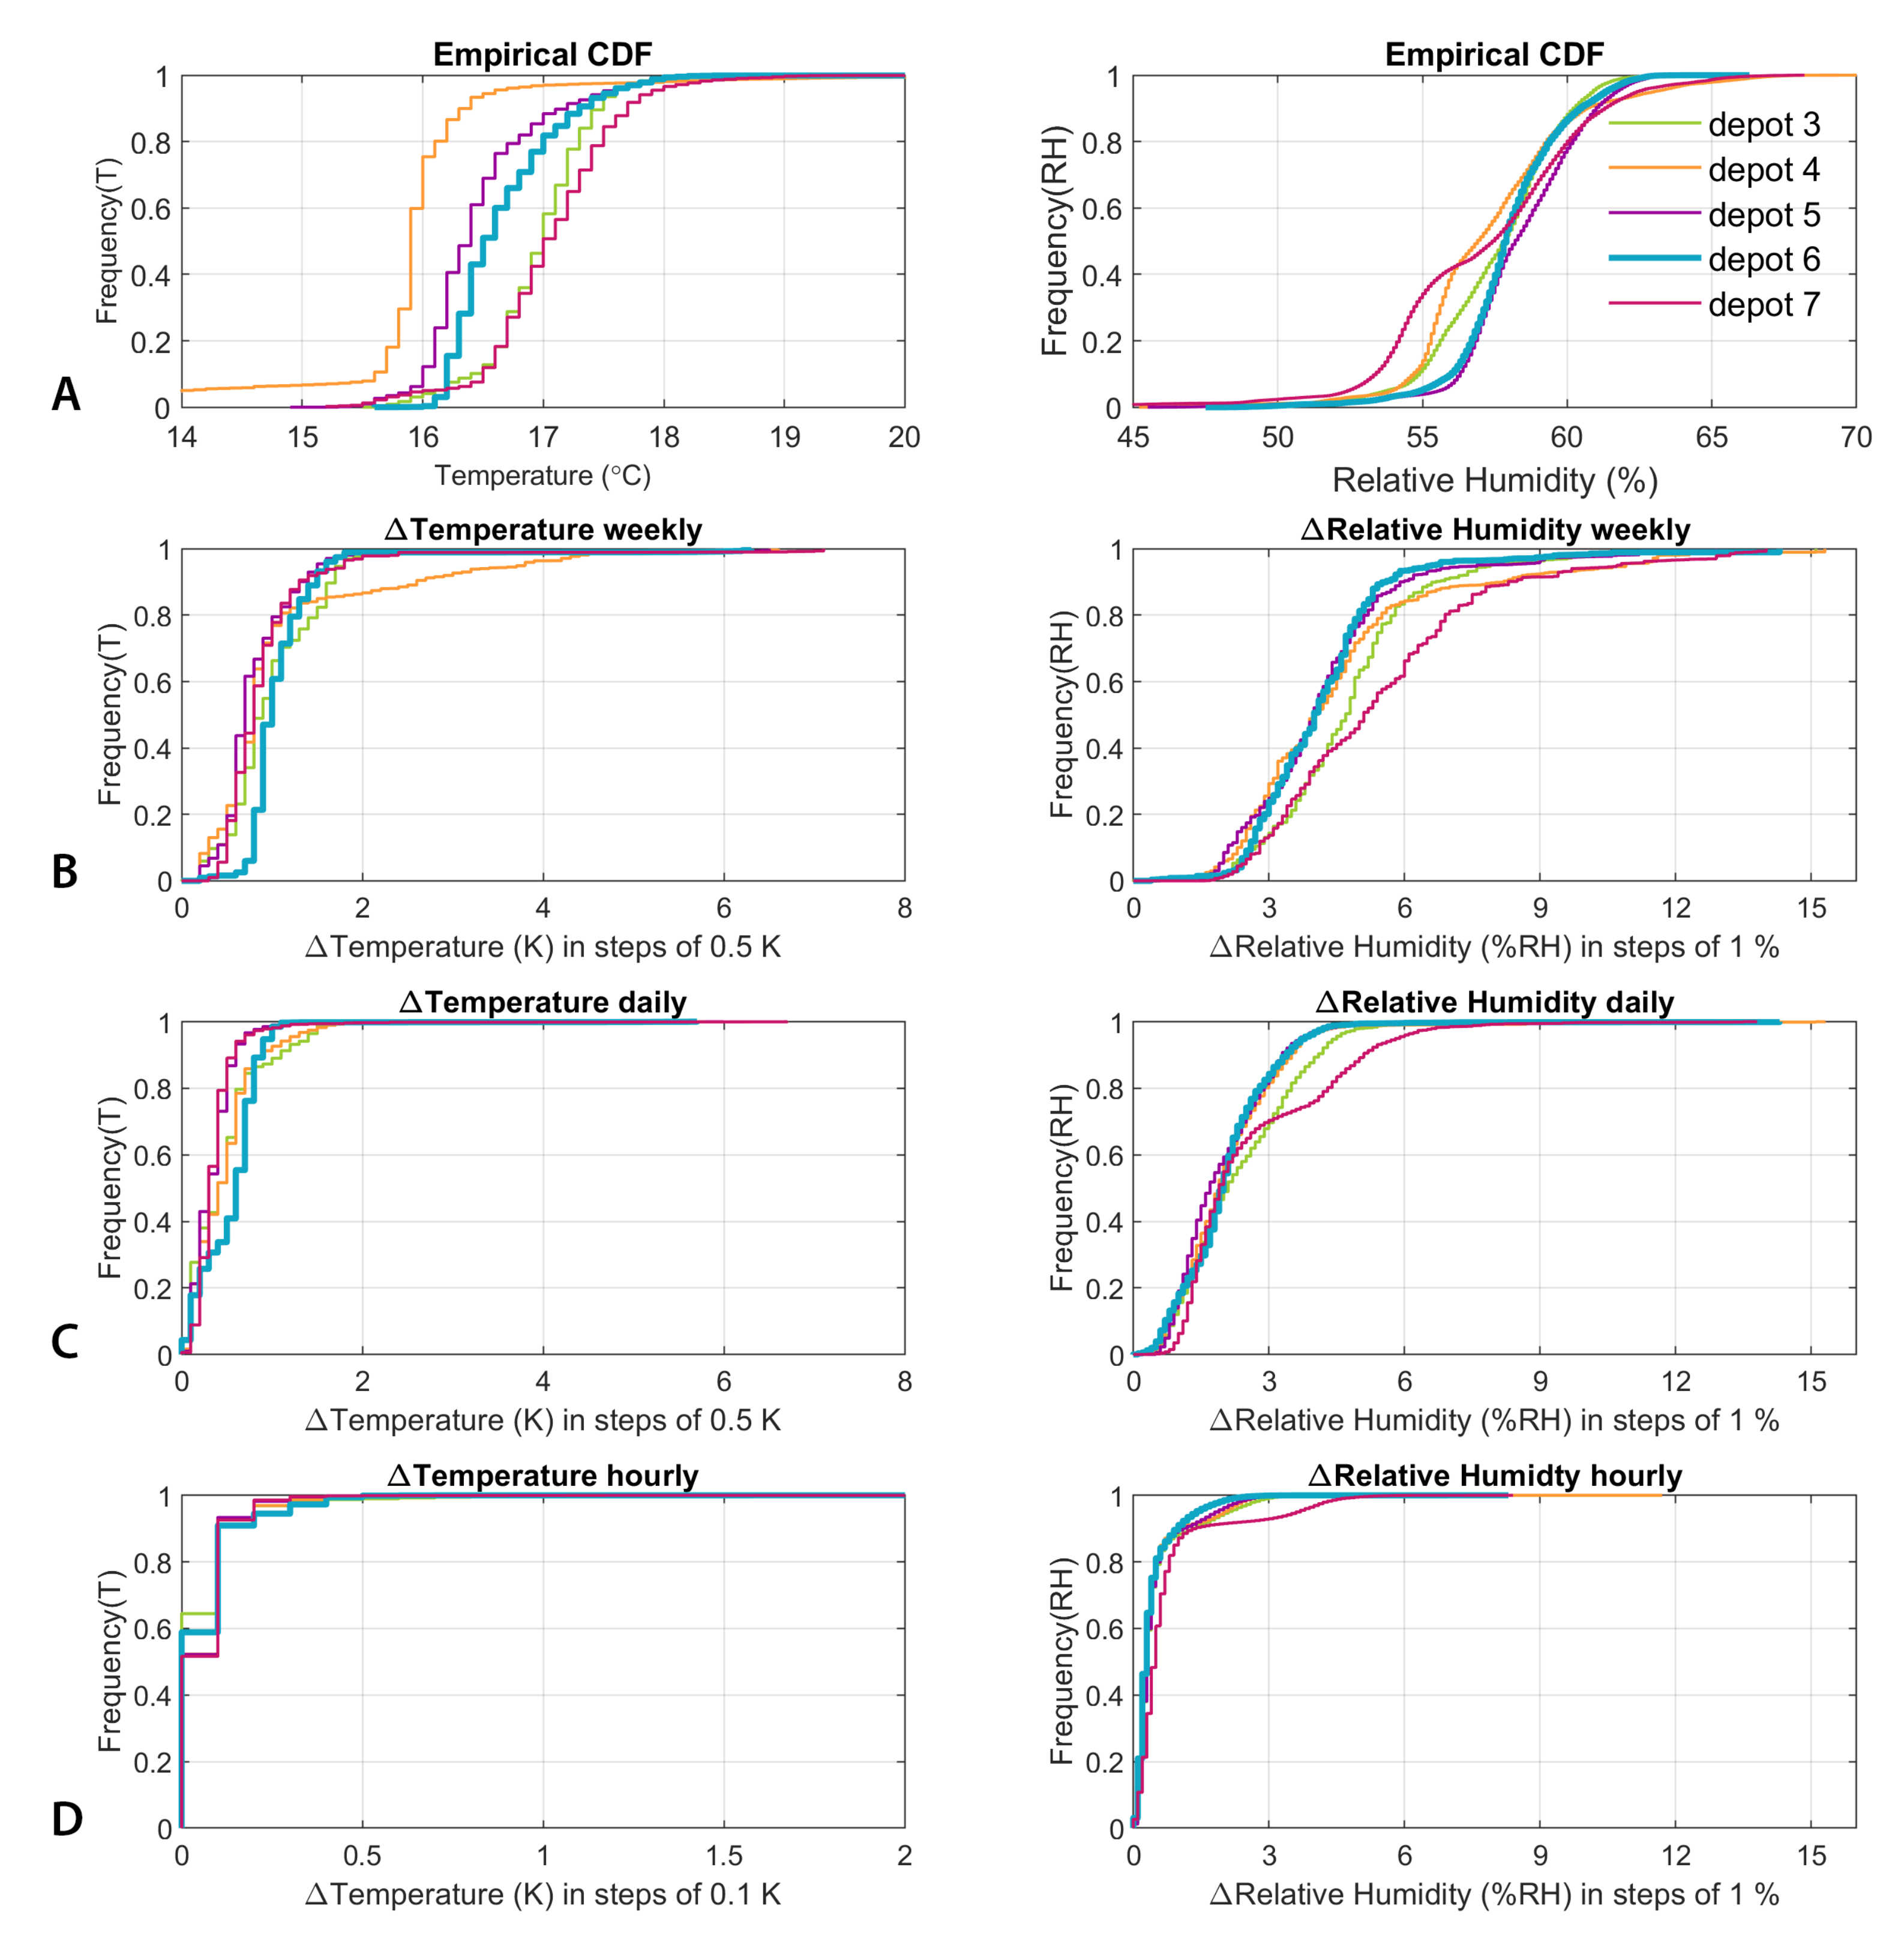
Measurements and numerical modeling provide insight into the climate conditions in repositories. While it is common to monitor the ambient indoor air conditions of a space or in the HVAC return duct, the experimental part of the research shows that locally deviating indoor climates are present and the ambient indoor conditions do not represent the hygrothermal conditions of the repository inside archival boxes. While stable
T and
are required by legislation, this study shows that even though an HVAC system is present, stable conditions might not be maintained and near the external wall, daily
T fluctuations occur.
T/
cycling seems not to be of influence for chemical degradation and preventing fluctuations is not necessary from a chemical decay point of view [
42]. This would underscore the idea of using passive ways to maintain preservation conditions (specifically low, stable
T which results in a stable
) in archival facilities where daily fluctuations are almost canceled out but seasonal fluctuations do gradually occur [
17]. With passive or semi-passive measures, the effect on the accumulation of volatile organic compounds (VOCs) needs to be considered [
23,
43].
A limitation of the current study is the lack of extensive validation based on air velocity distribution measurements. The numerical study was used as a means to understand the hygrothermal measurement results. For this, the inlet velocity was measured short-term and compared with the building management system velocity. The building management system inlet velocity was used as an imposed boundary condition. To gain more accuracy in the numerical model, the calculated air distribution needs to be compared with measurements.
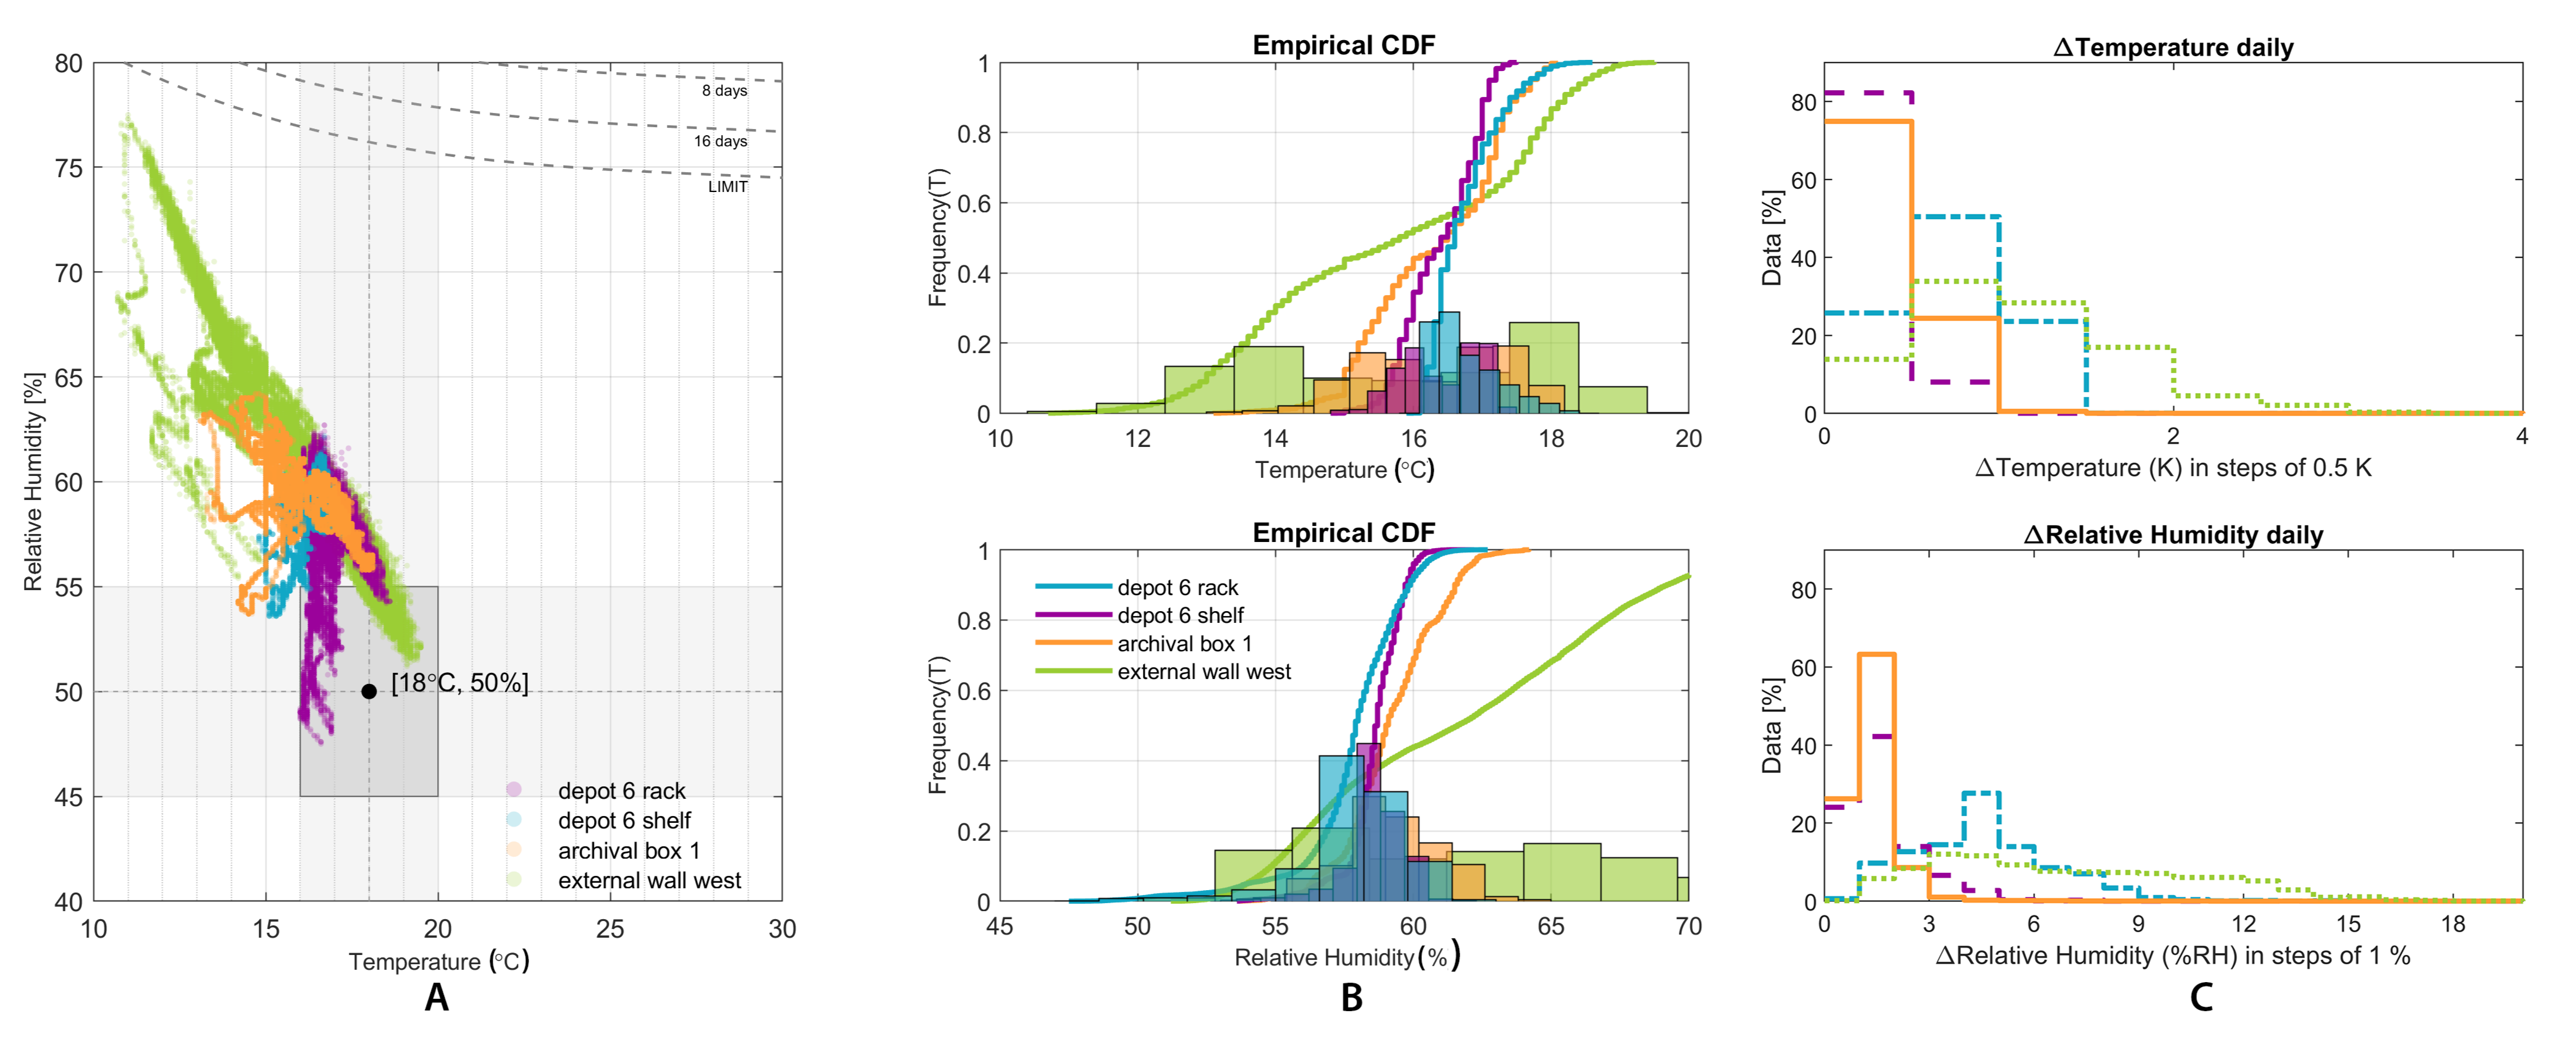
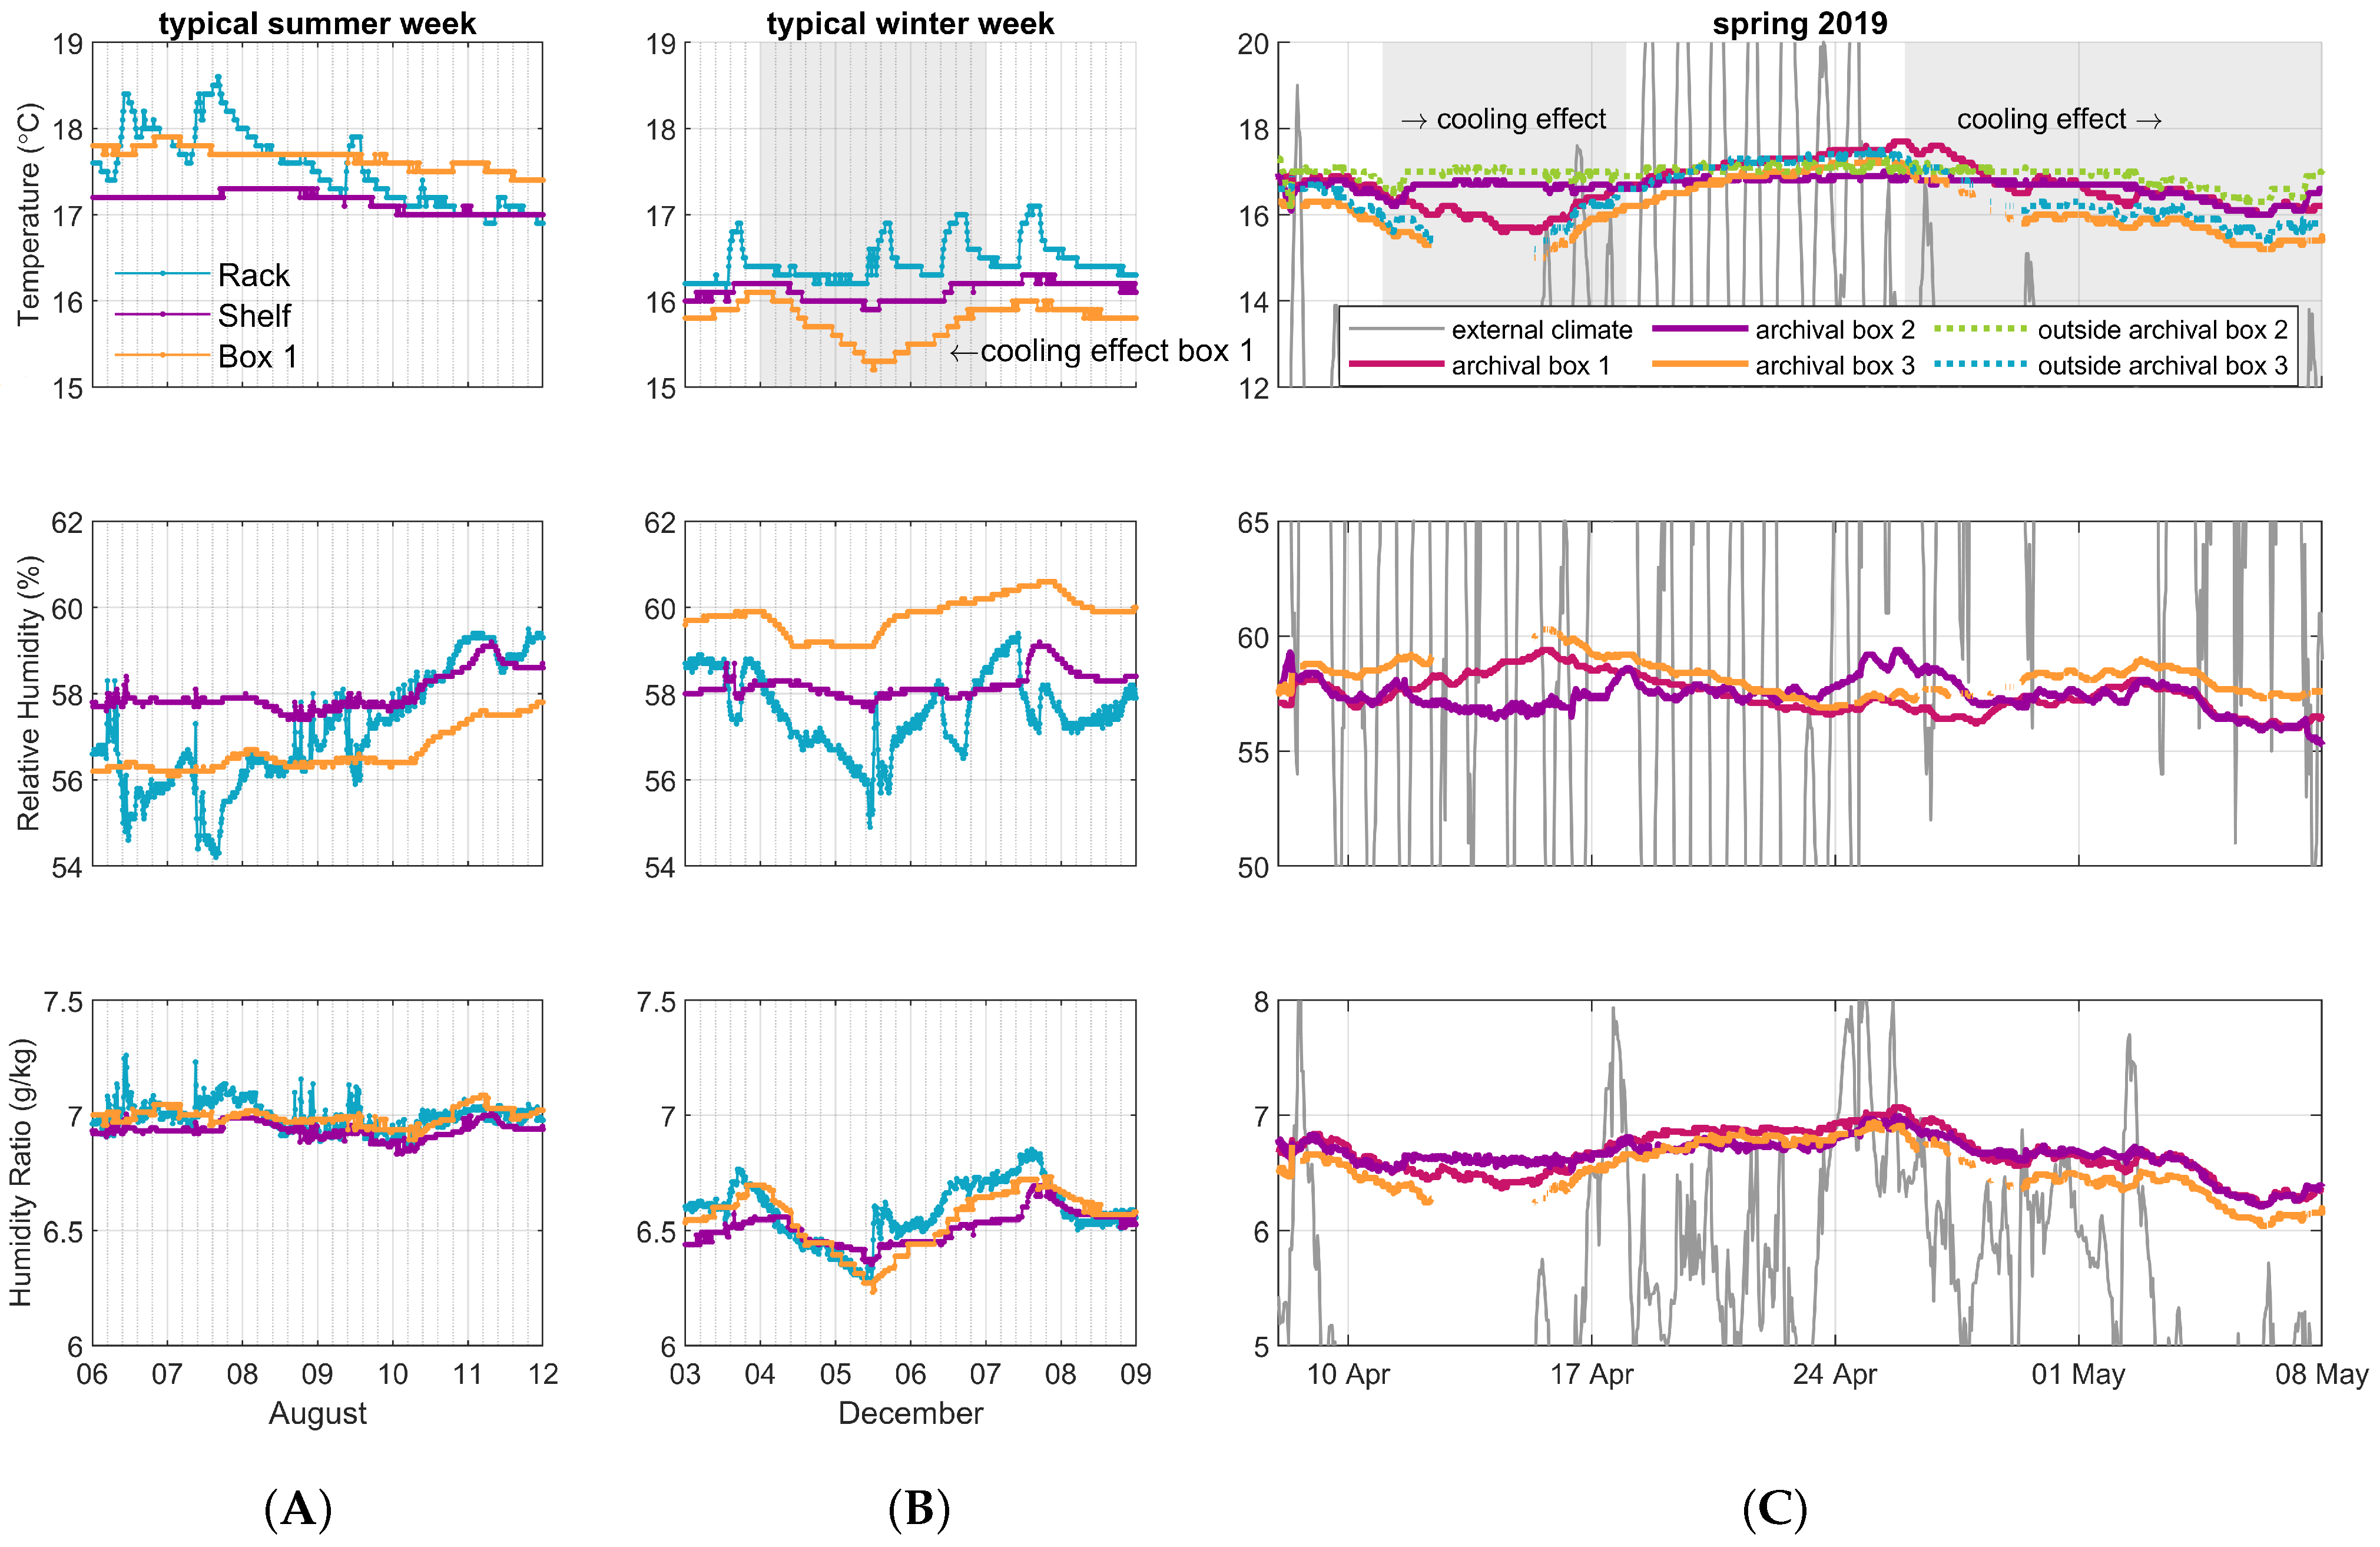
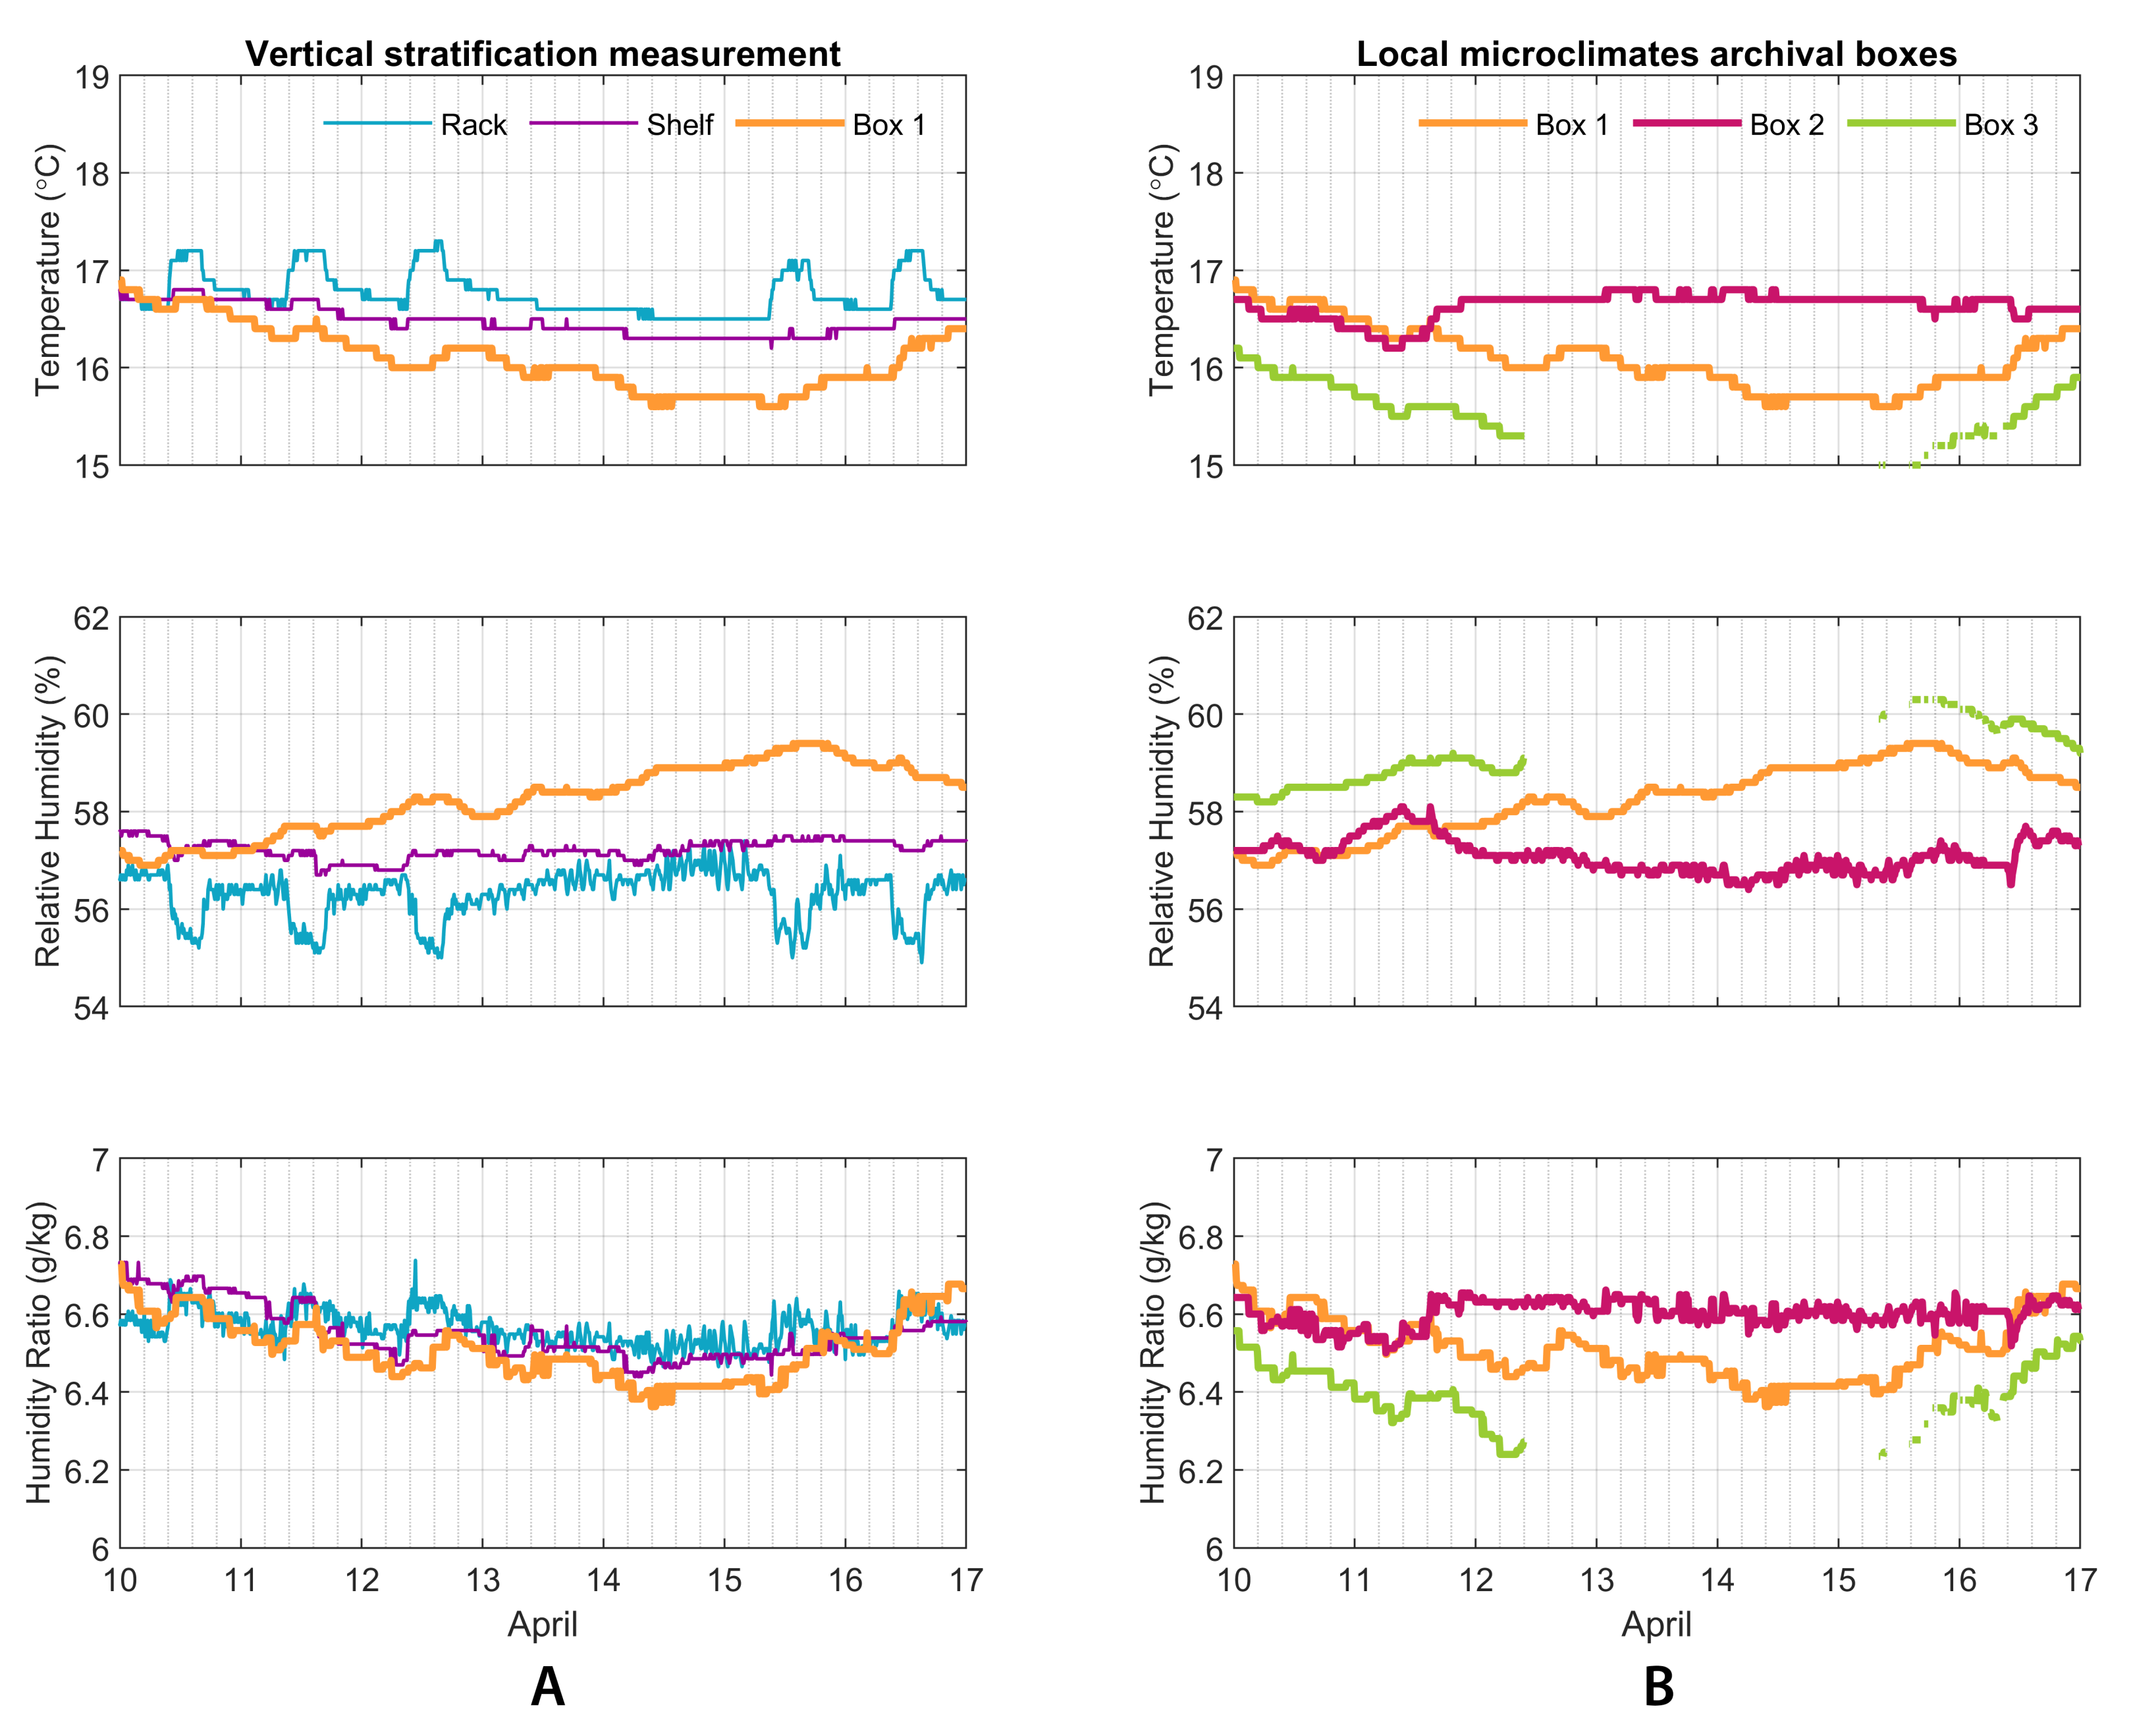
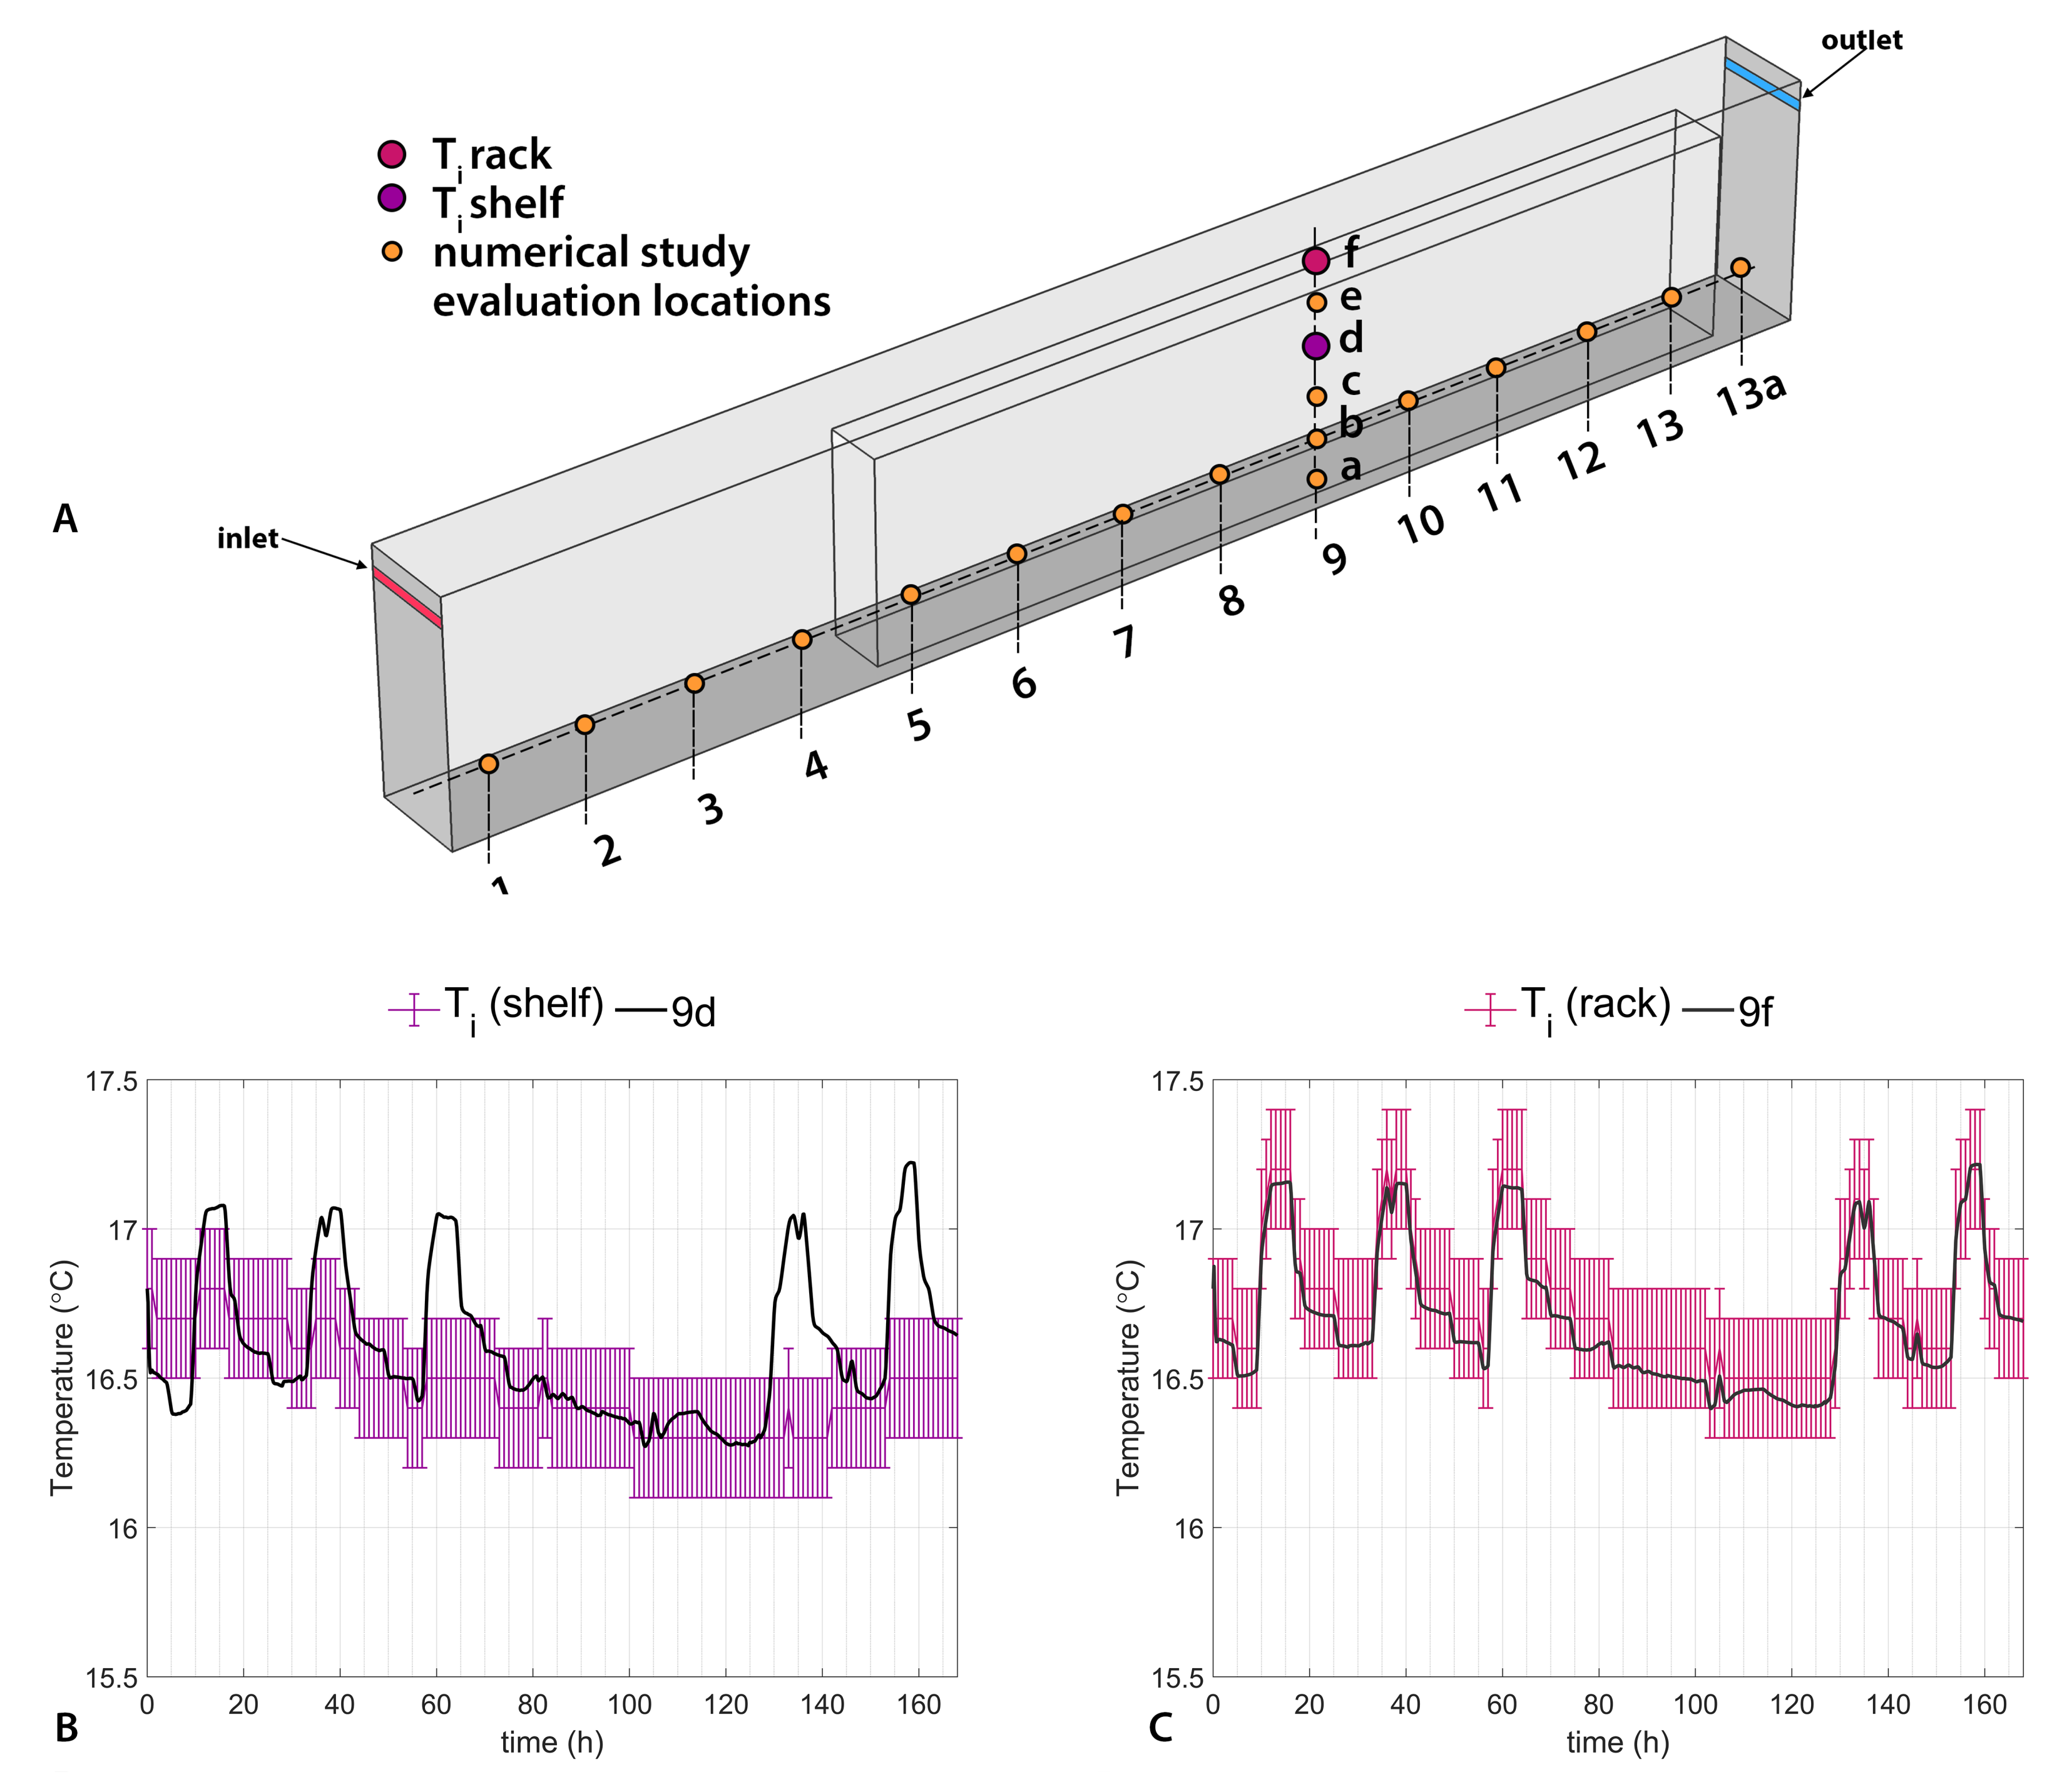
The microclimate measured during the experimental campaign was influenced by the thermal radiance of the external wall. Both boxes, 3 (closest to external wall) and 1 (in the center of the repository), showed influence with a dropped T
. This complies with the results mentioned in studies such as those of Wilson et al., Clare et al. and Bigourdan et al. where the microclimate monitored in archival boxes showed a time delay of a few days [
27,
28,
29]. Comparing both the microclimate in the archival box and just outside of the archival box, the trend shown in the two results is similar (see
Figure 7). Therefore, the degradation risks for objects placed in or out of an archival box would most likely be similar when it comes to incorrect
T and
. In the correct case, there was a cooling effect which did not increase the risk of archival objects that prefers preservation specifications with a low
T. Further research could account for thermal and hygric buffering of the archival box and to what extent this reduces the degradation risk during long periods of warm external temperatures.
Based on the research questions described in the introduction, the following conclusions can be drawn:
Measurements show that the microclimate in an archival box has a small daily span for T and . A stable daily climate surrounds the archival collection inside the box. The seasonal span for the T and of the archival box near an external wall shows larger fluctuations compared to other positions in the archival rack. This is mainly due to the influence of the external wall radiation which is also experienced by objects outside archival boxes placed near the external wall. Since relative humidity does not exceed 65% for a long period to form biological risk issues and short-term (hourly) fluctuations in temperature do not exceed 1 C, preservation conditions are considered good inside the archive box even when the conditions do not meet the criteria set by the Dutch archival legislation. T is on average lower than legislation prescribes. During summer, this significantly increases cooling energy consumption.
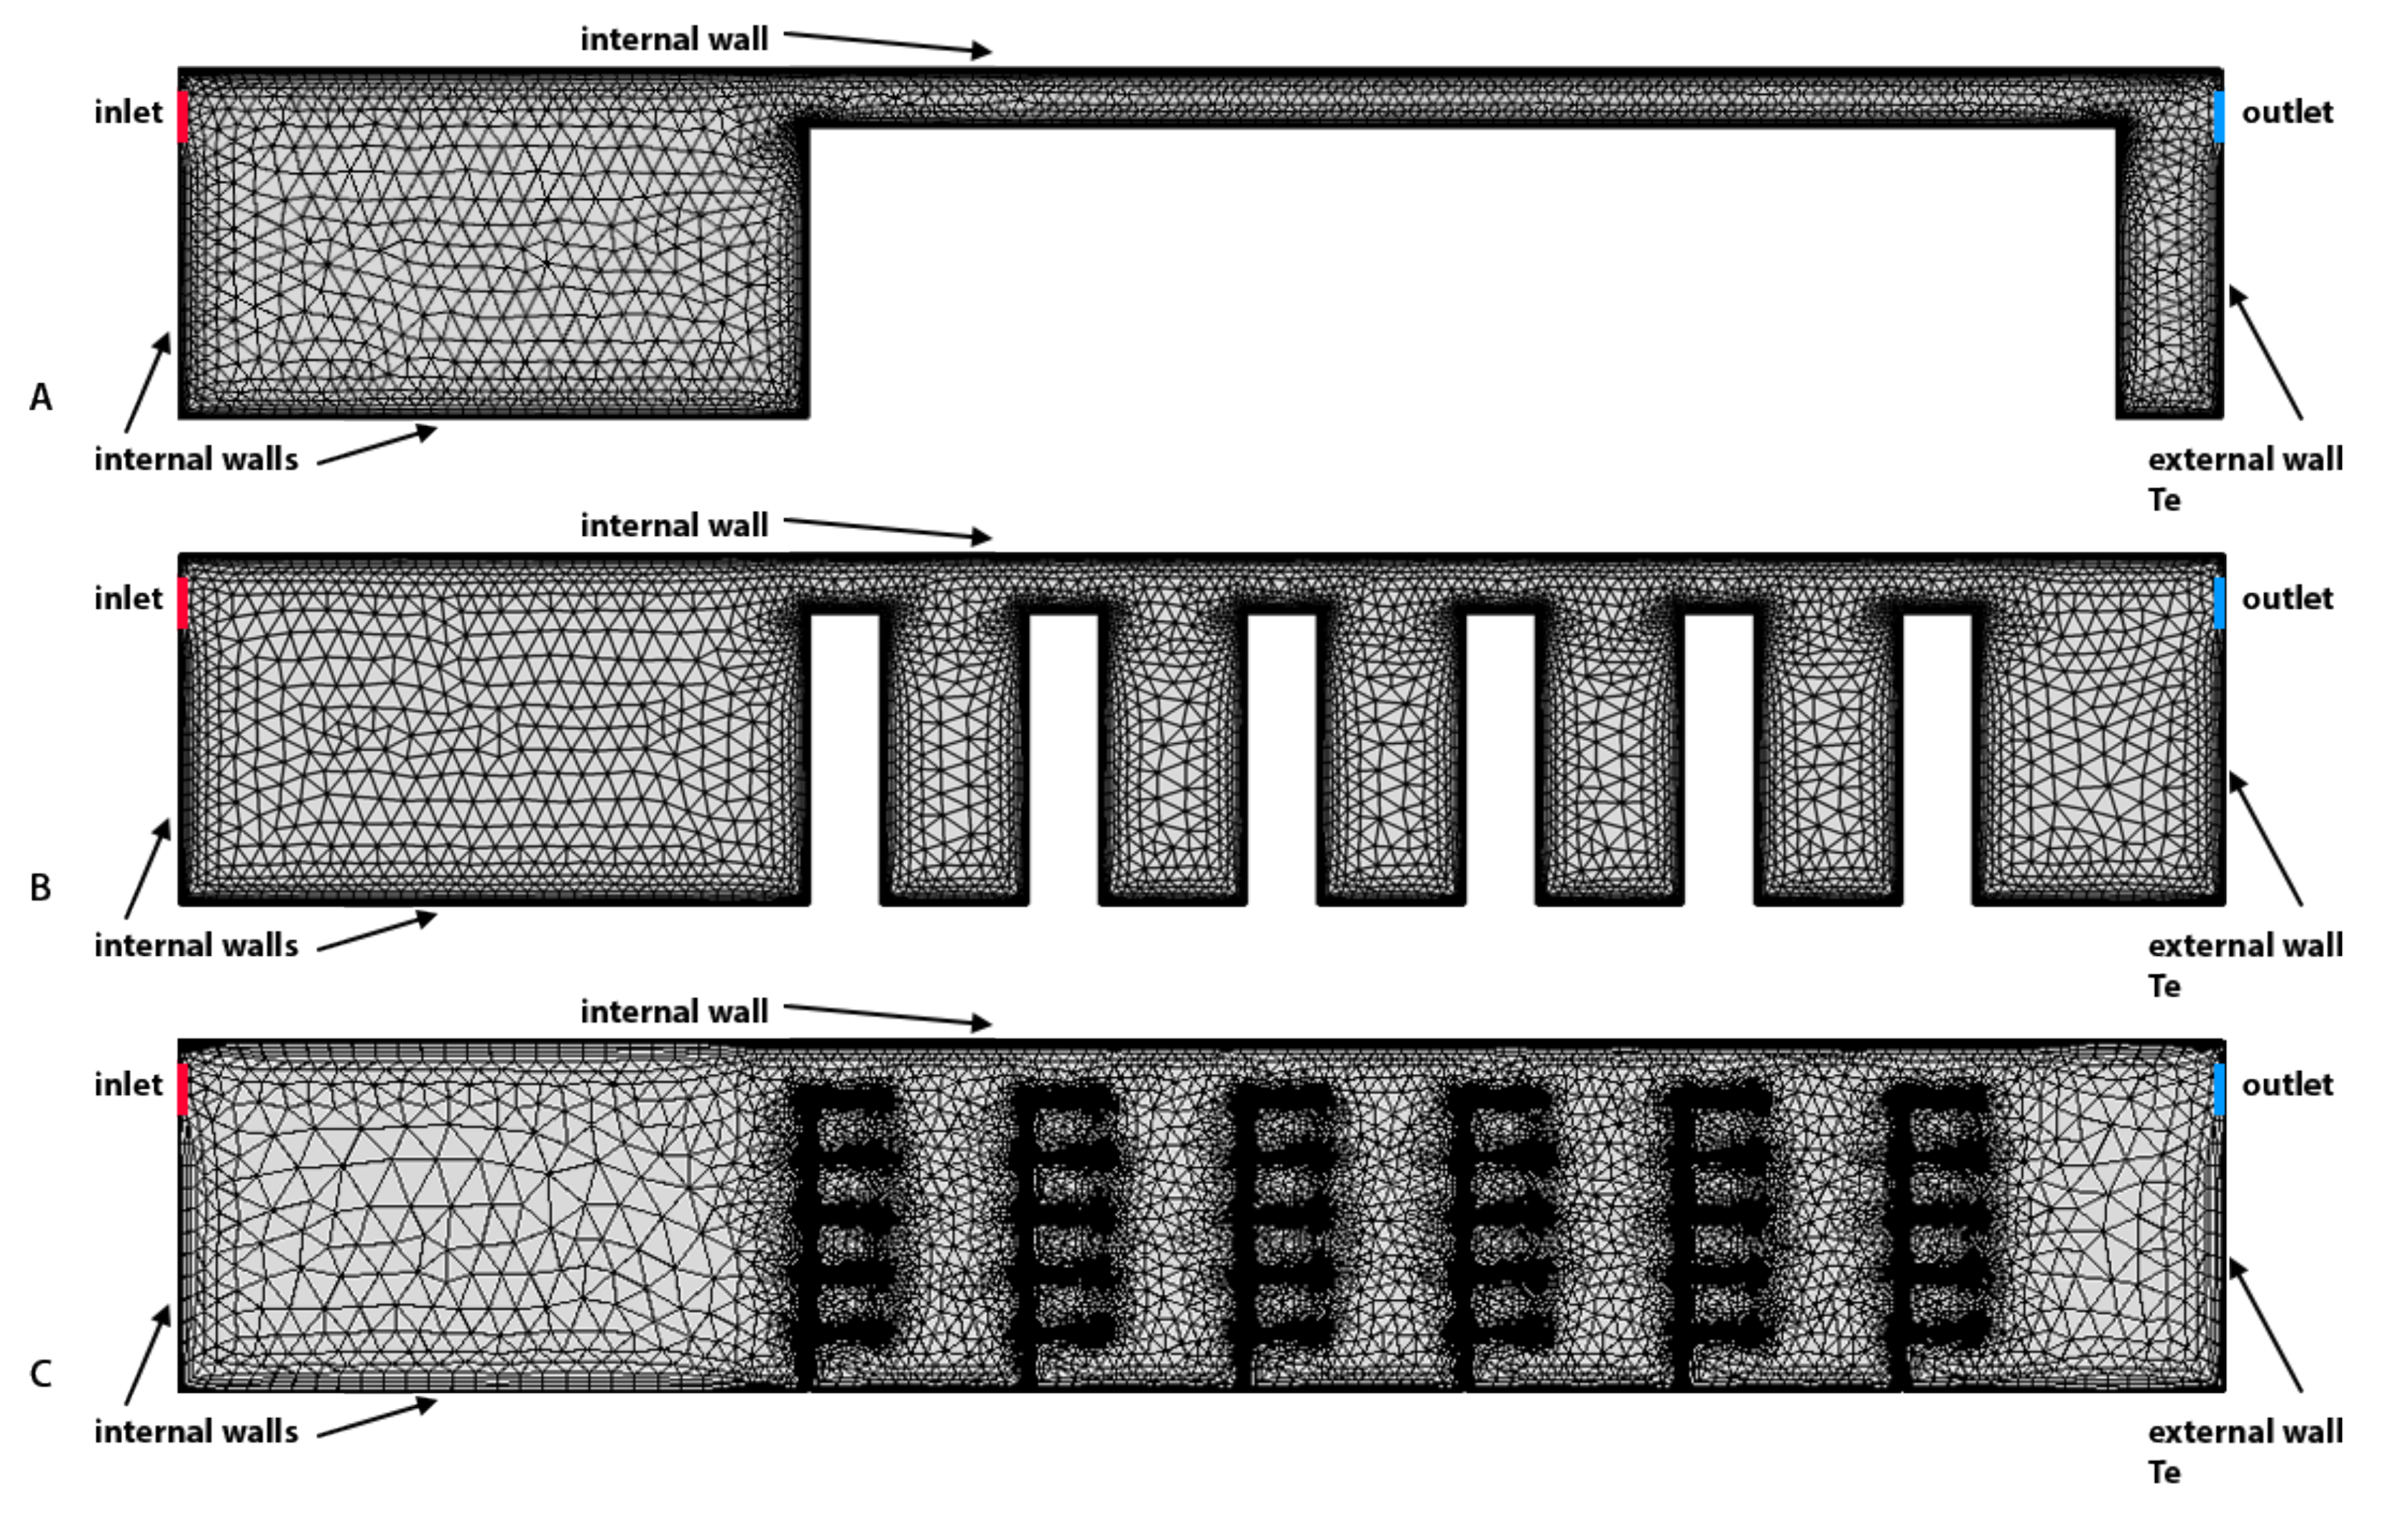
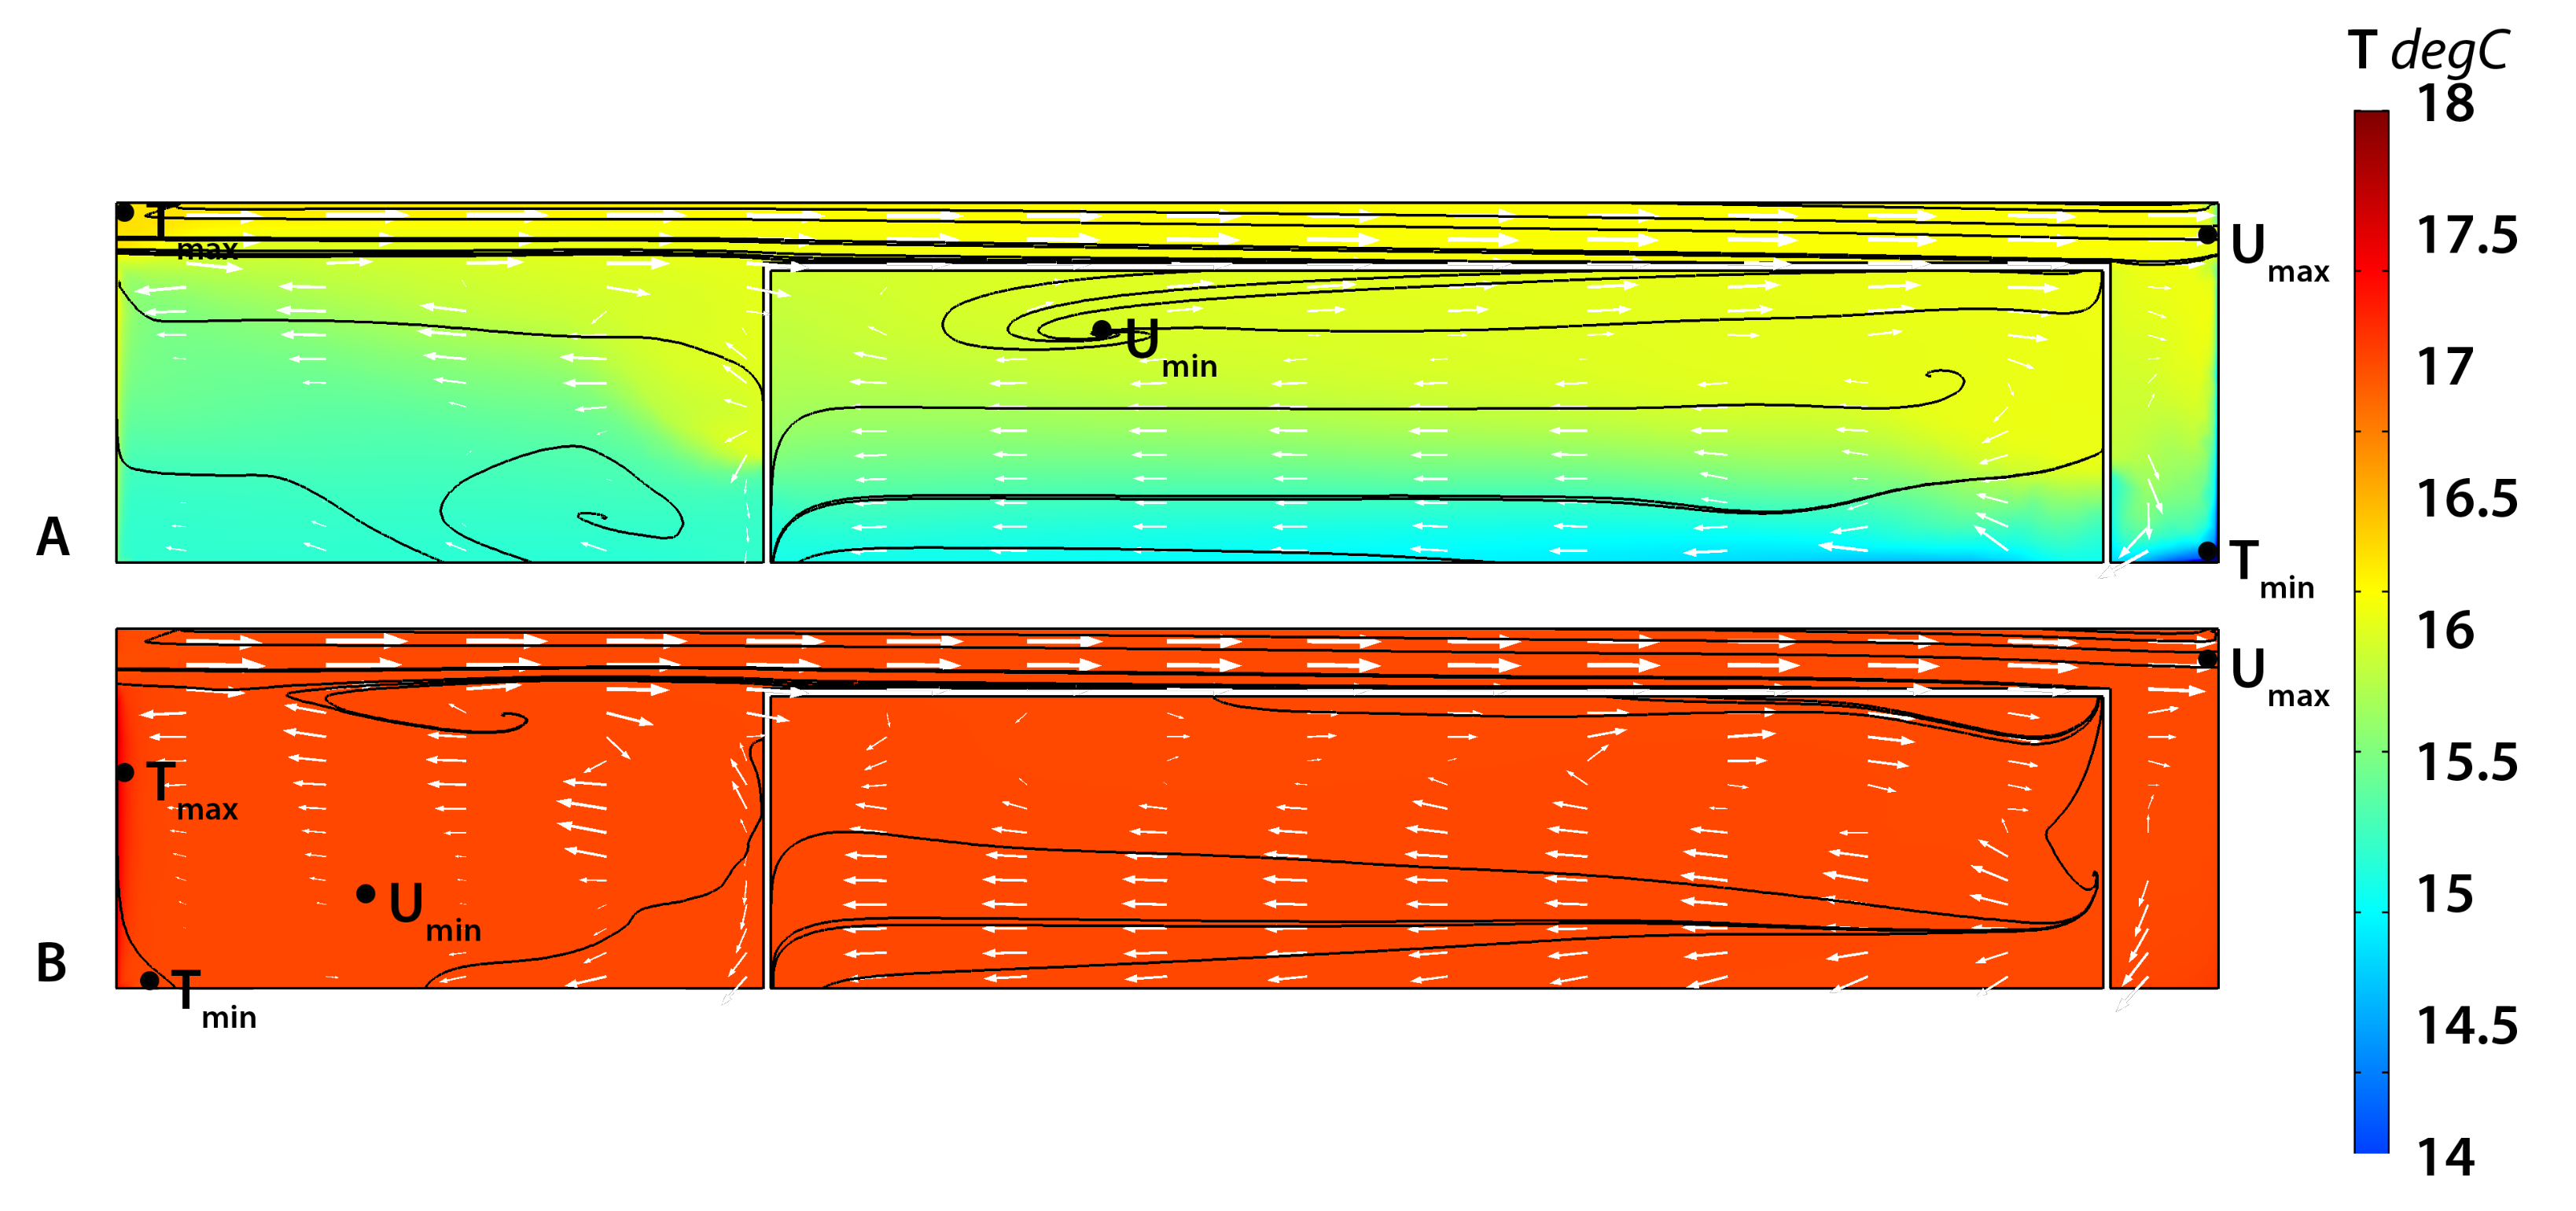
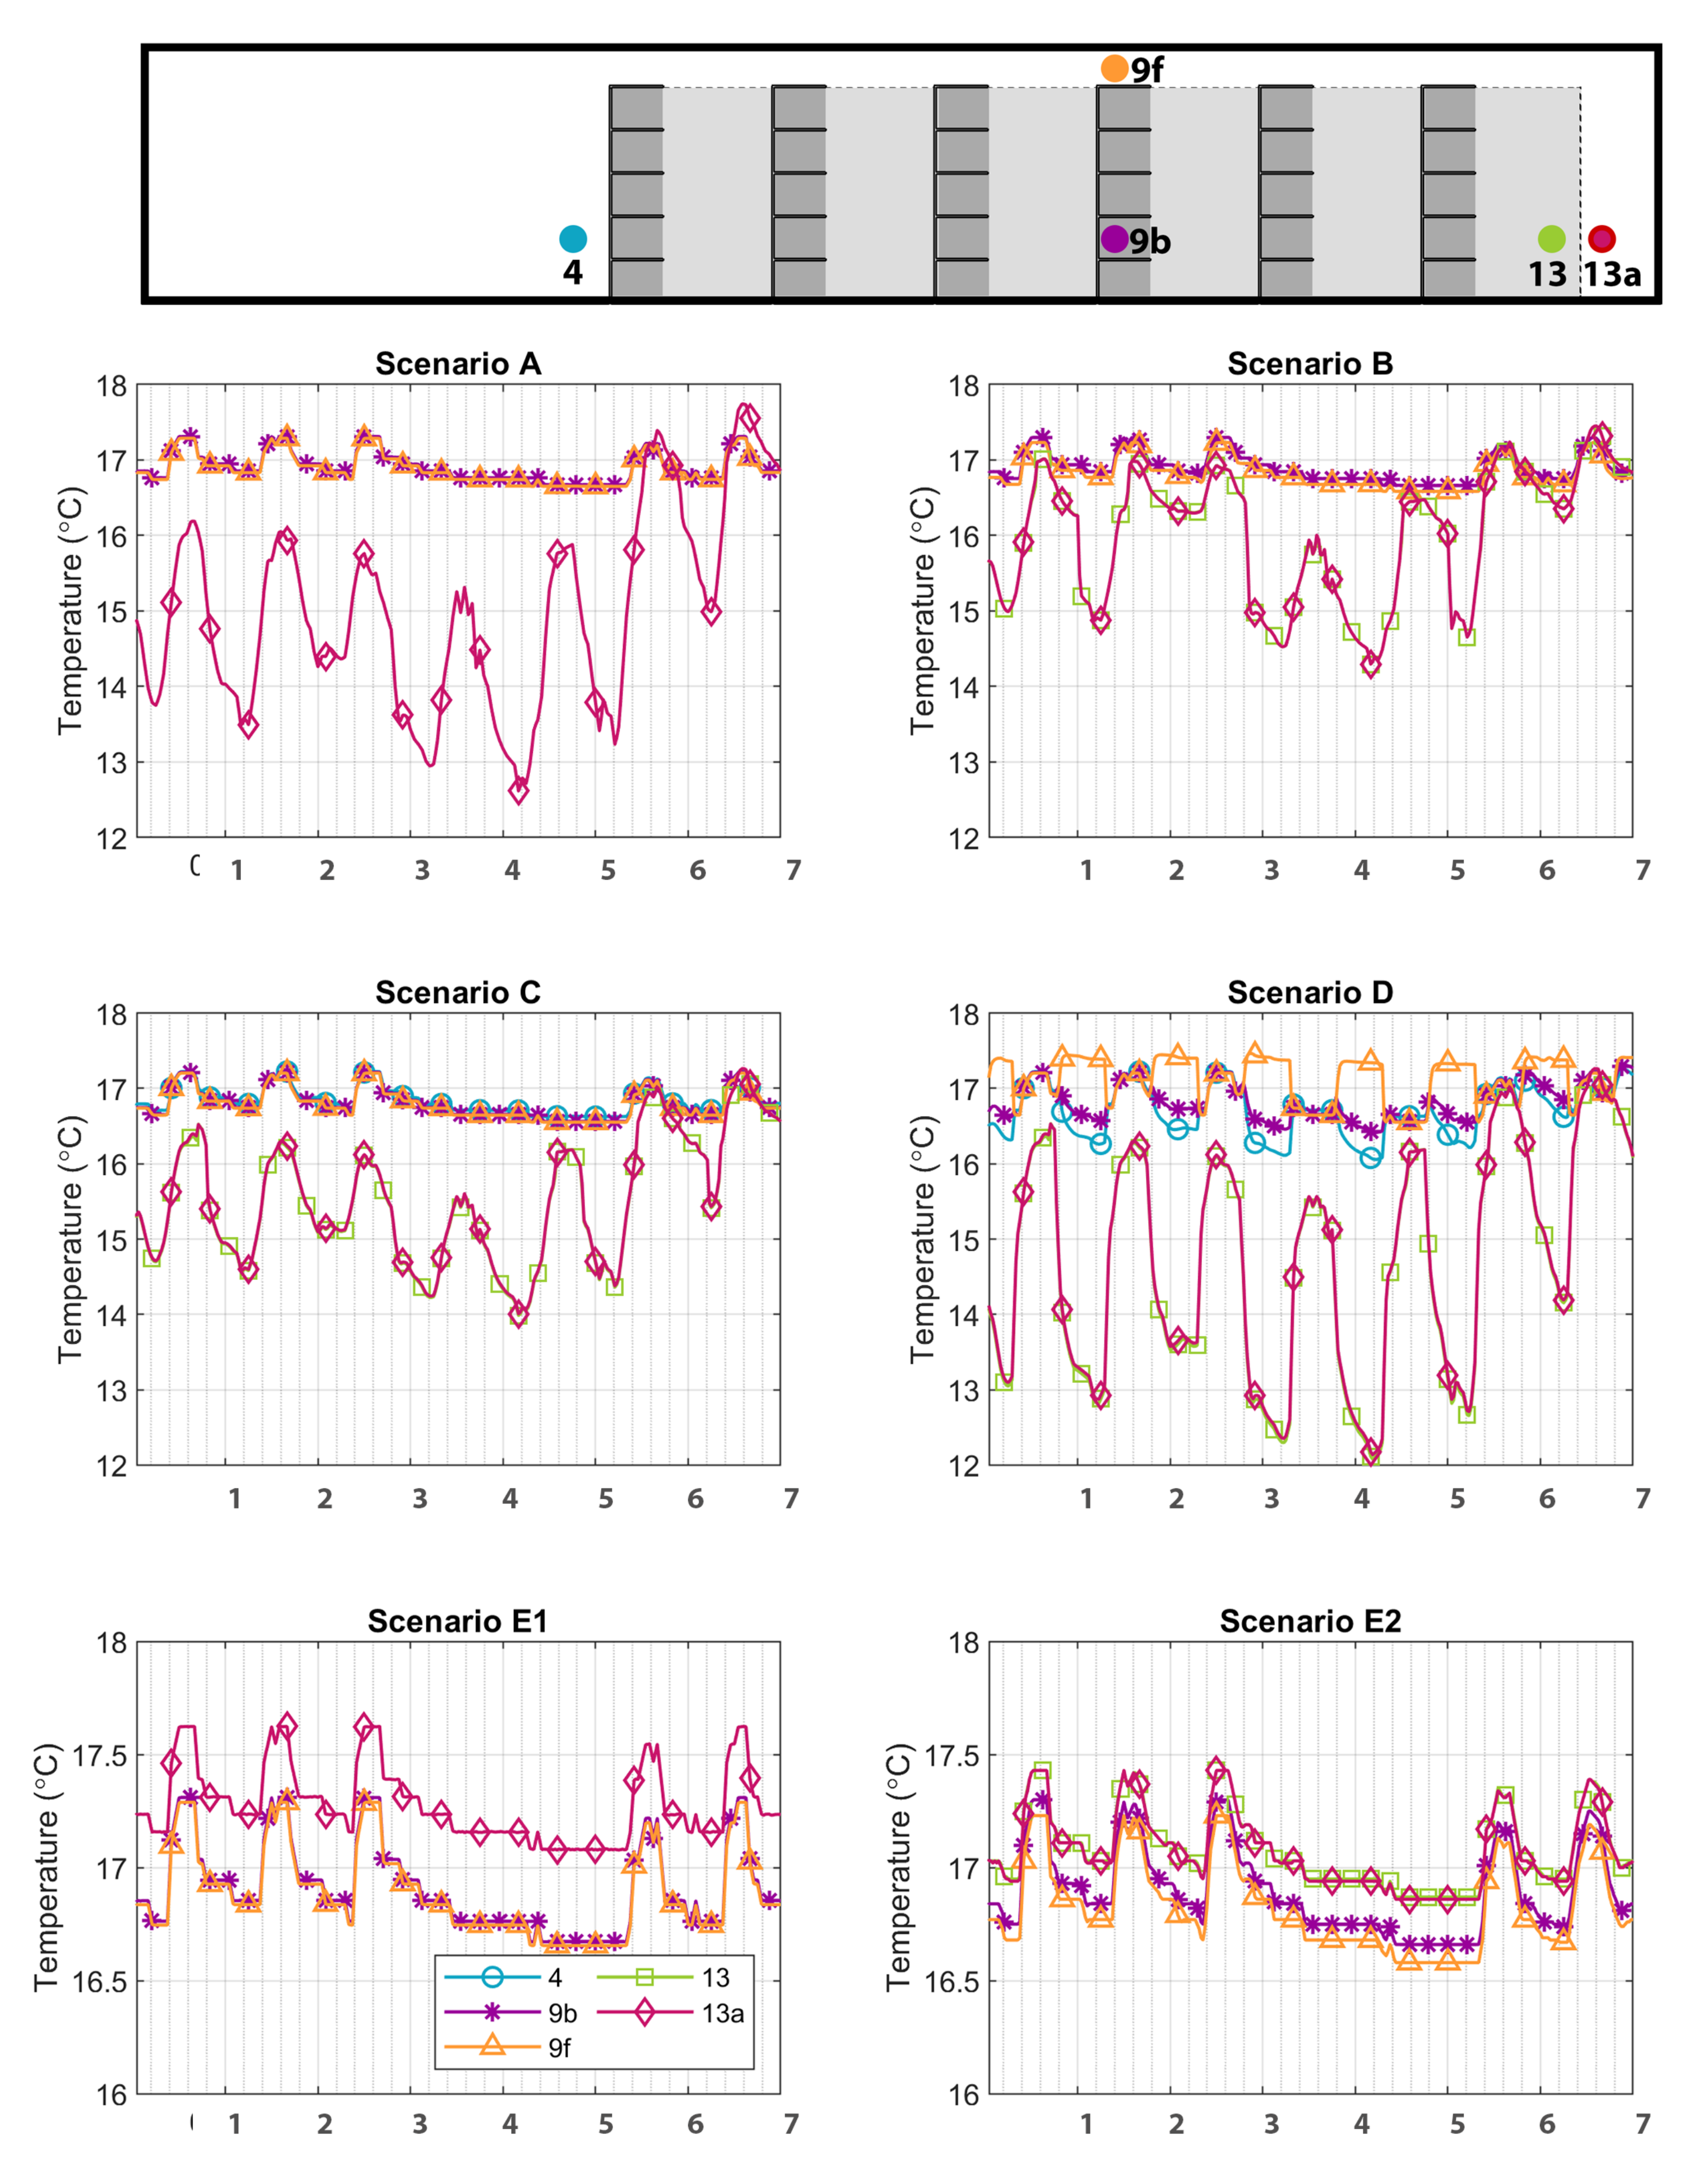
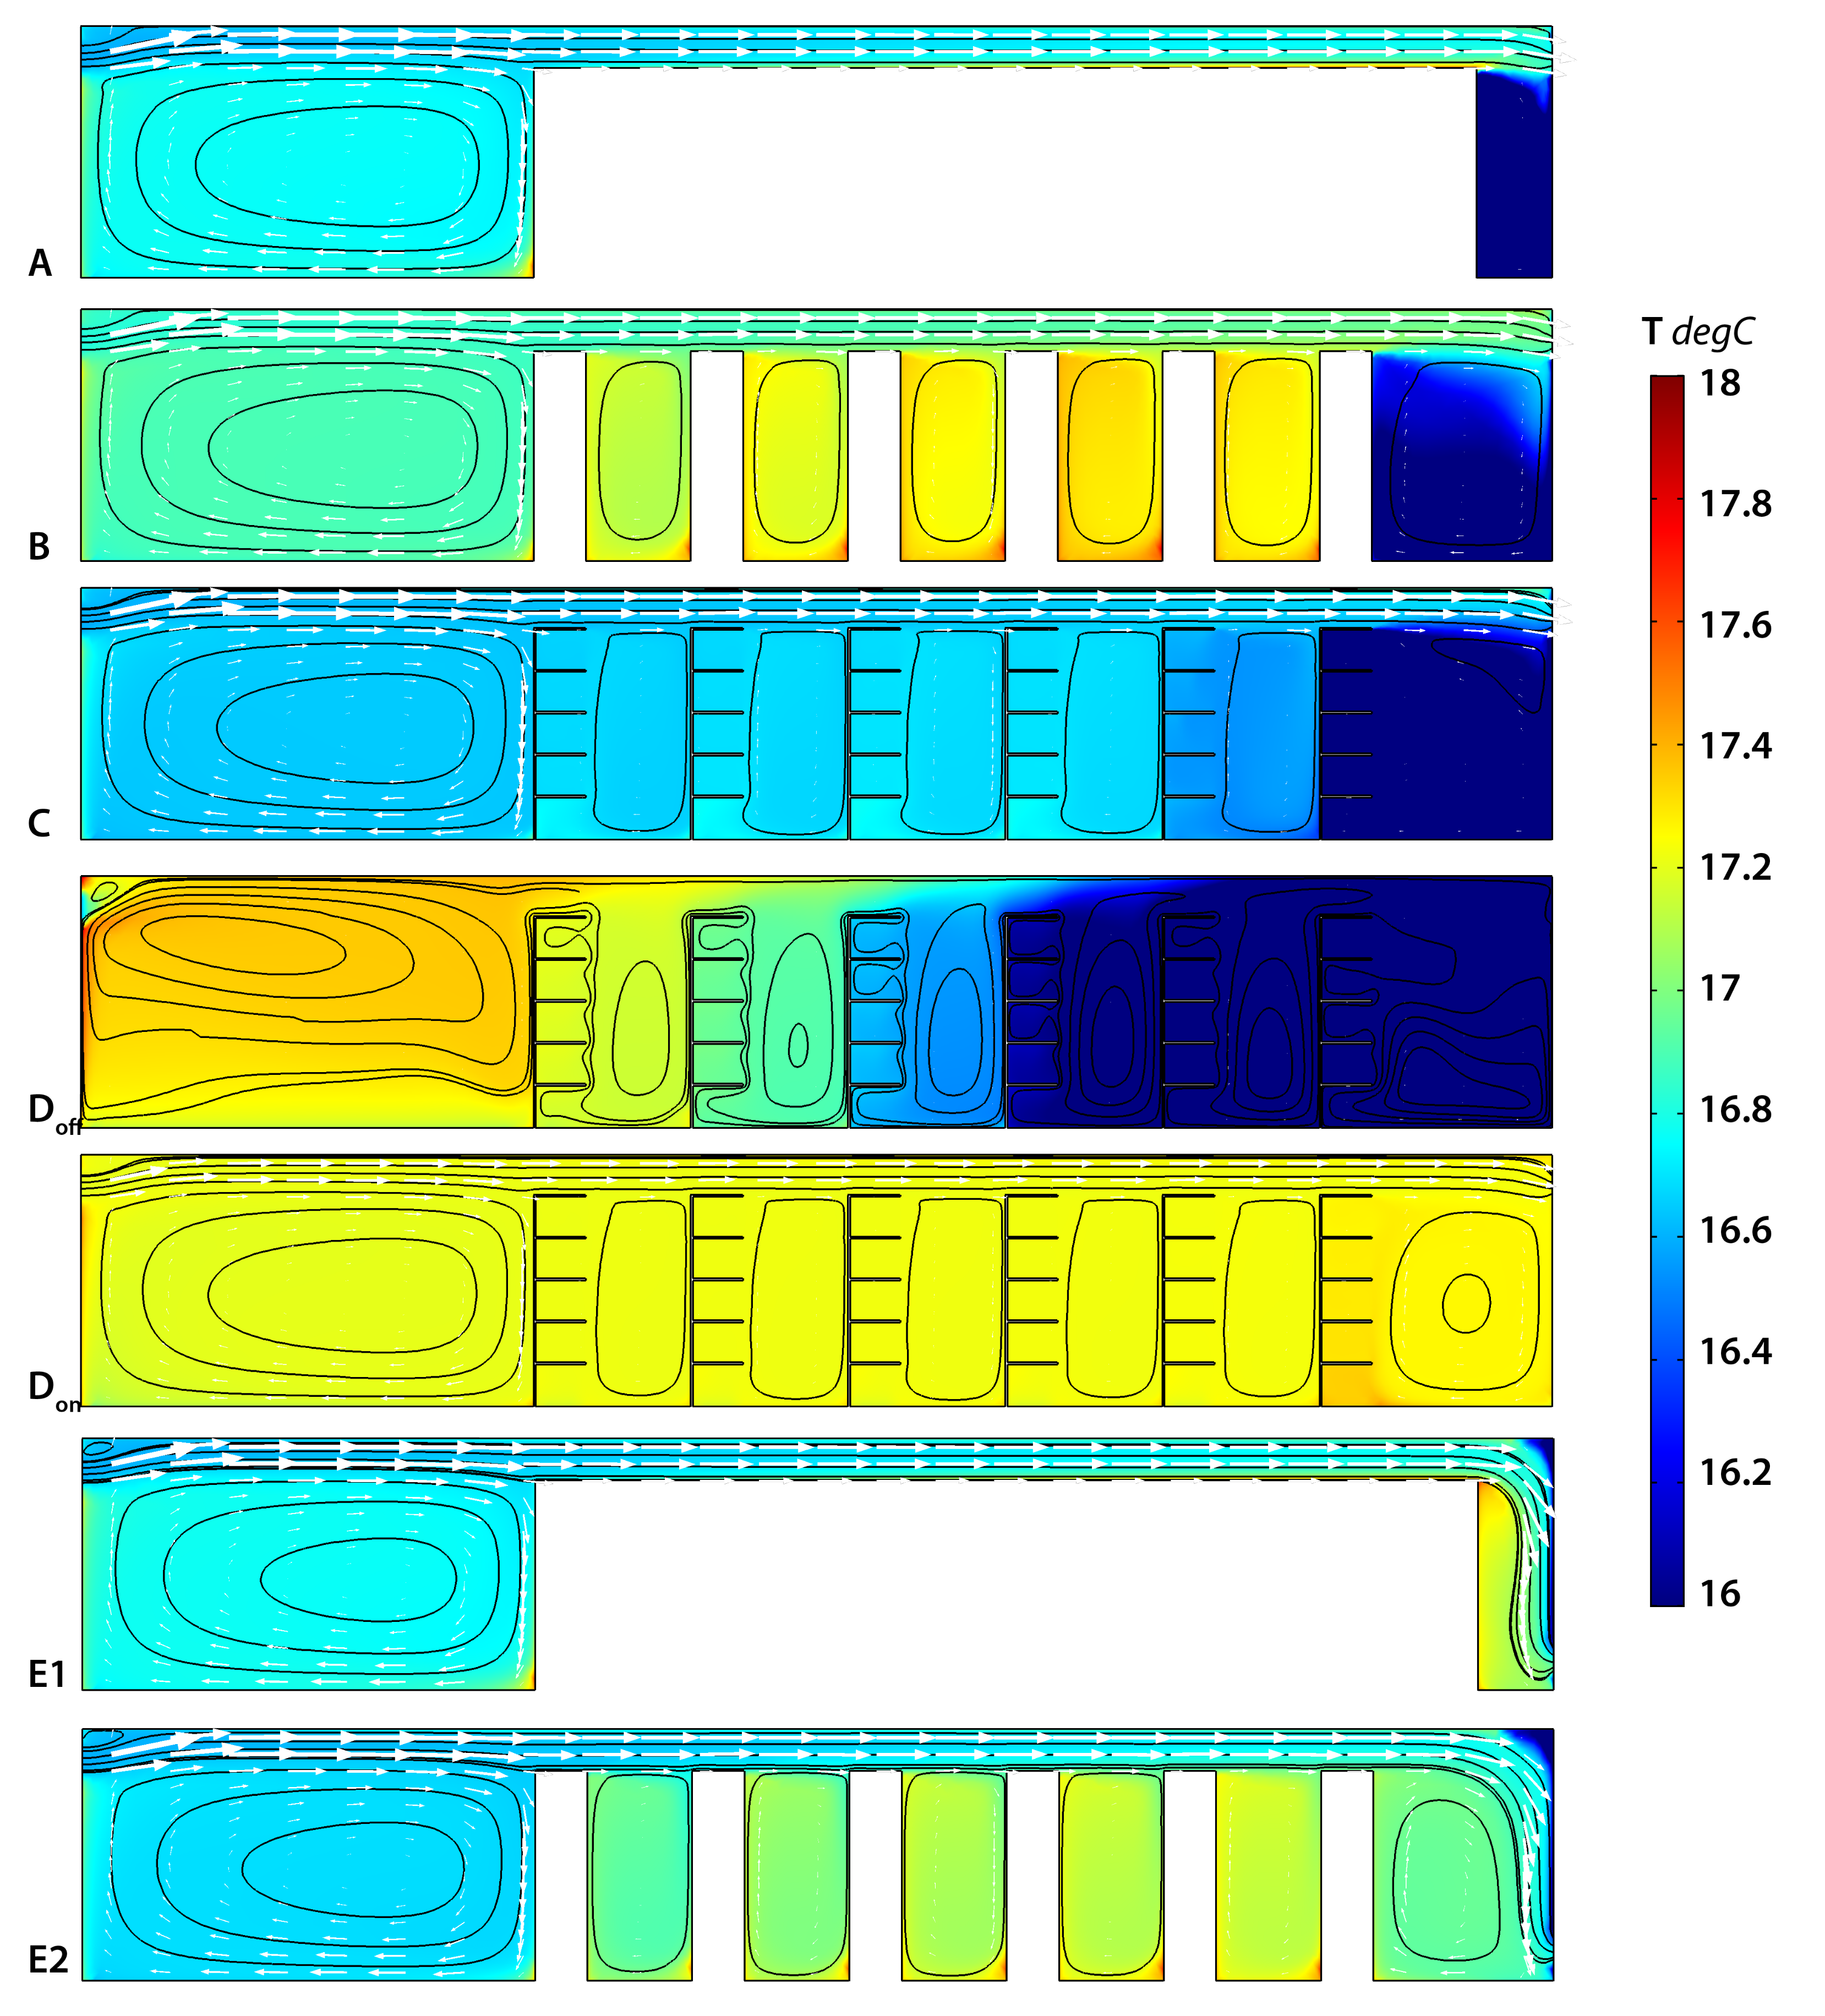
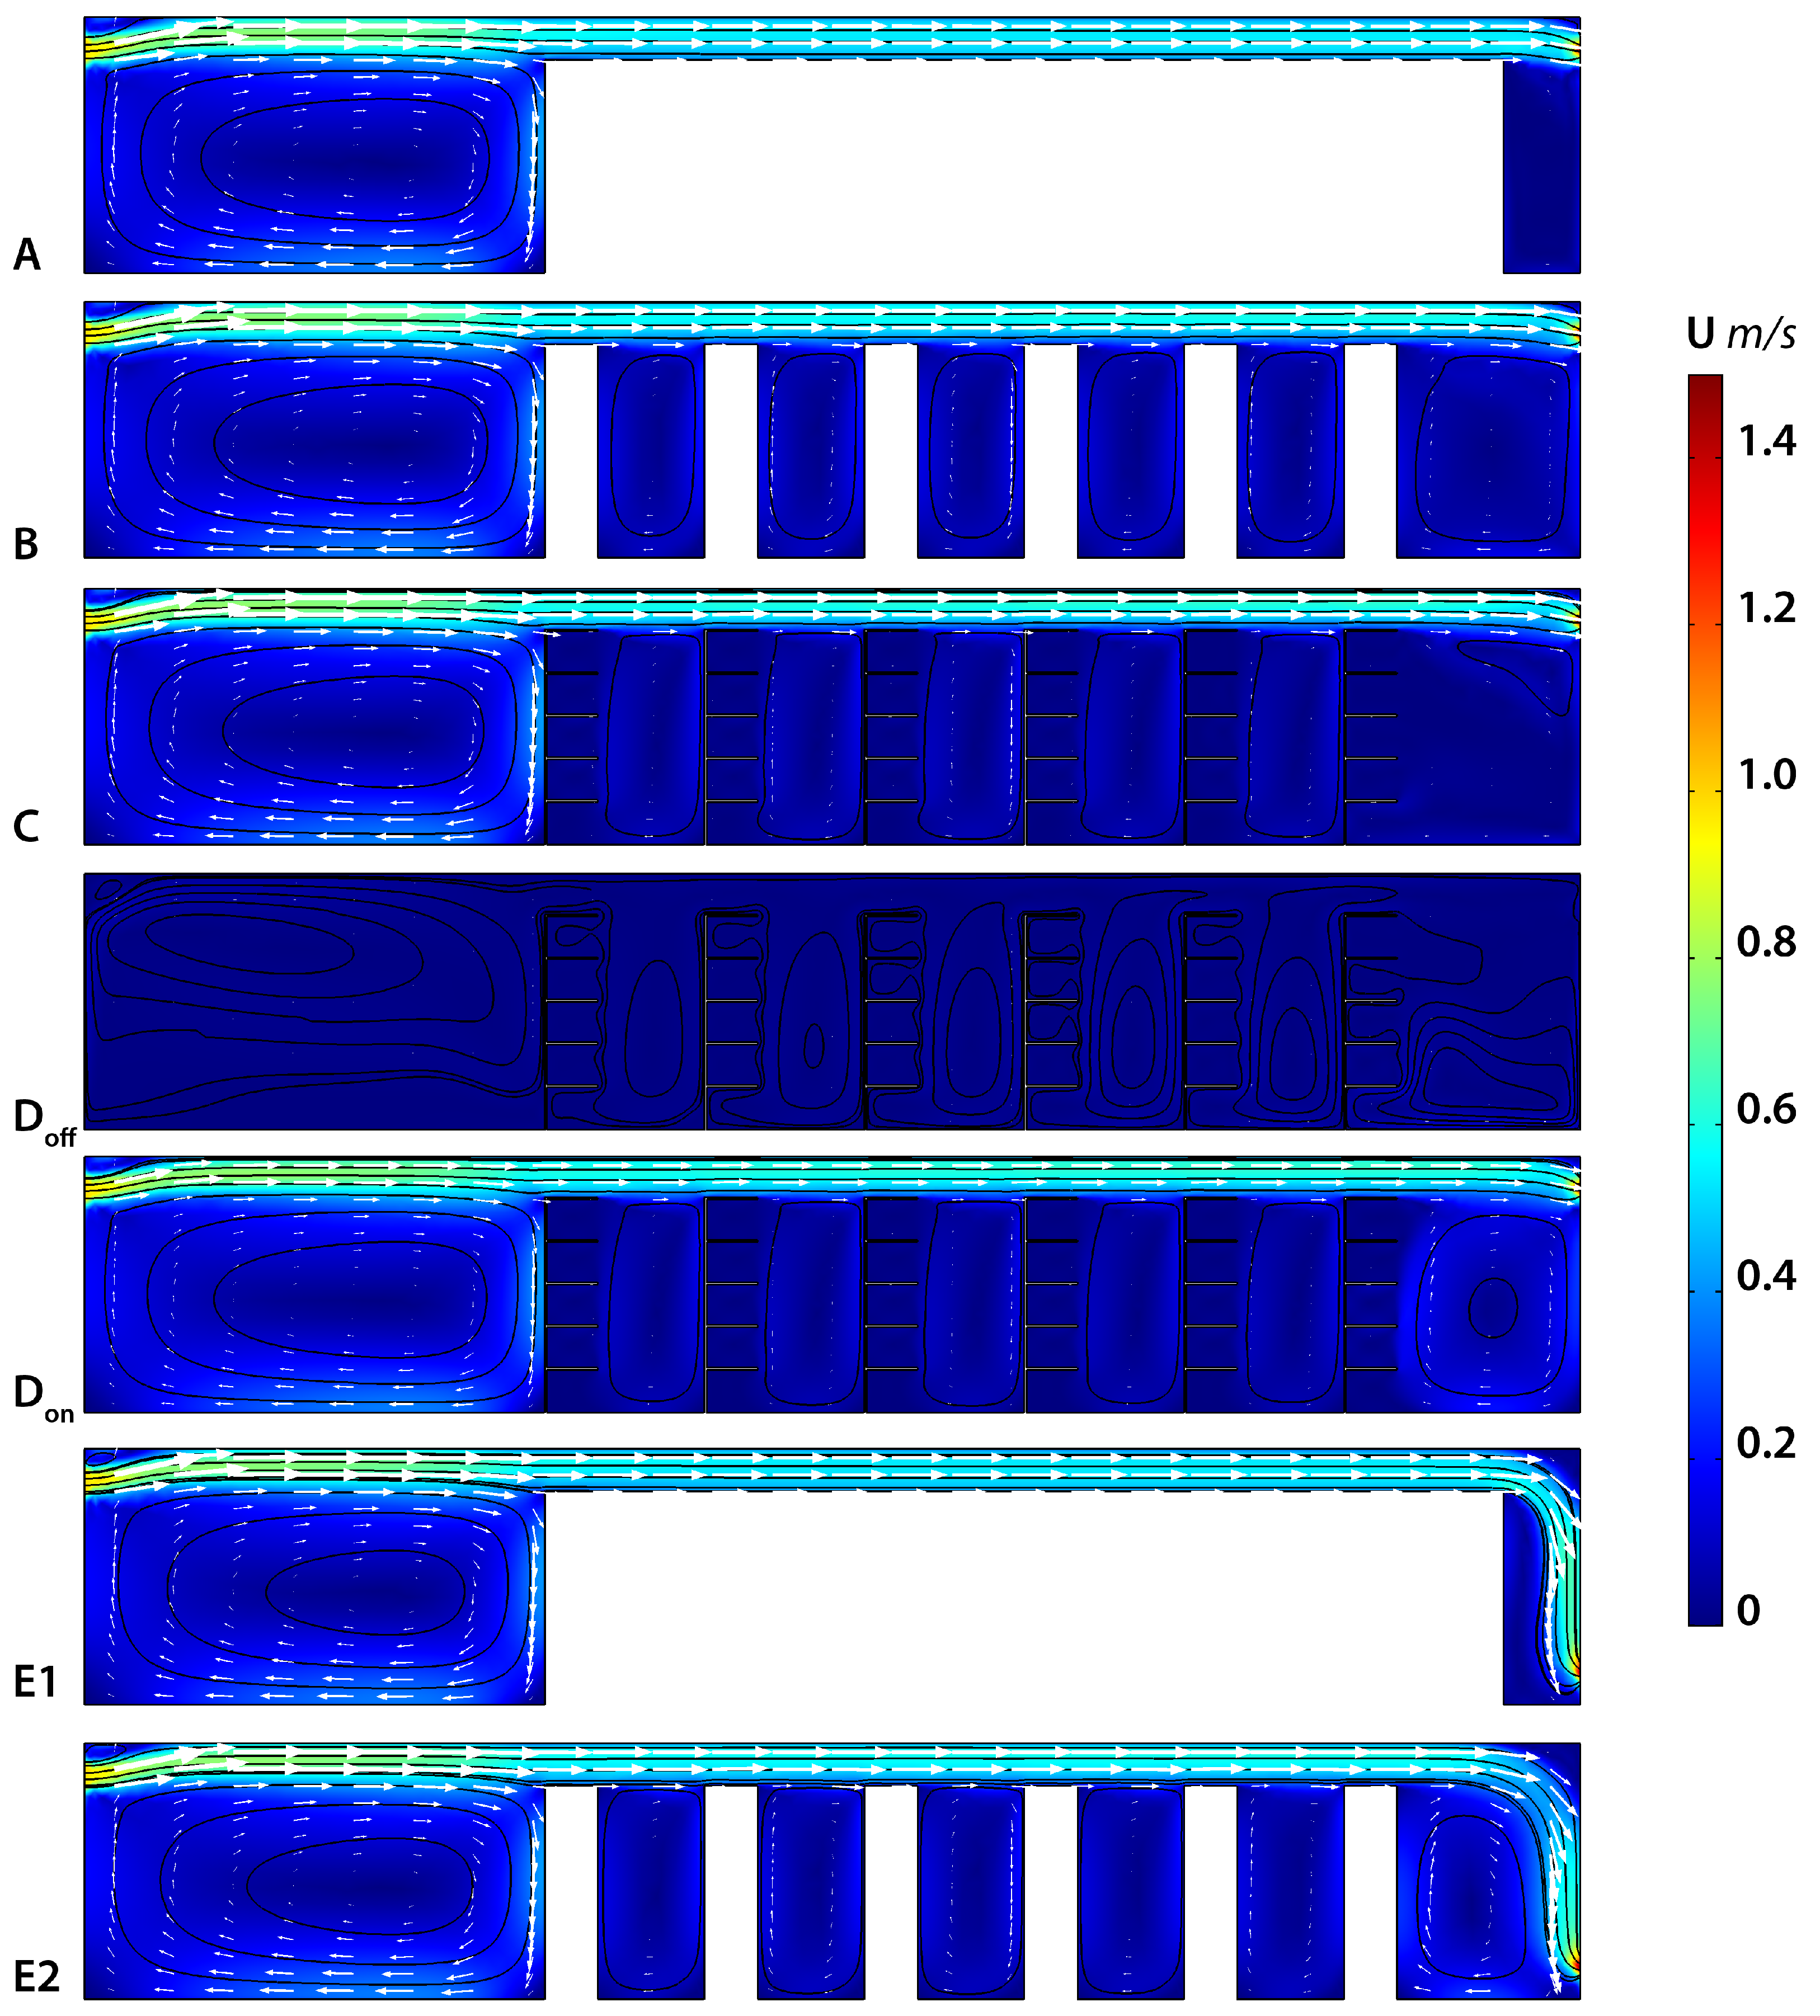
The simulated scenarios with archival racks perpendicular to the inlet direction show low velocities between the racks. Placing the racks in a parallel orientation ensures air-movement and therefore air-mixing between the racks. Fixed archival racks with a low fill rate create local indoor microclimates in between objects or shelves. Completely filled archival racks have the convenience of high thermal and hygric buffering by the objects, while short-term fluctuations will have a limited effect on the core of the objects due to this buffering capacity.
According to the numerical model, scenario D (night reduction in which the AHU is turned off) provides the largest temperature fluctuation near the external wall with 4 C. The fluctuation occurs gradually over a time period of 12 h (≈0.35 C/h). Turning off the AHU in a repository indicates the greater influence of indoor temperature towards the building envelope quality. In the case of a low thermal quality, this results in temporal gradients near the external walls. If the thermal quality of an external wall is good, very limited influence of the external climate is expected and energy conservation increases. A small amount of ventilation might be needed to remove the volatile organic compounds emitted by objects or building materials.
The duct placement of an HVAC system assists in creating vertical stratification when both the supply and extract are located near the ceiling. This results in limited airflow. Low external wall quality contributes to a horizontal stratification when air-mixing is blocked by objects such as archival racks. Improving airflow for better air-mixing near an external wall is achieved by placing the outlet grid near the floor next to the external wall.


