1. Introduction
Pitched roofs with natural ventilation in the unheated attic space have traditionally been used to construct simple, and moisture-safe roof constructions in Denmark and similar cold climates. Possible excess moisture in the attic space is removed by ventilation. The loadbearing part is often wood, which is sensitive to elevated moisture levels yielding moisture related problems including e.g., mould growth. Sufficient natural ventilation of these attics is vital for maintaining acceptable hygrothermal conditions. A survey of 200 single-family houses in Sweden [
1,
2,
3] confirmed significant mould growth on wooden parts in 60–80% of the included cold attics and mould odours in the indoor air as a consequence. The moisture problems were often related to changes in the hygrothermal conditions or pressure balances caused by refurbishments i.e., additional insulation, or installation of new heating systems that can alter the thermal and pressure balances of a house leading to higher convection and diffusion through the ceiling and lower temperatures in the attic [
3].
Moisture intrusion in these naturally ventilated, cold attics can be attributed to outdoor air in times of high humidities and, primarily, infiltration of moist air from the indoor environment, which causes raised levels of concern [
4]. The infiltration of humid air to the attic from the dwelling is primarily attributed to convection through leakages in the airtight plane [
5,
6], which in these houses is located in the ceiling, but diffusion through the construction also occurs [
7]. Leakages occur through cracks, insufficiently tight hatches and joints—all of which should be minimized in order to reduce the convection and associated moisture transport to the attic. Human presence and activity in the dwelling cause a higher water vapour concentration compared to outside and in the attic; therefore, the air will diffuse out through construction parts. The air leakage through the ceiling can thus contribute significantly to elevated humidity conditions in the attic—especially in combination with insufficient ventilation.
1.1. Vapour Barriers in Ceilings
To avoid convection (and to some extent diffusion) of moist air, vapour barriers were introduced in ceiling constructions by the 1960s in the Danish building regulations [
8]. Reduction of air leakages in the ceiling reduces the heat loss through the ceiling as well, and the use of vapour barriers for airtightness of ceilings became common practice in the 1970s [
9]. By 1998, the vapour barriers were no longer mandatory in ceilings; however, airtightness, as well as the necessity of sufficient ventilation in the cold attics were still known to be vital factors [
10]. Today, airtightness of ceilings is most often ensured with air/vapour barriers including joints and assemblies, or an intact, plastered ceiling. However, it is difficult to establish complete airtightness with existing vapour barriers. Firstly, the vapour barriers are not always accessible and, in time, may have been perforated or have lose joints. Secondly, vapour barriers can vary significantly in conditions, even within one house. Similarly, installation of new vapour barriers is often omitted when refurbishing [
5], due to costly and comprehensive work, and the airtightness is provided solely by a plastered ceiling.
1.2. Ventilation in Cold Attics
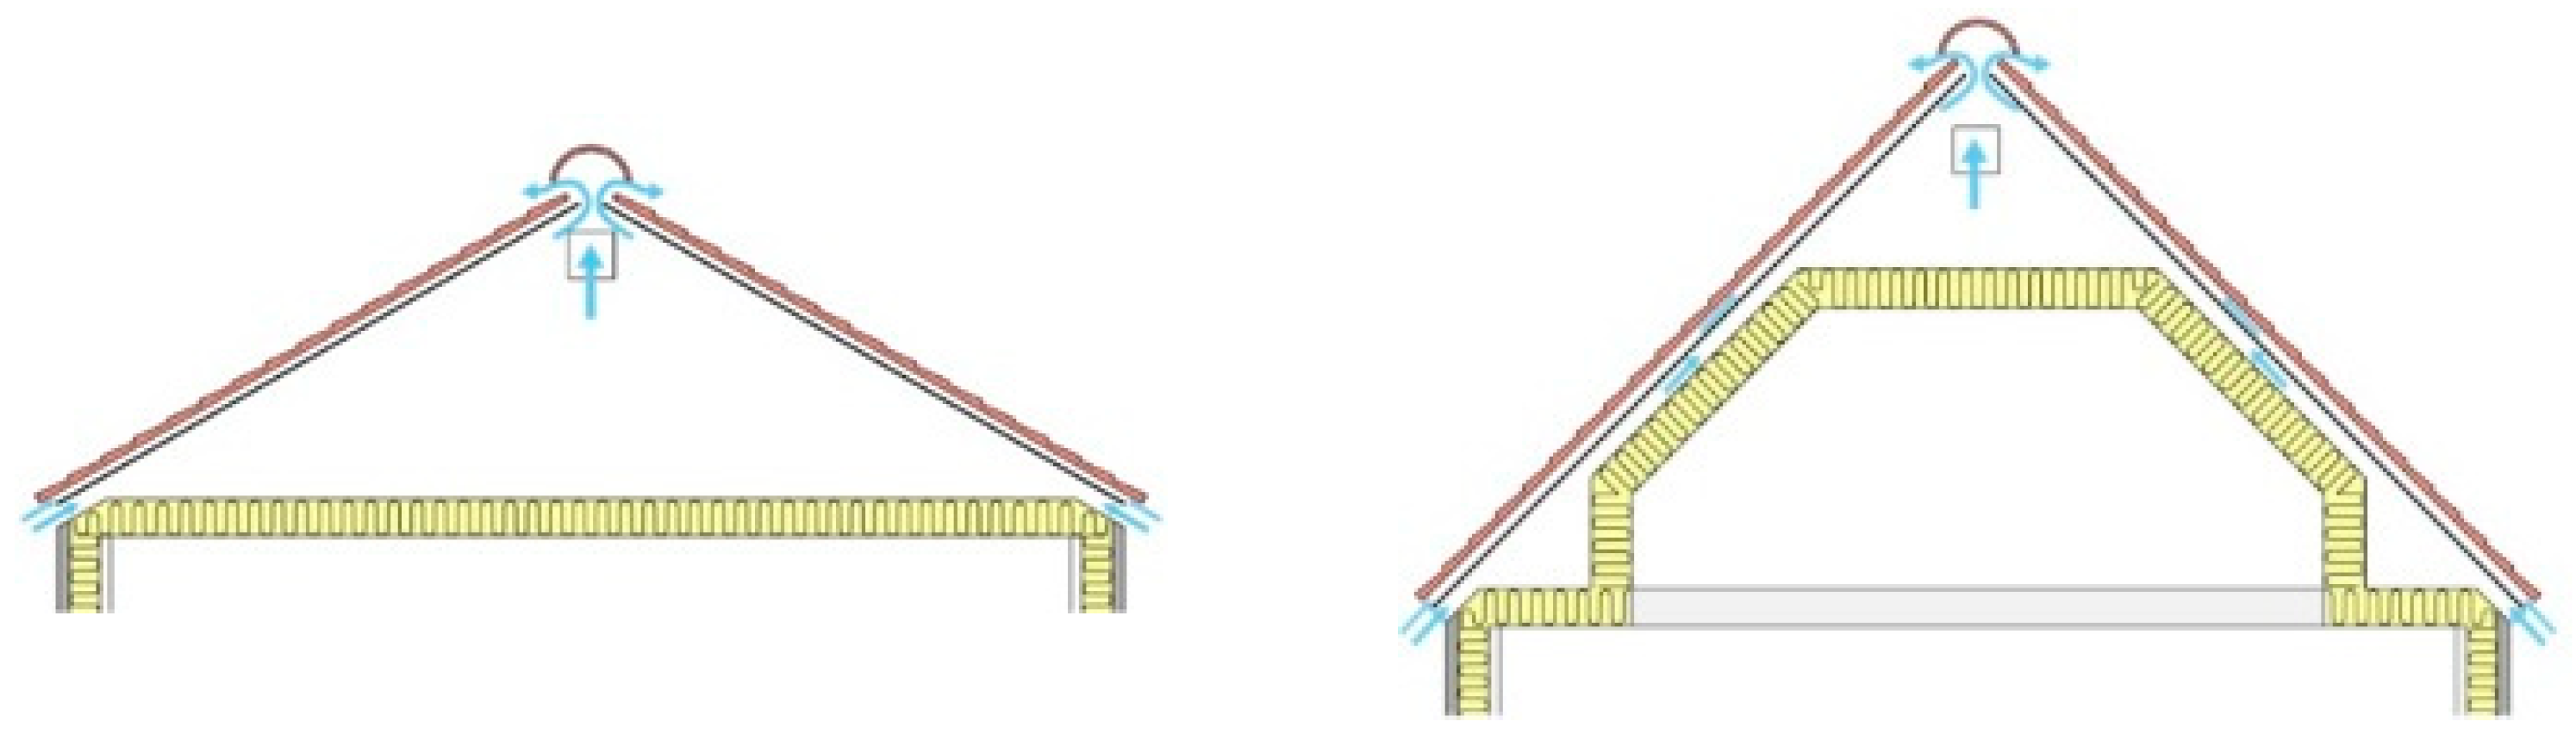
Natural ventilation occurs through openings at the eaves and the ridge, as well as openings in the gables or roof windows in some cases [
11]. The ventilation is driven by air and wind pressure, as well as by thermal conditions, utilizing the stack effect and airflow through the ridge openings,
Figure 1.
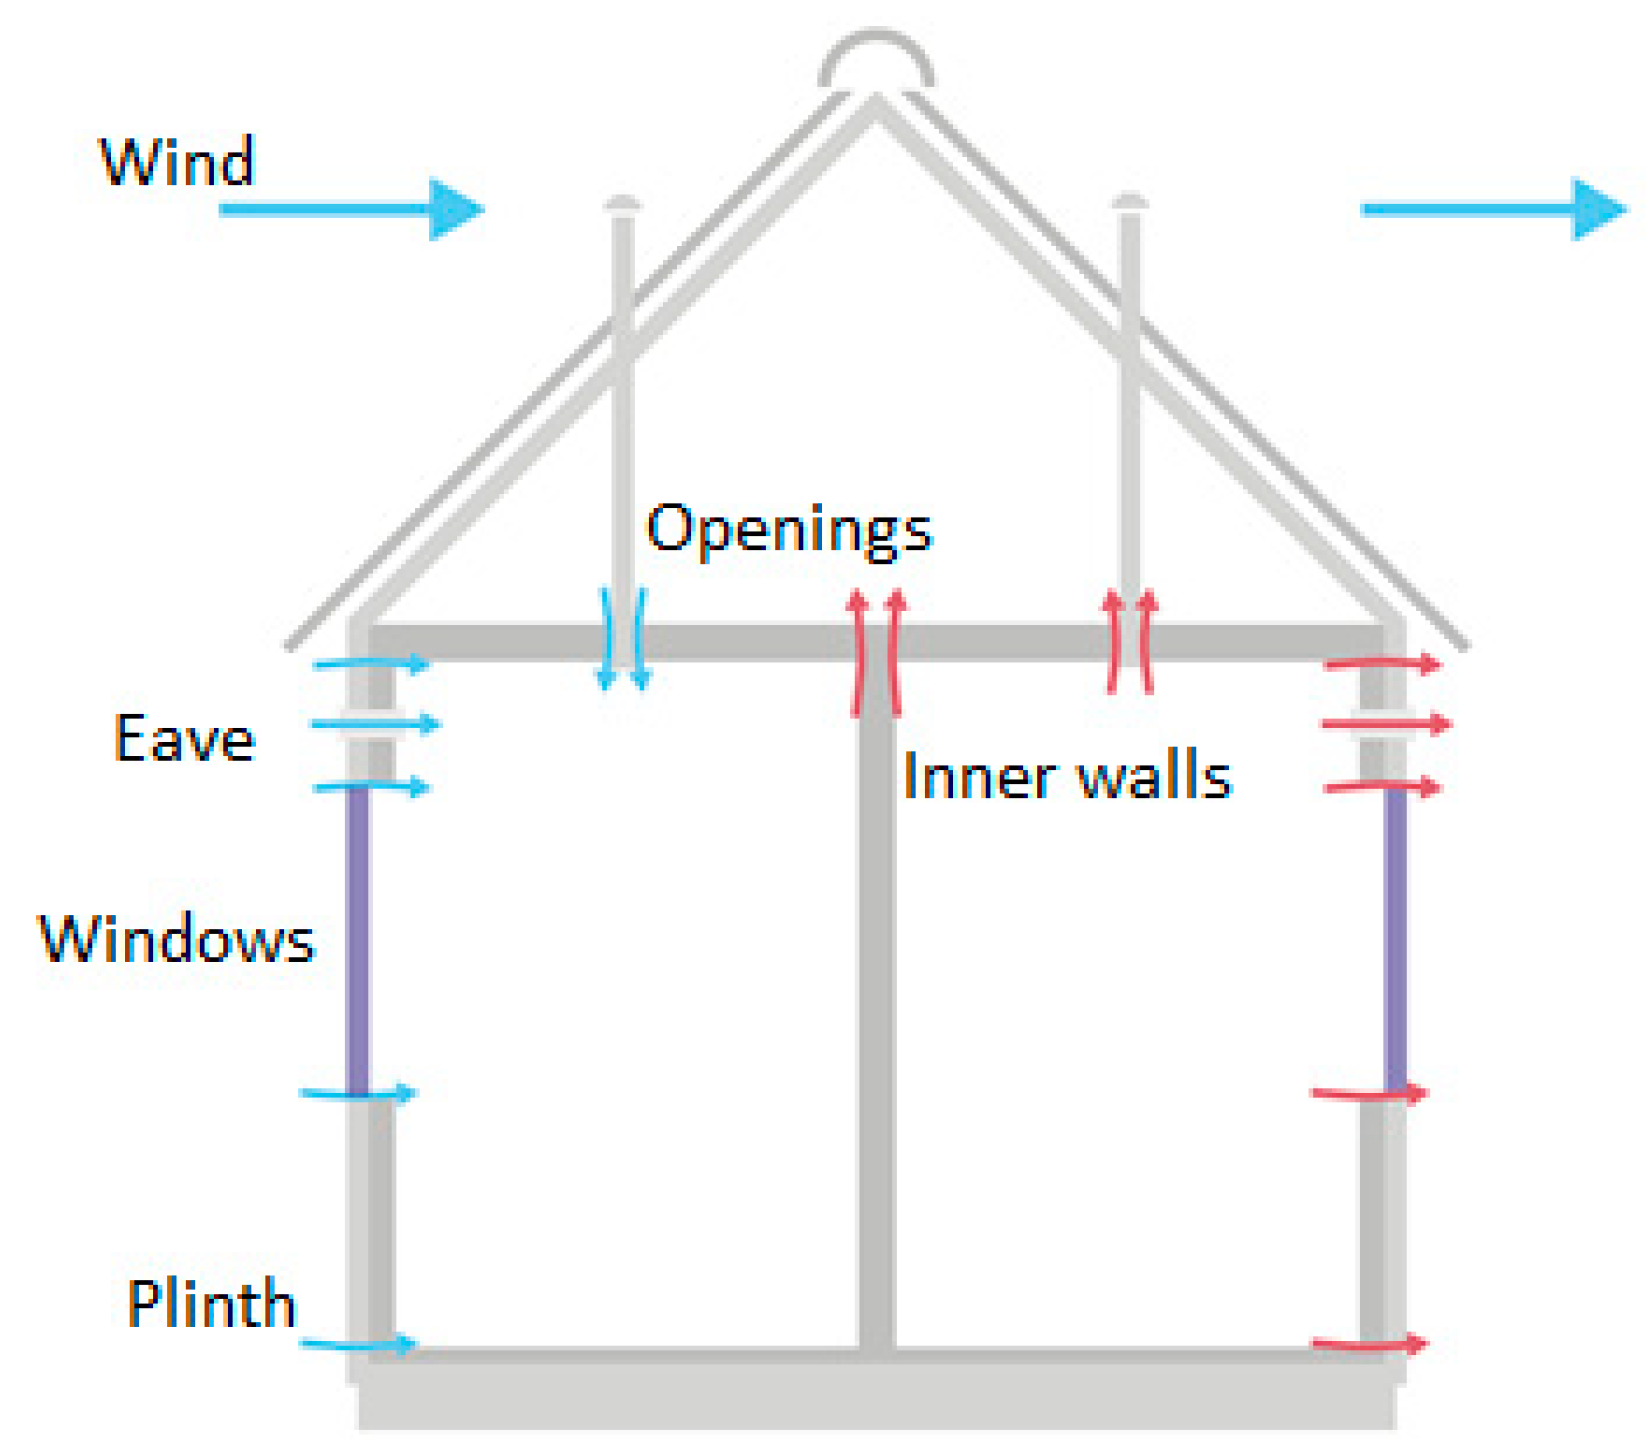
Wind on the building and the roof creates typically an overpressure on the windward side, and underpressure on leeward, and due to these pressure differences, air and moisture both infiltrates and exfiltrates the building, through ventilation gaps and other openings. Due to thermal buoyancy, there is often an underpressure created in the lower sections of the building, especially in colder seasons, and infiltration occurs. At the same time, an overpressure is created towards the top of the building, and exfiltration occurs. The exfiltration and infiltration in the building, as well as the air exchange through the ceiling, primarily occurs by convection through leakages, cracks and penetrations. Thus, the ventilation in these attics is primarily driven by the two factors; pressure differences (wind) and thermal differences (chimney effect), and these factors are dominated by the outdoor conditions (wind velocity and direction, temperature), and therefore the variation in air change rate can be significant. In
Figure 2 it is seen that cold air enters the building on the windward side, which can cause draught. Furthermore, the overpressure created in the attic can drive air and possible impurities down to the dwelling. The warm air is driven out through the façade and ceiling, which causes both heat loss, and risks of moisture damage, as the moist, warm air is driven towards colder construction parts. Especially the roof underlay can become very cold in connection with sky radiation, and if the temperature falls below the dewpoint, condensation can occur, increasing the risks of mould and decay.
1.3. Additional Ceiling Insulation
Additional insulation to reduce heat loss through the ceiling yields theoretically decreased temperature and increased relative humidity in the attic as the heat flux through the ceiling is reduced [
12,
13]. Furthermore, a lower temperature in the attic reduces the ventilation by stack effect, driven by temperature differences, and thus the ability to remove excess moisture is impeded. Some studies however, show that the amount of insulation does not have significant effect on the attic temperature [
5,
14] that appeared to be mostly dominated by outdoor temperature [
15]. Most importantly, adequate ventilation of the cold attics with outdoor air seems important for the hygrothermal performance of the attic, and therefore, the application of postinsulation should not block any existing ventilation openings [
16,
17]. The type of insulation material applied on the ceiling may have an effect on the overall hygrothermal conditions in the attic. According to [
18], cellulose-based insulation can absorb 10–40 times more moisture than mineral wool, due to the hygroscopic properties; hence having a moisture-buffering effect. However, full-scale studies as well as field studies have not been able to establish this effect [
16,
19]. Some measurements do however indicate marginally lower moisture conditions in cold attics with hygroscopic insulation materials [
20].
1.4. Consequences of Moisture and Air Exchange
Excess moisture in cold attic spaces may condense on cold parts in the attic construction, and especially the roof underlay, which is cooled significantly due to sky radiation. The condensation of water on surfaces increases the risk of deterioration of building components, as well as the risks of both mould and other microbiological growth. There is not presently substantial knowledge on whether mould growth in a cold, ventilated attic effects the indoor air quality of the dwelling below.
The airtightness of the ceiling prevents both convection of moist air from the dwelling, but also reduces the possibility of downward airflow of possibly contaminated air. A recent Danish study of small cold attic spaces under the eaves stressed the importance of an airtight ceiling, as ventilation is not always sufficient for removal of moist air [
21]. A Swedish study [
1] also determined the side effect of mould odour in the dwelling due to mould growth in the attic. Furthermore, studies have shown migration of VOCs (volatile organic compounds) [
22], air exchange [
23] and mould spore migration [
24] through floor separations between crawl spaces and dwelling—especially in cases of underpressure in the dwelling. The significance of these pressure differences were elaborated in an American study [
25]. The study found that 2% of 2 µm particles passed through a slit at a pressure difference of 2 Pa, whereas 40% of the 2 µm particles passed at pressure difference of 5 Pa, and 90% of the particles passed though at 20 Pa pressure difference. Therefore, there might be reason for concern for the indoor air quality in cases with mould growth in the attic. A Swedish study [
3] found increased moisture safety in cold attics given the following conditions: airtight ceiling, well-ventilated indoor climate, and maintaining an overpressure in the attic. The latter however, may not be advisable in order to prevent possible transport of e.g., mould spores from the attic to the dwelling
In practice, mould in the attic has not been considered as a significant issue if combined with an airtight ceiling. This is due to the fact that mould is superficial, and doesn’t deteriorate the constructions, and with a tight ceiling the spores are not assumed to affect the indoor air quality. At the same time, mould growth in attics generates an insecurity for the inhabitants, as the consequences are not fully investigated, and the mould furthermore indicates high levels of moisture and inadequate ventilation. Mould exposure can cause health related issues for occupants, which is why it is undesired in the indoor climate. Therefore, occupants risk being exposed to allergens, mycotoxins, glucans and VOCs, if there is migration of spores from attic to dwelling. Common symptoms include allergic reactions, respiratory problems, inflammation, headaches, fatigue and more, which has been demonstrated by various exposure experiments [
26].
The objective of the present study was to investigate air exchange between dwellings and cold, ventilated attics in traditional Danish, single-family houses. The air exchange—in both directions—was established by means of perfluorocarbon tracer (PFT) gas measurements in 30 Danish homes, with a variety of ceiling constructions and cold roofs. The measurements were performed twice for each house, in a cold and warm season respectively. The downward air transfer is relevant with regard to mould exposure in the dwellings, in cases of mould growth in the attic, while the upward air transfer is vital for the moisture conditions in the attic space. Furthermore, the air change rates in both dwelling and attic were determined for both measurement periods for all the houses. Research in the balance between ventilation rates and the ceilings’ air tightness are necessary in order to moisture safely omit vapour barriers in these ceilings, and this investigation is a first step in that direction.
2. Materials and Methods
For the present investigation, 30 single-family houses with cold, ventilated attics were studied. Tracer gas measurements were performed in order to determine ventilation conditions and air exchange. Furthermore, temperature and relative humidity conditions were monitored in the dwelling, attic and outdoors.
2.1. Selection of Test Houses
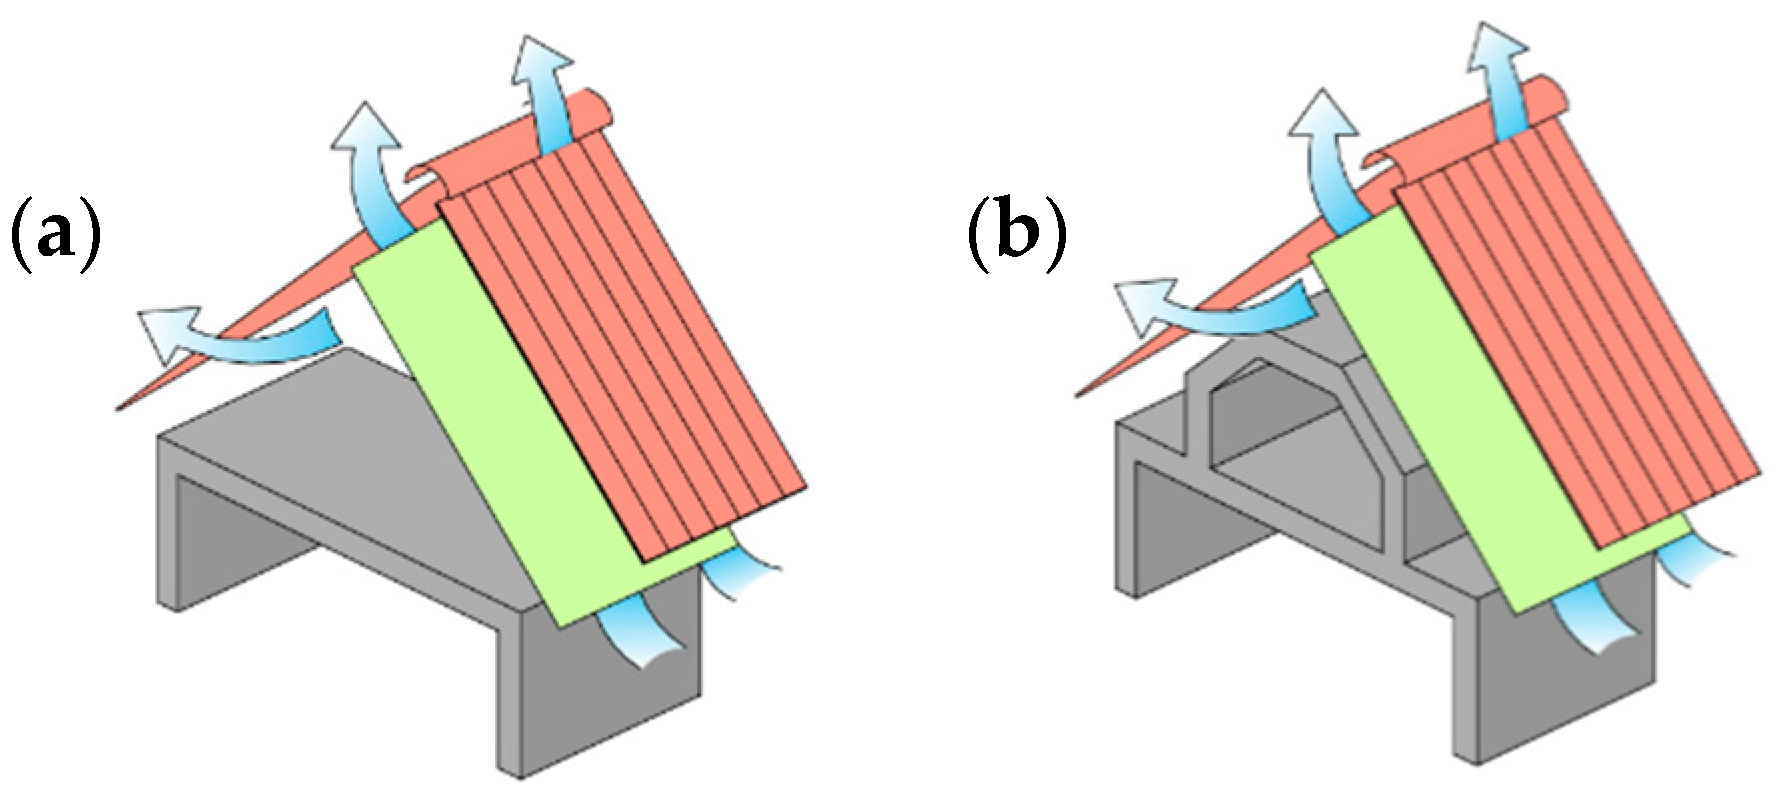
Criteria for selection of houses to be included in the investigation were first and foremost the attic and roof construction. Types as presented in
Figure 3 were included in the study. Furthermore, the attic had to be accessible, so the inclination of the roof had to be >15°.
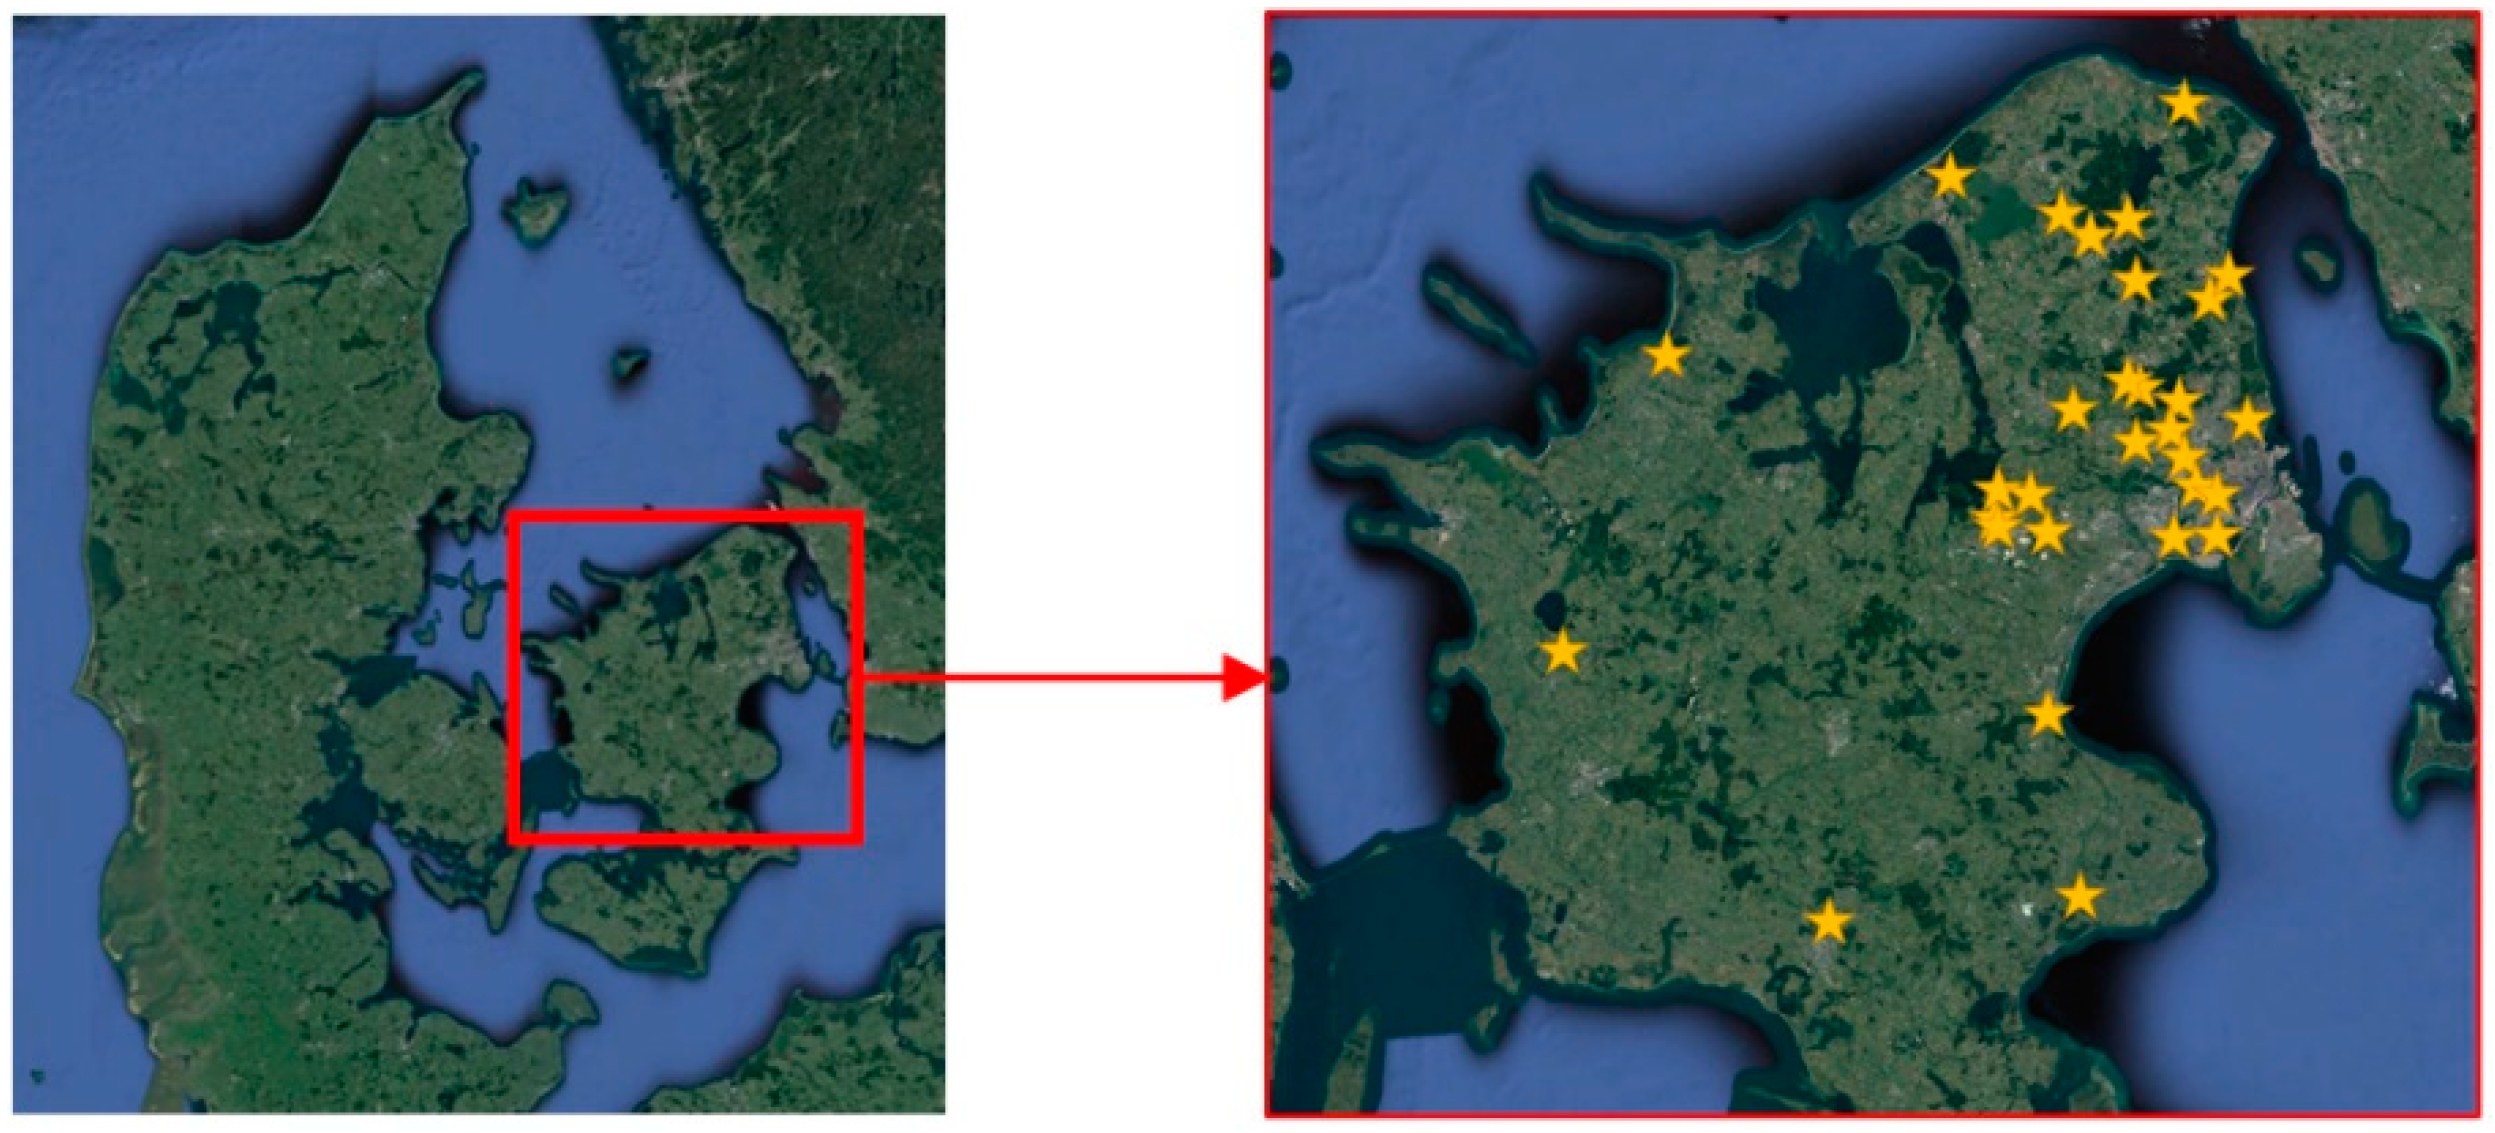
All test houses were within driving distance from Copenhagen, and on the island Zealand.
Figure 4 depicts the locations of the 30 test houses.
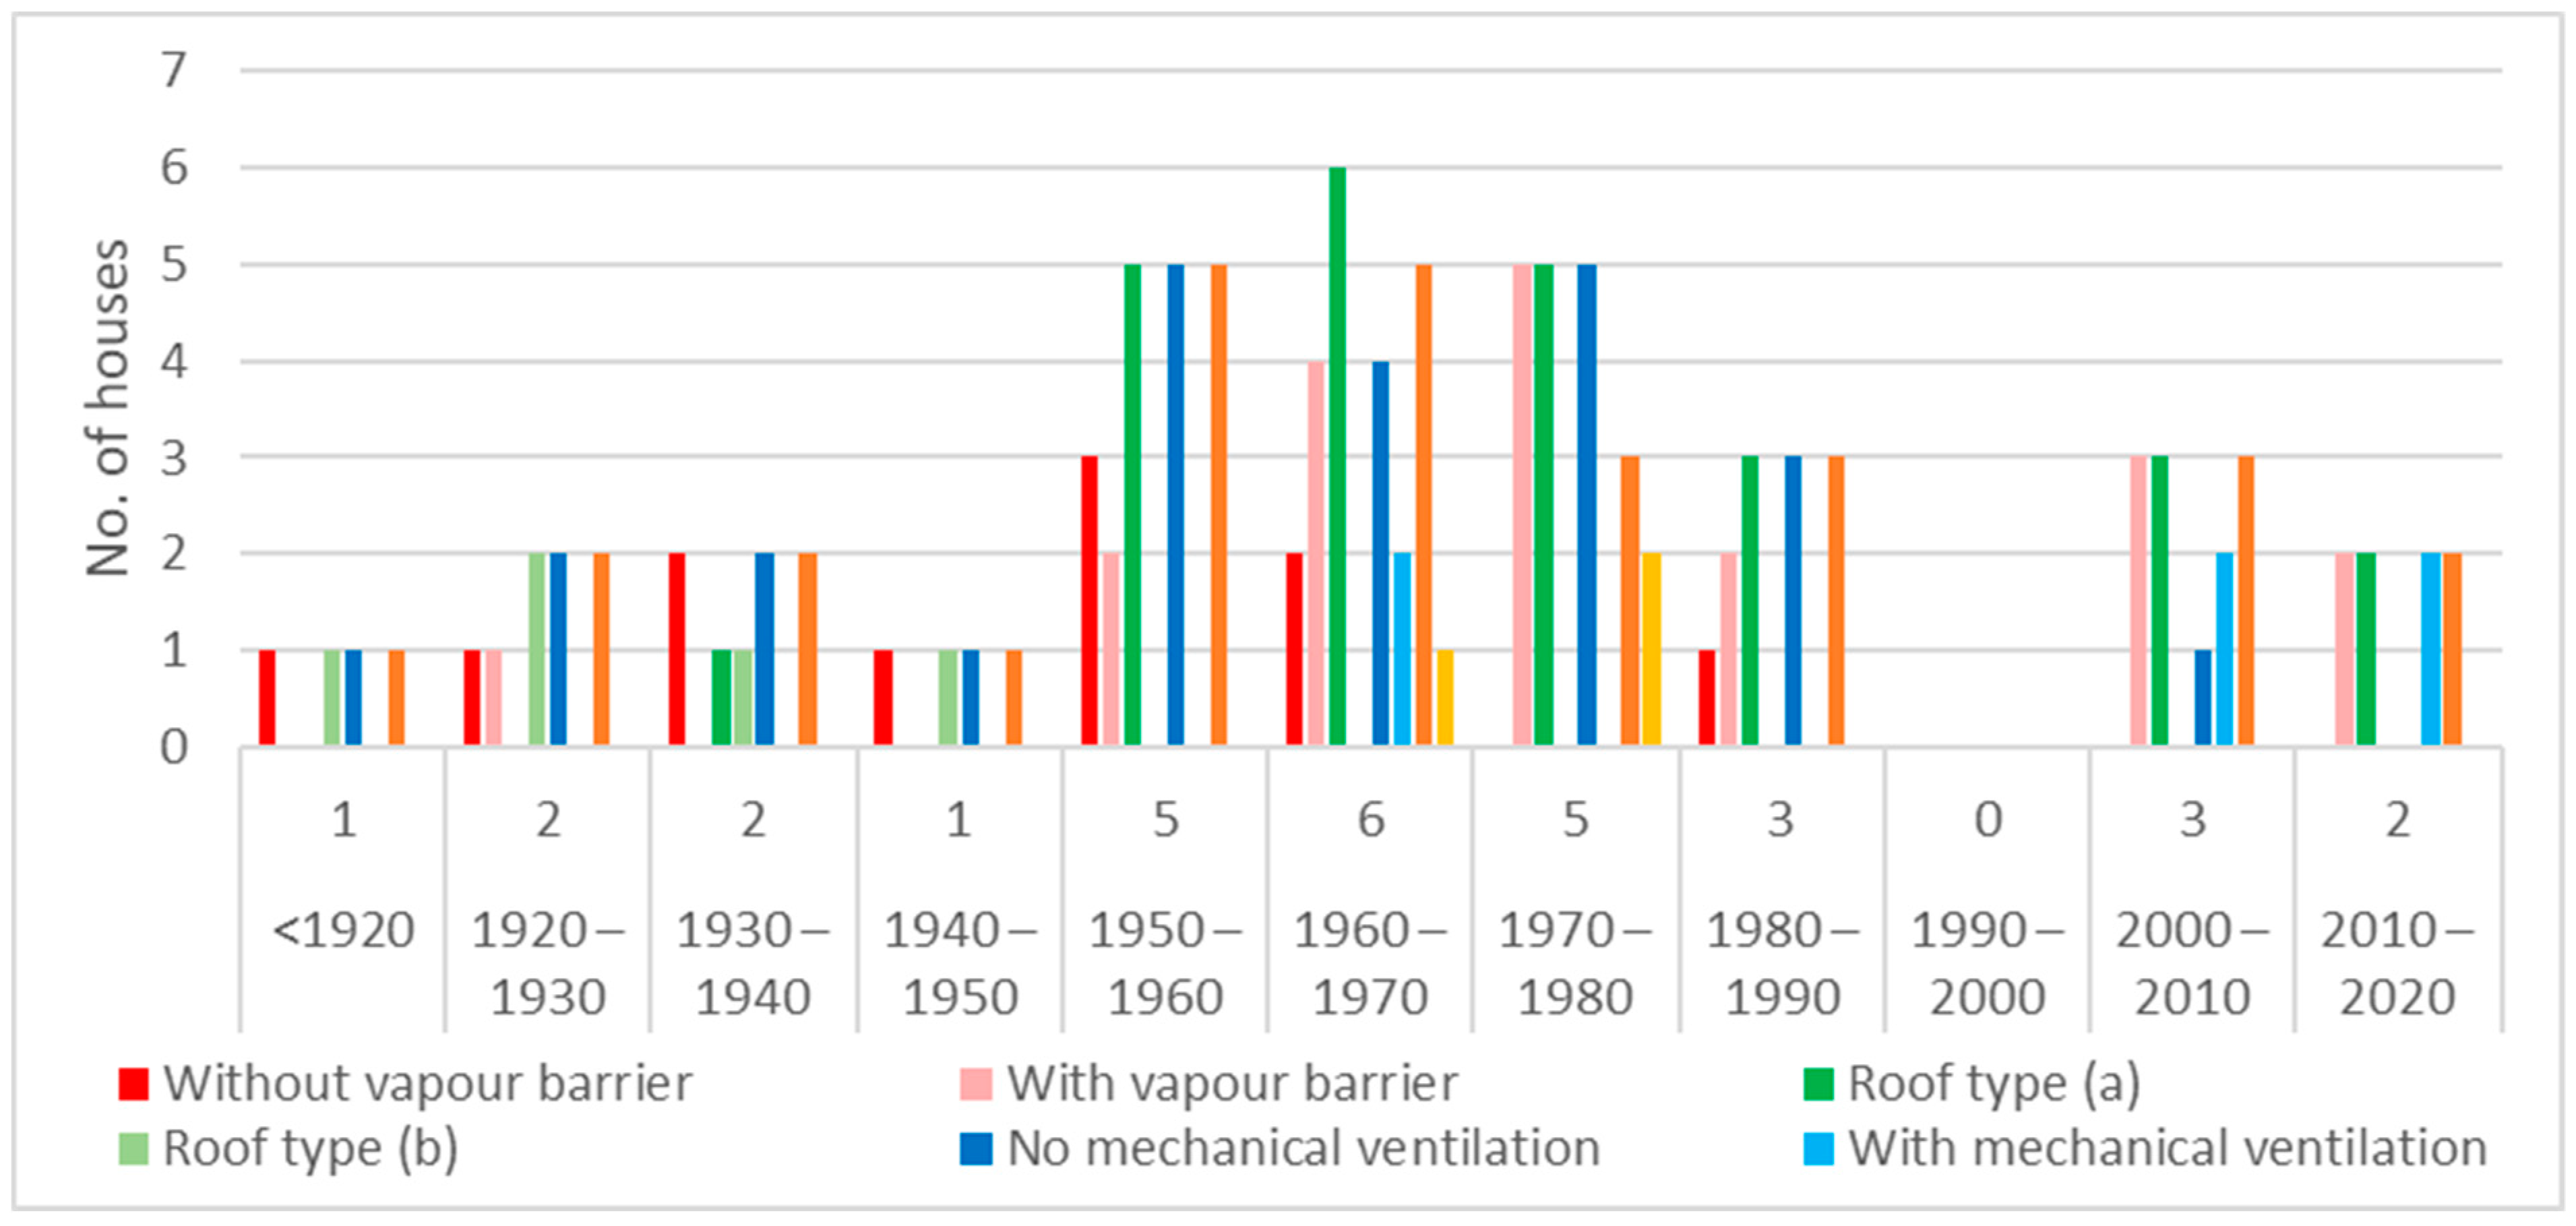
Furthermore, an equal distribution of houses with and without vapour barriers was targeted, as well as an equal distribution of houses with mineral wool and cellulose-based insulation materials due to the differences in moisture buffering properties. However, the equal distribution was not achieved, as it proved to be a complicated task to find 30 suitable houses to volunteer for measurements. Alas, the distribution of with/without a vapour barrier was 19/11, and mineral wool/cellulose-based insulation was 27/3. In the three cases with cellulose-based insulation, this had been applied on top of an existing layer of mineral wool. Of the houses reported to have vapour barriers, the condition of these were largely unknown—especially in the older houses. Most of the houses without vapour barriers, were from prior to 1970. All the included buildings were equipped with air extraction in kitchen and bathrooms, and further six houses were equipped with mechanical ventilation systems. The houses were primarily constructed between 1928 and 2016, and a single house is from 1719. The 30 houses are elaborated in
Table 1, and a graphical distribution of houses on year of construction, with/without a vapour barrier, roof type, ventilation and insulation is seen in
Figure 5.
2.2. Measurements
For the present investigation, the following measurements were performed;
Data logging of temperature (T) and relative humidity (RH) in both dwelling and cold attic space, and outdoors
Tracer gas measurements (perfluorocarbon, PFT) for measurements of air change rates in dwelling and cold attic space, as well as the air exchange between the two
2.2.1. Perflourocarbon Tracer (PFT) Gas Measurements
The PFT method is used to determine air change rates, as well as the air exchange between zones. It is based on a constant-dose principle and passive adsorption sampling [
28,
29]. The method is extensively described in [
28], and a brief method description is provided here. The method determines the supply of outdoor air to a building, or different zones in a building. When several types of tracer gases are used, the internal air exchange between zones can be determined as well. The tracer gas sources release gases with constant dose, dependent on the temperature. Thus, the average emission rate can be determined based on the average temperature. The passive sampling occurs without energy supply. The tracer gas types are perfluorocarbons which are organic compounds of the perfluoralkylcycloalkan-family. These types are used, as they are chemically stable, and not harmful for humans nor the environment. Furthermore, the background concentration of these gases in the ambient surroundings is low, and the volatility high, and thus they give a strong response in the analysis. The measurements provide average values for the air exchange rates for the measurement period.
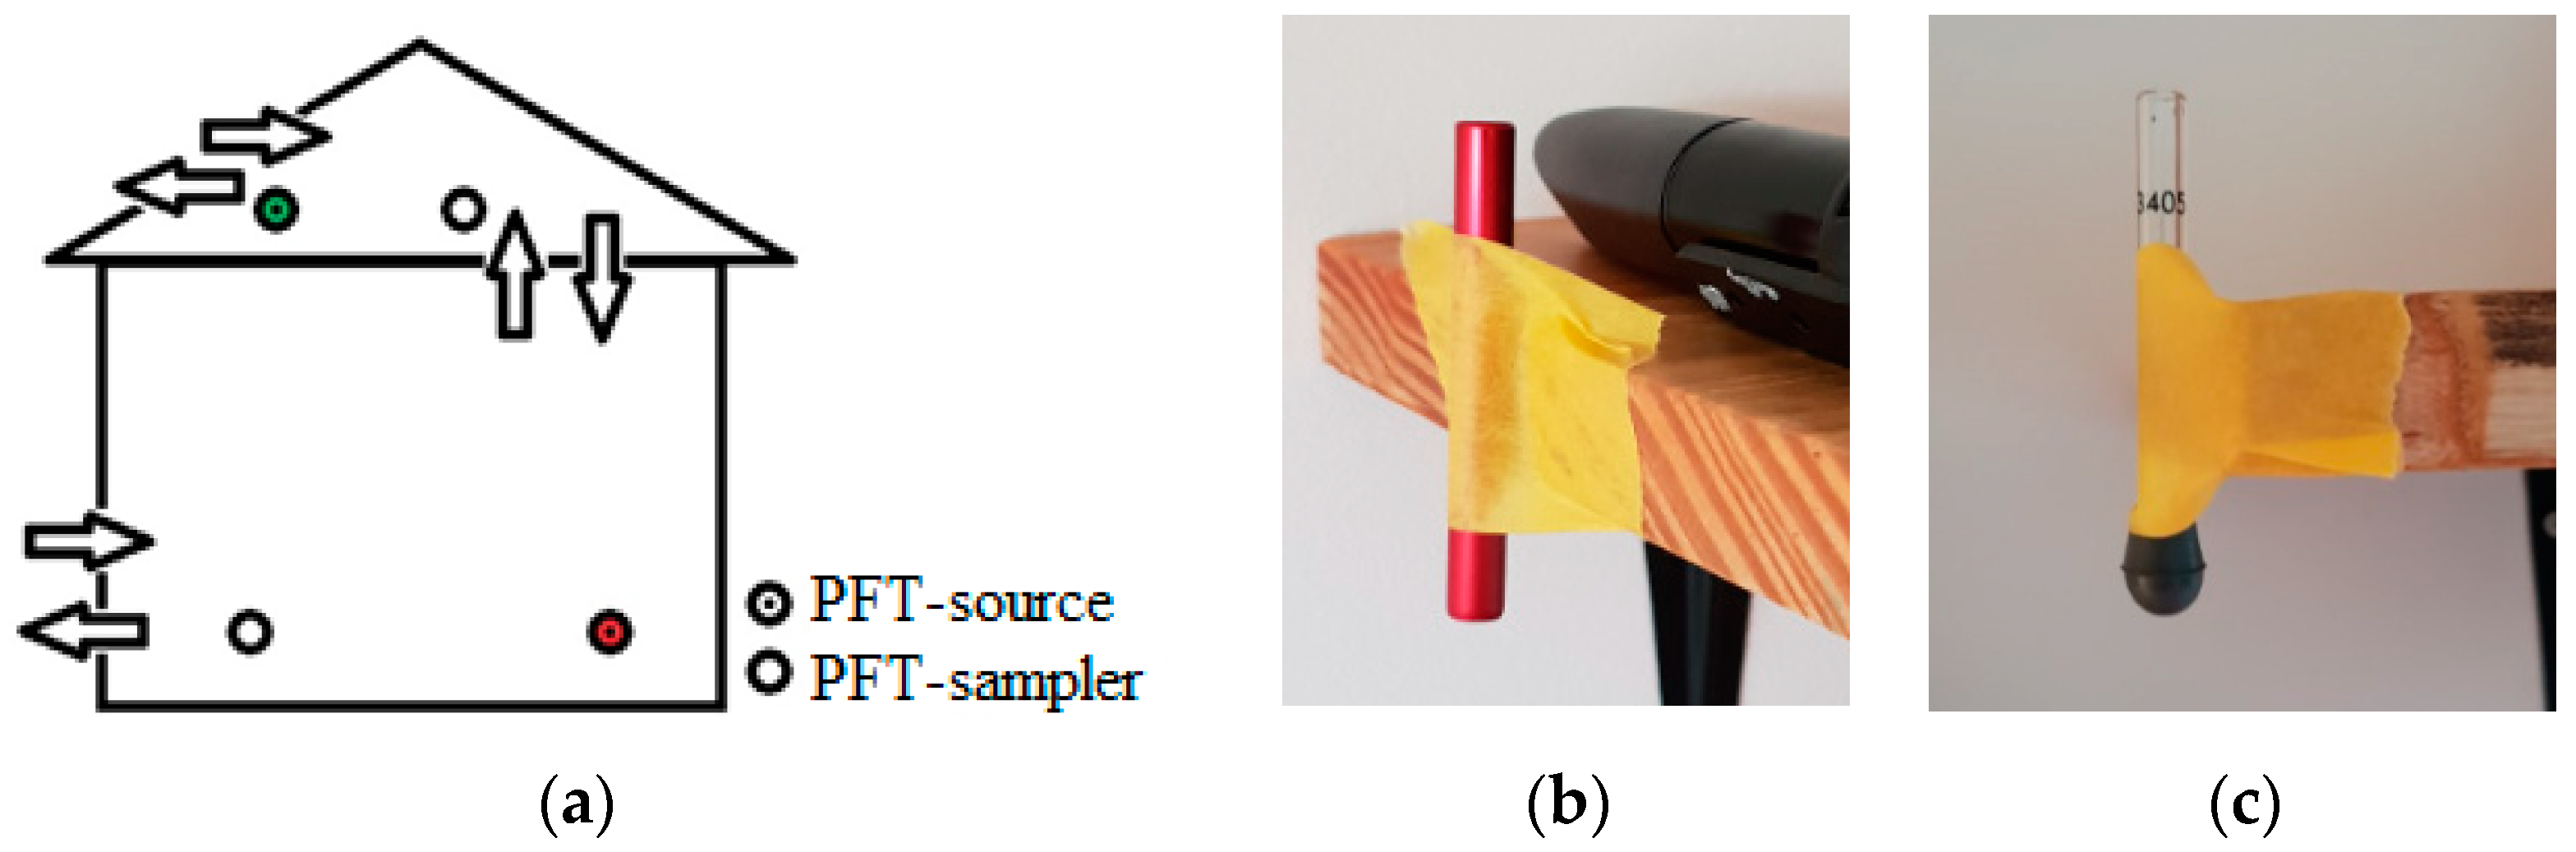
For the measurements, the following equipment was used: passive tracer gas sources, passive sampling tubes, and temperature measurements for determination of average emission rate. Thermal desorption and ECD (electron capture detector) were used for analysis of the sampling tubes after measurements. The passive tracer gas sources are small metal tubes with compressed gas, sealed with silicone the gas can diffuse through (
Figure 6b). The sampling tubes are small glass tubes with an adsorption material (Ambersorb type 347) (
Figure 6c).
In this project, the two-zone principle was used, and two types of tracer gases in all 30 houses. The principle is simple and illustrated in
Figure 6a. One gas type, PMCH (perfluoromethylcyclohexan) was placed in the dwelling-zone, and another, PMCP (perfluoromethylcyclopentan) was placed in the attic-zone. By estimation of the emission rate of each gas source by average temperature and the empirically estimated sampling rates (dependent on the tube dimensions and the gas types), the infiltration and exfiltration can be determined. Divided by the volumes of each zone, the air change rate is also determined. The volume of dwelling and attic space was determined from floor plans when possible, and the height of both dwelling and attic were determined with a handheld laser distance measurer. The laser distance measurer was also used in cases that could not provide drawings drawn to scale.
The 30 houses included in the study have a variety of geometries and layouts. Nevertheless, for nearly all the attic spaces, two gas sources and two sampling tubes were used. In one case, the attic was so small that one gas source, and one sampler was sufficient. In the dwelling zone, four to six gas sources and sampling tubes were installed, dependent on the dwelling size. The number of temperature/relative humidity loggers differed with regard to size of the zones, and general temperature differences. Due to the temperature dependency, the equipment was installed in a manner so it was not affected by neither direct solar radiation, cold surfaces or heat from electrical equipment. Furthermore, the gas sources were placed so that there was highest possible mixing with the indoor air, e.g., in the opposite corner to a kitchen extractor pipe. The sampling tubes were placed so they are representative for the room air, and at least 2 m from the gas source.
2.2.2. Temperature and Relative Humidity
For the same measurement periods, temperature (θ) and relative humidity (RH) measurements were performed in both the dwelling and attic space. Dataloggers of the type EL-USB-2+ from EasyLog were used. The dataloggers have a measurement range between −35 °C and 80 °C, and 0 to 100% RH, and were set to measure hourly. One to two data loggers were placed in the attic spaces, and two to four dataloggers were placed in the dwelling spaces. Average measurements from both zones were used for further processing. The dataloggers were placed out of reach of sunlight and not on cold walls or electrical appliances.
2.2.3. Uncertainties
In connection with the measurements, there are some uncertainties. First of all, the emission rate from the gas sources is determined from average temperatures during the measurement period, and therefore any fluctuations are not considered. Furthermore, the gas sources and the samplers were transported together by car to and from the test houses, which may have caused some misreadings. However, the transportation was done as safely as possible, by placing the gas sources in the trunk, and the samplers (with covers) in the front seat. Lastly, some precautions should be considered, as the temperature and relative humidity loggers were not calibrated before nor after measurements. However, measurements show realistic tendencies and are considered sufficient. For further evaluation, the measurements were converted to absolute humidity. The producer has specified the uncertainties of temperature and relative humidity as provided in
Table 2. As the accuracy is not given for the entire measurement range, measurement results that fall out of the accuracy ranges are subject to errors, and measurements outside the given accuracy ranges should be considered with reservations.
2.2.4. Measurement Periods
The measurements were performed twice in all the included houses, with a minimum of two months in between. Measurements from cold and warm periods were sought, however due to restrictions in time and equipment, some measurements were performed in the spring season. The average length of each measurement was 15 days, but the duration varied from 9–28 days. The measurement results were thus average values for this period.
3. Results and Discussion
Some measurements were clearly erroneous and are not included in the results. In addition, some houses did not want to participate in the second measurement. The measurements left out were; houses 8 and 12 for the winter, and houses 5, 14, 18, 24 and 29 for the summer.
3.1. Temperature, Relative and Absolute Humidity
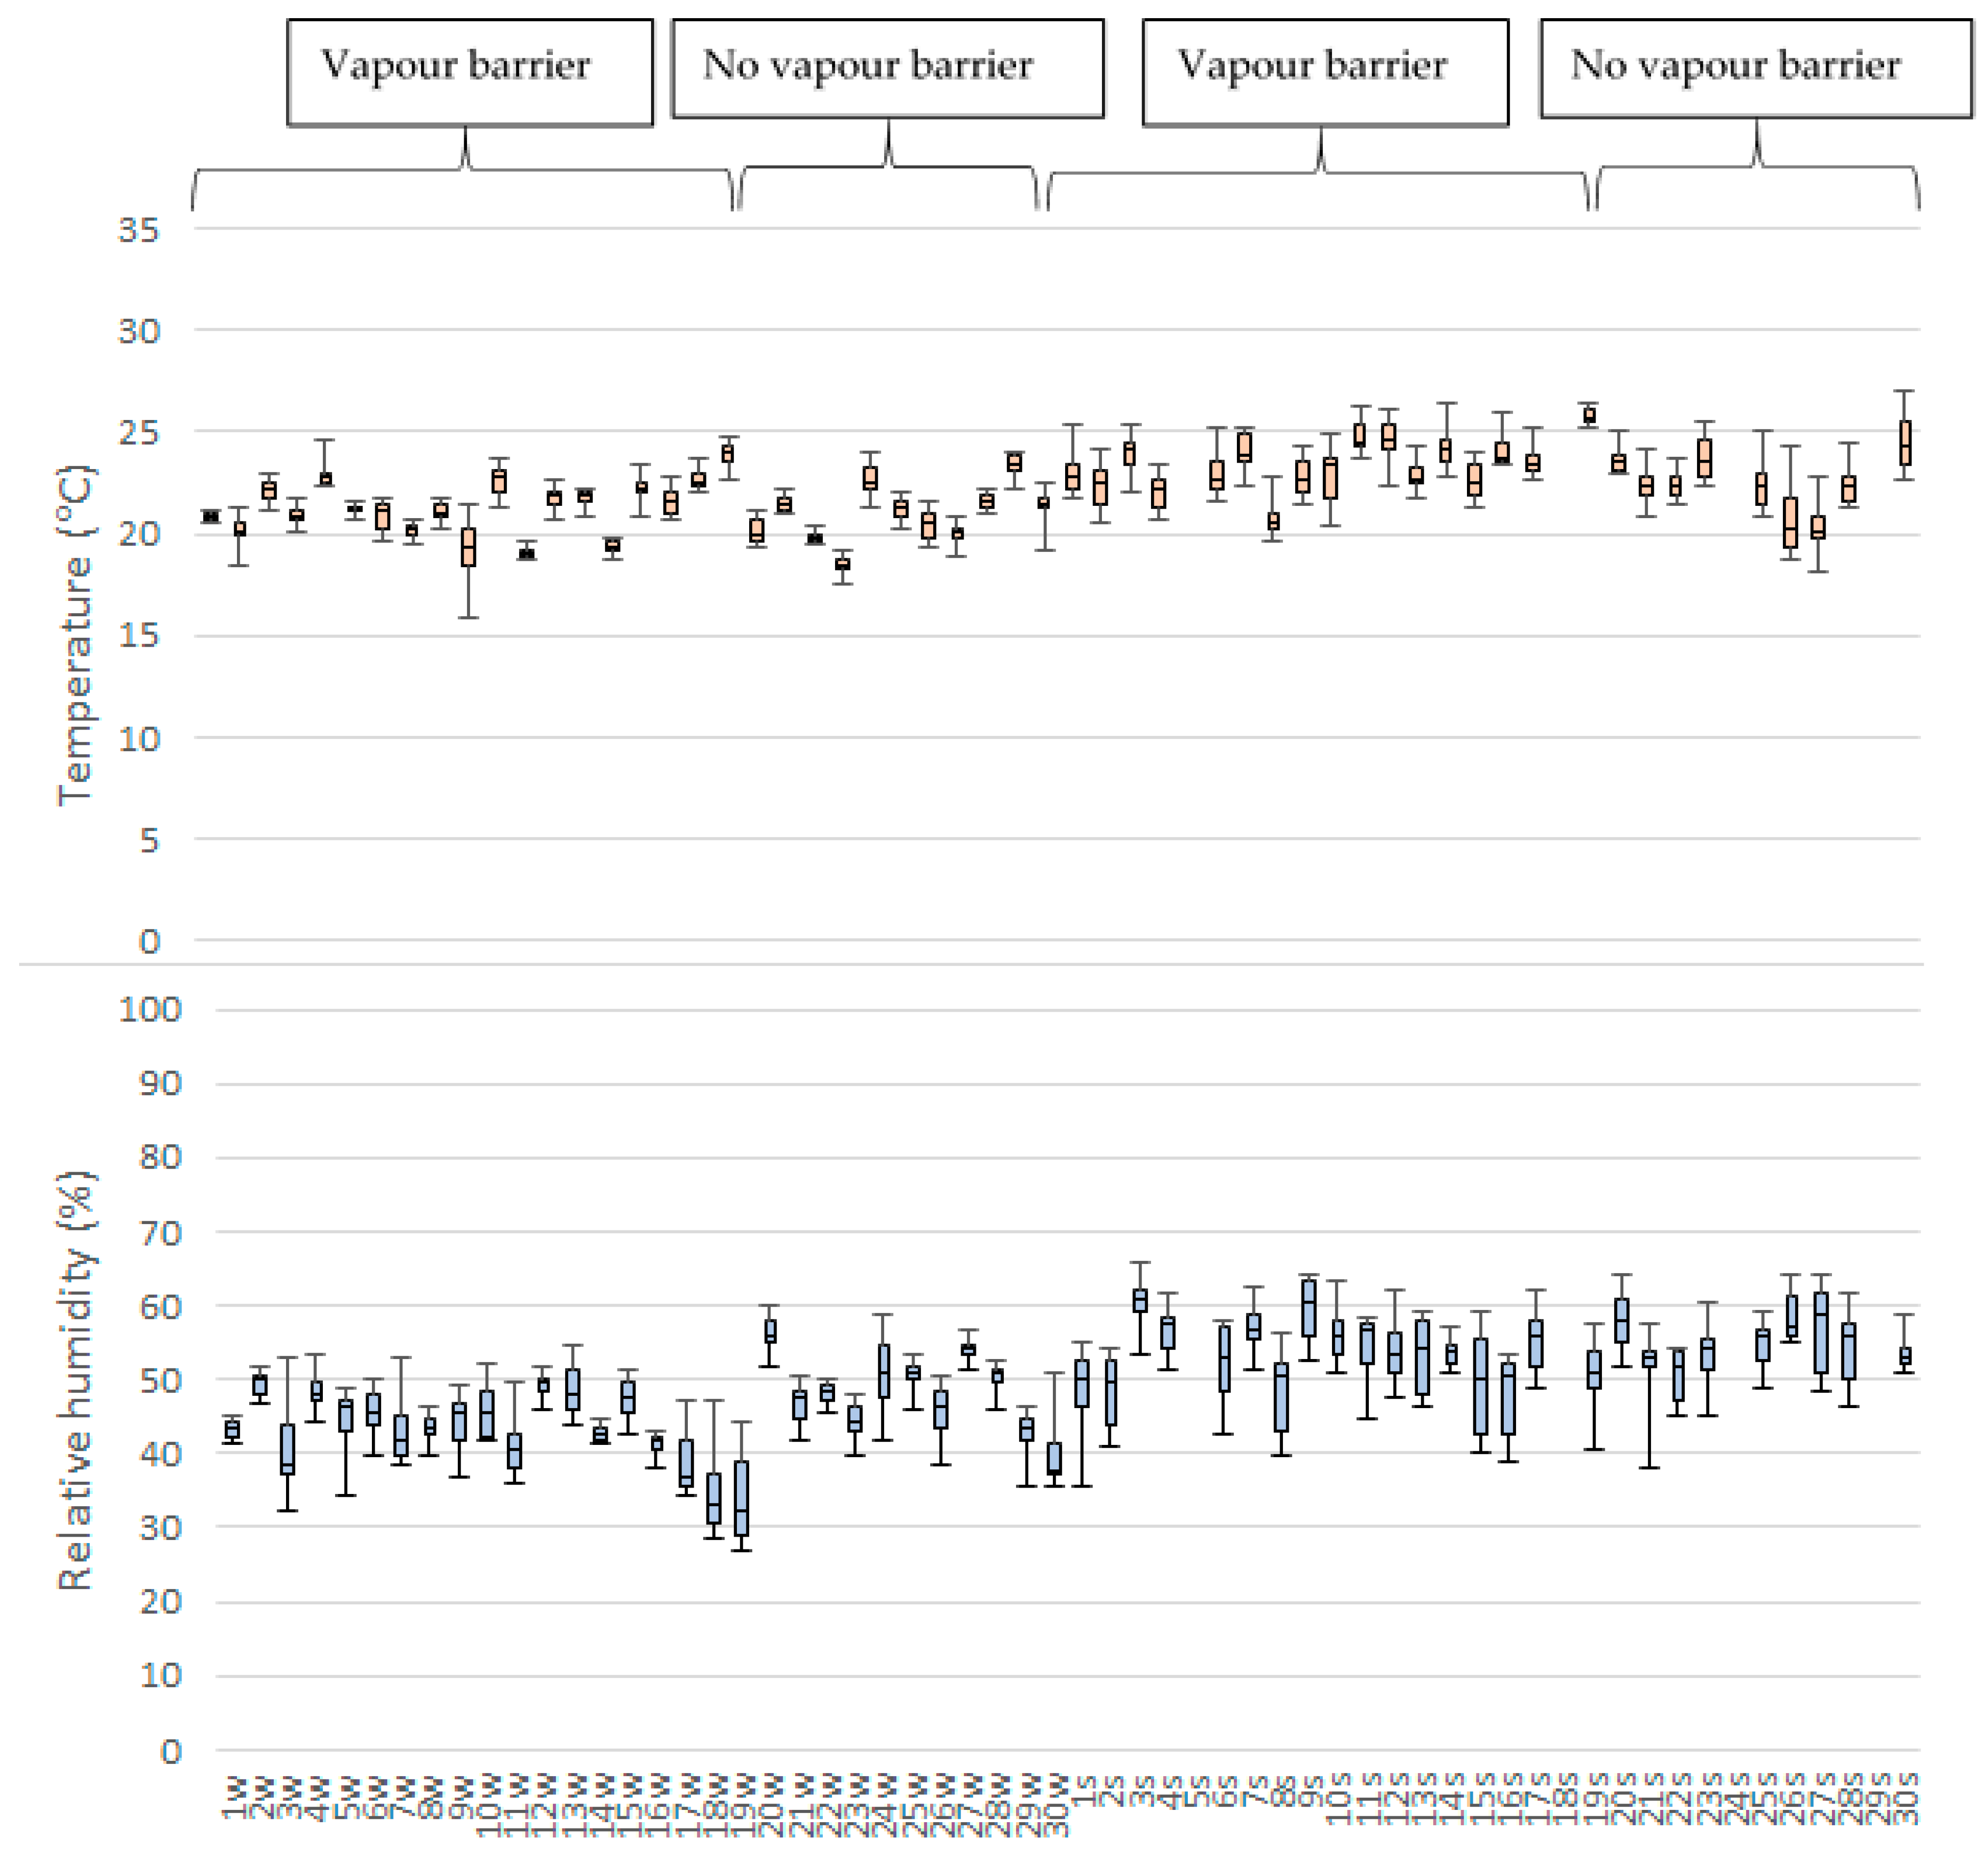
The measured values of temperature and relative humidity for dwellings and attics are presented in
Figure 7 and
Figure 8 as daily averages. From
Figure 7 it can be seen, that the dwelling temperatures are fairly stable around 20 °C, and a little warmer in summer. The relative humidity in dwellings fluctuates between 30–60%, and is also slightly higher in summer.
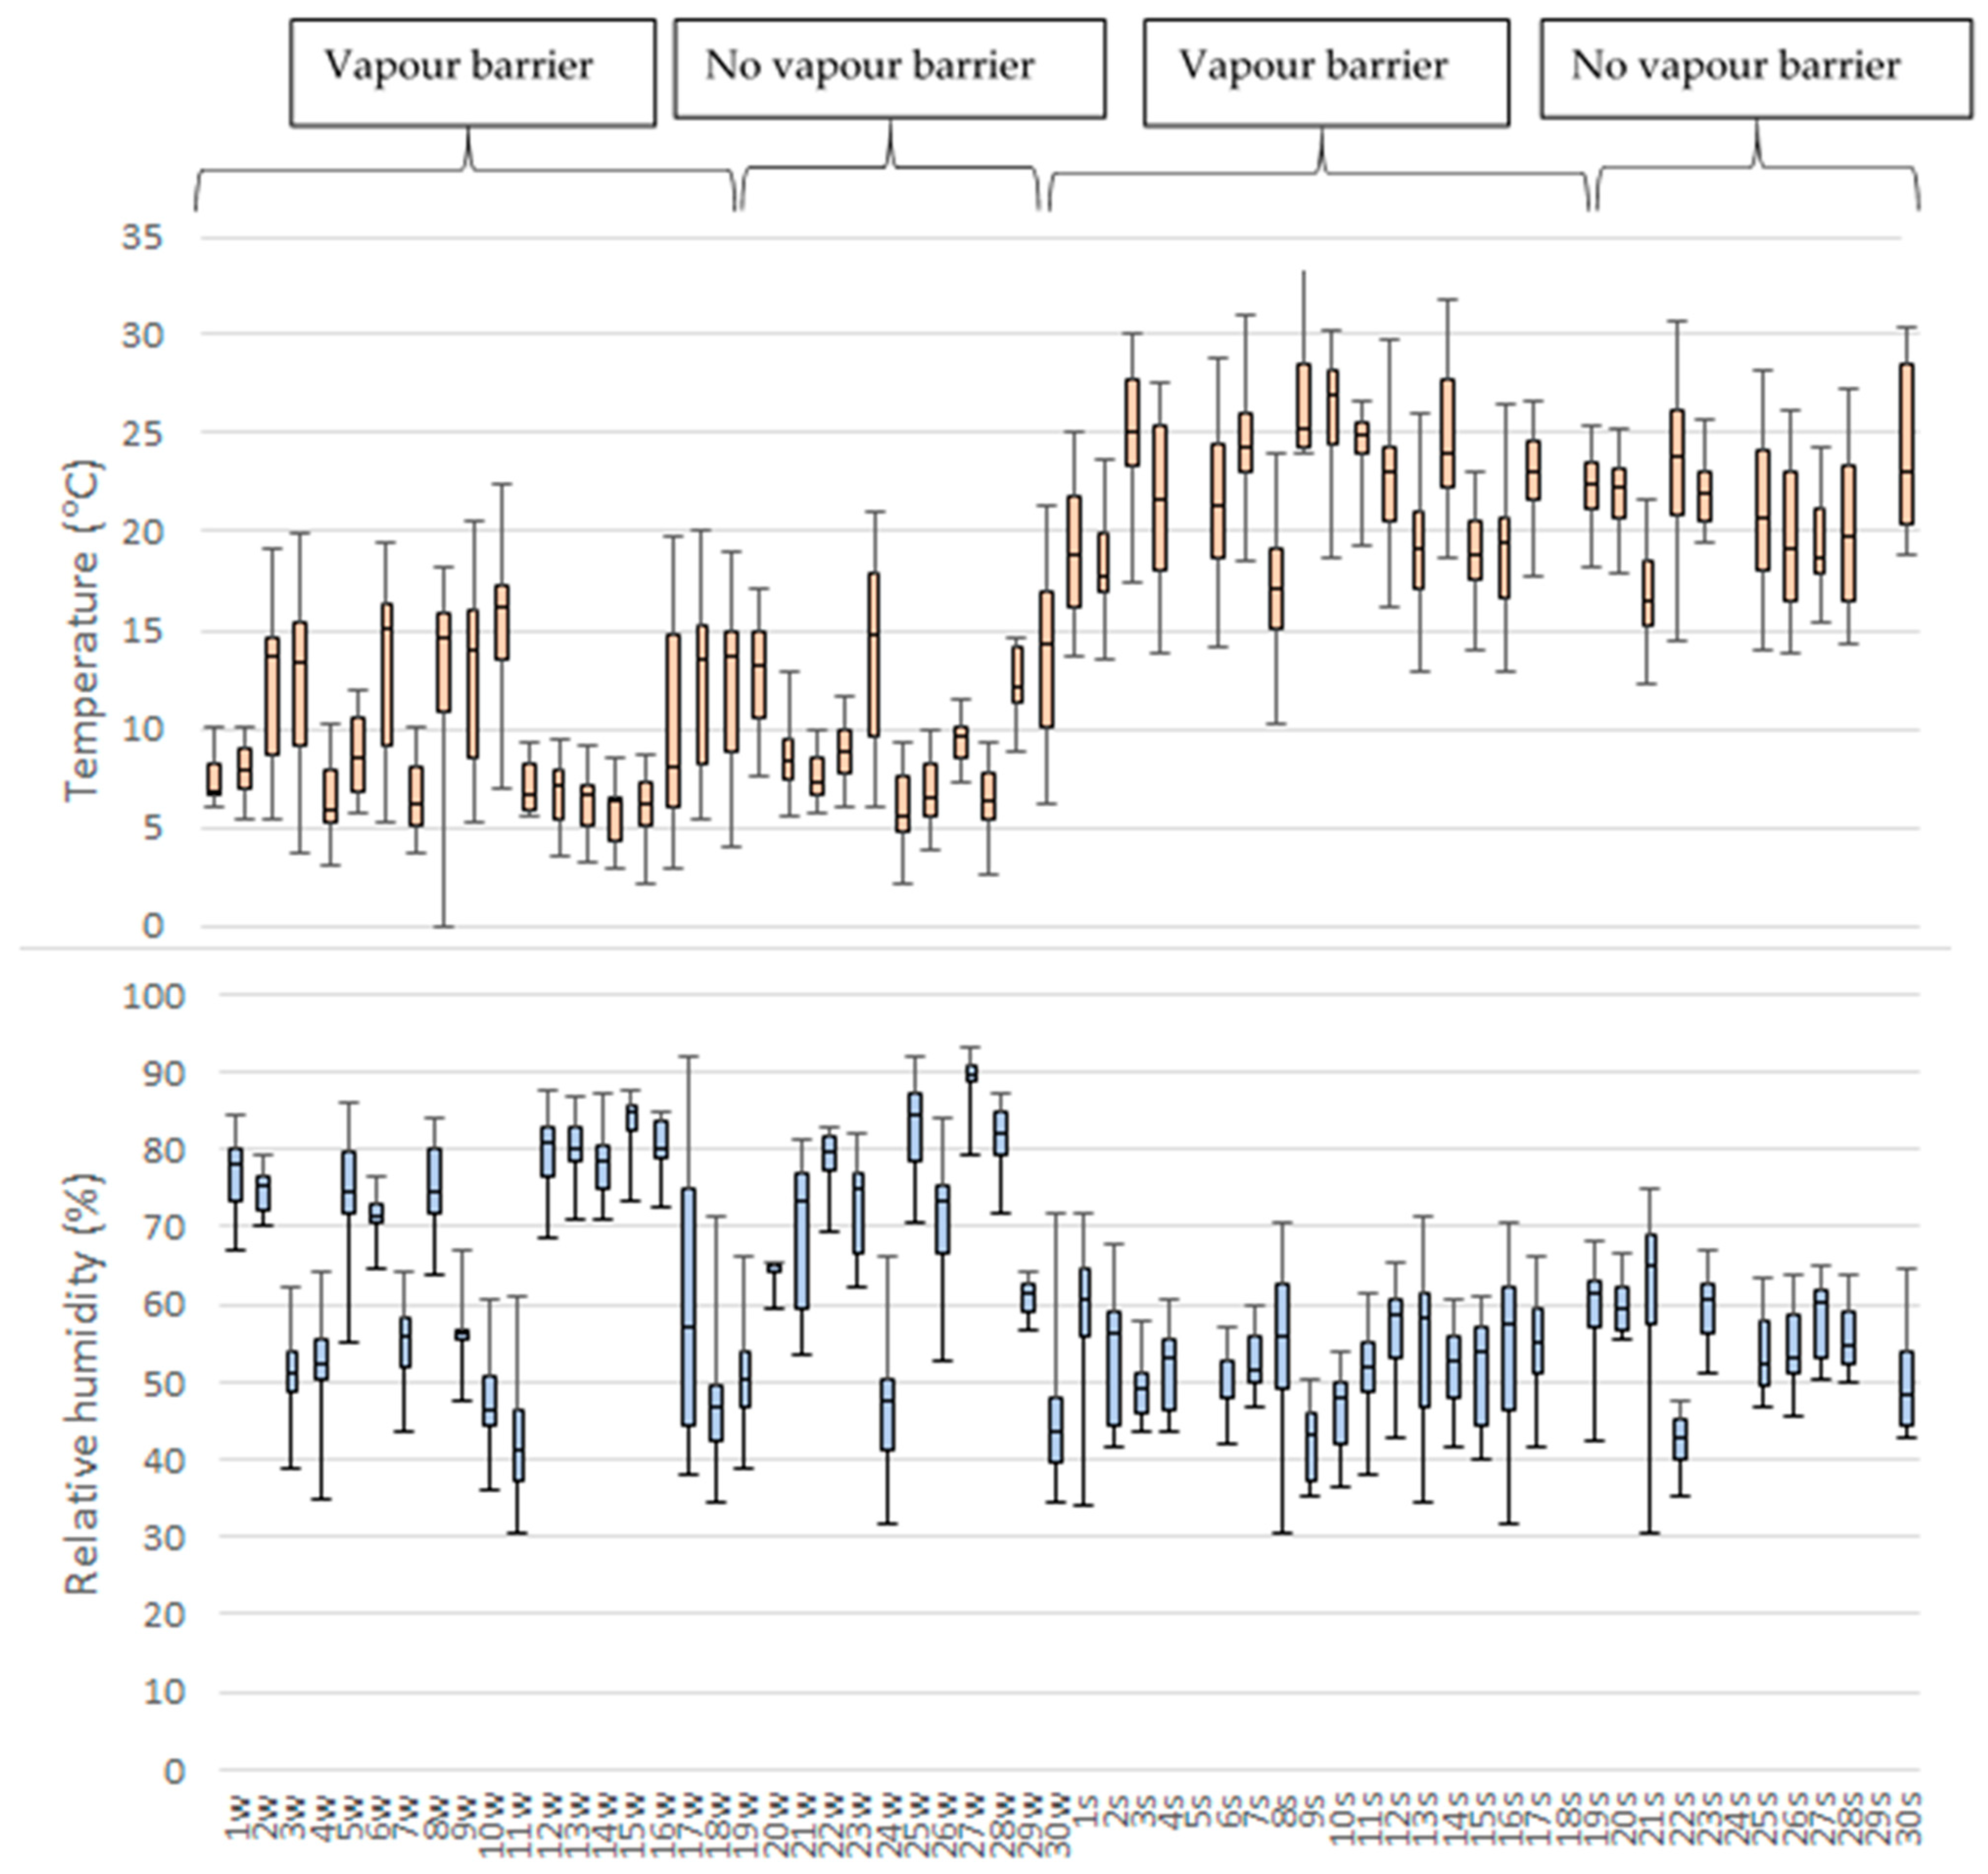
The temperature and relative humidity measured in the attics,
Figure 8, show a large daily and seasonal variation. The attic spaces become very cold in winter, down to 0 °C, while the relative humidity is high, above 80%. As the temperature increases, the relative humidity decreases, but peaks above 80% still occur. The attic conditions are very similar to the exterior conditions.
With regard to the given accuracy in
Table 2; all temperature and relative humidity measurements performed in the dwellings fall within the given accuracy ranges. In the attics, some measurements fall out of range in the winter season; all houses with one exception (house 29) for T < 5°C, and seven houses (5, 12, 14, 17, 25, 27, 28) for RH > 90%. The validity of these results is therefore not guaranteed, but results of the measurements are within realistic magnitudes. In summer months, all the measurements in the attics fall within the accuracy ranges.
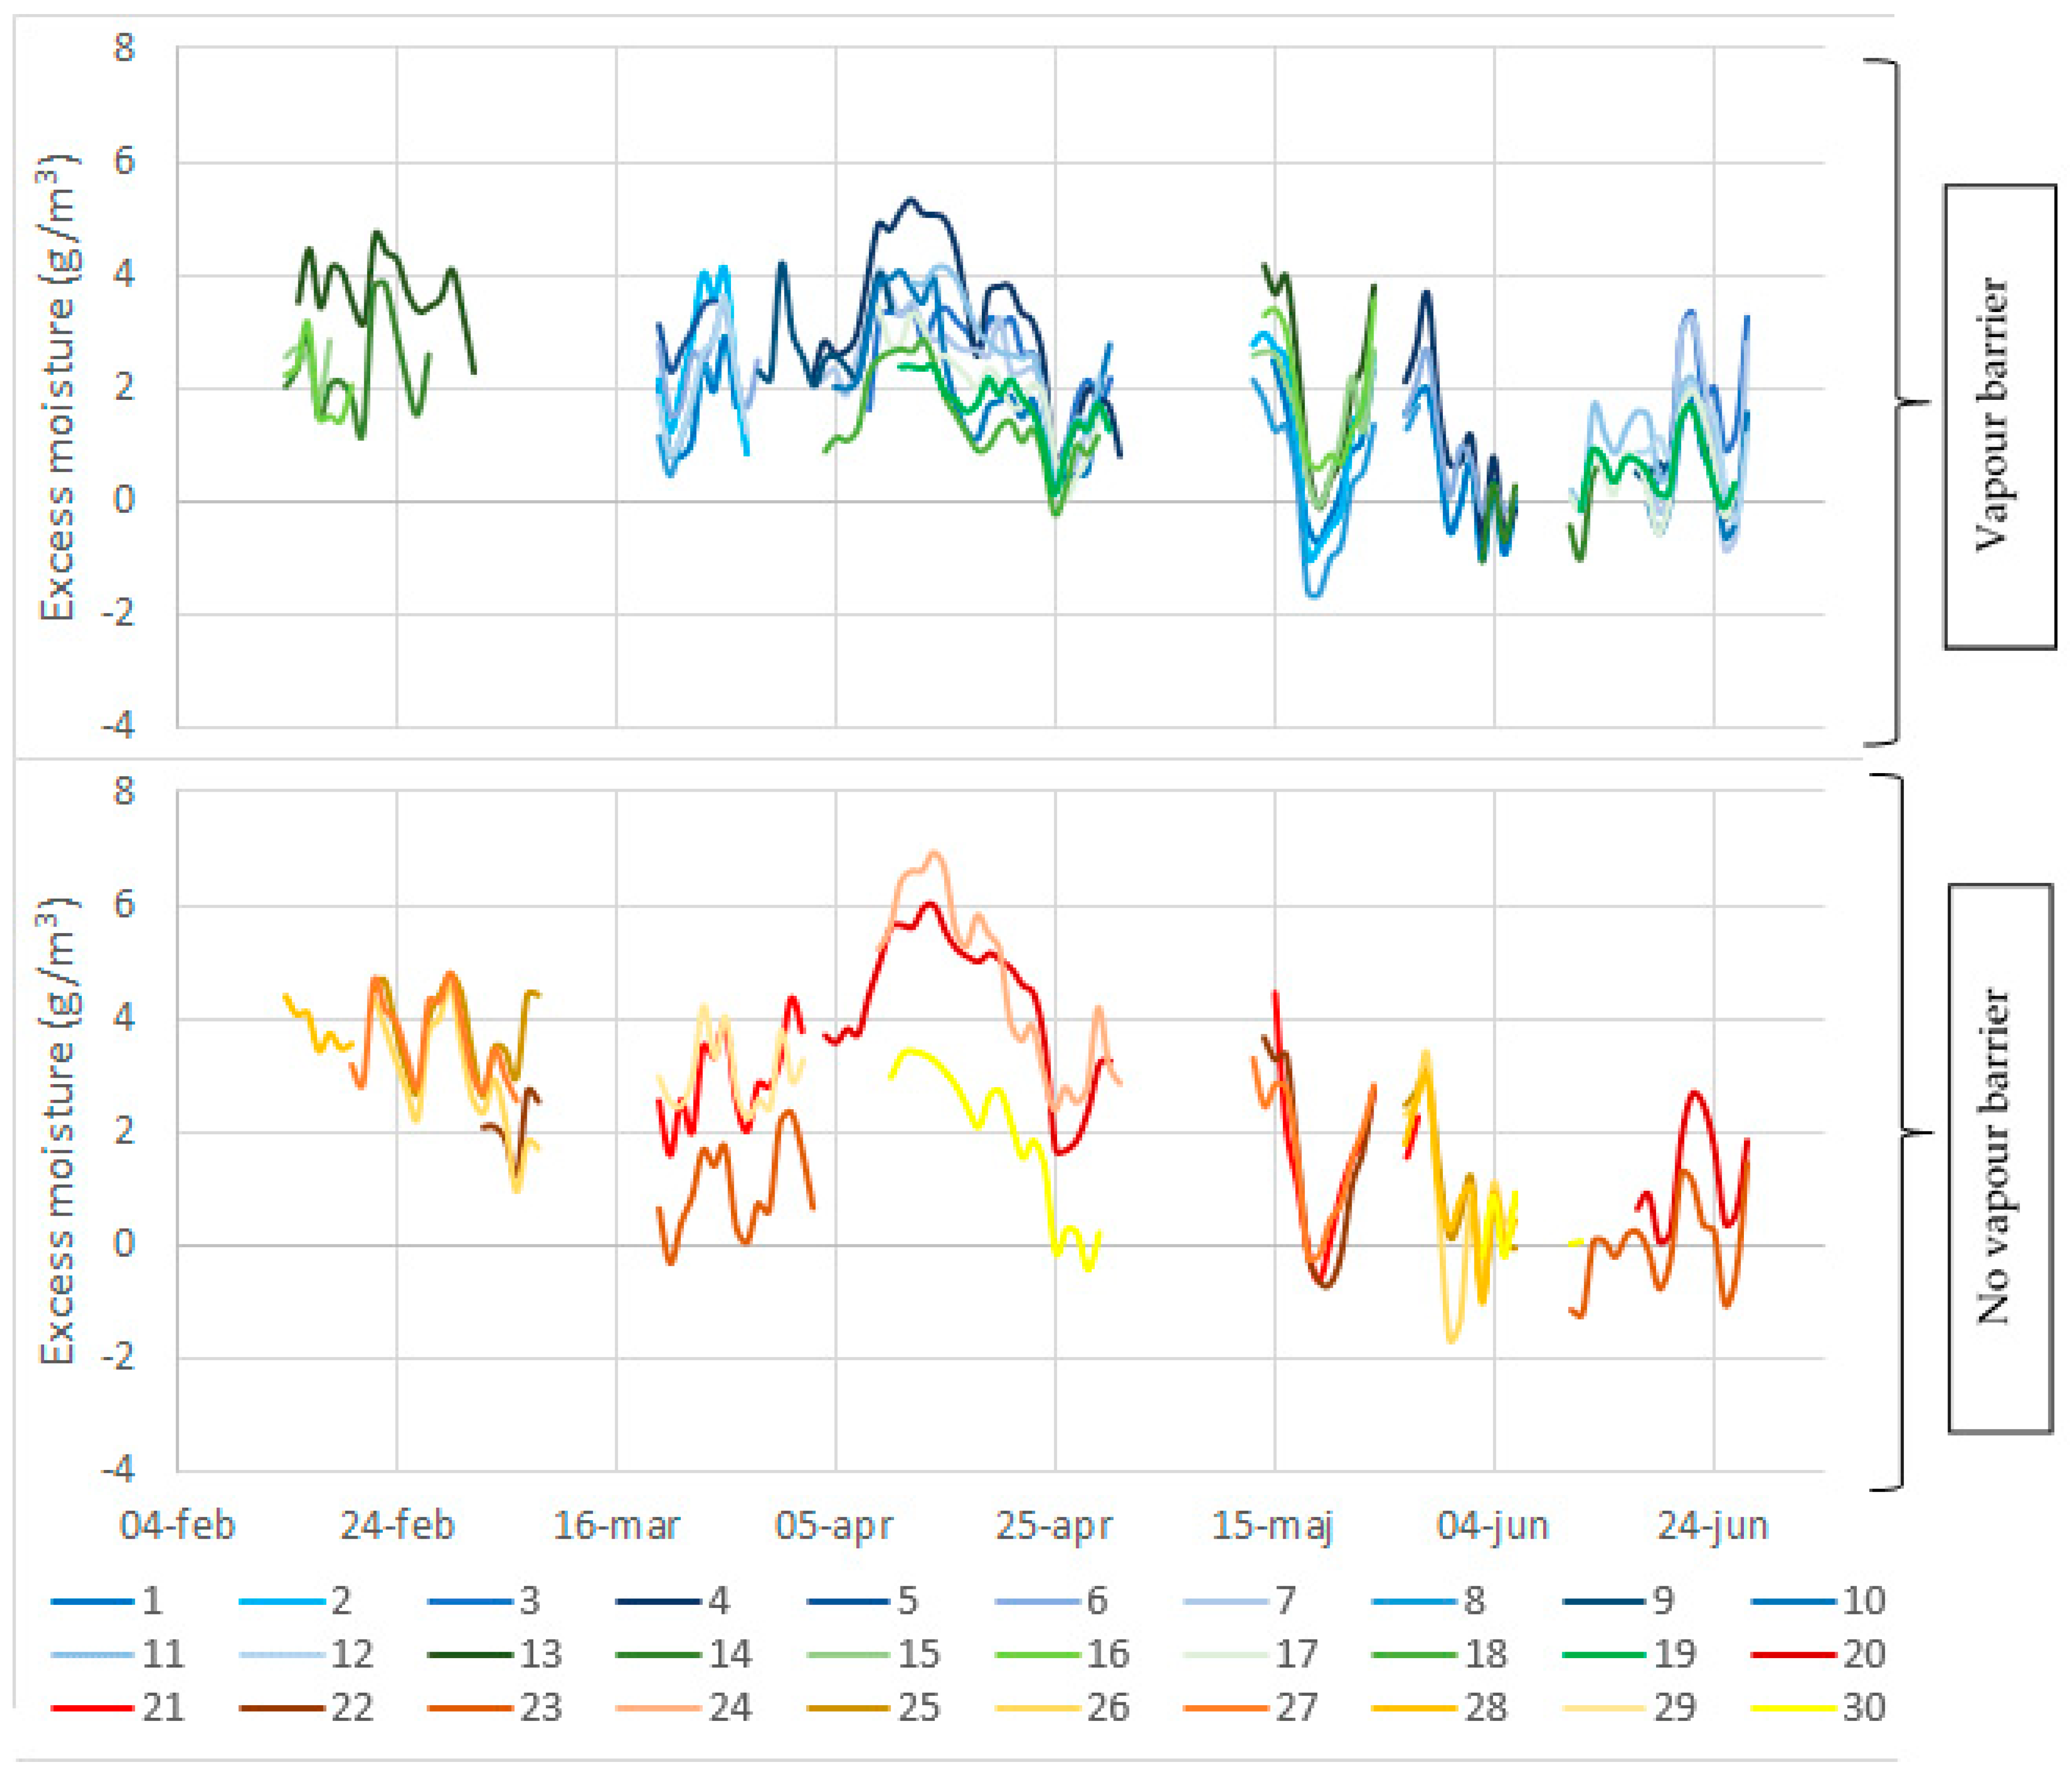
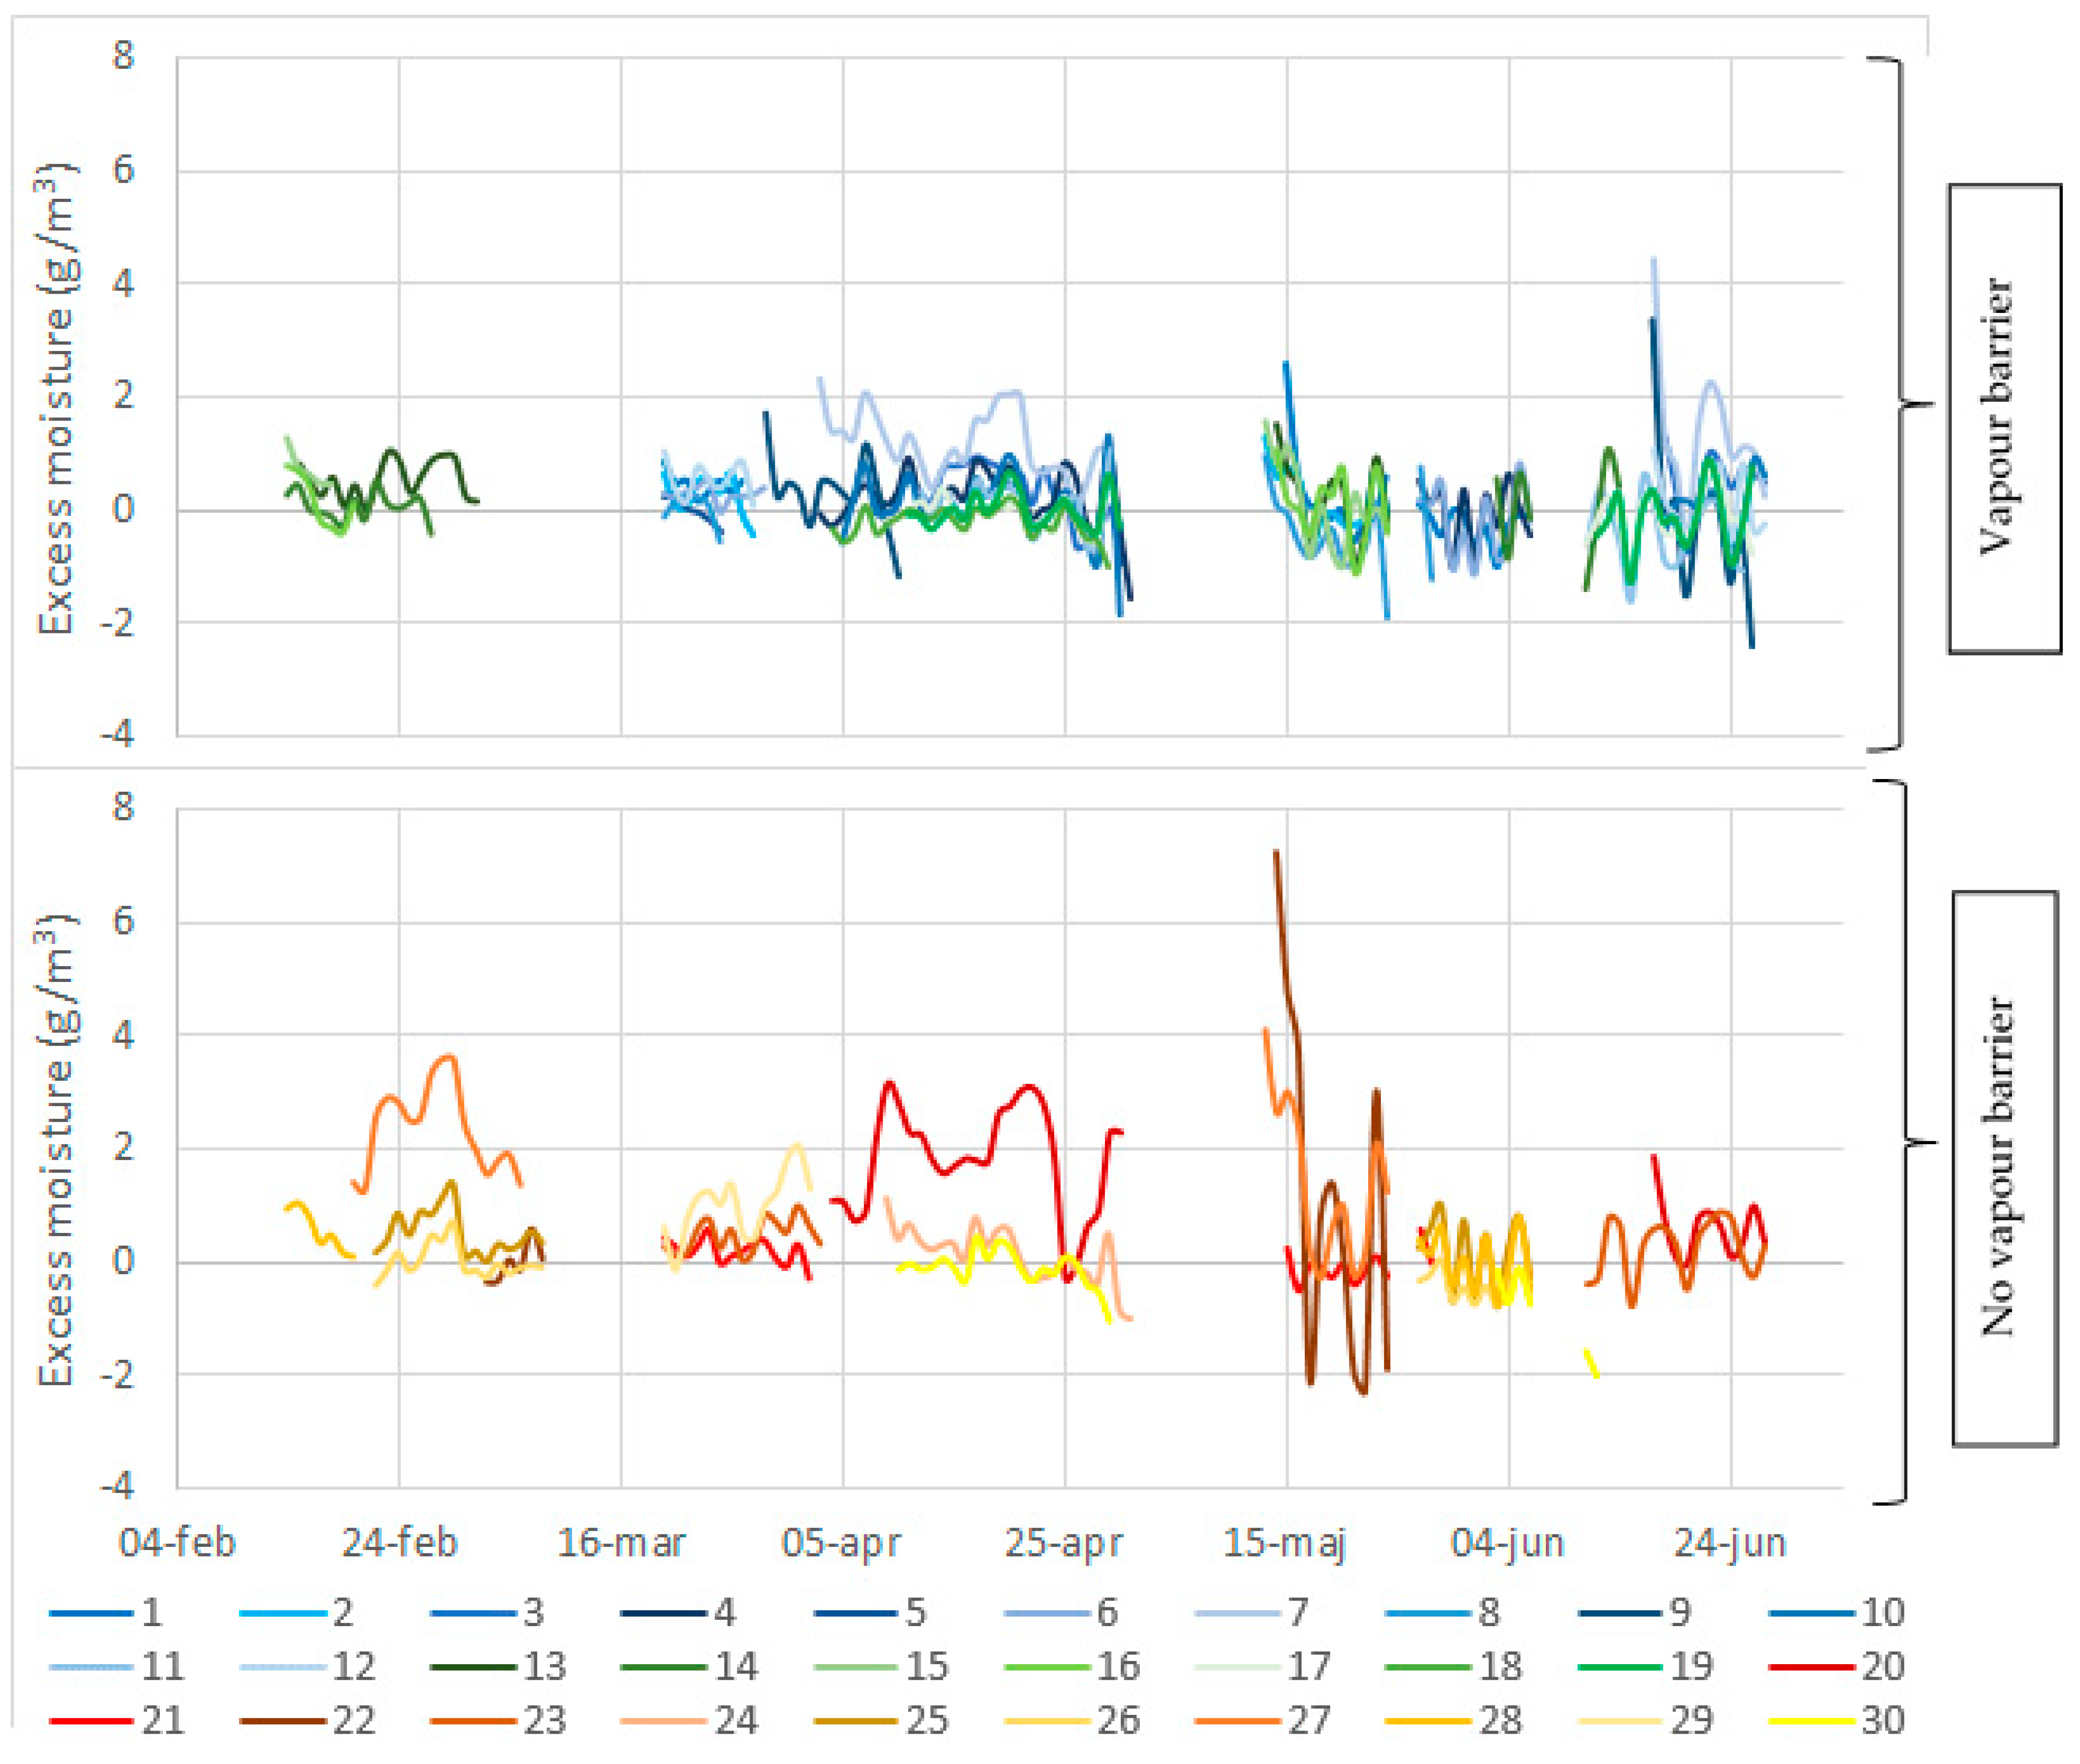
To study the course of excess moisture in dwellings and attics, respectively, relatively to the outdoor air, the excess moisture was determined as a difference between absolute humidity in a zone and outdoors. Absolute humidity is generated from temperature and relative humidity measurements These are portrayed in
Figure 9 and
Figure 10. The figures show that there clearly is excess moisture in the dwellings compared to the outdoor conditions in cold seasons, up to 5–6 g/m
3, while the conditions in the dwellings are more similar to outdoor conditions in warmer periods, most likely due to the increased ventilation rates in the dwellings. In the cold attics, there also exists excess moisture in the cold time of year, but less than in dwellings, while the conditions in summer are similar to outdoor air—and dwellings.
Nearly all the attics exhibit daily variation that ranges from positive to negative excess moisture values in relation to outdoor conditions with few exceptions. Attics 20 and 27 exhibit higher absolute humidity than outdoor conditions for nearly the complete winter measurement periods. House 20 is an old rectory, and the residents pointed out problems with moisture and rising damp. House 27 was under renovation, and the resident pointed out missing covings, and expected a leaky ceiling. It is apparent that there is excess moisture from dwellings to attics, as the attics exhibit excess moisture (with fluctuations however) when compared to outdoors—and this is most pronounced in winter.
3.2. Perflourocarbon Tracer (PFT) Gas Measurements
The PFT measurements were implemented to find both the air change rates of the two zones, dwelling and attic space, as well as the air exchange between the two zones.
3.2.1. Air Change Rates
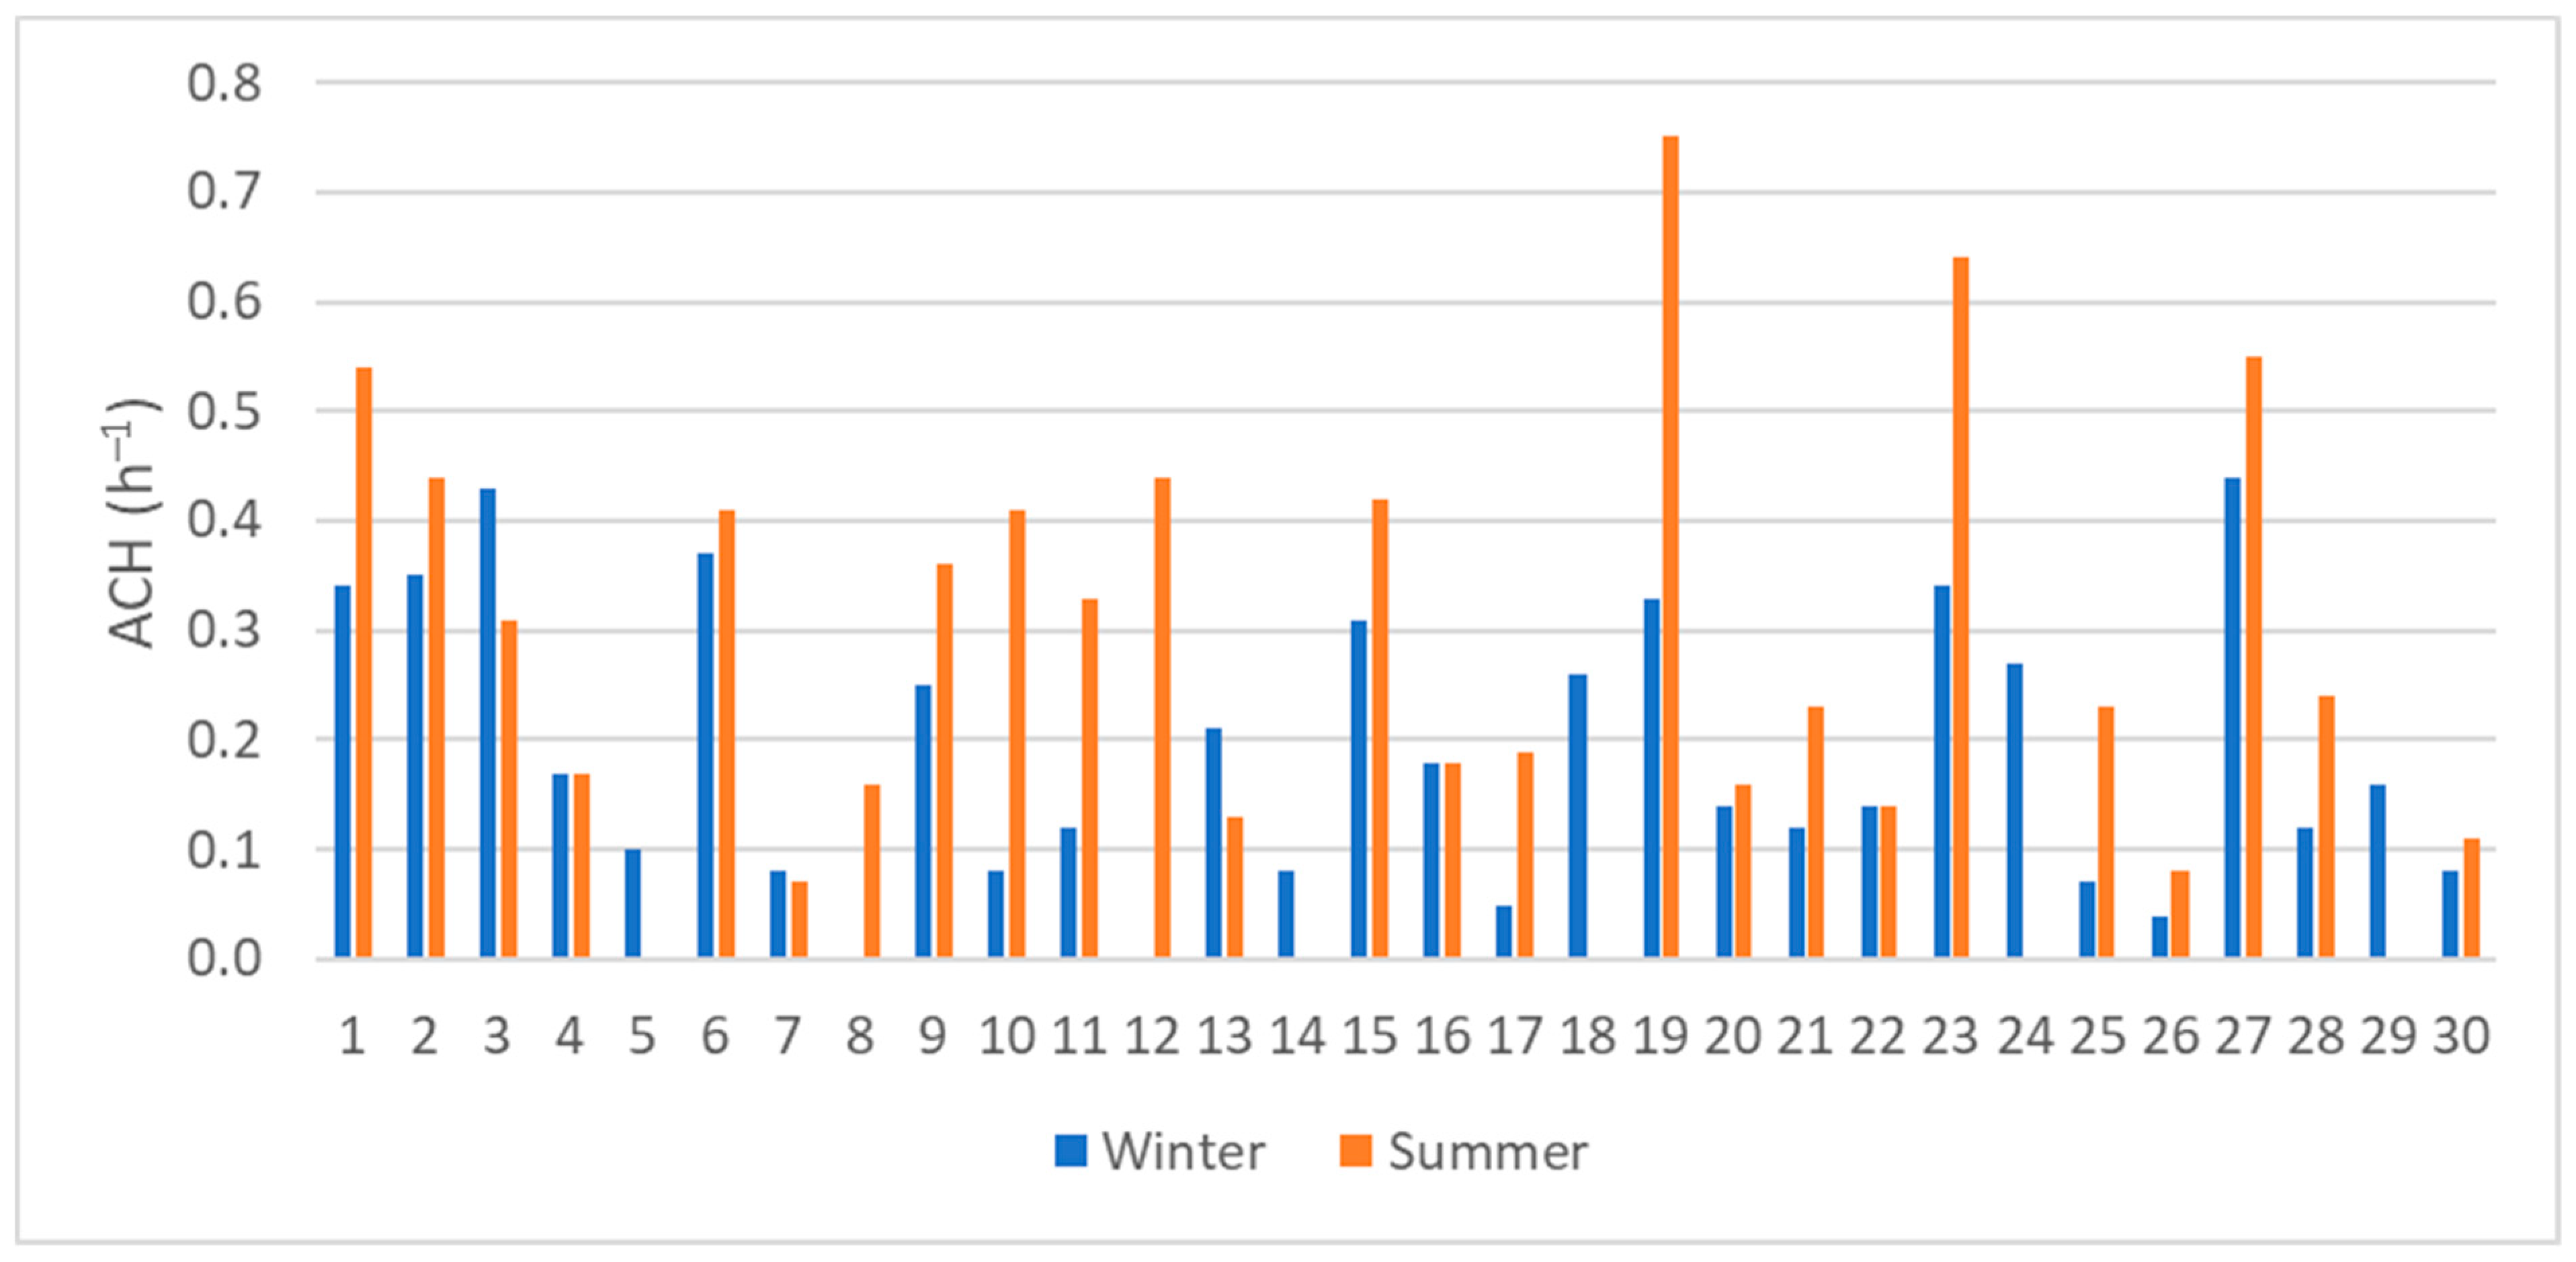
The measured air change rates for all 30 dwellings and attics, for summer and winter, are presented in
Figure 11 and
Figure 12. The general tendency of air change rates in the dwellings are higher in summer when compared to winter. This is a natural phenomenon, as inhabitants have tendencies for more open doors and windows in warm seasons. The average air changes rate for all the houses is 0.20 h
−1 for winter, and 0.31 h
−1 for summer. Three houses (4, 16, 22) have the same air change rate for both seasons, and two houses (3, 13) have a higher air change in the dwelling in the winter. From
Figure 11 it can be seen, that the majority of dwellings do not achieve the recommended air change rate of 0.5 h
−1 by the Danish building regulations [
31]. Only four houses (1, 19, 23, 27) reached the recommended level of air change rate, and only in summer measurements. In 2012, Dimitroulopoulou gathered a review of measurements of ACH (air changes per hour) in dwellings from various European studies [
32]. A general tendency is seen, that despite a requirement of 0.5 h
−1, a significant number of dwellings exhibit lower air change rates in Denmark. Similar results have been found in other northern countries despite similar regulations, e.g., Finland, Norway, Sweden and U.K. [
32].
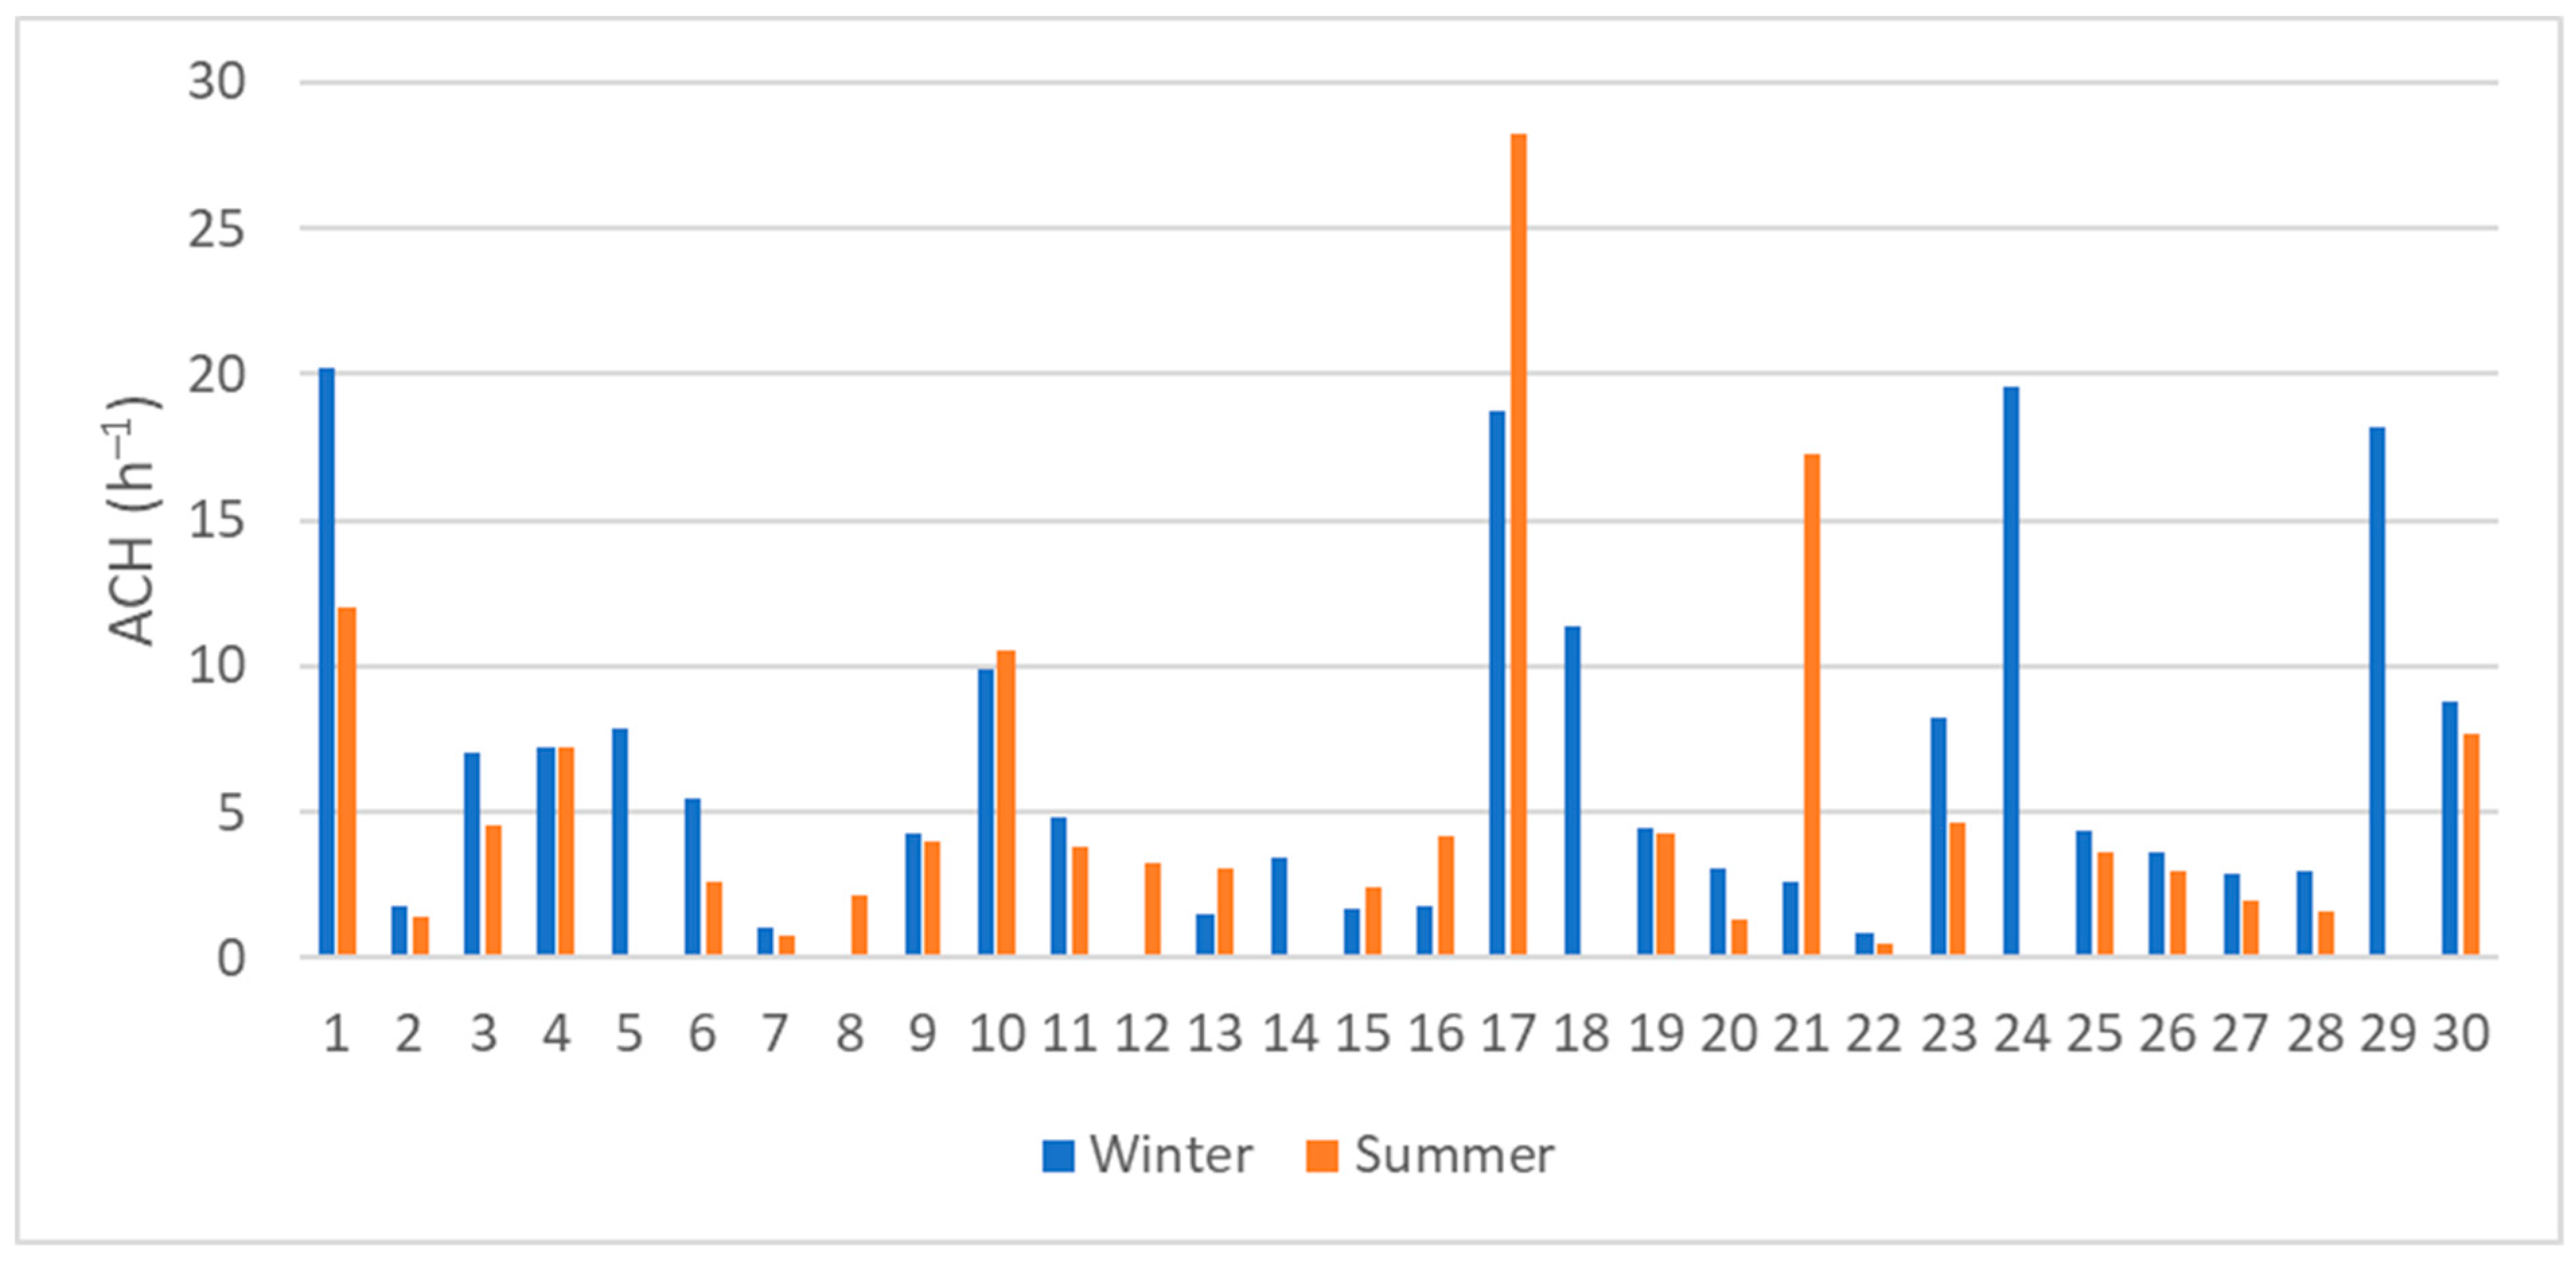
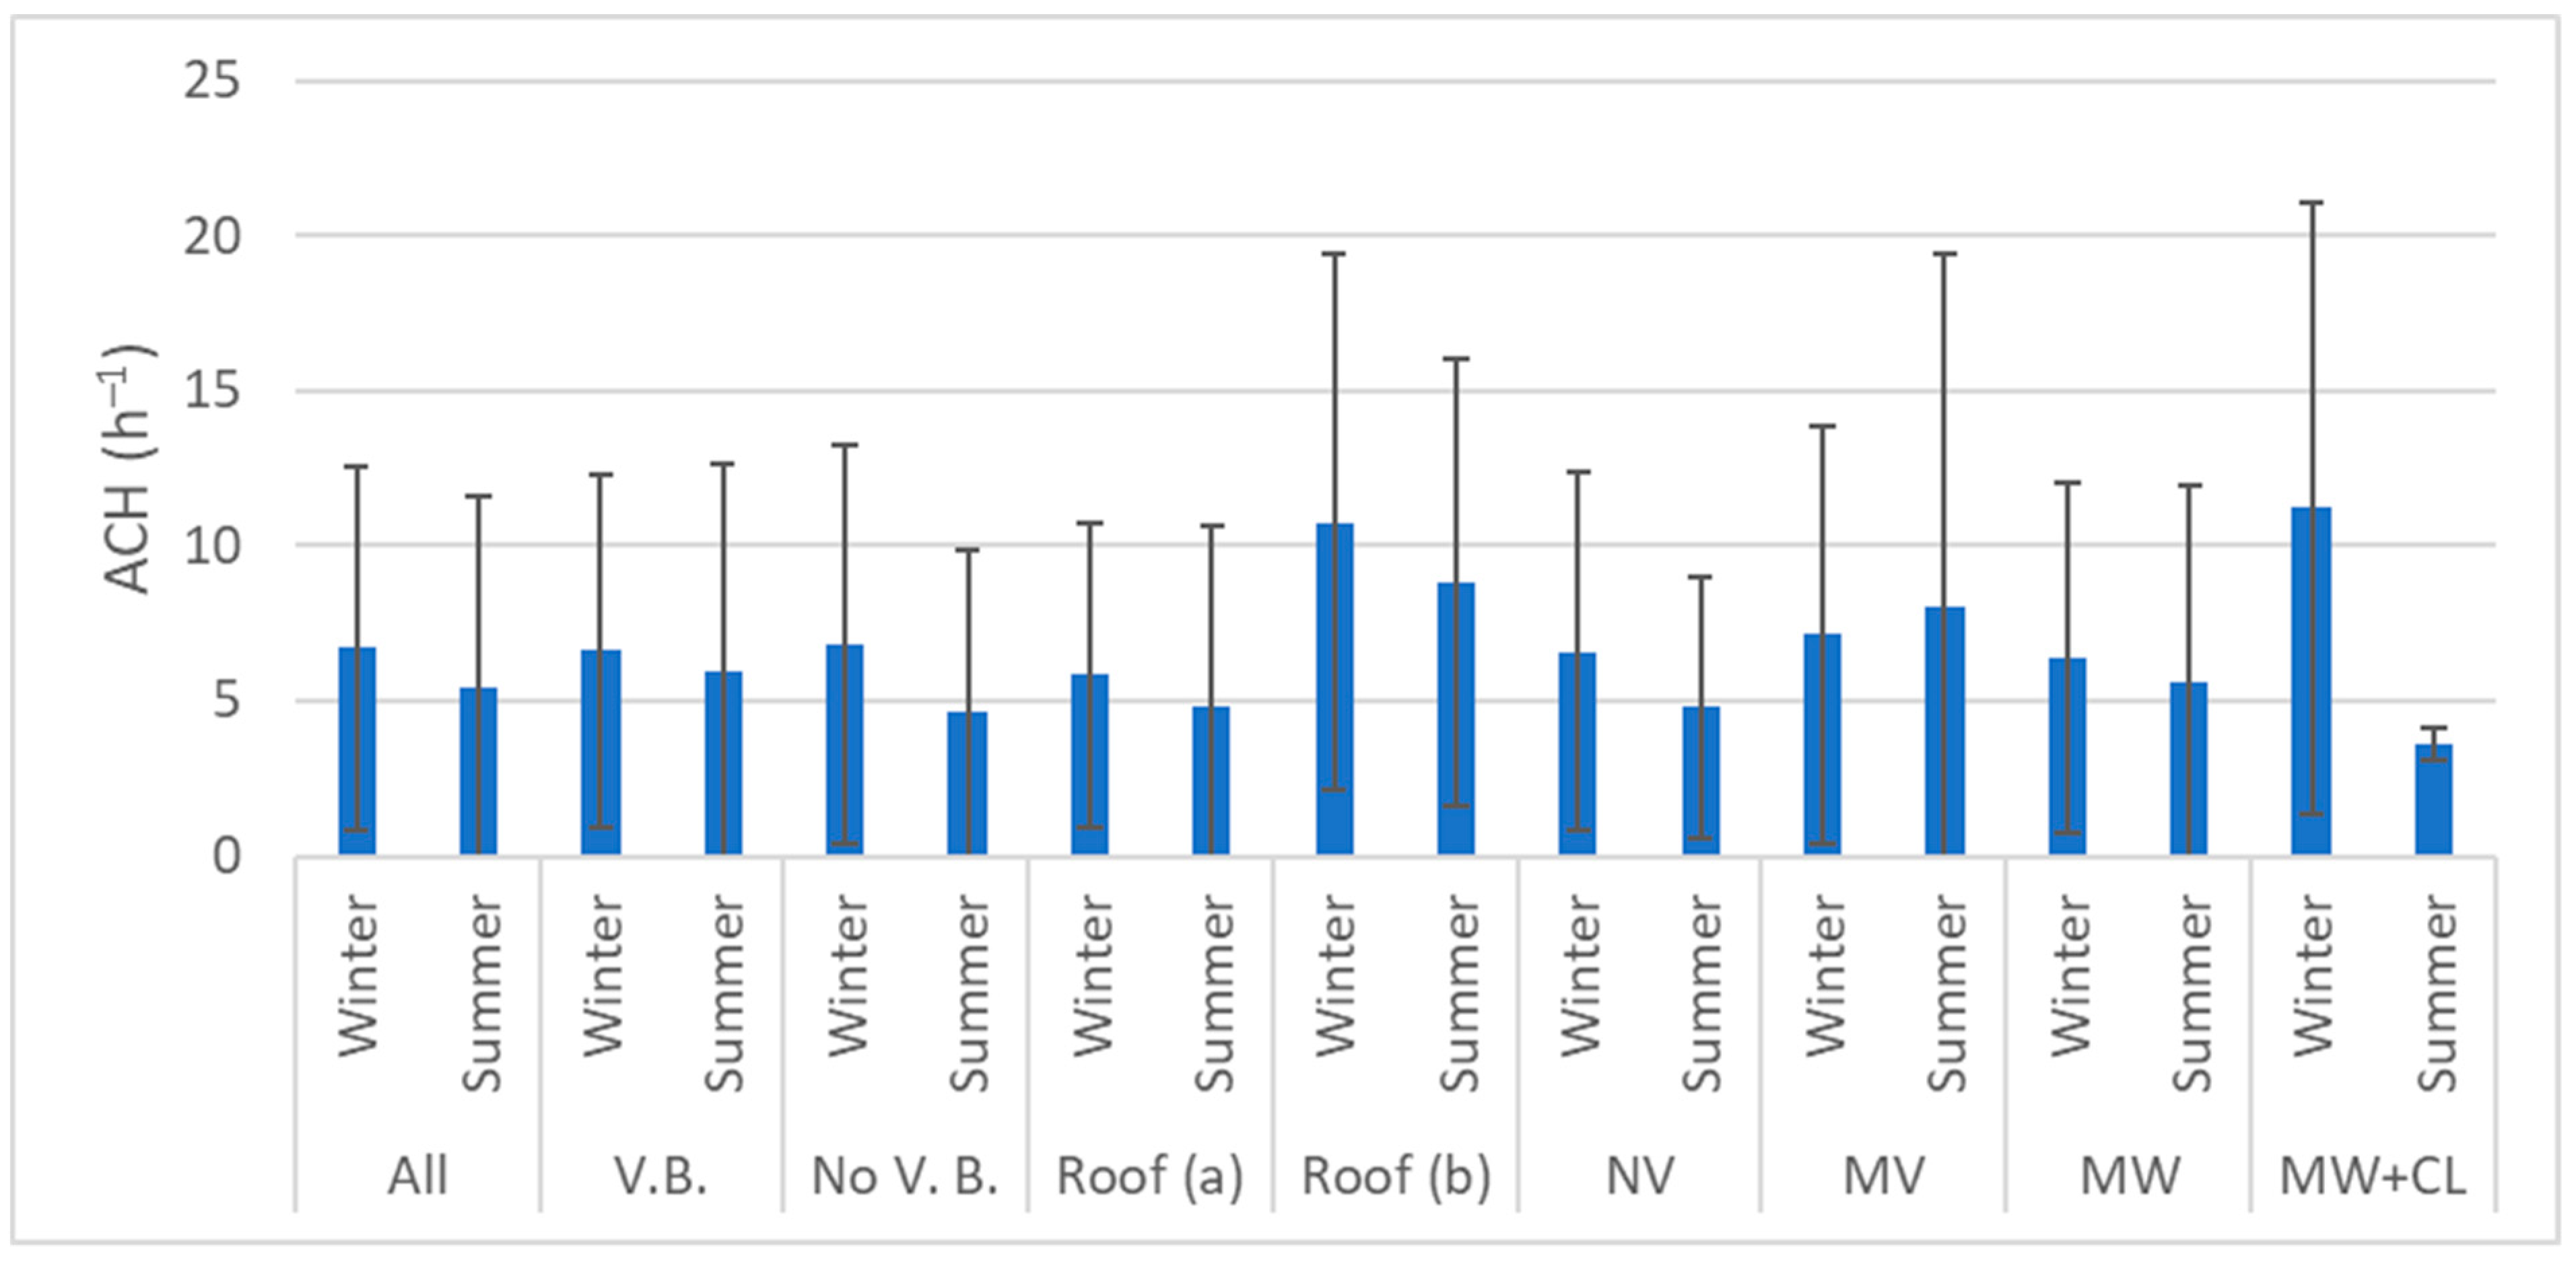
The air change rates measured in the cold attics vary significantly between the cases, and measurement periods, as seen in
Figure 12. The air change rate in the attic is highly dependent on the outdoor conditions, including wind velocity and orientation. A similar study of air change rates in cold attics also showed a large variety—up to factor 10 in the same attic, depending on the measurement time [
33]. The average air change rates in the attics was found to be 6.7 h
−1 in cold periods, and 5.5 h
−1 in warmer periods, but with large deviations. The lowest air change rates were found to be 0.9 h
−1 in winter, and 0.5 h
−1 in the summer, whereas the highest air change rates were 20.2 h
−1 in winter, and 28.2 h
−1 in summer. The largest variation within one case was found in house 21, with a variety of factor 6.5.
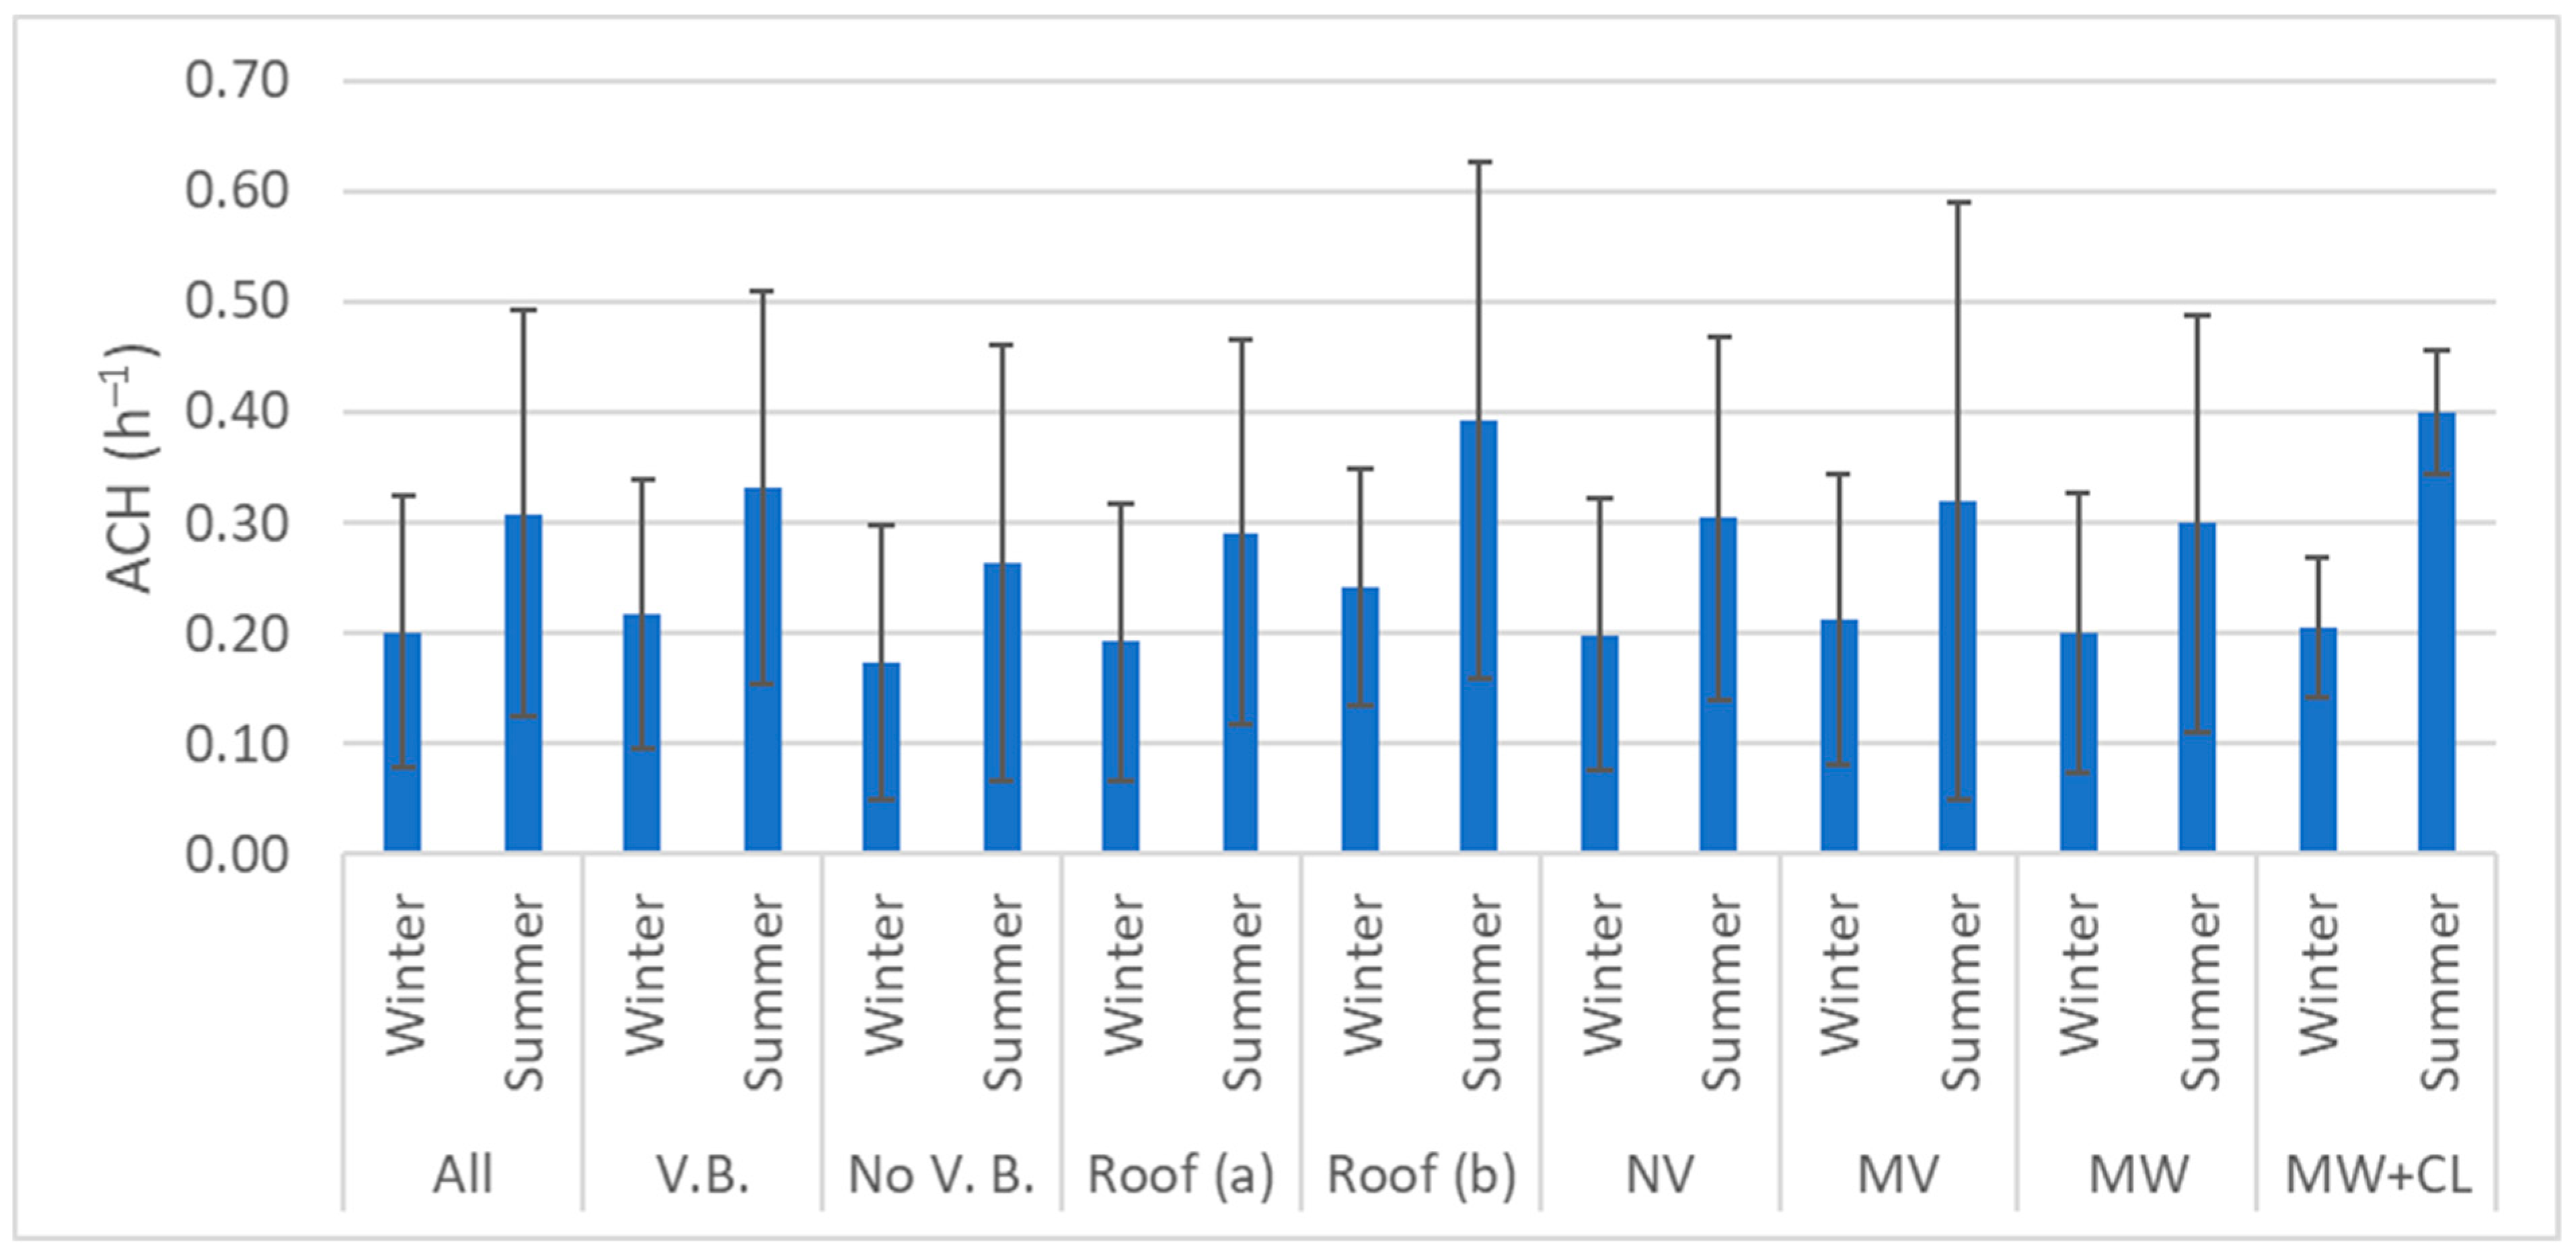
In order to evaluate the effect of the various variables; vapour barrier, roof type, natural/mechanical ventilation and insulation material, average values for each category has been calculated and are depicted in
Figure 13 and
Figure 14. From the average values in the different construction categories in
Figure 13, it can be seen that dwellings with vapour barriers have slightly higher air change rates. This can be due to the fact that these houses are newer, and ventilation conditions were considered in the design process. In cases where vapour barriers were installed in older houses during renovations, the focus may also have been on maintaining sufficient ventilation conditions. Furthermore, it can be seen that roof type (b) exhibits higher ventilation rates, which may be associated with the fact that these buildings are primarily from before the 1950s, and the general airtightness in these buildings is assumed to be lower when compared to new buildings, which is why the dwelling ventilation may be higher.
The average values for the different construction types show, that roof type (b) has higher air change rates when compared to roof type (a). In all cases of roof type (b), the roof is of roof types without underlay. Furthermore, some cases with roof type (b) also had open roof windows, contributing to higher ventilation rates. There are no recommendations as to ventilation rates in these cold attics, but it should be sufficient enough to remove excess moisture.
3.2.2. Air Exchange between Zones
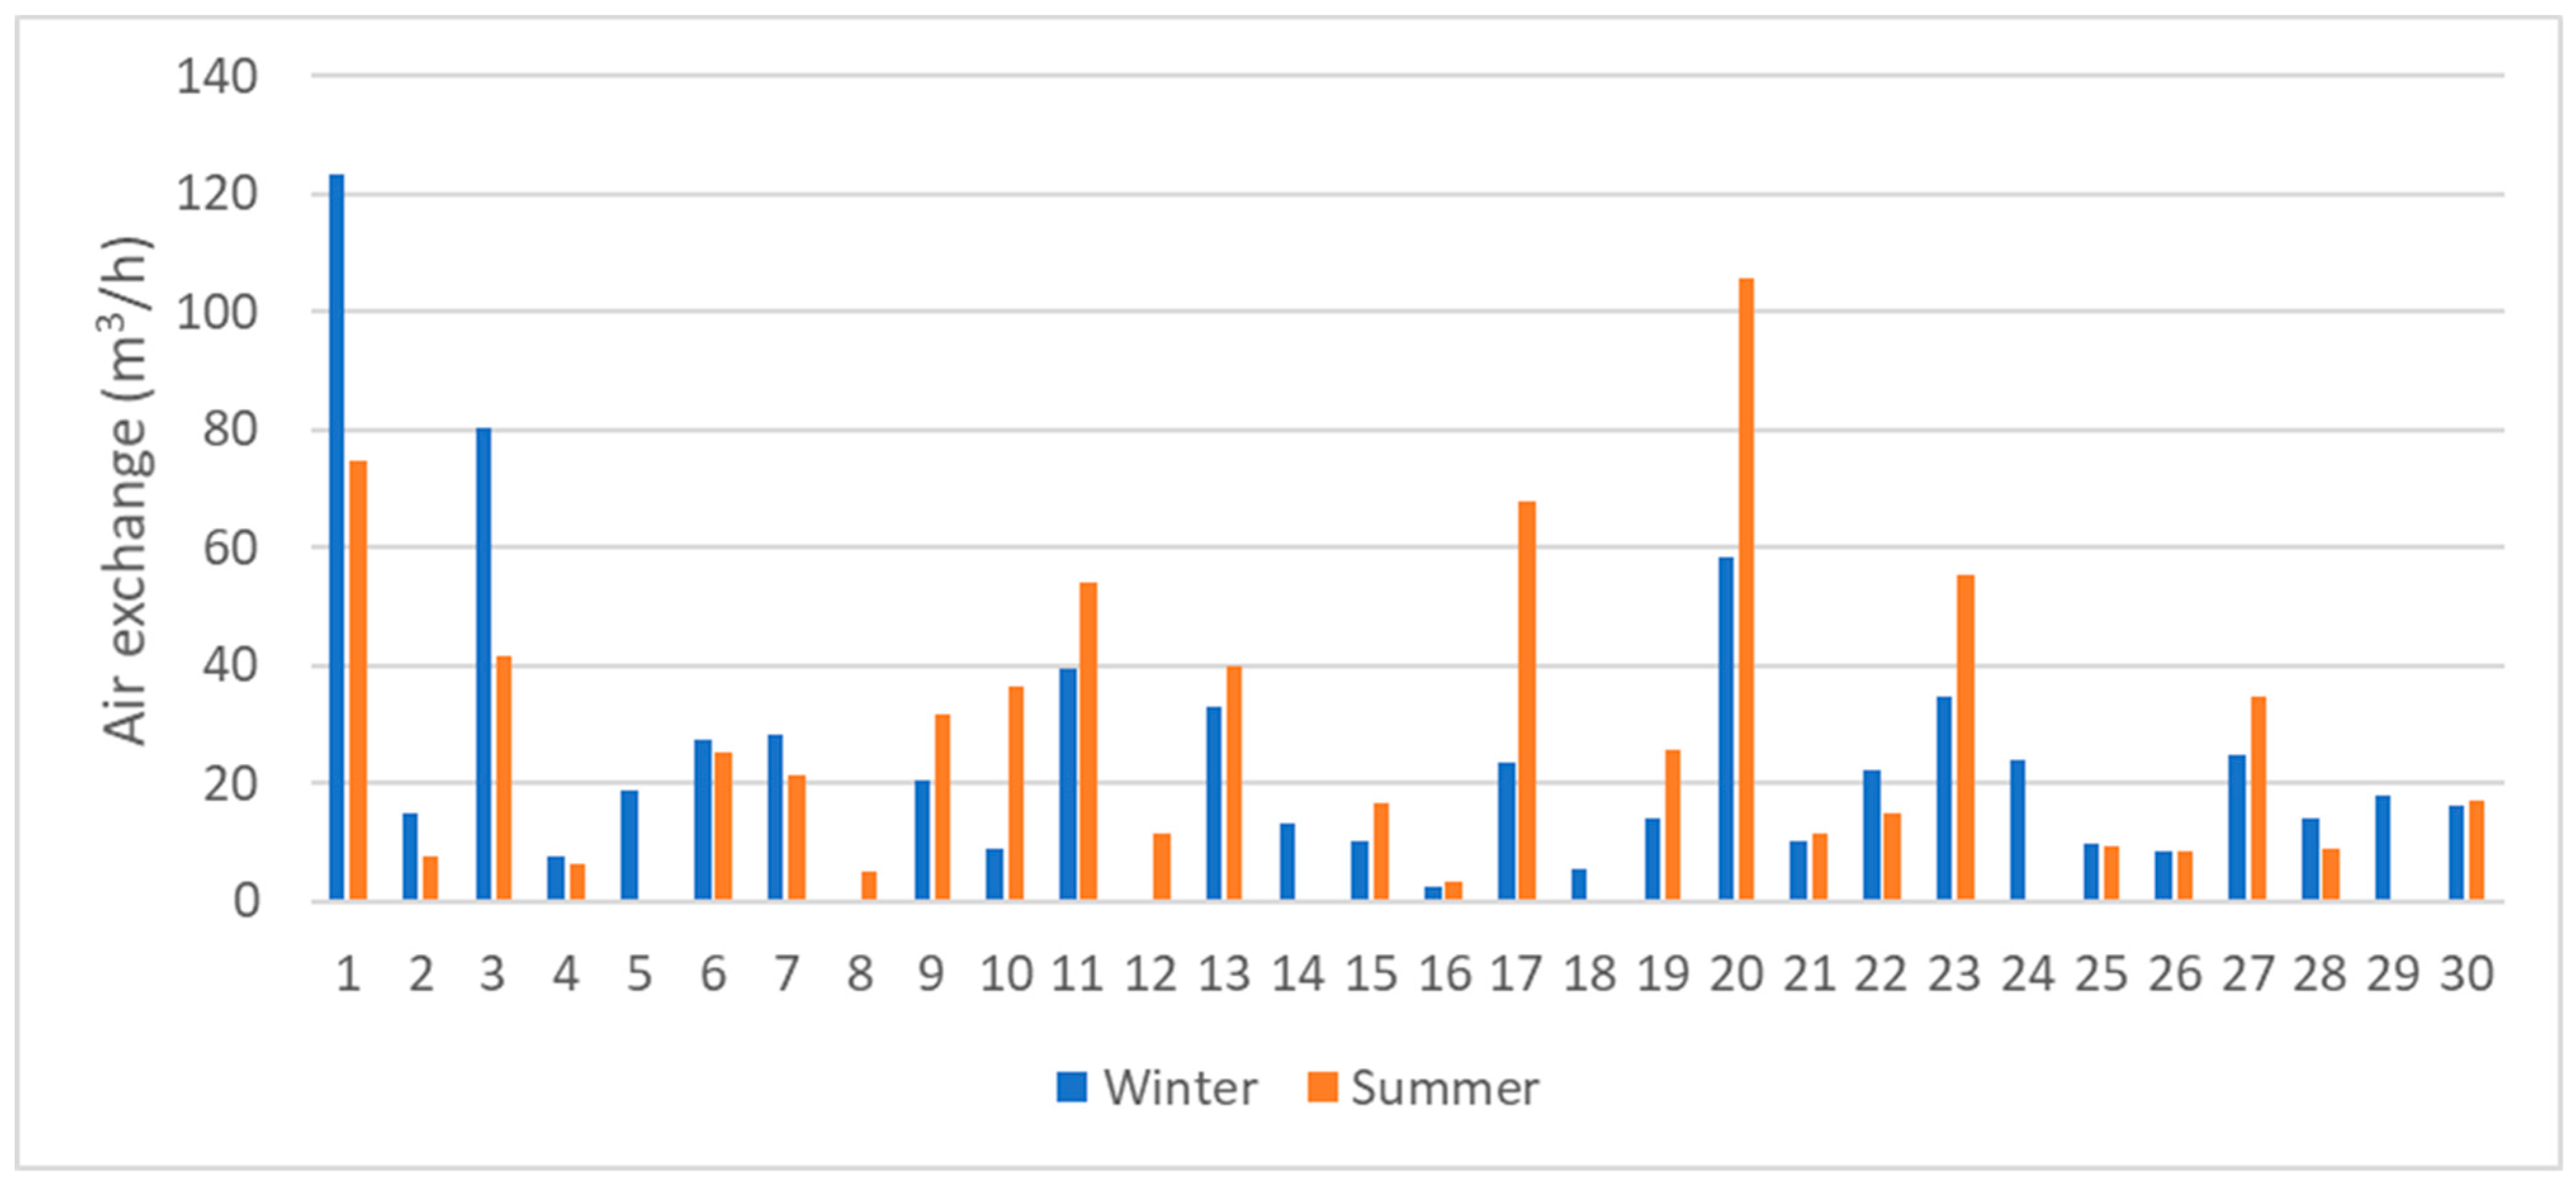
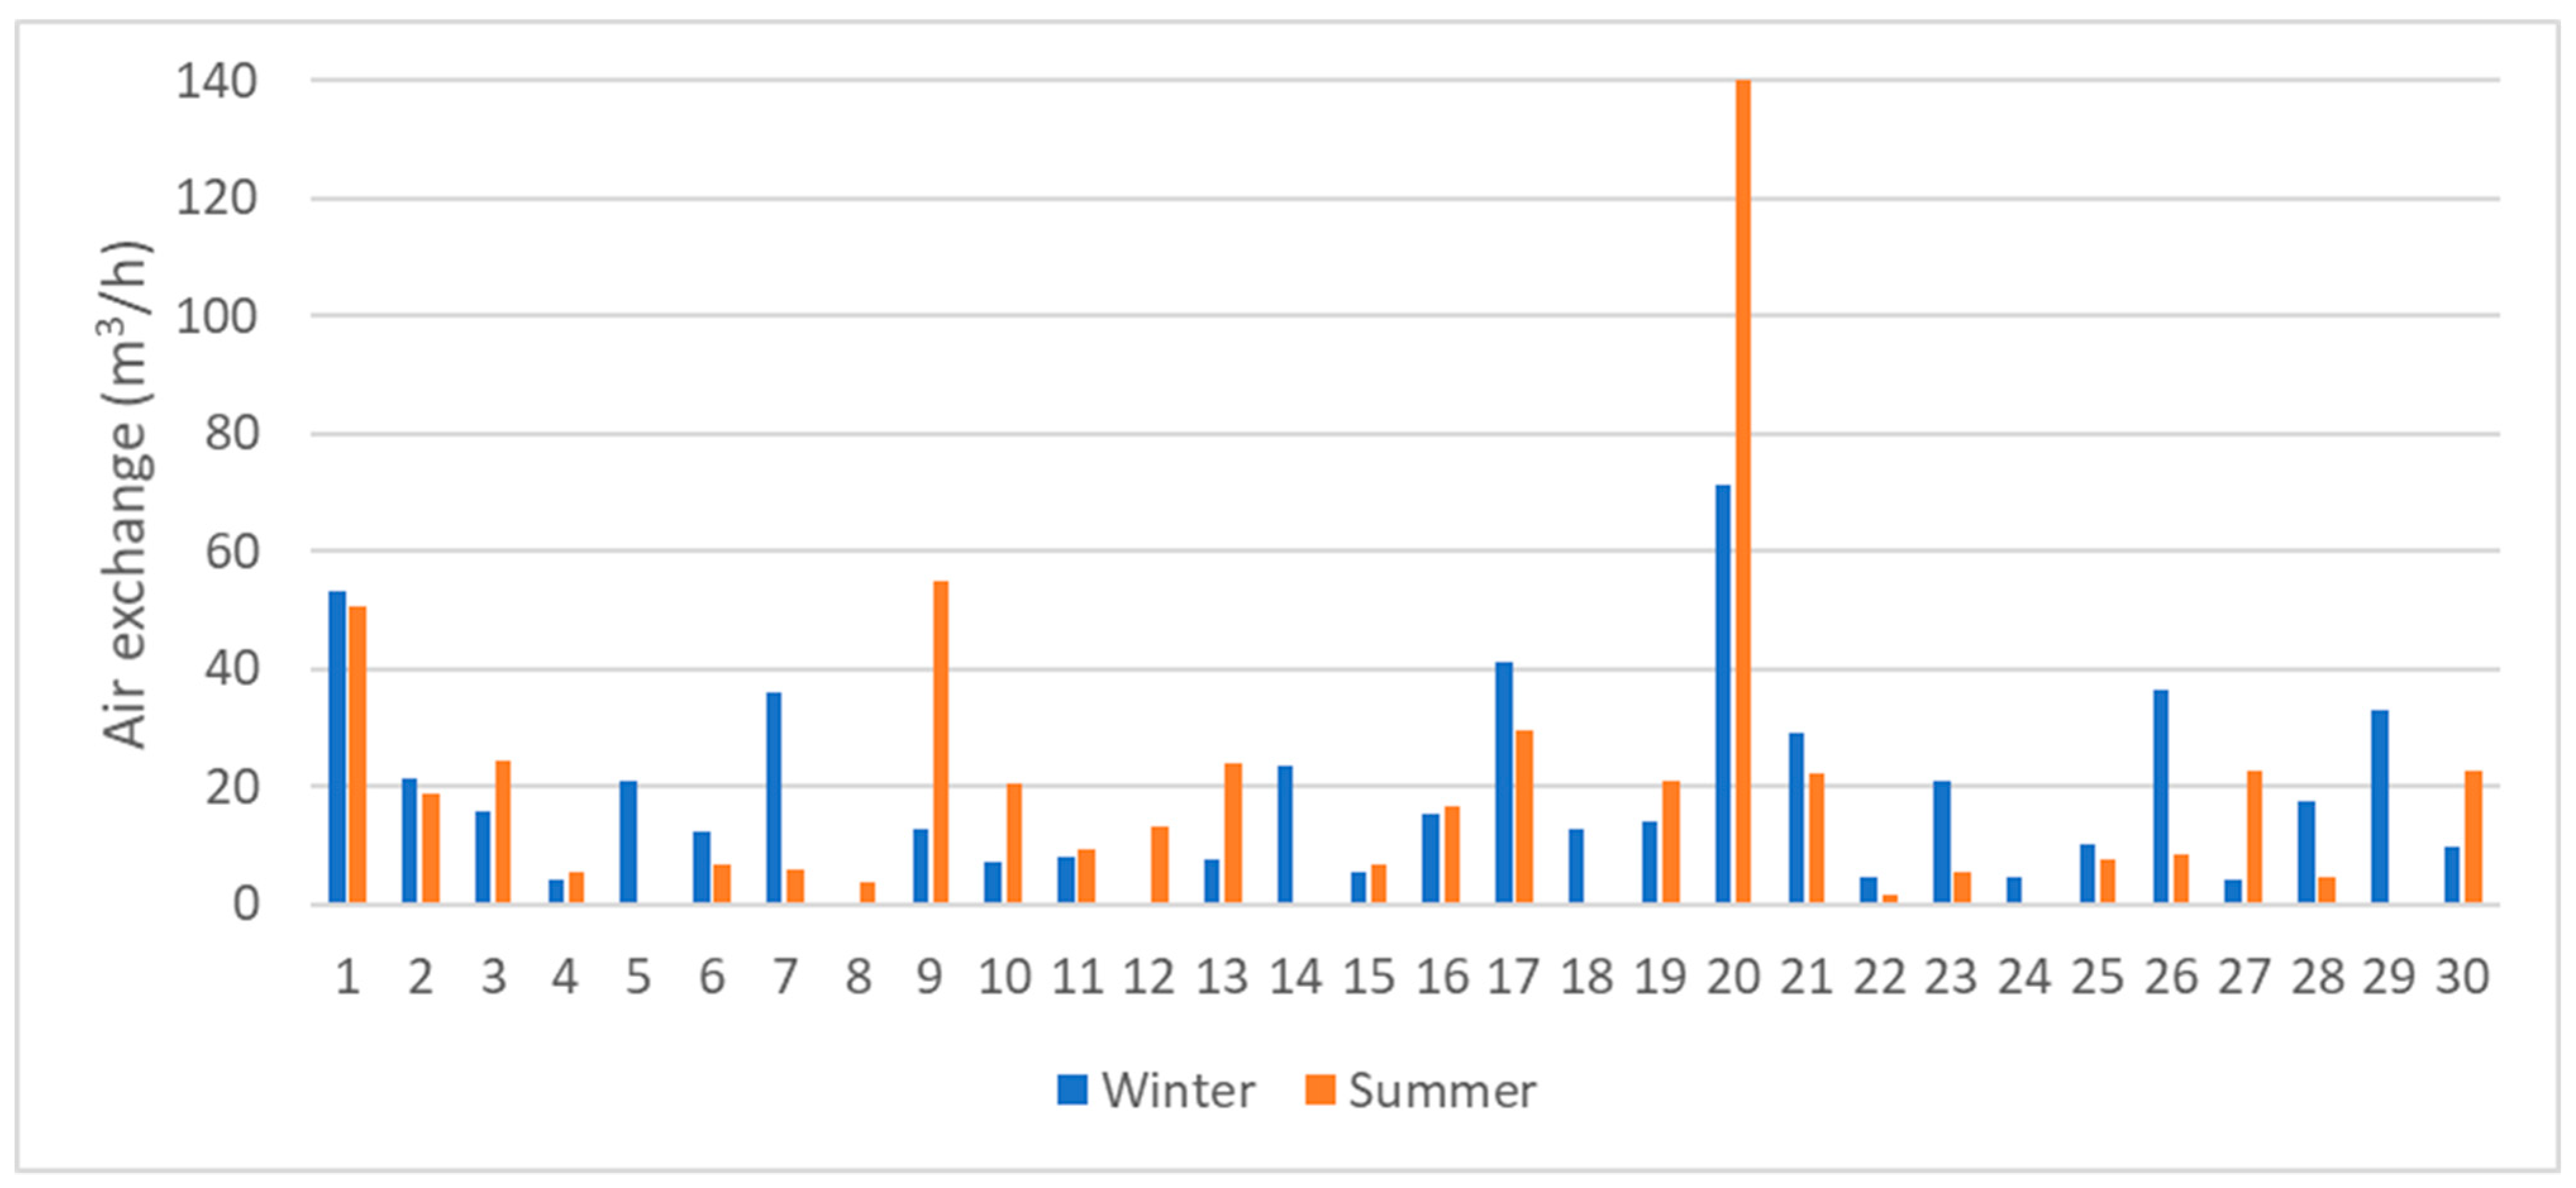
In
Figure 15 and
Figure 16 the average upward and downward air exchange respectively for both measurement periods for all the included houses are presented.
Figure 15 illustrates the upward air exchange from dwelling to attic, whilst
Figure 16 presents the downward air exchange from attic to dwelling. The figures clearly indicate, that air exchange to a greater or lesser extent occurs in both directions, and in both seasons for all the houses. Therefore, it can be stated that air exchange between dwelling and attic occurs in both houses with and without a vapour barrier, and there are no clear indications or reduced air exchange in houses with a vapour barrier in the ceiling. This can partly be attributed the fact that the condition of these vapour barriers is mostly unknown. By considering newer houses erected after 2000, namely houses 15–19, all with vapour barriers with conditions assumed to be tight due to the low age, relatively low air exchange is observed, however not significantly lower than older buildings, or buildings without vapour barriers. Average values for the air exchange suggest higher upward air exchange in winter periods. The average values also suggest higher downward air exchange in summer. However, considering the individual houses, those observations appear invalid; For winter periods, measurements show that the upward air exchange dominates in 14 of 28 valid measurements (nine with a vapour barrier, five without a vapour barrier), while the remaining 14 houses (eight with a vapour barrier, six without a vapour barrier) predominantly show higher downward air exchange in winter. For the summer period, with 25 valid measurements, the upward air exchange dominated in 17 houses (12 with a vapour barrier, five without a vapour barrier). Thus, a seasonal dependence of the direction of air exchange cannot be established based on the obtained results.
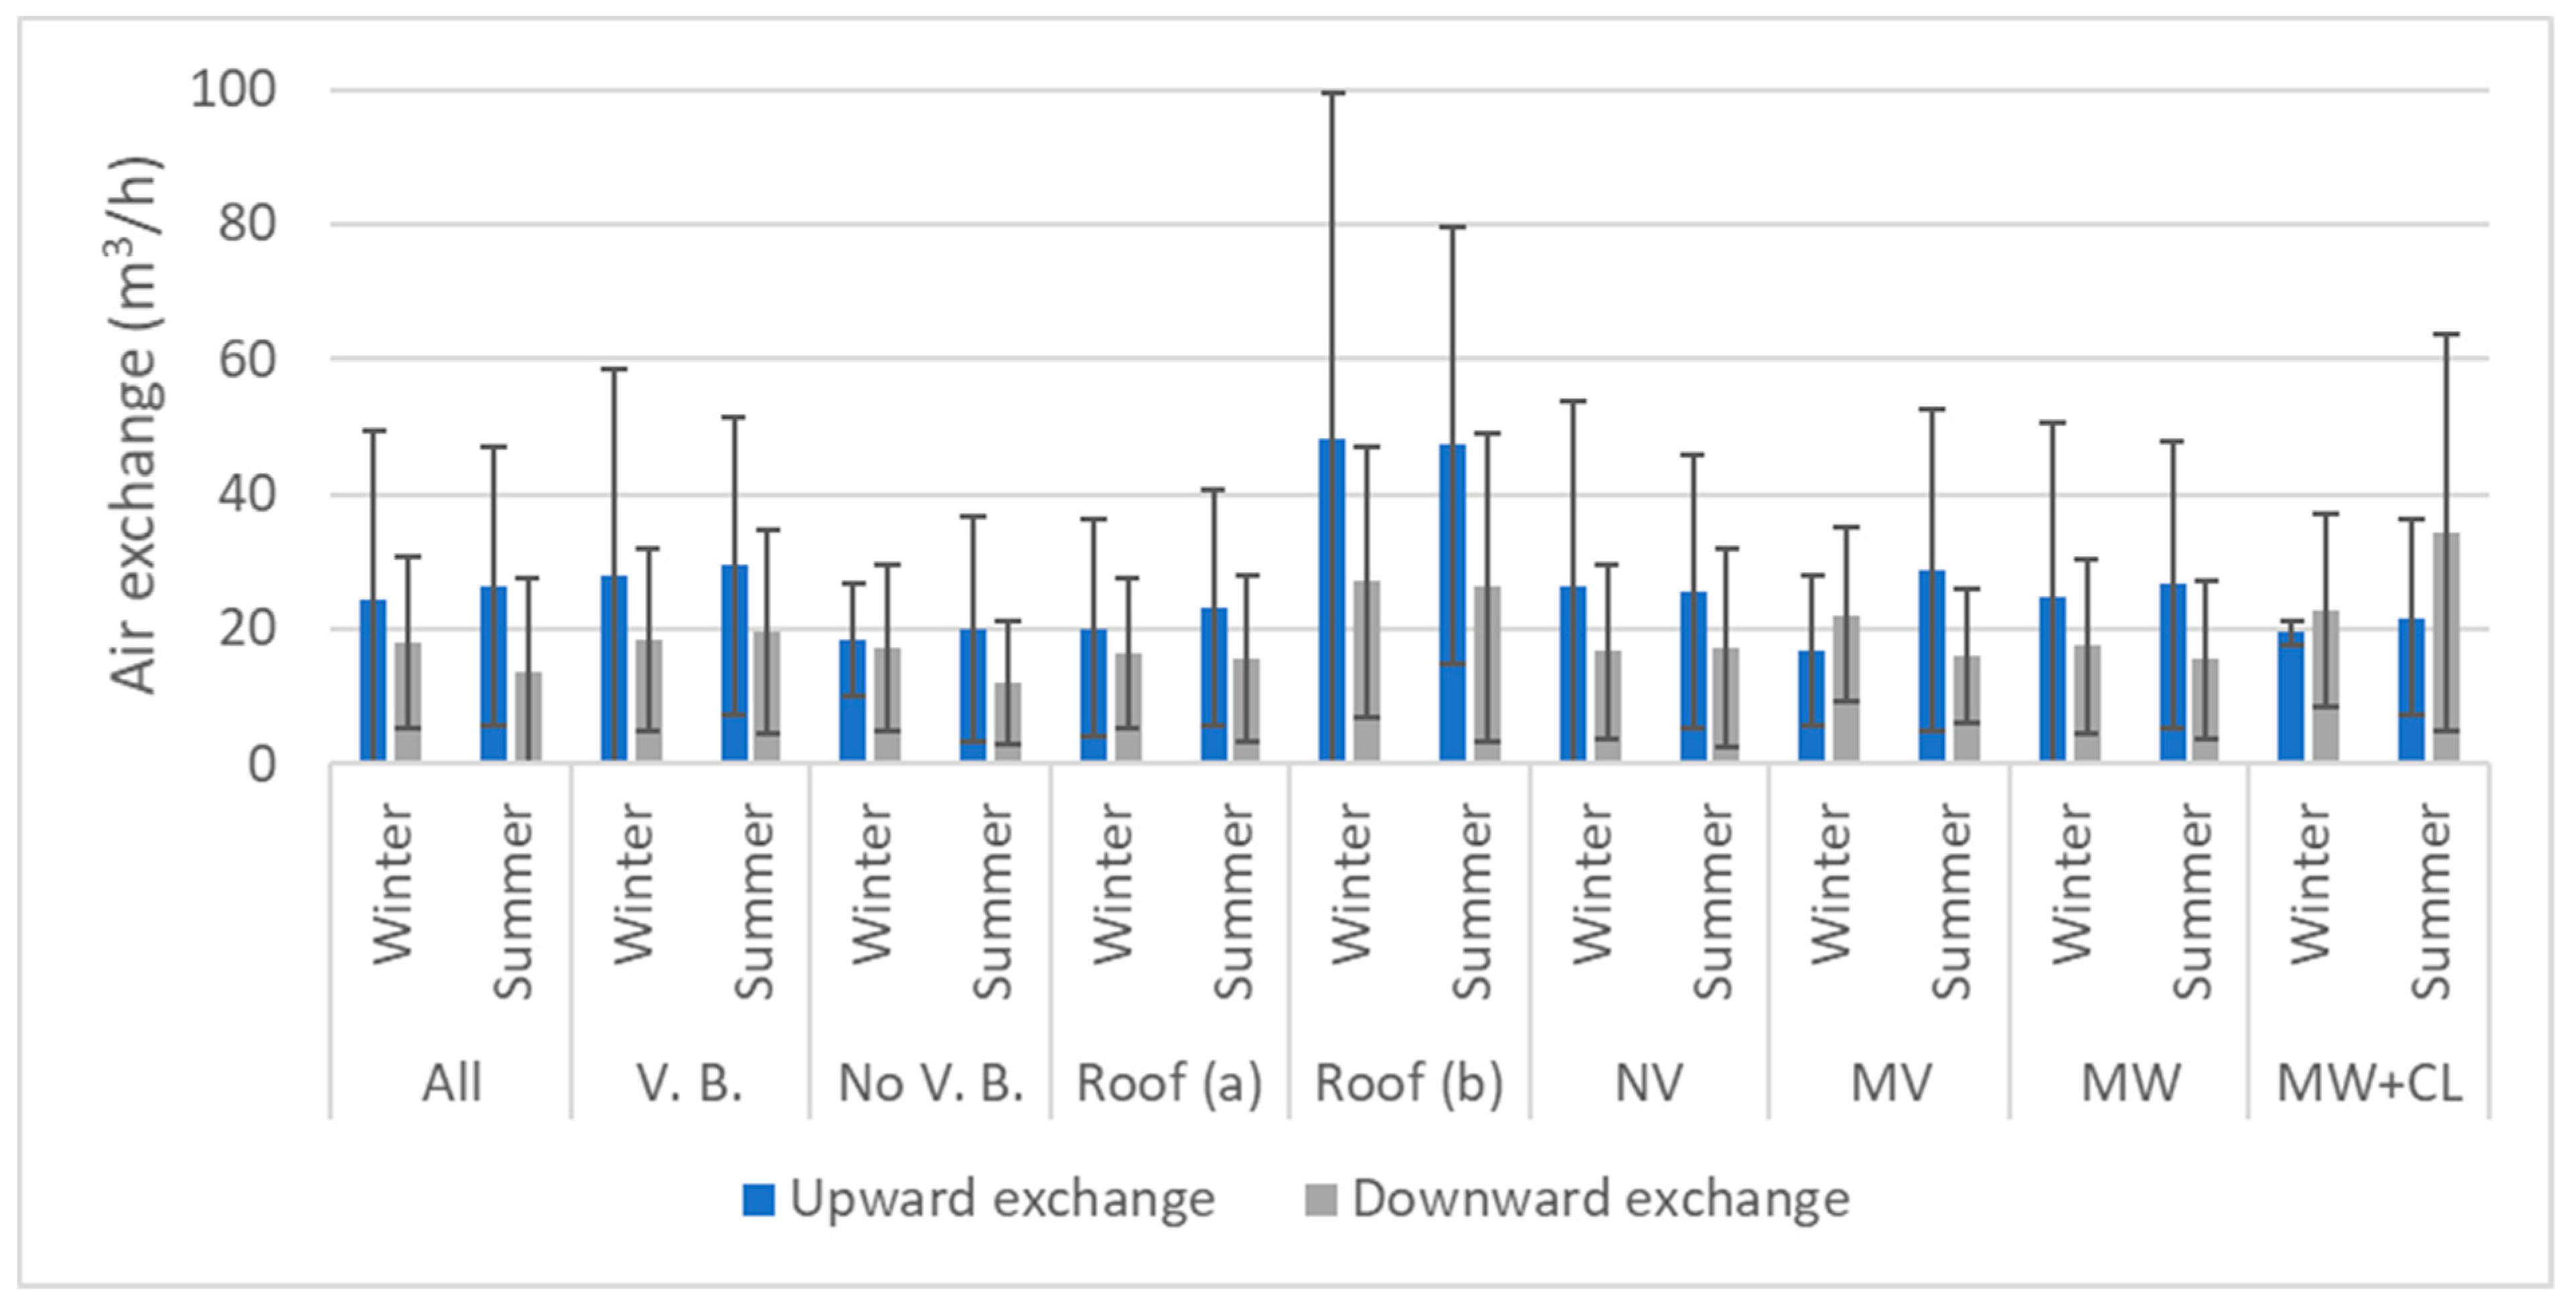
The average air exchange between dwelling and attic distributed on construction types, can be seen in
Figure 17 for summer and winter. Due to extreme measurements of air exchange from house 20, this has been removed from further analysis. In the figure, it can be seen, that for almost all cases, the upward air exchange is higher both winter and summer. The exceptions to this, are the few houses with mechanical ventilation, and the few houses with additional cellulose insulation. The reason for the exceptions may be that there has been focus on the airtightness of the ceiling in connection with postinsulation, or installation of mechanical ventilation. Furthermore, the results show that roof type (b) has significantly larger upward air exchange when compared to roof type (a) as well as the other categories. In this study, this roof type is represented by older houses, constructed in 1943 or before. Prior to the 1950s, vapour barriers were not common in Danish ceiling constructions [
9], and only one of the five cases with roof type (b) includes a vapour barrier. At the same time, there is no significant difference in the air exchange between cases with and without vapour barriers.
3.2.3. Excess Moisture, Air Change Rate and Air Exchange
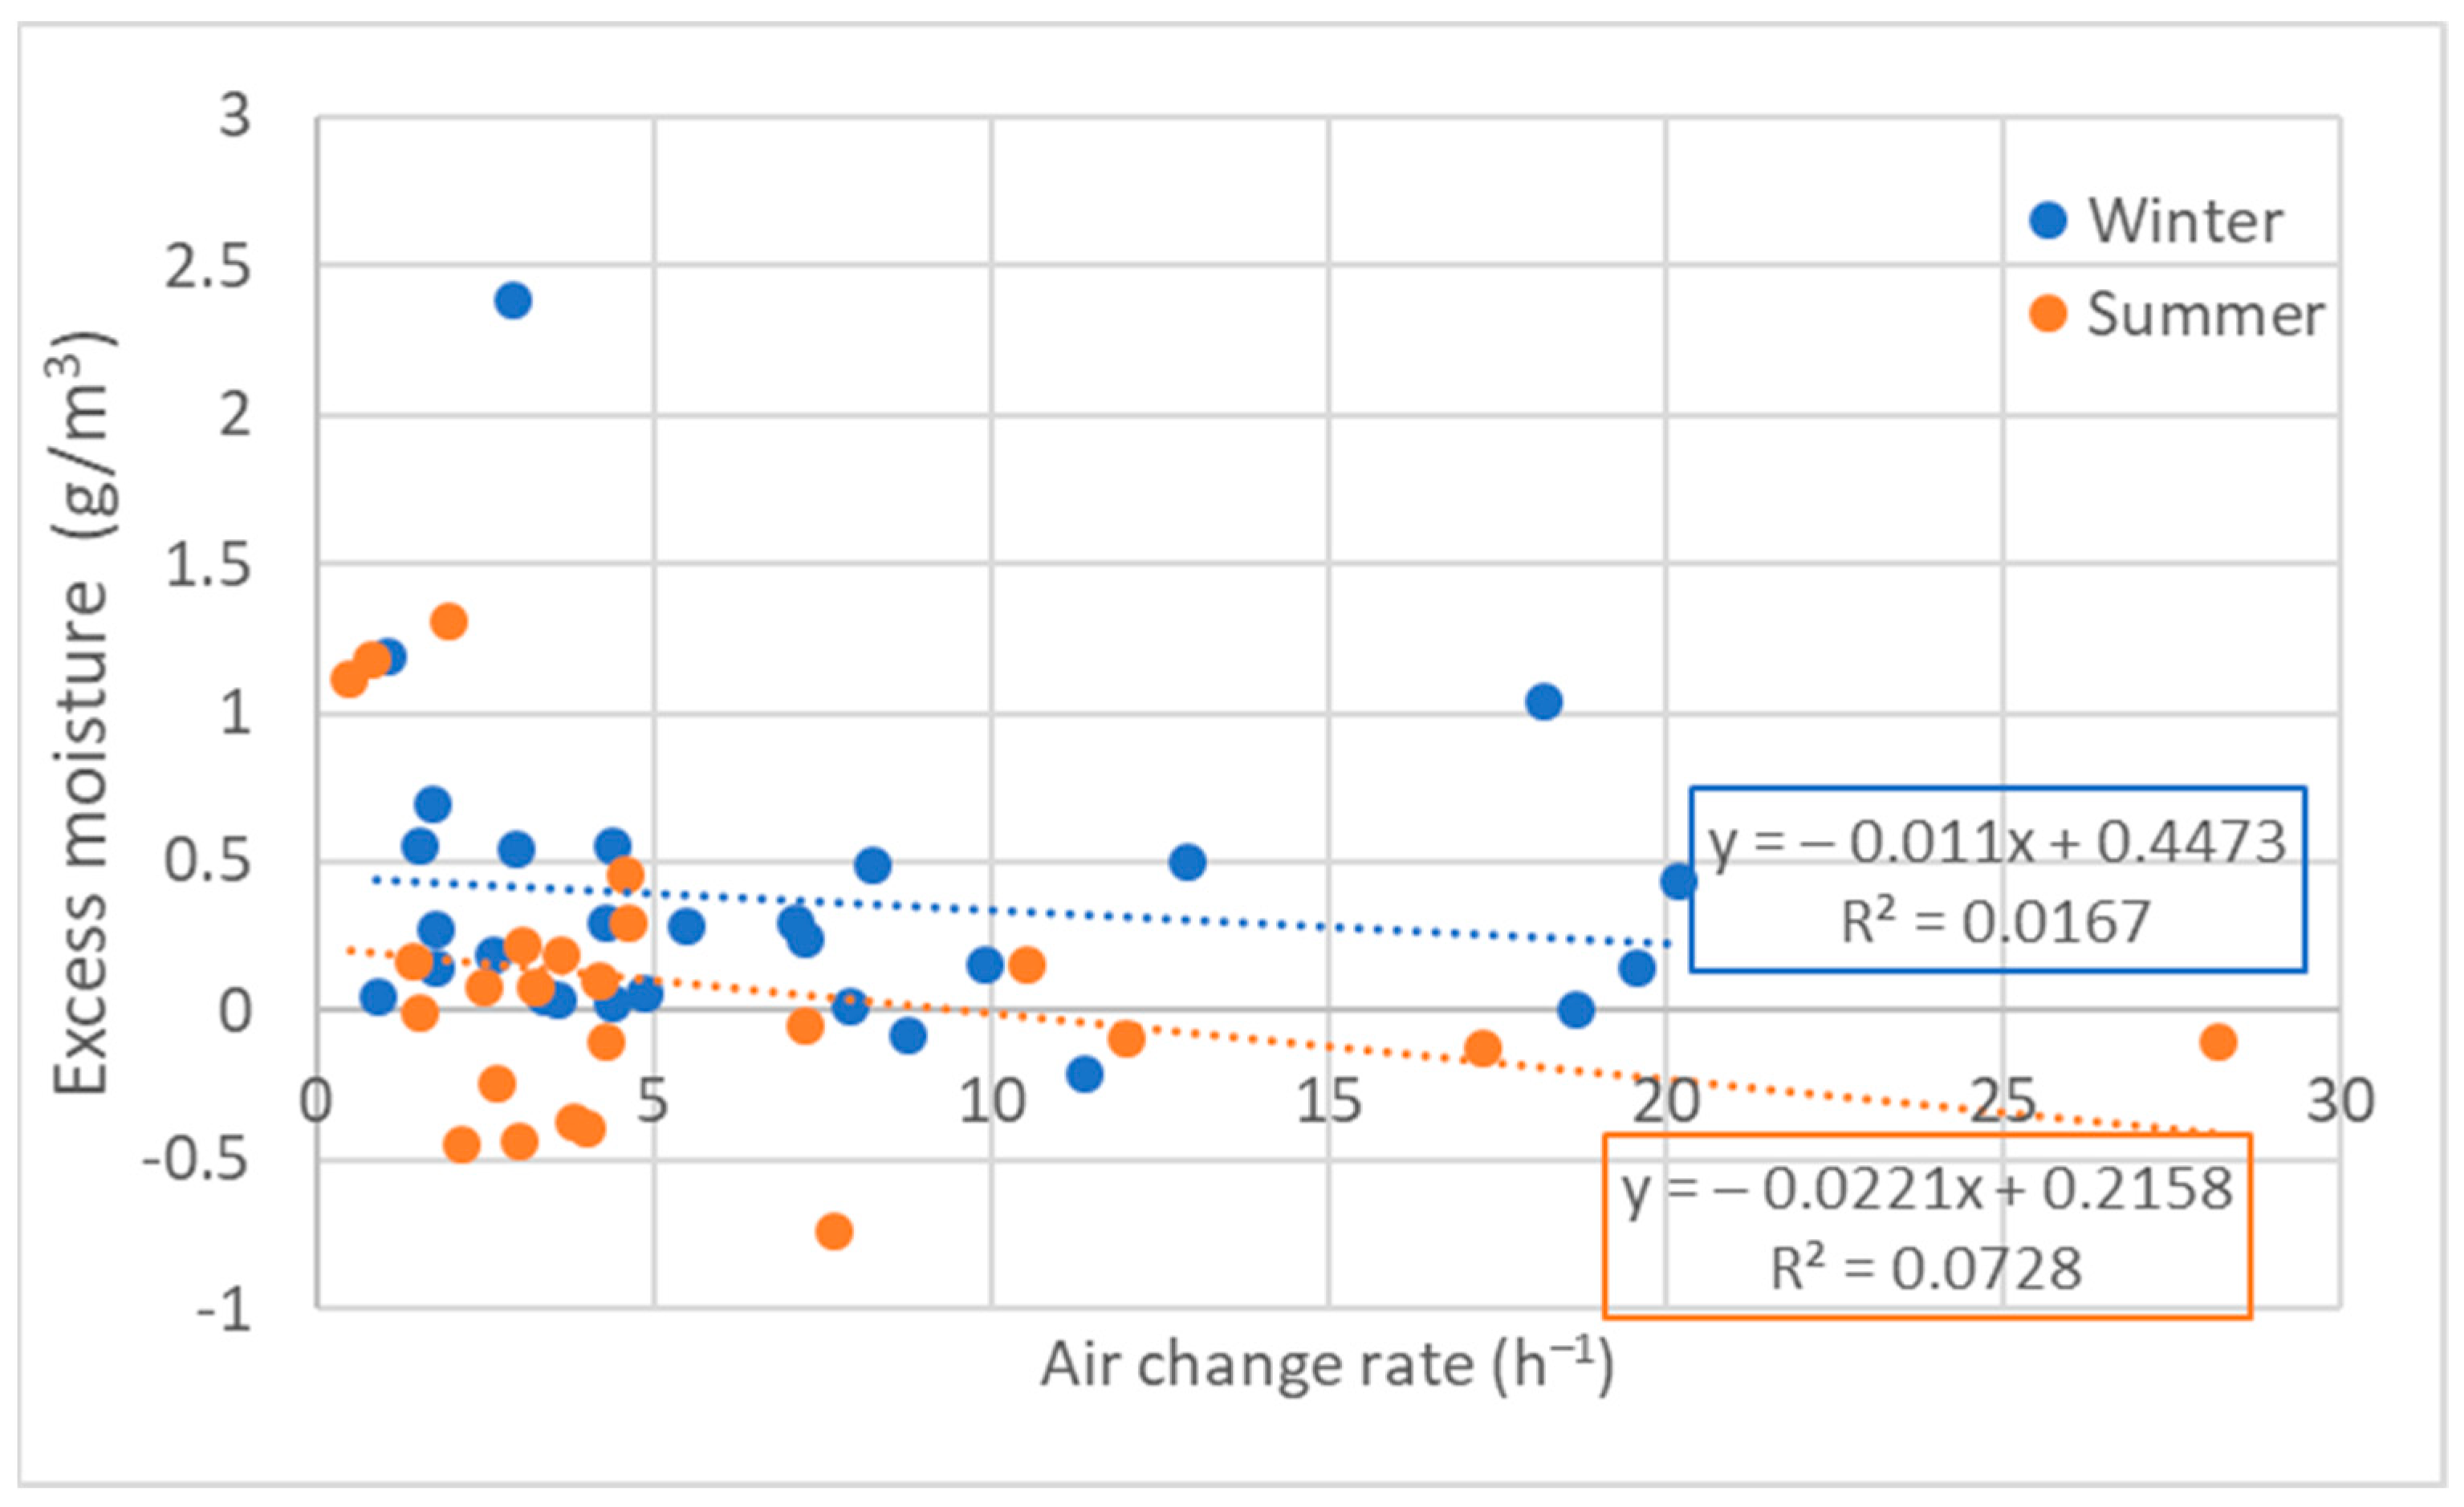
In order to assess the effect if the air change rate in the attic with regards to excess moisture, the average air change rates in attics are plotted against the average excess moisture for the attic in relation to outdoors, found in the same period in
Figure 18. It can be seen, that for both seasons, there is a tendency of reduced excess moisture with larger air change rates, which could be expected; however, the results are a bit scattered.
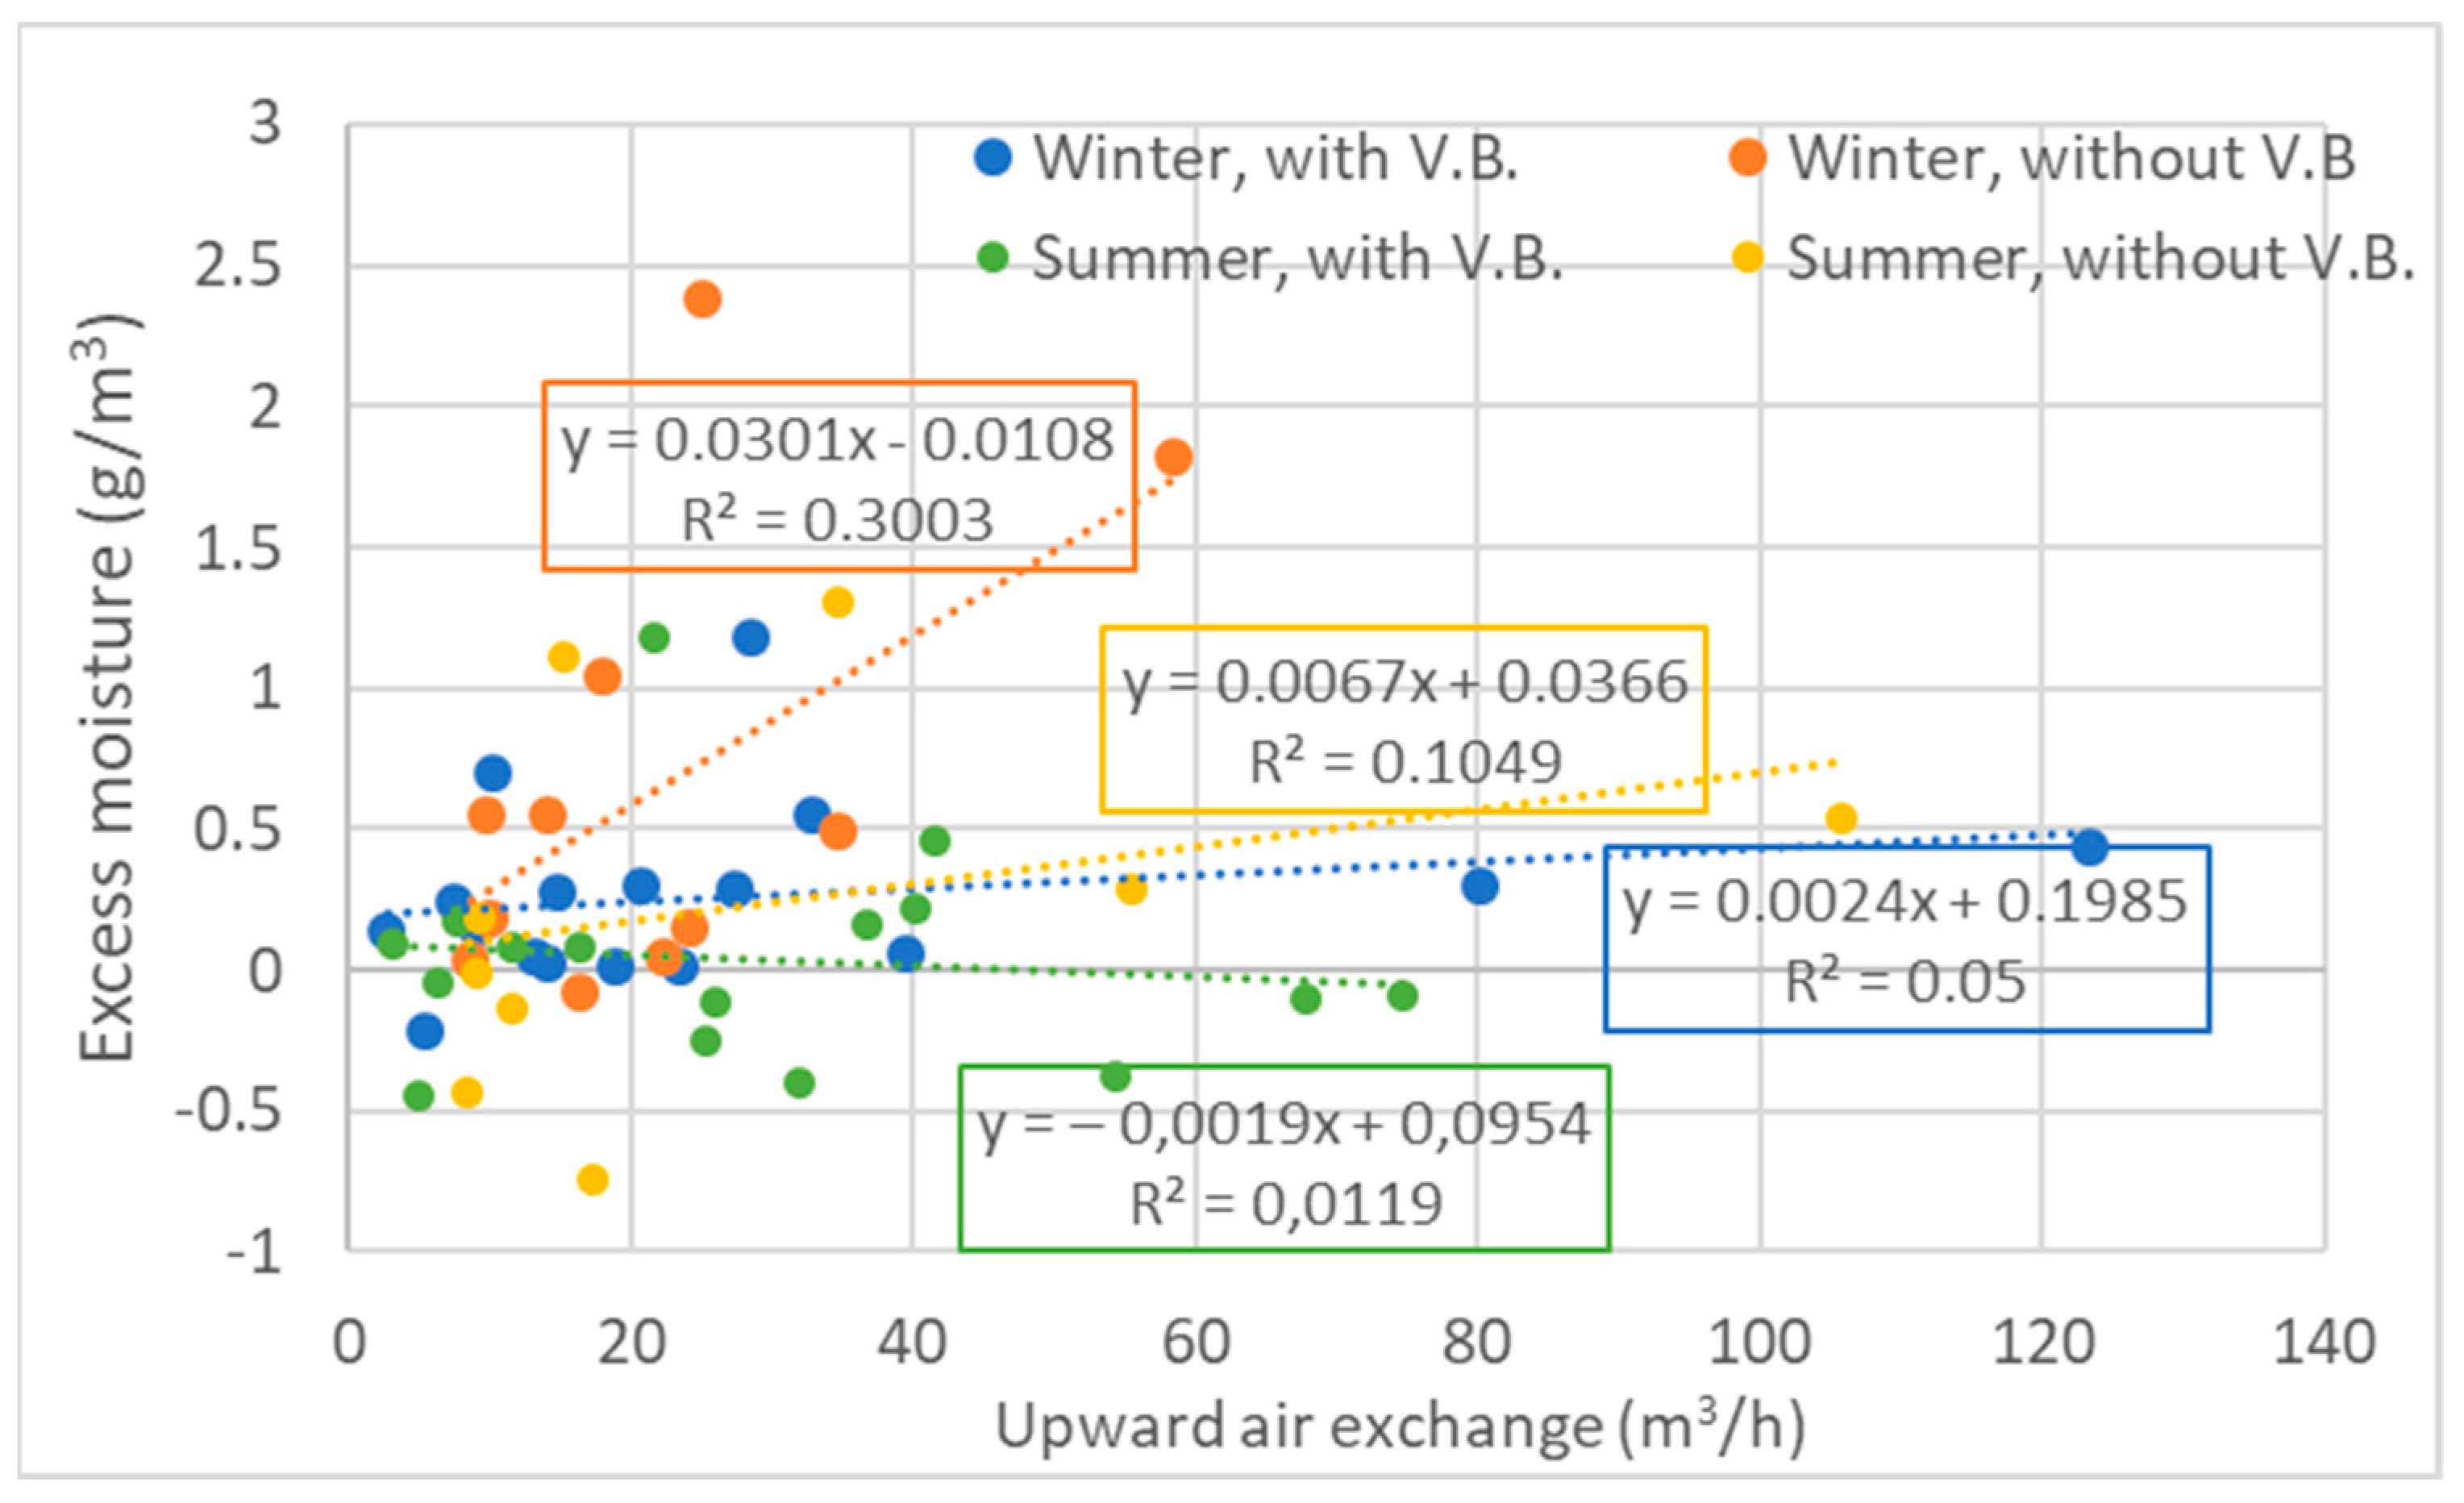
In order to assess to what extent upward air exchange affects the average excess moisture in the attics, for houses both with and without a vapour barrier, the upward air exchange is plotted against the excess moisture in the attic in relation to outdoors, and presented with trendlines in
Figure 19. The trendlines indicate a correlation between the excess moisture and upward air exchange; The excess moisture increases with increasing upward air exchange, with the exception of summer periods in cases with a vapour barrier. The tendency is significantly larger in winter, and in cases without a vapour barrier. For cases with a vapour barrier, there is less influence of the upward air exchange on the excess moisture in the attic. It should be noted however, that the number of measurements was limited, why the tendencies should be regarded as indicative.
3.2.4. Mould Growth in Attics
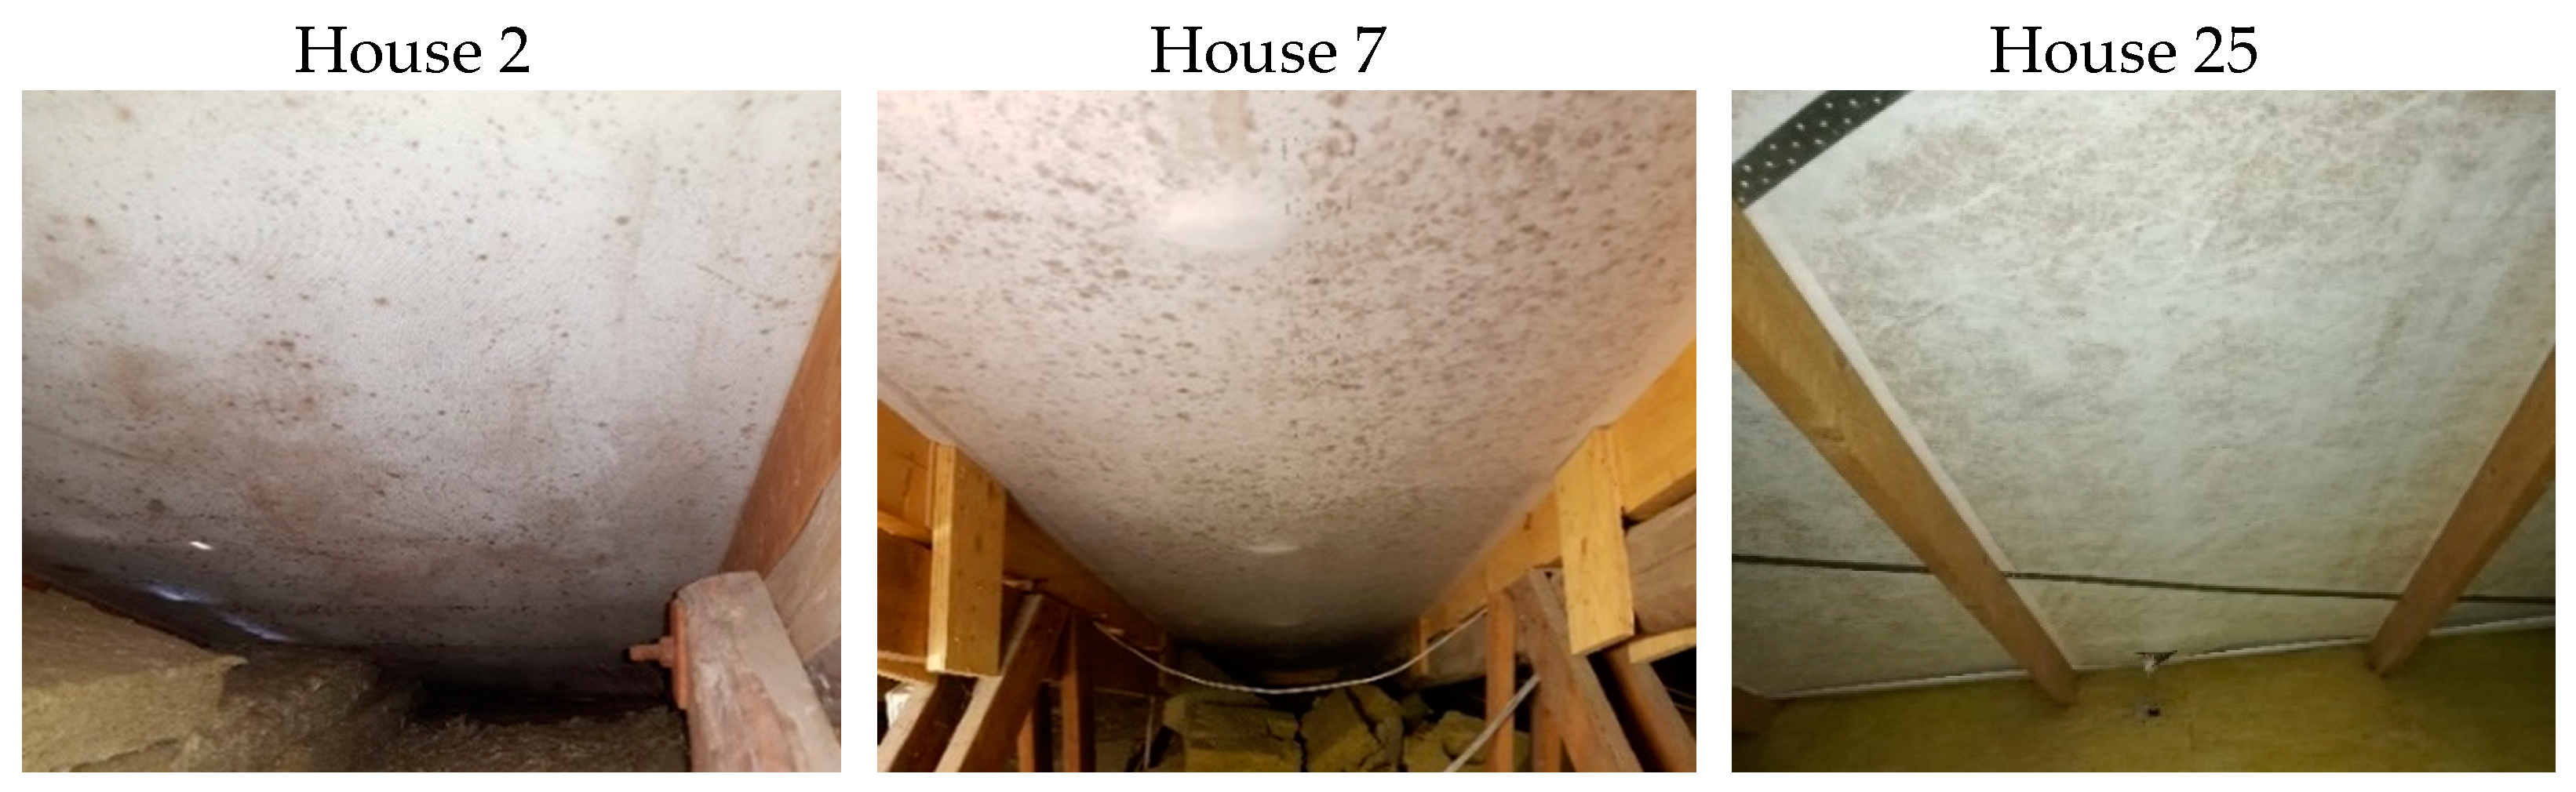
In connection with the measurements, three of the cases buildings exhibited significant visible mould growth on the roof underlay as seen in
Figure 20. In these attics, relatively low air change rates were measured, namely 1.76 h
−1, 1.04 h
−1 and 4.4 h
−1 (winter) and 1.44 h
−1, 0.80 h
−1, 3.64 h
−1 (summer), respectively. However, other houses exhibit equally low air exchange rates in the attics, without visible mould growth.
The results in this study indicate clearly that air exchange occurs in both directions, and for both seasons. Therefore, it is also plausible that mould spores from the attic can cause exposure in the dwelling. This exposure can have negative consequences for inhabitants’ health, as stated in the introductory section. For the three houses with visible mould growth in the attic, the downward air exchange is largest during winter, but present for both seasons. Relative humidity measurements in the attic of house 25 (22 February 2019–11 March 2019), showed very high humidity conditions with an average of 84% and a maximum of 96%. As mould growth can initiate at 75% relative humidity, it is of utmost importance that the relative humidity can be sustained low. For houses 2 and 7, the cold season measurements were performed later in the year (house 2: March, house 3: April), and the relative humidity in these periods is lower compared to house 25. Nevertheless, the average relative humidity in house 2 was found to be 75%, with a maximum of 82%, suggesting that the relative humidity could be higher in even colder seasons, yielding favourable mould growth conditions.
In the present study the concentration of mould spores in the dwelling was not measured, but the presented results suggest the importance of an airtight ceiling, so possible exposure to mould spores in the dwelling can be reduced. This study has shown, that the ventilation conditions in cold attics can possibly contribute to the release and distribution of mould spores in dwellings, if the ceiling is leaky.
4. Conclusions
The air change rates in the dwellings were found to be higher in summer, as expected. The general tendency of the dwelling air change rate however, showed low values with regard to general guidelines of 0.5 h−1 air change in the majority of the houses. Only four of the included houses reached the recommended level of air change rate, and only in the summer period. The average air change rate in the dwelling was found to be 0.20 h−1 in winter, and 0.31 h−1 in summer periods. The air change rates measured in attics were significantly higher, and exhibited much more variation, as also found in previous studies. The air change rates in all the attics were in the range of 0.49–28.20 h−1, and the average values were found to be 6.71 h−1 and 5.45 h−1 in winter and summer respectively. Higher air changes rates were found in attics of roof type (b), with average values of 10.76 h−1 (winter) and 8.80 h−1 (summer). The air change rate in the attics are, however, dependent on outdoor conditions with regard to wind velocity and direction, and as the measurements were not performed simultaneously, the weather is likely to have influenced the variety in results.
The air exchange was found to occur in both directions in both seasons. Based on the present study, there was not found any seasonal dependence with regard to the direction of air exchange, however average values suggest dominating upward air exchange It was found that the vapour barrier does not necessarily have the desired effect in the ceiling, and cases with vapour barriers actually had slightly higher upward air exchange in winter, compared to cases without vapour barriers. In summer, the upward air exchange was approximately the same for cases with and without a vapour barrier. With regard to the downward air exchange from attic to dwelling, the vapour barrier does seem to have a minor effect, as the downward air exchange was found to be higher in cases without vapour barriers for summer periods. These results highlight the importance of airtightness of the ceiling, as the downward air exchange can transfer mould spores to the dwelling. It was furthermore established, that higher upward air exchange leads to higher excess moisture in the attic construction, especially for cases without a vapour barrier, which essentially can yield mould growth. For this reason, the airtightness of the ceiling should be a priority in houses with cold, naturally ventilated attics. Lastly it was established that larger air change rates in attics tend to yield less excess moisture, underlining the importance of the unblocked natural ventilation openings in the attics. For future research, it is relevant to investigate the balance between ceiling airtightness and as air change rates in attic, and thus perhaps establish a minimum ventilation rate based on ceiling airtightness, which could contribute to regulations regarding omission of vapour barriers in ceilings.
Funding
This research was performed with funding by the Kerrn-Jespersen fond and Realdania.
Institutional Review Board Statement
Not applicable.
Informed Consent Statement
Not applicable.
Data Availability Statement
Data is available by contact to corresponding author.
Acknowledgments
Acknowledgements also go to the 30 households that allowed measurements in their homes. Furthermore, co-workers Haseeb Wahedi for assistance with measurements, Niels Christian Bergsøe for analysis of PFT equipment, Ruut Peuhkuri and Martin Morelli for valuable discussions.
Conflicts of Interest
The author declares no conflict of interest.
References
- Hagentoft, C.-E.; Kalagasidis, A.S. Drying potential of cold attic using natural and controlled ventilation in different Swedish climates. Procedia Eng. 2016, 146, 2–7. [Google Scholar] [CrossRef] [Green Version]
- Ahrnens, C.; Borglund, E. Fukt på Kallvindar—En Kartläggning av Småhus i Västra Götalands län, Chalmers Tekniska Högskola. 2007. Available online: https://odr.chalmers.se/bitstream/20.500.12380/40279/1/40279.pdf (accessed on 8 February 2021).
- Hagentoft, C.-E.; Kalagasidis, A.S. Moisture safe cold attics—Assessment based on risk analyses of performance and cost. In Proceedings of the 10th Nordic Symposium on Building Physics, Lund, Sweden, 15–19 June 2014; pp. 1366–1373. [Google Scholar]
- Ge, H.; Wang, R.; Baril, D. Field measurements of hygrothermal performance of attics in extreme cold climates. Build. Environ. 2018, 134, 114–130. [Google Scholar] [CrossRef]
- Hansen, T.; Møller, E.B. Field measurements of moisture variation in cold ventilated attics with different ceiling constructions. Energy Procedia 2017, 132, 801–806. [Google Scholar] [CrossRef]
- Hansen, T.; Møller, E.B. Full scale laboratory test building for examining moisture penetration through different ceilings. In Proceedings of the International RILEM Conference Materials, Systems and Structures in Civil Engineering 2016 Segment on Service Life of Cement-Based Materials and Structures; Kielsgaard Hansen, K., Rode, C., Nilsson, L.-O., Eds.; RILEM Publications S.A.R.L.: Lyngby, Denmark, 2016; pp. 59–68. [Google Scholar]
- Richter, J.; Staněk, K.; Tywoniak, J.; Kopecký, P. Moisture-safe cold attics in humid climates of Europe and North America. Energies 2020, 13, 3856. [Google Scholar] [CrossRef]
- Hansen, T. Vapour Barrier in Cold Ventilated Attics—The Use of Vapour Barriers in Ceilings against Cold Ventilated Attics, with Different Amounts and Types of Insulation Materials; Aalborg University: Copenhagen, Denmark, 2020. [Google Scholar]
- Brandt, E.; Møller, E.B.; Due, L. Due, L. Due, Installation of vapour barriers in existing buildings—Obstacles and solutions. In Proceedings 5th International Conference on Building Physics (IBPC); Kyoto University: Kyoto, Japan, 2012; pp. 449–456. [Google Scholar]
- Bjarløv, S.P.; Johnston, C.; Hansen, M. Hygrothermal conditions in cold, north facing attic spaces under the eaves with vapour-open roofing underlay in a cool, temperate climate. Build. Environ. 2016, 95, 272–282. [Google Scholar] [CrossRef]
- Brandt, E.; Bunch-Nielsen, T.; Morelli, M. SBI-Anvisning 273: Tage; Materialer, Egenskaber, Detaljer; Danish Building Research Institute: Copenhagen, Denmark, 2019. [Google Scholar]
- Harderup, L.-E.; Arfvidsson, J. Moisture safety in cold attics with thick thermal insulation. J. Arch. Eng. 2013, 19, 265–278. [Google Scholar] [CrossRef]
- Mundt-Petersen, S.O.; Harderup, L.-E. Predicting hygrothermal performance in cold roofs using a 1D transient heat and moisture calculation tool. Build. Environ. 2015, 90, 215–231. [Google Scholar] [CrossRef]
- Nielsen, A.; Morelli, M. Measured temperature and moisture conditions in the roof attic of a one-and-a-half story house. Energy Procedia 2017, 132, 789–794. [Google Scholar] [CrossRef]
- Hansen, T.; Møller, E.B. Measurements of temperature dependency on thermal insulation thickness in ventilated attics. In Proceedings of the 7th International Building Physics Conference, Syracuse, New York, USA, 23–26 September 2018. [Google Scholar]
- Hansen, T.; Moeller, E.B. Hygrothermal performance of cold ventilated attics above different horizontal ceiling constructions—Field survey. Build. Environ. 2019, 165, 106380. [Google Scholar] [CrossRef]
- Iffa, E.; Tariku, F. A review of heat and moisture performance of attic roofs. NED Univ. J. Res. 2016, 13, 1–15. [Google Scholar]
- Pedersen, C.; de Place Hansen, E.J.; Hjorslev Hansen, M.; Marsh, R. SBI-anvisning 207: Anvendelse af Alternative Isoleringsmaterialer; 1., Byg og Byg; Statens Byggeforskningsinstitut: Hørsholm, Denmark, 2003. [Google Scholar]
- Hansen, T.; Møller, E.B.; Tvedebrink, T. Hygrothermal performance of cold ventilated attics above different horizontal ceiling constructions: Full-scale test building. J. Build. Phys. 2019, 44, 67–91. [Google Scholar] [CrossRef]
- Hansen, T.; Møller, E.B. Field measurements of moisture in cold ventilated attics with different types of insulation materials and vapor barrier. In Proceedings of the Thermal Performance of the Exterior Envelopes of Whole Buildings XIII International Conference, Clearwater Beach, FL, USA, 4–8 December 2016; p. 13. [Google Scholar]
- Jensen, N.; Bjarløv, S.P.; Johnston, C.J.; Pold, C.F.H.; Hansen, M.H.; Peuhkuri, R.H. Hygrothermal assessment of north-facing, cold attic spaces under the eaves with varying structural roof scenarios. J. Build. Phys. 2019, 44, 3–36. [Google Scholar] [CrossRef]
- Du, L.; Batterman, S.A.; Godwin, C.; Rowe, Z.; Chin, J.-Y. Air exchange rates and migration of VOCs in basements and residences. Indoor Air 2015, 25, 598–609. [Google Scholar] [CrossRef] [PubMed] [Green Version]
- Møller, E.; Gunnarsen, L. Midlertidig Skimmelrenovering af Krybekældre—Undersøgelse af Effekten af Affugtning og Sug i Krybekældre Med Skimmelsvamp; SBI Forlag: Hørsholm, Denmark, 2012. [Google Scholar]
- Airaksinen, M.; Pasanen, P.; Kurnitski, J.; Seppänen, O. Microbial contamination of indoor air due to leakages from crawl space: A field study. Indoor Air 2004, 14, 55–64. [Google Scholar] [CrossRef] [PubMed] [Green Version]
- Mosley, R.B.; Greenwell, D.J.; Sparks, L.E.; Guo, Z.; Tucker, W.G.; Fortmann, R.; Whitfield, C. Penetration of ambient fine particles into the indoor environment. Aerosol Sci. Technol. 2001, 34, 127–136. [Google Scholar] [CrossRef]
- Gravesen, S.; Nielsen, P.A.; Fog Nielsen, K. Skimmelsvampe i Vandskadede Bygninger, Hørsholm, Denmark. 1997. Available online: https://sbi.dk/Assets/Skimmelsvampe-i-vandskadede-bygninger/978-87-563-0960-8.pdf (accessed on 8 February 2021).
- Brandt, E.; Bunch-Nielsen, T.; Christensen, G.; Gudum, C.; Hjorslev Hansen, M.; Møller, E.B. SBI-Anvisning 224: Fugt i Bygninger, 2nd ed.; Danish Building Research Institute: Copenhagen, Denmark, 2009. [Google Scholar]
- Bergsøe, N.C. Passiv sporgasmetode til ventilationsundersøgelser—Beskrivelse og analyse af PFT-metoden. In SBI-Rapport 227; SBI Forlag: Hørsholm, Denmark, 1992. [Google Scholar]
- Dietz, R.N.; Cote, E.A. Air infiltration measurements in a home using a convenient perfluorocarbon tracer technique. Environ. Int. 1982, 8, 419–433. [Google Scholar] [CrossRef]
- Lascar Electronics. EL-USB-2+, High Accuracy Temp & RH Data Logger with USB. (n.d.) Available online: https://www.lascarelectronics.com/easylog-el-usb-2plus (accessed on 5 January 2021).
- Bygningsreglementet.dk, Bygningsreglementets Vejledning om Ventilation. (n.d.) Available online: https://bygningsreglementet.dk/Tekniske-bestemmelser/22/Vejledninger/Generel_vejledning/Kap-1_6#1d48dc7b-be02-4974-844a-2f701c45e7fd (accessed on 17 April 2020).
- Dimitroulopoulou, C. Ventilation in European dwellings: A review. Build. Environ. 2012, 47, 109–125. [Google Scholar] [CrossRef]
- Møller, E.B.; Morelli, M.; Hansen, T. Air change rate in ventilated attics—Reality and input for simulations. MATEC Web Conf. 2019, 282, 02073. [Google Scholar] [CrossRef]
Figure 1.
Illustration of ventilation principles at eaves and ridge in two types of cold attics [
11]. In these examples the ventilation is further supplemented with openings in the gables (valid for short buildings < 16 m).
Figure 1.
Illustration of ventilation principles at eaves and ridge in two types of cold attics [
11]. In these examples the ventilation is further supplemented with openings in the gables (valid for short buildings < 16 m).
Figure 2.
Air movements through a building with wind load. Blue arrows: cold air, Red arrows: warm air.
Figure 2.
Air movements through a building with wind load. Blue arrows: cold air, Red arrows: warm air.
Figure 3.
Roof and attic construction types included in the study [
27]; (
a) is a cold, open attic space, while some of the attic space is utilized (warm) in (
b), and less space is left for the cold attic.
Figure 3.
Roof and attic construction types included in the study [
27]; (
a) is a cold, open attic space, while some of the attic space is utilized (warm) in (
b), and less space is left for the cold attic.
Figure 4.
Location of houses included in the present study. Denmark (left) and Zealand (right).
Figure 4.
Location of houses included in the present study. Denmark (left) and Zealand (right).
Figure 5.
Distribution of house types included in the study, including year of construction, with/without a vapour barrier in the ceiling, roof type according to
Figure 3, ventilation systems and insulation material.
Figure 5.
Distribution of house types included in the study, including year of construction, with/without a vapour barrier in the ceiling, roof type according to
Figure 3, ventilation systems and insulation material.
Figure 6.
(a) Illustration of the two-zone model for perflourocarbon tracer (PFT) measurements. (b) PMCH (perfluoromethylcyclohexan) tracer gas source and T/RH logger. (c) Sampling tube.
Figure 6.
(a) Illustration of the two-zone model for perflourocarbon tracer (PFT) measurements. (b) PMCH (perfluoromethylcyclohexan) tracer gas source and T/RH logger. (c) Sampling tube.
Figure 7.
Box plot with temperature and relative humidity measured in the dwellings. Houses 1–19 have vapour barriers, and houses 20–30 do not have a vapour barrier. The notation “w” represents winter measurements, and “s” represents summer measurement.
Figure 7.
Box plot with temperature and relative humidity measured in the dwellings. Houses 1–19 have vapour barriers, and houses 20–30 do not have a vapour barrier. The notation “w” represents winter measurements, and “s” represents summer measurement.
Figure 8.
Daily average of temperature and relative humidity measured in the attics. Houses 1–19 have vapour barriers, and houses 20–30 do not have a vapour barrier. The notation “w” represents winter measurements, and “s” represents summer measurement.
Figure 8.
Daily average of temperature and relative humidity measured in the attics. Houses 1–19 have vapour barriers, and houses 20–30 do not have a vapour barrier. The notation “w” represents winter measurements, and “s” represents summer measurement.
Figure 9.
Daily average of excess moisture in the dwellings. Top: houses with vapour barriers (1–19), bottom: houses without vapour barriers (20–30).
Figure 9.
Daily average of excess moisture in the dwellings. Top: houses with vapour barriers (1–19), bottom: houses without vapour barriers (20–30).
Figure 10.
Daily average of excess moisture in the attics. Note that some measurements from house 22 exhibit excess moisture up to 16 g/m3 in single measurements. Top: houses with vapour barriers (1–19), bottom: houses without vapour barriers (20–30).
Figure 10.
Daily average of excess moisture in the attics. Note that some measurements from house 22 exhibit excess moisture up to 16 g/m3 in single measurements. Top: houses with vapour barriers (1–19), bottom: houses without vapour barriers (20–30).
Figure 11.
Air change rates measured in the 30 dwellings.
Figure 11.
Air change rates measured in the 30 dwellings.
Figure 12.
Air change rates measured in the 30 attics.
Figure 12.
Air change rates measured in the 30 attics.
Figure 13.
Average air change rate in dwellings and standard deviation distributed by types; all investigated houses (all), houses with (V.B) and without (no V.B.) a vapour barrier, roof type (a) according to
Figure 3 (Roof (a)), roof type (b) according to
Figure 3 (Roof (b)), houses with only natural ventilation (NV), houses with mechanical ventilation (MV), insulation material mineral wool (MW) or mineral wool and cellulose-based insulation (MW+CL).
Figure 14.
Average air change rate in attics and standard deviation distributed by types; all investigated houses (all), houses with (V.B) and without (no V.B.) a vapour barrier, roof type (a) according to
Figure 3 (Roof (a)), roof type (b) according to
Figure 3 (Roof (b)), houses with only natural ventilation (NV), houses with mechanical ventilation (MV), mineral wool insulation material (MW) or mineral wool and cellulose-based insulation (MW+CL).
Figure 15.
Upward air exchange from dwelling to attic.
Figure 15.
Upward air exchange from dwelling to attic.
Figure 16.
Downward air exchange from attic to dwelling. In the summer, house 20 obtains a downward air exchange of 225 m3/h.
Figure 16.
Downward air exchange from attic to dwelling. In the summer, house 20 obtains a downward air exchange of 225 m3/h.
Figure 17.
Average air exchange between dwelling and attic in both directions, summer and winter, distributed on construction types; all investigated houses (all), houses with (V.B) and without (no V.B.) a vapour barrier, roof type (a) according to
Figure 3 (Roof (a)), roof type (b) according to
Figure 3 (Roof (b)), houses with only natural ventilation (NV), houses with mechanical ventilation (MV), mineral wool insulation material (MW) or mineral wool and cellulose-based insulation (MW+CL).
Figure 18.
Average excess moisture in attics plotted against the average air change rate in attics for measurement periods in summer and winter, with linear trendlines.
Figure 18.
Average excess moisture in attics plotted against the average air change rate in attics for measurement periods in summer and winter, with linear trendlines.
Figure 19.
Moisture excess in attics in relation to outdoors as a function of average upward air exchange for the 30 houses included in the study, for both summer and winter, and linear trendlines. Houses with a vapour barrier are presented with blue/green, and houses without a vapour barrier are presented in orange/yellow.
Figure 20.
Mould growth in the attics of three test houses, namely houses 2, 7 and 25.
Figure 20.
Mould growth in the attics of three test houses, namely houses 2, 7 and 25.
Table 1.
Description of 30 houses included in the study. V.B.: vapour barrier, M. V.: mechanical ventilation, Ins: insulation material, MW: mineral wool, CL: cellulose-based insulation.
Table 1.
Description of 30 houses included in the study. V.B.: vapour barrier, M. V.: mechanical ventilation, Ins: insulation material, MW: mineral wool, CL: cellulose-based insulation.
| House | Year | V.B. | Roof | M. V. | Ins. | House | Year | V.B. | Roof | M. V. | Ins. |
|---|
| 1 | 1928 | Yes | (b) * | | MW | 16 | 2003 | Yes | (a) * | x | MW |
| 2 | 1955 | Yes | (a) * | | MW | 17 | 2006 | Yes | (a) * | x | MW |
| 3 | 1956 | Yes | (a) * | | MW | 18 | 2015 | Yes | (a) * | x | MW |
| 4 | 1961 | Yes | (a) * | | MW | 19 | 2016 | Yes | (a) * | x | MW |
| 5 | 1964 | Yes | (a) * | | MW | 20 | 1719 | No | (b) * | | MW |
| 6 | 1964 | Yes | (a) * | x | MW | 21 | 1929 | No | (b) * | | MW |
| 7 | 1965 | Yes | (a) * | x | MW | 22 | 1934 | No | (a) * | | MW |
| 8 | 1970 | Yes | (a) * | | MW | 23 | 1934 | No | (b) * | | MW |
| 9 | 1970 | Yes | (a) * | | MW+CL | 24 | 1943 | No | (b) * | | MW |
| 10 | 1970 | Yes | (a) * | | MW | 25 | 1952 | No/Yes a | (a) * | | MW |
| 11 | 1970 | Yes | (a) * | | MW | 26 | 1956 | No | (a) * | | MW |
| 12 | 1975 | Yes | (a) * | | MW+CL | 27 | 1959 | No | (a) * | | MW |
| 13 | 1981 | Yes | (a) * | | MW | 28 | 1960 | No | (a) * | | MW |
| 14 | 1986 | Yes | (a) * | | MW | 29 | 1964 | No | (a) * | | MW+CL |
| 15 | 2003 | Yes | (a) * | | MW | 30 | 1985 | No | (a) * | | MW |
Table 2.
Uncertainties on temperature and relative humidity measurements as provided by producer [
30].
Table 2.
Uncertainties on temperature and relative humidity measurements as provided by producer [
30].
| Parameter | Accuracy | Under Given Conditions |
|---|
| Temperature, θ | 0.45 °C | 5–60 °C |
| Relative humidity, RH | 2.05% | 20–90% |
| Publisher’s Note: MDPI stays neutral with regard to jurisdictional claims in published maps and institutional affiliations. |
© 2021 by the author. Licensee MDPI, Basel, Switzerland. This article is an open access article distributed under the terms and conditions of the Creative Commons Attribution (CC BY) license (http://creativecommons.org/licenses/by/4.0/).


