
Critical Analysis about Emerging Technologies for Building’s Façade Inspection


Abstract
:1. Introduction
2. Materials and Methods
3. Global Inspection System for the Buildings’ Envelope Elements: 2 Case Studies
4. The Uncertainty Associated with the Building Inspection Based on Fieldwork
5. Emerging Technologies to Automate Visual Building’s Façade Inspection
5.1. 3D Laser Scanning (TLS)
5.2. Infrared Thermography (IRT)
5.3. Photogrammetry and Remote Sensing (PRS)
5.4. Digital Image Processing (DIP)
5.5. Drones (UAV)
6. Critical Analysis for Inspection and Diagnosis of Facades Elements
7. Conclusions
Author Contributions
Funding
Data Availability Statement
Acknowledgments
Conflicts of Interest
References
- Ferraz, G.T.; de Brito, J.; de Freitas, V.P.; Silvestre, J.D. State-of-the-art review of building inspection systems. J. Perform. Constr. Facil. 2016, 30, 04016018. [Google Scholar] [CrossRef]
- Pereira, C.; de Brito, J.; Silvestre, J.D. Harmonising the classification of diagnosis methods within a global building inspection system: Proposed methodology and analysis of fieldwork data. Eng. Fail. Anal. 2020, 115, 104627. [Google Scholar] [CrossRef]
- Pereira, C.; de Brito, J.; Silvestre, J.D.; Flores-Colen, I. Atlas of defects within a global building inspection system. Appl. Sci. 2020, 10, 5879. [Google Scholar] [CrossRef]
- Pereira, C.; Silva, A.; de Brito, J.; Ferreira, C.; Flores-Colen, I.; Silvestre, J. Uncertainty and Risk Analysis in Inspection and Diagnosis, CIB W086 State of the Art Report; University of Lisbon: Lisbon, Portugal, 2020. [Google Scholar]
- Gasparoli, P.; Jornet, A.; Panato, E. Factory-made dry rendering mortars: Characterization and artificial weathering. In Proceedings of the International Workshop on Management of Durability in the Building Process, Politecnico di Milano, Milan, Italy, 25 June 2003. [Google Scholar]
- Kus, H.; Nygren, K.; Norberg, P. In-use performance assessment of rendered autoclaved aerated concrete walls by long-term moisture monitoring. Build. Environ. 2004, 39, 677–687. [Google Scholar] [CrossRef]
- Daniotti, B.; Iacono, P. Evaluating the service life of external walls: A comparison between long-term and short-term exposure. In Proceedings of the X International Conference on Durability of Building Materials and Components, Lyon, France, 17–20 April 2005; p. 8. [Google Scholar]
- Wyatt, D. The contribution of FMEA and FTA to the performance review and auditing of service life design of constructed assets. In Proceedings of the 10th Durability of Building Materials and Components (10DBMC), Lyon, France, 17–20 April 2005; pp. 17–20. [Google Scholar]
- Köliö, A.; Honkanen, M.; Lahdensivu, J. Corrosion propagation phase studies on finnish reinforced concrete facades. In New Approaches to Building Pathology and Durability; Delgado, J., Ed.; Springer: Singapore, 2016; pp. 75–98. [Google Scholar]
- Serralheiro, M.I.; de Brito, J.; Silva, A. Methodology for service life prediction of architectural concrete facades. Constr. Build. Mater. 2017, 133, 261–274. [Google Scholar] [CrossRef]
- Shohet, I.; Rosenfeld, Y.; Puterman, M.; Gilboa, E. Deterioration patterns for maintenance management—A methodological approach. In Proceedings of the 8th International Conference on Durability of Building Materials and Components (DBMC), Vancouver, BC, Canada, 30 May–3 June 1999; pp. 1666–16678. [Google Scholar]
- Straub, A. Using a condition-dependent approach to maintenance to control costs and performances. J. Facil. Manag. 2002, 1, 380–395. [Google Scholar] [CrossRef]
- Daniotti, B.; Lupica Spagnolo, S. Service life prediction for buildings’ design to plan a sustainable building maintenance. In Proceedings of the SB07 Lisbon—Sustainable Construction, Materials and Practices: Challenge of the Industry for the New Millennium, Minho, Portugal, 12–14 September 2007; IOS Press: Lisbon, Portugal; pp. 515–521. [Google Scholar]
- Bauer, E.; Kraus, E.; Silva, M.N.B.; Zanoni, V.A.G. Evaluation of damage of building facades in Brasília. In Proceedings of the XIII DBMC—International Conference on Durability of Materials and Components, Sao Paulo, Brazil, 2–5 September 2014; pp. 535–542. [Google Scholar]
- Peng, K.C.; Feng, L.; Hsieh, Y.C.; Yang, T.H.; Hsiung, S.H.; Tsai, Y.D.; Kuo, C. Unmanned Aerial Vehicle for infrastructure inspection with image processing for quantification of measurement and formation of facade map. In Proceedings of the International Conference on Applied System Innovation (ICASI), Sapporo, Japan, 13–17 May 2017; Institute of Electrical and Electronics Engineers Inc.: Piscataway, NJ, USA; pp. 1969–1972. [Google Scholar]
- Dorafshan, S.; Maguire, M. Bridge inspection: Human performance, unmanned aerial systems and automation. J. Civ. Struct. Heal. Monit. 2018, 8, 443–476. [Google Scholar] [CrossRef] [Green Version]
- Serrat, C.; Banaszek, A.; Cellmer, A.; Gibert, V. Use of UAVs for technical inspection of buildings within the BRAIN Massive inspection platform. In IOP Conference Series: Materials Science and Engineering; Institute of Physics Publishing: Bristol, UK, 2019; Volume 471. [Google Scholar]
- Tuutti, K. Corrosion of Steel in Concrete; Swedish Cement and Concrete Research Institute: Stockholm, Sweden, 1982. [Google Scholar]
- Berberan, A.; Portela, E.A.; Boavida, J. Assisted visual inspection of dams for structural safety control. In Proceedings of the Hydro 2006: Maximizing the Benefits of Hydropower, Porto Carras, Greece, 25–27 September 2006. [Google Scholar]
- Law, D.W.; Holden, L.; Silcock, D. The assessment of crack development in concrete using a terrestrial laser scanner (TLS). Aust. J. Civ. Eng. 2015, 13, 22–31. [Google Scholar] [CrossRef]
- Serrat Piè, C.; Gibert Armengol, V.; Cellmer, A.; Banaszek, A. Quantitative comparison between visual and UAV-based inspections for the assessment of the technical condition of building facades. In Research and Modelling in Civil Engineering 2018; Katzer, J., Cichocki, K., Domski, J., Eds.; Koszalin University of Technology Publishing House: Koszalin, Poland, 2018; pp. 19–29. [Google Scholar]
- Masiero, A.; Costantino, D. TLS for detecting small damages on a building façade. ISPRS Ann. Photogramm. Remote Sens. Spat. Inf. Sci. 2019, XLll–2/W11, 831–836. [Google Scholar] [CrossRef] [Green Version]
- Marković, M.; Laban, M.; Kuzmić, T.; Vujinović, M.; Draganić, S. Application of modern technologies in assessing facade condition of building structures. In Proceedings of the FIG Working Week 2020, Smart Surveyors for Land and Water Management, Amsterdam, The Netherlands, 10–14 May 2020. [Google Scholar]
- Agnisarman, S.; Lopes, S.; Chalil Madathil, K.; Piratla, K.; Gramopadhye, A. A survey of automation-enabled human-in-the-loop systems for infrastructure visual inspection. Autom. Constr. 2019, 97, 52–76. [Google Scholar] [CrossRef]
- Madureira, S.; Flores-Colen, I.; de Brito, J.; Pereira, C. Maintenance planning of facades in current buildings. Constr. Build. Mater. 2017, 147, 790–802. [Google Scholar] [CrossRef]
- Bortolini, R.; Forcada, N. Building Inspection System for Evaluating the Technical Performance of Existing Buildings. J. Perform. Constr. Facil. 2018, 32, 04018073. [Google Scholar] [CrossRef]
- Moropoulou, A.; Labropoulos, K.C.; Delegou, E.T.; Karoglou, M.; Bakolas, A. Non-destructive techniques as a tool for the protection of built cultural heritage. Constr. Build. Mater. 2013, 48, 1222–1239. [Google Scholar] [CrossRef]
- McGibbon, S.; Abdel-Wahab, M. Emerging digitisation trends in stonemasonry practice. In Proceedings of the Science and Art: A Future for Stone: Proceedings of the 13th International Congress on the Deterioration and Conservation of Stone, Paisley, Glasgow, Scotland, 6–10 September 2016; Volume 2, pp. 1041–1050. [Google Scholar]
- Calantropio, A.; Chiabrando, F.; Rinaudo, F.; Teppati Losè, L. Use and evaluation of a short range small quadcopter and a portable imaging laser for built heritage 3D documentation. Int. Arch. Photogramm. Remote Sens. Spat. Inf. Sci. ISPRS Arch. 2018, 42, 71–78. [Google Scholar] [CrossRef] [Green Version]
- Markiewicz, J.; Tobiasz, A.; Kot, P.; Muradov, M.; Shaw, A.; Al-Shammaa, A. Review of surveying devices for structural health monitoring of cultural heritage buildings. In Proceedings of the International Conference on Developments in eSystems Engineering, DeSE, Kazan, Russia, 20 October 2019; Institute of Electrical and Electronics Engineers Inc.: Piscataway, NJ, USA; pp. 597–601. [Google Scholar]
- Shariq, M.H.; Hughes, B.R. Revolutionising building inspection techniques to meet large-scale energy demands: A review of the state-of-the-art. Renew. Sustain. Energy Rev. 2020, 130. [Google Scholar] [CrossRef]
- Valero, E.; Forster, A.; Bosché, F.; Hyslop, E.; Wilson, L.; Turmel, A. Automated defect detection and classification in ashlar masonry walls using machine learning. Autom. Constr. 2019, 106, 102846. [Google Scholar] [CrossRef]
- Lee, D.Y.; Chi, H.L.; Wang, J.; Wang, X.; Park, C.S. A linked data system framework for sharing construction defect information using ontologies and BIM environments. Autom. Constr. 2016, 68, 102–113. [Google Scholar] [CrossRef]
- De Brito, J.; Pereira, C.; Silvestre, J.; Flores-Colen, I. Expert Knowledge-Based Inspection Systems: Inspection, Diagnosis, and Repair of the Building Envelope; Springer International Publishing: New York, NY, USA, 2020; ISBN 978-3-030-42446-6. [Google Scholar]
- Gonçalves, J.; Mateus, R.; Silvestre, J.D. Comparative analysis of inspection and diagnosis tools for ancient buildings. In Proceedings of the Digital Heritage, Progress in Cultural Heritage: Documentation, Preservation, and Protection. 7th International Conference, EuroMed 2018, Nicosia, Cyprus, 29 October–3 November 2018; Springer: Berlin/Heidelberg, Germany, 2018; Volume 11197 LNCS, pp. 289–298. [Google Scholar]
- Van den Beukel, A. Building Pathology: A State-of-the-Art Report; CIB W086-Publication 155; Conseil International du Bâtiment: Rotterdam, The Netherlands, 1993. [Google Scholar]
- De Freitas, V.P. A State-of-the-Art Report on Building Pathology; CIB W086-Publication 393; Conseil International du Bâtiment: Rotterdam, The Netherlands, 2013. [Google Scholar]
- Pereira, C.; de Brito, J.; Silvestre, J.D. Harmonised classification of the causes of defects in a global inspection system: Proposed methodology and analysis of fieldwork data. Sustainability 2020, 12, 5564. [Google Scholar] [CrossRef]
- Silvestre, J.D.; de Brito, J. Inspection and repair of ceramic tiling within a building management system. J. Mater. Civ. Eng. 2010, 22, 39–48. [Google Scholar] [CrossRef]
- Neto, N.; de Brito, J. Inspection and defect diagnosis system for natural stone cladding. J. Mater. Civ. Eng. 2011, 23, 1433–1443. [Google Scholar] [CrossRef]
- Sá, G.; Sá, J.; De Brito, J.; Amaro, B. Statistical survey on inspection, diagnosis and repair of wall renderings. J. Civ. Eng. Manag. 2015, 21, 623–636. [Google Scholar] [CrossRef] [Green Version]
- Silva, A.; de Brito, J.; Gaspar, P.L. Methodologies for service life prediction of buildings: With a focus on façade claddings. In Green Energy and Technology, 1st ed.; Springer International Publishing: New York, NY, USA, 2016; ISBN 978-3-319-33288-8. [Google Scholar]
- Silva, A.; de Brito, J. Do we need a buildings’ inspection, diagnosis and service life prediction software? J. Build. Eng. 2019, 22, 335–348. [Google Scholar] [CrossRef]
- Pereira, C.; de Brito, J.; Silvestre, J.D. Global inspection, diagnosis and repair system for buildings: Managing the level of detail of the defects classification. In Proceedings of the 7th Rehabend Congress—Construction Pathology, Rehabilitation Technology and Heritage Management, Cáceres, Spain, 24–27 March 2018; pp. 572–579. [Google Scholar]
- Gaspar, P.L.; Brito, J. de Quantifying environmental effects on cement-rendered facades: A comparison between different degradation indicators. Build. Environ. 2008, 43, 1818–1828. [Google Scholar] [CrossRef]
- Gaspar, P.L. Service Life of Constructions: Development of a Method to Estimate the Durability of Construction Elements. Application to Renderings of Current Buildings. Ph.D. Thesis, Instituto Superior Técnico, University of Lisbon, Lisbon, Portugal, 2009. [Google Scholar]
- Ferreira, C.; Canhoto Neves, L.; Silva, A.; de Brito, J. Stochastic Petri net-based modelling of the durability of renderings. Autom. Constr. 2018, 87, 96–105. [Google Scholar] [CrossRef]
- Silva, A.; De Brito, J.; Gaspar, P.L. Service life prediction model applied to natural stone wall claddings (directly adhered to the substrate). Constr. Build. Mater. 2011, 25, 3674–3684. [Google Scholar] [CrossRef]
- Falorca, J.; Lanzinha, J.C.G. Developments Towards the Use of Drones in the Building Envelope Condition Assessment: A Comprehensive Review and Experimental Rehearsals, 1st ed.; Universidade da Beira Interior (UBI): Covilhã, Portugal, 2019; ISBN 978-989-654-610-6. [Google Scholar]
- El Masri, Y.; Rakha, T. A scoping review of non-destructive testing (NDT) techniques in building performance diagnostic inspections. Constr. Build. Mater. 2020, 265, 120542. [Google Scholar] [CrossRef]
- Smits, J. Application of 3D terrestrial laser scanning to map building surfaces. J. Arch. Conserv. 2011, 17, 81–94. [Google Scholar] [CrossRef]
- Sánchez-Aparicio, L.J.; Del Pozo, S.; Ramos, L.F.; Arce, A.; Fernandes, F.M. Heritage site preservation with combined radiometric and geometric analysis of TLS data. Autom. Constr. 2018, 85, 24–39. [Google Scholar] [CrossRef]
- Nowak, R.; Orłowicz, R.; Rutkowski, R. Use of TLS (LiDAR) for building diagnostics with the example of a historic building in Karlino. Buildings 2020, 10, 24. [Google Scholar] [CrossRef] [Green Version]
- Suchocki, C.; Katzer, J. TLS Technology in brick walls inspection. In Proceedings of the 2018 Baltic Geodetic Congress (BGC Geomatics), Olsztyn, Poland, 21–23 June 2018; Institute of Electrical and Electronics Engineers Inc.: New York, NY, USA, 2018; pp. 359–363. [Google Scholar]
- Russo, M.; Carnevali, L.; Russo, V.; Savastano, D.; Taddia, Y. Modeling and deterioration mapping of façades in historical urban context by close-range ultra-lightweight UAVs photogrammetry. Int. J. Arch. Herit. 2019, 13, 549–568. [Google Scholar] [CrossRef]
- Valença, J.; Dias-Da-Costa, D.; Júlio, E.; Araújo, H.; Costa, H. Automatic crack monitoring using photogrammetry and image processing. Meas. J. Int. Meas. Confed. 2013, 46, 433–441. [Google Scholar] [CrossRef]
- Kamnik, R.; Nekrep Perc, M.; Topolšek, D. Using the scanners and drone for comparison of point cloud accuracy at traffic accident analysis. Accid. Anal. Prev. 2020, 135, 105391. [Google Scholar] [CrossRef] [PubMed]
- Edis, E.; Flores-Colen, I.; de Brito, J. Passive Thermographic inspection of adhered ceramic claddings: Limitation and conditioning factors. J. Perform. Constr. Facil. 2013, 27, 737–747. [Google Scholar] [CrossRef]
- Kylili, A.; Fokaides, P.A.; Christou, P.; Kalogirou, S.A. Infrared thermography (IRT) applications for building diagnostics: A review. Appl. Energy 2014, 134, 531–549. [Google Scholar] [CrossRef]
- Edis, E.; Flores-Colen, I.; De Brito, J. Passive thermographic detection of moisture problems in façades with adhered ceramic cladding. Constr. Build. Mater. 2014, 51, 187–197. [Google Scholar] [CrossRef]
- Edis, E.; Flores-Colen, I.; De Brito, J. Building thermography: Detection of delamination of adhered ceramic claddings using the passive approach. J. Nondestruct. Eval. 2015, 34, 1–13. [Google Scholar] [CrossRef]
- Bauer, E.; de Freitas, V.P.; Mustelier, N.; Barreira, E.; de Freitas, S.S. Infrared thermography–Evaluation of the results reproducibility. Struct. Surv. 2015, 33, 20–35. [Google Scholar] [CrossRef]
- Bauer, E.; Pavón, E.; Pereira, C.H.F.; Nascimento, M.L.M. Criteria for identification of ceramic detachments in building facades with infrared thermography. In Recent Developments in Building Diagnosis Techniques; Delgado, J.M.P.Q., Ed.; Springer: Singapore, 2016; pp. 51–68. [Google Scholar]
- Bauer, E.; Milhomem, P.M.; Aidar, L.A.G. Evaluating the damage degree of cracking in facades using infrared thermography. J. Civ. Struct. Heal. Monit. 2018, 8, 517–528. [Google Scholar] [CrossRef]
- Lucchi, E. Applications of the infrared thermography in the energy audit of buildings: A review. Renew. Sustain. Energy Rev. 2018, 82, 3077–3090. [Google Scholar] [CrossRef]
- Costanzo, A.; Minasi, M.; Casula, G.; Musacchio, M.; Buongiorno, M. Combined use of terrestrial laser scanning and IR thermography applied to a historical building. Sensors 2014, 15, 194–213. [Google Scholar] [CrossRef] [PubMed] [Green Version]
- Lagüela, S.; Armesto, J.; Arias, P.; Herráez, J. Automation of thermographic 3D modelling through image fusion and image matching techniques. Autom. Constr. 2012, 27, 24–31. [Google Scholar] [CrossRef]
- González-Jorge, H.; Lagüela, S.; Krelling, P.; Armesto, J.; Martínez-Sánchez, J. Single image rectification of thermal images for geometric studies in façade inspections. Infrared Phys. Technol. 2012, 55, 421–426. [Google Scholar] [CrossRef]
- FLIR Products. Available online: https://www.flir.eu/products/tg267/ (accessed on 21 December 2020).
- Rakha, T.; Gorodetsky, A. Review of Unmanned Aerial System (UAS) applications in the built environment: Towards automated building inspection procedures using drones. Autom. Constr. 2018, 93, 252–264. [Google Scholar] [CrossRef]
- Garrido, I.; Lagüela, S.; Otero, R.; Arias, P. Thermographic methodologies used in infrastructure inspection: A review—Post-processing procedures. Appl. Energy 2020, 266, 114857. [Google Scholar] [CrossRef]
- Valença, J.; Júlio, E.N.B.S.; Araújo, H.J. Applications of photogrammetry to structural assessment. Exp. Tech. 2012, 36, 71–81. [Google Scholar] [CrossRef]
- Jiang, R.; Jáuregui, D.V.; White, K.R. Close-range photogrammetry applications in bridge measurement: Literature review. Measurement 2008, 41, 823–834. [Google Scholar] [CrossRef]
- Oliveira, A.; Boavida, J.; Santos, B. Displacement and surface pathology monitoring of former Tejo Power Station building by combining terrestrial laser scanning, micro-geodesy, photogrammetry and GIS. In Proceedings of the INGEO 2017—7th International Conference on Engineering Surveying, Lisbon, Portugal, 18–20 October 2017; pp. 1–8. [Google Scholar]
- Berberan, A.; Portela, E.A.; Boavida, J. Enhancing on-site dams visual inspections. In Proceedings of the 5th International Conference on Dam Engineering, Lisbon, Portugal, 14–16 February 2007; pp. 55–62. [Google Scholar]
- Paulo, P.V.; Branco, F.A.; de Brito, J. Using orthophotography based on buildingslife software to inspect building facades. J. Perform. Constr. Facil. 2014, 28, 04014019. [Google Scholar] [CrossRef]
- Agisoft Metashape Software. Available online: https://www.agisoft.com/buy/online-store/ (accessed on 21 December 2020).
- Laofor, C.; Peansupap, V. Defect detection and quantification system to support subjective visual quality inspection via a digital image processing: A tiling work case study. Autom. Constr. 2012, 24, 160–174. [Google Scholar] [CrossRef]
- González Manich, C.; Kelman, T.; Coutts, F.; Qiu, B.; Murray, P.; González-Longo, C.; Marshall, S. Exploring the use of image processing to survey and quantitatively assess historic buildings. In Structural Analysis of Historical Constructions: Anamnesis, Diagnosis, Therapy, Controls; Koen Van Balen, E.V., Ed.; CRC Press: Leuven, Belgium, 2016; pp. 125–132. ISBN 9781138029514. [Google Scholar]
- Ruiz, R.D.B.; Lordsleem Júnior, A.C.; Fernandes, B.J.T.; Oliveira, S.C. Unmanned aerial vehicles and digital image processing with deep learning for the detection of pathological manifestations on facades. In Proceedings of the 18th International Conference on Computing in Civil and Building Engineering, ICCCBE 2020, Lecture Notes in Civil Engineering, São Paulo, Brazil, 18–20 August 2020; Santos, E.T., Scheer, S., Eds.; Springer: Berlin/Heidelberg, Germany, 2021; Volume 98, pp. 1099–1112. [Google Scholar]
- Pereira, F.C.; Pereira, C.E. Embedded image processing systems for automatic recognition of cracks using UAVs. IFAC Pap. 2015, 28, 16–21. [Google Scholar] [CrossRef]
- DJI Products. Available online: https://store.dji.com/pt/product/phantom-4-pro-v2?from=landing_page&site=brandsite&vid=43151 (accessed on 21 December 2020).
- Mosly, I. Applications and issues of unmanned aerial systems in the construction industry. Int. J. Constr. Eng. Manag. 2017, 6, 235–239. [Google Scholar] [CrossRef] [Green Version]
- Eschmann, C.; Kuo, C.M.; Kuo, C.H.; Boller, C. Unmanned aircraft systems for remote building inspection and monitoring. In Proceedings of the 6th European Workshop on Structural Health Monitoring (EWSHM 2012), Dresden, Germany, 3–6 July 2012; Volume 2, pp. 1179–1186. [Google Scholar]
- Chen, K.; Reichard, G.; Xu, X. Opportunities for applying camera-equipped drones towards performance inspections of building facades. In Proceedings of the Computing in Civil Engineering 2019: Smart Cities, Sustainability, and Resilience—Selected Papers from the ASCE International Conference on Computing in Civil Engineering 2019, Atlanta, GA, USA, 17–19 June 2019; American Society of Civil Engineers (ASCE): Reston, VA, USA; pp. 113–120. [Google Scholar]
- Furtado, F.J.; Gonçalves, L.J.C. Facade inspections with drones—Theoretical analysis and exploratory tests. Int. J. Build. Pathol. Adapt. 2020, 24. [Google Scholar] [CrossRef]
- Roca, D.; Lagüela, S.; Díaz-Vilariño, L.; Armesto, J.; Arias, P. Low-cost aerial unit for outdoor inspection of building façades. Autom. Constr. 2013, 36, 128–135. [Google Scholar] [CrossRef]


| Defects | (%) | |||||
|---|---|---|---|---|---|---|
| Stains, Astains | Condition B | 2.5 | 2.63 | 1 | 0.67 | 1.762 |
| Condition C | 4.2 | 4.41 | 2 | 0.67 | 5.909 | |
| Condition D | 3.1 | 3.26 | 3 | 0.67 | 6.553 | |
| Condition E | - | - | 4 | 0.67 | - | |
| Cracking, Acracking | Condition B | - | - | 1 | 1.00 | - |
| Condition C | 3.3 | 3.47 | 2 | 1.00 | 6.940 | |
| Condition D | 1.8 | 1.91 | 3 | 1.00 | 5.730 | |
| Condition E | 4.1 | 4.30 | 4 | 1.50 | 25.800 | |
| Loss of adhesion, Aadhesion | Condition B | - | - | 1 | 1.50 | - |
| Condition C | - | - | 2 | 1.50 | - | |
| Condition D | 0.8 | 0.85 | 3 | 1.50 | 3.825 | |
| Condition E | - | - | 4 | 1.50 | - | |
| Degradation Condition | Physical and Visual Assessment | Illustrative Example |
|---|---|---|
| Condition A (kn = 0) | Complete mortar surface with no deterioration, with surface even and uniform. No visible cracking or cracking ≤ 0.1 mm. Uniform colour and no dirt. No detachment of elements. |  |
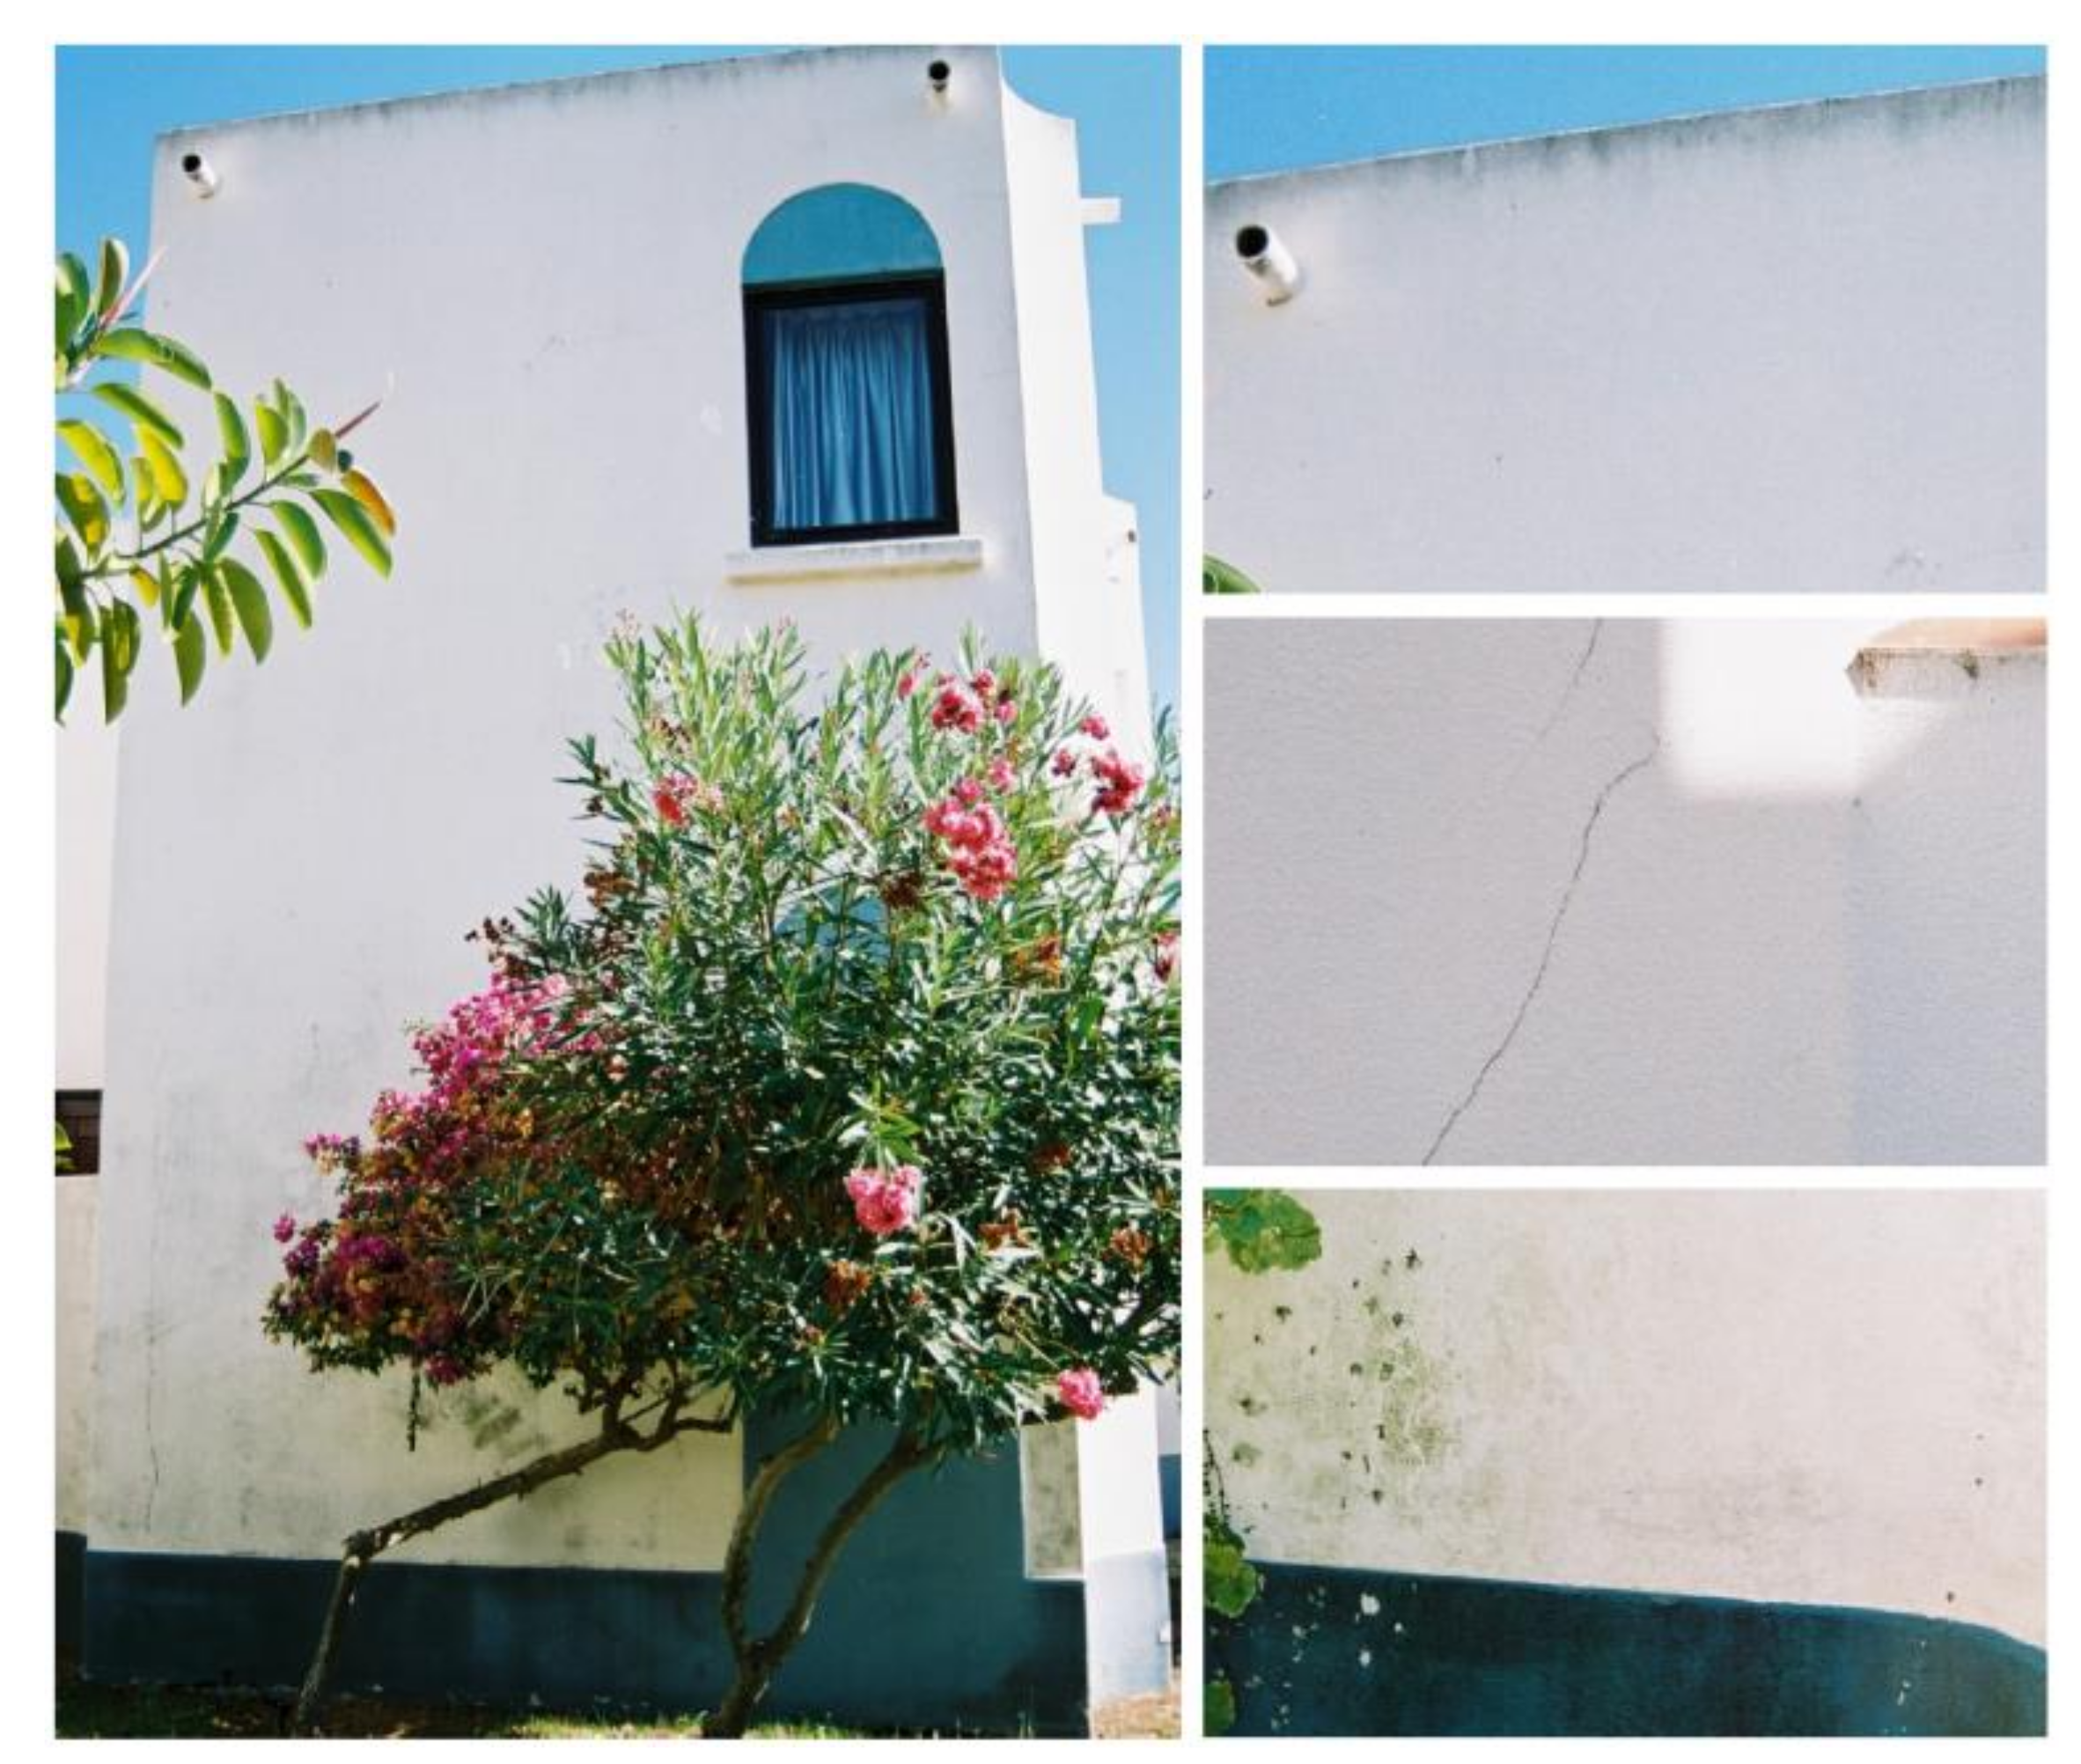
| Condition B (kn = 1) | Non-uniform mortar surface with capillary cracking (0.1 to 0.25 mm). Slight stains in localized areas, mainly dirt. |  |
| Condition C (kn = 2) | Non-uniform mortar surface with likelihood of hollow localized areas determined by percussion, but no signs of detachment. Small cracking (0.25 to 1.0 mm) in localized areas. Changes in the general colour of the surface with a potential presence of microorganisms. |  |
| Condition D (kn = 3) | Mortar with localized detachments or perforations, revealing a hollow sound by percussion. Detachments only in the socle. Easily visible cracking (1 to 2 mm). Dark stains of damp and dirt, often with microorganisms and algae. |  |
| Condition E (kn = 4) | Incomplete mortar surface due to detachments and falling of mortar patches. Wide or extensive cracking (≥ 2 mm). Very dark stains of damp and dirt, often with microorganisms and algae. |  |
| Degradation Condition | Stains | Cracking | Loss of Adhesion |
|---|---|---|---|
| Condition A | 0.00 | 0.00 | 0.00 |
| Condition B | 0.67 | 1.00 | 1.50 |
| Condition C | 0.67 | 1.00 | 1.50 |
| Condition D | 0.67 | 1.00 | 1.50 |
| Condition E | 0.67 * | 1.50 | 1.50 |
| Degradation Condition | Severity of Degradation, Sw |
|---|---|
| Condition A (no degradation) | |
| Condition B (good) | |
| Condition C (slight degradation) | |
| Condition D (moderate degradation) | |
| Condition E (generalized degradation) |
| Defects | (%) | |||||
|---|---|---|---|---|---|---|
| Visual, Av | Condition B | - | - | 1 | 0.13 | - |
| Condition C | 40.3 | 30.24 | 2 | 0.13 | 7.862 | |
| Condition D | - | - | 1 | 0.13 | - | |
| Condition E | - | - | 1 | 0.13 | - | |
| In joints, Aj | Condition B | - | - | 1 | - | - |
| Condition C * | 20 | 15 | 2 | 0.25 | 7.500 | |
| Condition C ** | 10 | 7.50 | 2 | 1 | 15.000 | |
| Condition D | - | - | 3 | - | - | |
| Condition E | - | - | 4 | - | - | |
| Bound-to-substrate, Af | Condition B | - | - | 1 | 1.20 | - |
| Condition C | 10 | 7.50 | 2 | 1.20 | 18.000 | |
| Condition D | - | - | 3 | 1.20 | - | |
| Condition E | - | - | 4 | 1.20 | - | |
| Loss-of-integrity, Ai | Condition B | - | - | 1 | 1 | - |
| Condition C | 10.8 | 8.10 | 2 | 1 | 16.200 | |
| Condition D | 20 | 15 | 3 | 1 | 45.000 | |
| Condition E | - | - | 4 | 1 | - | |
| Degradation Condition | Anomalies | ka,n | % Area of NSC Affected | Severity of Degradation (%) | |
|---|---|---|---|---|---|
| A (kn = 0) | No visible degradation | - | - | Sw ≤ 1 | |
| B (kn = 1) | Visual or surface degradation anomalies | Surface dirt | 0.13 | >10 | 1 < Sw ≤ 8 |
| Moisture stains/localised stains/colour change | 0.13 | ≤15 | |||
| Flatness deficiencies | 0.13 | ≤10 | |||
| Loss-of-integrity anomalies | Material degradation * ≤ 1% plate thickness | 1.00 | - | ||
| Material degradation * ≤ 10% plate thickness Cracking width ≤ 1 mm | 1.00 | ≤20 | |||
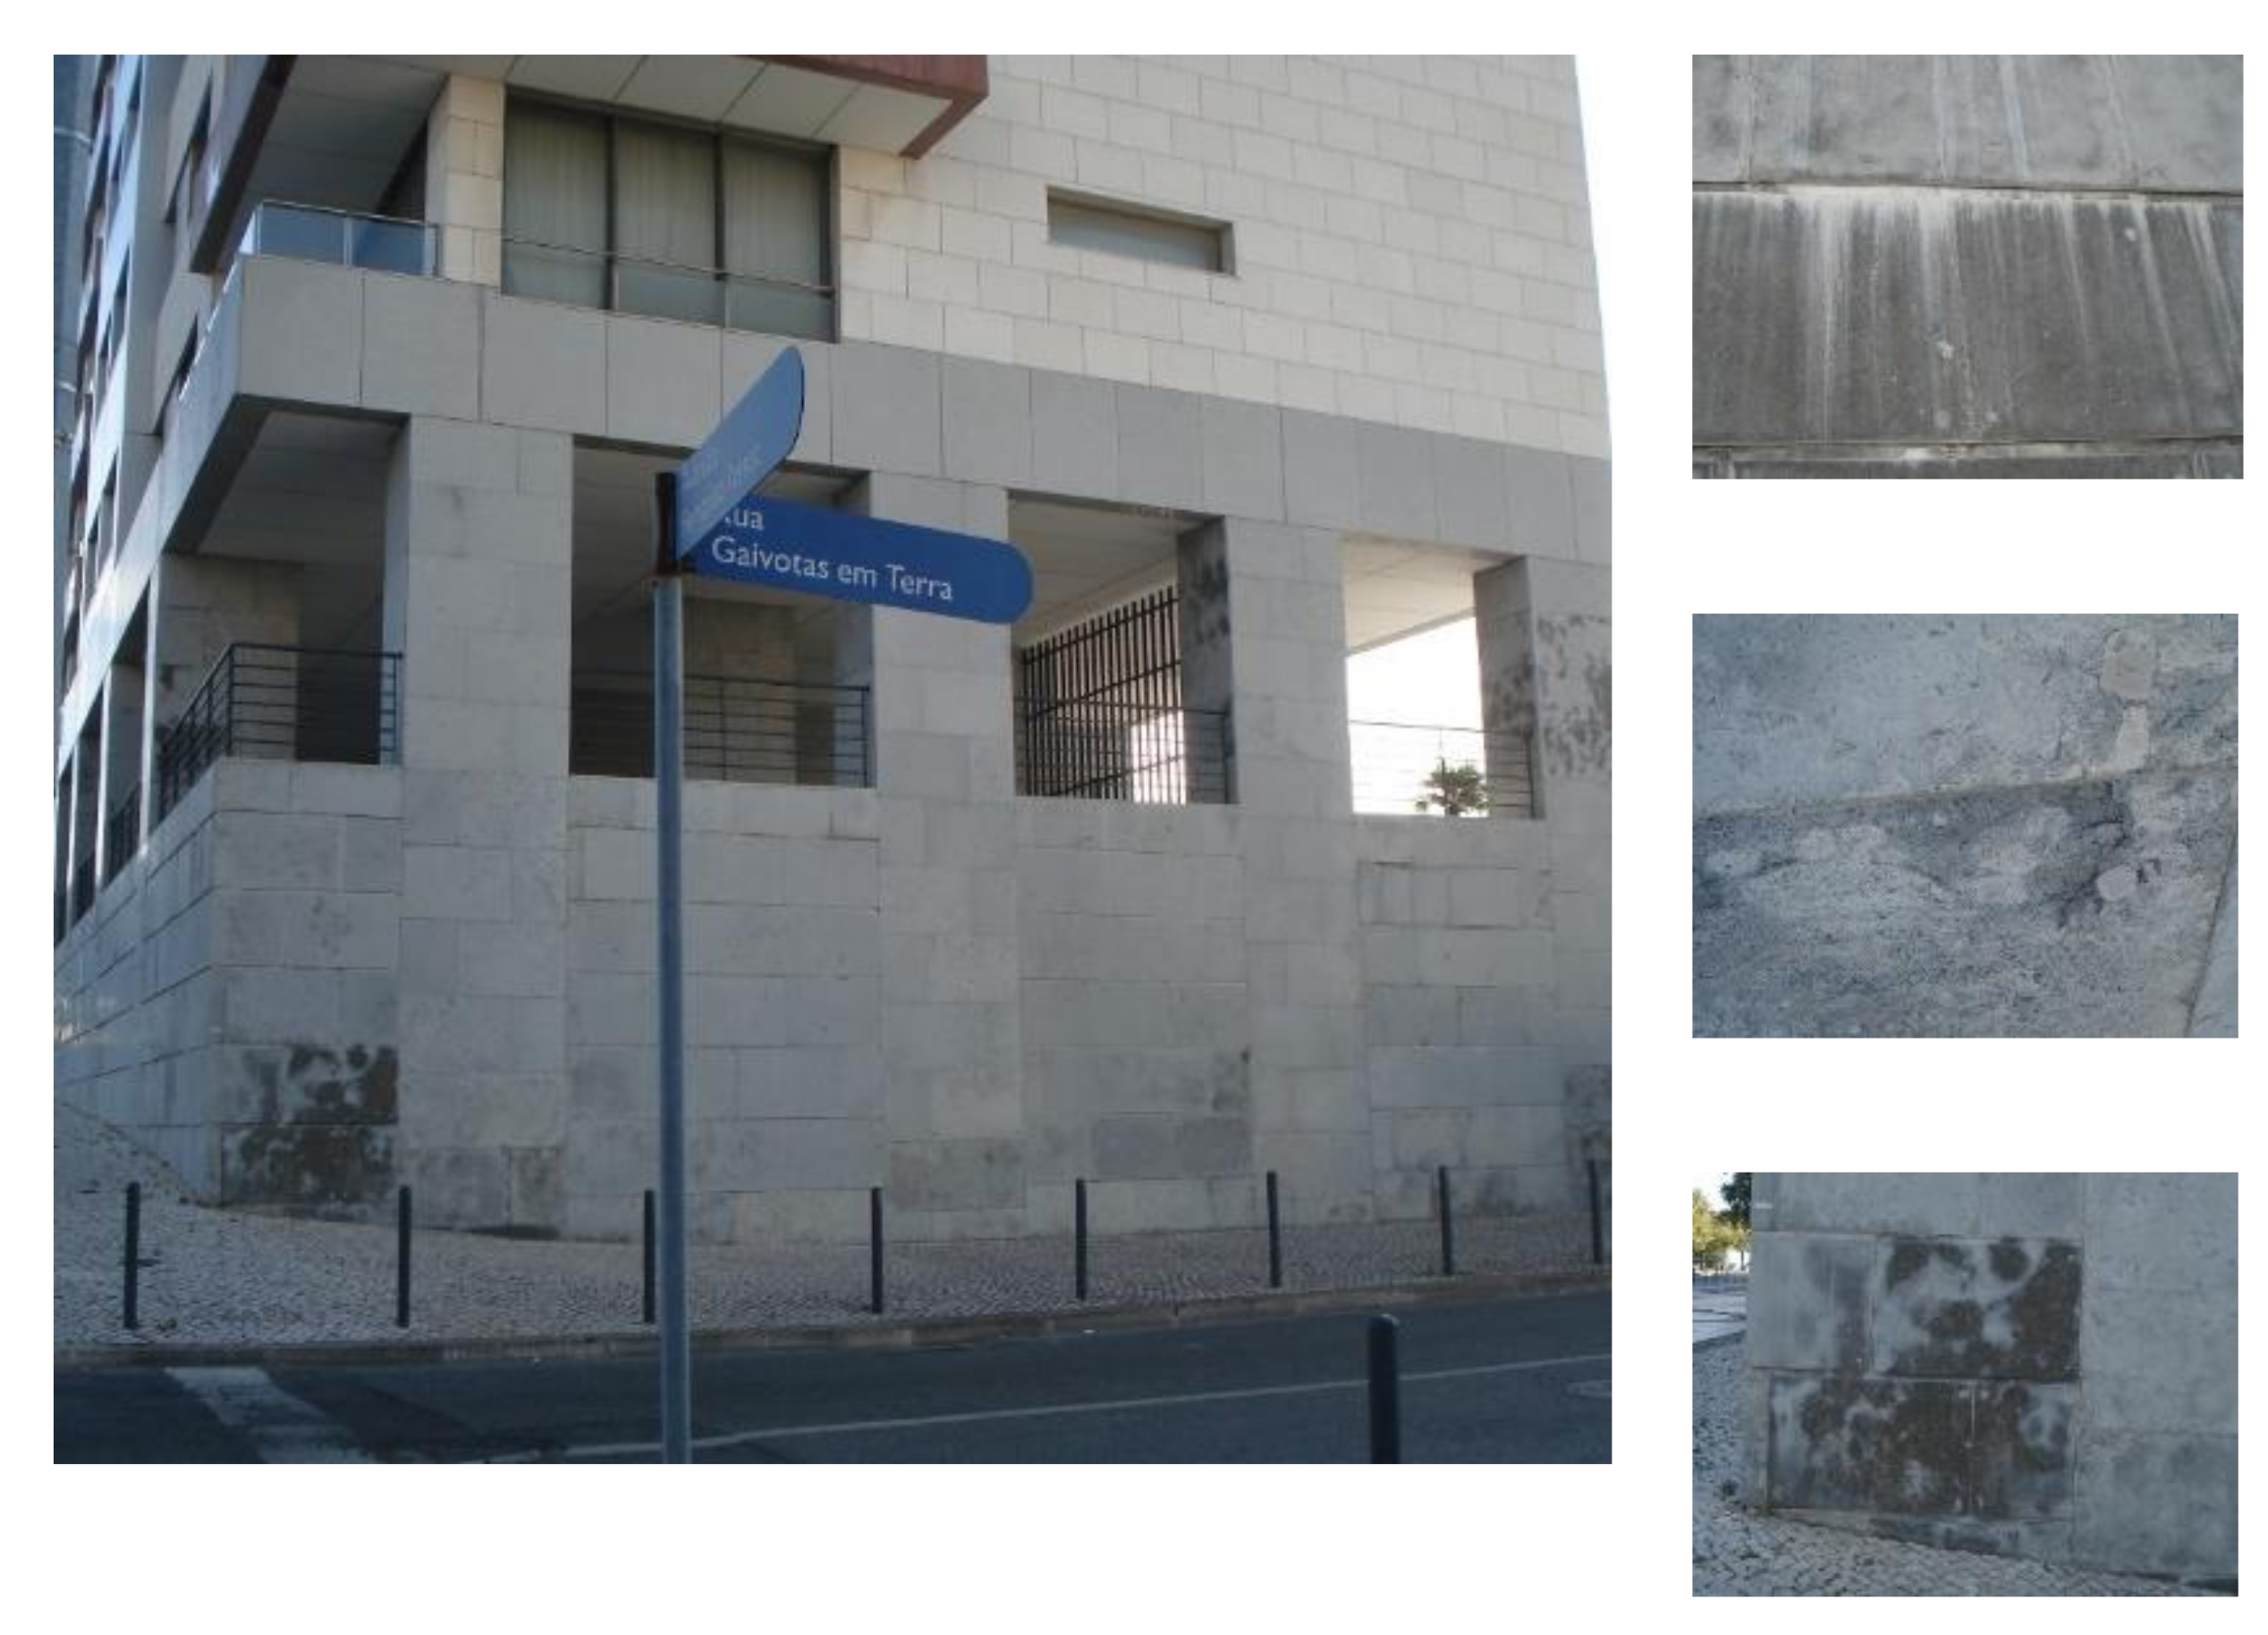
| C (kn = 2) | Visual or surface degradation anomalies | Moisture stains/localised stains/colour change | 0.13 | >15 | 8 < Sw ≤ 20 |
| Moss, lichen, algae growth/parasitic vegetation/efflorescence | 0.13 | ≤30 | |||
| Flatness deficiencies | 0.13 | >10 and ≤50 | |||
| Joint anomalies | Joint material degradation | 0.25 | ≤30 | ||
| Material loss-open joint | 1.00 | ≤10 | |||
| Bond-to-substrate anomalies | Scaling of stone near the edges Partial loss of stone material | 1.20 | ≤20 | ||
| Loss-of-integrity anomalies | Material degradation * ≤ 10% plate thickness Cracking width ≤ 1 mm | 1.00 | >20 | ||
| Material degradation * > 10% and ≤ 30% plate thickness Cracking width > 1 mm and ≤ 5 mm | 1.00 | ≤20 | |||
| Fracture | 1.00 | ≤5 | |||
| D (kn = 3) | Visual or surface degradation anomalies | Moss, lichen, algae growth/parasitic vegetation/efflorescence | 0.13 | >30 | 20 < Sw ≤ 45 |
| Flatness deficiencies | 0.13 | >50 | |||
| Joint anomalies | Joint material degradation | 0.25 | >30 | ||
| Material loss-open joint | 1.00 | >10 | |||
| Bond-to-substrate anomalies | Scaling of stone near the edges Partial loss of stone material | 1.20 | >20 | ||
| Loss of adherence | 1.20 | ≤10 | |||
| Loss-of-integrity anomalies | Material degradation * > 10% and ≤ 30% plate thicknessCracking width > 1 mm and ≤ 5 mm | 1.00 | >20 | ||
| Material degradation * > 30% plate thickness Cracking width > 5 mm | 1.00 | ≤20 | |||
| Fracture | 1.00 | >5 and ≤10 | |||
| E (kn = 4) | Bond-to-substrate anomalies | Loss of adherence | 1.20 | >10 | Sw > 45 |
| Loss-of-integrity anomalies | Material degradation * > 30% plate thickness Cracking width > 5 mm | 1.00 | >20 | ||
| Fracture | 1.00 | >10 | |||
| Degradation Condition | Severity of Degradation, Sw |
|---|---|
| Condition A (no degradation) | |
| Condition B (good) | |
| Condition C (slight degradation) | |
| Condition D (moderate degradation) | |
| Condition E (generalized degradation) |
| ID (from Neto, 2008) | Sw (Neto, 2008) | Sw (Silva, 2009) | Sw (Neto, 2008)/Sw (Silva, 2009) | ΔSw |
|---|---|---|---|---|
| Ed. A.1 | 2.1% | 2.1% | 1.00 | 0.00% |
| Ed. Q.2 | 1.8% | 1.8% | 1.00 | 0.00% |
| Ed. R.3 | 1.9% | 1.9% | 1.00 | 0.00% |
| Ed. T.2 | 2.1% | 2.1% | 1.00 | 0.00% |
| Ed. BB.4 | 0.6% | 0.6% | 1.00 | 0.00% |
| Ed. BB.5 | 1.1% | 1.1% | 1.00 | 0.00% |
| Ed. I.1 | 2.0% | 2.0% | 0.98 | 0.03% |
| Ed. H.3 | 1.6% | 1.5% | 1.03 | 0.05% |
| Ed. E.2 | 2.1% | 2.0% | 1.05 | 0.10% |
| Ed. F.2 | 1.1% | 1.2% | 0.87 | 0.16% |
| Ed. E.1 | 2.1% | 1.9% | 1.11 | 0.21% |
| Ed. I.3 | 1.3% | 1.1% | 1.20 | 0.21% |
| Ed. R.2 | 2.1% | 1.9% | 1.11 | 0.21% |
| Ed. F.1 | 1.1% | 1.4% | 0.79 | 0.29% |
| Ed. P.2 | 2.0% | 1.7% | 1.19 | 0.32% |
| Ed. Q.1 | 1.7% | 1.4% | 1.23 | 0.32% |
| Ed. BB.6 | 2.4% | 2.7% | 0.88 | 0.32% |
| Ed. I.2 | 4.3% | 3.9% | 1.10 | 0.40% |
| Ed. R.1 | 2.1% | 1.7% | 1.23 | 0.40% |
| Ed. Z.2 | 1.8% | 2.3% | 0.81 | 0.43% |
| Ed. Z.1 | 1.1% | 1.5% | 0.71 | 0.43% |
| Ed. T.3 | 0.8% | 1.3% | 0.63 | 0.47% |
| Ed. Z.3 | 2.1% | 2.7% | 0.80 | 0.54% |
| Ed. O.1 | 4.1% | 3.5% | 1.16 | 0.56% |
| Ed. K.4 | 3.0% | 2.4% | 1.28 | 0.66% |
| Ed. H.1 | 1.2% | 0.5% | 2.26 | 0.68% |
| Ed. T.1 | 1.5% | 2.2% | 0.68 | 0.70% |
| Ed. G.1 | 2.1% | 2.8% | 0.73 | 0.77% |
| Ed. D.3 | 0.9% | 0.1% | 11.58 | 0.78% |
| Ed. S.1 | 2.1% | 3.0% | 0.72 | 0.83% |
| Ed. K.3 | 2.0% | 2.9% | 0.70 | 0.85% |
| Ed. Q.3 | 2.0% | 2.8% | 0.70 | 0.86% |
| Ed. B.1 | 1.9% | 1.0% | 2.00 | 0.96% |
| Ed. CC.2 | 1.8% | 2.7% | 0.64 | 0.96% |
| Ed. KK.1 | 3.4% | 2.3% | 1.49 | 1.13% |
| Ed. AA.3 | 10.7% | 9.5% | 1.13 | 1.21% |
| Ed. U.1 | 4.5% | 3.3% | 1.38 | 1.23% |
| Ed. H.2 | 2.3% | 1.0% | 2.36 | 1.31% |
| Ed. AA.2 | 10.8% | 9.3% | 1.16 | 1.50% |
| Ed. D.2 | 2.0% | 0.4% | 4.85 | 1.55% |
| Ed. O.3 | 0.3% | 1.9% | 0.17 | 1.57% |
| Ed. K.1 | 3.3% | 1.6% | 1.99 | 1.63% |
| Ed. U.3 | 3.4% | 1.7% | 1.98 | 1.70% |
| Ed. D.1 | 2.0% | 0.1% | 14.22 | 1.81% |
| Ed. J.2 | 3.4% | 1.5% | 2.29 | 1.93% |
| Ed. K.2 | 2.7% | 0.6% | 4.20 | 2.06% |
| Ed. AA.1 | 10.7% | 8.5% | 1.26 | 2.23% |
| Emerging Technologies | ||||||
|---|---|---|---|---|---|---|
| TLS | DIP | UAV | IRT | PRS | ||
| Technical Features | Mapping stains | Only suitable with other technologies (−) | Suitable (+) | Suitable (+) | Only suitable for some stains (−) | Suitable (+) |
| Mapping cracking | Suitable (+) | Suitable (+) | Suitable (+) | Only suitable for some cracking (−) | Suitable (+) | |
| Mapping loss of adhesion | Suitable, in case of façade geometry change (−) | Unsuitable, if there is no image change (−) | Unsuitable, if there is no image change (−) | Suitable (+) | Unsuitable, if there is no image change (−) | |
| Measure the crack thickness | Suitable (+) | Suitable (+) | Only suitable combined with other technologies (−) | Unsuitable (−) | Suitable (+) | |
| Quantify defect area | Only suitable combined with other technologies (−) | Suitable (+) | Only suitable combined with other technologies (−) | Only suitable combined with other technologies (−) | Suitable (+) | |
| Survey in tall buildings | Unsuitable, with acquisition from the ground (−) | Unsuitable, with acquisition from the ground (−) | Suitable (+) | Unsuitable, with acquisition from the ground (−) | Unsuitable, with acquisition from the ground (−) | |
| Access to the facade surface | Unsuitable, with narrow streets around (−) | Only suitable if image acquisition is done by drone (−) | Suitable (+) | Unsuitable, with narrow streets around (−) | Unsuitable, with narrow streets around (−) | |
| Weather conditions | Independent (+) | Dependent (−) | Dependent (−) | Dependent (−) | Dependent (−) | |
Publisher’s Note: MDPI stays neutral with regard to jurisdictional claims in published maps and institutional affiliations. |
© 2021 by the authors. Licensee MDPI, Basel, Switzerland. This article is an open access article distributed under the terms and conditions of the Creative Commons Attribution (CC BY) license (http://creativecommons.org/licenses/by/4.0/).
Share and Cite
Dias, I.S.; Flores-Colen, I.; Silva, A. Critical Analysis about Emerging Technologies for Building’s Façade Inspection. Buildings 2021, 11, 53. https://doi.org/10.3390/buildings11020053
Dias IS, Flores-Colen I, Silva A. Critical Analysis about Emerging Technologies for Building’s Façade Inspection. Buildings. 2021; 11(2):53. https://doi.org/10.3390/buildings11020053
Chicago/Turabian StyleDias, Ilídio S., Inês Flores-Colen, and Ana Silva. 2021. "Critical Analysis about Emerging Technologies for Building’s Façade Inspection" Buildings 11, no. 2: 53. https://doi.org/10.3390/buildings11020053