Article

Tests and Simulation of the Bond-Slip between Steel and Concrete with Recycled Aggregates from CDW

Instituto Superior Técnico, University of Lisbon, Av. Rovisco Pais 1, 1049-001 Lisboa, Portugal
*
Author to whom correspondence should be addressed.
Buildings 2021, 11(2), 40; https://doi.org/10.3390/buildings11020040
Submission received: 18 December 2020 / Revised: 15 January 2021 / Accepted: 19 January 2021 / Published: 26 January 2021
(This article belongs to the Collection Utilization of Waste Materials in Building Engineering)

Abstract

:
This works intends to analyze, experimentally and numerically, the bond-slip behavior between steel and concrete made with recycled aggregates (RA) from construction and demolition waste (CDW) from several recycling plants in Portugal. Pull-out tests performed in concrete mixes with RA from CDW are described and the main results (bond strength, bond-slip curves and failure modes) are shown and discussed. Additionally, a comparison between experimental and analytical (using equations from the literature) results is made. Afterwards, finite element (FE) models using Abaqus are developed and compared with the experimental results. The interface behavior between steel and concrete follows that prescribed by the CEB-FIP Model Code and uses as input experimental results. After validation, the models show good results when extended to predict the bond-slip behavior of the remaining concrete mixes studied. It is generally concluded that, per each 10% of natural aggregates replaced with RA from CDW, the bond strength decreases in circa 3% (numerically) to 5% (experimentally). CEB-FIP Model Code equations are shown to be able to predict bond strength and, when used in FE models, to lead to accurate simulation of the bond-slip response of steel and concrete with RA from CDW: the average ratio between numerical and experimental bond strengths is 0.95. In the scope of the FE models developed, a simple equation to be used along with those prescribed by CEB-FIP, which accounts for fraction and ratio of aggregates replaced, is put forward, as a first approach, showing good results.

1. Introduction

High quantities of natural resources and energy are consumed annually by the construction industry leading to a high generation of construction and demolition waste (CDW). This waste stream is one of the highest fractions of the total waste generated in the European Union: about 30% of the 3000 million tons generated every year [1]. An attempt to overcome this issue has been made by the construction industry by means of recycling and re-introducing CDW into the production stream. Such an approach has shown both economic and environmental viability [2,3], with the additional advantage of reducing the extraction of raw materials, besides the obvious reduction of the volume of waste placed into landfills. Still, CDW are seldom used as recycled aggregates (RA) for concrete production and are mostly used as flexible road pavement sub-bases. This stems from the fact that RA from CDW generally exhibit worse properties than those of natural aggregates (NA) due to their higher variability in composition.
In general, RA tend to be more porous and to have more elongated shapes and higher roughness than NA [4]. This naturally affects the properties of the concrete mixes produced with such aggregates: higher amounts of water are needed to maintain workability, which adds to the higher porosity of the aggregates in contributing to more porous recycled concretes. The increase in porosity of concrete leads to increases in its water absorption [5,6,7,8], carbonation depth [7,8,9] and chloride-ion penetration [7,8,10], thus decreasing its durability. Consequently, recycled aggregate concrete generally exhibits lower mechanical and durability-related properties than natural aggregate concrete. Most researchers conclude that the mechanical properties, such as compressive and tensile strengths and Young’s modulus, of concrete with RA from several CDW streams such as mixed CDW [10,11,12,13], concrete [14,15], ceramics [16,17,18] and glass [19,20] are lower than those of natural aggregate concrete. However, if replacement ratios of NA with RA from CDW are maintained below 25%, some researchers [12,15] report that the obtained concrete mixes can present properties similar or even slightly better than those of their natural aggregate concrete counterparts. Due to the generally inferior performance of concrete with RA from CDW compared to natural aggregate concrete, some authors also investigated the possibility of mitigating the outcomes of using RA by incorporating additions, such as fly ash [21] or silica fume [22], or steel [23] or polypropylene [24] fibers in the concrete mixes. It is shown that additions contribute to increase the compactness of concrete and enhance the interfacial transition zone (ITZ), thus improving both mechanical and durability-related properties [21,22]. In turn, fibers are found to be able to increase the compressive and tensile strengths as well as the toughness of concrete with RA from CDW [23,24].
Besides the evaluation of the properties of concrete, the knowledge of the quality of the bond between steel rebars and concrete with RA is essential to study the use of these aggregates in structural applications. Bond is a phenomenon that is fundamentally associated with the installation of tangential stresses in concrete, and is related to the compressive and tensile strengths. Bond strength mainly stems from three distinct components: adhesive strength, mechanical strength and friction [25]. Adhesive strength consists of the shear strength in the steel–concrete interface zone, caused by chemical and micro-mechanical interconnections. As soon as there are relative displacements between the steel and the surrounding concrete, in an initial phase of the transmission of forces, these interconnections are broken. According to Youlin [26], this effect results in a strength of about 0.4 to 0.8 MPa, therefore having a minor role on the maximum bond capacity. The mechanical strength is due to the anchoring effect conferred by the existing ribs on the steel surface [27]. This effect is responsible for the effective transfer of forces and, consequently, for the stresses installed in the concrete [28]. Friction is caused by the relative displacement between the two surfaces and depends on the roughness of the contact surfaces. In turn, the roughness of contact surfaces depends on factors such as the oxidation state of the rebar or the composition of concrete. When ribbed rebars are used, this effect only stands out after failure by mechanical adhesion, i.e., when the breaking surfaces are already defined and the sliding of the rebar is rather high [28].
Steel–concrete bond mechanisms have been extensively studied in conventional concrete. Several authors highlight the distinct bond-slip behavior between concrete and ribbed or plain steel rebars. The former case may be relevant for the analysis of older constructions in which such rebars were often used [29]. In the scope of conventional concrete, D’Amato et al. [30] and Braga et al. [31] conducted relevant numerical investigations on the bond-slip of steel rebars. D’Amato et al. [30] showed that the model they developed can accurately capture the axial slip of rebars with lower computational cost than a more refined model by assuming a linear slip field along the steel rebar. Later, Braga et al. [31] showed that their newly developed constitutive model, which includes both the relative slip between bars and concrete and the steel post-yielding (hardening) behaviors, is suitable to be implemented in engineering software. However, there are still few investigations that assess the bond behavior between steel and concrete with RA. The results collected in the available literature are quite scattered. Butler et al. [32] evaluated the influence of incorporating coarse RA in the steel–concrete bond behavior, having observed a decrease of approximately 10% of the bond strength with the use of 100% coarse RA relative to a reference concrete. The authors justified the result with the (negative) influence of the coarse RA on the fracture energy of concrete. Several studies indeed report that coarse aggregates have a high influence on the fracture energy of concrete, suggesting that the higher the strength of the aggregates, the higher the values of the fracture energies of the produced concrete [33]. Bai et al. [34] reported a 25% decrease in the steel–concrete bond strength with full replacement of NA with RA. On the other hand, Zuhud [35] obtained an increase in the steel–concrete bond strength with the incorporation of RA in concrete, justifying this result with the higher roughness of RA. Hence, this author states that the higher roughness of RA may cause a higher friction between RA and the ribbed rebars.
As seen above, the urgent need to properly recycle CDW has led to a significant increase in the number of investigations on the use of this waste in concrete and in particular on the bond-slip behavior of steel and concrete with RA. However, in order to better understand such behavior between steel and concrete produced with CDW, concrete with RA from concrete, ceramics, glass, plastics, among other materials should be studied. Furthermore, attention must also be given to the physical and chemical properties of RA from CDW, which vary widely, as well as to the size of the RA used (replacement in the fine or in the coarse fraction). Such an integrated approach has seldom been used in previous works, thus it is the basis of this work. With respect to finite element modelling, investigations on the bond-slip behavior between steel rebars and concrete with mixed CDW are, to the best of the authors’ knowledge, still absent. In this scope, Guerra et al. [36] studied, experimentally and numerically, the bond behavior between steel rebars and concrete, but the RA stemmed from concrete only (which was previously produced in a laboratory). Very recently, Bai and Liu [37] and Liu et al. [38] studied numerically the bond-slip of composite RA concrete-steel members. The first authors addressed the bond-slip behavior of RA concrete-filled steel tubes with a circular cross-section, whereas the second authors investigated the bond-slip behavior of concrete-encased steel section members. Hence, this study intends to contribute to the understanding of the bond-slip behavior between steel and concrete with RA from CDW by presenting experimental and numerical results on this topic. For this purpose, several concrete mixes with RA from distinct recycling plants were analyzed. It is deemed that only by considering several samples is it possible to understand how these RA influence this steel–concrete interaction property. Afterwards, with the obtained experimental results, the authors proceeded with the numerical simulation that allowed the prediction of the bond-slip behavior between steel and concrete with RA from CDW. This extensive and relevant process constitutes the main innovation of the work reported. Furthermore, its outcomes are expected to further contribute to aid the construction industry in the acceptance and effective use of RA from CDW in concrete.
Firstly, the aggregates and concrete mixes are experimentally characterized. Then, experimental tests and results of the concrete mixes in the hardened state are presented with emphasis on the bond-slip behavior. Afterwards, finite element models to simulate the pull-out tests are developed, compared with the experimental results and used to predict the bond-slip behavior of concrete with RA from CDW. Finally, the main conclusions of the work are summarized.

2. Experimental Campaign

In this section the materials used in the production of the studied concrete mixes, particularly the RA from CDW, are firstly presented and characterized in detail. Then, the different concrete mixes and production processes are identified and explained. Finally, the mechanical tests carried out with the aim of characterizing the mechanical properties of the concrete mixes and the bond-slip behavior between steel and concrete with RA from CDW are described.

2.1. Materials

In this study, NA and RA from four Portuguese CDW recycling plants Valnor (Avis, Portugal), Retria (Valongo, Portugal), Vimajas (Pero Pinheiro, Portugal) and Ambilei (Leiria, Portugal) were used in concrete production. River sand (Areipor, Bucelas, Portugal) was used as fine NA and crushed limestone (Soarvamil, Corroios, Portugal) as coarse NA. With respect to coarse recycled aggregates (CRA), those from Valnor and Retria were used in concrete production, whereas regarding fine recycled aggregates (FRA), those from Vimajas and Ambilei were considered. In all concrete mixes, CEM I 42.5 R cement (Secil, Outão, Portugal) and tap water were used. Table 1 shows the composition of all RA used, which allows an understanding of their characteristics as well as better predicting and understanding the performance of the obtained concrete mixes. It can be seen that RA have a content of “concrete, mortar and natural stone” between 69% and 84% and a significantly variable (between 1% and 29%) content of “masonry—clay materials”.
The experimental campaign started with the detailed physical and chemical analyses of all the aggregates according to the standard EN 12620 “Aggregates for concrete”. Particle density and water absorption (according to NP EN 1097−6), apparent density and void volume (according to NP EN 1097−3), shape index (according to NP EN 933−4) and resistance to fragmentation as per the Los Angeles method (according to NP EN 1097−2) were obtained. The following chemical properties were also evaluated, according to NP EN 1744−1: water soluble chloride content, water soluble sulfate content, acid soluble sulfate content, general sulfur content, light contaminant content, humus and water solubility. Finally, the composition of all recycled aggregates was visually analyzed.
Table 2 and Table 3 show the results of the physical characterization of all aggregates used. It can be seen that RA have a lower density and higher water absorption than those of NA due to their composition and higher porosity. These results already imply that a higher water content is required in concrete mixes with RA if the same workability is expected in all concrete mixes. If FRA and CRA are compared, it can be concluded that the water absorption of the former is higher than that of the latter. The higher porosity of RA, which explains their higher water absorption, is also responsible for their lower density. With the exception of aggregates from the Ambilei’s recycling plant, all RA have a higher shape index than NA’s, which can also lead to a lower workability of mixes with RA. Finally, it was also found that RA have a higher level of fragmentation (Los Angeles wear test) than NA, which can, in part, be responsible for the attainment of lower strength concrete.
The results of the chemical tests on RA (Table 4) show that, apart from the content of light contaminants and from the water-soluble chlorides in RA from Vimajas, all the remaining generally meet the requirements of EN 12620 (2008).
In this study, a total of 13 concrete mixes were produced: (i) a reference concrete, RC, and (ii) concrete mixes with 10%, 50% and 100% of coarse NA replaced (in volume) with CRA (from two of the four recycling plants) and (iii) concrete mixes with 10%, 50% and 100% of fine NA replaced (in volume) with FRA (from the remaining two recycling plants). The replacement of NA with RA was made sieve by sieve in order to keep constant the particle size distribution of the aggregates in the RC mix (determined with Faury’s method—Table 5). No admixtures or additions were used in the production of the concrete mixes in order to exclusively assess the influence of RA on their behavior. Finally, it should be referred that the target strength and workability classes of the RC were, respectively, C30/37 and S3 (125 ± 15 mm).
In order to obtain concrete mixes with the same applicability, it was defined that all mixes produced should have the same workability as the RCs. Table 6 shows the workability measured by slump using the Abram’s cone (EN 12350−2) and the effective water/cement (w/c) ratio of each concrete. It can be observed that, generally, the higher the RA percentage, the higher the effective w/c ratio used. However, the increase in water content varies depending on the RA used, due to the variation in their composition. For instance, there is a significant increase in the effective w/c ratio of mixes with FRA from Vimajas, due to the high clay content of the RA from this recycling plant (Table 1). It is known that these fine particles adsorb large amounts of water, causing the need to increase the w/c ratio in order to maintain the workability of these mixes.

2.2. Experimental Procedures

In order to characterize the performance of concrete with RA from CDW, besides the pull-out tests (main focus of this work), several other tests were performed. The compressive strength (in cubes with 150 mm of edge) and splitting tensile strength (in cylinders with 150 mm of diameter and 300 mm of heigh) and Young’s modulus (in cylinders with 150 mm of diameter and 300 mm of height) of all concrete mixes were determined at 28 days in accordance, respectively, with EN 12390−3, EN 12390−3 and LNEC E397. Since this work is part of a broader experimental campaign, pull-out tests were only performed at 56 days. At this age, cubic specimens (with 150 mm of edge) from each concrete mix were also tested in compression. The pull-out tests were carried out in accordance with RILEM 7.11.128 on cubic specimens with an edge of 120 mm, where A500 NR SD steel rebars with a diameter of 12 mm were embedded along their central axis. A length of 30 mm was left free at the end opposite to that of load application to read the displacements in some of the tests. A bond length of 100 mm was used, corresponding to approximately 8 times the diameter of the rebars, and PVC tubes were used as bond breakers, near the load application ends, to avoid the onset of premature “cone-shaped” failure modes [39].
Casting of concrete in the specimens subjected to pull-out tests was made in a direction orthogonal to that of the rebar axis, since it is the most representative of actual casting in a construction site. Nevertheless, it is recognized by most of the literature [39,40] that this procedure leads to lower bond stresses between steel and concrete since exudation in the vicinity of rebars leads to porosity and to concrete with lower properties.
Five specimens per concrete mix were tested after 56 days of curing in laboratory environment (average temperature of 20 °C and relative humidity of 60%). An ENERPAC RCH123 hydraulic jack (ENERPAC, Menomonee Falls, WI, USA) and a TML load cell (Tokyo Measuring Instruments Laboratory Co., Ltd., Tokyo, Japan) were used, respectively, for load applying and reading. An LVDT TML displacement transducer (Tokyo Measuring Instruments Laboratory Co., Ltd., Tokyo, Japan) was used to measure the free end displacement in some tests. The bond stress (τ) was obtained by,
τ   =   F π D l b
where F is the applied load, D is the rebar diameter (12 mm) and lb is the bond length (100 mm).

3. Experimental Results and Discussion

3.1. Strength and Stiffness
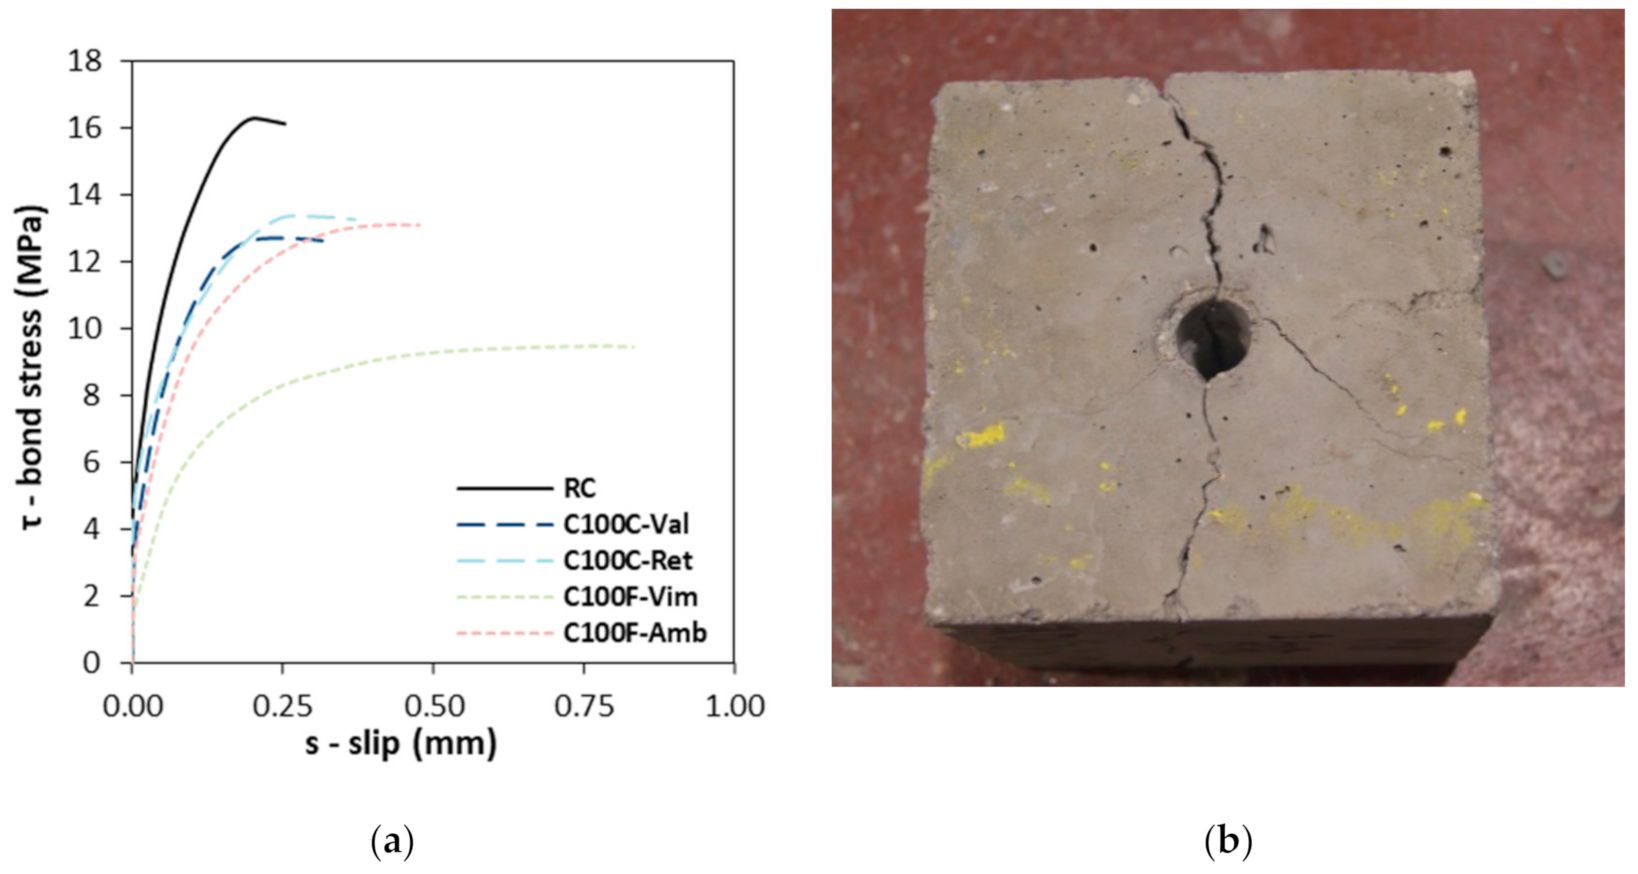
Table 7 shows the compressive strength at 28 days (fcm,28) and 56 days (fcm,56), splitting tensile strength at 28 days (fctm,28) and Young’s modulus at 28 days (Ecm,28) of the concrete mixes. In Table 7 and the following tables, the labelling of the concrete mixes is as follows: (i) “RC” stands for reference concrete and for concrete mixes with RA from CDW; (ii) the first “C” stands for concrete; (iii) the two or three digit number that follows is the percentage replacement of NA with RA from CDW (10, 50 or 100%); (iv) “C” or “F” stand, respectively for coarse or fine fraction (of aggregates replaced); and (v) the last three letters are an abbreviation (“Val”—Valnor, “Vim”—Vimajas, “Amb”—Ambilei and “Ret”—Retria) of the recycling plant from which the RA were collected.
The first observation of Table 7 allows us to conclude that, when the content of RA from CDW increases, all mechanical properties generally decrease. On average, per each 10% increase of RA from CDW in the concrete mixes, at 28 days, the compressive strength, the tensile strength and the Young’s modulus decrease, respectively, between 3.7% and 4.8%, between 3.7% and 6.0%, and between 4.8% and 2.9%. The first values of each interval correspond to decreases when the coarse fraction is replaced and the second to decreases when fine aggregates are replaced. Hence, it can be generally concluded that replacement of the fine fraction results in worse performance than that in the coarse fraction. The lower performance of the concrete mixes with RA from CDW naturally stems from the composition and strength (Table 2 shows that CRA have higher Los Angeles values than NA) of the aggregates but also in part from the fact that the effective w/c ratio had to be increased in the concrete mixes with RA from CDW to maintain the same workability as that of the RC.
The composition (stemming from the origin) of RA also influenced the results since these were collected from different recycling plants. As per concrete mixes with FRA, Table 7 shows that those from Vimajas lead to lower compressive strength than those from Ambilei. This is because the former contains a higher amount of clay materials than the latter. This results in a much higher effective w/c ratio needed, since such fine particles adsorb the mixing water and prevent a good bond between the RA and the cement paste, thus leading to a weakening of concrete. It is emphasized that, in some cases, the use of FRA from Ambilei led to concrete with better properties than some mixes in which CRA were used. This is due to the composition of these FRA, which presents a high amount (84%) of “concrete, mortar and natural stone” and a low amount (l%) of “masonry—clay materials”.

3.2. Bond-Slip

Table 8 presents the maximum bond strength (τmax) obtained for each concrete mix. Additionally, Figure 1a shows the bond stress vs. slip curves (τ vs. s) of the RC, C100C-Val, C100C-Ret, C100F-Vim and C100F-Amb in which these curves were obtained. Both Table 8 and Figure 1a show that, as the content of RA from CDW increases, the bond strength between steel and concrete decreases. It should be referred that, shortly after the maximum bond stress occurred in the specimens, they failed by splitting, as shown in Figure 1b, since no confinement was applied. This justifies the absence of the majority of the descending branches of the τ vs. s curves depicted in Figure 1a.
Considering the influence of RA from CDW on the bond strength, it can be concluded that, on average (and using the results shown in Table 8), for each 10% increase of RA from CDW, the bond strength decreases between 3.9% (coarse fraction) and 6.0% (fine fraction). This can also be observed in Figure 1a, where it is evident that the concrete mixes with replacement of the coarse aggregates exhibit τ vs. s curves more similar (with respect to bond strength and slip for maximum bond stress) to those of the RC. Figure 1a also shows that all curves show a similar qualitative trend: (i) a non-linear ascending branch up to the maximum bond stress and (ii) an initially linear descending branch after the maximum bond stress. However, it can also be noticed that the curves of RC and mixes with CRA from CDW show a more evident descending branch than the curves of mixes with FRA from CDW that exhibit curves in which a plateau can be found prior to the descending portion of the τ vs. s curves. It can be stated that the bond-slip behavior of mixes with FRA from CDW are more akin to those in which plain rebars (i.e., without ribs) are used. This difference in behavior is also visible when the rebars, after testing, are observed. In Figure 2a,b, rebars embedded in an RC and in a C100F-Amb specimen are shown, respectively. As seen there, the amount of concrete crushed up to the point at which the specimens failed by splitting is much higher in the latter than in the former. For RC, the initial position of the ribs is still visible in the concrete specimen, whereas for C100F-Amb the embedment shows a smooth cylindrical (without grooving) surface. This correlates with the higher slip observed for C100F-Amb in Figure 1a. In sum, when RA from CDW were used in concrete, it can be seen that the slip for maximum bond stress increases, especially for FRA and, as stated, the bond strength decreases: s = 0.20 mm for RC, s = 0.24 mm for C100C-Val, s = 0.27 mm for C100C-Ret, s = 0.77 mm for C100F-Vim and s = 0.43 mm for C100F-Amb. Prince and Singh [41] also evaluated the bond-slip behavior between steel and concrete with replacement of NA with RA. These authors obtained slips for maximum bond stresses of the magnitude of those obtained in this work (between 0.38 mm and 0.71 mm). Indeed, concrete mixes with FRA from Vimajas presented the lowest bond strength: when full replacement of fine NA was made with FRA from Vimajas, a decrease of 41.9% of the bond strength was obtained. As for CRA, the highest decrease was obtained when 100% of aggregates from Valnor were used (22.1%), and the difference between families of CRA was much lower than that for FRA. Besides some factors mentioned above (such as a high amount of clay materials, strength of RA and higher w/c ratio needed to maintain workability), the microscopic and durability test performed on FRA from Vimajas [8,42] allowed us to conclude that these were highly porous, thus also leading to a highly porous concrete. Kim and Yun [43] evaluated the bond-slip between steel and concrete with CRA and pointed out that the quality of concrete near the rebars, especially its porosity, highly influences the bond strength obtained.
Unsurprisingly, the percentage variations of bond strength for concrete mixes with RA from CDW (3.9 to 6.0%) are within the range of those found for the decrease of the compressive strength of the concrete mixes (between 3.7% to 4.8%), since in fact most analytical expressions estimate τmax by means of the compressive strength of concrete. Kim and Yun [44] also refer that the prediction of the bond strength by means of the compressive strength of concrete is more appropriate than by means of the tensile strength. Given this, the analytical expressions proposed by Orangun et al. [45] (Equation (2)), Darwin et al. [46] (Equation (3)) and CEB-FIP [47] (Equations (4) and (5)), which were developed for the prediction of bond strengths by means of the compressive strength for natural aggregate concrete, were plotted superimposed with the experimental results obtained in this work in Figure 3, in particular, regarding CEB-FIP [47]. Expressions for both good confinement (Equation (4)) and poor confinement (Equation (5)) are shown,
τ m a x   =   0.083045 f c m 1.2 + 3 C D + 50 D l b
τ m a x   =   0.083045 f c m 1.06 + 2.12 C D + 75 D l b
τ m a x   =   2.5 f c m
τ m a x   =   2.0 f c m
where C is the minimum distance between the axis of the rebar and the edge of the concrete specimen (60 mm). In the equations presented above, fcm’ is the equivalent compressive strength of concrete obtained in cylindrical specimens, which can be estimated from their cubic counterparts by multiplying these values by 0.80 [48].
The CEB-FIP [47] equations correlating compressive and bond strengths (Equations (4) and (5)) are those leading to the best agreement with the experimental results obtained, with the results being in-between them. Additionally, the fact that these equations developed for natural aggregate concrete seem to be extended to estimate the bond strength of mixes with RA from CDW and allows us to conclude that the compressive strength maintains its crucial role in these concrete mixes. If the latter (compressive strength) is known, the former (bond strength) can also be estimated.

4. Description of the Numerical Model

In this section, the numerical model developed to simulate the pull-out tests on concrete with RA from CDW is described. The geometry of the model was the same as that of the specimens tested. Experimental properties were used as input in the definition of materials. As for the bond-slip law, that proposed by the FIB Model Code [47] was considered, as it is also shown to provide good estimates for bond strength, as presented before. A detailed description of these features is presented next.

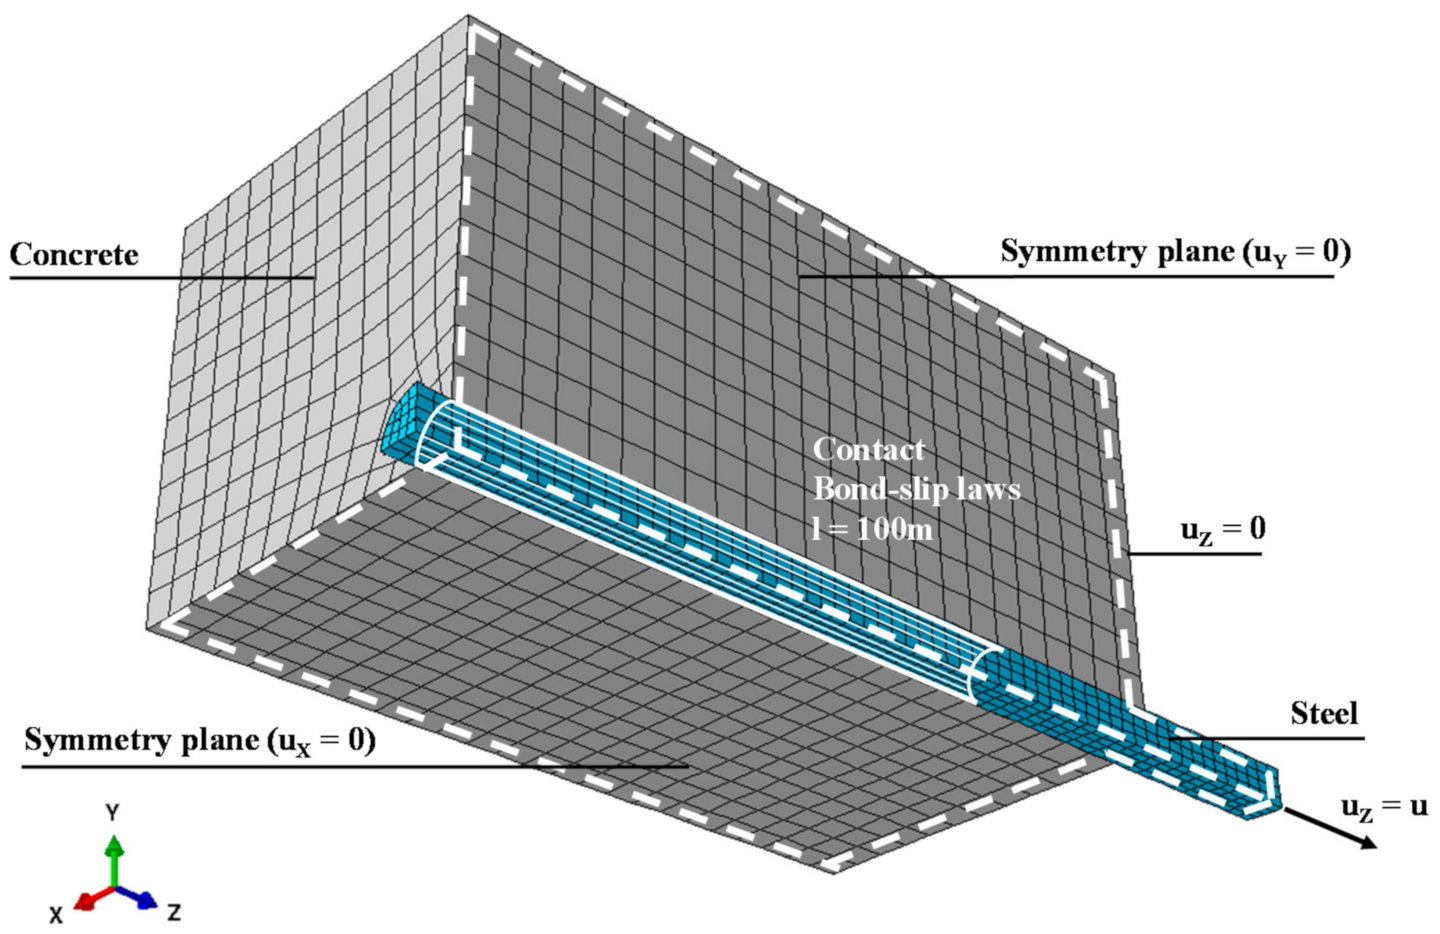
4.1. Geometry and Mesh

Figure 4 shows the geometry and finite element (FE) mesh of the model. Due to the symmetry of the specimens and loading, only one fourth of the geometry was modelled and symmetry boundary conditions were applied. Therefore, nodes belonging to the XZ and YZ planes were prevented from displacing along the Y-axis and X-axis, respectively.
In general, the dimensions of the FEs of steel and concrete were 2.5 mm and 5.0 mm, respectively, and a slightly higher refinement was used at the interface: the number of FE on the contour was set to six. As shown ahead in Section 5.1, devoted to the verification of the models, such discretization proved to be adequate to model this phenomenon. Both steel and concrete were meshed with three-dimensional 8-node solid FE (C3D8 in Abaqus [49] nomenclature). In sum, each model has a total of 4800 FEs.

4.2. Materials

Both steel and concrete were modelled as linear elastic materials since, to capture the bond-slip behavior, such an approach was observed to be sufficient. This is also addressed ahead with more detail in the scope of numerical results (Section 5.1—Verification of the numerical model) for the studied mixes. As for steel, a maximum longitudinal stress obtained numerically (of circa 480 MPa, for the case of RC) was lower than 500 MPa (lower bound of yield stress, minimum characteristic value) evidencing that yielding did not occur. Regarding the elastic properties of steel, the typical values for the Young’s modulus and Poisson’s ratio, respectively of Es = 210 GPa [50] (CEN, 2010b) and νs = 0.30 [50] (CEN, 2010b) were adopted. As for concrete, the experimental values of the Young’s modulus measured for each concrete mix, Ecm (Table 7) were used and a common value for the Poisson’s ratio of νc = 0.20 [48] (CEN, 2010a) was used for all concrete mixes. It is recognized that the Young’s modulus at 28 days used herein is an approximation, since such property at 56 days (when the pull-out tests were conducted) was not determined. Furthermore, the value of Poisson’s ratio for all concrete mixes is also a simplified, but deemed adequate, approximation.

4.3. Bond-Slip

The bond-slip behavior between steel and concrete was modelled based on the law proposed by the FIB Model Code (CEB-FIP, 1990) which reads,
τ   =   τ m a x s / s 1 α ,   f o r   0 s s 1
τ   =   τ m a x ,   f o r   s 1 s s 2
τ   =   τ m a x τ m a x τ f s s 1 s 3 s 2 ,   f o r   s 2 s s 3
τ   =   τ f ,   f o r   s s 3
where τ is the bond stress, τmax the maximum bond stress (bond strength) and τf = 0.15 τmax the minimum bond stress, α is the power of the curve defining the ascending branch of the bond-slip law, which can assume values between 0 (the bond-slip law starts with a constant value of τmax) and 1 (the bond-slip law presents a linear ascending branch), and s1, s2 and s3 are, respectively, the slips at the end of the ascending branch, at the beginning of the descending branch and at the end of the descending branch. The FIB Model Code [47] suggests that α = 0.4 and that τmax = 2.0√fcm’ are used for good bond conditions (e.g., ribbed rebars, as used in this work) and unconfined concrete (failure occurs by concrete splitting, as observed experimentally). Indeed, in the previous section, it was shown that the correlation between compressive strength and bond strength fell between 2.0√fcm’ and 2.5√fcm’. However, since the failure of specimens was by splitting, a factor of 2.0 was considered to be the most appropriate, as recommended by FIB Model Code [47]. It is recalled that in 2.0√fcm’, fcm’ is the equivalent compressive strength of concrete in cylindrical specimens, obtained by multiplying the cubic compressive strength by 0.80 [48]. As seen ahead, both these options (regarding α and estimation of τmax) yield good agreement between numerical and experimental results. The FIB Model Code [47] also proposes that s1 = s2 = 0.60 mm and that s3 = 1.0 mm. The latter was adopted and revealed to be irrelevant for the analyses since all specimens failed by splitting before reaching it. However, the adoption of s1 = s2 = 0.60 mm did not lead to good results, as also shown ahead. Hence, s1 and s2 were calibrated by curve fitting and by the values suggested by the bond-slip curves available (RC, C100C-Val, C100C-Ret, C100F-Vim and C100F-Amb). Additionally, as seen above, two distinct behaviors were observed experimentally: in the RC and in mixes with CRA from CDW, the bond-slip curves presented a descending branch shortly after the peak stress was reached, whereas mixes with FRA showed a portion of the curves similar to that of a plateau before the descending branch occurred. This was accounted for in the numerical models by bringing s1 and s2 closer to each other in the former cases and making them more apart in the latter (see also Table 9).
To implement the bond-slip law in Abaqus [49], contact with cohesive surfaces between the concrete and steel parts was adopted in the same length as that used in the experimental tests, 100 mm. Such an approach implies the definition of the stiffness of the contact (Kτ) as well as damage initiation and evolution of the bond properties. The bond-slip behavior was assumed, in all cases, to be linear elastic up to a slip of s = 0.01 mm and since, in such conditions, τ = Kτ × s, Kτ was determined by dividing the value of τ for s = 0.01 mm by s = 0.01 mm. For slips higher than s = 0.01 mm, the bond-slip curves were implemented by the transformation of the FIB Model Code [47] bond-slip law along with the experimental properties of the concretes into a damage-slip curve, as required by Abaqus [49] in which the damage parameter (D) for each value of slip is obtained in the usual way by D = 1 − τ/(Kτ × s). Table 9 shows the properties adopted for the bond-slip curves of each concrete mix used in the simulations.

4.4. Boundary Conditions, Loading and Analysis Procedure

Regarding boundary conditions, besides those imposed to guarantee symmetry conditions to the model, described above, all the nodes on the face of the concrete part in the side in which loading was imposed (right side in Figure 4) were prevented from displacing along the Z-axis.
Loading was applied by monotonically increasing the displacement along the positive way of Z-axis (Figure 4) of all the nodes on the extremity of the steel part.
Static monotonic physically non-linear analyses with the static general solver in Abaqus [49], which uses the Newton–Raphson incremental-iterative method, were performed in all simulations to obtain the numerical solutions.

5. Numerical Results and Discussion

In this section, the numerical results obtained are presented and discussed in detail. Firstly, the numerical model is verified by comparing the numerical and experimental results. Afterwards, the use of the numerical model is extended to obtain the bond-slip behavior of the remaining concrete mixes, i.e., those which were not used to calibrate the model. For this purpose, a simplified approach, based on the fraction and percentage of replacement of NA with RA from CDW is presented in Section 5.2. It should be emphasized that this proposal should not be viewed as a closed one but as a first attempt to show that such an approach is deemed possible.

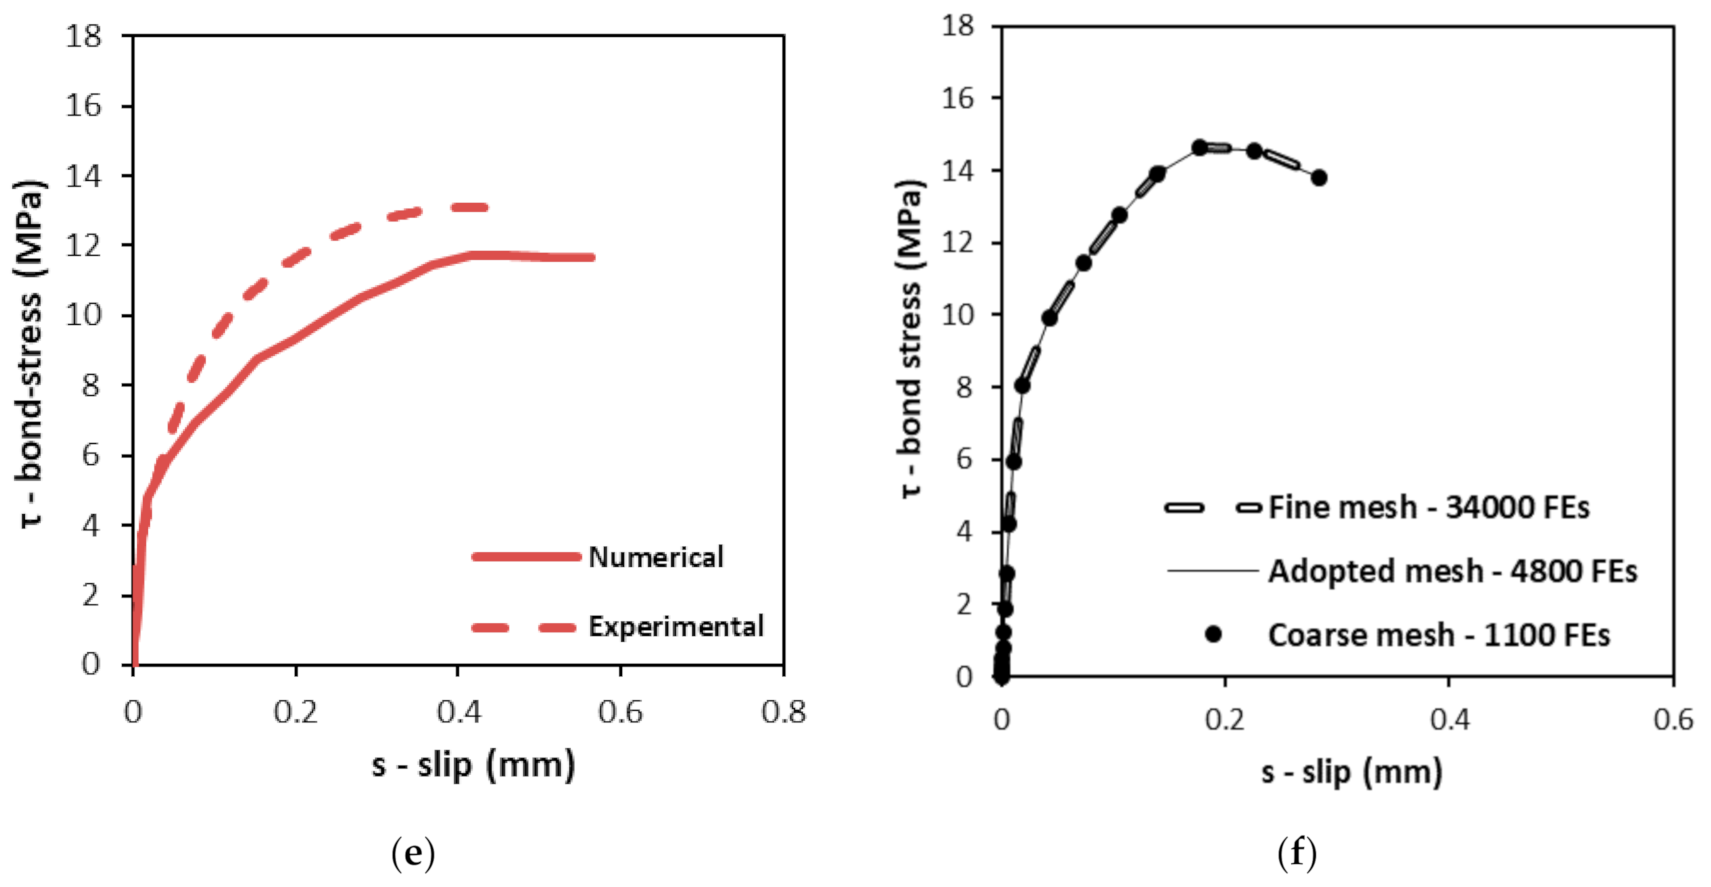
5.1. Verification of the Numerical Model

Figure 5a–e shows the comparison between numerical and experimental bond-slip curves for the five concrete mixes (RC, C100C-Val, C100C-Ret, C100F-Vim and C100F-Amb) that were used to calibrate the numerical model. To obtain the numerical curves, the displacement was monitored at the free extremity of the steel part (as performed in the experimental tests) and the bond stress was determined by summing the reaction forces that arose at the nodes in which displacement was imposed and dividing the resulting value by the contact area between the steel and concrete parts. Additionally, Figure 5f shows the influence of the mesh discretization on the obtained bond-slip curves for RC. There (i), the curve termed “Adopted mesh” is that corresponding to 4800 FEs as shown in Figure 4; (ii) that termed “Fine mesh” (34,000 FEs) is one in which the size of the FEs was reduced to half in both steel and concrete parts (in the interface of both parts, the number of FE on the contour was doubled); and (iii) the one termed “Coarse mesh” (1100 FEs) is one in which the size of the FEs was doubled (with respect to the original mesh) in both steel and concrete parts (in the interface of both parts, the number of FE on the contour was maintained).
The first observation of Figure 5a–e allows us to conclude that numerical and experimental bond-slip curves show good agreement for the five concrete mixes considered. The average ratio between numerical and experimental bond stress is 1.00 and the standard deviation of the ratio is 0.15. This allows us to conclude that the use of α = 0.4 and τmax = 2.0√fcm, as suggested by the FIB Model Code [47], seems suitable to model the bond-slip behavior between steel and the concrete mixes studied.
Considering Figure 5f in particular, it is shown that the adopted mesh seems suitable to model the bond-slip behavior between steel and concrete. In fact, the differences between the three curves presented are nearly imperceptible and the difference in maximum bond stresses is noticeable only in the second decimal place and is lower than 1%. However, the computational time needed for each analysis is very different: it increases exponentially as the number of FEs increases. The model with the adopted mesh took twice the time to run as that with the coarse mesh and the model with the fine mesh took 30 times the computational time of the latter.
With respect to the values of s1 and s2, they also seem to have been correctly estimated based on the experimental results. Figure 6a shows the influence of different values of α and Figure 6b the influence of adopting s1 = s2 = 0.60 for the RC, as suggested by the FIB Model Code [47] (CEB-FIP, 1990). As seen there, with respect to the value of α, in fact the one leading to the best agreement between numerical and experimental results, is α = 0.4, i.e., that suggested by the FIB Model Code [47] (CEB-FIP, 1990). However, regarding the influence of the slips, it is possible to observe that, when the values of slip proposed by the FIB Model Code [47] (CEB-FIP, 1990) are used, s1 = s2 = 0.60, the numerical and experimental curves show a poor qualitative agreement. Furthermore, the difference between numerical and experimental bond strengths for RC increases from 10% to 14%. This allows us to conclude that the values of s1 and s2 are key parameters to be estimated if the simulation of the bond-slip behavior between steel and concrete is sought for rather than only the prediction of the bond strength.
As was also observed experimentally, the numerical models predict that, when the content of RA from CDW increases from 0 to 100%, the bond strength decreases and the corresponding slip increases. These variations are also found, numerically, to be higher when the replacement is made in the fine aggregates rather than in the coarse ones: for the cases modeled up to this point, full replacement of fine aggregates leads to a decrease of 25% of the bond strength, whereas full replacement of coarse aggregates leads to a decrease of 13% of the bond strength, i.e., about half of the former.
Finally, Figure 7 shows the tensile stress fields that arise on the ZY longitudinal face (tensile stress fields on XZ longitudinal face are similar due to symmetry and thus not shown) and the compressive stress fields (with Z-axis direction) on the concrete parts for the RC (Figure 7a,b) and for the C100F-Vim (Figure 7c,d) mixes, at the instant in which the maximum bond stress is achieved. The objective is to check that neither cracking nor crushing of concrete are predicted by the model at this instant by comparing the applied stresses, in two of the three principal directions, with the corresponding strengths. In Figure 7, positive values correspond to tensile stresses (highest values are also represented with outwards pointing arrows) and negative values are compressive stresses (the highest values are represented with inwards pointing arrows).
In both cases, the tensile stresses (with X-axis direction) are lower than the tensile strengths of the concrete mixes (the tensile stresses are compared herein with the tensile strengths at 28 days which are a lower bound of those at 56 days since the latter were not determined experimentally) (σXX = 2.7 MPa < 4.0 MPa, for RC and σXX = 1.9 MPa < 2.6 MPa, for C100F-Vim) and the compressive stresses (with Z-axis direction) are lower than the corresponding compressive strengths (σZZ = 15.2 MPa << 61.1 MPa, for RC and σZZ = 10.8 MPa << 30.6 MPa, for C100F-Vim). This means that, up to the maximum bond stress, neither tensile cracking nor compressive crushing would be predicted by the models in the concrete parts and therefore the adoption of the elastic properties of the concrete mixes seems sufficient to model their bond-slip behavior. It is also interesting to observe, in both cases and with respect to the tensile stress fields, an area (in red) corresponding to maximum tensile stresses visible near the right-hand side of the models. Such an area would be the location where cracking would occur, leading to tensile splitting of the specimens, as observed experimentally. It is naturally understood, however, that the tensile stresses that arise in the model are only due to Poisson’s effect rather than from the summed effect of the former and of rib mobilization and surface roughness, which would increase tensile stresses in the post-peak stage of the response.

5.2. Prediction of the Bond-Slip Behaviour of Concrete with Recycled Aggregates from Construction and Demolition Waste

In the previous sub-section, it was found that the numerical model can adequately, qualitatively and quantitatively, capture the bond-slip behavior between steel and the concrete mixes with RA from CDW. Hence, in this sub-section, the use of the model is extended to attempt to obtain bond-slip curves and bond strengths of the remaining concrete mixes studied in this work (with different percentages of NA replaced with RA from CDW). In particular, it is also intended to evaluate herein whether the use of the FIB Model Code [47] is also extensive to the remaining cases, but also attempting to maintain a fairly simple and direct modelling approach. Therefore, for the remaining concrete mixes, (i) Equations (6)–(9) were also used; and (ii) α = 0.40 and τmax = 2.0√fcm were also adopted. Hence, only s1 and s2, which were identified as key parameters to be determined, were required to be estimated. To do so, the simplest approach was taken, which was to perform a linear interpolation (between the RC and the concrete mixes with 100% of replacement of NA with RA from CDW) to determine the values of s1 and s2 as shown in Figure 8. Figure 8a,b shows, respectively, the variation of s1 and s2 with the percentage of replacement of NA with RA from CDW. Additionally, for each variation set of points, a linear regression was adopted in order to be able to interpolate the values of s1 and s2 for mixes with different contents of RA from CDW.
The equations defined were then rewritten in a more compact form in order for the percentage of replacement and for the fraction in which the replacement is made to be considered, since, experimentally, these parameters were seen to play a key role in the bond-slip behavior of the concrete mixes. Accordingly, the equations for estimating s1 and s2 read,
s 1   =   0.20 + k 1 p
and,
s 2   =   0.25 + k 2 p
in which p is the percentage of replacement of NA with RA (varying between 0 and 100) and k1 and k2 are coefficients that account for the fraction of aggregates replaced, which are the slopes of the linear regressions presented before in Figure 8: (i) for fine aggregates, k1 = 0.0020 and k2 = 0.0055 and (ii) for coarse aggregates, k1 = 0.0005 and k2 = 0.0010. As can be seen, the values of k1 and k2 are much smaller in the case of coarse aggregates than in the case of fine aggregates, as the former were observed to have a lower influence on the bond-slip curves than the latter.
Table 10 shows the numerical bond strengths (τmax,Num) of all concrete mixes as well as their comparison with the experimental values (τmax,Nummax,Exp), obtained using the numerical model developed and the simplified approach described before. As seen there, with the approach proposed (estimation of slips based on percentage and fraction of aggregates replaced), it is possible to obtain good predictions of the bond strengths. The average ratio between numerical and experimental bond strengths is 0.95 and the maximum difference is 14%. Indeed, it was shown before (Figure 6b) that the values of s1 and s2 influence not only the aspect of the bond-slip curves but also the value of the bond strength.
As for the influence of the RA on the bond-slip behavior of the concrete mixes, the numerical results lead to the same conclusions drawn experimentally: the replacement of fine aggregates leads to higher decreases in bond strength than that of coarse aggregates. On average, for each 10% NA replaced with FRA, the numerical bond strength decreases 4.0% (experimentally, 6.0%) and for each 10% NA replaced with CRA, the numerical bond strength decreases 2.5% (experimentally, 3.9%).
Figure 9 show some bond-slip curves of the mixes modeled in this sub-section, particularly those with incorporation of CRA from Valnor (Figure 9a) and of FRA from Vimajas (Figure 9b). As can be observed, as the content of RA from CDW increases, the numerical τ vs. s curves show decreasing initial stiffness, decreasing maximum bond strength and increasing corresponding slips.
Comparing mixes with coarse and with fine RA from CDW, it can be clearly seen that the former possess a lower variation of both strength and slip for maximum bond stress, as the percentage of replaced aggregates increased. For the particular cases shown, it can be seen (see also Table 10) that, for a given replacement ratio, the bond strength for coarse or for fine aggregate replacement is not that distinct but the values of slips show a marked difference. The results suggest that the shift from a steep descending branch to that where a plateau behavior arises are obtained for contents of FRA from CDW higher than 50%.
Considering the results shown above, it is possible to state that if (i) the compressive strength; (ii) fraction; and (iii) replacement ratio of NA with RA from CDW of a given concrete mix are known, its bond-slip behavior can be modelled using (iv) the bond-slip law proposed by the FIB Model Code [47] and (v) the slips estimated by simple equations such as Equations (10) and (11) proposed herein. Nevertheless, it is emphasized once again that this approach is not a closed subject. Several other parameters, such as different RA, simultaneous replacements of fine and coarse aggregates, confined concrete and rebars with different rib configurations, should be assessed in future works to propose more general equations. However, it is deemed that an approach similar to that proposed herein is applicable to the modeling of structural elements with concrete with RA from CDW such as columns, beams or slabs, in which the bond behavior between both materials plays an important role in the overall response.

6. Conclusions

This work presented experimental and numerical investigations on the bond-slip behavior between steel and concrete with recycled aggregates (RA) from construction and demolition waste (CDW) from four recycling plants in Portugal. Concrete mixes with replacement ratios of 10%, 50% and 100% in the fine and in the coarse fraction of natural aggregates (NA) were studied. The main conclusions of the work are as follows:
-
The high roughness and clay content of RA from CDW leads to a need to increase the effective water/binder ratio to obtain the workability constant in all concrete mixes (fixed parameter). This, together with the high porosity of RA, leads to recycled aggregate concrete with lower strength and stiffness by circa 5% and 4%, respectively, compared to the reference concrete per each 10% increase of NA replaced with RA from CDW.
-
Given the typical correlation between both properties, the influence of the increase of RA from CDW on bond strength is similar to that on compressive strength: per each 10% of NA replaced with RA from CDW, bond strength tends to decrease by about 5%. Furthermore, it is concluded that the increase in the content of RA from CDW results in an increase in the slip for maximum bond stress, especially when fine RA are used. Although anchorage length was not assessed in this work, the use of concrete with RA from CDW seems feasible in reinforced concrete members and similar anchorage lengths may be expected (for a given concrete strength) as the correlation between bond strength and compressive strength is similar to that found for natural aggregate concrete.
-
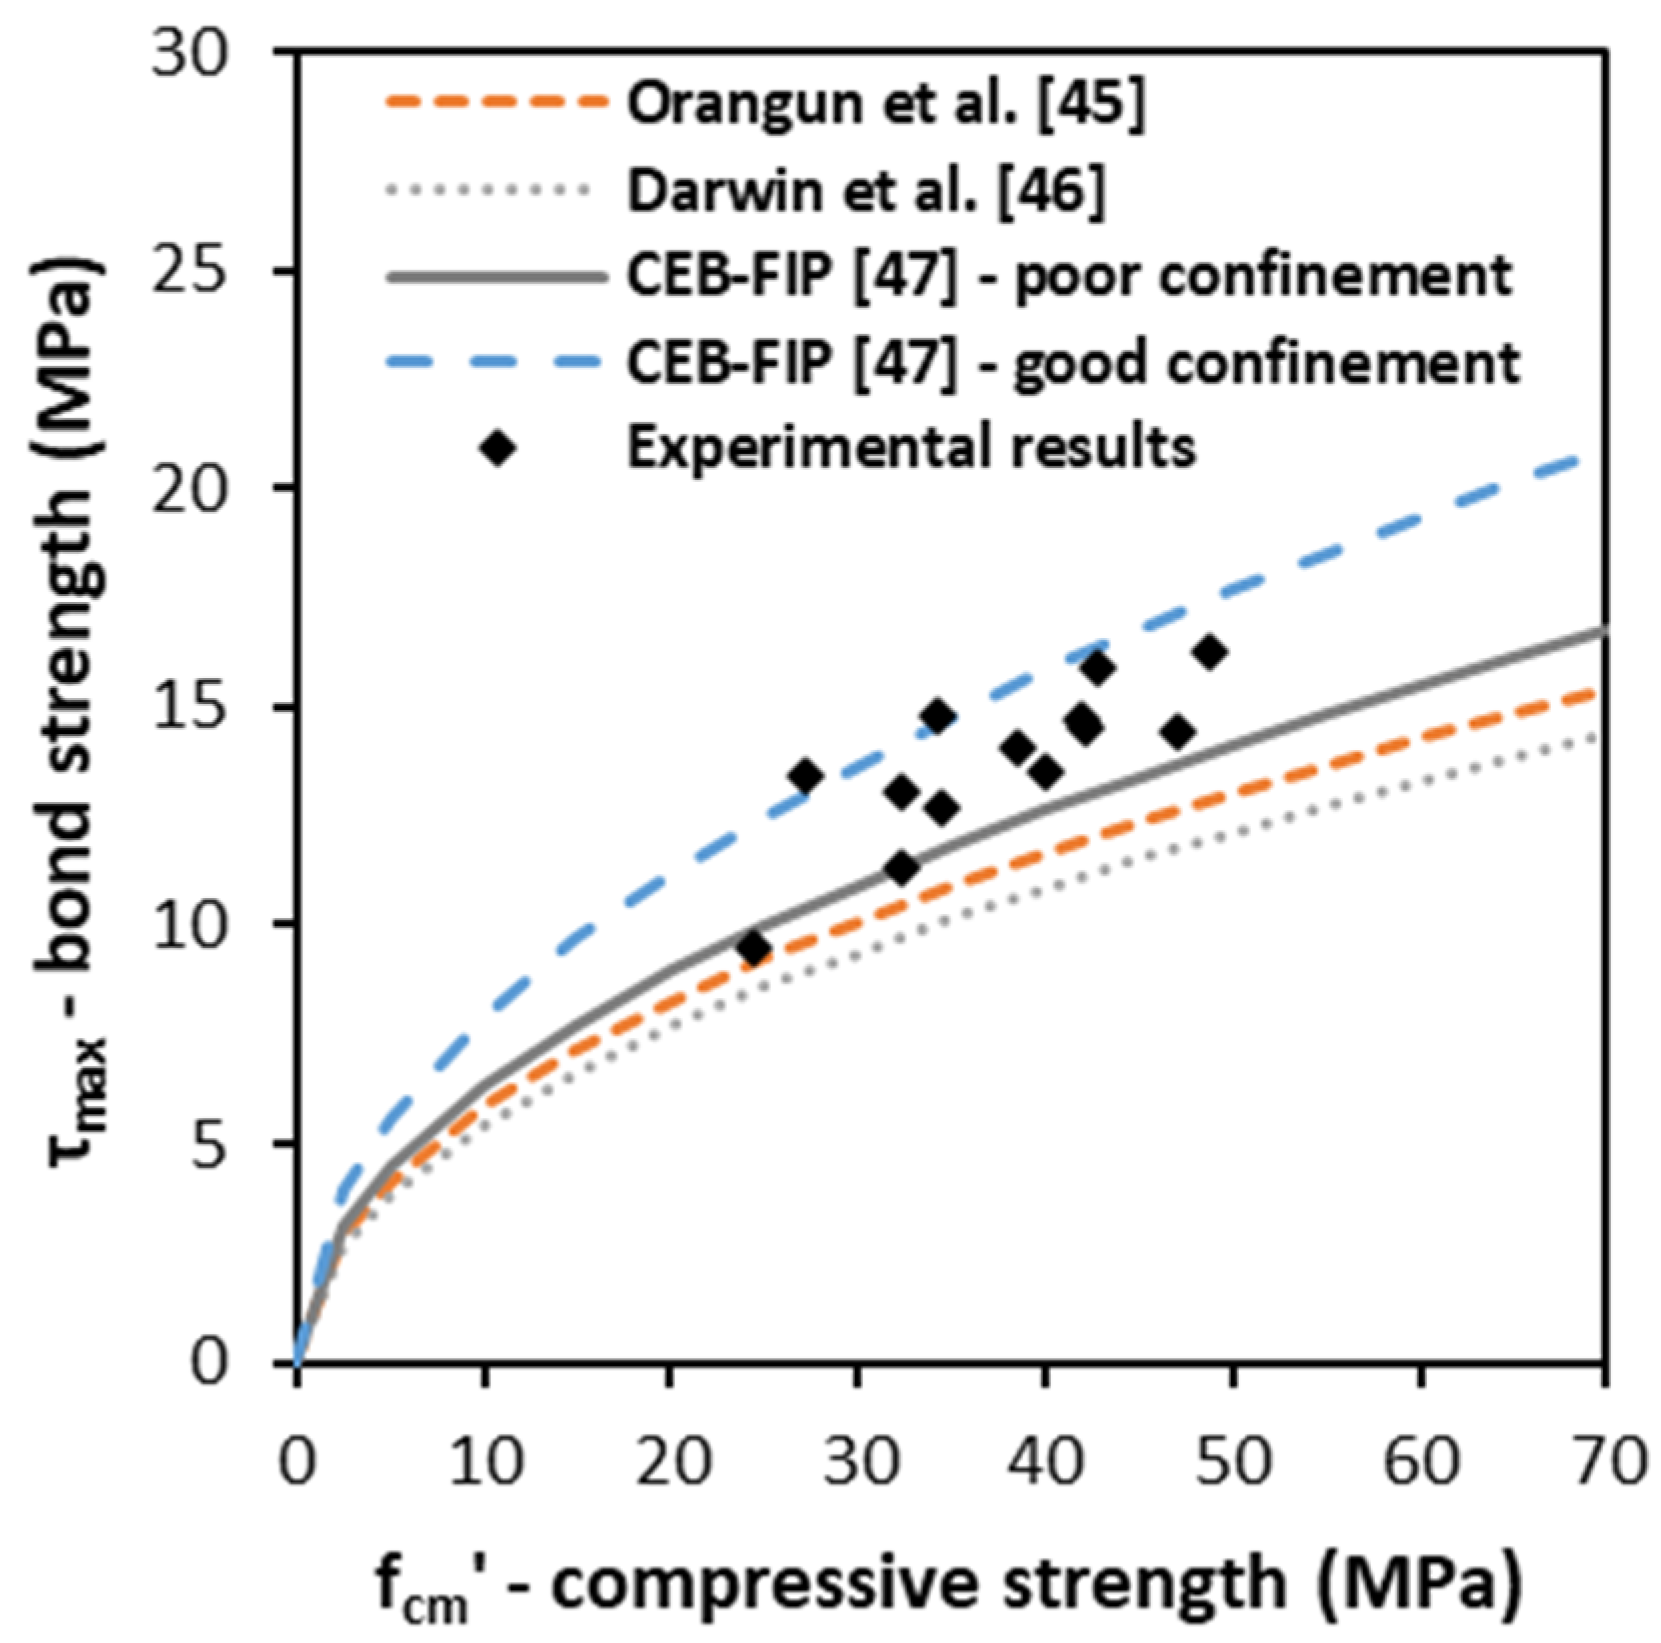
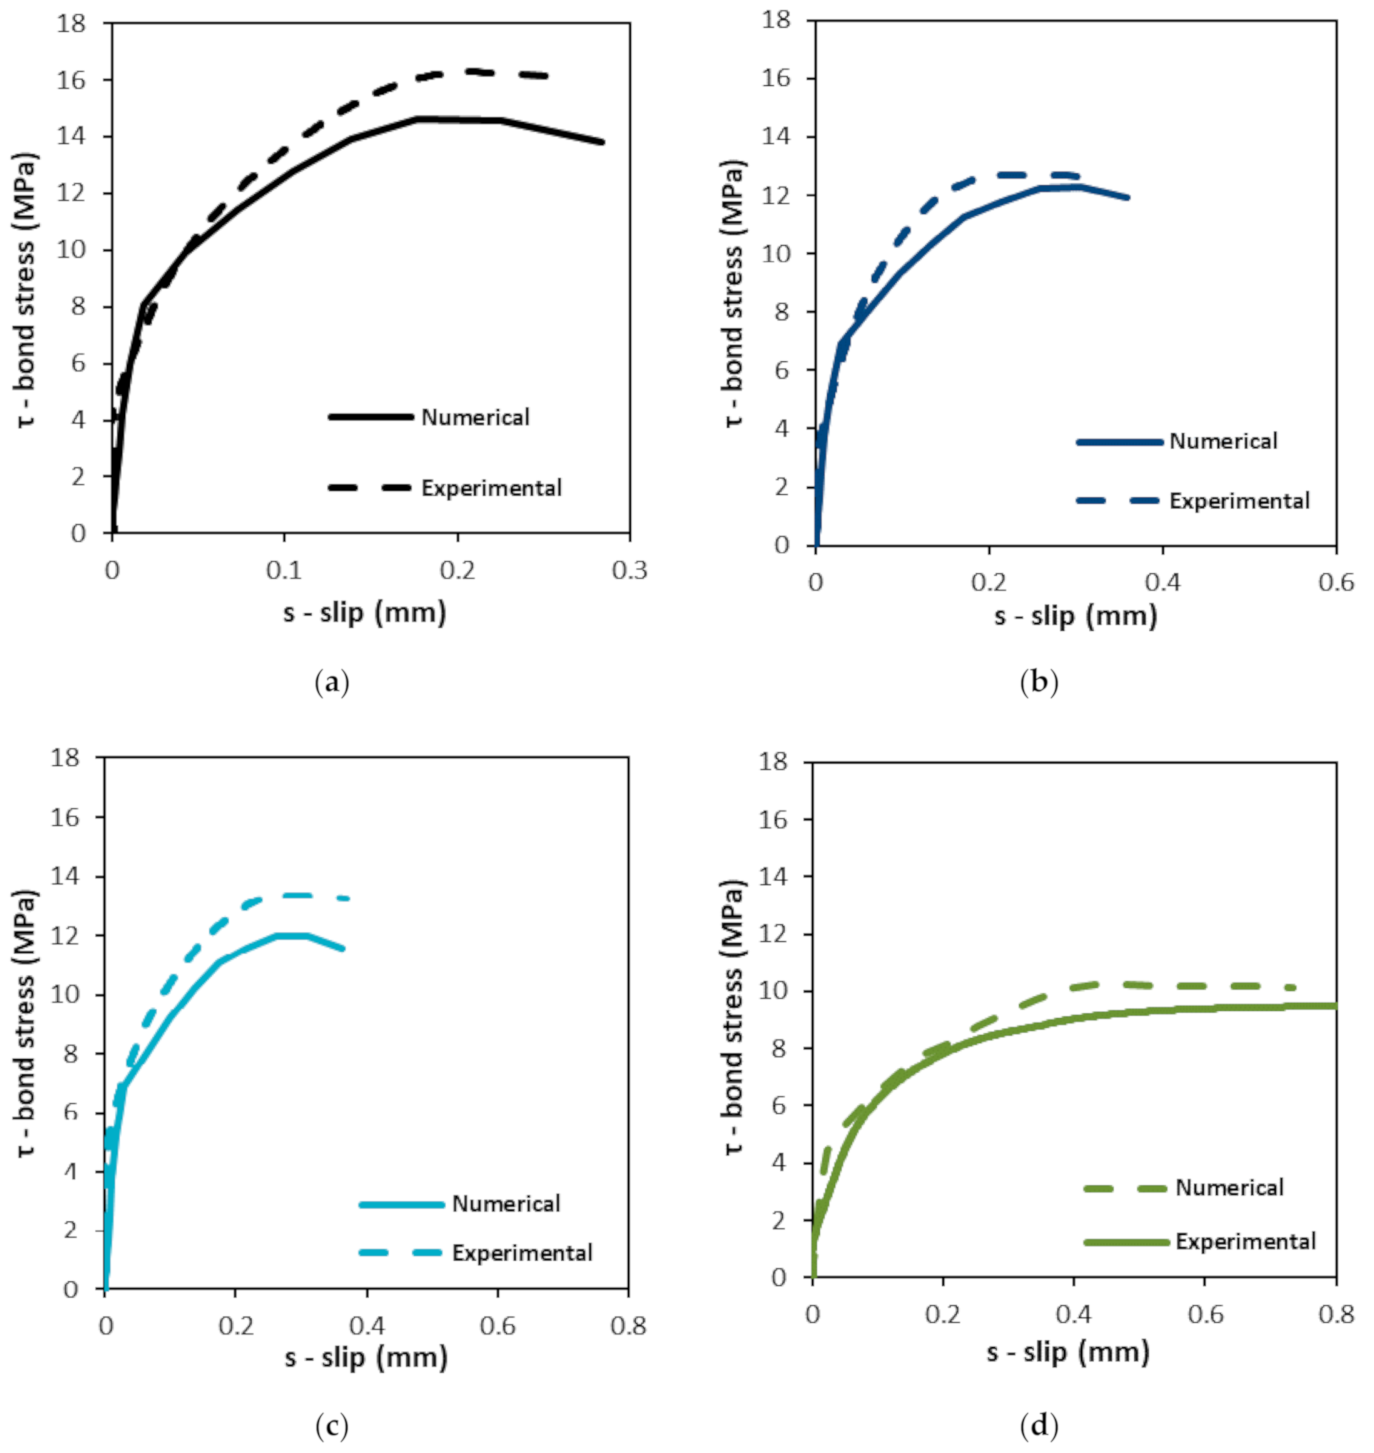
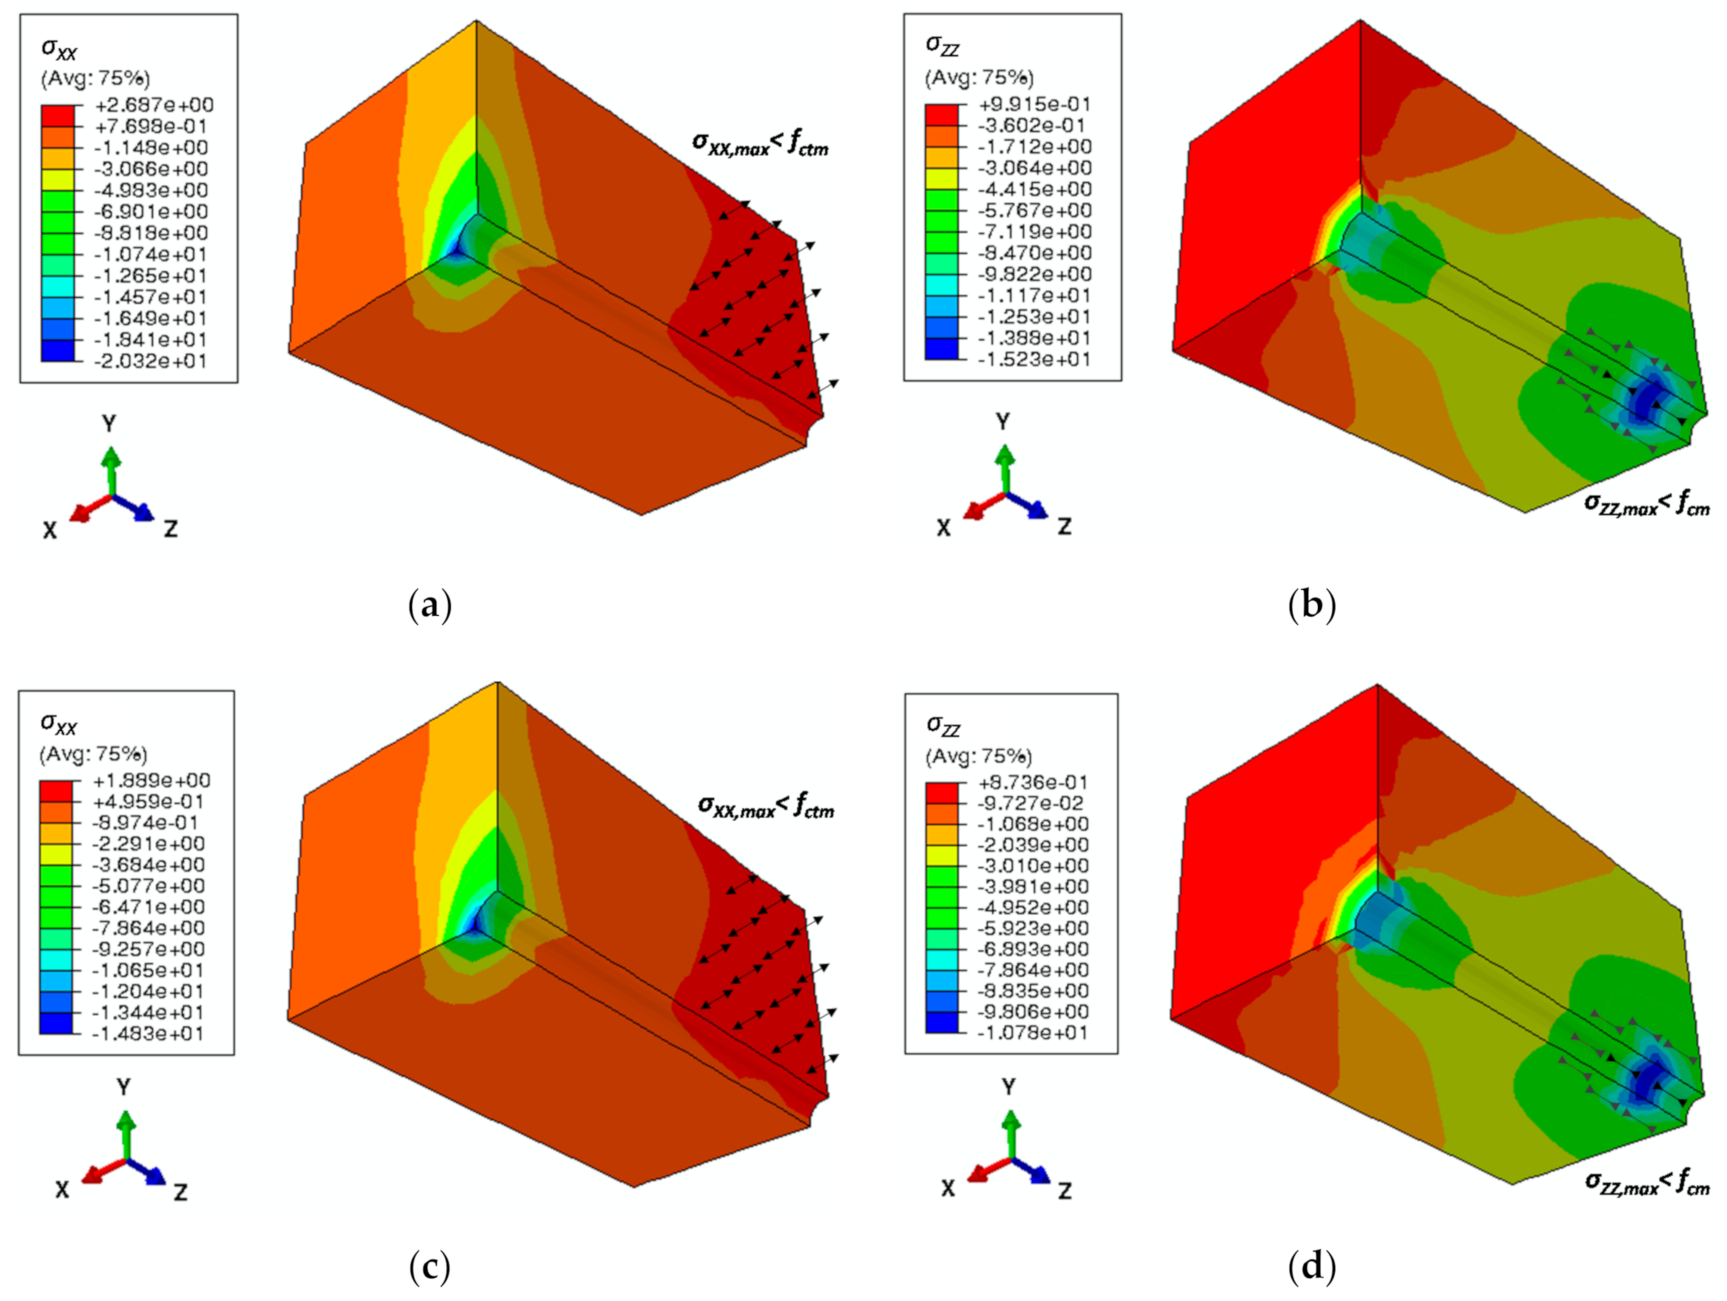
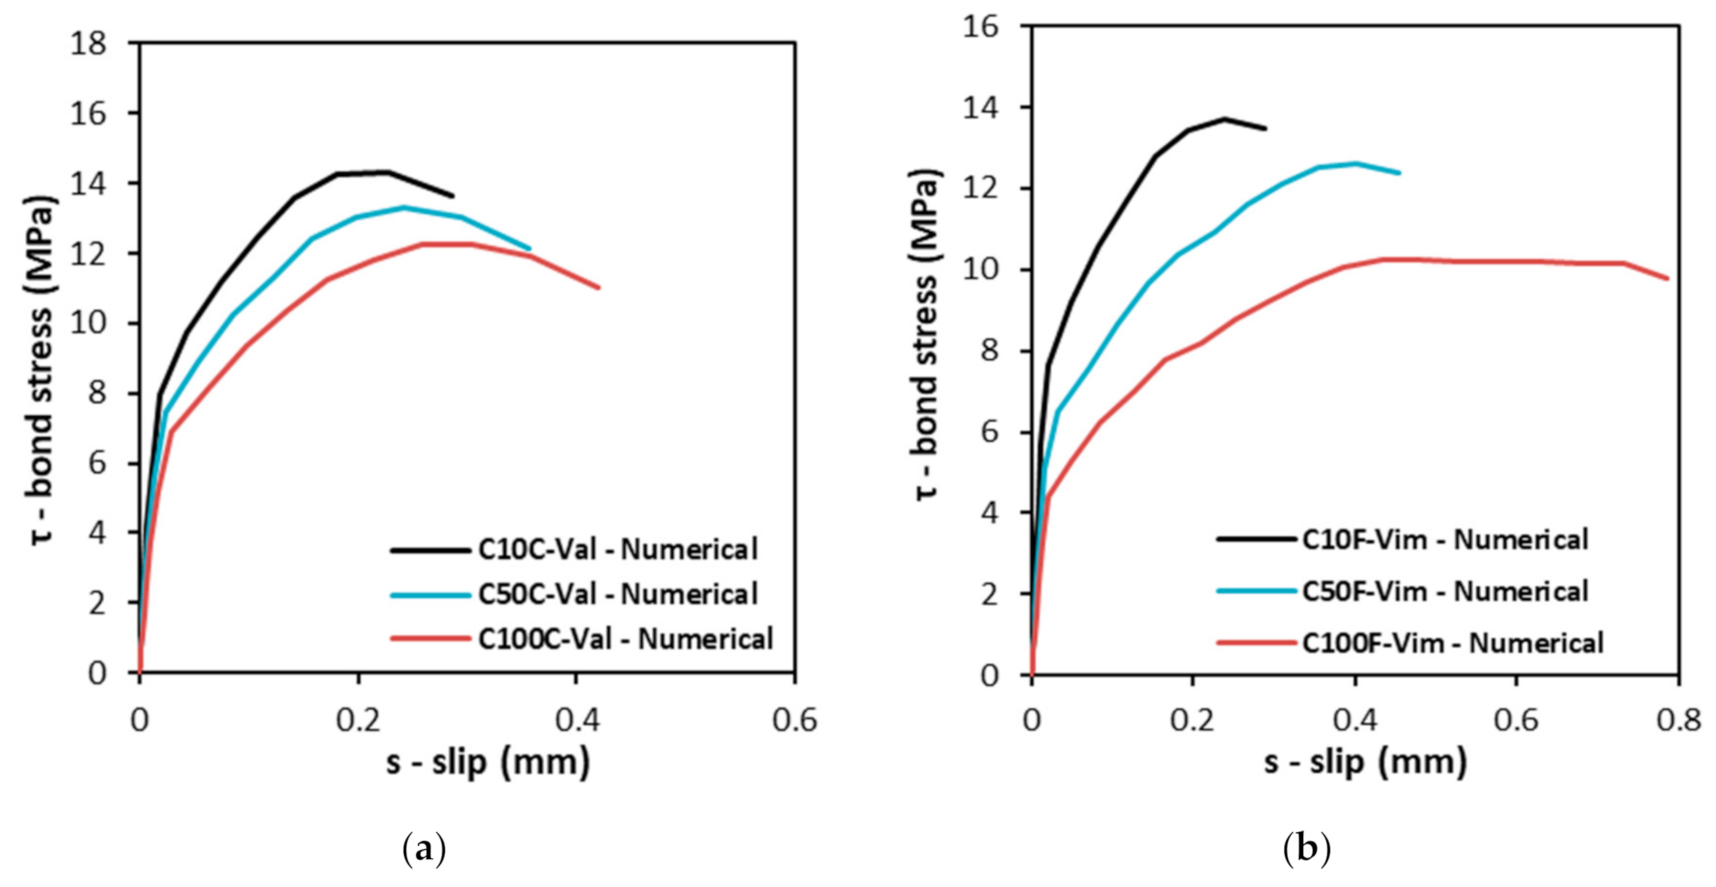
The use of FIB Model Code equations for unconfined concrete and good bond conditions are found to provide good estimates of bond strength for concrete with RA from CDW. When the full set of equations prescribed in this standard is used, in the finite element model developed, the bond-slip behavior (bond stress vs. slip curves) between steel and concrete with RA from CDW can also be accurately predicted: the average ratio between numerical and experimental bond strengths is 0.97. Given this and since the results presented are only dependent on the compressive strength of concrete and on size and content of RA from CDW, it can be stated that the outcomes presented have general validity and may be used as a benchmark in future investigations.
-
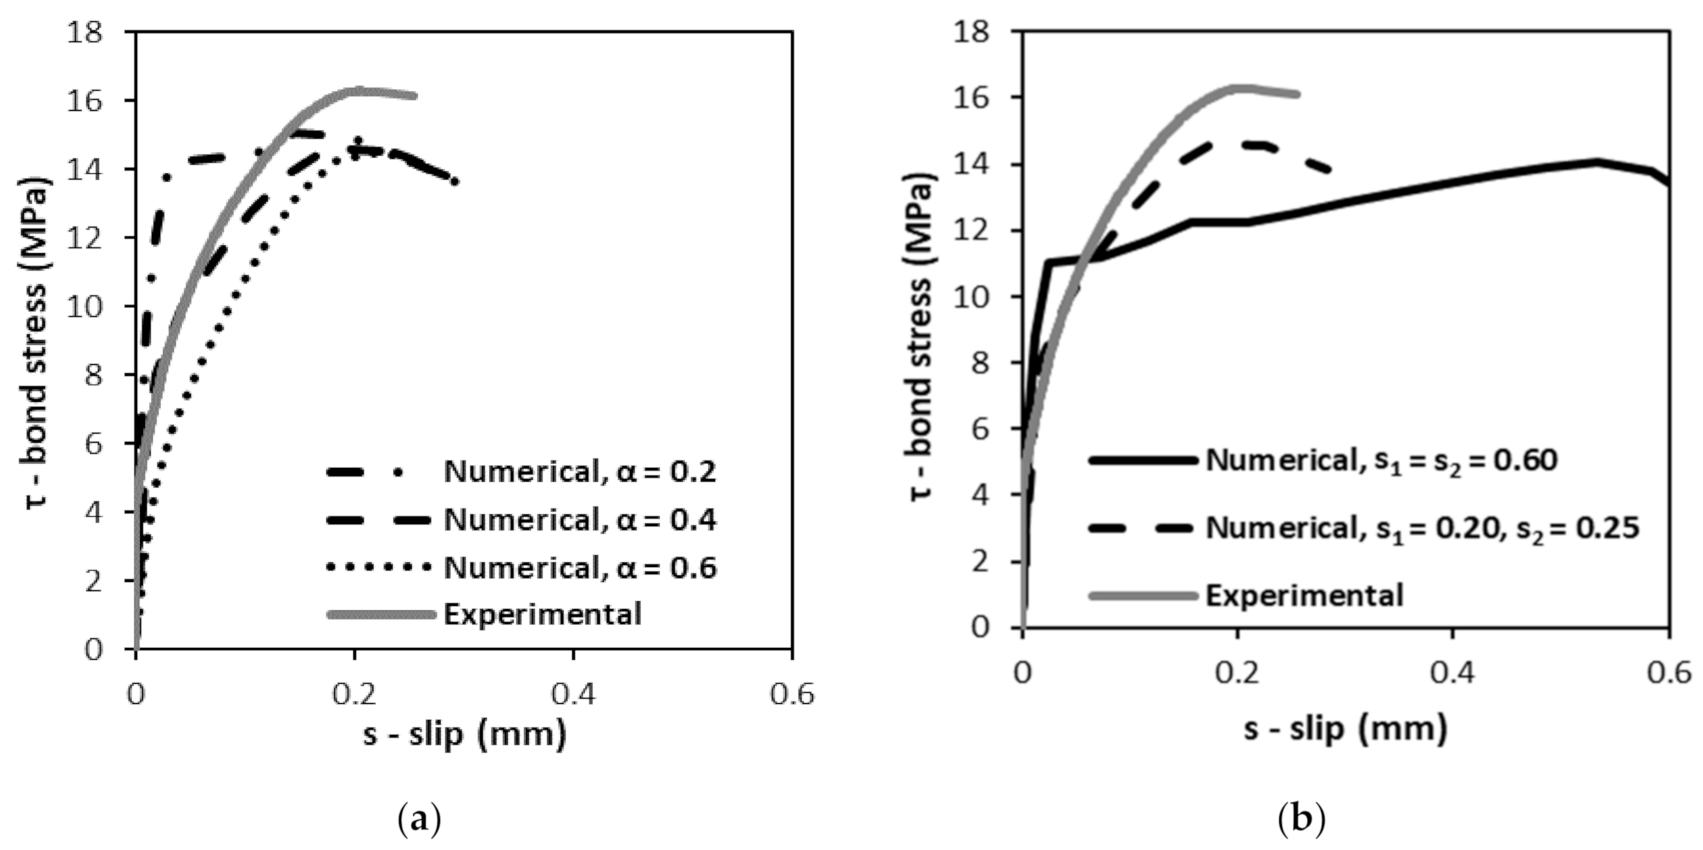
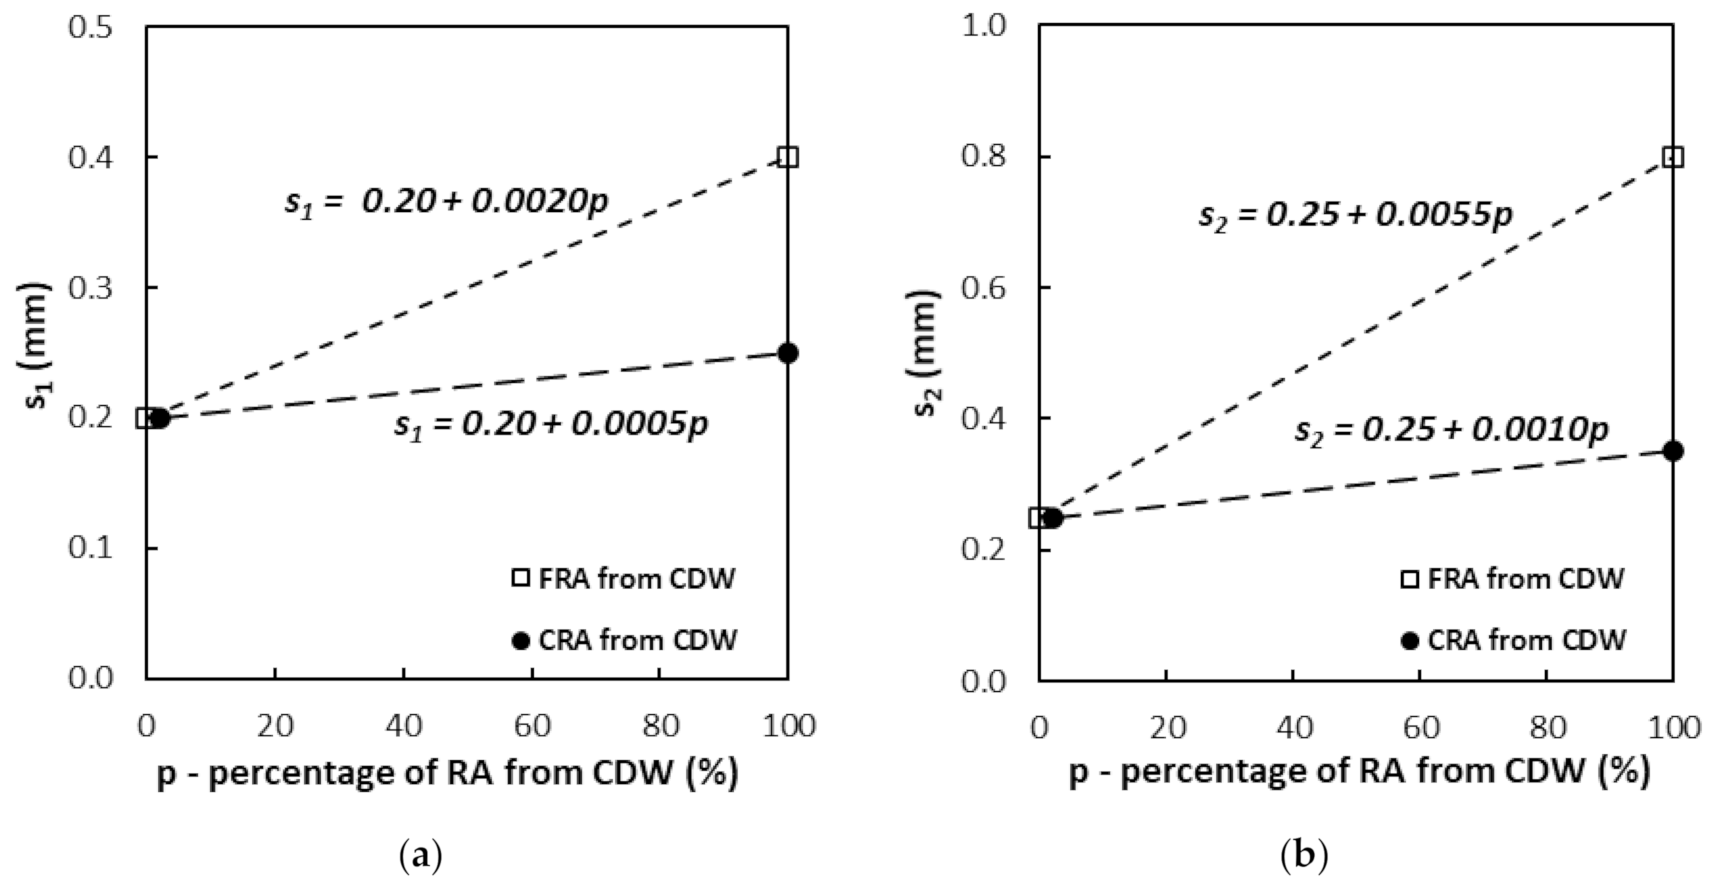
Besides the knowledge of the compressive strength of concrete with RA from CDW, it is shown that numerical modeling of the bond-slip behavior requires estimating the values of the slips associated with the end of the ascending branch and onset of the descending branch of the bond-slip equations of the FIB Model Code, which are different from those proposed. A first attempt to propose an additional equation that accounts for the fraction and percentage of NA replaced with RA from CDW is made and proven to yield good results.

Author Contributions

Conceptualization, M.B., A.P.C.D., J.d.B., L.E.; Methodology, M.B., A.P.C.D., J.d.B., L.E.; Formal analysis, M.B., A.P.C.D., J.d.B., L.E.; Data curation, M.B., A.P.C.D., J.d.B., L.E.; Writing–original draft, M.B., A.P.C.D.; Writing–review and editing, M.B., A.P.C.D., J.d.B., L.E. All authors have read and agreed to the published version of the manuscript.

Funding

This research received no external funding.

Institutional Review Board Statement

Not applicable.

Informed Consent Statement

Not applicable.

Data Availability Statement

No new data were created or analyzed in this study. Data sharing is not applicable to this article.

Conflicts of Interest

The authors declare no conflict of interest.

References

  1. European Commission. “Waste. Construction and demolition waste (CDW)”, European Commission. Available online: https://ec.europa.eu/ (accessed on 7 October 2020).
  2. Coelho, A.; De Brito, J. Economic viability analysis of a construction and demolition waste plant in Portugal—Part II: Economic sensitivity analysis. J. Clean. Prod. 2013, 39, 329–337. [Google Scholar] [CrossRef]
  3. Coelho, A.; De Brito, J. Environmental analysis of a construction and demolition waste plant in Portugal—Part II: Environmental sensitivity analysis. Waste Manag. 2013, 33, 147–161. [Google Scholar] [CrossRef] [PubMed]
  4. Silva, R.V.; De Brito, J.; Dhir, R.K. Properties and composition of recycled aggregates from construction and demolition waste suitable for concrete production. Constr. Build. Mater. 2014, 65, 201–217. [Google Scholar] [CrossRef]
  5. Zaharieva, R.; Buyle-Bodin, F.; Skoczylas, F.; Wirquin, E. 2003, Assessment of the surface permeation properties of recycled aggregate concrete. Cem. Concr. Res. 2003, 25, 223–232. [Google Scholar] [CrossRef]
  6. Siddique, S.; Shrivastava, S.; Chaudhary, S. Durability properties of bone china ceramic fine aggregate concrete. Constr. Build. Mater. 2018, 173, 323–331. [Google Scholar] [CrossRef]
  7. Evangelista, L.; De Brito, J. Durability performance of concrete made with fine recycled concrete aggregates. Cem. Concr. Compos. 2010, 32, 9–14. [Google Scholar] [CrossRef]
  8. Bravo, M.; De Brito, J.; Evangelista, L.; Pacheco, J. Durability and shrinkage of concrete with, C.D.W. as recycled aggregates: Benefits from superplasticizer’s incorporation and influence of, C.D.W. composition. Constr. Build. Mater. 2018, 168, 818–830. [Google Scholar] [CrossRef]
  9. Del Bosque, I.S.; Van den Heede, P.; De Belie, N.; De Rojas, M.S.; Medina, C. Carbonation of concrete with construction and demolition waste based recycled aggregates and cement with recycled content. Constr. Build. Mater. 2020, 234, 117336. [Google Scholar] [CrossRef]
  10. Kou, S.; Poon, C.; Chan, D. Properties of steam cured recycled aggregate fly ash concrete. Use of Recycled Materials in buildings and structures. In Proceedings of the International RILEM Conference, Barcelona, Spain, 8–11 November 2004; pp. 590–599. [Google Scholar]
  11. Poon, C.; Kou, S.; Lam, L. Influence of recycled aggregate on slump and bleeding of fresh concrete. Mater. Struct. 2007, 40, 981–988. [Google Scholar] [CrossRef]
  12. Medina, C.; Zhu, W.; Howind, T.; Rojas, M.; Frías, M. Influence of mixed recycled aggregate on the physical—Mechanical properties of recycled concrete. J. Clean. Prod. 2014, 68, 216–225. [Google Scholar] [CrossRef]
  13. Bravo, M.; De Brito, J.; Pontes, J.; Evangelista, L. Mechanical performance of concrete made with aggregates from construction and demolition waste recycling plants. J. Clean. Prod. 2015, 99, 59–74. [Google Scholar] [CrossRef]
  14. Oliveira, M.; Assis, C.; Wanderley, A. Study on compressed stress, water absorption and modulus of elasticity of produced concrete made by recycled aggregate. Use of Recycled Materials in Buildings and Structures. In Proceedings of the International RILEM Conference, Barcelona, Spain, 8–11 November 2004; pp. 636–642. [Google Scholar]
  15. Etxeberria, M.; Vázquez, E.; Marí, A.; Barra, M. Influence of amount of recycled coarse aggregates and production process on properties of recycled aggregate concrete. Cem. Concr. Res. 2007, 37, 735–742. [Google Scholar] [CrossRef]
  16. Zong, L.; Fei, Z.; Zhang, S. Permeability of recycled aggregate concrete containing fly ash and clay brick waste. J. Clean. Prod. 2014, 70, 175–182. [Google Scholar] [CrossRef]
  17. Alves, A.V.; Vieira, T.F.; De Brito, J.; Correia, J.R. Mechanical properties of Struct. concrete with fine recycled ceramic aggregates. Constr. Build. Mater. 2014, 64, 103–113. [Google Scholar] [CrossRef]
  18. Medina, C.; Rojas, M.; Frías, M. Freeze-thaw durability of recycled concrete containing ceramic aggregate. J. Clean. Prod. 2013, 40, 151–160. [Google Scholar] [CrossRef]
  19. Park, S.; Lee, B.; Kim, J. Studies on mechanical properties of concrete containing waste glass aggregate. Cem. Concr. Res. 2004, 34, 2181–2189. [Google Scholar] [CrossRef]
  20. Mardani-Aghabaglou, A.; Tuyan, M.; Ramyar, K. Mechanical and durability performance of concrete incorporating fine recycled concrete and glass aggregates. Mater. Struct. 2015, 48, 2629–2640. [Google Scholar] [CrossRef]
  21. Ahmed, S.F.U. Properties of concrete containing construction and demolition wastes and fly ash. J. Mater. Civil Eng. 2013, 25, 1864–1870. [Google Scholar] [CrossRef] [Green Version]
  22. Rajhans, P.; Panda, S.K.; Nayak, S. Sustainable self compacting concrete from C&D waste by improving the microstructures of concrete ITZ. Constr. Build. Mater. 2018, 163, 557–570. [Google Scholar]
  23. Carneiro, J.A.; Lima, P.R.L.; Leite, M.B.; Toledo Filho, R.D. Compressive stress–strain behavior of steel fiber reinforced-recycled aggregate concrete. Cem. Concr. Compos. 2014, 46, 65–72. [Google Scholar] [CrossRef]
  24. Akça, K.R.; Çakır, Ö.; Ipek, M. Properties of polypropylene fiber reinforced concrete using recycled aggregates. Constr. Build. Mater. 2015, 98, 620–630. [Google Scholar] [CrossRef]
  25. Haskett, M.; Oehlers, D.; Mohamed Ali, M. Local and global bond characteristics of steel reinforcing bars. Eng. Struct. 2008, 30, 376–383. [Google Scholar] [CrossRef]
  26. Youlin, X. Experimental study of bond-anchorage properties for deformed bars in concrete. In Proceedings of the International Conference—Bond in Concrete—From Research to Practice, Riga, Latvia, 15–17 October 1992; Volume 1. [Google Scholar]
  27. Lutz, L.; Gergely, P. Mechanisms of bond and slip of deformed bars in concrete. ACI J. 1967, 64–62, 711–721. [Google Scholar]
  28. Camões, A.; Cruz, P.; Sá, J. Avaliação da aderência ao betão de varões de aço galvanizado ou com revestimento epoxídico. In Encontro Nacional de Betão Estrutural; Universidade do Minho: Guimarães, Portugal, 2008. (In Portuguese) [Google Scholar]
  29. Braga, F.; Gigliotti, R.; Laterza, M.; D’Amato, M.; Kunnath, S. Modified steel bar model incorporating bond-slip for seismic assessment of concrete structures. J. Struct. Eng. 2012, 138, 1342–1350. [Google Scholar] [CrossRef]
  30. D’Amato, M.; Braga, F.; Gigliotti, R.; Kunnath, S.; Laterza, M. Validation of a modified steel bar model incorporating bond-slip for seismic assessment of concrete structures. J. Struct. Eng. 2012, 138, 1351–1360. [Google Scholar] [CrossRef]
  31. Braga, F.; Caprili, S.; Gigliotti, R.; Salvatore, W. Hardening slip model for reinforcing steel bars. Earthq. Struct. 2015, 9, 503–539. [Google Scholar] [CrossRef]
  32. Butler, L.; West, J.; Tighe, S. The effect of recycled concrete aggregate properties on the bond strength between RCA concrete and steel reinforcement. Cem. Concr. Res. 2011, 41, 1037–1049. [Google Scholar] [CrossRef]
  33. Darwin, D.; Barham, S.; Kozul, R.; Luan, S. Fracture energy of high-strength concrete. ACI Mater. J. 2001, 98, 410–417. [Google Scholar]
  34. Bai, G.; Wu, S.; Li, X. Investigation of bond-slip behavior between recycled concrete and steel bars under pull-out test. In Proceedings of the 2nd International Conference on Waste Eng. and Management—ICWEM 2010, Shanghai, China, 13–15 October 2010; RILEM Publications SARL: Paris, France, 2010; pp. 628–637. [Google Scholar]
  35. Zuhud, A. Performance of Recycled Aggregate Concrete; Dissertation in Design and Rehabilitation of Structures. Master’s Thesis, Islamic University of Gaza, Gaza, Palestine, 2008. [Google Scholar]
  36. Guerra, M.; Ceia, F.; de Brito, J.; Júlio, E. Anchorage of steel rebars to recycled aggregates concrete. Constr. Build. Mater. 2014, 72, 113–123. [Google Scholar] [CrossRef]
  37. Bai, G.; Liu, B. Nonlinear finite element analysis of bond-slip performance of recycled aggregate concrete filled circular steel tube. J. Adhes. Sci. Technol. 2019, 33, 1294–1319. [Google Scholar] [CrossRef] [Green Version]
  38. Liu, C.; Xing, L.; Liu, H.; Quan, Z.; Fu, G.; Wu, J.; Zhenyuan, L.; Zhu, C. Numerical study of bond slip between section steel and recycled aggregate concrete with full replacement ratio. Appl. Sci. 2020, 10, 887. [Google Scholar] [CrossRef] [Green Version]
  39. El-Hacha, R.; Elagroudy, H.; Rizkalla, S. Bond characteristics of high-strength steel reinforcement. ACI Struct. J. 2006, 103, 771–782. [Google Scholar]
  40. Bogas, J. Caracterização de Betões Estruturais Com Agregados Leves de Argila Expandida. Ph.D. Thesis, IST-University of Lisbon, Lisbon, Portugal, 2011. (In Portuguese). [Google Scholar]
  41. Prince, M.; Singh, B. Bond behaviour of deformed steel bars embedded in recycled aggregate concrete. Constr. Build. Mater. 2013, 49, 852–862. [Google Scholar] [CrossRef]
  42. Bravo, M.; Silva, A.S.; De Brito, J.; Evangelista, L. Microstructure of concrete with aggregates from construction and demolition waste recycling plants. Microsc. Microanal. 2016, 22, 149–167. [Google Scholar] [CrossRef] [PubMed]
  43. Kim, S.; Yun, H. Influence of recycled coarse aggregates on the bond behavior of deformed bars in concrete. Eng. Struct. 2013, 48, 133–143. [Google Scholar] [CrossRef]
  44. Kim, S.; Yun, H. Evaluation of the bond behavior of steel reinforcing bars in recycled fine aggregate concrete. Cem. Concr. Compos. 2014, 46, 8–18. [Google Scholar] [CrossRef]
  45. Orangun, C.O.; Jirsa, J.O.; Breen, J.E. A reevaulation of test data on development length and splices. ACI J. Proceed. 1977, 74, 114–122. [Google Scholar]
  46. Darwin, D.; McCabe, S.; Idun, E.; Schoenekase, S. Development length criteria: Bars not confined by transverse reinforcement. ACI Struct. J. 1992, 89, 709–720. [Google Scholar]
  47. CEB-FIP. CEB-FIP Model Code 1990: Design Code. Comité Euro-International du Béton; Thomas Telford: London, UK, 1990. [Google Scholar]
  48. CEN. Eurocode 2: Design of Concrete Struct.—Part 1–1: General Rules and Rules for Buildings, EN 1992–1-1; European Committee for Standardization: Brussels, Belgium, 2010. [Google Scholar]
  49. Simulia. ABAQUS Standard, User’s Manual, Version 2018; Dassault Systèmes: Waltham, RI, USA, 2018. [Google Scholar]
  50. CEN. Eurocode 3: Design of Steel Struct.—Part 1–1: General Rules and Rules for Buildings, EN 1993–1-1; European Committee for Standardization: Brussels, Belgium, 2010. [Google Scholar]
Figure 1. (a) Bond stress vs. slip curves and (b) failure mode of specimens.
Buildings 11 00040 g001
Figure 2. Mobilization of ribs in (a) RC and (b) C100F-Amb.
Buildings 11 00040 g002
Figure 3. Comparison of experimental results with predictions from analytical expressions.
Buildings 11 00040 g003
Figure 4. Geometry and mesh of the FE model developed.
Buildings 11 00040 g004
Figure 5. Numerical vs. experimental bond-slip curves of (a) RC, (b) C100C-Val, (c) C100C-Ret, (d) C100F-Vim, (e) C100F-Amb and (f) influence of mesh discretization on the bond-slip behavior of RC.
Buildings 11 00040 g005aBuildings 11 00040 g005b
Figure 6. Influence of (a) the value of α and (b) the adoption of s1 = s2 = 0.60 in the numerical bond-slip curve of RC.
Buildings 11 00040 g006
Figure 7. Numerical (a) tensile and (b) compressive stress fields of RC and (c) tensile and (d) compressive stress fields of C100F-Vim at the corresponding instants of maximum bond stress (stress values in MPa).
Buildings 11 00040 g007
Figure 8. Variation of (a) s1 and (b) s2 with the percentage of NA replaced with RA from CDW.
Buildings 11 00040 g008
Figure 9. Numerical bond vs. slip curves of concrete mixes with (a) CRA from Valnor and (b) FRA from Vimajas.
Buildings 11 00040 g009
Table 1. Composition of the recycled aggregates (% in mass).
Composition (%)CRA ValnorCRA RetriaFRA VimajasFRA Ambilei
Concrete, mortar and natural stone70.869.175.283.7
Masonry—clay materials28.628.611.60.9
Glass0.52.11.015.4
Bituminous materials0.00.010.50.0
Others0.10.21.70.0
Total100.0100.0100.0100.0
Table 2. Results of the physical tests of the coarse aggregates.
Physical TestsCL 3 *CL 2 *CL 1 *CRA ValnorCRA Retria
Oven-dry particles density (kg/m3)25992609252220912137
Water absorption (%)1.51.32.78.68.4
Bulk density (kg/m3)13601350134810951236
Shape index (%)1517182424
Los Angeles wear (%)2628-5246
* CL 1—Crushed limestone 1 (4.0–5.6 mm); * CL 2—Crushed limestone 2 (5.6–11.2 mm); * CL 3—Crushed limestone 3 (11.2–22.4 mm).
Table 3. Results of the physical tests of the fine aggregates.
Physical TestsFine SandCoarse SandFRA VimajasFRA Ambilei
Oven-dry particle density (kg/m3)2583258120702112
Water absorption (%)0.30.710.112.9
Bulk density (kg/m3)1530154013321435
Table 4. Results of the chemical tests of the recycled aggregates.
Chemical TestsCRA ValnorCRA RetriaFRA VimajasFRA AmbileiThreshold
Water-soluble chloride content<0.010<0.0100.016<0.0100.010 1
Water-soluble sulphate content0.040.040.180.110.20 1
Acid-soluble sulphate content0.20.30.80.20.8 1
Sulphur global content0.10.10.30.11.0 1
Light contaminants content1.5<0.11.71.80.5 1
Humus contentNegativeNegativeNegativeNegativeNegative
Water solubility1.01.22.10.510.0 2
1 According to EN 12620 (2008); 2 According to EN 1744 (2009).
Table 5. Composition of the reference concrete (RC) (l/l).
Cement0.115
Fine aggregates0–0.0630.000
0.063–0.1250.016
0.125–0.250.044
0.25–0.50.050
0.5–10.057
1–20.066
2–40.076
Coarse aggregates4–5.60.041
5.6–80.046
8–11.20.047
11.2–160.121
16–22.40.122
Water0.182
Voids0.017
Total1.000
Table 6. Slump and effective w/c ratio of the concrete mixes.
Recycled
Aggregates
01050100
Slump (mm)w/c RatioSlump (mm)w/c RatioSlump (mm)w/c RatioSlump (mm)w/c Ratio
CRA Valnor1140.511260.521200.531200.53
CRA Retria1180.521250.531210.53
FRA Vimajas1190.531240.581210.64
FRA Ambilei1400.521400.531350.55
Table 7. Mechanical properties of the concrete mixes with RA from CDW and their variation (∆) with respect to the RC.
Concrete Mixfcm,28
(MPa)

(%)
fcm,56
(MPa)

(%)
fctm,28
(MPa)

(%)
Ecm,28
(GPa)

(%)
RC53.9 ± 1.8-61.1 ± 1.6-4.0 ± 0.0-40.5 ± 0.2-
C10C-Val54.1 ± 2.20.258.8 ± 1.9−3.83.7 ± 0.3−8.339.1 ± 0.4−3.5
C50C-Val46.2 ± 2.7−14.350.1 ± 2.1−18.13.2 ± 0.0−19.529.2 ± 0.9−27.9
C100C-Val35.3 ± 1.4−34.543.2 ± 1.5−29.43.1 ± 0.1−24.321.1 ± 0.5−47.9
C10C-Ret48.3 ± 2.3−10.453.4 ± 0.9−12.64.0 ± 0.4−0.437.7 ± 0.0−6.9
C50C-Ret44.9 ± 1.4−16.842.7 ± 1.8−30.23.2 ± 0.3−20.631.5 ± 0.2−22.3
C100C-Ret40.1 ± 1.1−25.633.9 ± 2.6−44.52.7 ± 0.2−32.126.3 ± 0.0−35.1
C10F-Vim49.2 ± 1.1−8.752.8 ± 1.9−13.73.9 ± 0.1−7.240.8 ± 0.6−4.7
C50F-Vim37.6 ± 1.3−30.240.5 ± 0.1−33.73.7 ± 0.3−26.234.8 ± 0.3−21.2
C100F-Vim30.2 ± 0.5−44.130.6 ± 0.9−50.02.9 ± 0.0−34.626.7 ± 0.4−42.5
C10F-Amb51.6 ± 1.0−4.352.3 ± 0.4−14.53.4 ± 0.1−14.940.3 ± 0.3−0.5
C50F-Amb46.8 ± 1.2−13.348.1 ± 0.9−21.33.4 ± 0.3−14.637.4 ± 0.4−7.7
C100F-Amb38.4 ± 1.2−28.840.3 ± 0.1−34.03.2 ± 0.1−20.732.5 ± 0.6−19.8
Table 8. Bond strength of the concrete mixes with RA from CDW.
Concrete Mixτmax
(MPa)

(%)
RC16.3 ± 1.4-
C10C-Val14.4 ± 1.1−11.5
C50C-Val13.5 ± 1.7−17.1
C100C-Val12.7 ± 1.1−22.1
C10C-Ret15.9 ± 1.9−2.7
C50C-Ret14.8 ± 1.1−9.3
C100C-Ret13.4 ± 1.0−18.0
C10F-Vim14.5 ± 0.4−11.2
C50F-Vim11.3 ± 0.9−30.9
C100F-Vim9.5 ± 0.8−41.9
C10F-Amb14.7 ± 1.0−9.9
C50F-Amb14.1 ± 0.6−13.4
C100F-Amb13.1 ± 0.6−19.6
Table 9. Bond-slip properties adopted in the simulations.
Concrete MixKτ (MPa/mm)τmax (MPa)τf (MPa)s1 (mm)s2 (mm)s3 (mm)
RC421.9613.992.100.200.251.00
C100C-Val324.6311.761.760.200.351.00
C100C-Ret317.2311.501.720.250.351.00
C100F-Vim226.359.901.480.400.801.00
C100F-Amb259.5011.351.700.400.801.00
Table 10. Numerical bond strength of the concrete mixes with RA from CDW.
Concrete Mixτmax,Num
(MPa)
τmax,Nummax,Exp
(-)
RC14.60.90
C10C-Val14.30.99
C50C-Val13.30.99
C100C-Val12.30.97
C10C-Ret13.70.86
C50C-Ret12.70.86
C100C-Ret12.00.90
C10F-Vim13.70.94
C50F-Vim12.61.12
C100F-Vim10.21.07
C10F-Amb13.70.93
C50F-Amb13.70.97
C100F-Amb11.70.89
Average0.95
Standard deviation0.07
Publisher’s Note: MDPI stays neutral with regard to jurisdictional claims in published maps and institutional affiliations.

