
Seismic Fragility Functions for Non-Seismically Designed RC Structures Considering Pounding Effects


Abstract
:1. Introduction
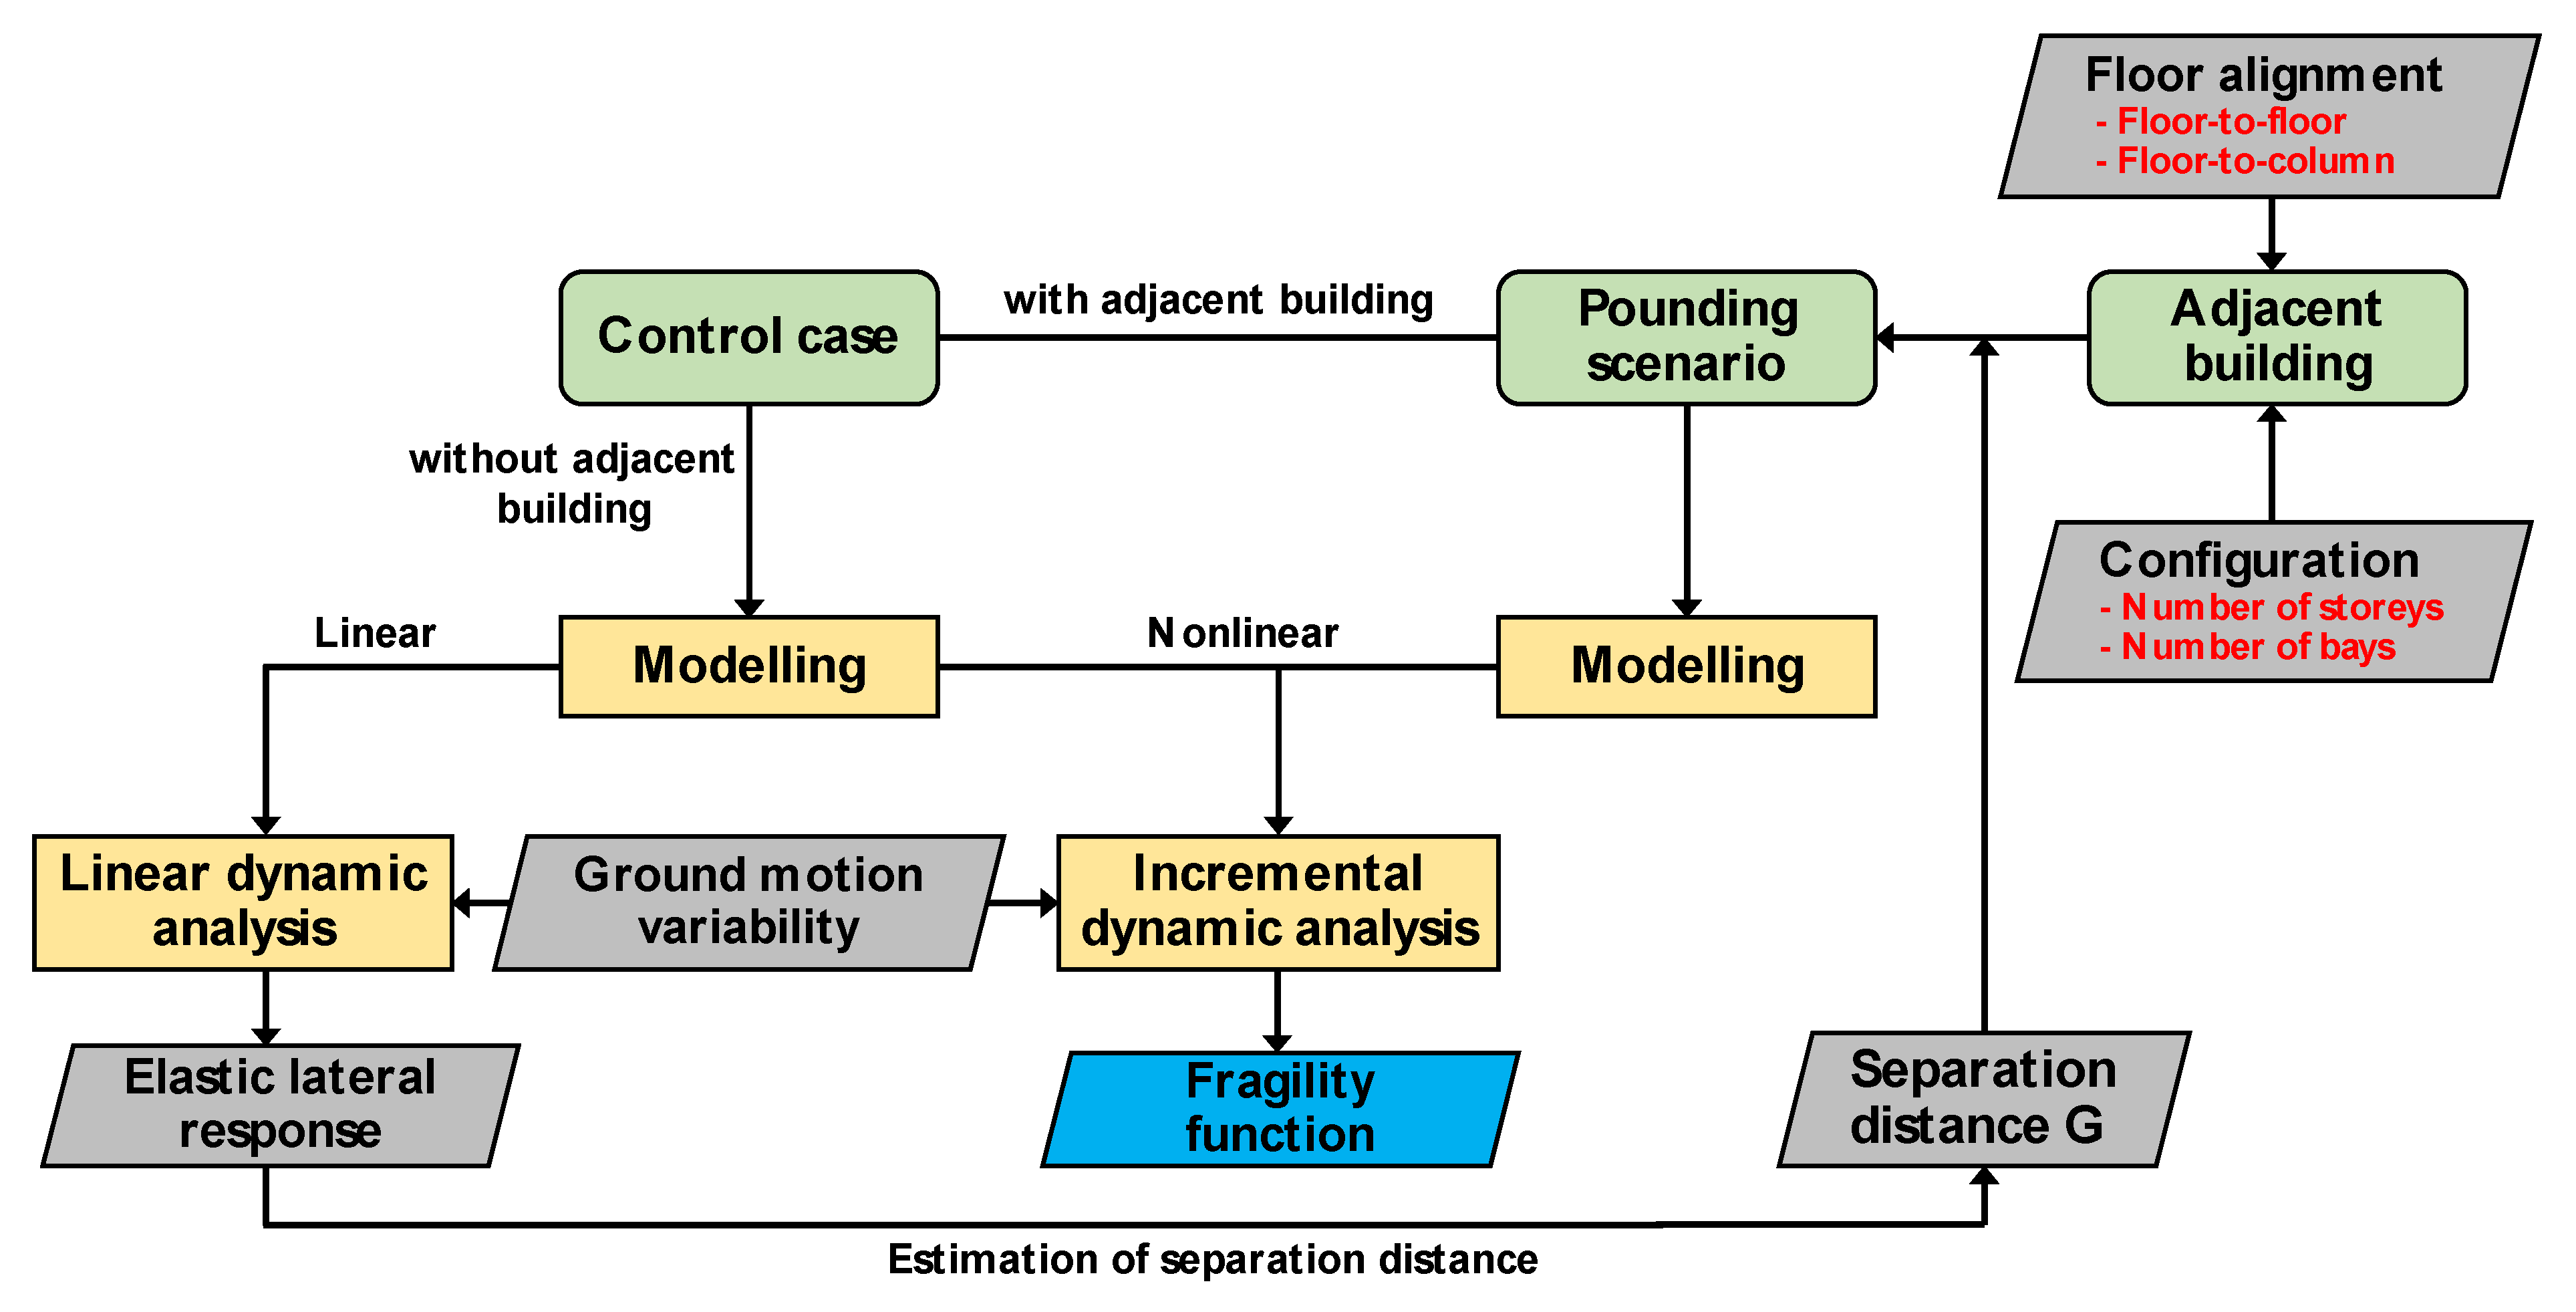
2. Methodology
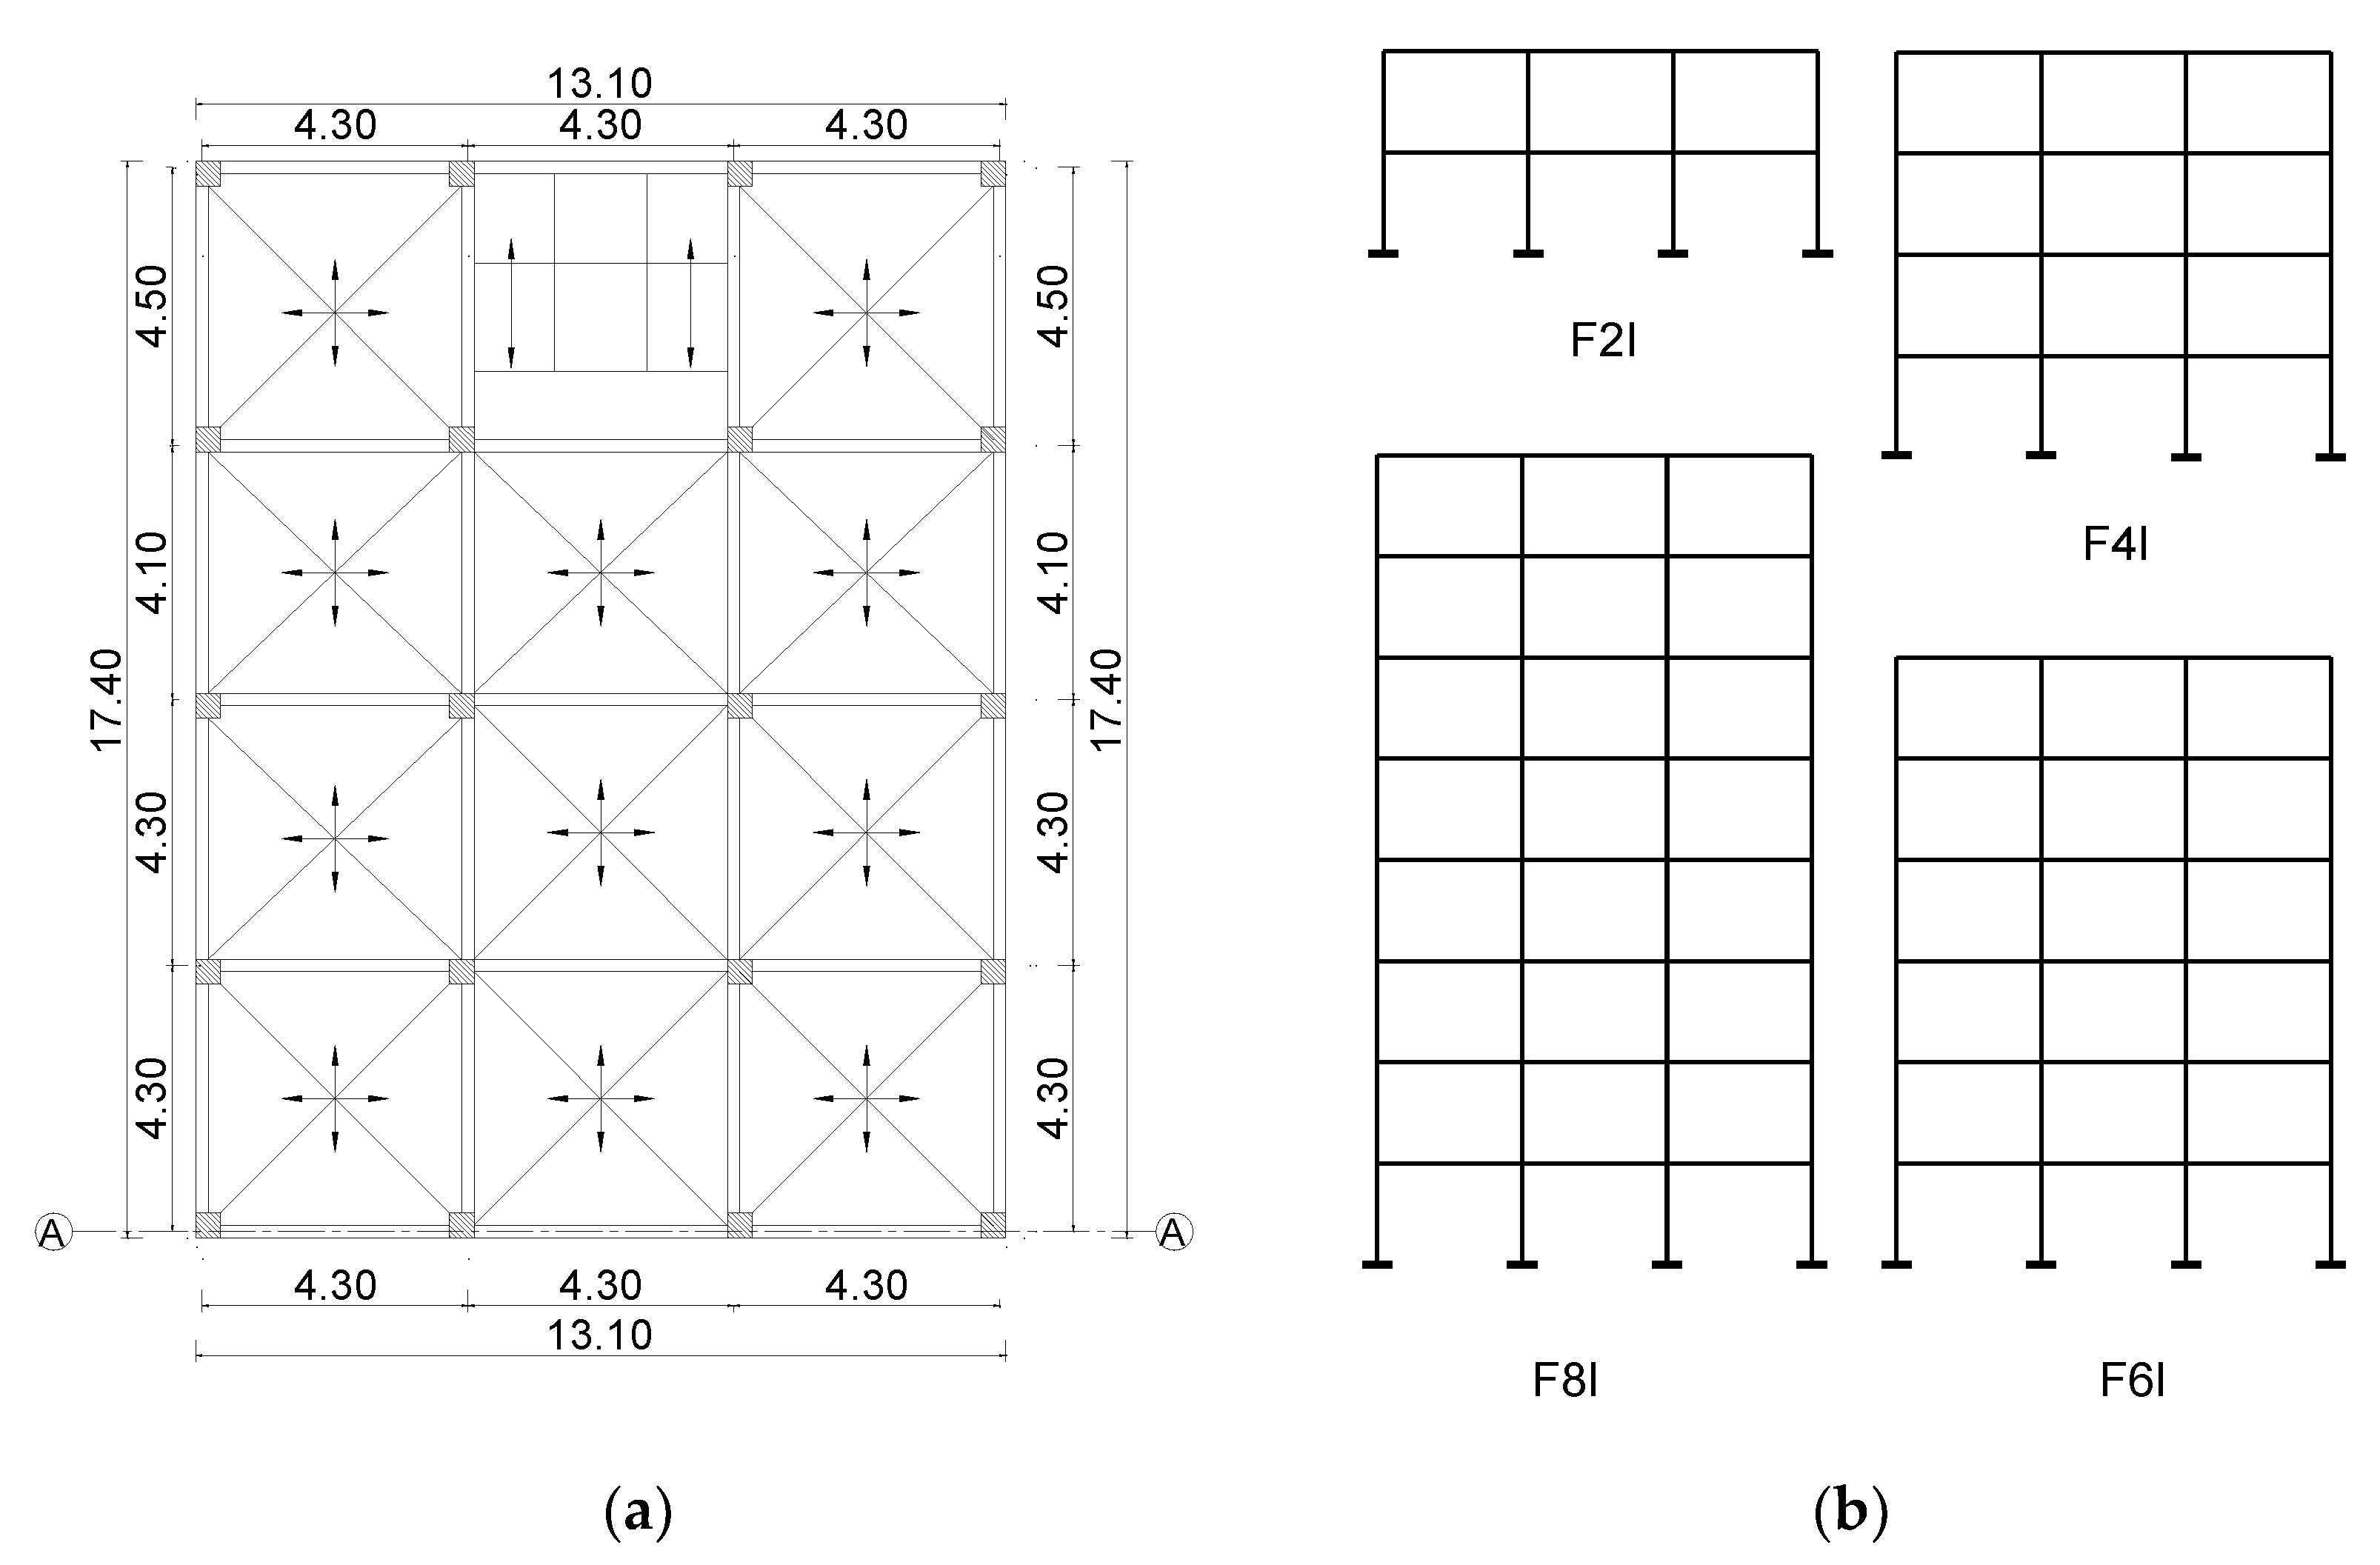
3. Characterisation of the Selected Building Systems
4. Numerical Modelling
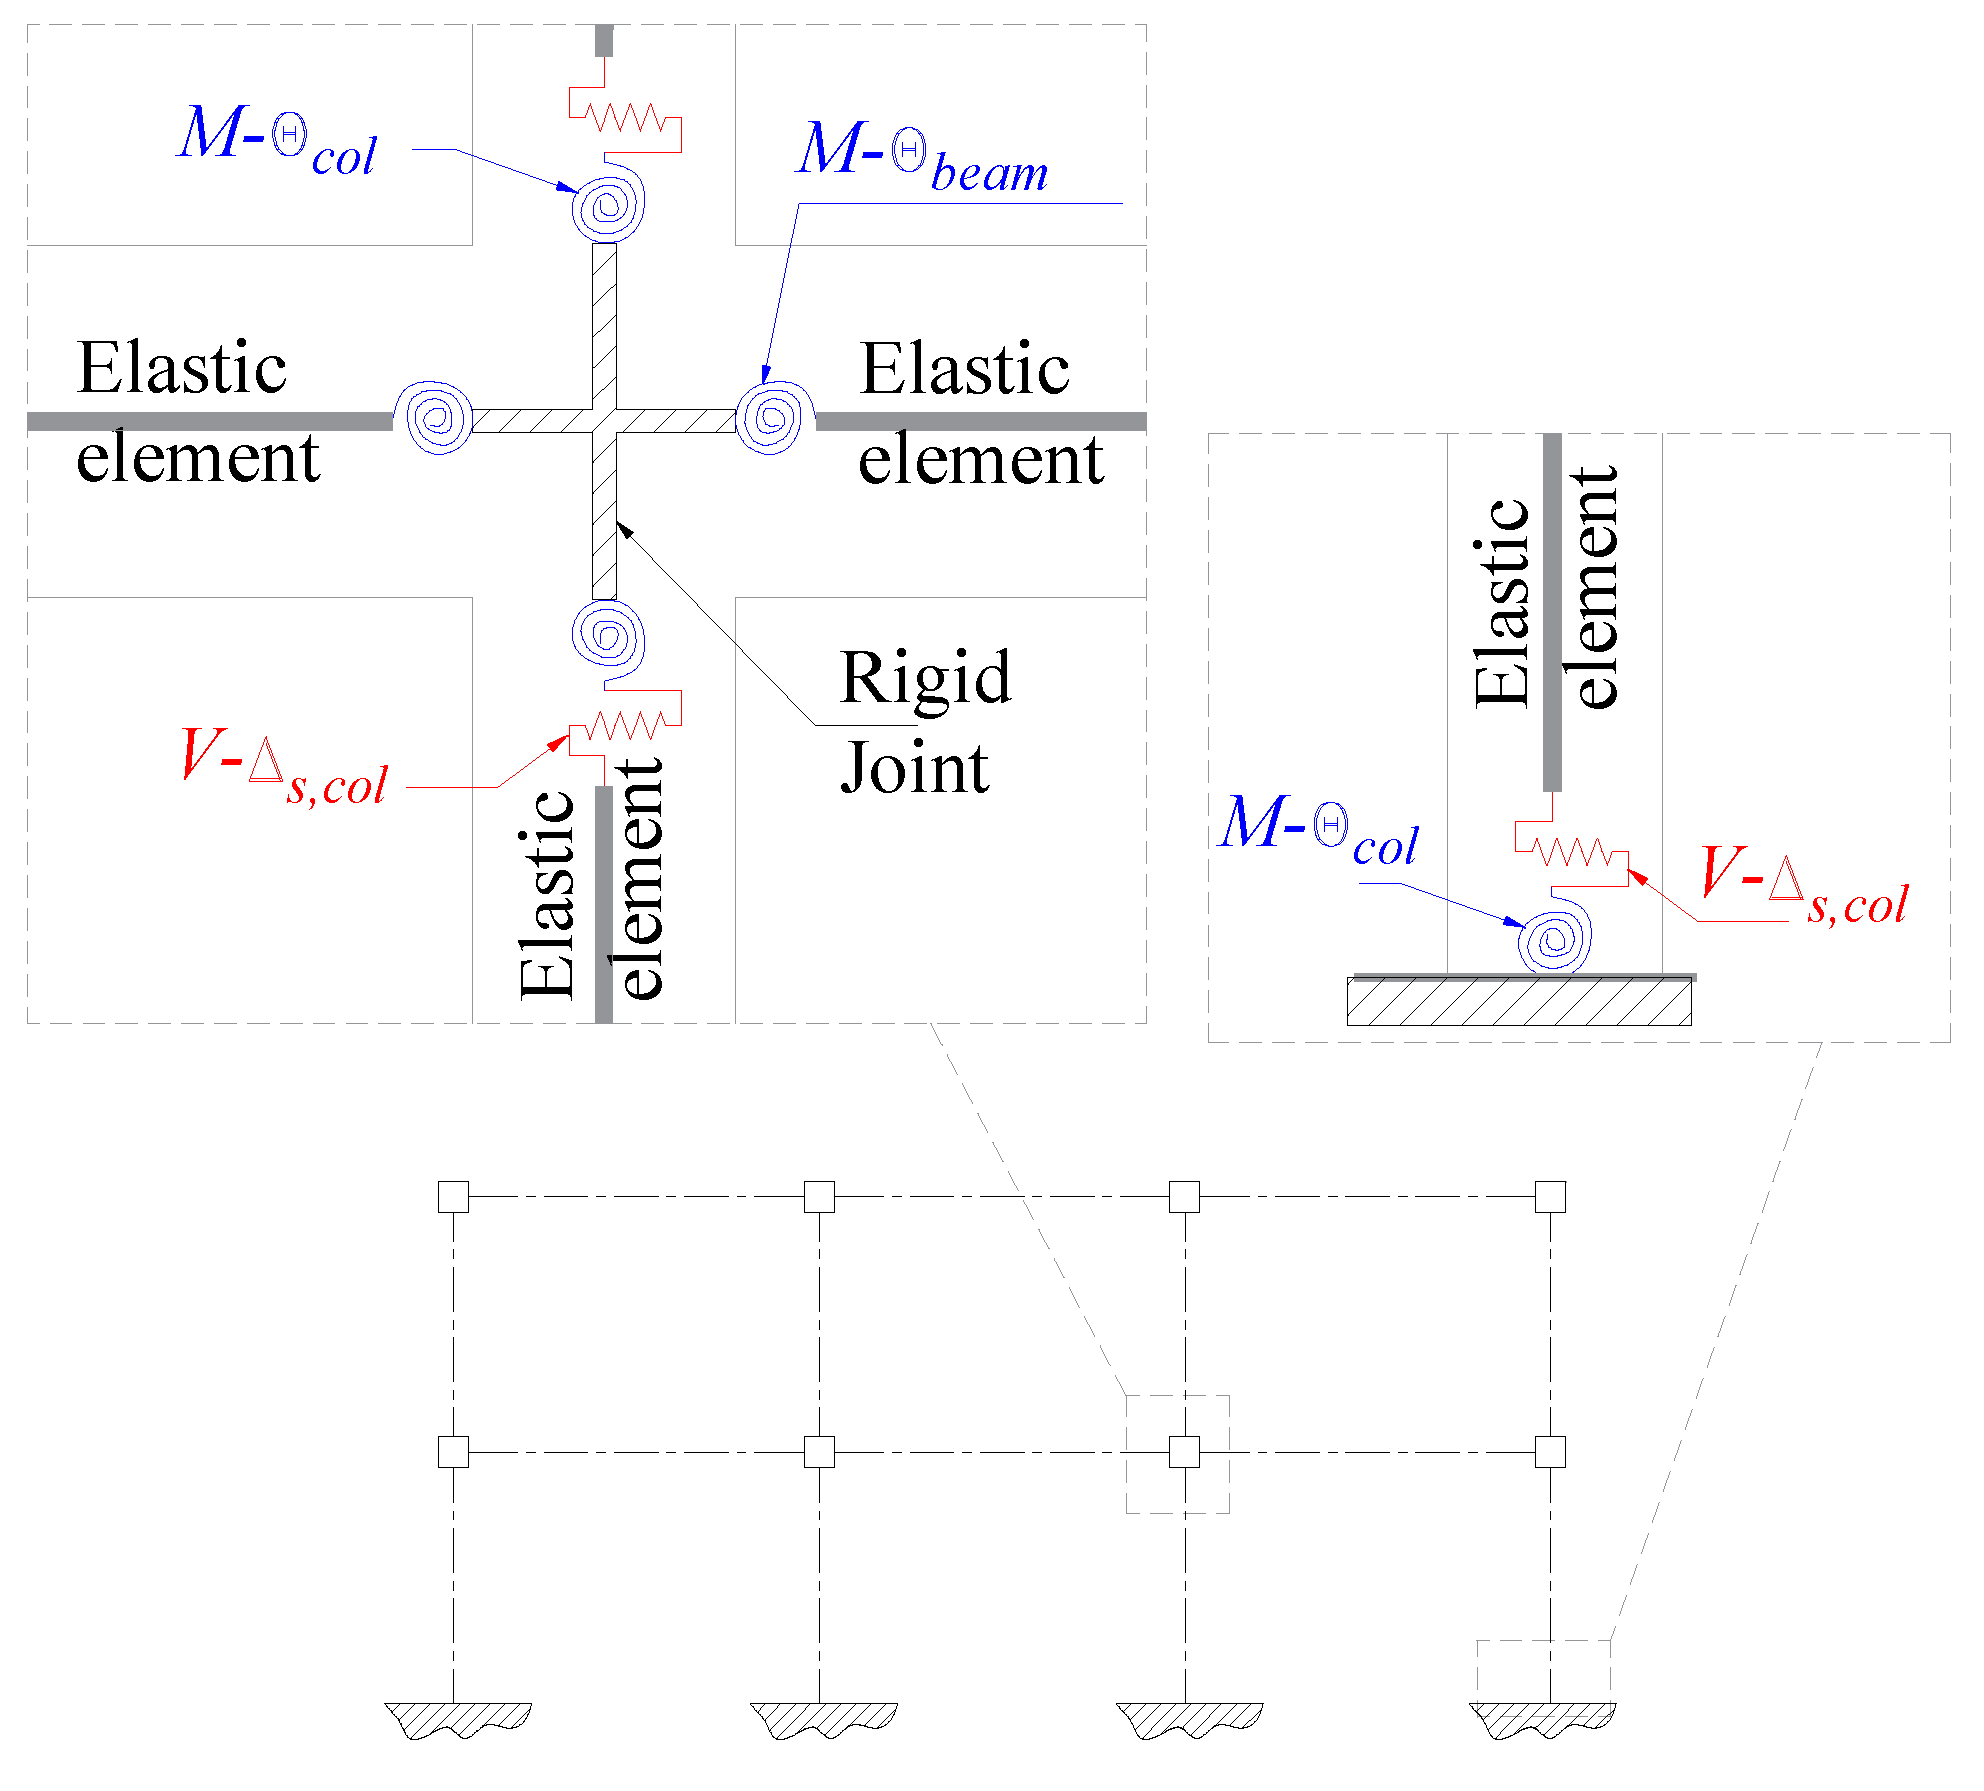
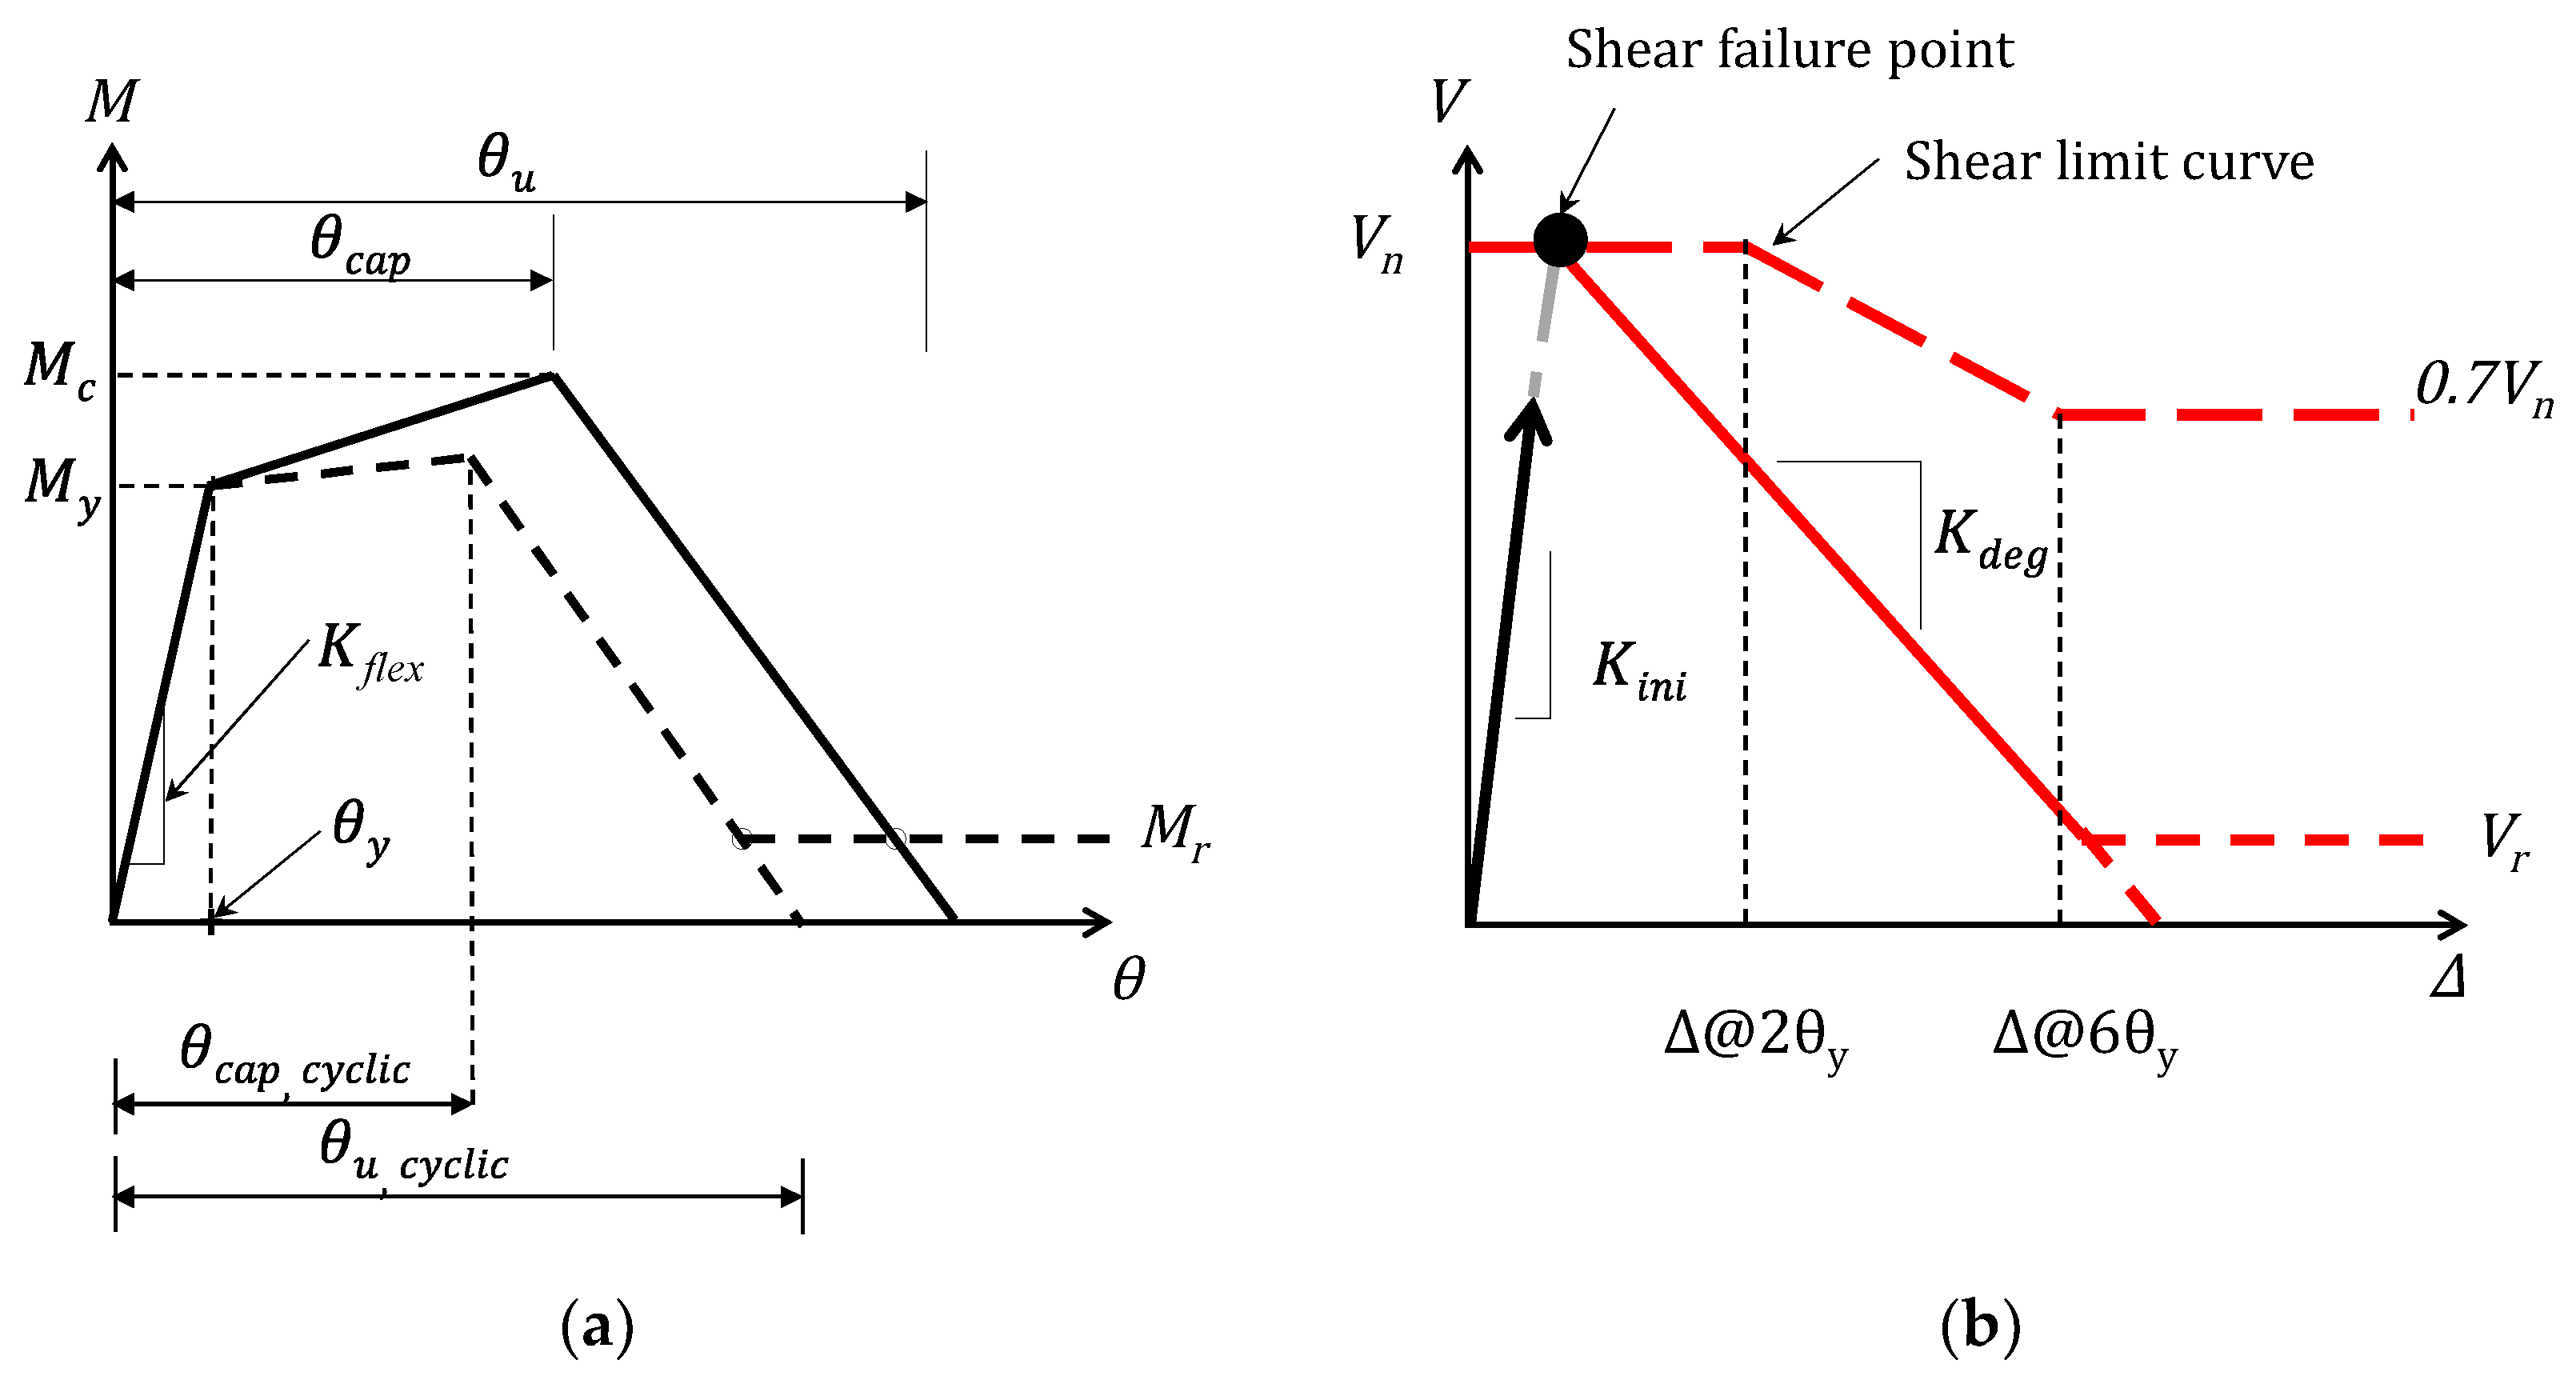
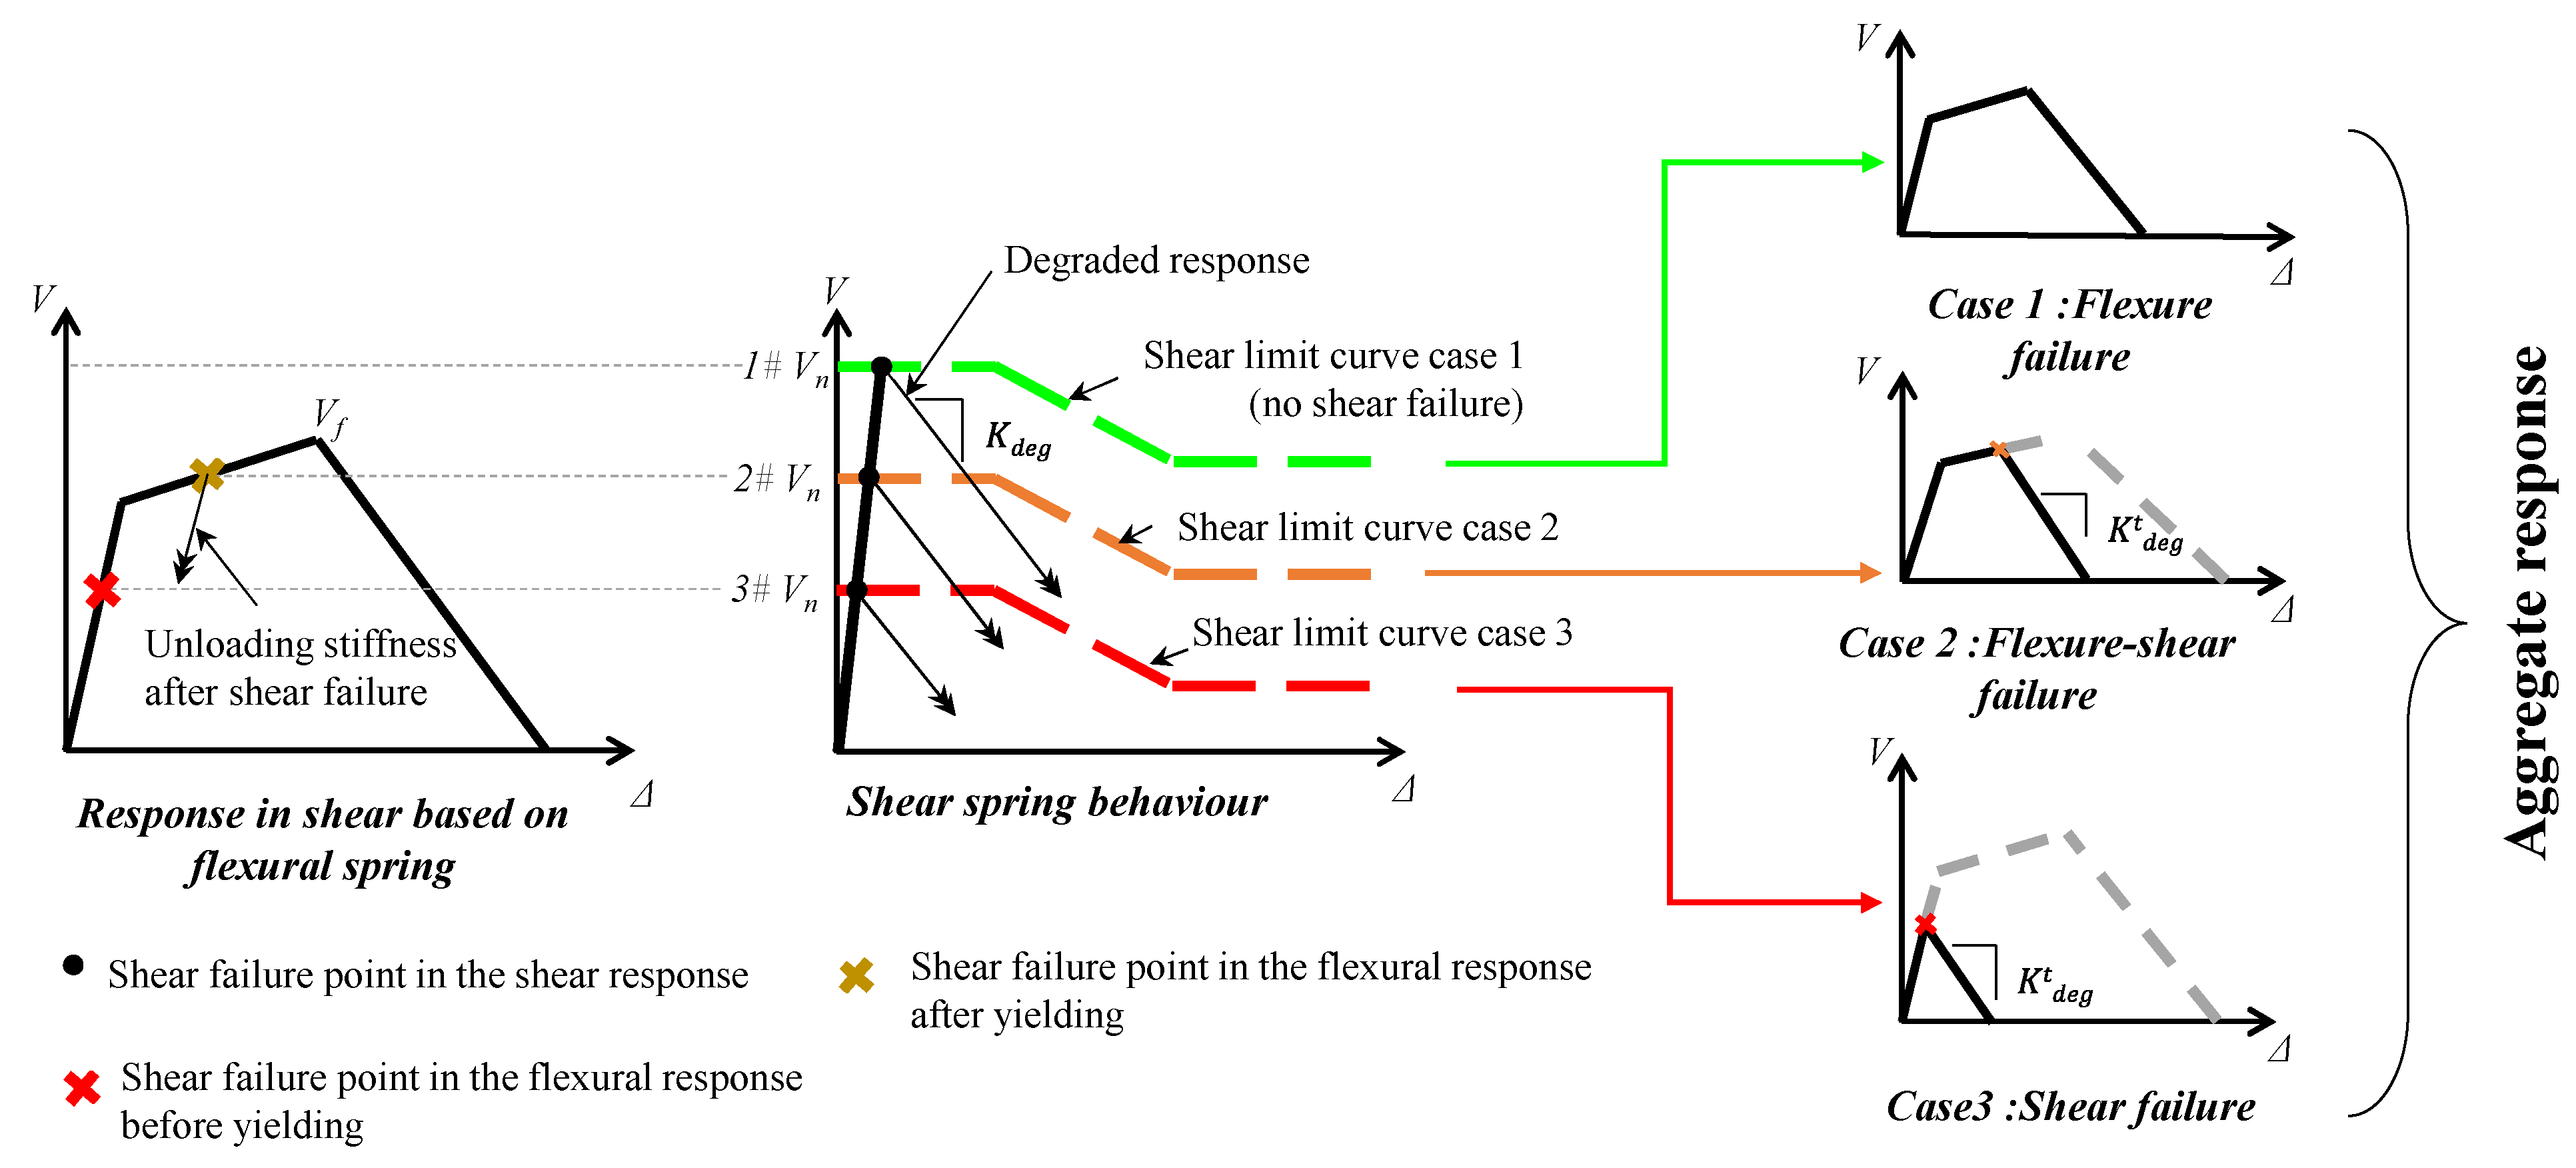
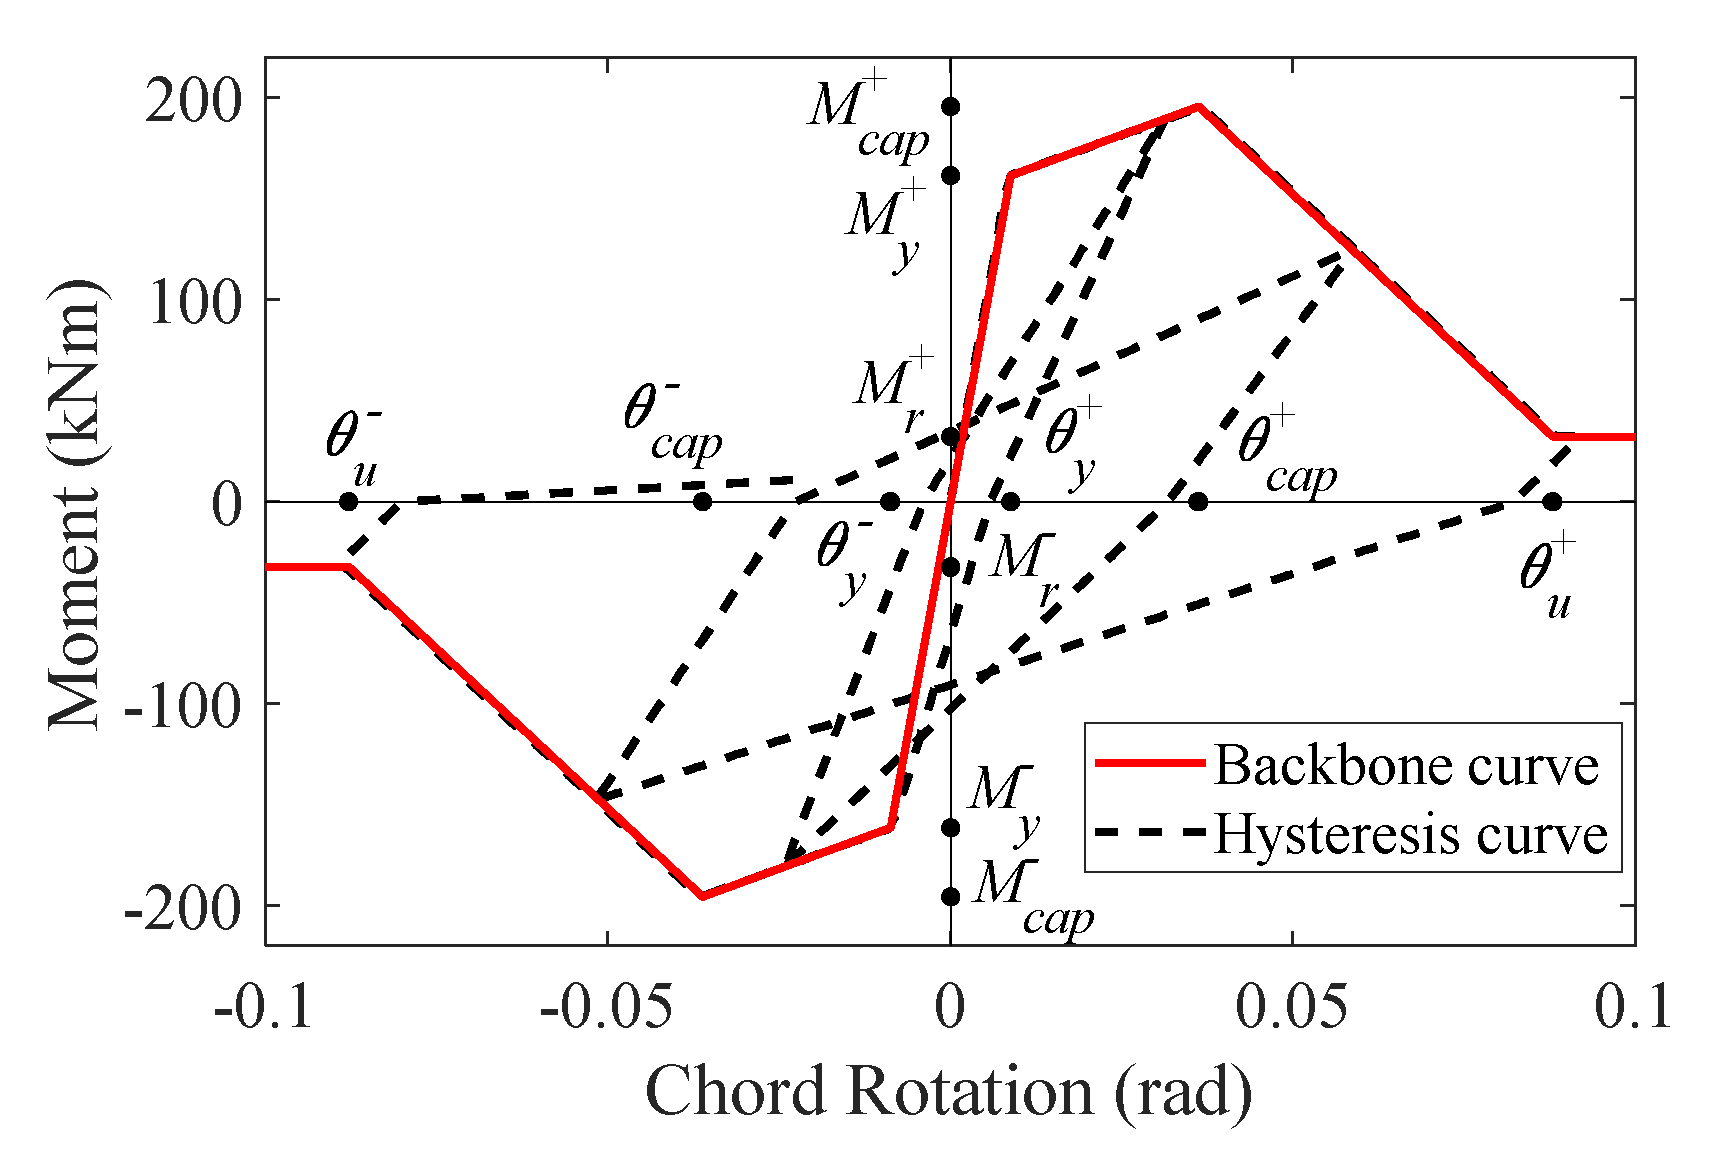
4.1. Modelling of the RC Elements
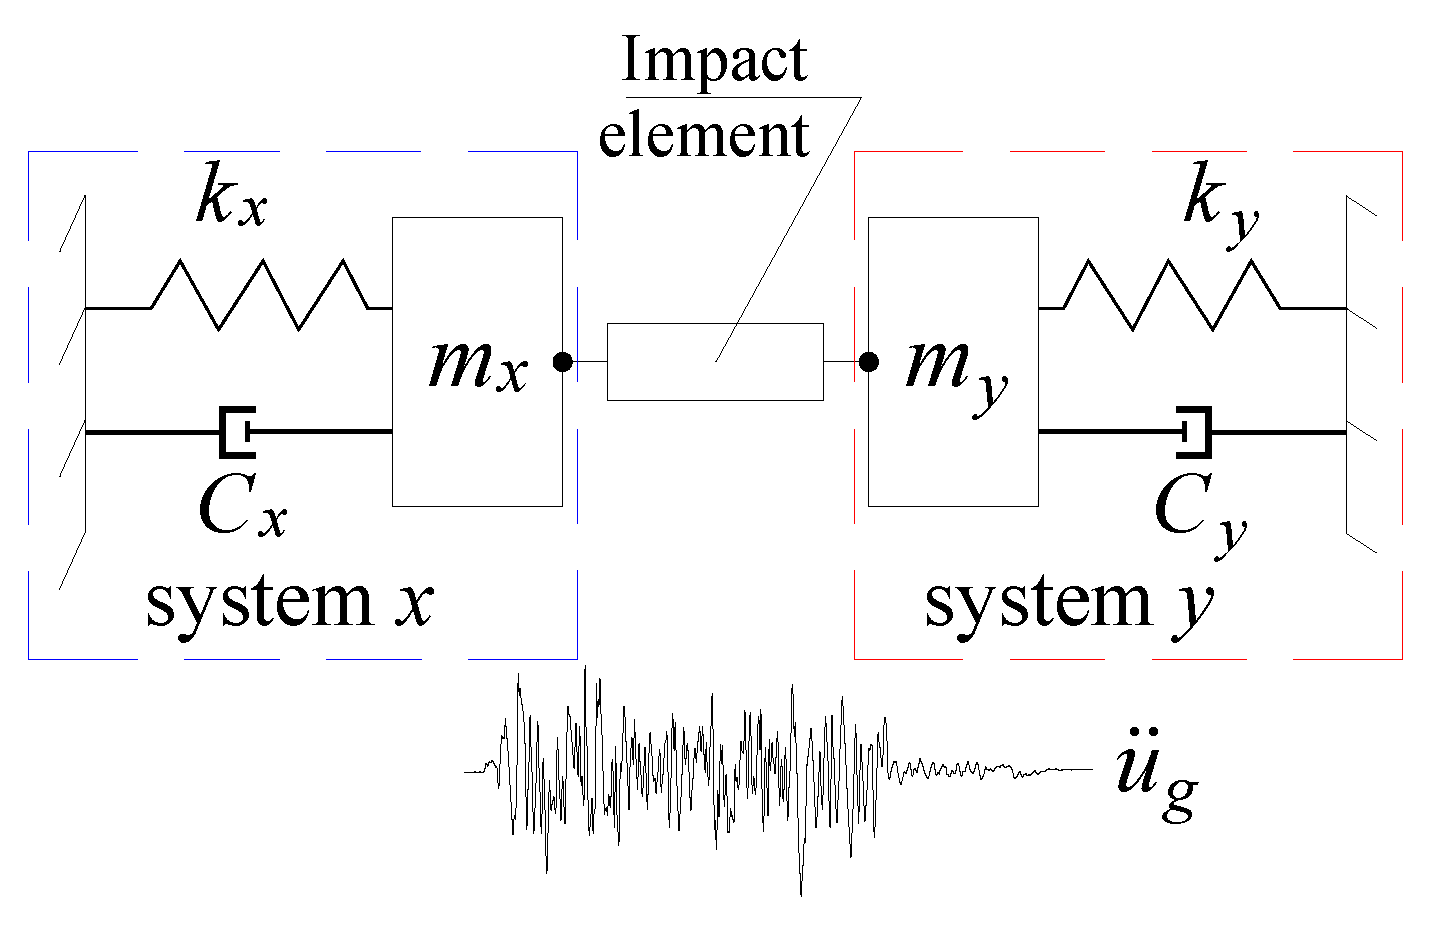
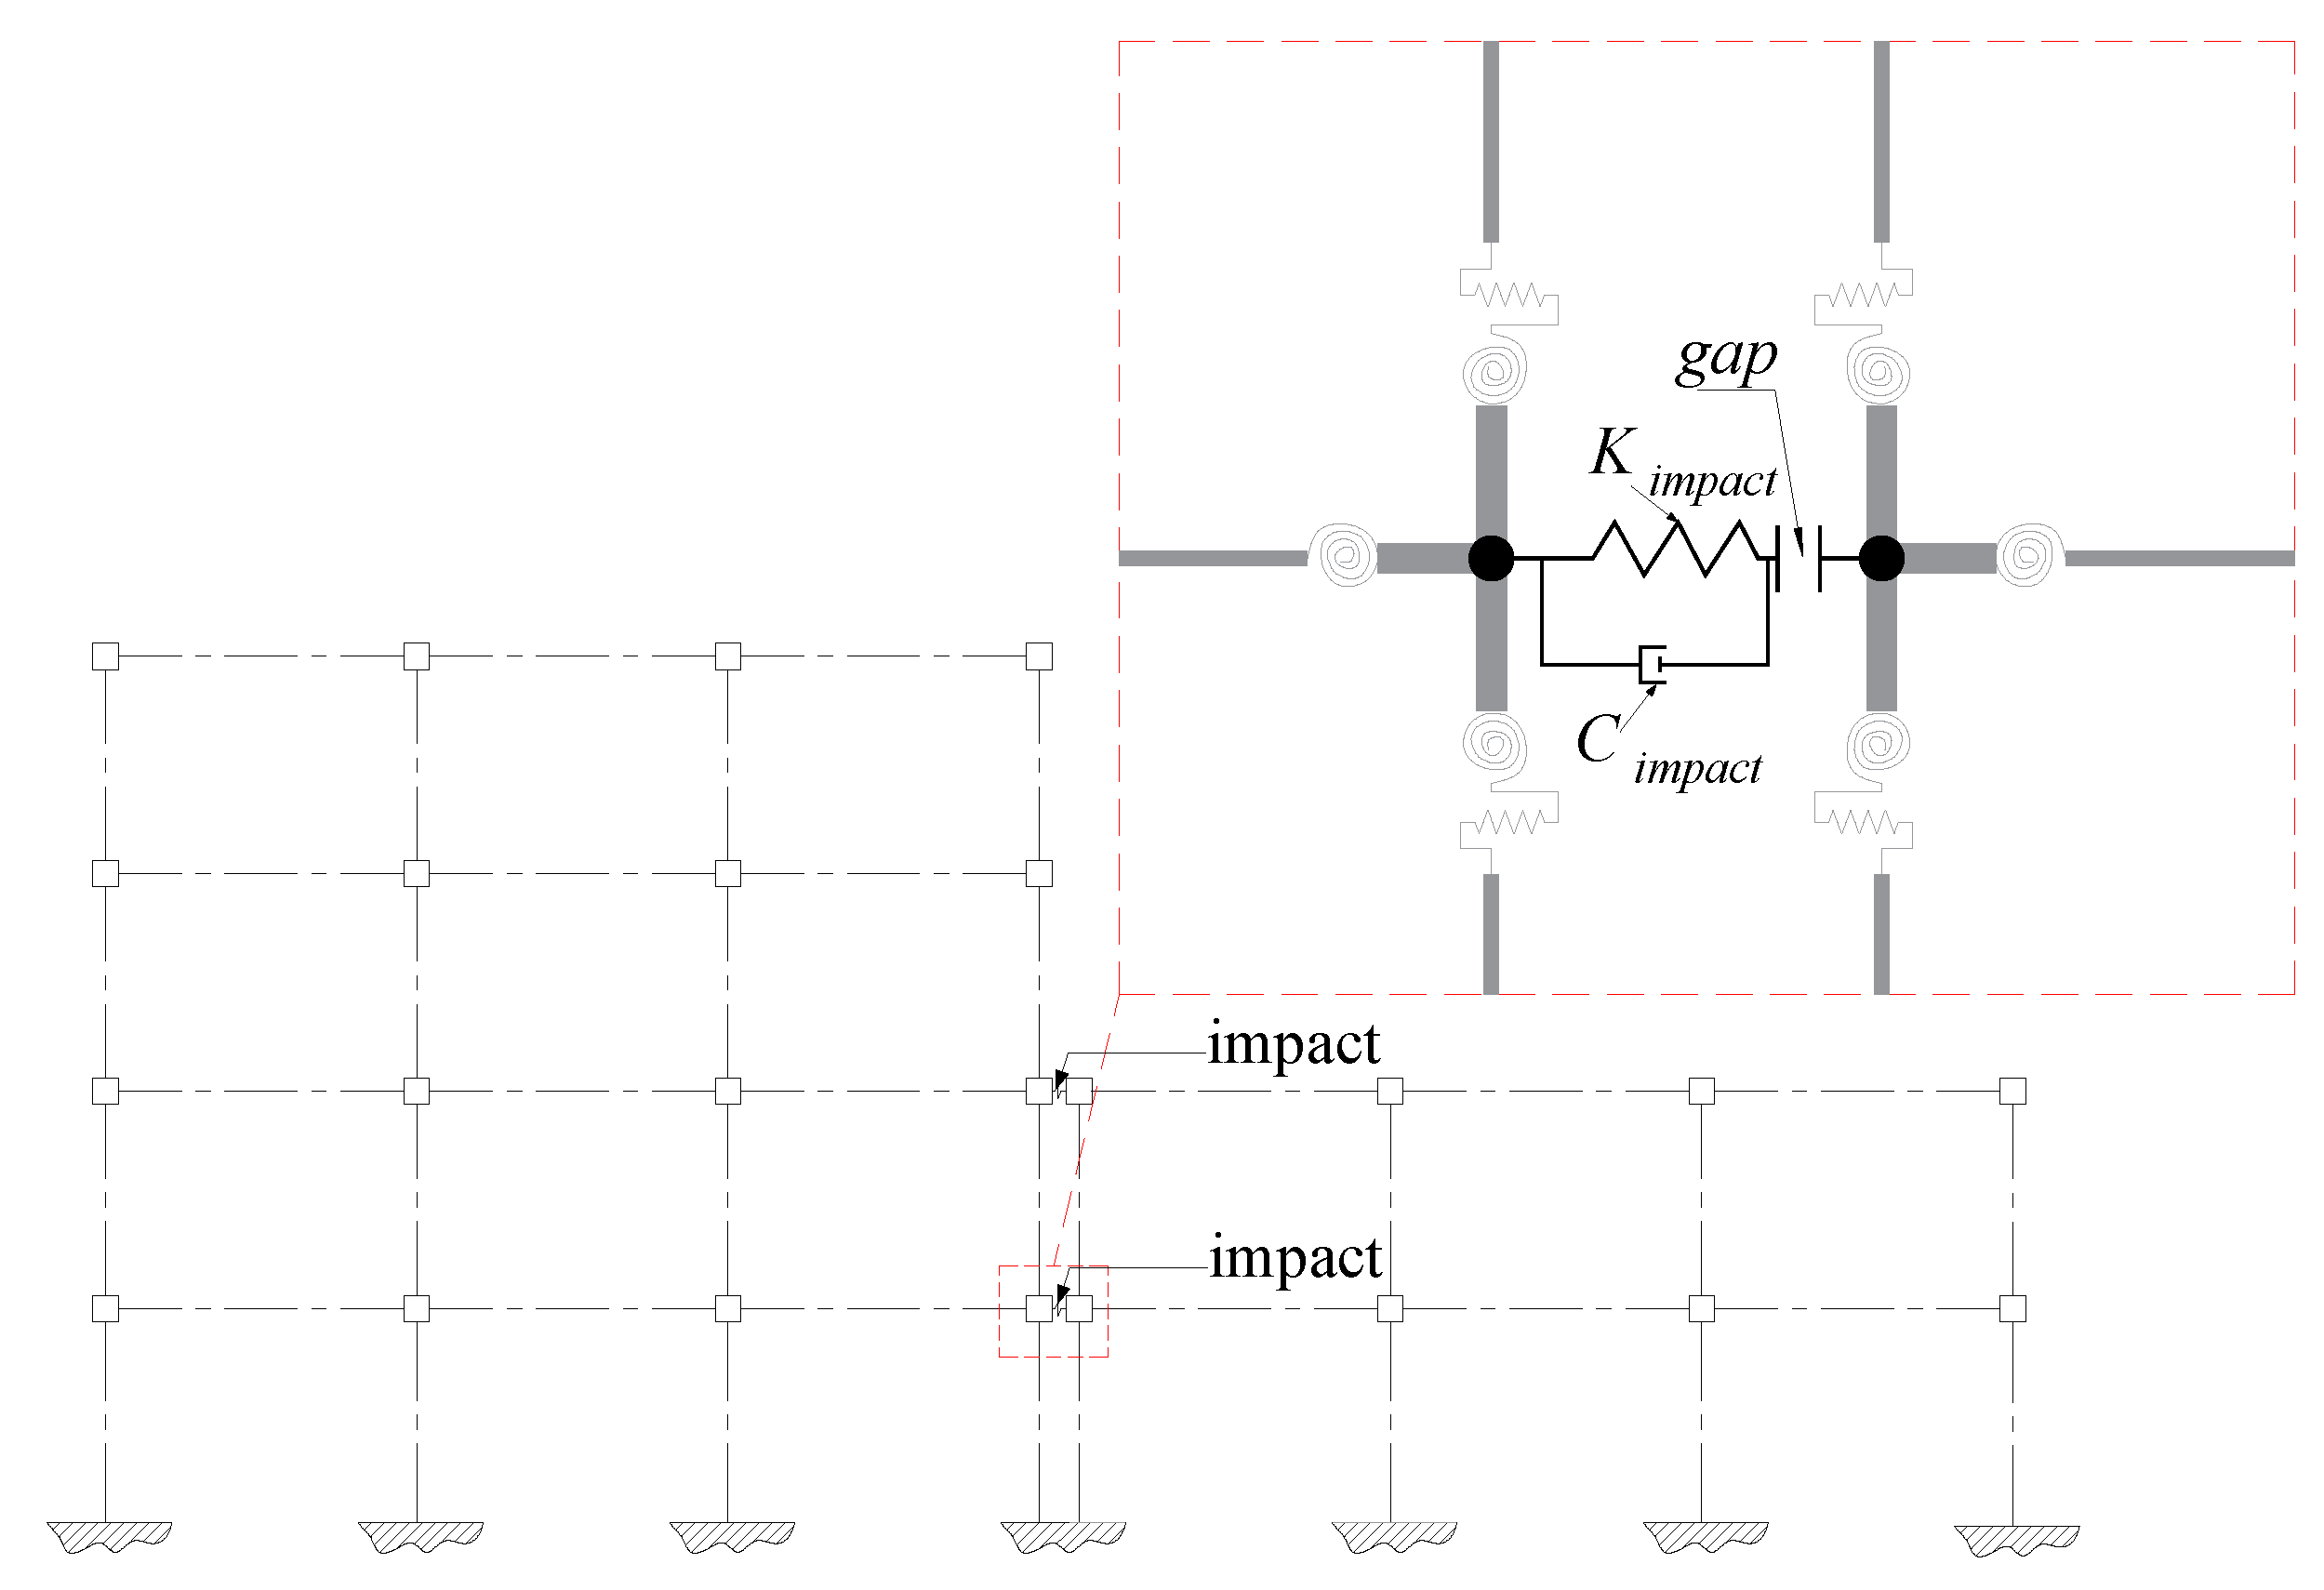
4.2. Modelling of the Impact Forces
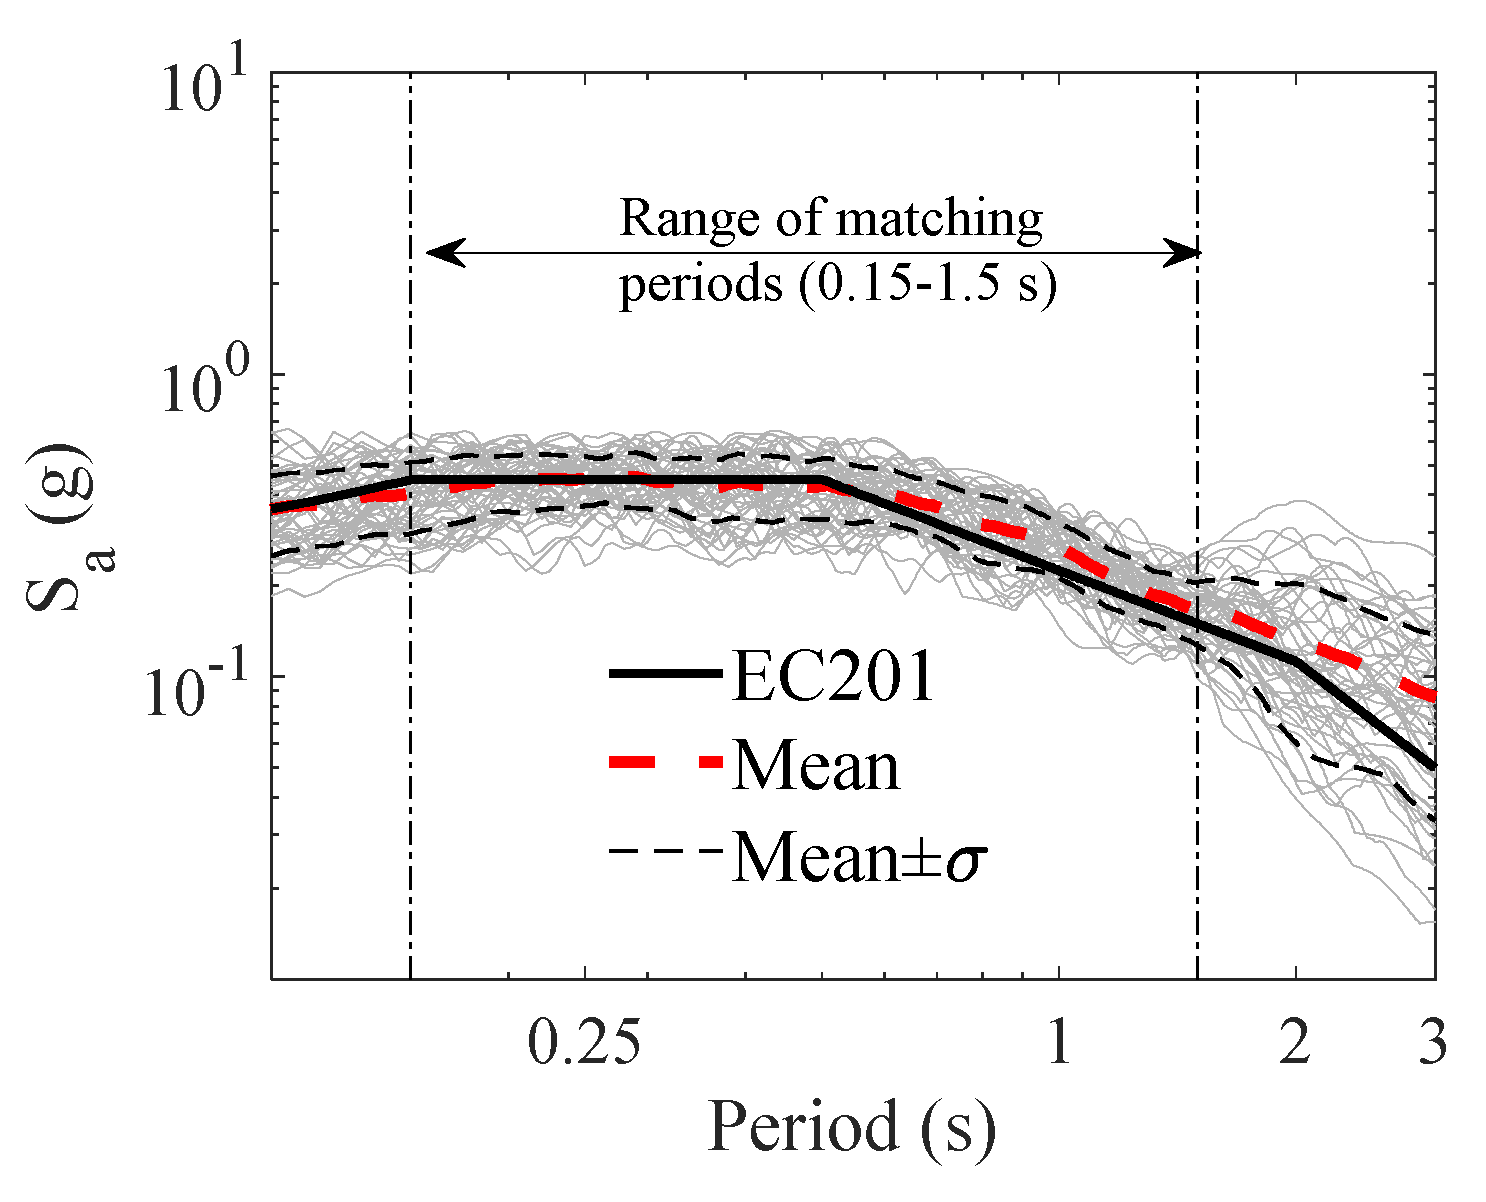
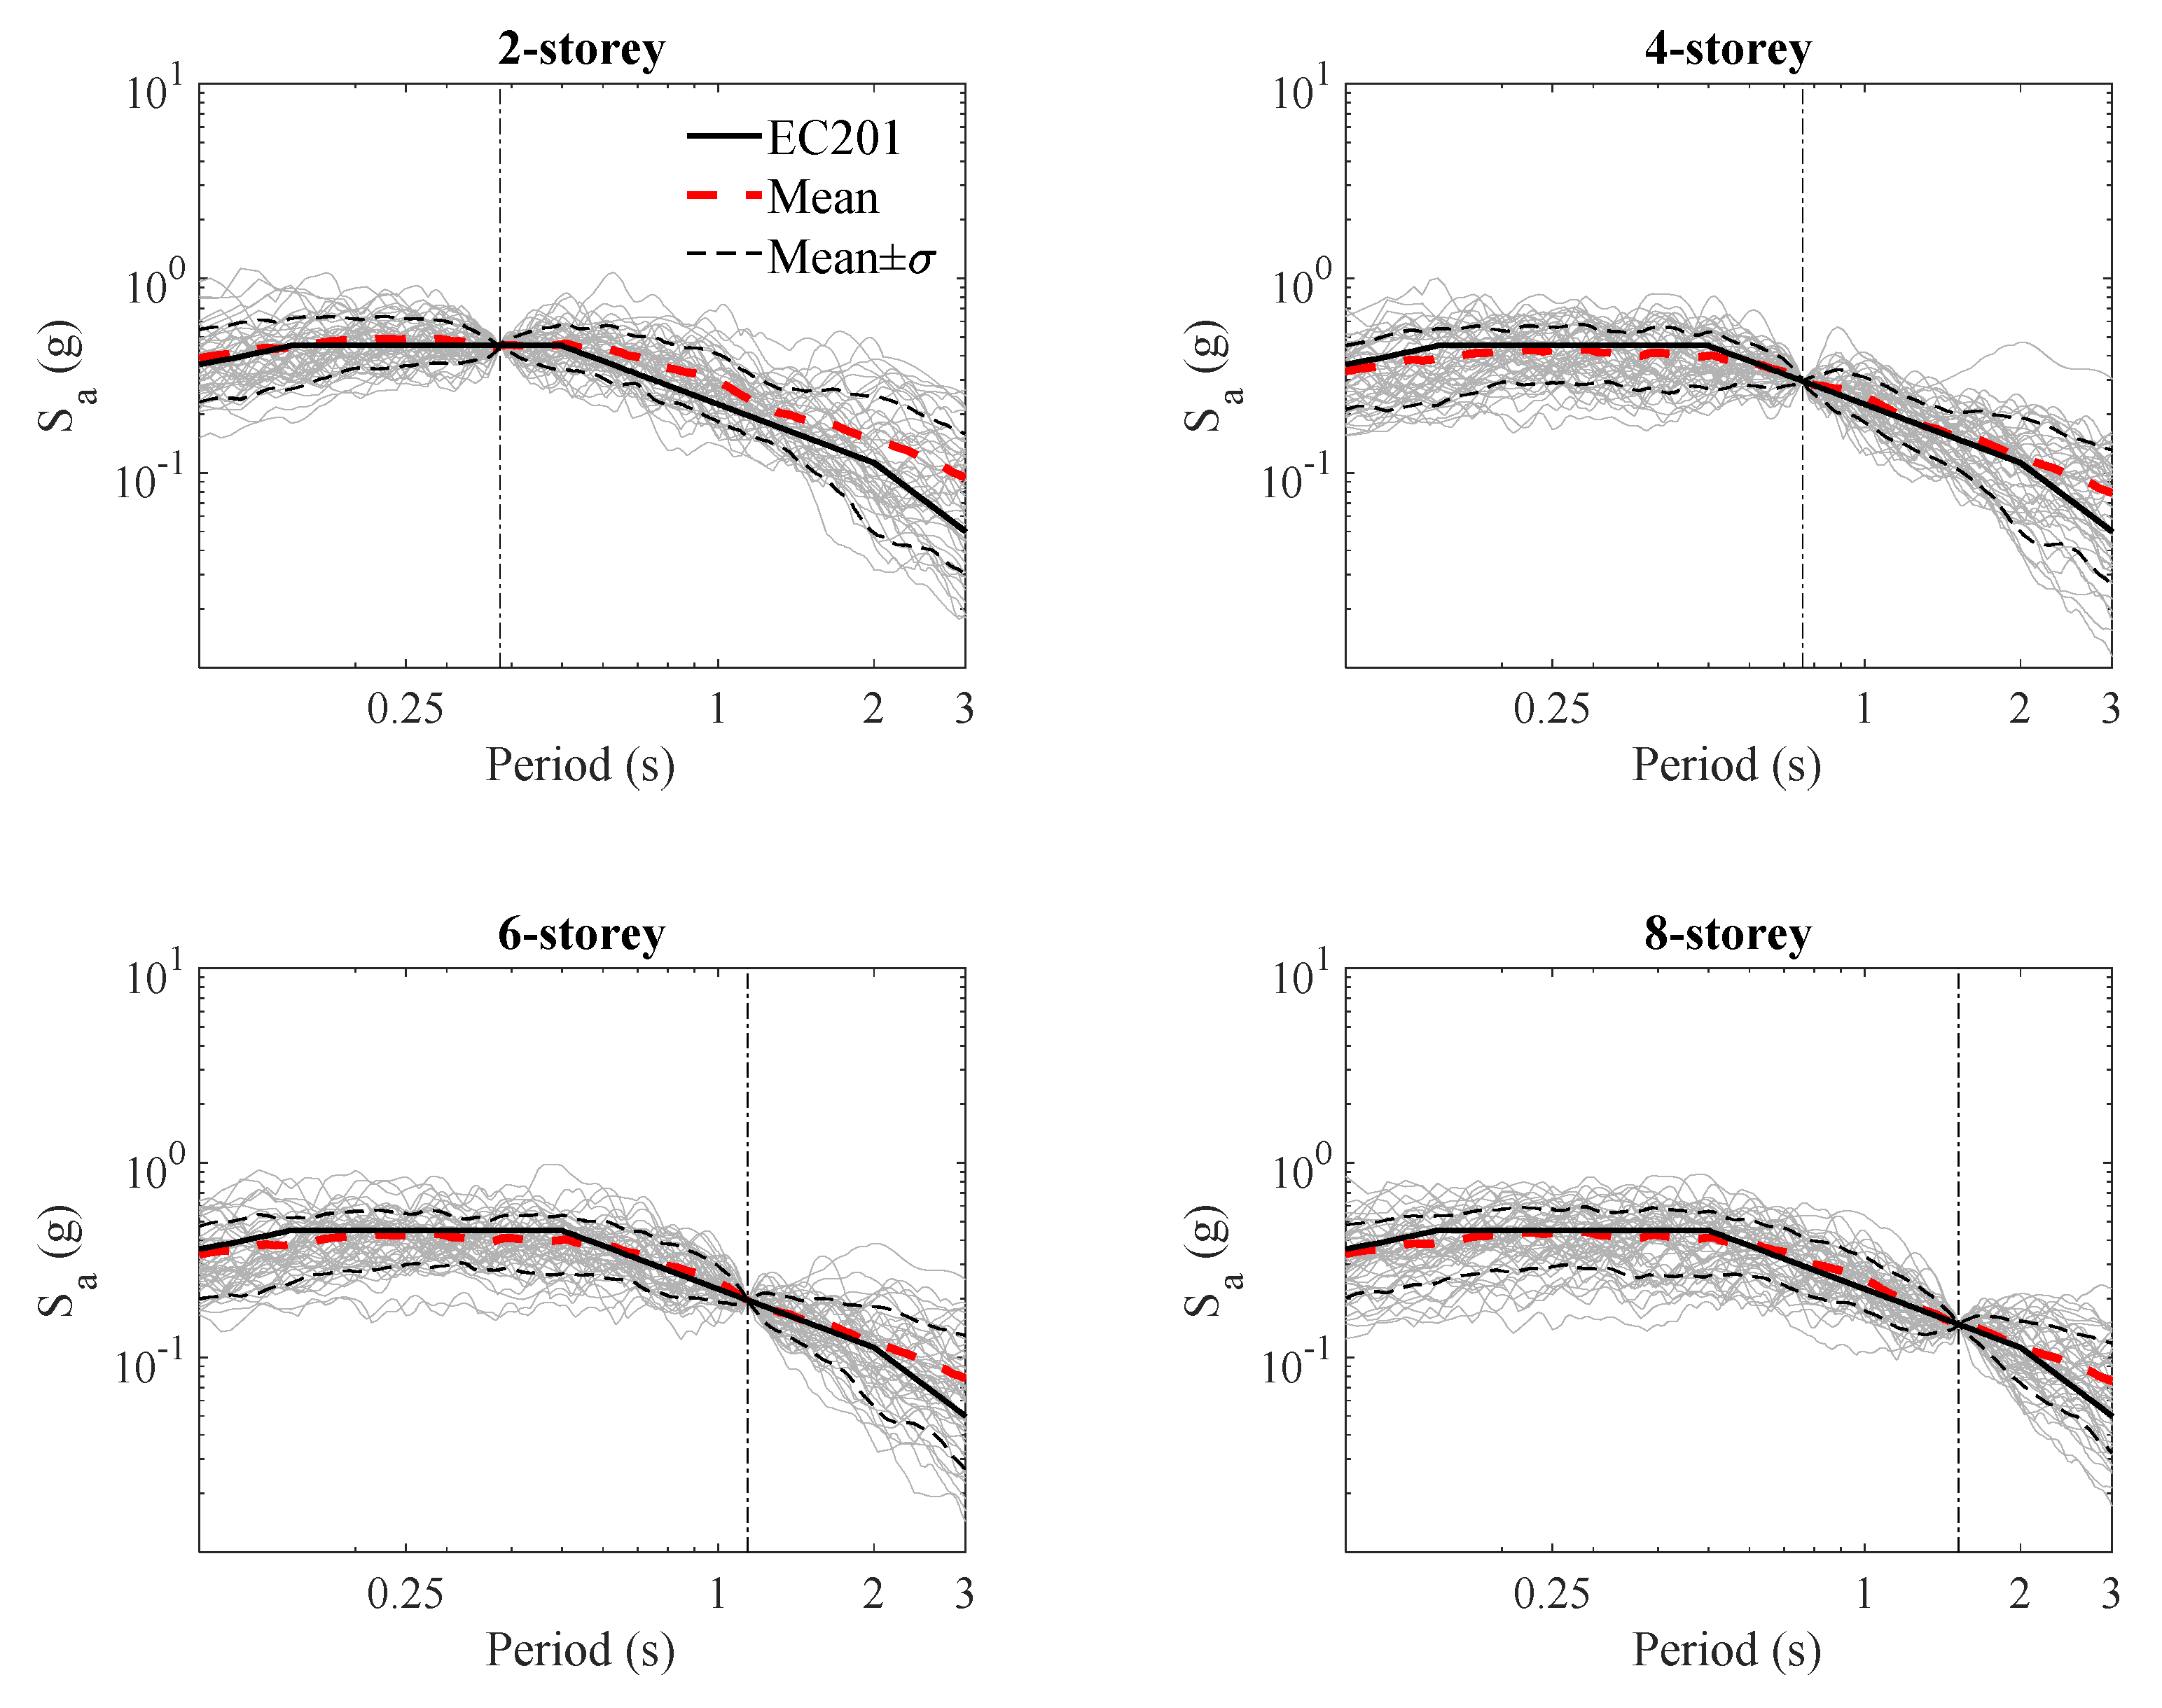
4.3. Incremental Dynamic Analysis and Ground Motion Selection
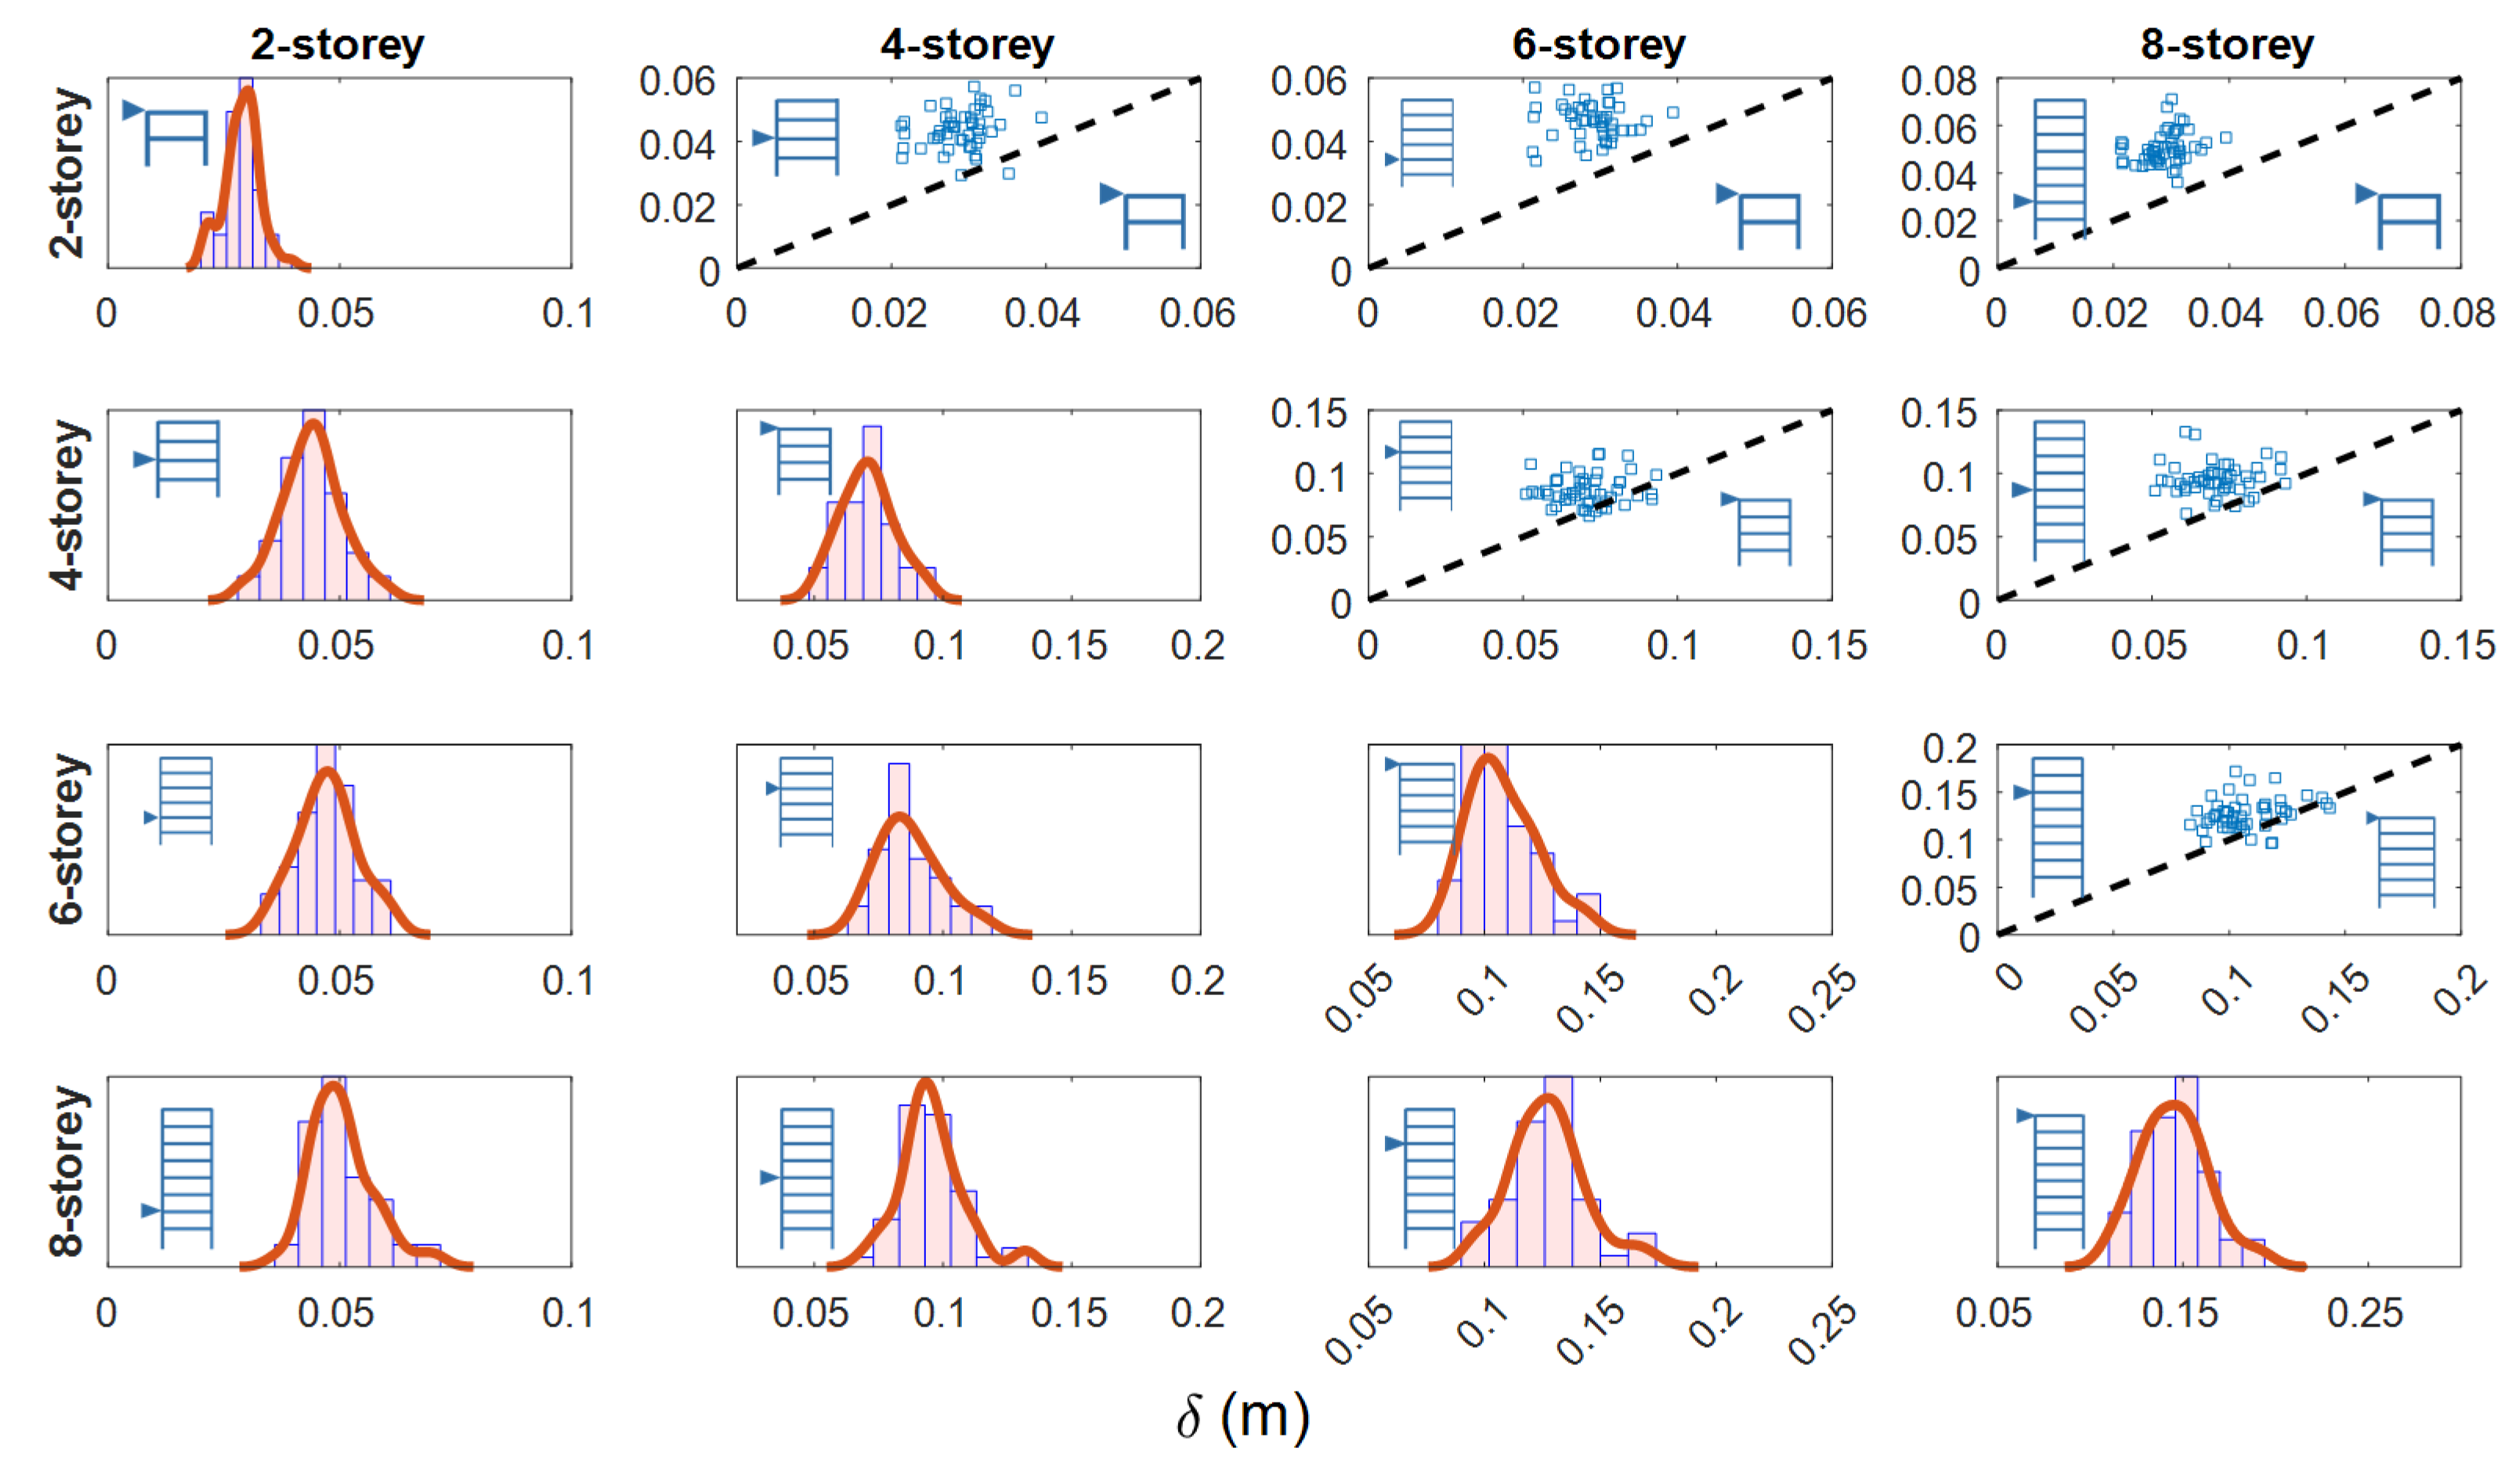
4.4. Probabilistic Definition of the Separation Distance between the Buildings
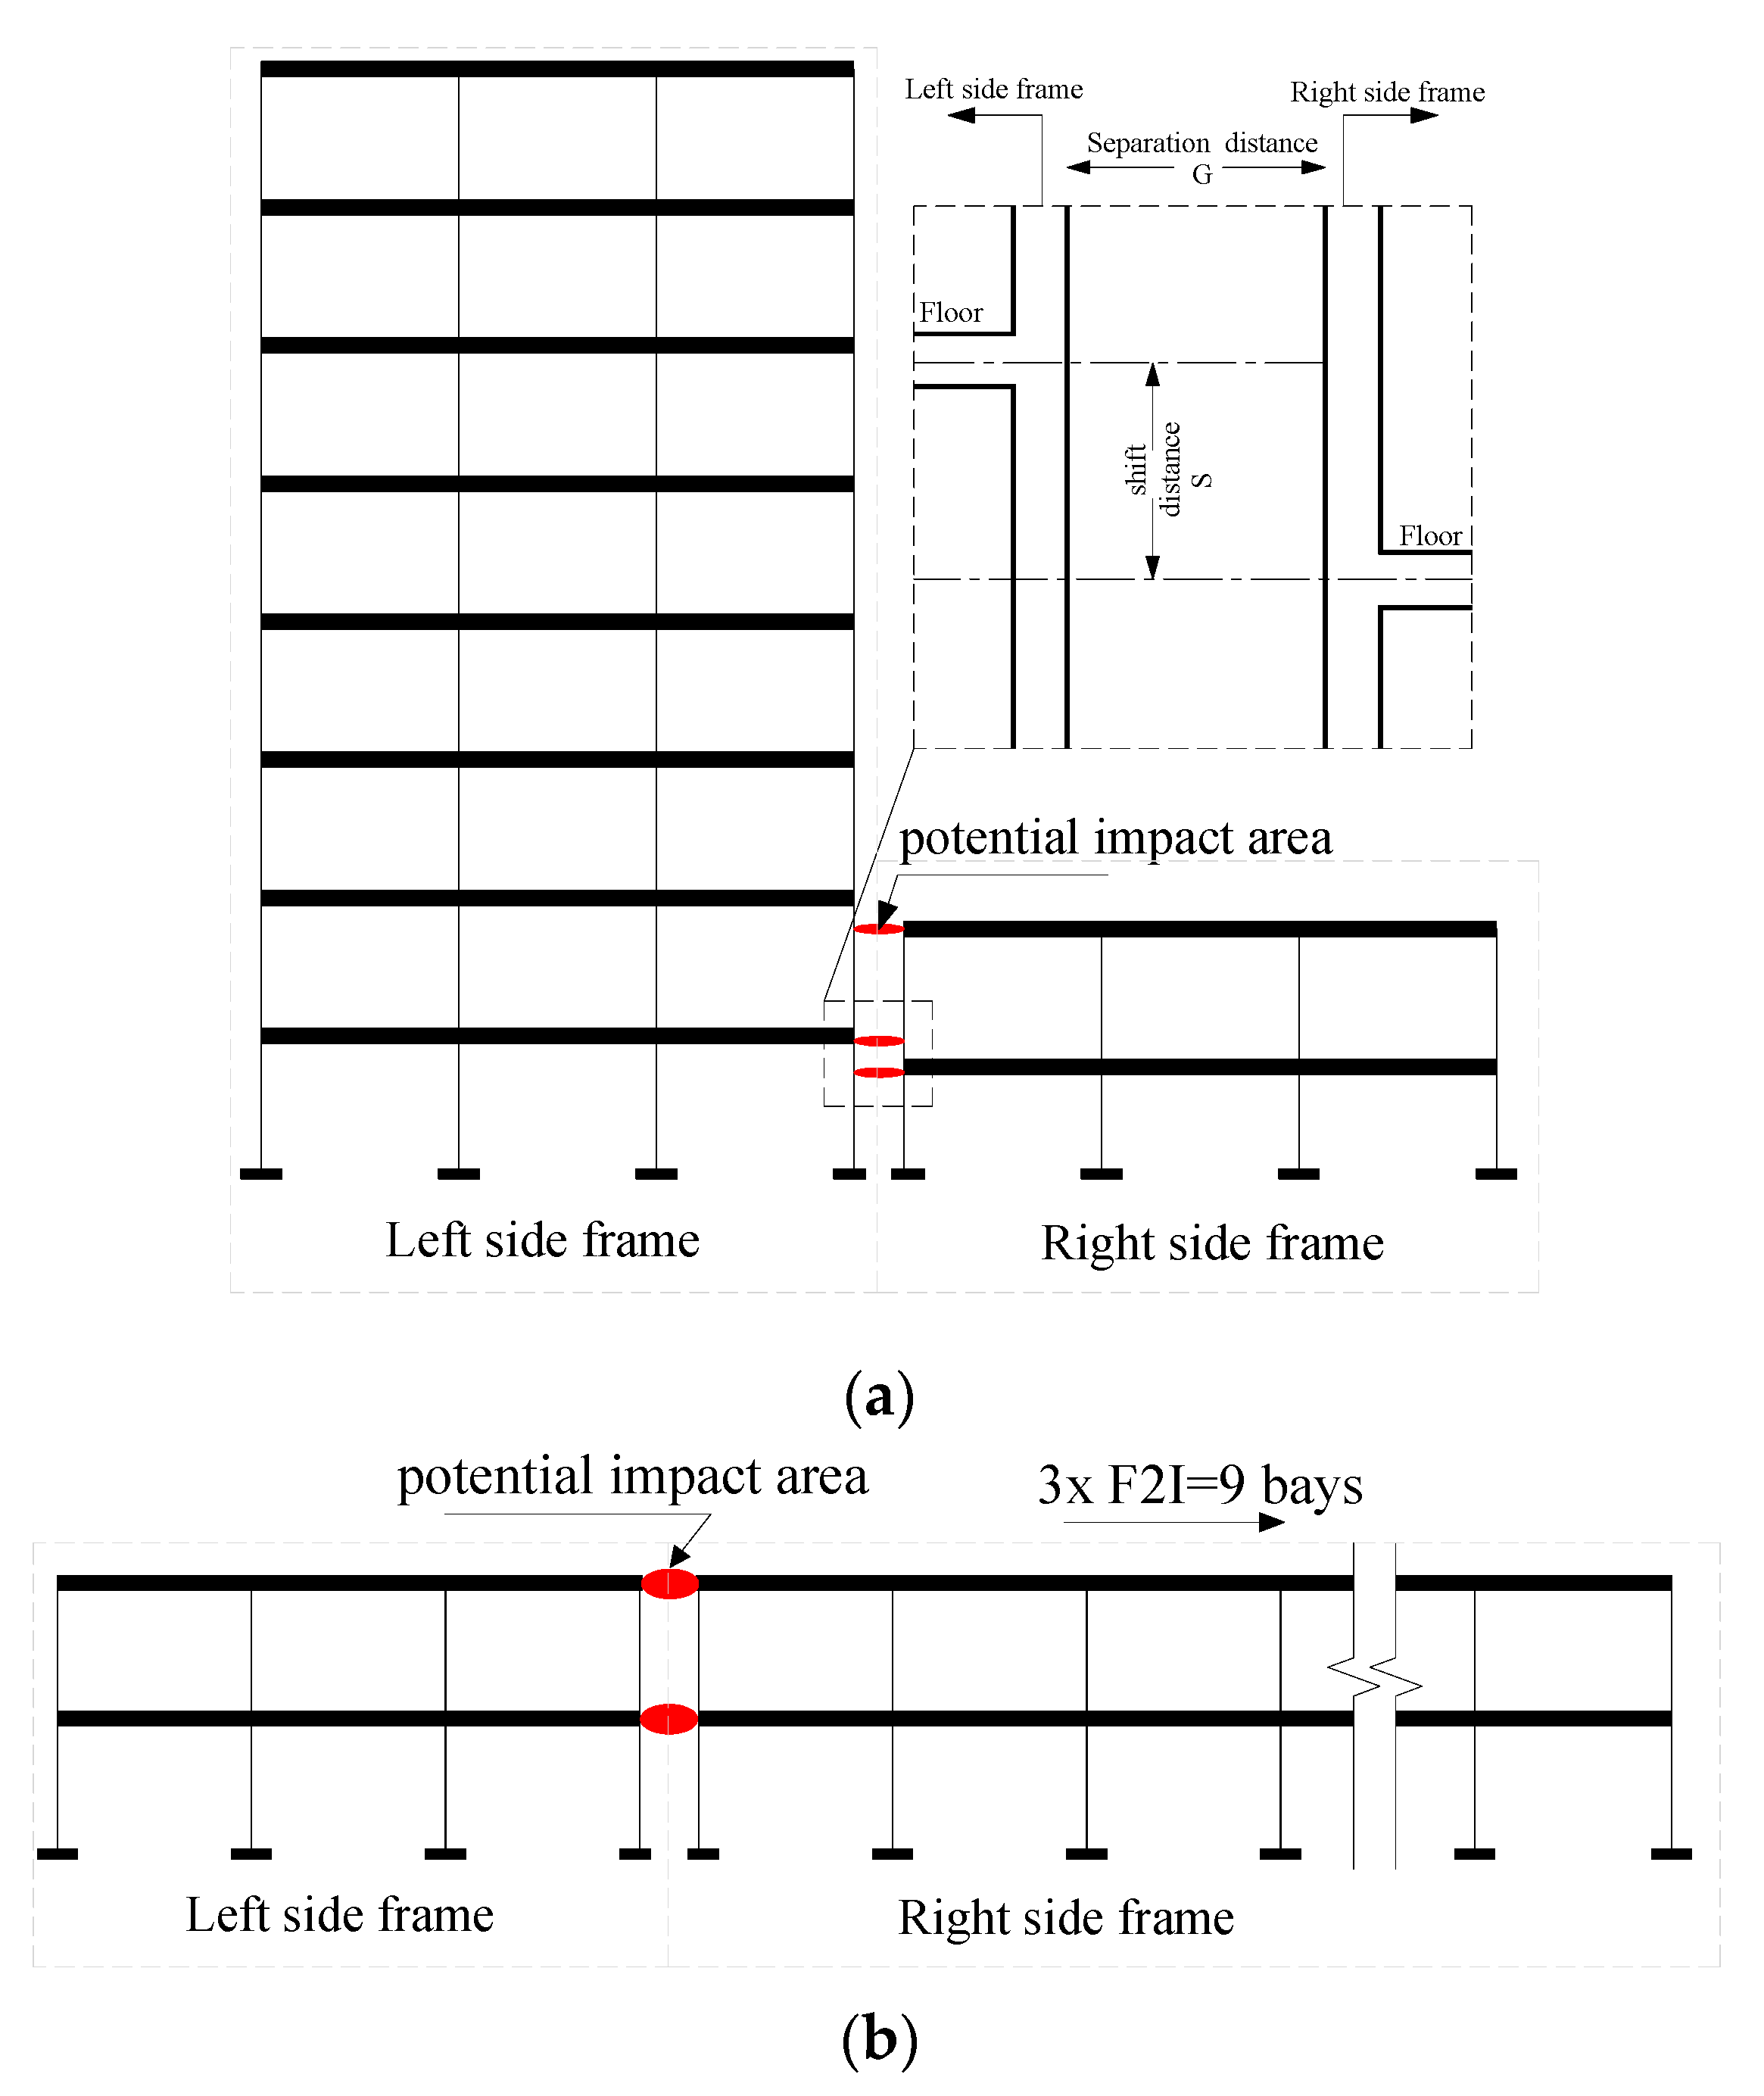
4.5. Considered Pounding Configurations
5. Behaviour of the Analysed Structures
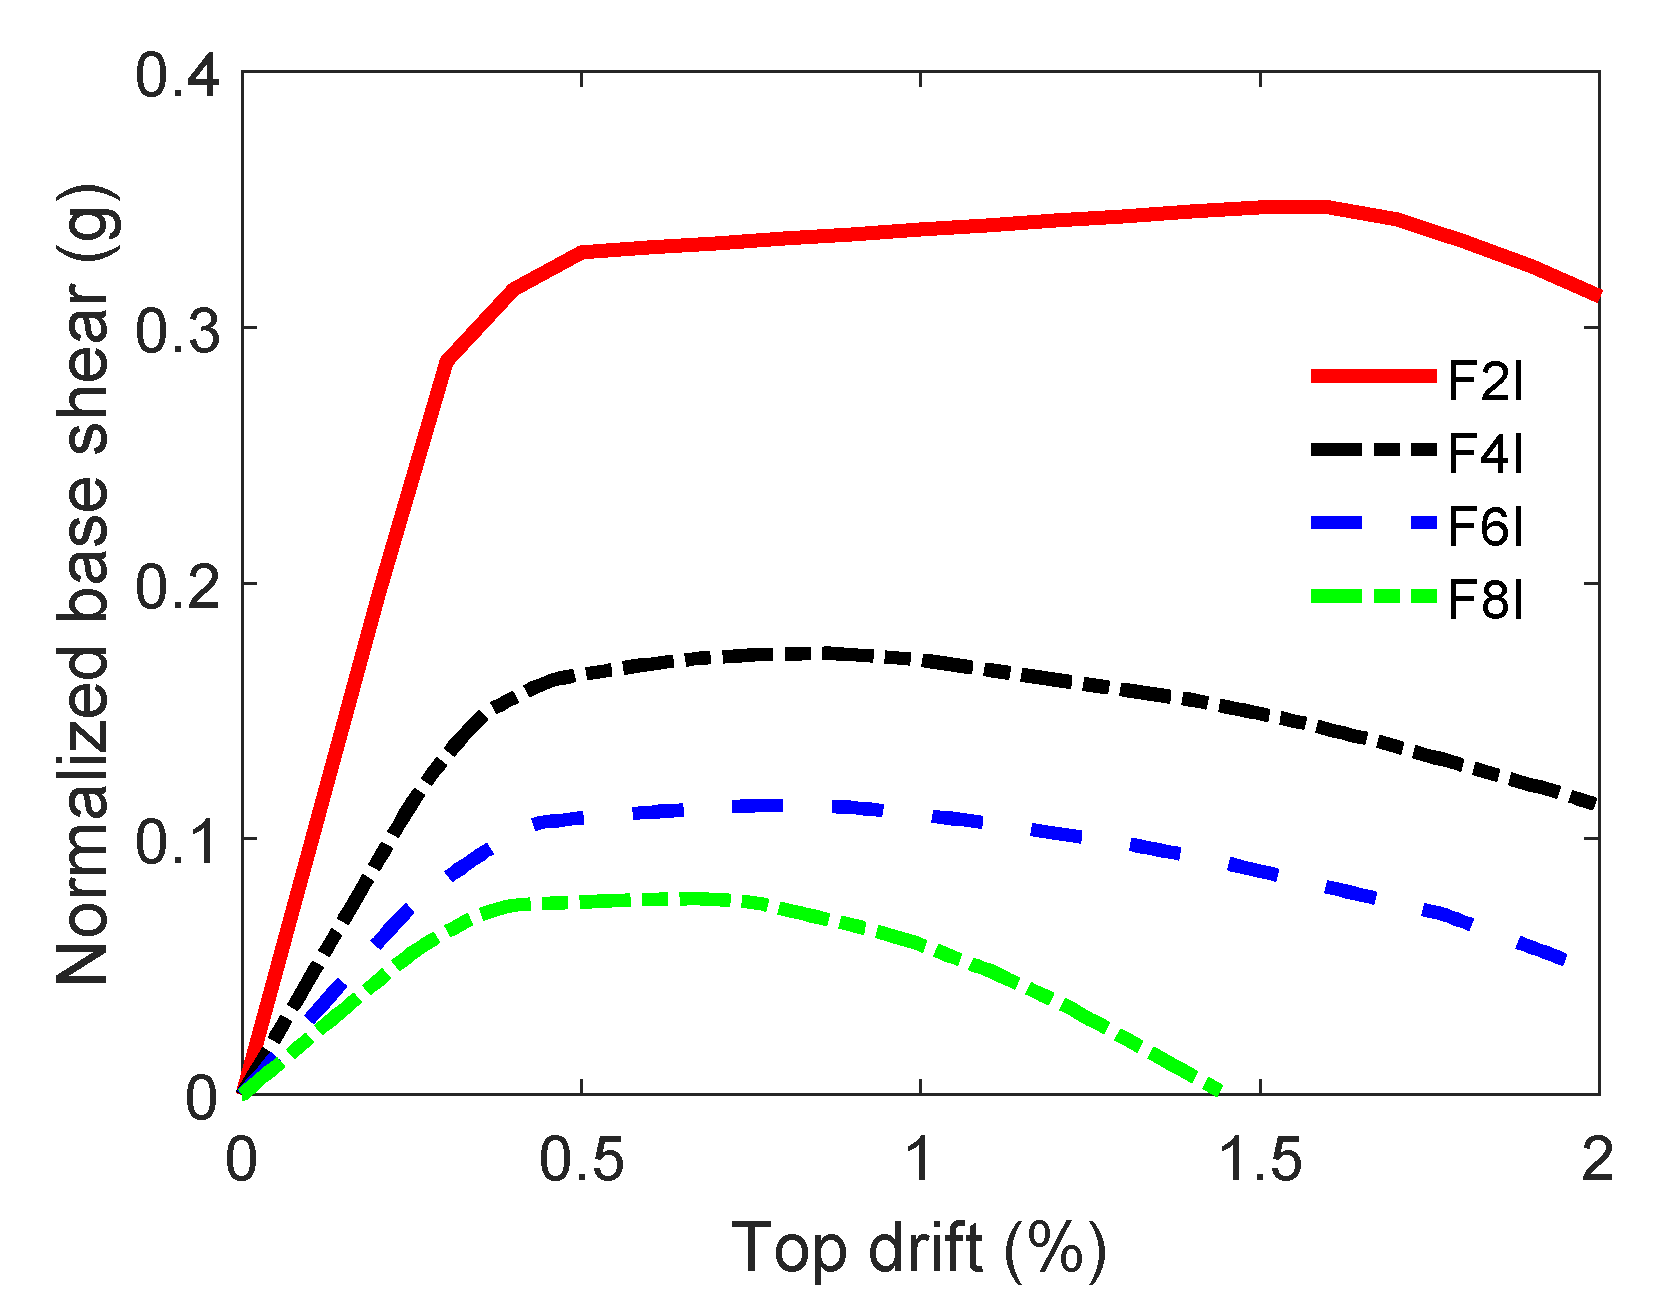
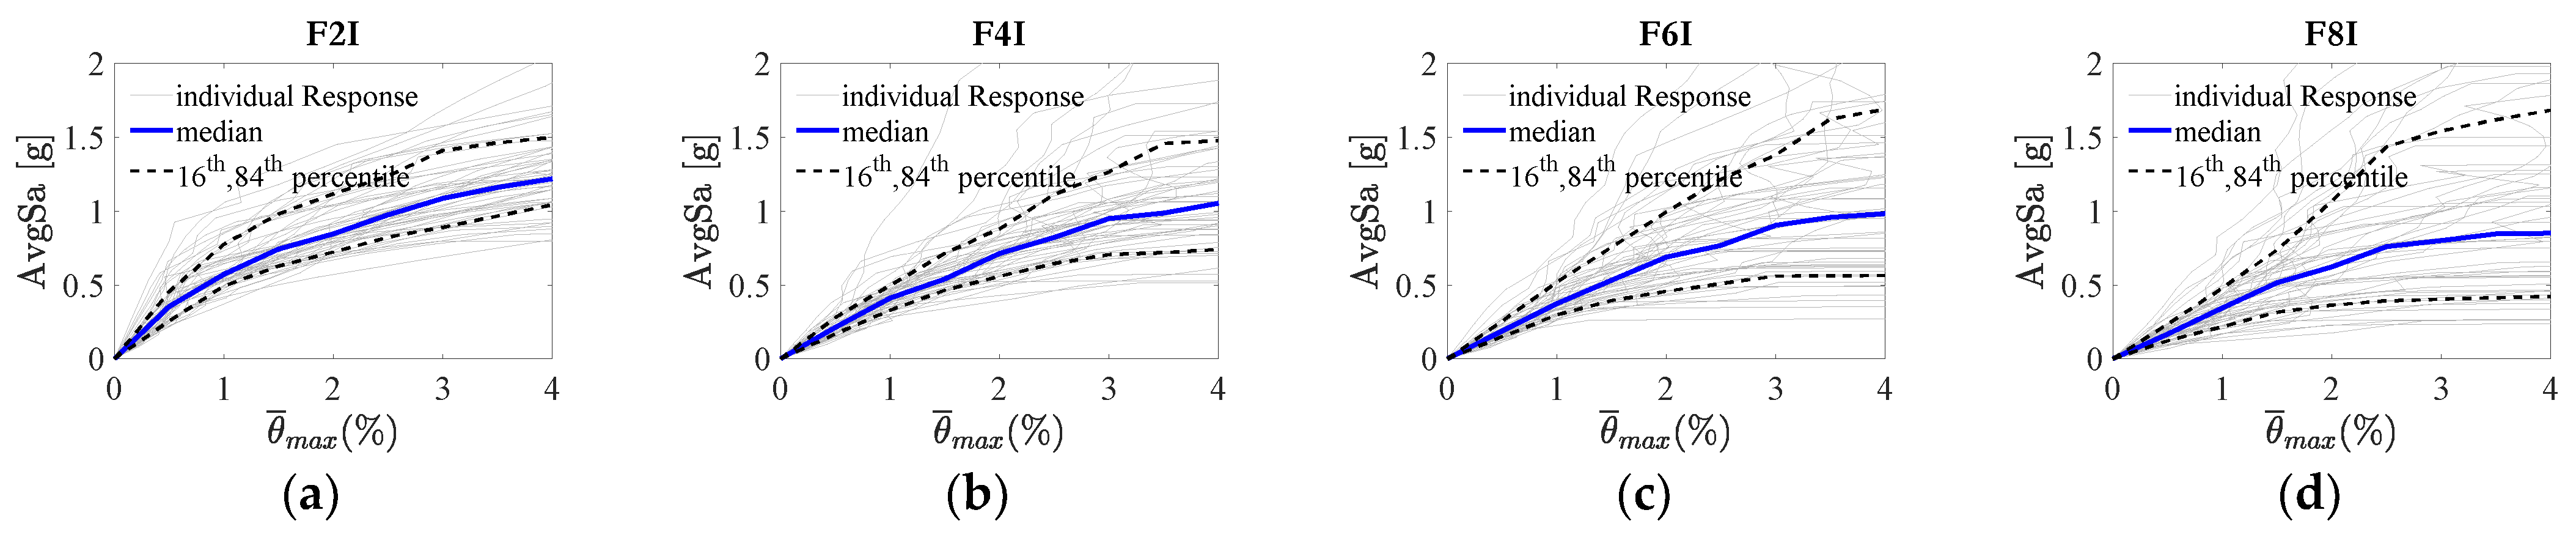
5.1. Capacity Curves and IDA Curves of the Control Cases
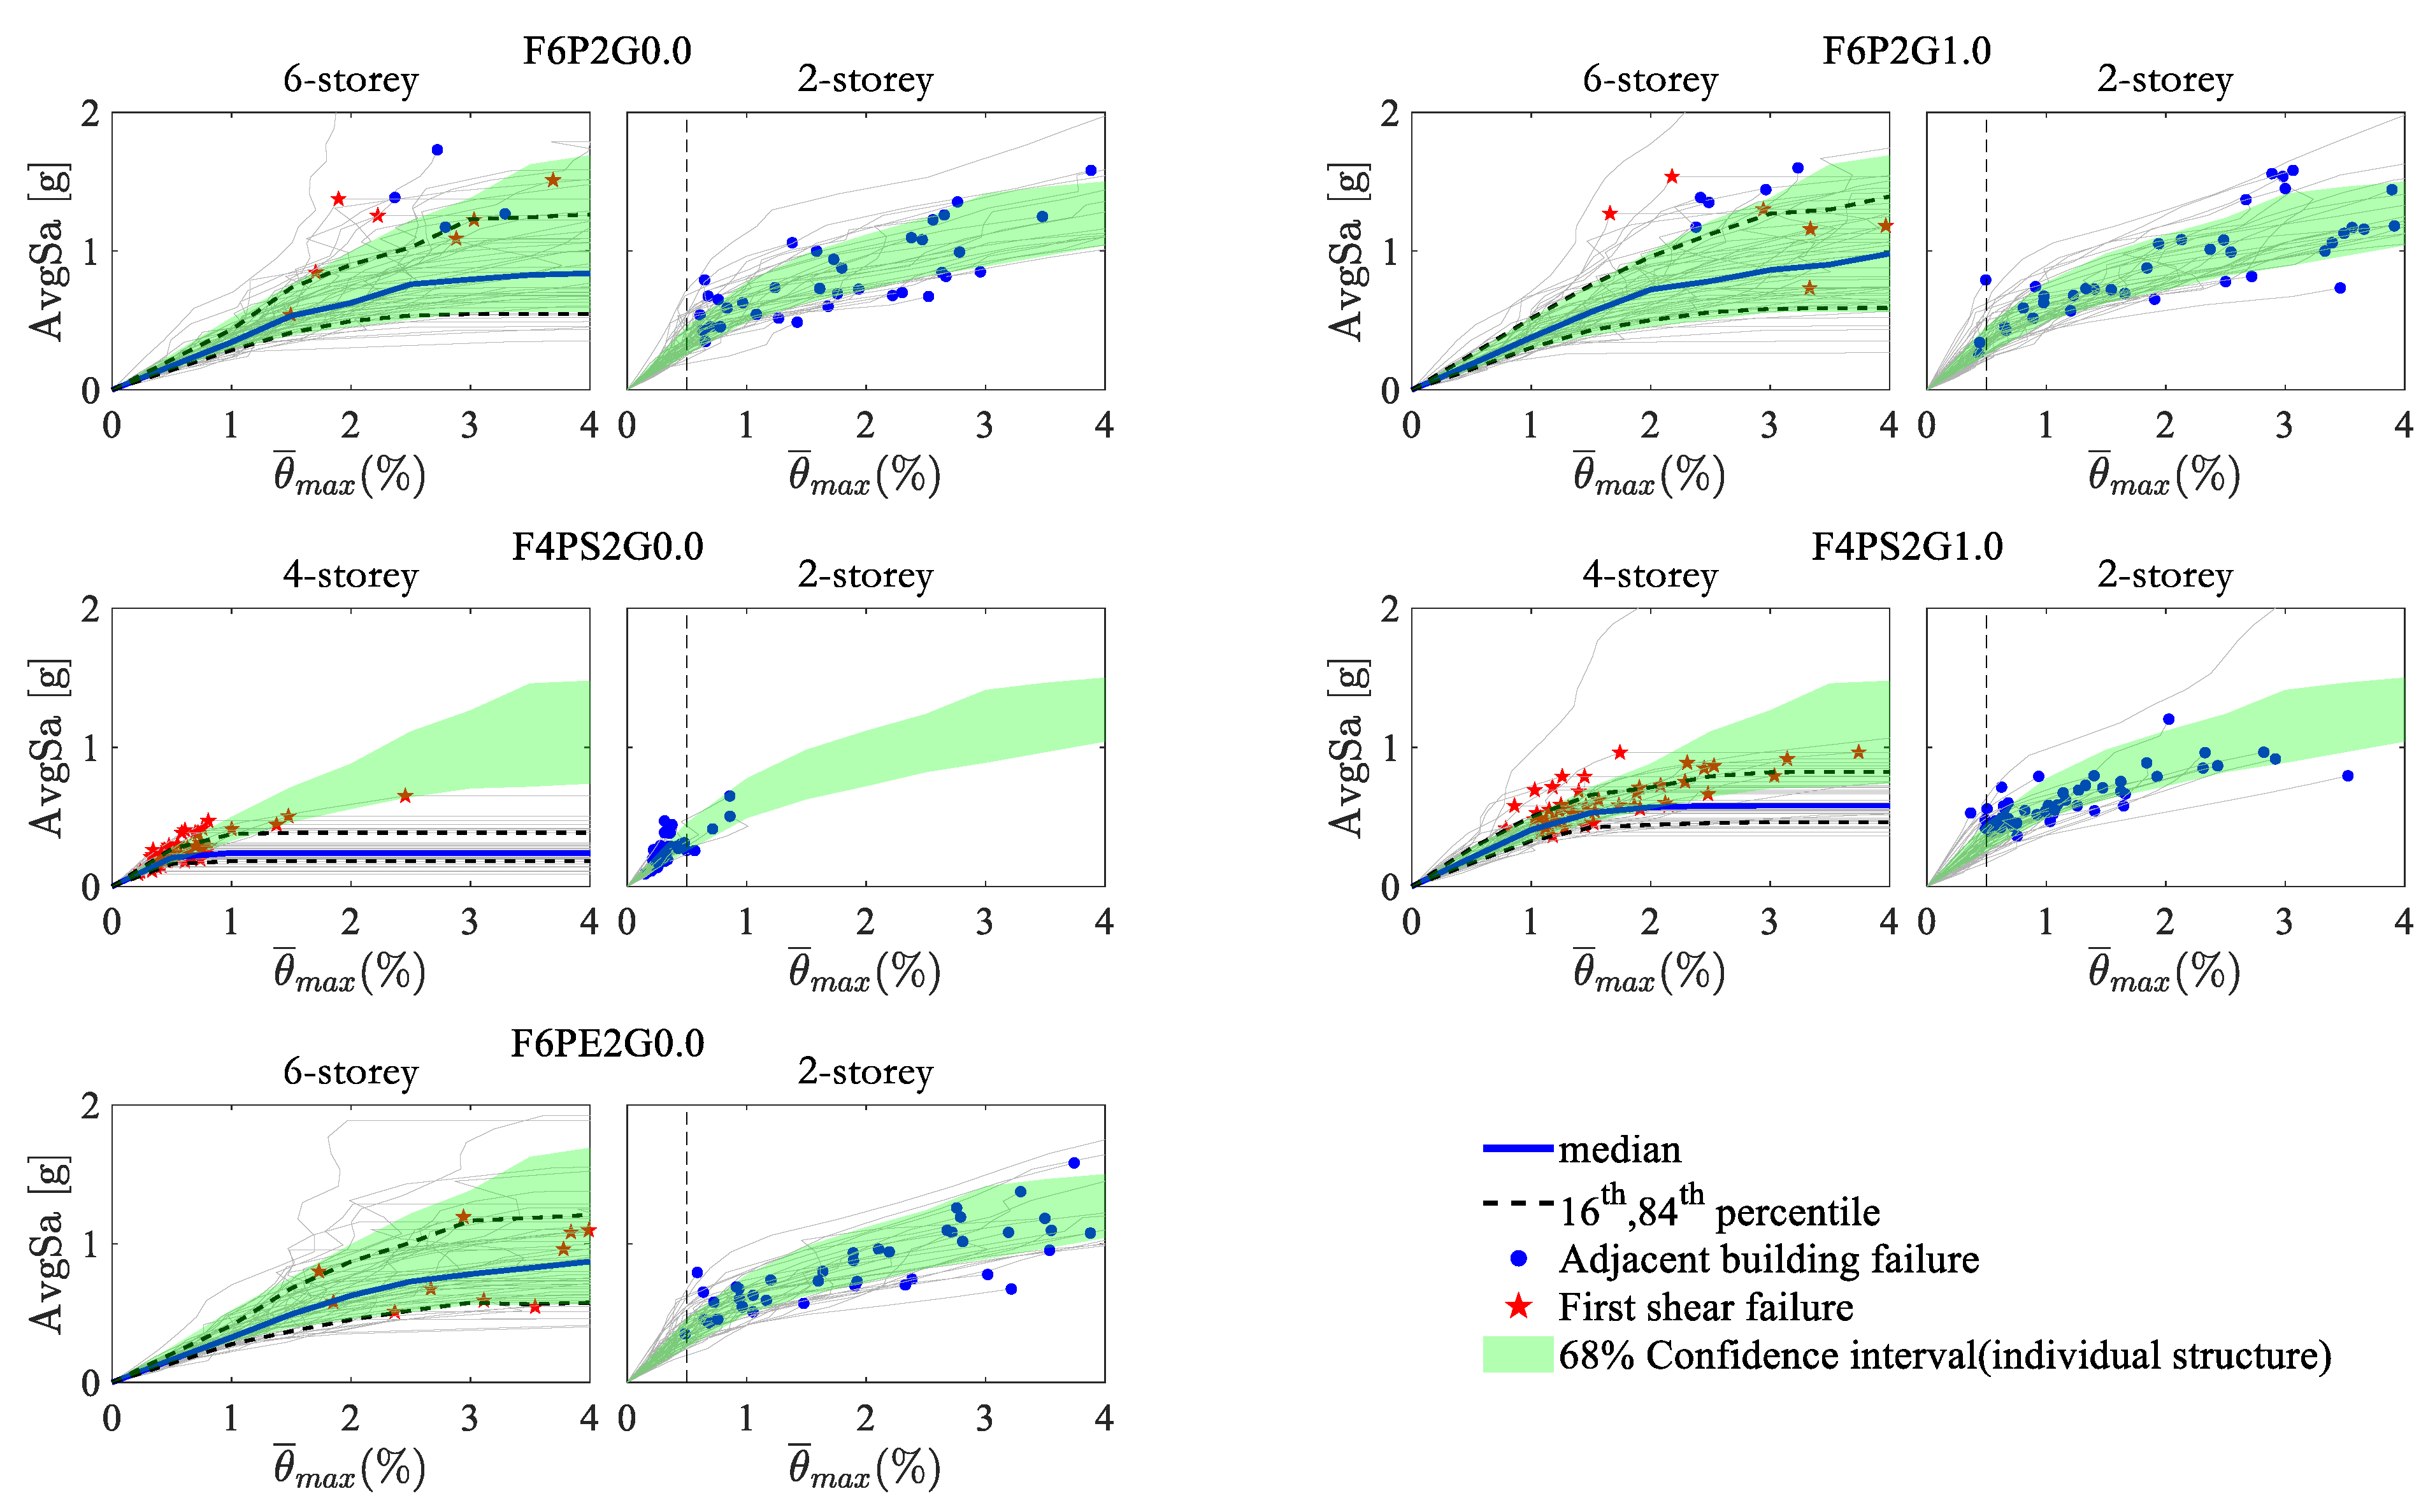
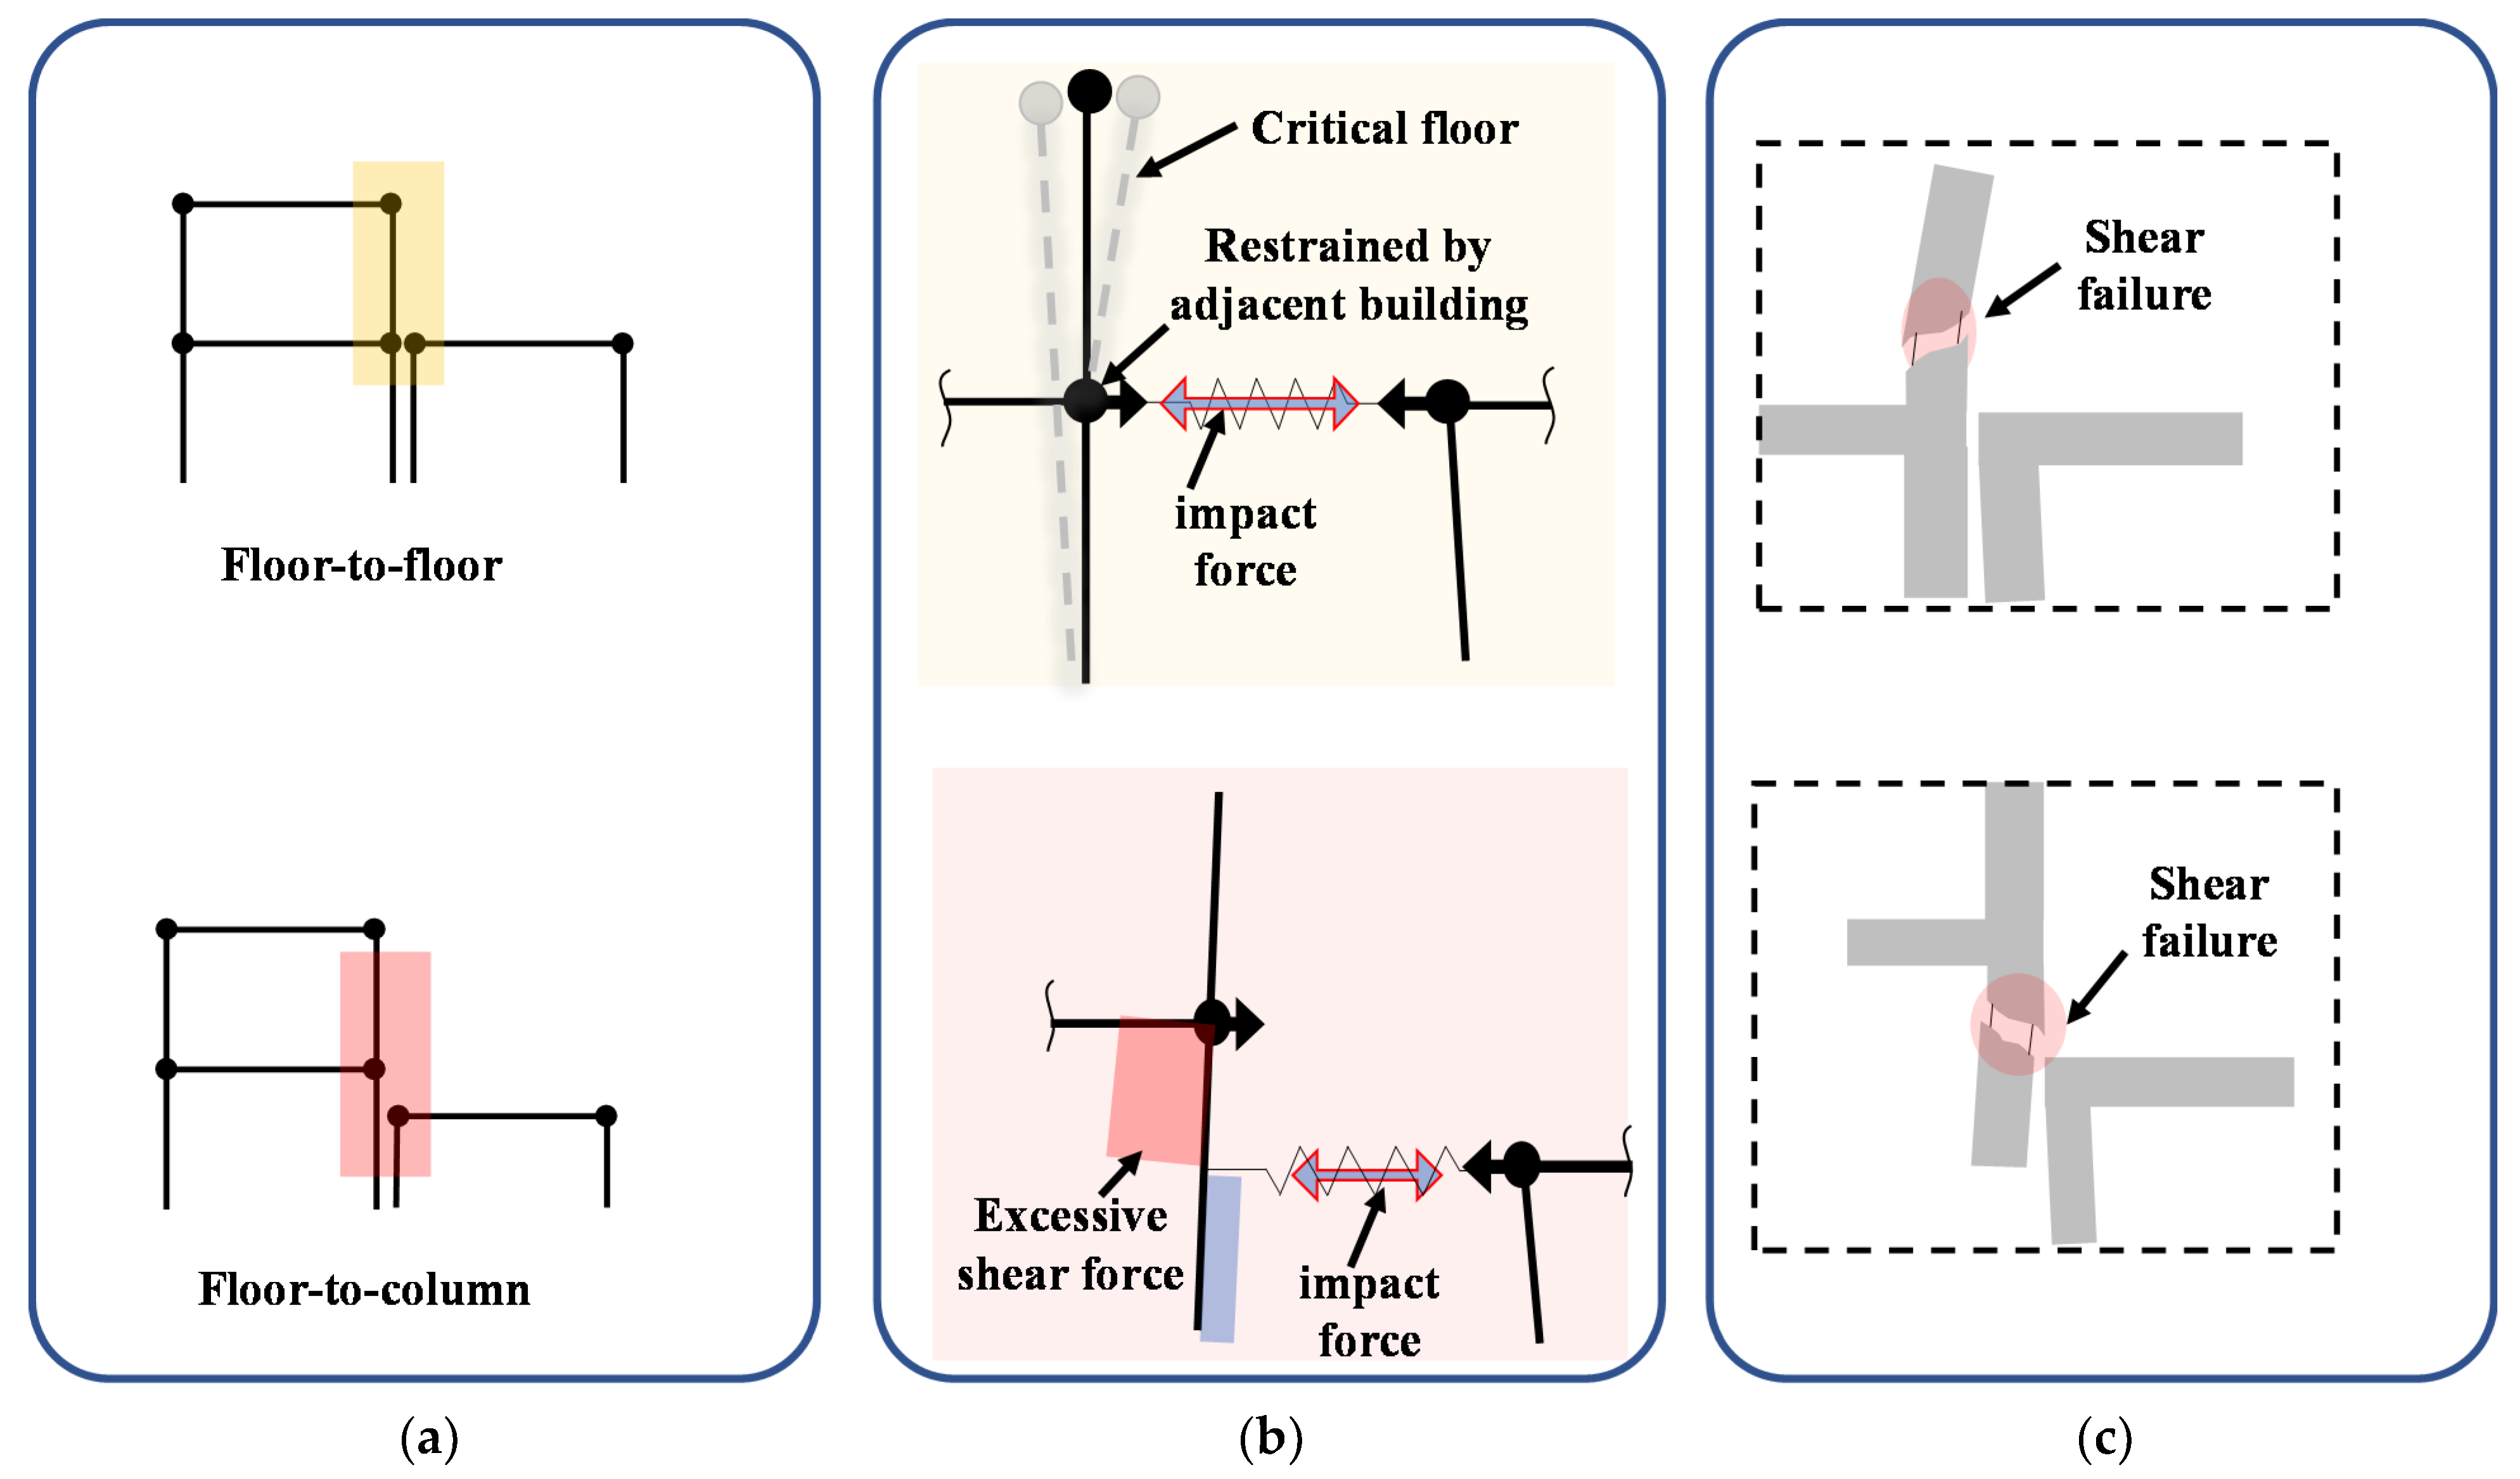
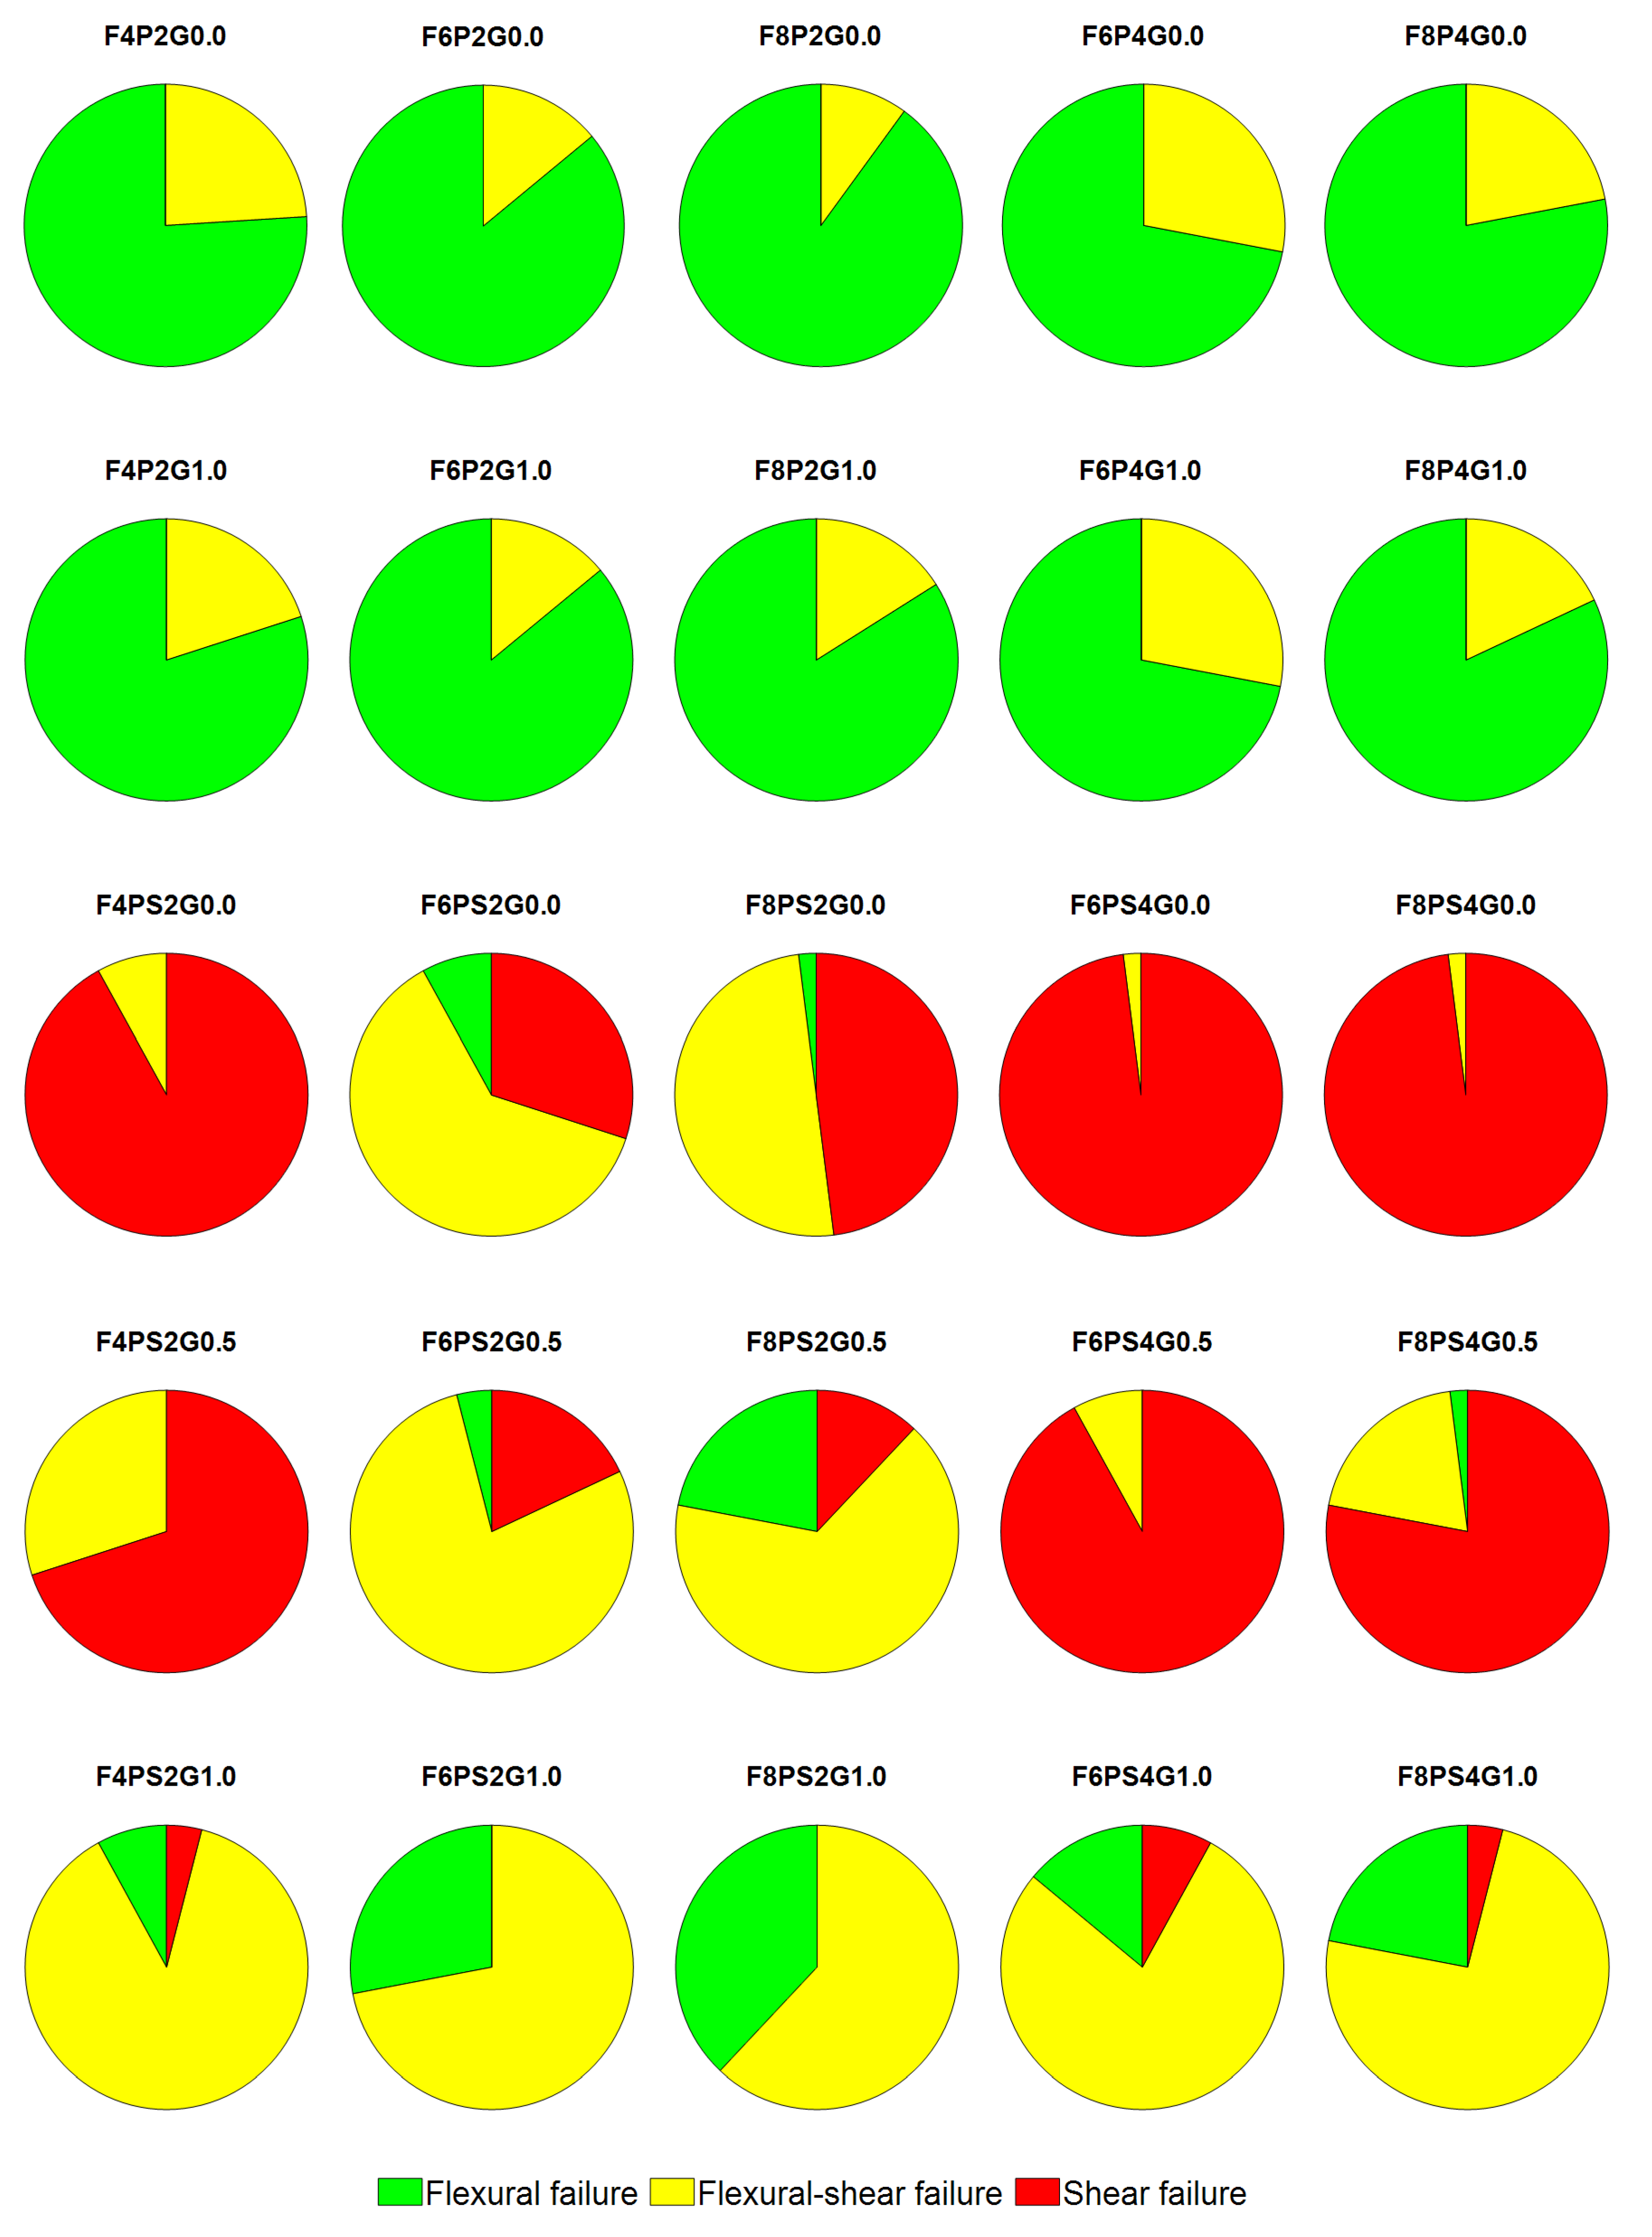
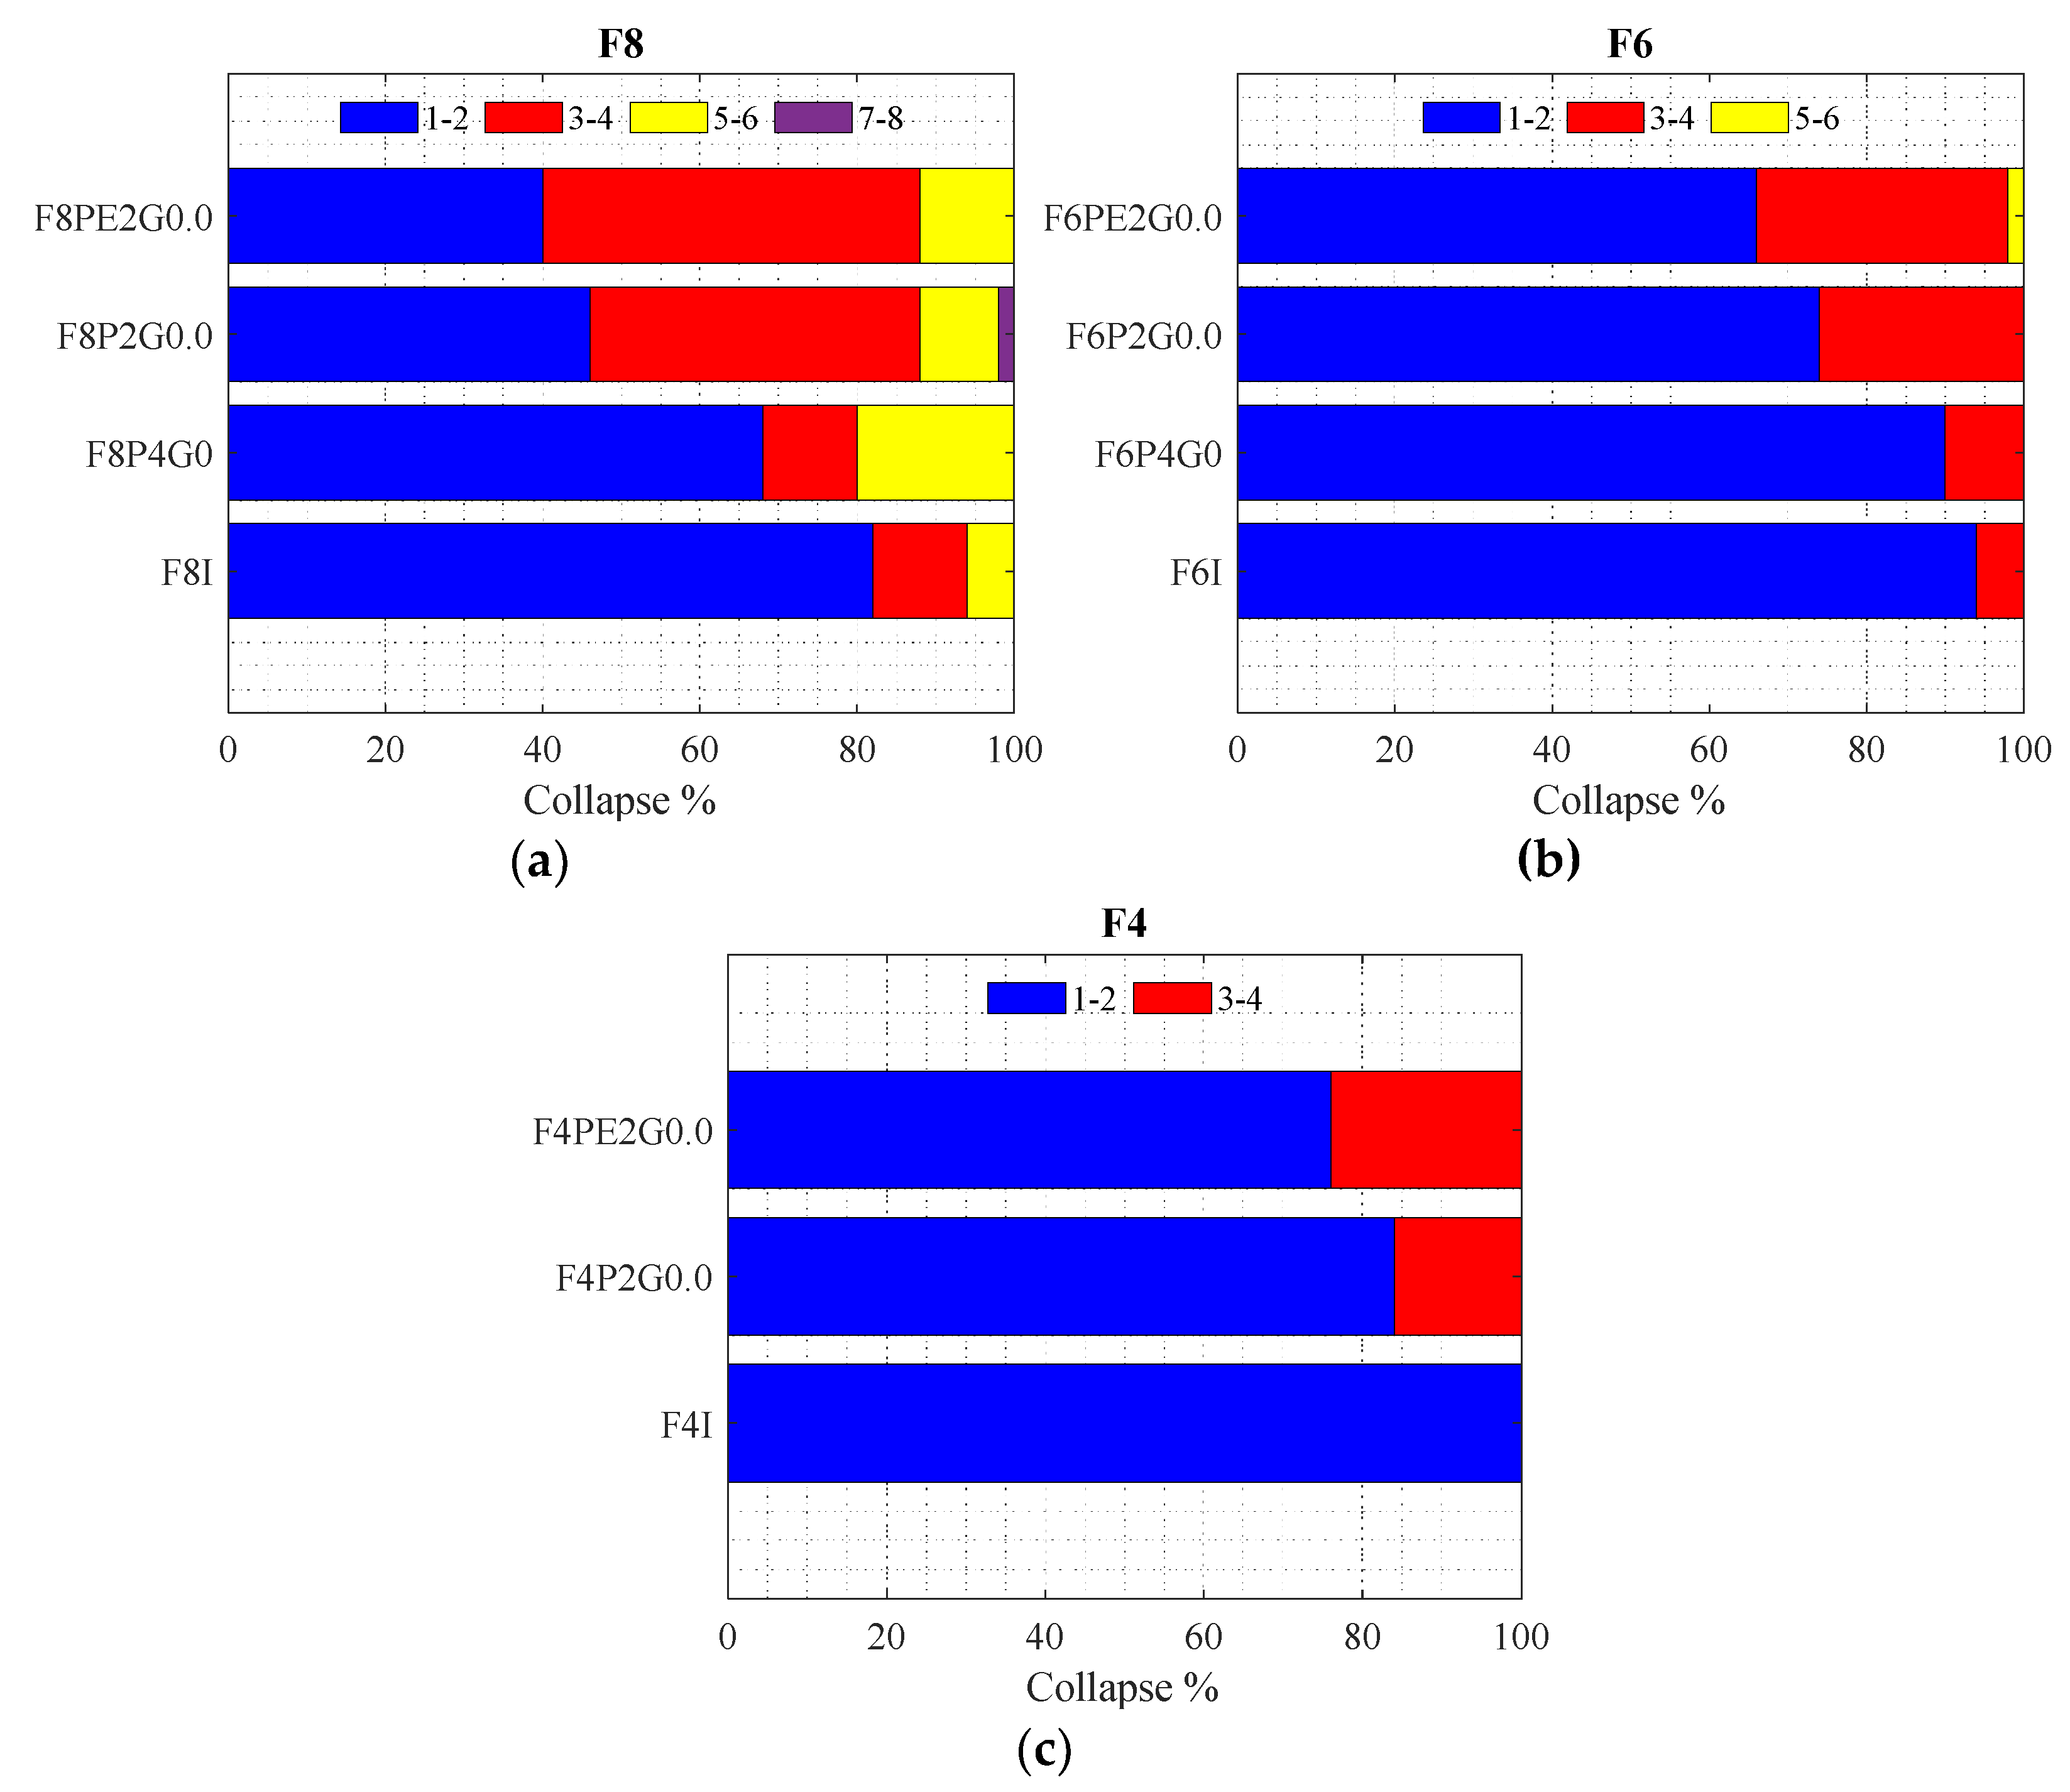
5.2. Failure Mechanisms Observed for Different Pounding Configurations
6. Probabilistic Performance of the Analysed Structures
7. Conclusions
Supplementary Materials
Author Contributions
Funding
Institutional Review Board Statement
Informed Consent Statement
Data Availability Statement
Conflicts of Interest
References
- Silva, V.; Crowley, H.; Varum, H.; Pinho, R. Seismic risk assessment for mainland Portugal. Bull. Earthq. Eng. 2015, 13, 429–457. [Google Scholar] [CrossRef]
- Martins, L.; Silva, V. Development of a fragility and vulnerability model for global seismic risk analyses. Bull. Earthq. Eng. 2021, 19, 6719–6745. [Google Scholar] [CrossRef]
- D’Ayala, D.; Meslem, A.; Vamvatsikos, D.; Porter, K.; Rossetto, T.; Crowley, H.; Silva, V. Guidelines for Analytical Vulnerability Assessment of Low/Mid-Rise Buildings—Methodology; Vulnerability Global Component Project; GEM Technical Report; GEM: Pavia, Italy, 2014. [Google Scholar]
- Martins, L.; Silva, V.; Crowley, H.; Cavalieri, F. Vulnerability modellers toolkit, an open-source platform for vulnerability analysis. Bull. Earthq. Eng. 2021, 19, 5691–5709. [Google Scholar] [CrossRef]
- Silva, A.; Macedo, L.; Monteiro, R.; Castro, J.M. Earthquake-induced loss assessment of steel buildings designed to Eurocode 8. Eng. Struct. 2020, 208, 110244. [Google Scholar] [CrossRef]
- Villar-Vega, M.; Silva, V.; Crowley, H.; Yepes, C.; Tarque, N.; Acevedo, A.B.; Hube, M.A.; Gustavo, C.D.; María, H.S. Development of a fragility model for the residential building stock in South America. Earthq. Spectra 2017, 33, 581–604. [Google Scholar] [CrossRef]
- Silva, V.; Crowley, H.; Varum, H.; Pinho, R.; Sousa, L. Investigation of the characteristics of Portuguese regular moment-frame RC buildings and development of a vulnerability model. Bull. Earthq. Eng. 2015, 13, 1455–1490. [Google Scholar] [CrossRef]
- Chouw, N.; Hao, H. Pounding damage to buildings and bridges in the 22 February 2011 Christchurch earthquake. Int. J. Prot. Struct. 2012, 3, 123–139. [Google Scholar] [CrossRef]
- Cole, G.L.; Dhakal, R.P.; Turner, F.M. Building pounding damage observed in the 2011 Christchurch earthquake. Earthq. Eng. Struct. Dyn. 2012, 41, 893–913. [Google Scholar] [CrossRef]
- Favvata, M.; Karayannis, C.; Anagnostopoulou, V. Influence of infill panels with and without openings on the pounding effect of RC structures. In Proceedings of the 15th World Conference on Earthquake Engineering, Lisbon, Portugal, 24–28 September 2012. [Google Scholar]
- Khatiwada, S.; Chouw, N. A shake table investigation on interaction between buildings in a row. Coupled Syst. Mech. Int. J. 2013, 2, 175–190. [Google Scholar] [CrossRef]
- Castañeda, Á.E.; Bravo, Y.M. Overview of the structural behavior of columns, beams, floor slabs and buildings during the earthquake of 2016 in Ecuador. Revista Ingeniería de Construcción 2018, 32, 157–172. [Google Scholar] [CrossRef] [Green Version]
- Shrestha, B.; Hao, H. Building pounding damages observed during the 2015 Gorkha earthquake. J. Perform. Constr. Facilities. 2018, 32, 04018006. [Google Scholar] [CrossRef]
- Doğan, M.; Günaydin, A. Pounding of adjacent RC buildings during seismic loads. Eskişehir Osmangazi Üniversitesi Mühendislik ve Mimarlık Fakültesi Dergisi 2009, 22, 129–145. [Google Scholar]
- Jeng, V.; Tzeng, W.L. Assessment of seismic pounding hazard for Taipei City. Eng. Struct. 2000, 22, 459–471. [Google Scholar] [CrossRef]
- ASCE/SEI-7-16. Minimum Design Loads and Associated Criteria for Buildings and Other Structures; American Society of Civil Engineers: Reston, VA, USA, 2017. [Google Scholar]
- EN1998-1. Eurocode 8: Design of Structures for Earthquake Resistance—Part 1: General Rules, Seismic Actions and Rules for Buildings; European Committee for Standardization: Brussels, Belgium, 2005. [Google Scholar]
- EC201. Egyptian Code for Calculating Loads and Forces in Structural Work and Masonry (Code N 201–Ministerial Decision 431/2011); Housing and Building National Research Center (HBRC), Ministry of Housing, Utilities and Urban Planning: Giza, Egypt, 2012. (In Arabic) [Google Scholar]
- Kazemi, F.; Miari, M.; Jankowski, R. Investigating the effects of structural pounding on the seismic performance of adjacent RC and steel MRFs. Bull. Earthq. Eng. 2021, 19, 317–343. [Google Scholar] [CrossRef]
- Terenzi, G.; Fuso, E.; Sorace, S.; Costoli, I. Enhanced seismic retrofit of a reinforced concrete building of architectural interest. Buildings 2020, 10, 211. [Google Scholar] [CrossRef]
- Cole, G.; Dhakal, R.; Carr, A.; Bull, D. Building Pounding State of the Art: Identifying Structures Vulnerable to Pounding Damage; NZSEE Conference; New Zealand Society for Earthquake Engineering Inc.: Wellington, New Zealand, 2010. [Google Scholar]
- Kazemi, F.; Mohebi, B.; Jankowski, R. Predicting the seismic collapse capacity of adjacent SMRFs retrofitted with fluid viscous dampers in pounding condition. Mech. Syst. Signal Process. 2021, 161, 107939. [Google Scholar] [CrossRef]
- Kazemi, F.; Mohebi, B.; Yakhchalian, M. Evaluation the P-delta effect on collapse capacity of adjacent structures subjected to far-field ground motions. Civ. Eng. J. 2018, 4, 1066. [Google Scholar] [CrossRef] [Green Version]
- Karayannis, C.G.; Favvata, M.J. Earthquake-induced interaction between adjacent reinforced concrete structures with non-equal heights. Earthq. Eng. Struct. Dyn. 2005, 34, 1–20. [Google Scholar] [CrossRef]
- Jankowski, R. Experimental study on earthquake-induced pounding between structural elements made of different building materials. Earthq. Eng. Struct. Dyn. 2009, 39, 343–354. [Google Scholar] [CrossRef]
- Skrekas, P.; Sextos, A.; Giaralis, A. Influence of bi-directional seismic pounding on the inelastic demand distribution of three adjacent multi-storey R/C buildings. Earthq. Struct. 2014, 6, 71–87. [Google Scholar] [CrossRef] [Green Version]
- Polycarpou, P.C.; Papaloizou, L.; Komodromos, P. An efficient methodology for simulating earthquake-induced 3D pounding of buildings. Earthq. Eng. Struct. Dyn. 2014, 43, 985–1003. [Google Scholar] [CrossRef]
- Bertero, V.V.; Collins, R.G. Investigation of the Failures of the Olive View Stairtowers during the San Fernando Earthquake and Their Implications on Seismic Design; Earthquake Engineering Research Center, University of California: Berkeley, CA, USA, 1973. [Google Scholar]
- Berg, G.; Degenkolb, H. Engineering Lessons from the Managua Earthquake; American Iron and Steel Institute: Washington, DC, USA, 1973. [Google Scholar]
- Khatami, S.M.; Naderpour, H.; Barros, R.C.; Jakubczyk-Gałczyńska, A.; Jankowski, R. Determination of peak impact force for buildings exposed to structural pounding during earthquakes. Geosciences 2020, 10, 18. [Google Scholar] [CrossRef] [Green Version]
- Bamer, F.; Strubel, N.; Shi, J.; Markert, B. A visco-elastoplastic pounding damage formulation. Eng. Struct. 2019, 197, 109373. [Google Scholar] [CrossRef]
- Abdel Raheem, S.E.; Fooly, M.Y.M.; Abdel Shafy, A.G.A.; Taha, A.M.; Abbas, Y.A.; Abdel Latif, M.M.S. Numerical simulation of potential seismic pounding among adjacent buildings in series. Bull. Earthq. Eng. 2019, 17, 439–471. [Google Scholar] [CrossRef]
- Elwardany, H.; Seleemah, A.; Jankowski, R.; El-khoriby, S. Influence of soil–structure interaction on seismic pounding between steel frame buildings considering the effect of infill panels. Bull. Earthq. Eng. 2019, 17, 6165–6202. [Google Scholar] [CrossRef] [Green Version]
- Kharazian, A.; López-Almansa, F. State-of-the-art of research on seismic pounding between buildings with aligned slabs. Arch. Comput. Methods Eng. 2019, 26, 327–345. [Google Scholar] [CrossRef] [Green Version]
- Naeej, M.; Vaseghi Amiri, J.; Jalali, S.G. Stochastic analysis of adjacent structures subjected to structural pounding under earthquake excitation. J. Rehabil. Civ. Eng. 2019, 7, 153–165. [Google Scholar]
- Yang, Y.; Li, S. Development of a refined analysis method for earthquake-induced pounding between adjacent RC frame structures. Sustainability 2019, 11, 4928. [Google Scholar] [CrossRef] [Green Version]
- Hao, H. Analysis of seismic pounding between adjacent buildings. Aust. J. Struct. Eng. 2015, 16, 208–225. [Google Scholar] [CrossRef]
- Jankowski, R.; Seleemah, A.; El-Khoriby, S.; Elwardany, H. Experimental study on pounding between structures during damaging earthquakes. In Key Engineering Materials; Trans Tech Publications: Bäch, Switzerland, 2015; pp. 249–252. [Google Scholar]
- Cui, L.L.; Guo, A.X.; Li, H. Investigation of the parameters of Hertz impact model for the pounding analysis of highway bridge. Procedia Eng. 2011, 14, 2773–2778. [Google Scholar] [CrossRef] [Green Version]
- Rezavandi, A.; Moghadam, A.S. Experimental and numerical study on pounding effects and mitigation techniques for adjacent structures. Adv. Struct. Eng. 2007, 10, 121–134. [Google Scholar] [CrossRef]
- Filiatrault, A.; Wagner, P.; Cherry, S. An experimental study on the seismic pounding of buildings. In Proceedings of the Eleventh World Conference on Earthquake Engineering, Acapulco, Mexico, 23–28 June 1996. [Google Scholar]
- Filiatrault, A.; Wagner, P.; Cherry, S. Analytical prediction of experimental building pounding. Earthq. Eng. Struct. Dyn. 1995, 24, 1131–1154. [Google Scholar] [CrossRef]
- Jankowski, R. State-of-the-art of research on seismic pounding between buildings with aligned slabs; Letter to the editor: Discussion on the paper. Arch. Comput. Methods Eng. 2019, 26, 531–532. [Google Scholar] [CrossRef] [Green Version]
- Jankowski, R. Non-linear viscoelastic modelling of earthquake-induced structural pounding. Earthq. Eng. Struct. Dyn. 2005, 34, 595–611. [Google Scholar] [CrossRef]
- Jankowski, R.; Wilde, K.; Fujino, Y. Pounding of superstructure segments in isolated elevated bridge during earthquakes. Earthq. Eng. Struct. Dyn. 1998, 27, 487–502. [Google Scholar] [CrossRef]
- Favvata, M.J.; Karayannis, C.G. The inter-storey pounding effect on the seismic behaviour of infilled and pilotis RC structures. In Seismic Behaviour and Design of Irregular and Complex Civil Structures; Lavan, O., De Stefano, M., Eds.; Springer Netherlands: Dordrecht, The Netherlands, 2013; pp. 87–101. [Google Scholar]
- Flenga, M.G.; Favvata, M.J. Probabilistic seismic assessment of the pounding risk based on the local demands of a multistory RC frame structure. Eng. Struct. 2021, 245, 112789. [Google Scholar] [CrossRef]
- Flenga, M.G.; Favvata, M.J. Fragility curves and probabilistic seismic demand models on the seismic assessment of RC frames subjected to structural pounding. Appl. Sci. 2021, 11, 8253. [Google Scholar] [CrossRef]
- Vamvatsikos, D.; Cornell, C.A. Incremental dynamic analysis. Earthq. Eng. Struct. Dyn. 2002, 31, 491–514. [Google Scholar] [CrossRef]
- El-Kholy, A.M.; Sayed, H.; Shaheen, A.A. Comparison of Egyptian code 2012 with Eurocode 8-2013, IBC 2015 and UBC 1997 for seismic analysis of residential shear-walls RC buildings in Egypt. Ain Shams Eng. J. 2018, 9, 3425–3436. [Google Scholar] [CrossRef]
- McKenna, F. OpenSees: A framework for earthquake engineering simulation. Comput. Sci. Eng. 2011, 13, 58–66. [Google Scholar] [CrossRef]
- Ibarra, L.F.; Krawinkler, H. Global Collapse of Frame Structures Under Seismic Excitations; Pacific Earthquake Engineering Research Center: Berkeley, CA, USA, 2005. [Google Scholar]
- Lignos, D.G.; Krawinkler, H. Deterioration modeling of steel components in support of collapse prediction of steel moment frames under earthquake loading. J. Struct. Eng. 2011, 137, 1291–1302. [Google Scholar] [CrossRef] [Green Version]
- Haselton, C.B.; Liel, A.B.; Taylor-Lange, S.C.; Deierlein, G.G. Calibration of model to simulate response of reinforced concrete beam-columns to collapse. ACI Struct. J. 2016, 113, 1141–1152. [Google Scholar] [CrossRef]
- Jeon, J.-S.; Lowes, L.N.; DesRoches, R.; Brilakis, I. Fragility curves for non-ductile reinforced concrete frames that exhibit different component response mechanisms. Eng. Struct. 2015, 85, 127–143. [Google Scholar] [CrossRef] [Green Version]
- Elwood, K.J. Modelling failures in existing reinforced concrete columns. Can. J. Civ. Eng. 2004, 31, 846–859. [Google Scholar] [CrossRef]
- Baradaran, S.M.; Elwood, K.J. Mechanical model for non ductile reinforced concrete columns. J. Earthq. Eng. 2013, 17, 937–957. [Google Scholar] [CrossRef]
- Panagiotakos, T.B.; Fardis, M.N. Deformations of reinforced concrete members at yielding and ultimate. Struct. J. 2001, 98, 135–148. [Google Scholar]
- Elwood, K.J.; Moehle, J.P. Shake Table Tests and Analytical Studies on the Gravity Load Collapse of Reinforced Concrete Frames, PEER Report 2003/01; Pacific Earthquake Engineering Research Center, College of Engineering, University of California: Berkeley, CA, USA, 2003. [Google Scholar]
- Sezen, H.; Moehle Jack, P. Shear strength model for lightly reinforced concrete columns. J. Struct. Eng. 2004, 130, 1692–1703. [Google Scholar] [CrossRef]
- ASCE. Seismic Evaluation and Retrofit of Existing Buildings (ASCE/SEI 41-17); American Society of Civil Engineers: Reston, VA, USA, 2017. [Google Scholar]
- Park, R.; Paulay, T. Reinforced Concrete Structures; John Wiley & Sons: Hoboken, NJ, USA, 1975. [Google Scholar]
- Skoulidou, D.; Romão, X.; Franchin, P. How is collapse risk of RC buildings affected by the angle of seismic incidence? Earthq. Eng. Struct. Dyn. 2019, 48, 1575–1594. [Google Scholar] [CrossRef]
- Dolšek, M.; Fajfar, P. Post-Test Analyses of the SPEAR Test Building; University of Ljubljana: Ljubljana, Slovenia, 2005. [Google Scholar]
- DesRoches, R.; Muthukumar, S. Effect of pounding and restrainers on seismic response of multiple-frame bridges. J. Struct. Eng. 2002, 128, 860–869. [Google Scholar] [CrossRef]
- Goldsmith, W. Impact: The Theory and Physical Behaviour of Colliding Solids; Edward Arnold: London, UK, 1961. [Google Scholar]
- Ruangrassamee, A.; Kawashima, K. Relative displacement response spectra with pounding effect. Earthq. Eng. Struct. Dyn. 2001, 30, 1511–1538. [Google Scholar] [CrossRef] [Green Version]
- Maison Bruce, F.; Kasai, K. Analysis for a type of structural pounding. J. Struct. Eng. 1990, 116, 957–977. [Google Scholar] [CrossRef]
- Maison, B.F.; Kasai, K. Dynamics of pounding when two buildings collide. Earthq. Eng. Struct. Dyn. 1992, 21, 771–786. [Google Scholar] [CrossRef]
- Muthukumar, S.; DesRoches, R. A Hertz contact model with non-linear damping for pounding simulation. Earthq. Eng. Struct. Dyn. 2006, 35, 811–828. [Google Scholar] [CrossRef]
- Anagnostopoulos, S.A. Pounding of buildings in series during earthquakes. Earthq. Eng. Struct. Dyn. 1988, 16, 443–456. [Google Scholar] [CrossRef]
- Abdel Raheem, S.E. Pounding mitigation and unseating prevention at expansion joints of isolated multi-span bridges. Eng. Struct. 2009, 31, 2345–2356. [Google Scholar] [CrossRef]
- Karayannis, C.G.; Naoum, M.C. Torsional behavior of multistory RC frame structures due to asymmetric seismic interaction. Eng. Struct. 2018, 163, 93–111. [Google Scholar] [CrossRef]
- Anagnostopoulos, S.A. Equivalent viscous damping for modeling inelastic impacts in earthquake pounding problems. Earthq. Eng. Struct. Dyn. 2004, 33, 897–902. [Google Scholar] [CrossRef]
- Mahmoud, S.; Jankowski, R. Elastic and inelastic multi-storey buildings under earthquake excitation with the effect of pounding. J. Appl. Sci. 2009, 9, 3250–3262. [Google Scholar] [CrossRef]
- Mahmoud, S.; Jankowski, R. Modified linear viscoelastic model of earthquake-induced structural pounding. Trans. Civ. Environ. Eng. 2011, 35, 51–62. [Google Scholar]
- Polycarpou, P.C.; Komodromos, P. Earthquake-induced poundings of a seismically isolated building with adjacent structures. Eng. Struct. 2010, 32, 1937–1951. [Google Scholar] [CrossRef]
- Azevedo, J.; Bento, R. Design criteria for buildings subjected to pounding. In Proceedings of the Eleventh World Conference on Earthquake Engineering, Acapulco, Mexico, 23–28 June 1996. [Google Scholar]
- Khatiwada, S.; Larkin, T.; Chouw, N. Influence of mass and contact surface on pounding response of RC structures. Earthq. Struct. 2014, 7, 385–400. [Google Scholar] [CrossRef]
- Kohrangi, M.; Bazzurro, P.; Vamvatsikos, D. Vector and scalar IMs in structural response estimation, part II: Building demand assessment. Earthq. Spectra 2016, 32, 1525–1543. [Google Scholar] [CrossRef]
- Gentile, R.; Galasso, C. Accounting for directivity-induced pulse-like ground motions in building portfolio loss assessment. Bull. Earthq. Eng. 2020, 19, 6303–6328. [Google Scholar] [CrossRef]
- Kohrangi, M.; Kotha, S.R.; Bazzurro, P. Ground-motion models for average spectral acceleration in a period range: Direct and indirect methods. Bull. Earthq. Eng. 2018, 16, 45–65. [Google Scholar] [CrossRef]
- Ancheta, T.D.; Darragh, R.B.; Stewart, J.P.; Seyhan, E.; Silva, W.J.; Chiou, B.S.J.; Wooddell, K.E.; Graves, R.W.; Kottke, A.R.; Boore, D.M.; et al. NGA-West2 database. Earthq. Spectra 2014, 30, 989–1005. [Google Scholar] [CrossRef]
- Macedo, L.; Castro, J.M. SelEQ: An advanced ground motion record selection and scaling framework. Adv. Eng. Softw. 2017, 114, 32–47. [Google Scholar] [CrossRef]
- Ricci, P.; De Risi, M.T.; Verderame, G.M.; Manfredi, G. Procedures for calibration of linear models for damage limitation in design of masonry-infilled RC frames. Earthq. Eng. Struct. Dyn. 2016, 45, 1315–1335. [Google Scholar] [CrossRef]
- Rossetto, T.; Elnashai, A. Derivation of vulnerability functions for European-type RC structures based on observational data. Eng. Struct. 2003, 25, 1241–1263. [Google Scholar] [CrossRef]
- Rossetto, T.; Elnashai, A. A new analytical procedure for the derivation of displacement-based vulnerability curves for populations of RC structures. Eng. Struct. 2005, 27, 397–409. [Google Scholar] [CrossRef]
- Ghobarah, A. On drift limits with different damage levels. In Proceedings of the International Workshop on Performance-Based Seismic Design Concepts and Implementation, Bled, Slovenia, 28 June–1 July 2004. [Google Scholar]
- Federal Emergency Management Agency. Prestandard and Commentary for Seismic Rehabilitation of Buildings; FEMA-356; Federal Emergency Management Agency: Washington, DC, USA, 2000.
- Federal Emergency Management Agency. NEHRP Guidelines for the Seismic Rehabilitation of Buildings; FEMA-273; Federal Emergency Management Agency: Washington, DC, USA, 1997.
- NBCC. National Building Code of Canada. Ottawa; National Research Council: Ottawa, ON, Canada, 2010. [Google Scholar]
- IBC. International Building Code; International Code Council: Washington, DC, USA, 2009. [Google Scholar]
- Structural Design Actions-Part 4: Earthquake Actions in Australia AS1170-4 A; Committee BD-006, General Design Requirements and Loading on Structures, Council of Standards Australia: Sydney, Australia, 2007.
- Krawinkler, H.; Seneviratna, G.D.P.K. Pros and cons of a pushover analysis of seismic performance evaluation. Eng. Struct. 1998, 20, 452–464. [Google Scholar] [CrossRef]
- Crowley, H.; Despotaki, V.; Silva, V.; Dabbeek, J.; Romão, X.; Pereira, N.; Castro, J.M.; Daniell, J.; Veliu, E.; Bilgin, H.; et al. Model of seismic design lateral force levels for the existing reinforced concrete European building stock. Bull. Earthq. Eng. 2021, 19, 2839–2865. [Google Scholar] [CrossRef]
- Romão, X.; Delgado, R.; Costa, A. Assessment of the statistical distributions of structural demand under earthquake loading. J. Earthq. Eng. 2011, 15, 724–753. [Google Scholar] [CrossRef]
- Mohamed, H. Seismic Risk Assessment of Reinforced Concrete Frames with Masonry Infill. Ph.D. Thesis, University of Porto, Porto, Portugal, 2017. [Google Scholar]
- Shapiro, S.S.; Wilk, M.B. An analysis of variance test for normality (complete samples). Biometrika 1965, 52, 591–611. [Google Scholar] [CrossRef]
- Romão, X.; Delgado, R.; Costa, A. An empirical power comparison of univariate goodness-of-fit tests for normality. J. Stat. Comput. Simul. 2010, 80, 545–591. [Google Scholar] [CrossRef]
- Skoulidou, D.; Romão, X. Uncertainty quantification of fragility and risk estimates due to seismic input variability and capacity model uncertainty. Eng. Struct. 2019, 195, 425–437. [Google Scholar] [CrossRef]
- Romão, X.; Delgado, R.; Costa, A. Statistical characterization of structural demand under earthquake loading. Part 1: Robust estimation of the central value of the data. J. Earthq. Eng. 2012, 16, 686–718. [Google Scholar] [CrossRef]
- Romão, X.; Delgado, R.; Costa, A. Statistical characterization of structural demand under earthquake loading. Part 2: Robust estimation of the dispersion of the data. J. Earthq. Eng. 2012, 16, 864–896. [Google Scholar] [CrossRef]
- Asteris, G.P. Modeling of infilled frames with openings. Open Constr. Build. Technol. J. 2012, 6, 81–91. [Google Scholar] [CrossRef] [Green Version]
- Mohamed, H.; Romão, X. Analysis of the performance of strut models to simulate the seismic behaviour of masonry infills in partially infilled RC frames. Eng. Struct. 2020, 222, 111124. [Google Scholar] [CrossRef]
- Mohamed, H.; Romão, X. Robust calibration of macro-models for the in-plane behavior of masonry infilled RC frames. J. Earthq. Eng. 2018, 25, 407–433. [Google Scholar] [CrossRef]
- Mohamed, H.; Romão, X. Performance analysis of a detailed FE modelling strategy to simulate the behaviour of masonry-infilled RC frames under cyclic loading. Earthq. Struct. 2018, 14, 551–565. [Google Scholar]
- Asteris, G.P.; Cotsovos, D.M. Numerical investigation of the effect of infill walls on the structural response of RC frames. Open Constr. Build. Technol. J. 2012, 6, 164–181. [Google Scholar] [CrossRef]
- Sattar, S.; Liel, A.B. Seismic performance of reinforced concrete frame structures with and without masonry infill walls. In Proceedings of the 9th US National and 10th Canadian Conference on Earthquake Engineering, Toronto, ON, Canada, 25–29 July 2010. [Google Scholar]
- Sattar, S.; Liel, A.B. Seismic performance of nonductile reinforced concrete frames with masonry infill walls: II. Collapse assessment. Earthq. Spectra 2016, 32, 819–842. [Google Scholar] [CrossRef]
- Sattar, S.; Liel, A.B. Seismic performance of nonductile reinforced concrete frames with masonry infill walls: I. Development of a strut model enhanced by finite element models. Earthq. Spectra 2016, 32, 795–818. [Google Scholar] [CrossRef]


| Main Building | Sd (m) | 2-Storey | 4-Storey | 6-Storey | 8-Storey | ||||||||
|---|---|---|---|---|---|---|---|---|---|---|---|---|---|
| CoV (%) | CoV (%) | CoV (%) | CoV (%) | Adjacent Building | |||||||||
| N2 | N4 | N6 | N8 | ||||||||||
| N2 | 0.020 | 0.029 | 13.1 | 0.041 | 0.053 | 0.055 | 0.058 | ||||||
| N4 | 0.067 | 0.044 | 14.9 | 0.071 | 14.6 | 0.11 | 0.12 | ||||||
| N6 | 0.11 | 0.047 | 13.6 | 0.087 | 13.8 | 0.11 | 13.5 | ||||||
| N8 | 0.15 | 0.050 | 13.6 | 0.096 | 13.1 | 0.13 | 12.9 | 0.15 | 12.5 | ||||
| No. | Left Side Frame ‡ | Right Side Frame | Shift Distance S (m) (Figure 12a) | Separation Distance | Acronym * | Pounding Configurations | |||
|---|---|---|---|---|---|---|---|---|---|
| Type of Pounding | Adjacent Buildings with Significantly Different | ||||||||
| Floor-to-Floor | Floor-to-Column | Masses | Heights | ||||||
| 1 | 4-Storey | 2-Storey | 0.0 | G0.0 | F4P2G0.0 | ■ | |||
| 2 | 6-Storey | 2-Storey | 0.0 | G0.0 | F6P2G0.0 | ■ | |||
| 3 | 8-Storey | 2-Storey | 0.0 | G0.0 | F8P2G0.0 | ■ | ■ | ||
| 4 | 6-Storey | 4-Storey | 0.0 | G0.0 | F6P4G0.0 | ■ | ■ | ||
| 5 | 8-Storey | 4-Storey | 0.0 | G0.0 | F8P4G0.0 | ■ | ■ | ||
| 6 | 4-Storey | 2-Storey | 0.50 | G0.0 | F4PS2G0.0 | ■ | |||
| 7 | 6-Storey | 2-Storey | 0.50 | G0.0 | F6PS2G0.0 | ■ | ■ | ||
| 8 | 8-Storey | 2-Storey | 0.50 | G0.0 | F8PS2G0.0 | ■ | ■ | ||
| 9 | 6-Storey | 4-Storey | 0.50 | G0.0 | F6PS4G0.0 | ■ | |||
| 10 | 8-Storey | 4-Storey | 0.50 | G0.0 | F8PS4G0.0 | ■ | ■ | ||
| 11 | 2-Storey | 2-Storey (extended 3x) | 0.0 | G0.0 | F2PE2G0.0 | ■ | ■ | ||
| 12 | 4-Storey | 2-Storey (extended 3x) | 0.0 | G0.0 | F4PE2G0.0 | ■ | ■ | ||
| 13 | 6-Storey | 2-Storey (extended 3x) | 0.0 | G0.0 | F6PE2G0.0 | ■ | ■ | ■ | |
| 14 | 8-Storey | 2-Storey (extended 3x) | 0.0 | G0.0 | F8PE2G0.0 | ■ | ■ | ■ | |
| 15 | 4-Storey | 2-Storey | 0.50 | G0.5 | F4PS2G0.5 | ■ | |||
| 16 | 6-Storey | 2-Storey | 0.50 | G0.5 | F6PS2G0.5 | ■ | ■ | ||
| 17 | 8-Storey | 2-Storey | 0.50 | G0.5 | F8PS2G0.5 | ■ | ■ | ||
| 18 | 6-Storey | 4-Storey | 0.50 | G0.5 | F6PS4G0.5 | ■ | |||
| 19 | 8-Storey | 4-Storey | 0.50 | G0.5 | F8PS4G0.5 | ■ | ■ | ||
| 20 | 4-Storey | 2-Storey | 0.50 | G1.0 | F4PS2G1.0 | ■ | |||
| 21 | 6-Storey | 2-Storey | 0.50 | G1.0 | F6PS2G1.0 | ■ | ■ | ||
| 22 | 8-Storey | 2-Storey | 0.50 | G1.0 | F8PS2G1.0 | ■ | ■ | ||
| 23 | 6-Storey | 4-Storey | 0.50 | G1.0 | F6PS4G1.0 | ■ | |||
| 24 | 8-Storey | 4-Storey | 0.50 | G1.0 | F8PS4G1.0 | ■ | ■ | ||
| 25 | 6-Storey | 4-Storey | 0.0 | G0.5 | F6P4G0.5 | ■ | ■ | ||
| 26 | 8-Storey | 4-Storey | 0.0 | G0.5 | F8P4G0.5 | ■ | ■ | ||
| 27 | 4-Storey | 2-Storey | 0.0 | G1.0 | F4P2G1.0 | ■ | |||
| 28 | 6-Storey | 2-Storey | 0.0 | G1.0 | F6P2G1.0 | ■ | |||
| 29 | 8-Storey | 2-Storey | 0.0 | G1.0 | F8P2G1.0 | ■ | ■ | ||
| 30 | 6-Storey | 4-Storey | 0.0 | G1.0 | F6P4G1.0 | ■ | ■ | ||
| 31 | 8-Storey | 4-Storey | 0.0 | G1.0 | F8P4G1.0 | ■ | ■ | ||
 * P stands for floor-to-floor pounding; PS stands for floor-to-column pounding; Gx is the separation distance defined as a ratio of the value in Table 1 for the structures of a given configuration; PE stands for pounding involving an extended frame (i.e., one of the frames has a significantly different mass); ‡ The taller structure is always the left-hand side structure.
 | Model Name | Limit State | |||||||
|---|---|---|---|---|---|---|---|---|
| CI | IO | LS | CP | |||||
| F2I | 0.356 | 0.306 | 0.599 | 0.240 | 0.886 | 0.205 | 1.232 | 0.207 |
| F4I | 0.212 | 0.243 | 0.414 | 0.226 | 0.710 | 0.248 | 1.067 | 0.361 |
| F6I | 0.187 | 0.255 | 0.385 | 0.259 | 0.686 | 0.396 | 0.954 | 0.544 |
| F8I | 0.171 | 0.362 | 0.332 | 0.410 | 0.616 | 0.543 | 0.833 | 0.664 |
| F4P2G0.0 | 0.222 | 0.229 | 0.423 | 0.230 | 0.704 | 0.202 | 0.955 | 0.256 |
| F6P2G0.0 | 0.178 | 0.228 | 0.353 | 0.231 | 0.656 | 0.309 | 0.846 | 0.395 |
| F8P2G0.0 | 0.178 | 0.294 | 0.325 | 0.358 | 0.616 | 0.465 | 0.721 | 0.498 |
| F6P4G0.0 | 0.193 | 0.213 | 0.369 | 0.222 | 0.688 | 0.339 | 0.841 | 0.420 |
| F8P4G0.0 | 0.198 | 0.254 | 0.347 | 0.303 | 0.634 | 0.444 | 0.777 | 0.548 |
| F4PS2G0.0 | 0.206 | 0.276 | 0.245 | 0.351 | 0.248 | 0.380 | 0.248 | 0.380 |
| F6PS2G0.0 | 0.178 | 0.233 | 0.318 | 0.277 | 0.384 | 0.384 | 0.396 | 0.429 |
| F8PS2G0.0 | 0.178 | 0.300 | 0.277 | 0.398 | 0.323 | 0.495 | 0.325 | 0.501 |
| F6PS4G0.0 | 0.133 | 0.321 | 0.136 | 0.349 | 0.136 | 0.349 | 0.136 | 0.349 |
| F8PS4G0.0 | 0.141 | 0.370 | 0.149 | 0.398 | 0.149 | 0.402 | 0.149 | 0.402 |
| F2P2EG0.0 | 0.358 | 0.317 | 0.594 | 0.235 | 0.872 | 0.224 | 1.174 | 0.224 |
| F4P2EG0.0 | 0.193 | 0.225 | 0.361 | 0.242 | 0.649 | 0.226 | 0.923 | 0.240 |
| F6P2EG0.0 | 0.167 | 0.206 | 0.331 | 0.214 | 0.639 | 0.336 | 0.848 | 0.371 |
| F8P2EG0.0 | 0.168 | 0.289 | 0.318 | 0.334 | 0.566 | 0.447 | 0.713 | 0.472 |
| F4PS2G0.5 | 0.213 | 0.260 | 0.360 | 0.265 | 0.389 | 0.301 | 0.393 | 0.313 |
| F6PS2G0.5 | 0.184 | 0.243 | 0.359 | 0.201 | 0.491 | 0.278 | 0.509 | 0.295 |
| F8PS2G0.5 | 0.176 | 0.351 | 0.314 | 0.438 | 0.450 | 0.575 | 0.476 | 0.591 |
| F6PS4G0.5 | 0.169 | 0.348 | 0.206 | 0.472 | 0.209 | 0.492 | 0.209 | 0.492 |
| F8PS4G0.5 | 0.173 | 0.372 | 0.213 | 0.498 | 0.220 | 0.536 | 0.220 | 0.536 |
| F4PS2G1.0 | 0.210 | 0.245 | 0.410 | 0.225 | 0.573 | 0.248 | 0.609 | 0.286 |
| F6PS2G1.0 | 0.187 | 0.255 | 0.386 | 0.252 | 0.640 | 0.346 | 0.704 | 0.390 |
| F8PS2G1.0 | 0.177 | 0.341 | 0.331 | 0.395 | 0.578 | 0.481 | 0.668 | 0.509 |
| F6PS4G1.0 | 0.186 | 0.257 | 0.376 | 0.259 | 0.551 | 0.421 | 0.588 | 0.449 |
| F8PS4G1.0 | 0.178 | 0.347 | 0.330 | 0.397 | 0.524 | 0.462 | 0.549 | 0.477 |
| F6P4G0.50 | 0.187 | 0.266 | 0.387 | 0.226 | 0.691 | 0.357 | 0.854 | 0.401 |
| F8P4G0.50 | 0.180 | 0.344 | 0.343 | 0.352 | 0.627 | 0.452 | 0.770 | 0.527 |
| F4P2G1.0 | 0.210 | 0.245 | 0.415 | 0.228 | 0.737 | 0.254 | 1.027 | 0.277 |
| F6P2G1.0 | 0.187 | 0.255 | 0.388 | 0.253 | 0.704 | 0.369 | 0.897 | 0.432 |
| F8P2G1.0 | 0.177 | 0.340 | 0.331 | 0.396 | 0.614 | 0.471 | 0.749 | 0.520 |
| F6P4G1.0 | 0.186 | 0.258 | 0.377 | 0.258 | 0.670 | 0.374 | 0.824 | 0.418 |
| F8P4G1.0 | 0.178 | 0.347 | 0.329 | 0.386 | 0.649 | 0.497 | 0.749 | 0.518 |
Publisher’s Note: MDPI stays neutral with regard to jurisdictional claims in published maps and institutional affiliations. |
© 2021 by the authors. Licensee MDPI, Basel, Switzerland. This article is an open access article distributed under the terms and conditions of the Creative Commons Attribution (CC BY) license (https://creativecommons.org/licenses/by/4.0/).
Share and Cite
Mohamed, H.; Romão, X. Seismic Fragility Functions for Non-Seismically Designed RC Structures Considering Pounding Effects. Buildings 2021, 11, 665. https://doi.org/10.3390/buildings11120665
Mohamed H, Romão X. Seismic Fragility Functions for Non-Seismically Designed RC Structures Considering Pounding Effects. Buildings. 2021; 11(12):665. https://doi.org/10.3390/buildings11120665
Chicago/Turabian StyleMohamed, Hossameldeen, and Xavier Romão. 2021. "Seismic Fragility Functions for Non-Seismically Designed RC Structures Considering Pounding Effects" Buildings 11, no. 12: 665. https://doi.org/10.3390/buildings11120665