Next Article in Journal
Managing Fast-Track Construction Project in Qatar: Challenges and Opportunities
Previous Article in Journal
Net-Zero Energy Districts and the Grid: An Energy-Economic Feasibility Case-Study of the National Western Center in Denver, CO, USA
 
 
Retraction published on 26 August 2022, see Buildings 2022, 12(9), 1310.
Article

An Investigation of Bearing Capacity of High-Strength SRC Columns under Eccentric Axial Load

1
School of Civil Engineering, Northeast Forestry University, Harbin 150038, China
2
Shimao Group Holdings Limited, Minmin Temple Subway Station, Beijing 100020, China
*
Authors to whom correspondence should be addressed.
These authors contributed equally to this work, and should be considered as co-second author.
Buildings 2021, 11(12), 639; https://doi.org/10.3390/buildings11120639
Submission received: 17 November 2021 / Revised: 7 December 2021 / Accepted: 9 December 2021 / Published: 11 December 2021 / Retracted: 26 August 2022
(This article belongs to the Section Building Energy, Physics, Environment, and Systems)

Abstract

:
This paper investigates the eccentric compression performance of high-strength steel reinforced concrete (SRC) columns. In addition, the feasibility of the calculation codes used for the load-carrying capacity of these columns is verified by eccentric compression tests on 10 high-strength SRC columns with Q460 and Q690 steels and two normal SRC columns with Q235 steel. Moreover, the influence of the steel strength, relative eccentricity, steel ratio, and stirrup spacing on the bearing capacity and ductility of the specimens is analyzed. It was found that the bearing capacity and ductility of the specimens significantly increases when the steel strength increases from 276.5 MPa to 774.2 MPa; the bearing capacity of the Q690 SRC column is slightly higher than that of the Q460 SRC column. In addition, the ductility coefficient of the Q690 SRC columns is significantly higher than that of the Q460 SRC columns. It was also found that increasing the eccentricity and steel ratio can improve the ductility of the specimens and the smaller stirrup spacing can enlarge the contribution of Q690 steel under the ultimate bearing capacity. It is demonstrated that Eurocode 4-2004 and AISC360-16 codes significantly underestimate the test results. In contrast, JGJ138-2016 slightly underestimates the test results when the relative eccentricity is 0.2 but overestimates the test results when the relative eccentricity is 0.6. Furthermore, in order to maximize the contribution of Q690 steel under ultimate bearing capacity, the expanded parameter analysis is carried out using a finite element model. Following the analysis results, the suggestions for designing high-strength SRC columns under eccentric load are provided.

1. Introduction

Steel reinforced concrete (SRC) members are widely used in high-rise buildings and long-span structures to obtain higher load-bearing capacity, smaller sectional dimensions, and good seismic performance. In recent years, high-strength steels have been used in SRC structures exemplified by Star City in Sydney and Shenzhen Bay Sports Center in China [1,2,3,4]. The high strength still improves the load-bearing capacity and ductility, so that the member section and the amount of building materials are reduced. However, some factors affecting the material performance and the structure design have not yet been considered.
In 2014, in the high-rise project of Zhengzhou Greenland Central Plaza in China, Q460 and Q690 high-strength steels replaced the Q345 ordinary steel in SRC composite columns in the upper part of the structure. Thus, the self-weight of the structure was reduced, and the design strength was ensured. However, in that high-rise project, the lack of specifications of relevant design and lack of calculation methods of high-strength SRC structures made the accuracy of the bearing capacity calculations of the pre-designed Q460 SRC columns challenging. In order to ensure the safety of the structure of Zhengzhou Greenland Central Plaza, Yang et al. performed scale model tests on Q460 SRC columns under eccentric load [5]. They found that the bearing capacity and ductility of the specimens could meet the project’s needs. In addition, they found that the increasing magnitude of Q460 SRC columns is more significant than that of ordinary SRC columns. In addition, Yang et al. proposed that the superposition method is more accurate than the N-M curve method in Eurocode 4, and the N-M curve method is more conservative [6]. Nevertheless, the small number of specimens and only the small eccentricity that Yang et al. took into account increased the randomness of the results. Later, Kim et al. conducted a series of tests to study the influencing factors on the bearing capacity of high-strength SRC columns under large and small eccentricity conditions [7,8]. They also calculated the bearing capacity of specimens using different specifications. By comparing the test and calculated results, Kim et al. found that, when the eccentricity is small, the AISC 360-16 specification underestimates the bearing capacity of the specimens, while the Eurocode 4 overestimates the bearing capacity [9,10,11]. Thus, for a large eccentricity case, Eurocode 4 was in better agreement with the test result. In addition, by analyzing the failure mode, Kim et al. pointed out that the crushing failure of concrete always occurred before the steel developed its full plastic strength. This fact implies that the traditional plastic stress distribution method is not suitable for designing high-strength SRC columns. Therefore, following the materials’ strain analysis, the strain compatibility method was recommended. Gradually, the applicability of this method was developed by several scholars. In 2016, Cheol-Ho Lee used the strain compatibility method for the design of short rectangular concrete-filled tube (CFT) columns under eccentric axial loads [12,13]. Based on his results, in order to enhance the reliability of the strain compatibility method, an empirical stress–strain model, which can capture the stress–strain characteristics of the confined concrete of rectangular CFT columns is proposed, based on the analysis of an extensive existing test. This conclusion considered the strain compatibility method and steel confinement together, which provided a new idea for the design and calculation of SRC columns.
In recent years, the theory of confinement has been gradually developed and applied to SRC structures [14,15]. Wang et al. carried out a series of experimental studies on SRC columns under different loads and found that the actual peak stress and peak strain of confined concrete can be increased by the steel confinement effect, which cannot be ignored [16,17]. With the confinement on the strain of concrete, they tried to design SRC columns under axial load considering the confinement and strain compatibility method. Using this method, the contribution of materials under the maximum bearing capacity of specimens was maximized. However, whether strain compatibility method is applicable to design SRC columns under eccentric load still lacks of a lot of experimental analysis. Therefore, the systematic analysis of the factors affecting the bearing capacity of high-strength SRC columns under eccentric load and the application of the strain compatibility method to the specimens’ design still needs further study.
Therefore, in the present paper, Q460 and Q690 SRC columns under eccentric axial load are studied, in order to analyze the influence of strength grade, relative eccentricity, steel ratio, and stirrup spacing on the bearing capacity and ductility of high-strength SRC columns. In addition, test results and calculated results are compared to verify the applicability of the calculation methods provided by different specifications for the bearing capacity of high-strength SRC columns. These specifications include the Structural Steel Buildings (AISC360-16, Chicago, IL, USA) [18], Design of Composite Steel and Concrete Structures (EN1994-1-1:2004, Eurocode, Brussels, Belgium) [19] and Code for Design of Composite Structures (JGJ138-2016, Beijing, China) [20]. Furthermore, a finite element model is established to analyze the expanded parameters of concrete grade and verify the accuracy of the strain compatibility method. Based on the test and calculated results, some reasonable suggestions for the specimen design are proposed.

2. Experimental Investigation
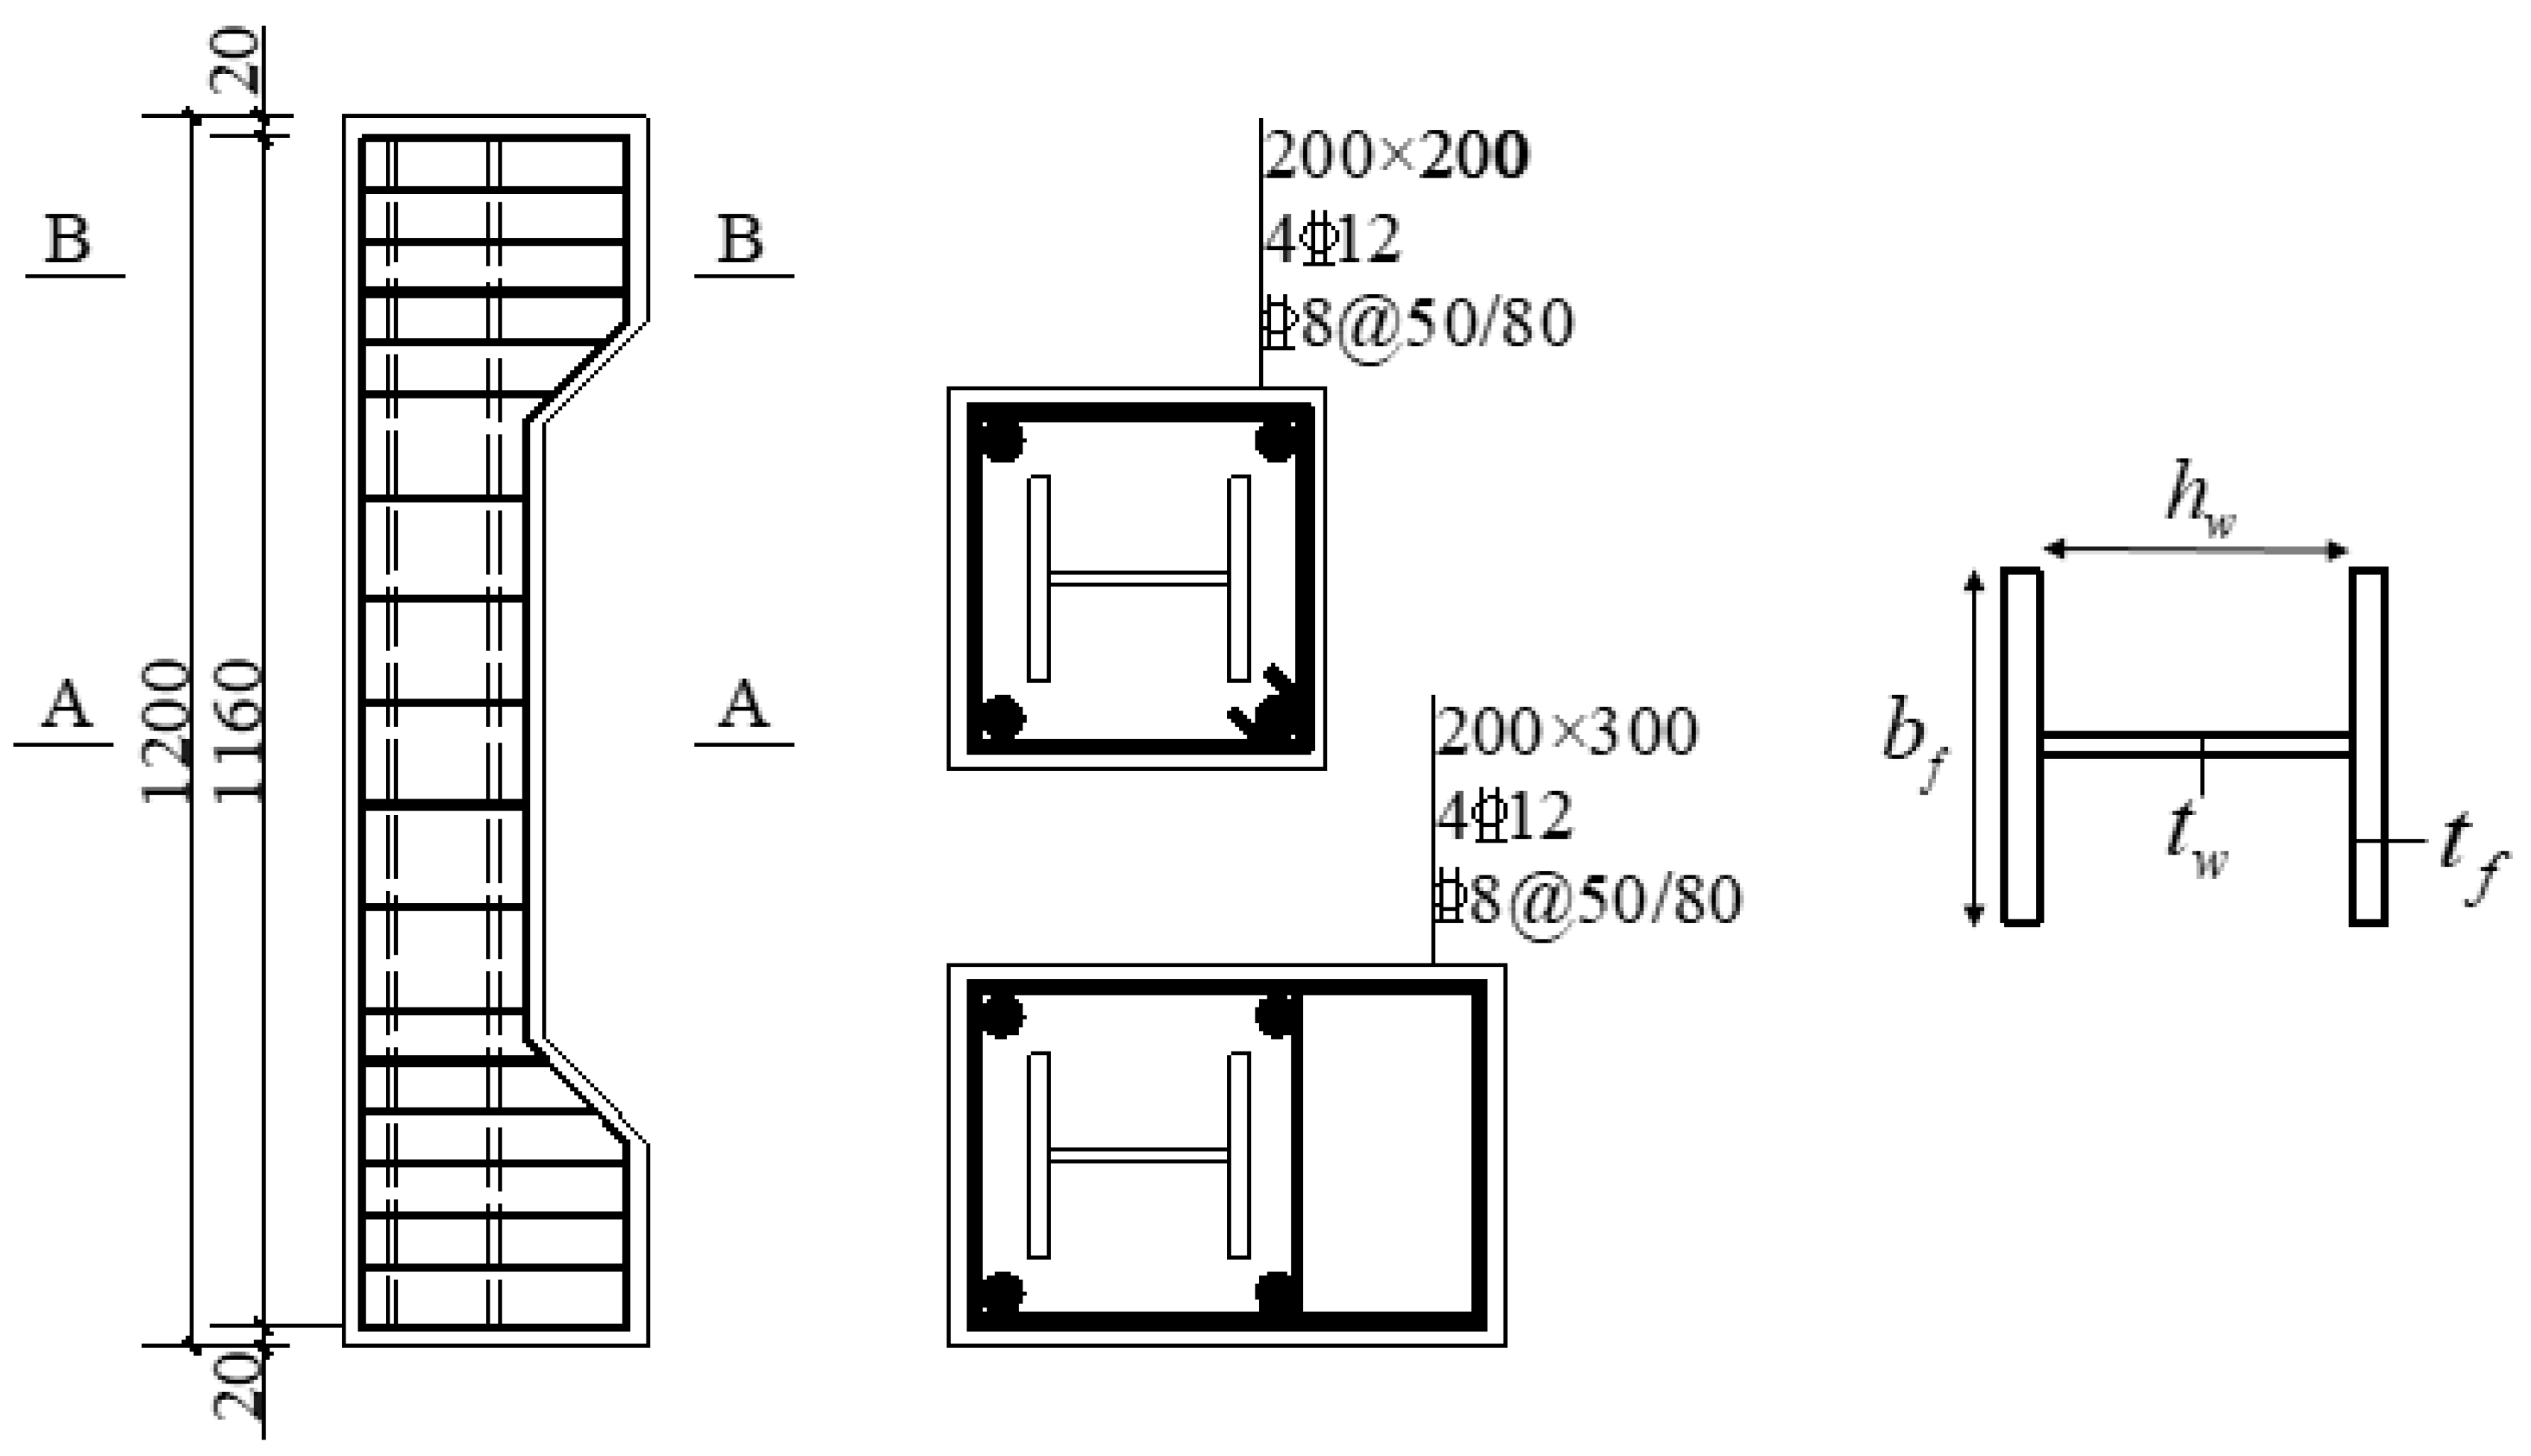
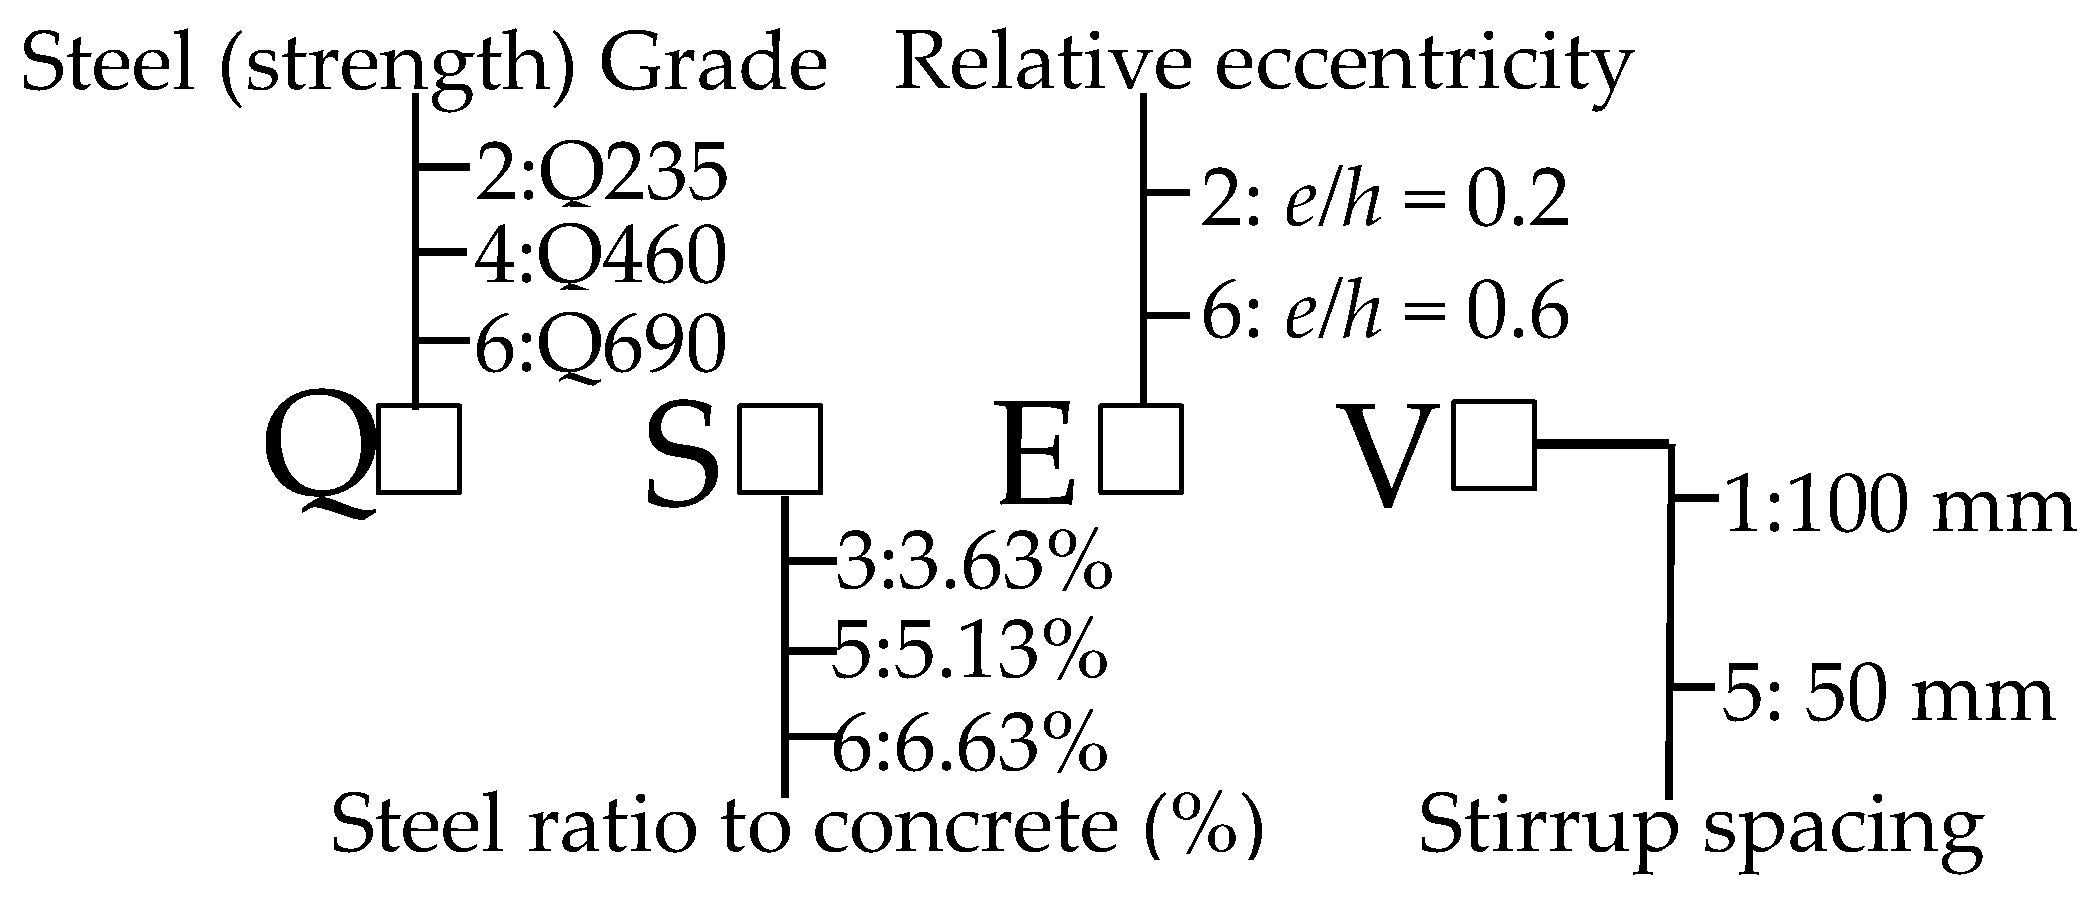
2.1. Test Specimen

Ten high-strength SRC columns and two ordinary SRC columns were tested in the structural laboratory of Northeast Forestry University. The type of section selected for this study is shown in Figure 1. In addition, the measured actual cross-section dimensions and parameters of specimens are provided in Table 1 and the labeling rule of the specimens is shown in Figure 2. To prevent local pressure failure at the upper and lower ends of the column, stirrup encryption and carbon fiber cloth reinforcement were performed within 1/6 height of both column ends.

2.2. Materials Properties

Steel sheets of grades Q235, Q460, Q690, and the reinforcement of HRB400 were selected to manufacture the specimens. Note that tensile coupon tests were carried out to obtain the steel material properties, and compression tests were carried out to obtain the properties of the concrete materials. Following the Chinese Standard GB/T 228-2010 [21], the measured material properties of steel provided in Table 2 are mean values of results.
It should also be noted that the C50 concrete was used in the test. After the preparation work was finished, all the specimens were poured simultaneously and maintained for 28 days under the condition of a temperature not less than 10 °C. Following the Standard for test methods of concrete structures (GB/T 50152-2012) [22], nine concrete cubes (150 mm × 150 mm × 150 mm) were maintained under the same conditions as the specimens. As shown in Figure 3, the compressive strength test according to GB/T 50152-2012 was carried out before the formal loading began. The results are listed in Table 3.
In Table 3, f c u 0 is the cubic compressive strength of concrete by the test; f c u , m 0 is the average cubic compressive strength; f c 0 is the calculation of the prism compressive strength, which is used in the finite element models; E c 0 is the elastic modulus measured by the test.

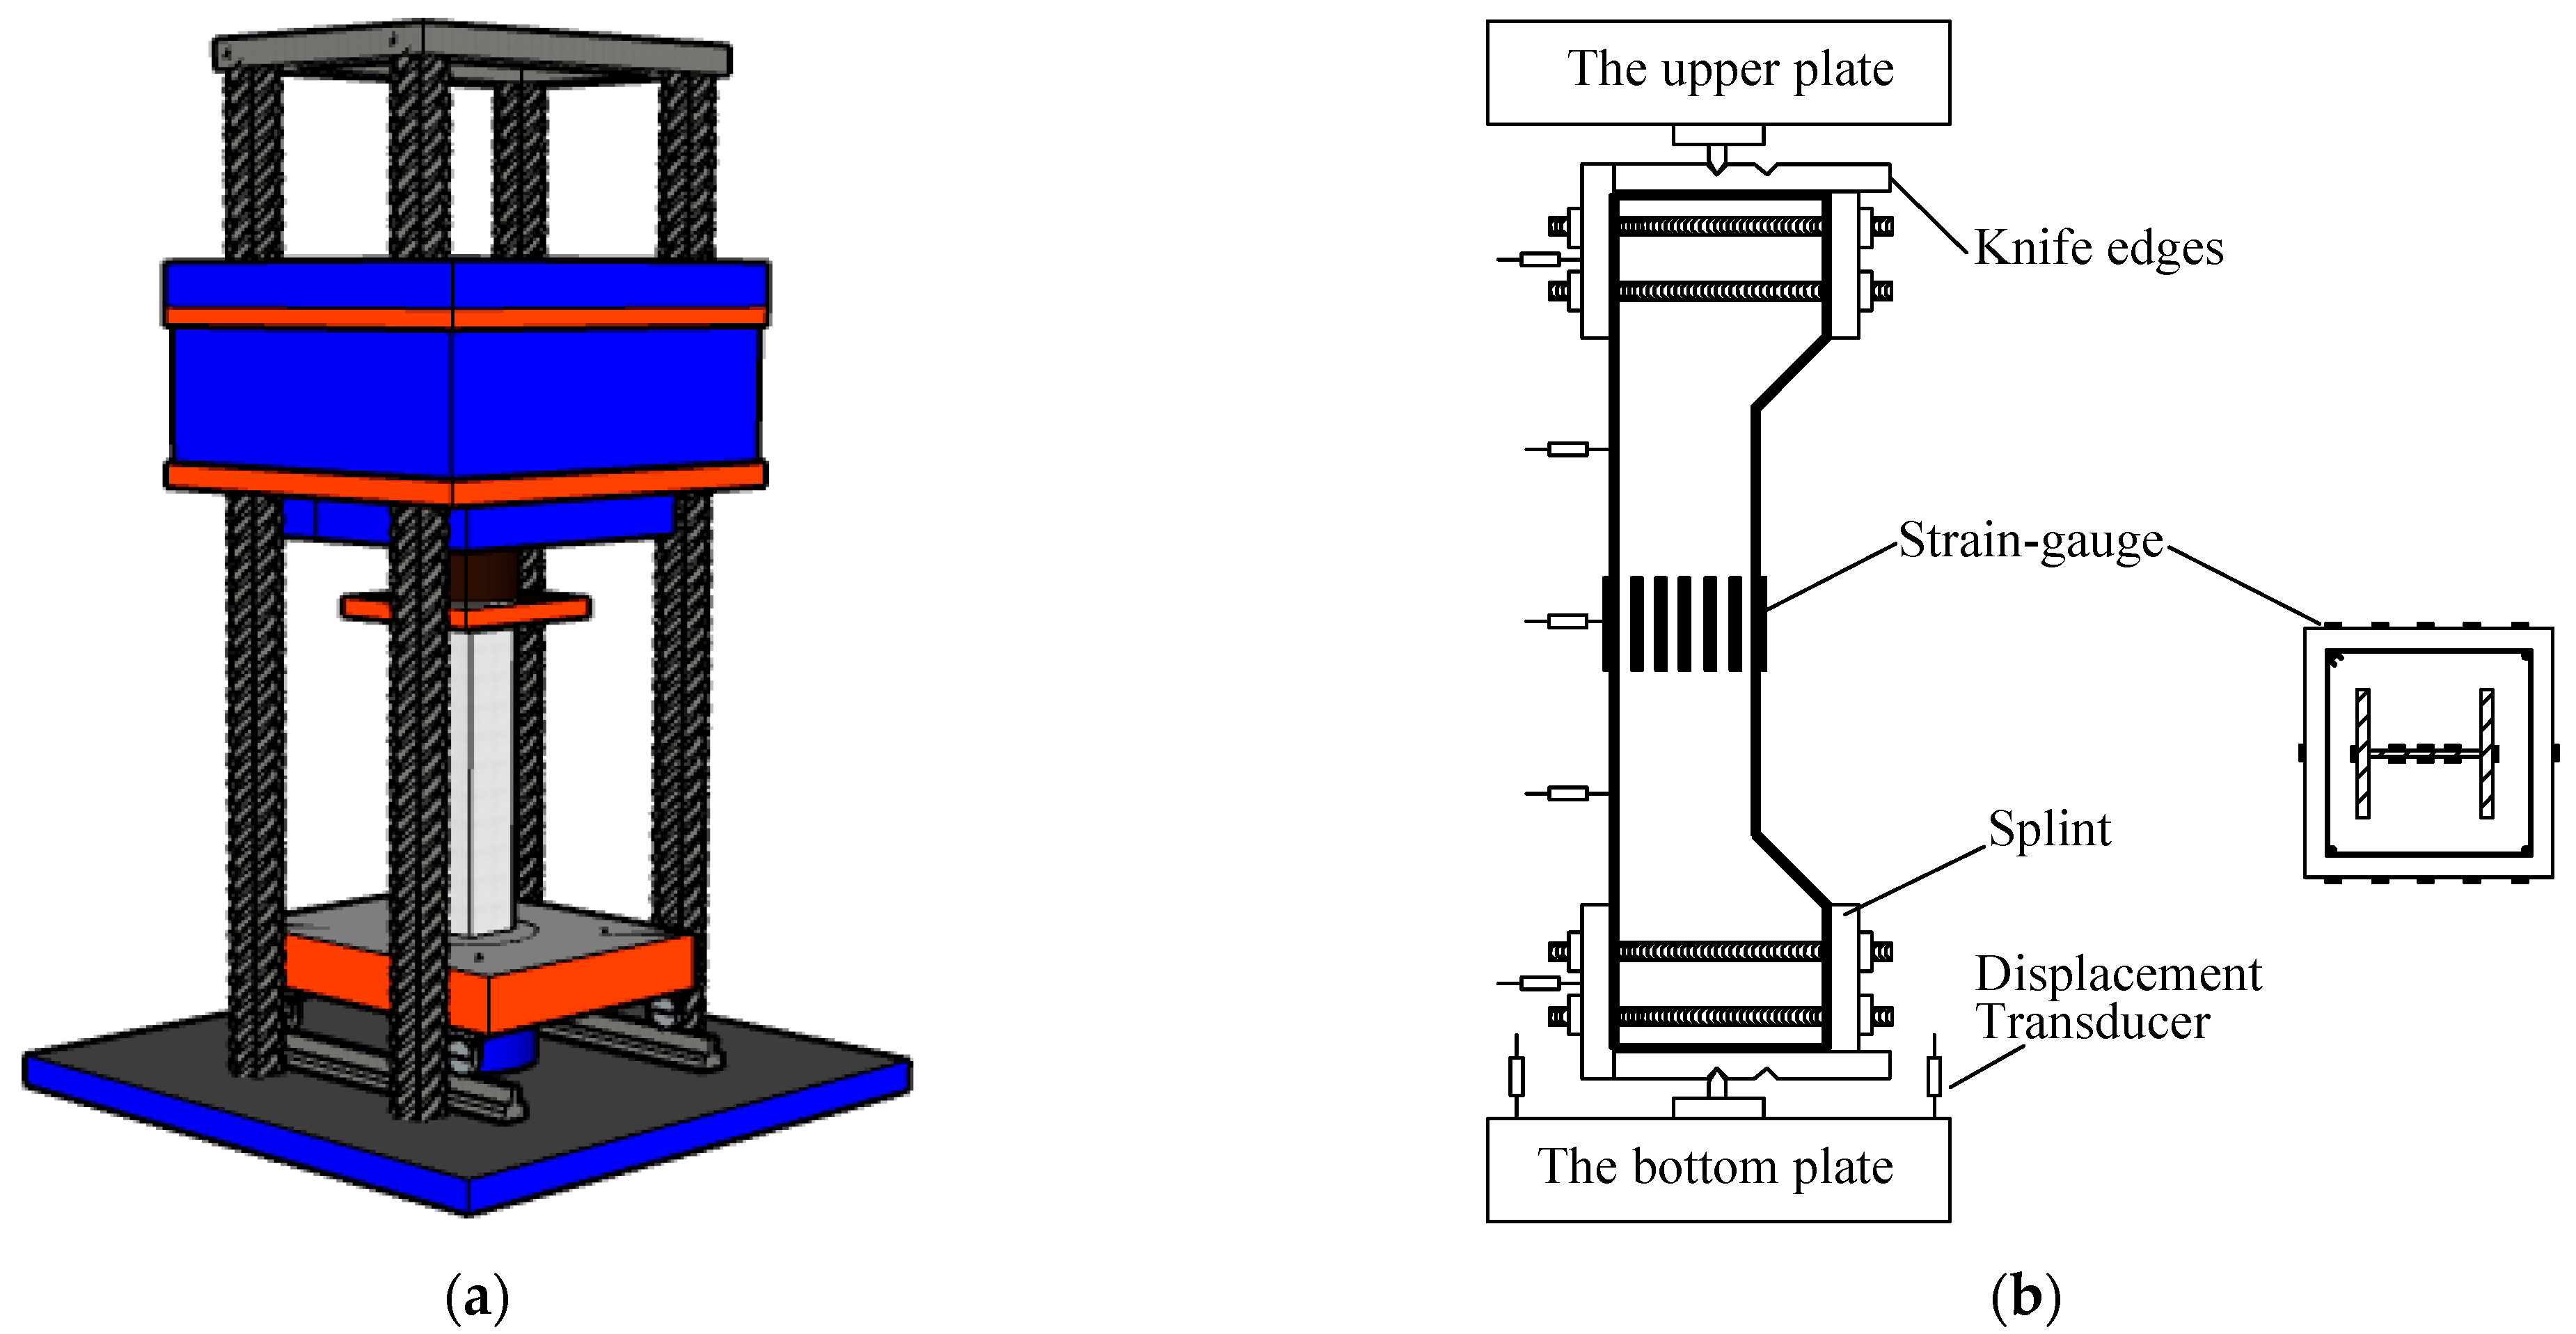
2.3. Test Setup and Operation

The test setup is shown in Figure 4. A 10,000 kN hydraulic servo testing machine was used for loading. The hydraulic jack applies the load to the column through the knife-edges. In addition, both ends of the column are provided with 50 mm thickness knife-edges, connected with the splint. The knife-edges and splint are both fixed on the bracket, and the eccentricity is controlled by changing the position of the knife head in the knife groove.
The pre-loading condition was adopted to check whether the machine was working properly. During the formal test, the load was divided into several steps. The first step was force control. Before the load reached 60% of the estimated ultimate load, each step was 10% of the estimated ultimate load, the loading rate was 300 kN/min, and the load lasted three minutes. When the load reached 60% of the estimated ultimate load, the loading rate dropped to 150 kN/min. Then, when the load was close to 80% of the estimated ultimate load, the loading rate was 0.6 mm/min until reaching the ultimate load. Finally, the loading ended when the load decreased to less than 80% of the ultimate load.
The vertical displacement at the end of the column and the lateral displacement along the height of the column were monitored by displacement transducers. Strain gauges are arranged on the outside of the steel flange, on both sides of the web, and on the side of the concrete at the middle section of the column height. The arrangement of the measuring points is shown in Figure 4.

3. Test Results and Analysis
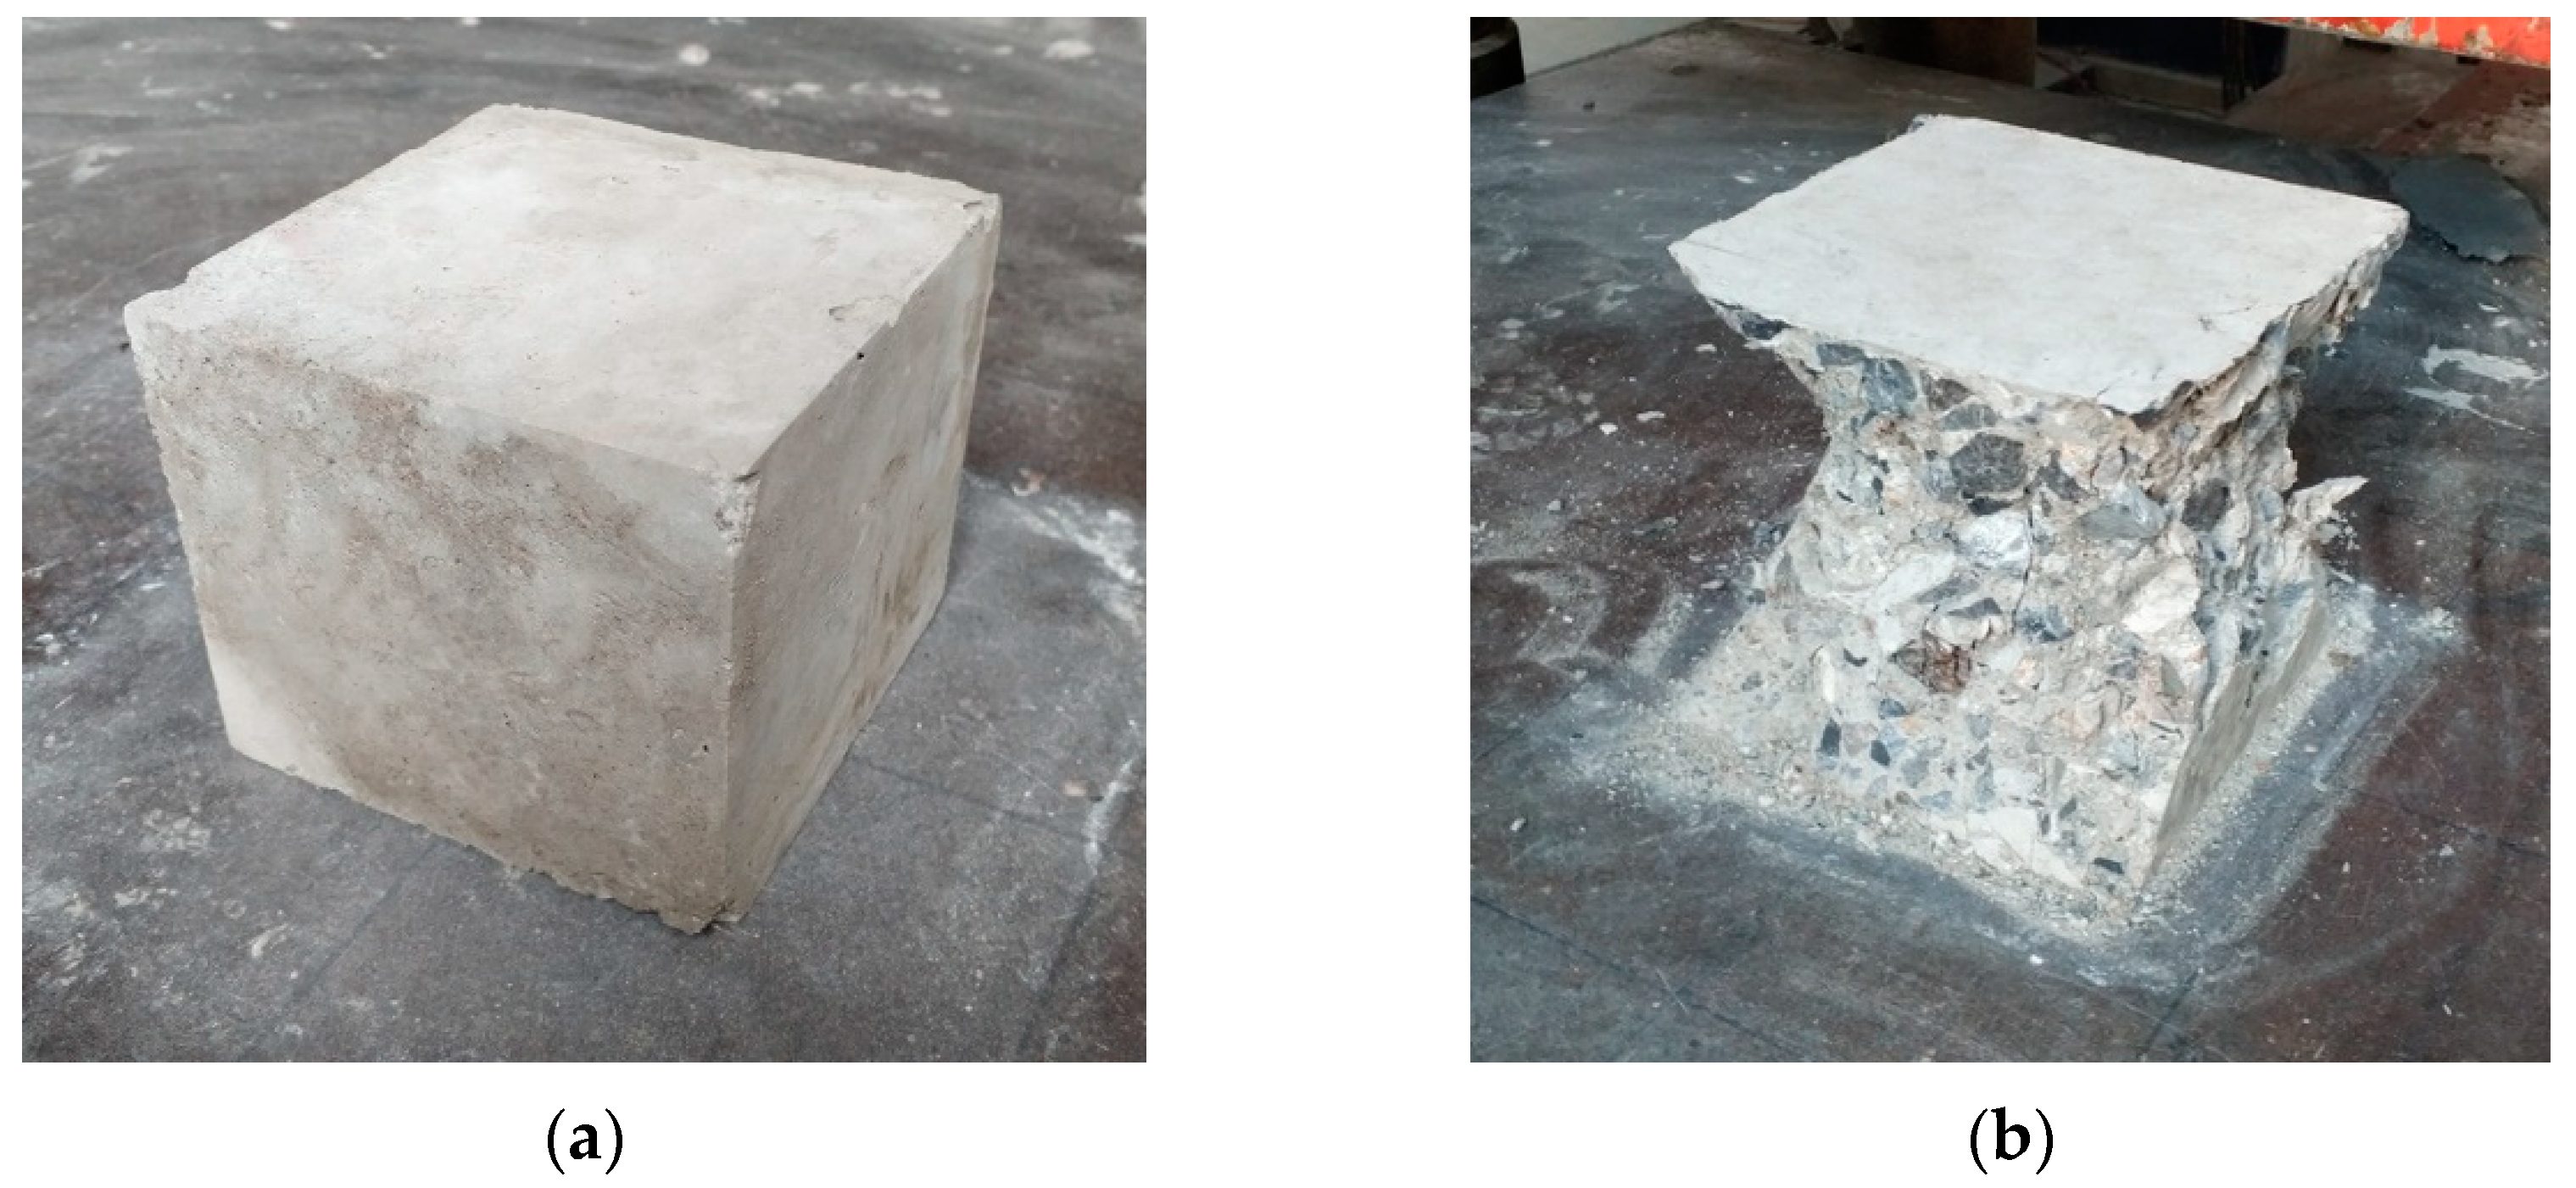
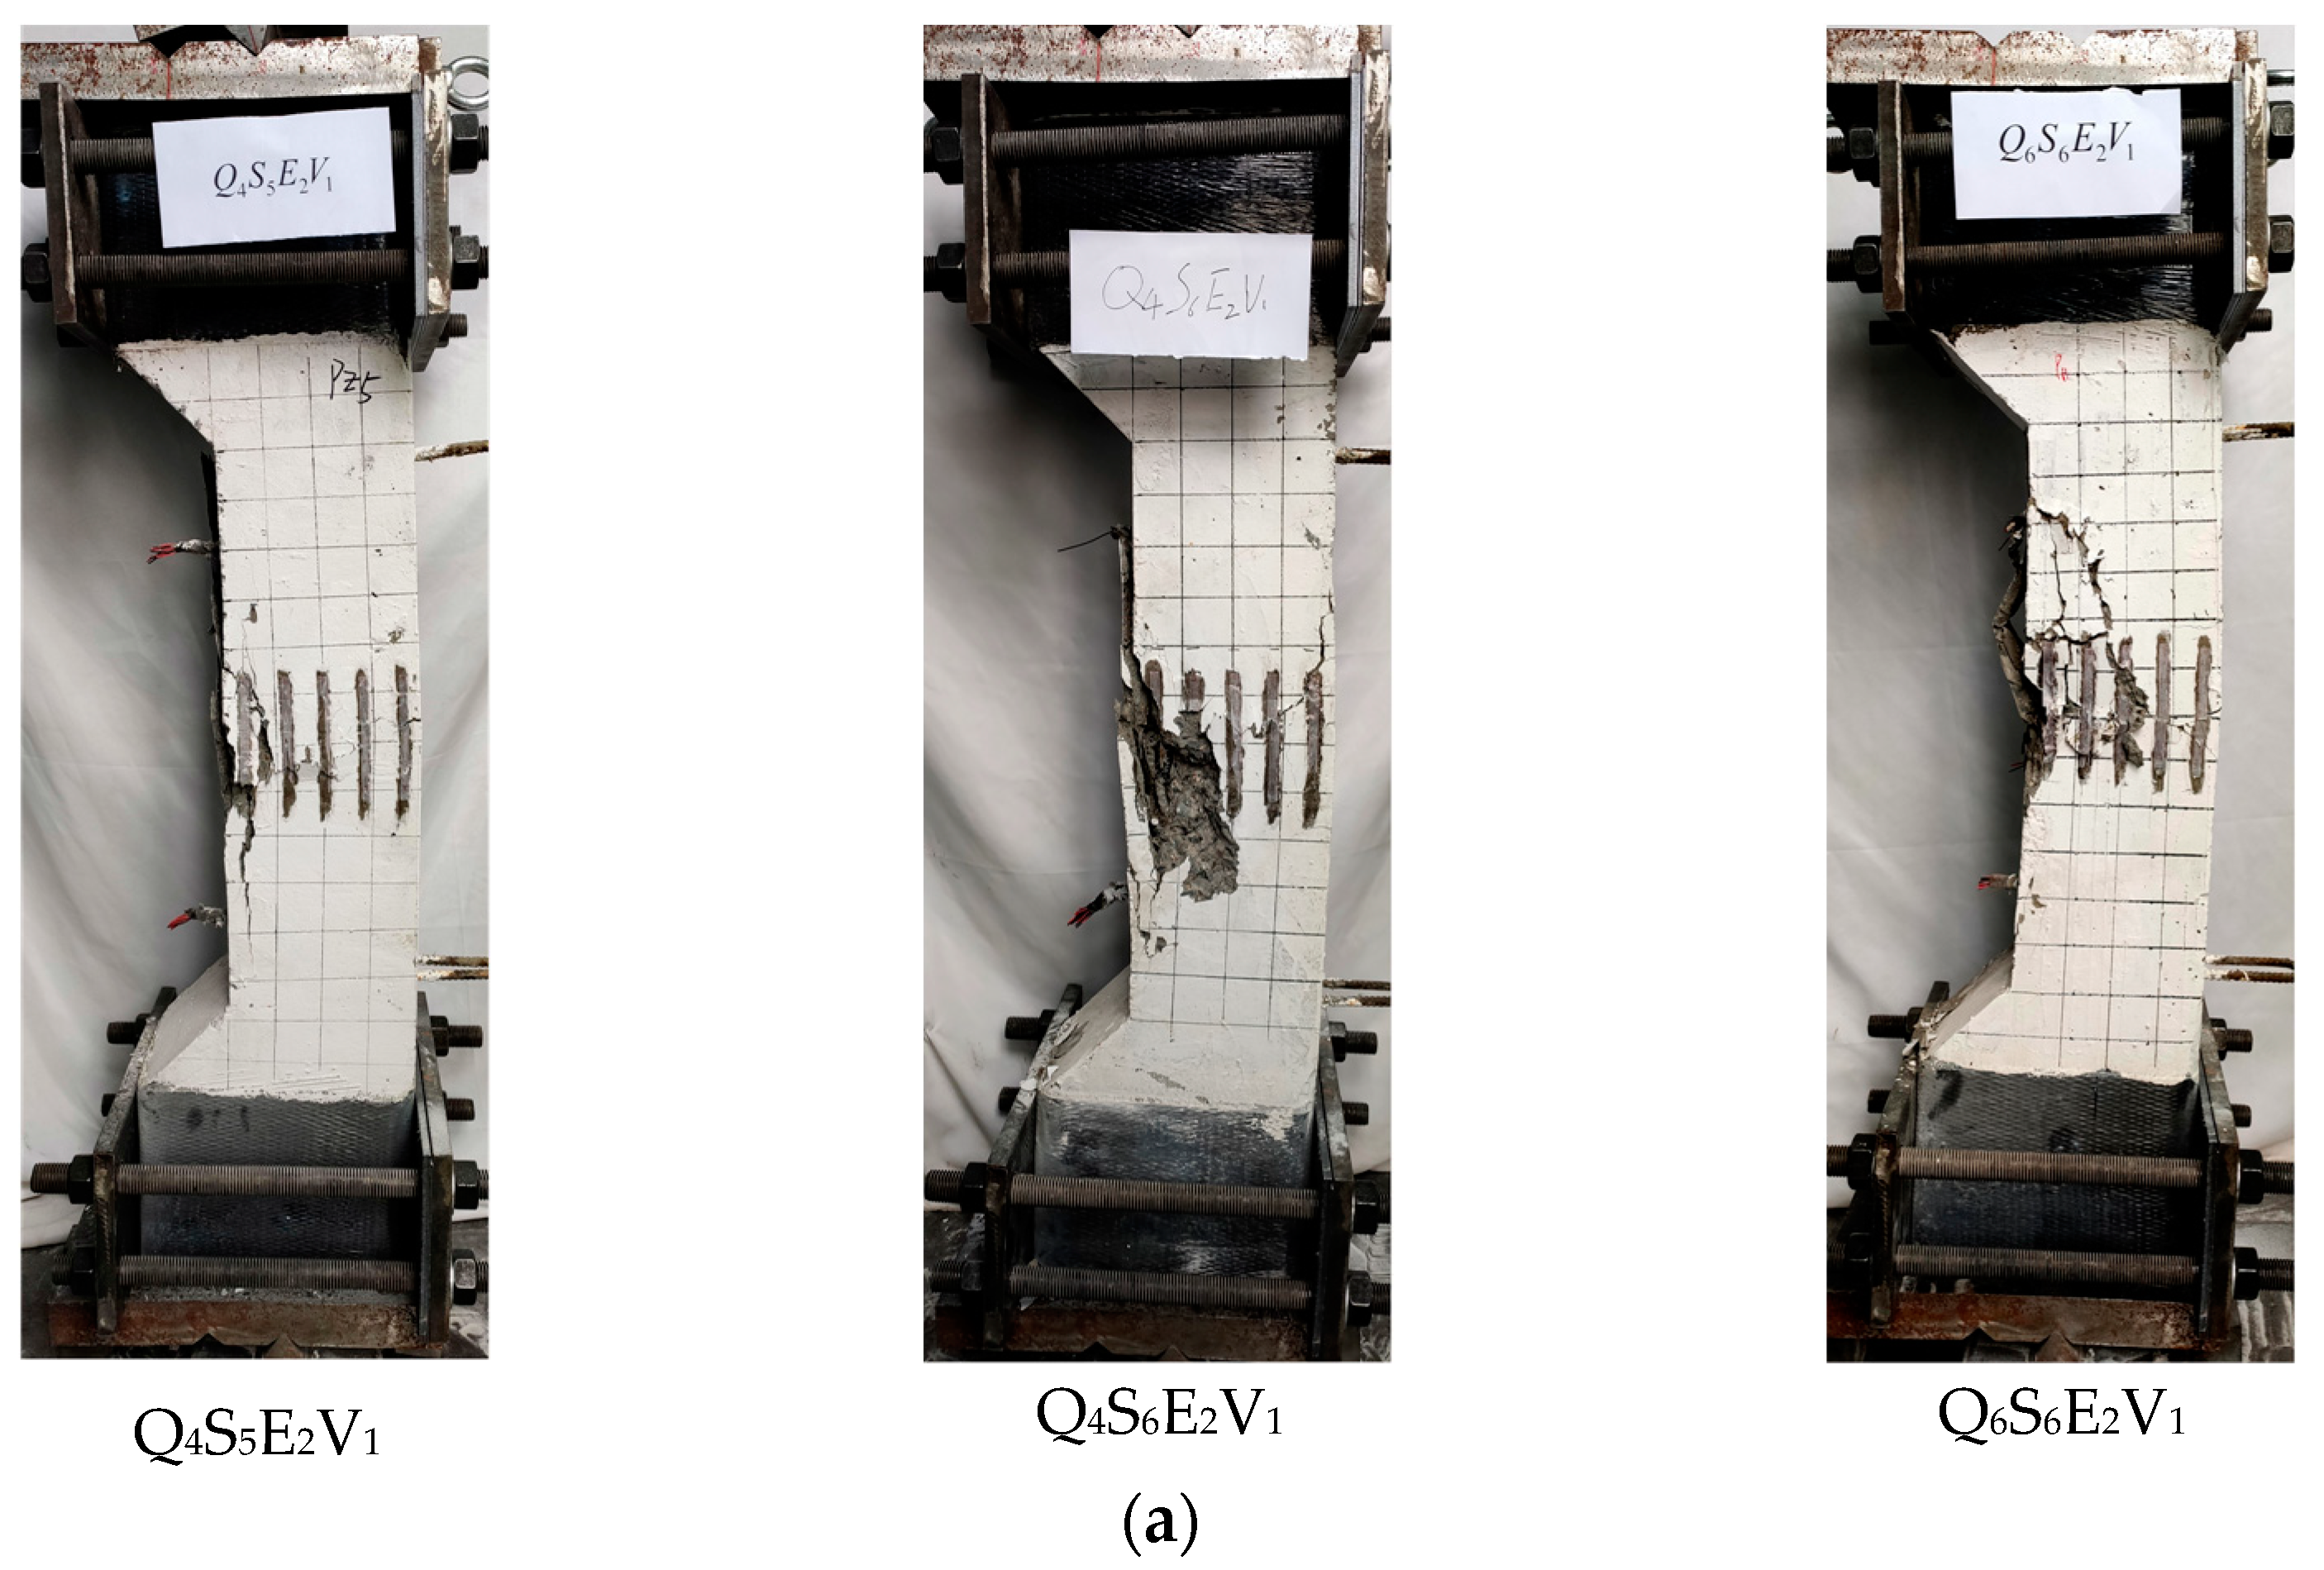
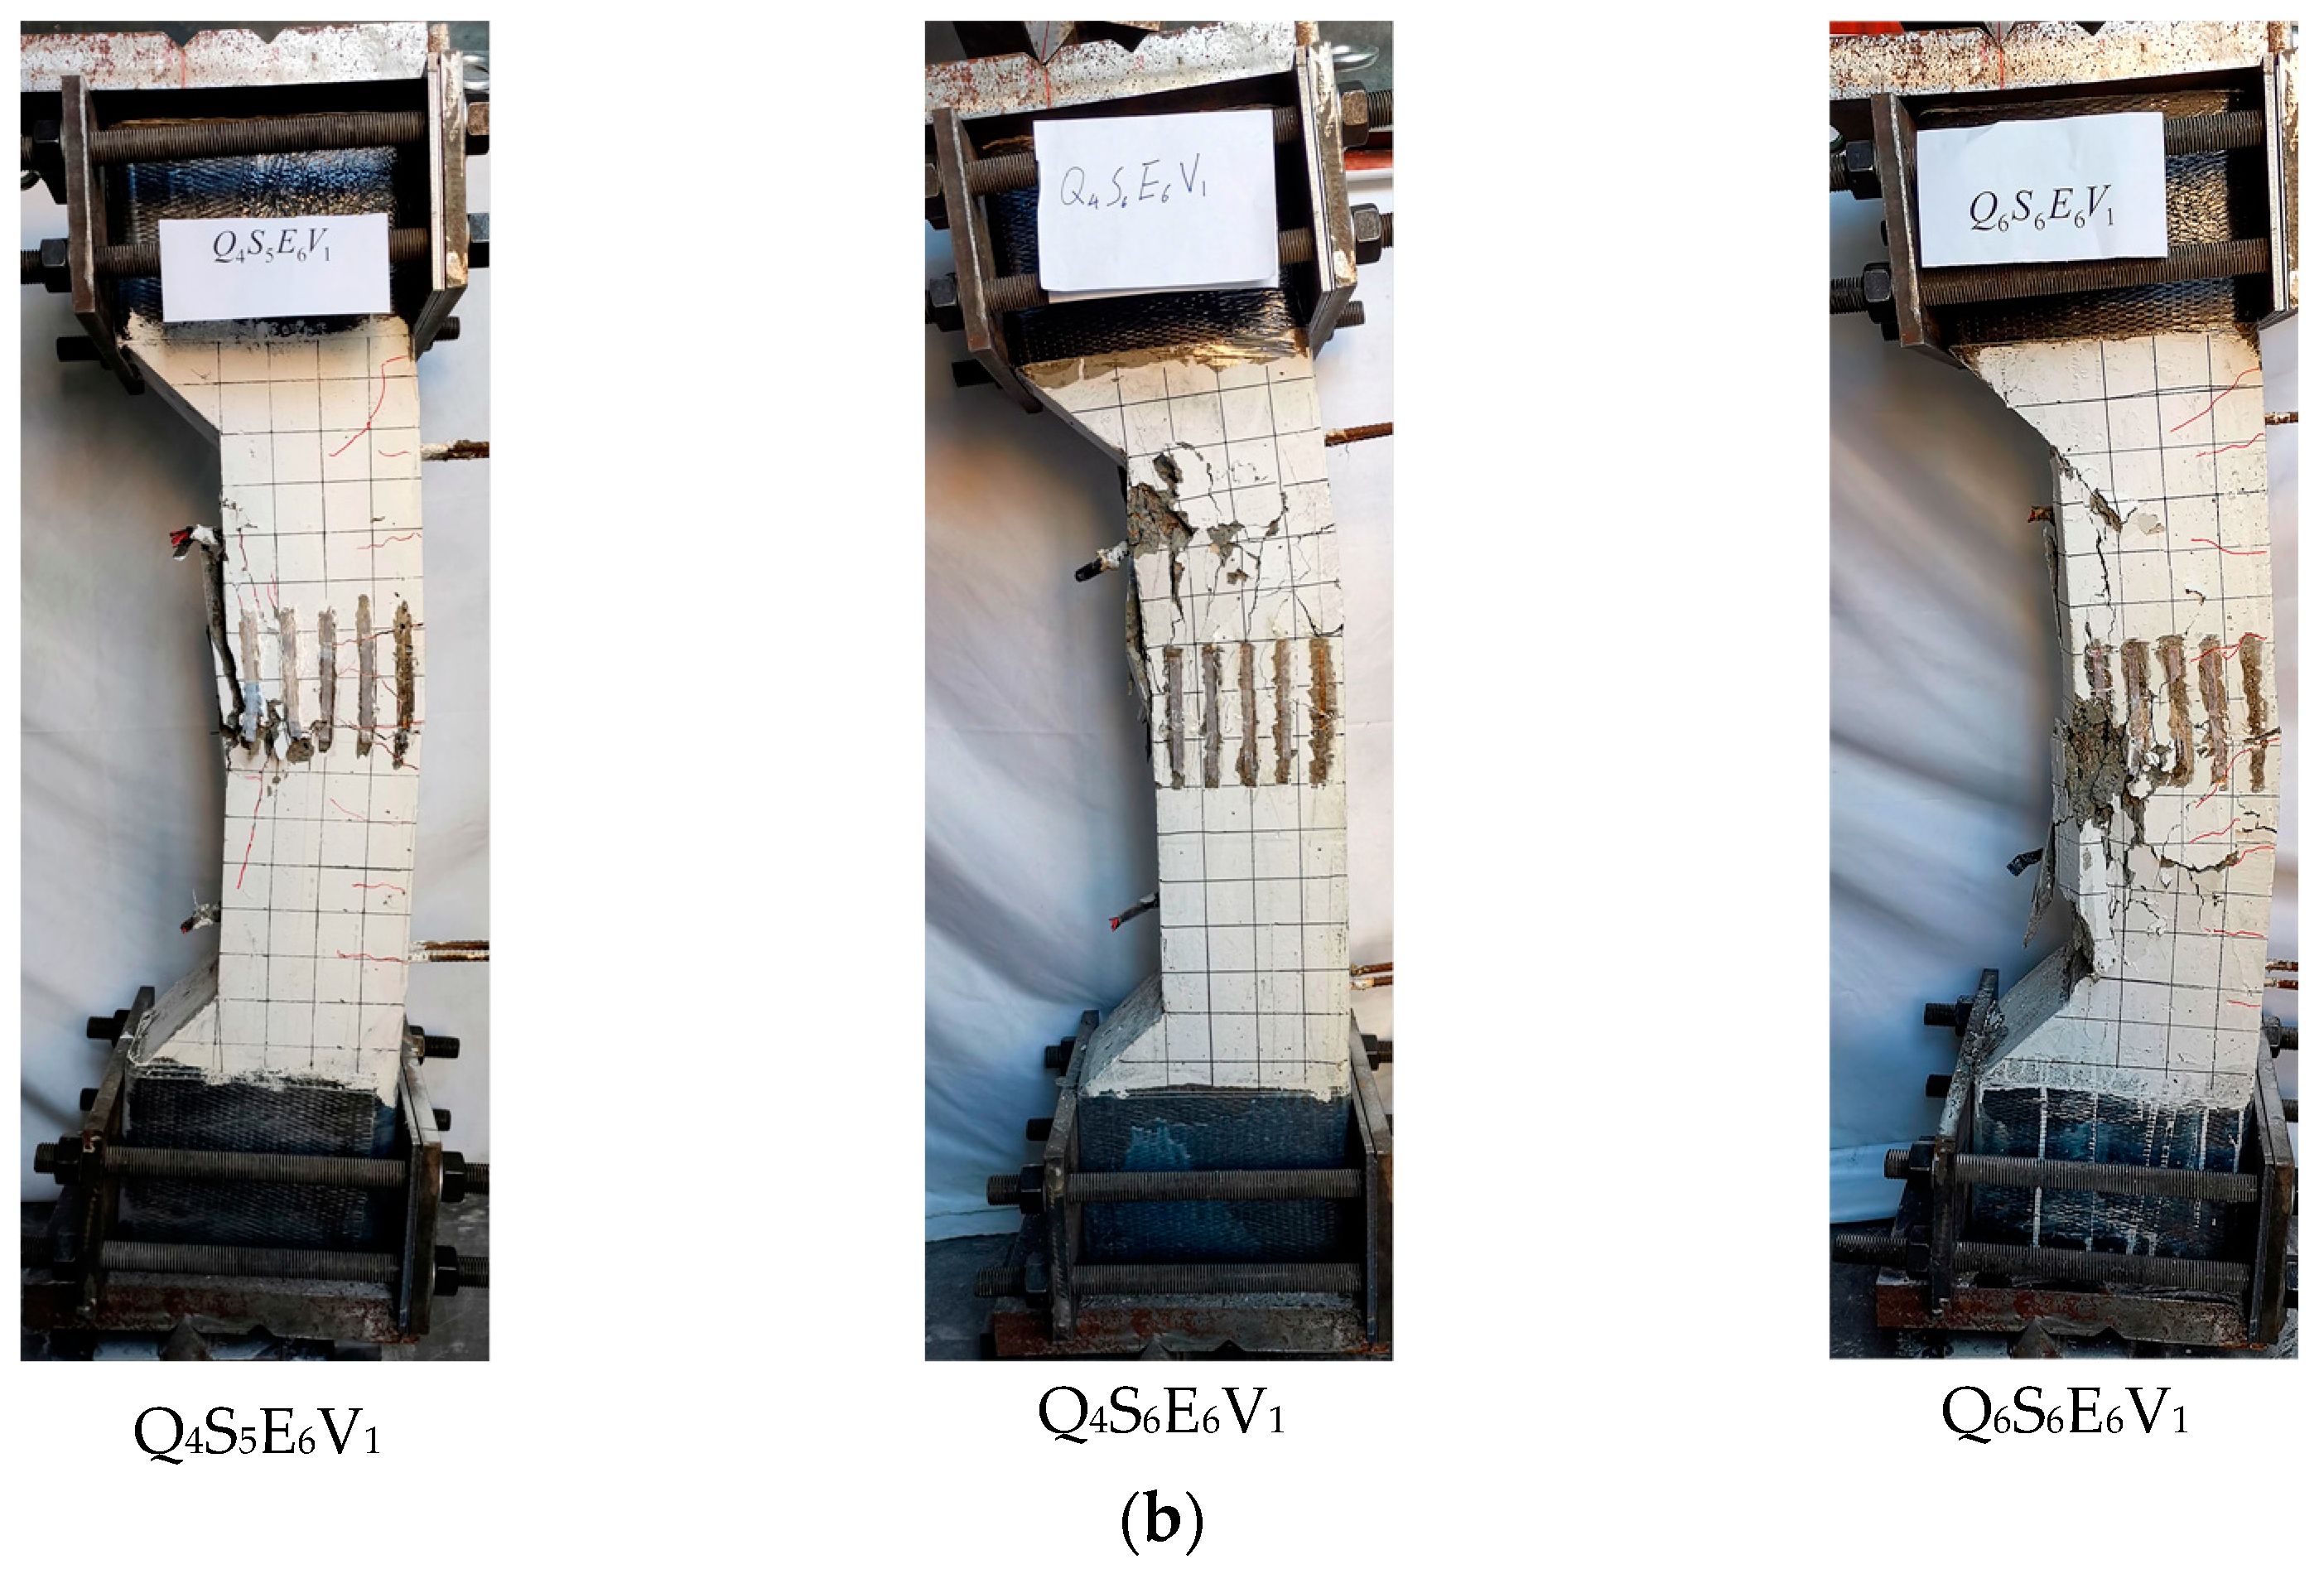
3.1. Failure Mode

Figure 5a presents the failure mode of the specimens with small relative eccentricity (e/h = 0.2). Before the load reached 80% of the ultimate load, small cracks appeared on the tensile side of the specimens, and the cracks did not develop further. When the load reached 80% of the ultimate load, vertical cracks appeared on the concrete compression side and extended to the end of the column. When the ultimate load was applied, the concrete on the compressive side was crushed, and there was a wide transverse crack on the concrete tensile side.
Figure 5b shows the failure mode of the specimens with e/h = 0.6. Before the load reached 60% of the ultimate load, cracks appeared and developed gradually. When the load reached 60% of the ultimate load, several main cracks of concrete formed on the tensile side and extended to the compression side, but no new cracks appeared. When the load reached to 90% of the ultimate load, the concrete on the compression side stared peeling, the tensile crack propagated through the whole tensile section, and the column presented obvious bending deformation. Moreover, when reaching the ultimate load, the concrete on the tension side had several wide transverse cracks with crushing concrete on the compression side.

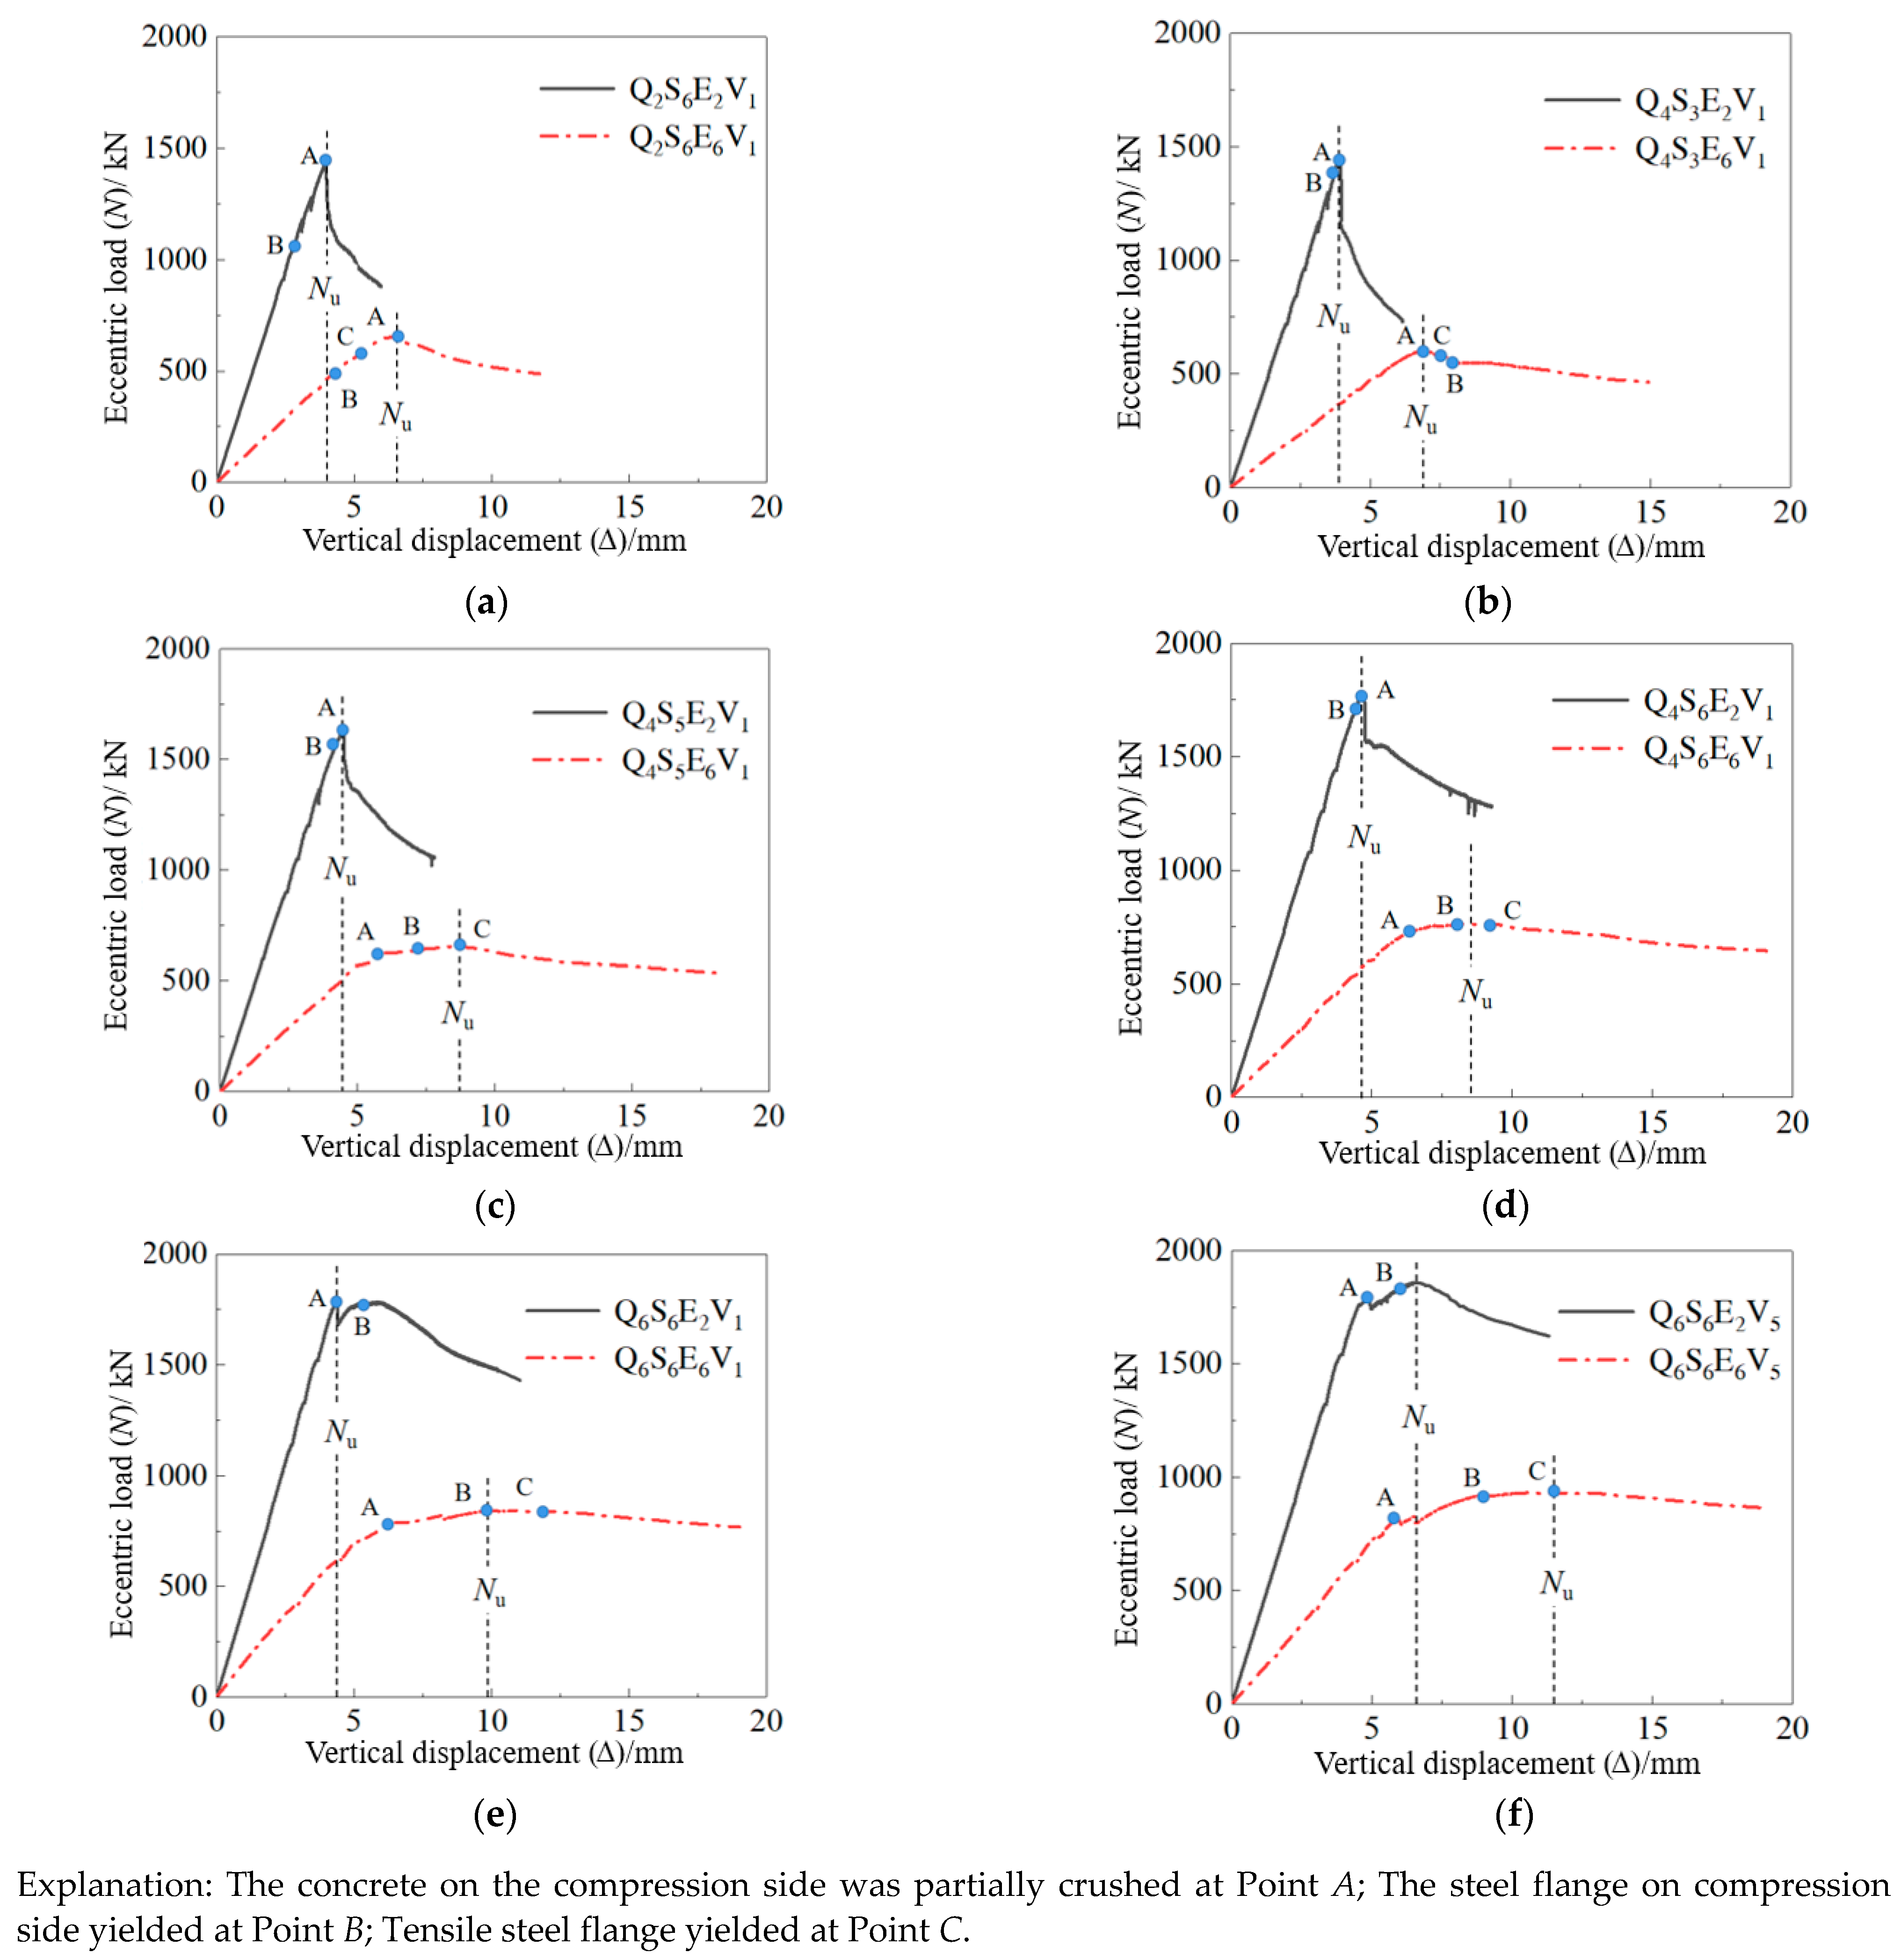
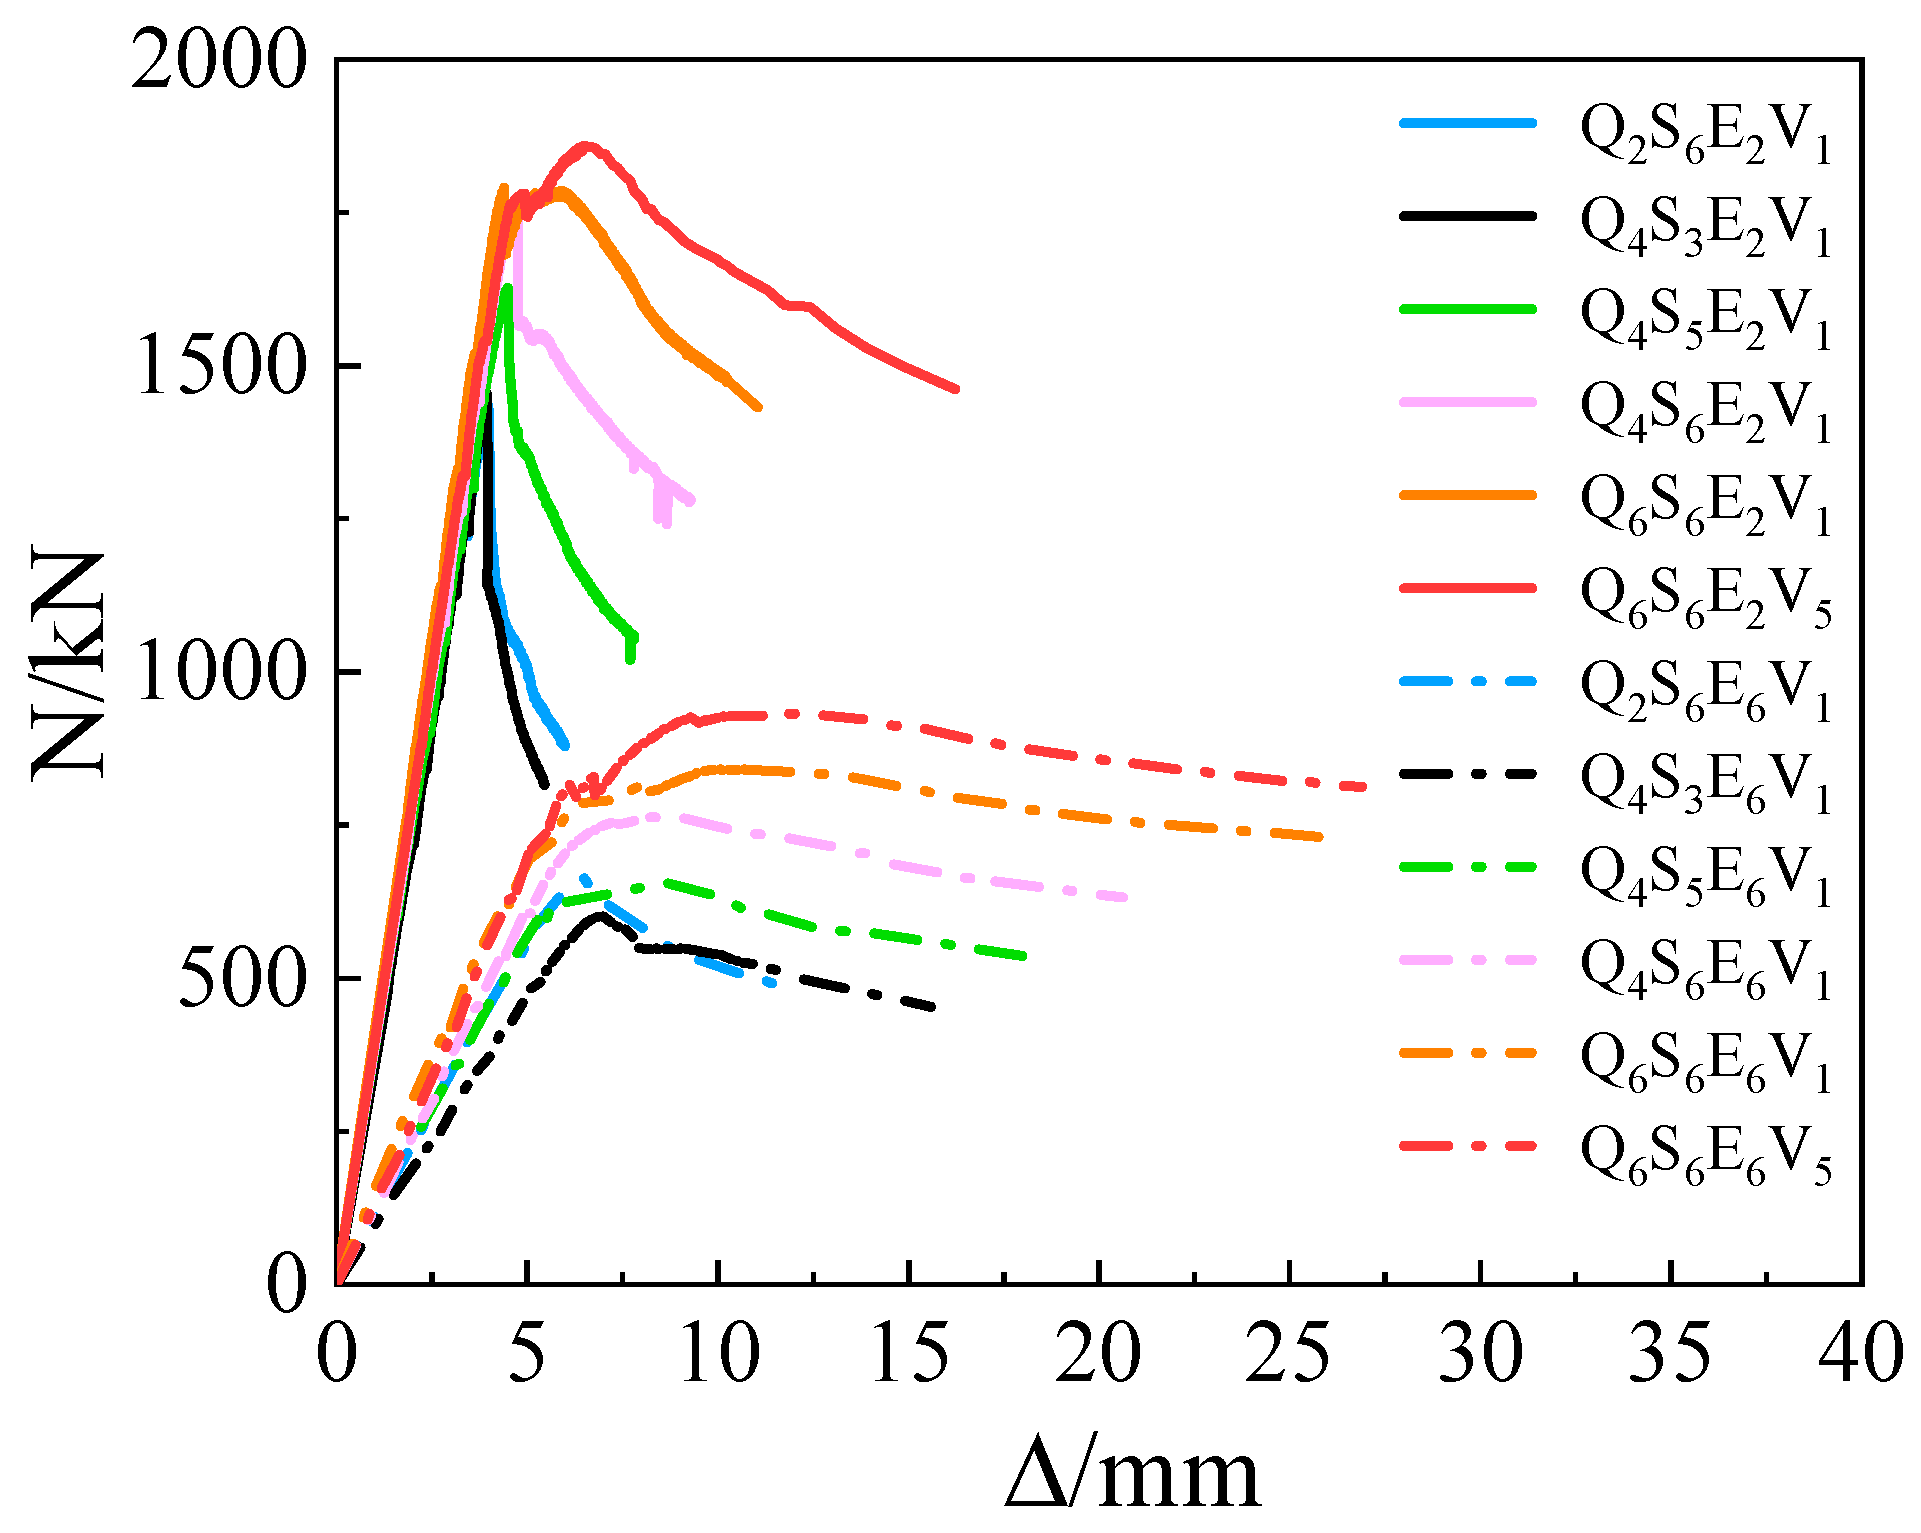
3.2. Load-Displacement Relationships

The load-displacement relationships of the specimens are shown in Figure 6. Under the steel ratio of 6.63%, the bearing capacity of Q235 SRC specimens reached the ultimate bearing capacity when the concrete was partially collapsed, shown as point A in Figure 6a. Afterward, the bearing capacity obviously dropped. It was found that before the compression side of concrete was crushed, the compression steel flange had already yielded, because the yield strain of Q235 steel was less than the peak strain of concrete. As a result, the bearing capacity of the specimens did not increase again after the local collapse of concrete.
Figure 6b–d show the load-displacement relationships of the specimens with different steel ratios. When the steel ratio is 3.63%, the ultimate bearing capacity was reached when the concrete was partially collapsed. When the steel ratio was 5.13% or 6.63%, the specimens with e/h = 0.2 reached the ultimate bearing capacity when the concrete was partially collapsed. However, the bearing capacity of the specimens with e/h = 0.6 continued to increase slightly after the local collapse of concrete. According to strain gauge data on the steel surface, the steel flange under compression and tension did not yield at this time. Thus, the effect of high-strength steel on bearing capacity was still visibly strengthening, as shown in Figure 6b,c.
Figure 6e,f shows the load-displacement relationships of the specimens with different stirrup spacing under the steel ratio of 6.63%. When e/h is equal to 0.2, the bearing capacity of specimen Q6S6E2V1 with stirrup spacing equal to 100 mm and Q6S6E2V5 with stirrup spacing equal to 50 mm both increased again after the local collapse of concrete. In the second ascent, the bearing capacity reached another peak. Note that the second peak of the bearing capacity (point B) of the specimen Q6S6E2V1 did not exceed the first peak, but the second peak of the bearing capacity of the specimen Q6S6E2V5 exceeded the first peak. When e/h = 0.6, the bearing capacity of specimens Q6S6E6V1 and Q6S6E6V5 both increased after concrete local crushing, and their second peaks of bearing capacity both exceeded their first peaks. The strain data show that the steel flange under compression yielded when the ultimate bearing capacity was reached, but the steel flange under tension did not yet yield for specimen Q6S6E6V1. In contrast, the compression and tensile steel flanges of the specimen Q6S6E2V1 both did not yield. However, both sides of the steel yielded when the first peak of the bearing capacity was reached. Thus, the contribution of steel was maximized for the specimen Q6S6E6V5.
In general, the second peak of bearing capacity appeared when specimens with high-strength steel were at a high steel ratio. In addition, the bearing capacity of the specimens with e/h = 0.6 is more likely to increase again. In addition, the shorter stirrup spacing is beneficial to maximize the contribution of high-strength steel.

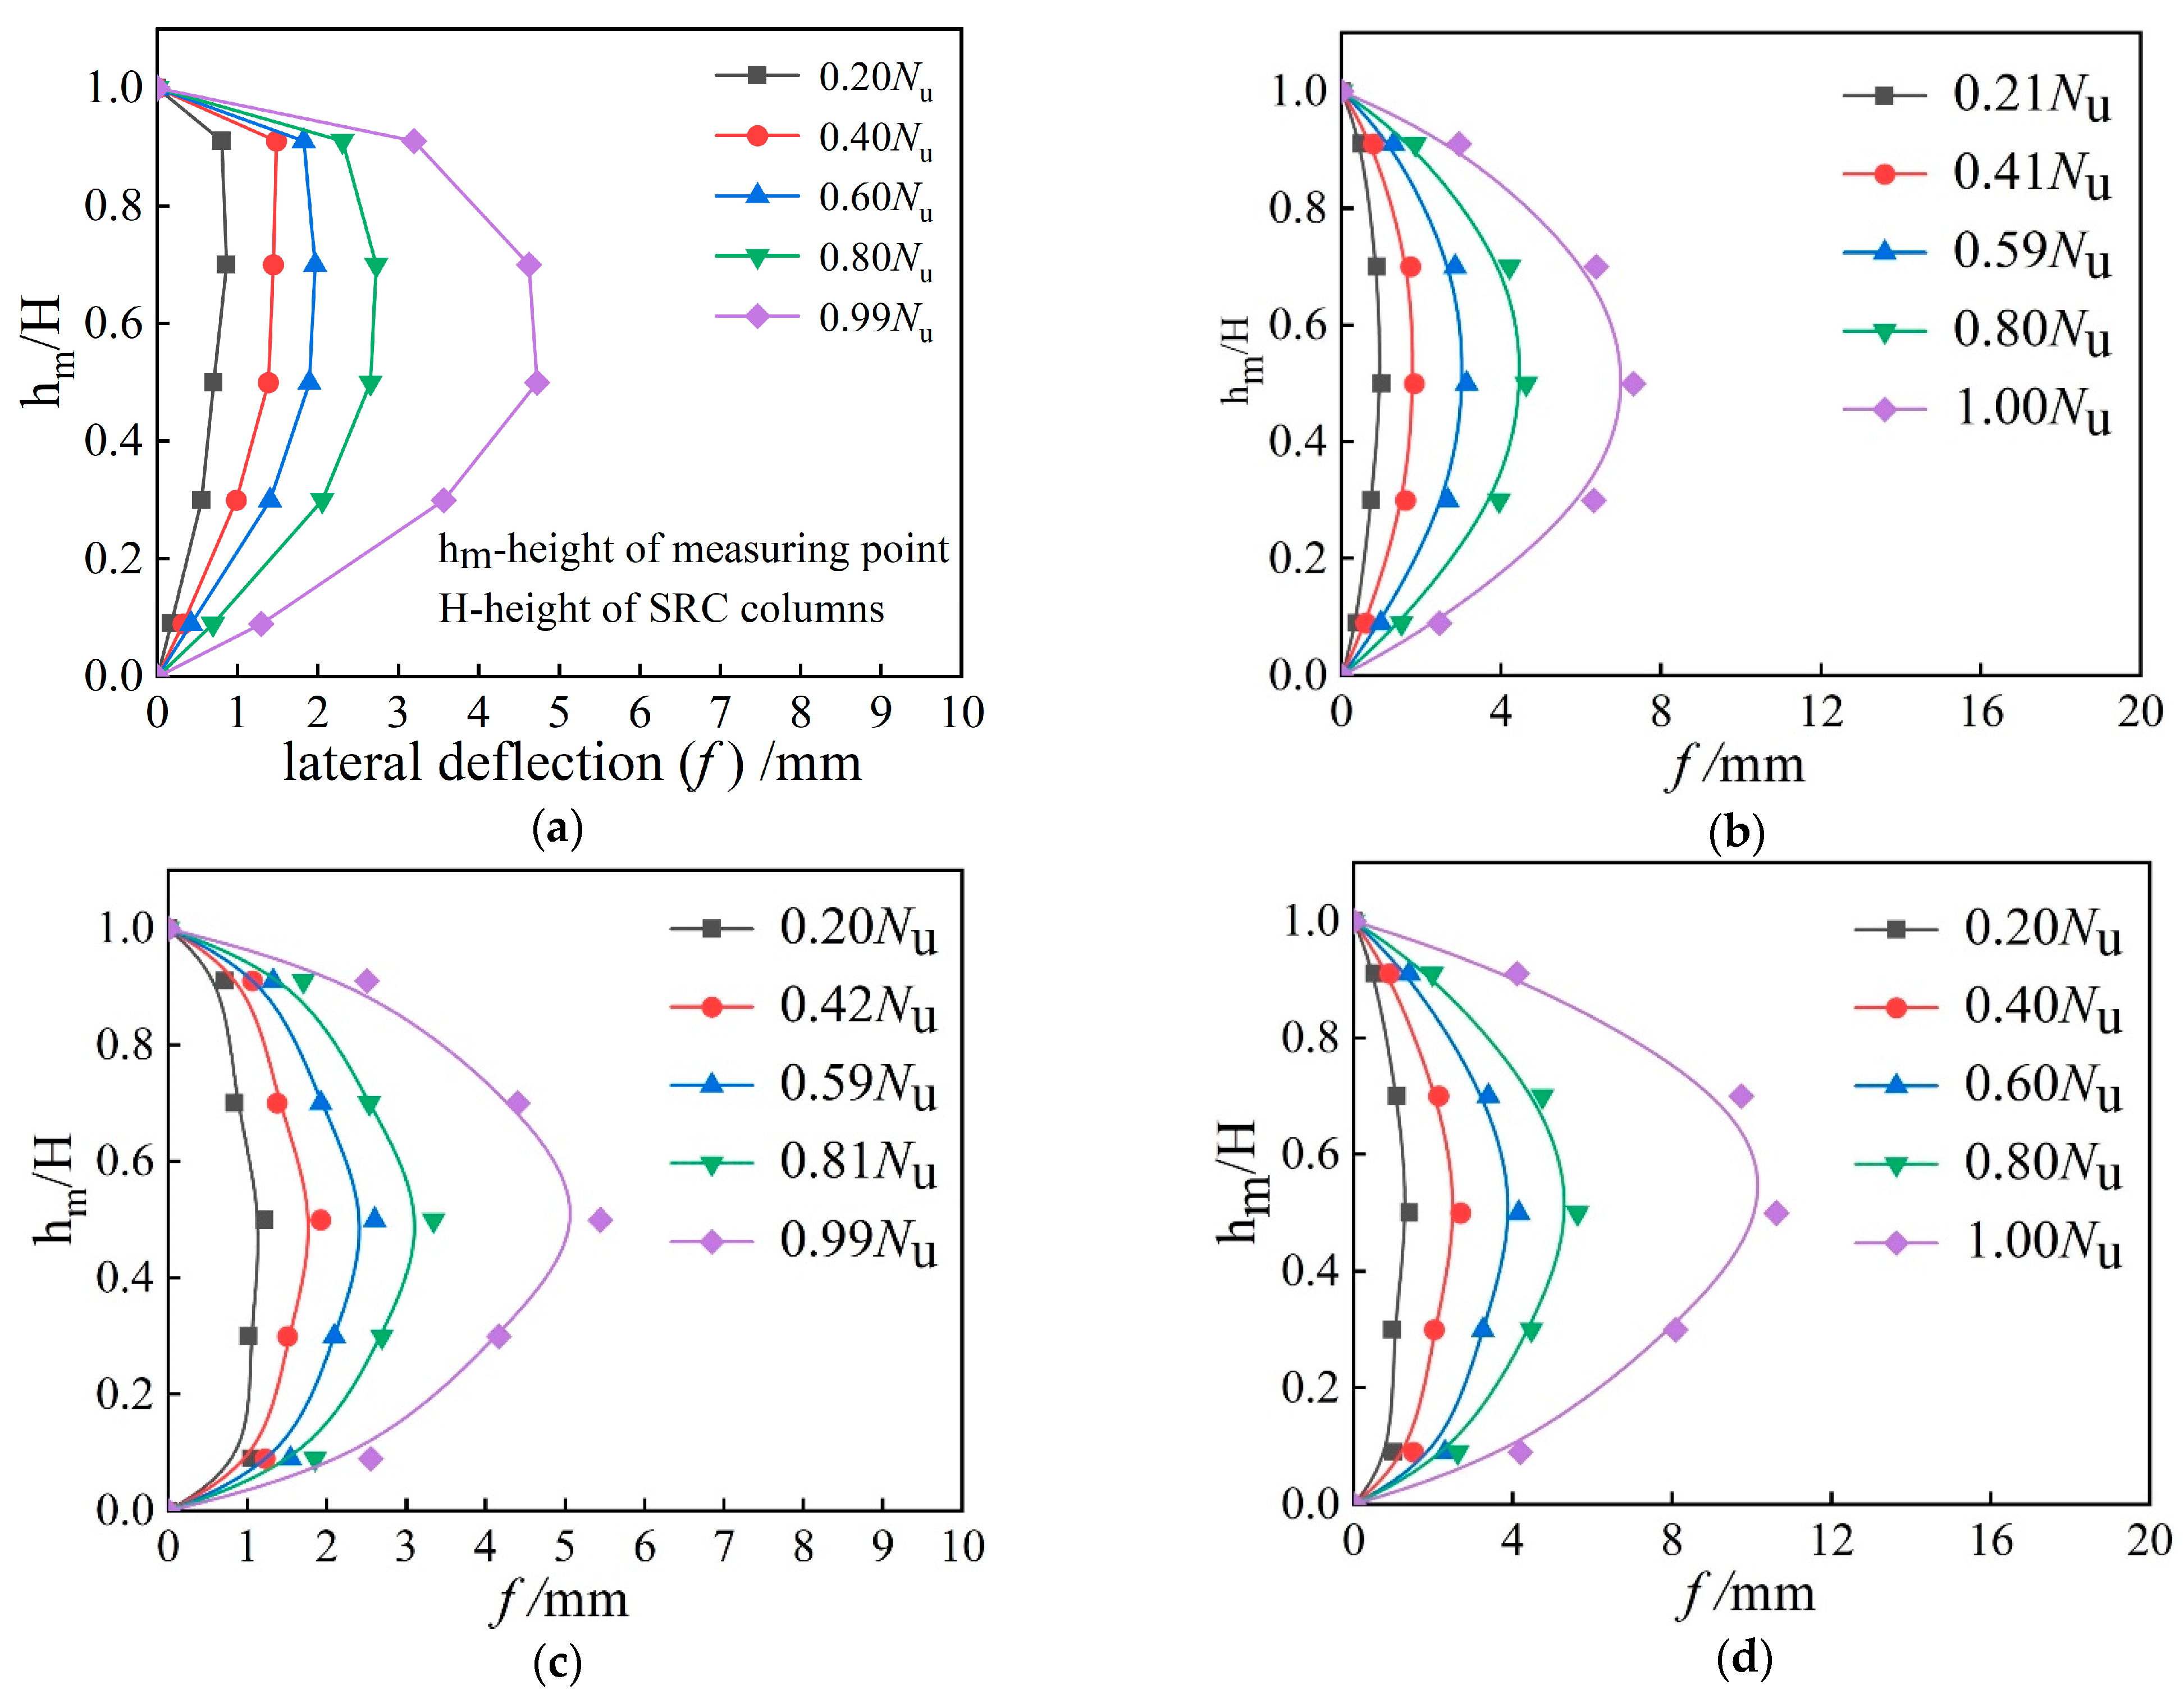
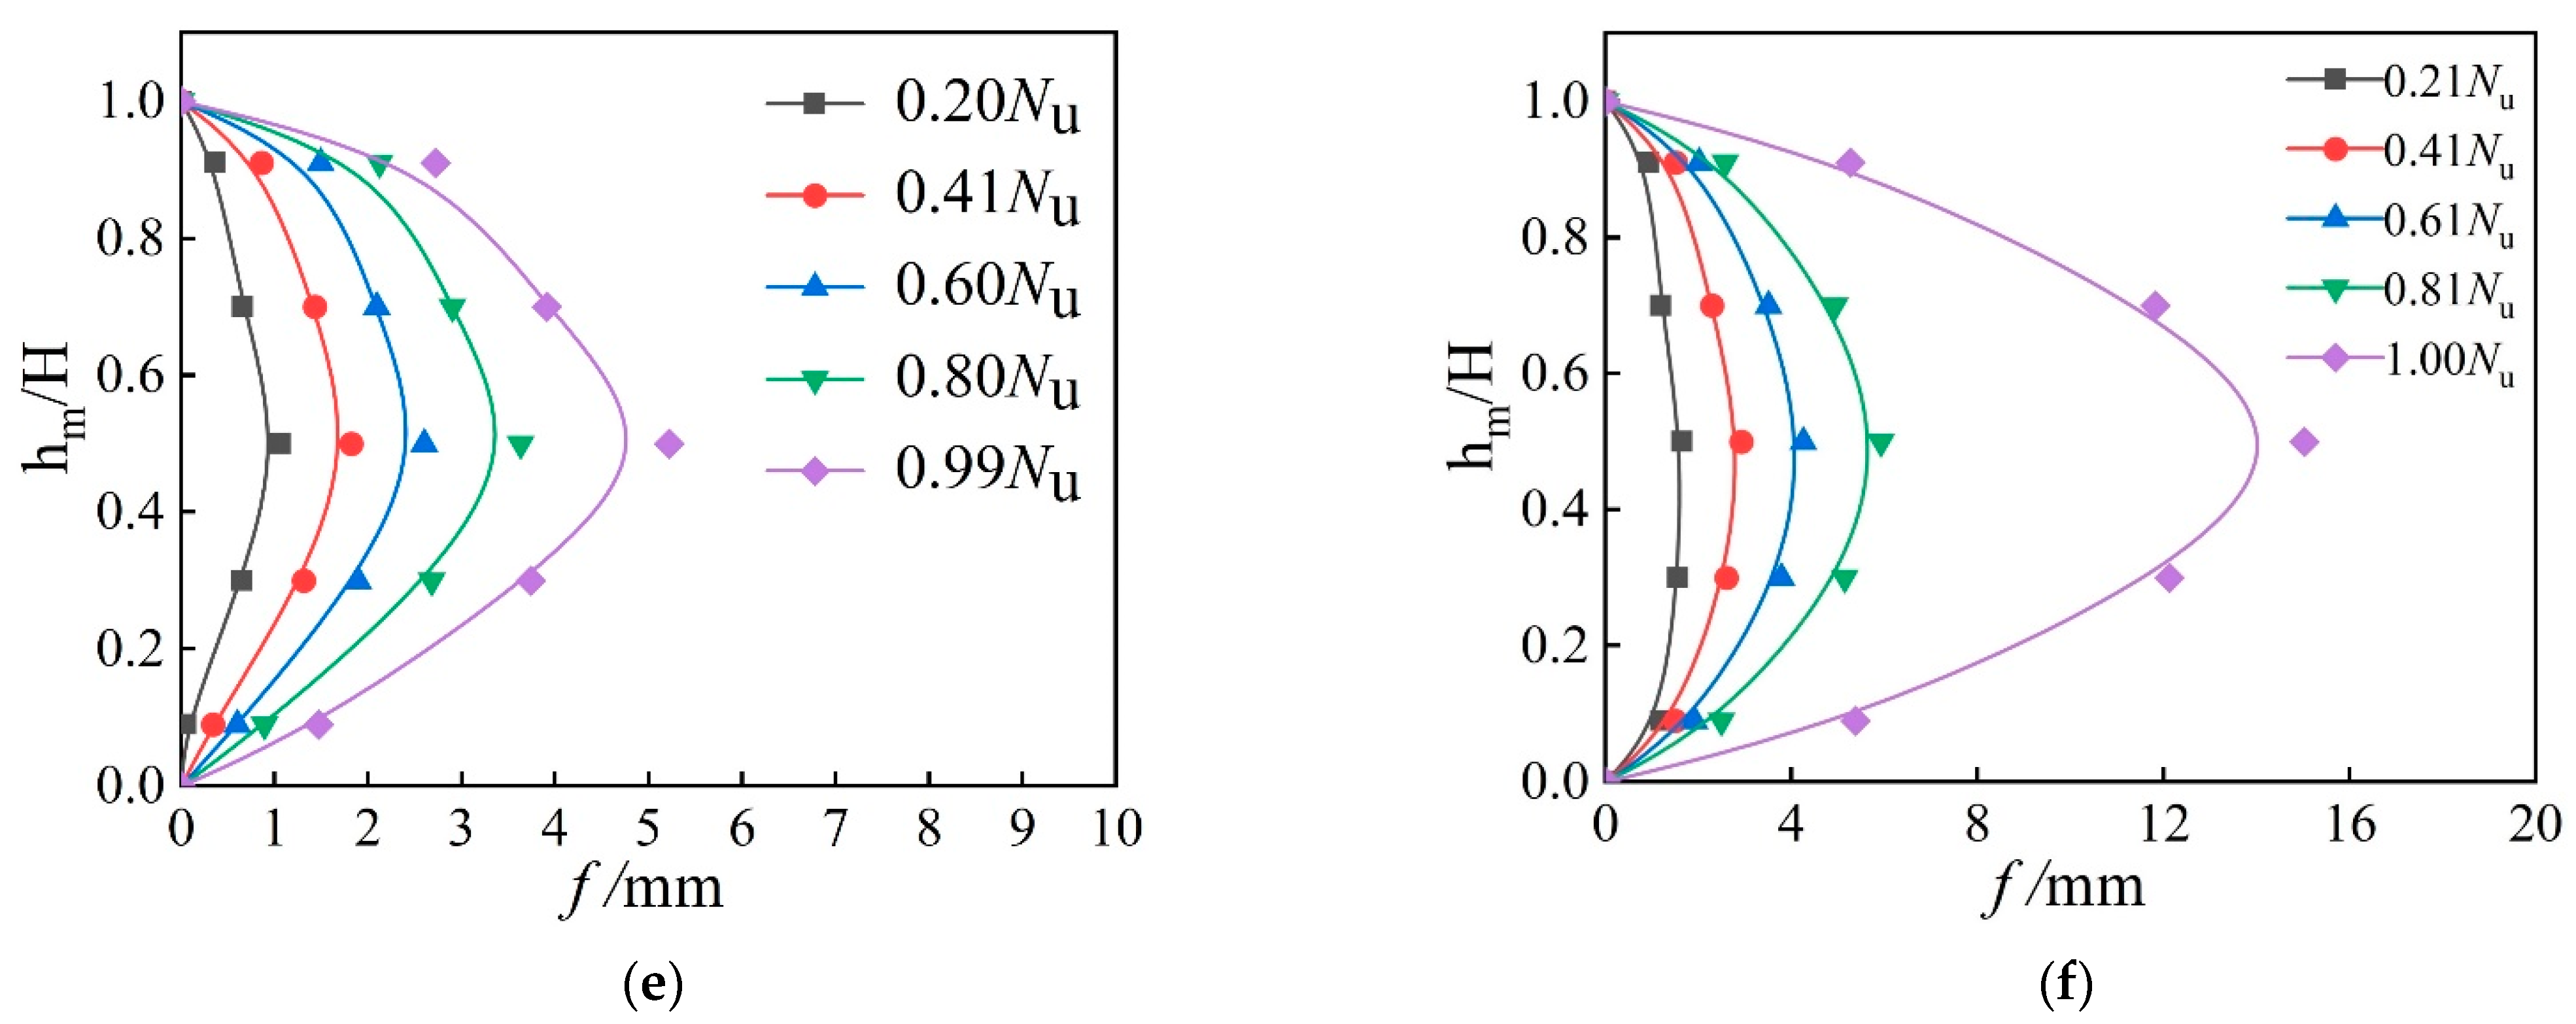
3.3. Load-Deflection Curve at Mid Height Section

Figure 7 shows the load-lateral deflection curve for specimens with different steel. At the early loading stage of loading, the deflection at the mid height section of the specimen increased slowly. When the load reached 80% of the ultimate load, the deflection of the mid height section increased remarkably. When the relative eccentricity was 0.6, the lateral deflection of the specimens with Q235 steel increased to 158.2% of that of the specimens with 80% of the ultimate load. In addition, the specimens with Q460 and Q690 steel increased to 189.5% and 254.0%, respectively. When the relative eccentricity was 0.2, the deflection under the ultimate load at the mid height of the specimens increased with the increase of the steel strength. In addition, the lateral deflection of the specimens with Q235, Q460, and Q690 steel increased, respectively, to 162.2%, 163.1%, and 144.7% of that of the specimens with 80% of the ultimate load.

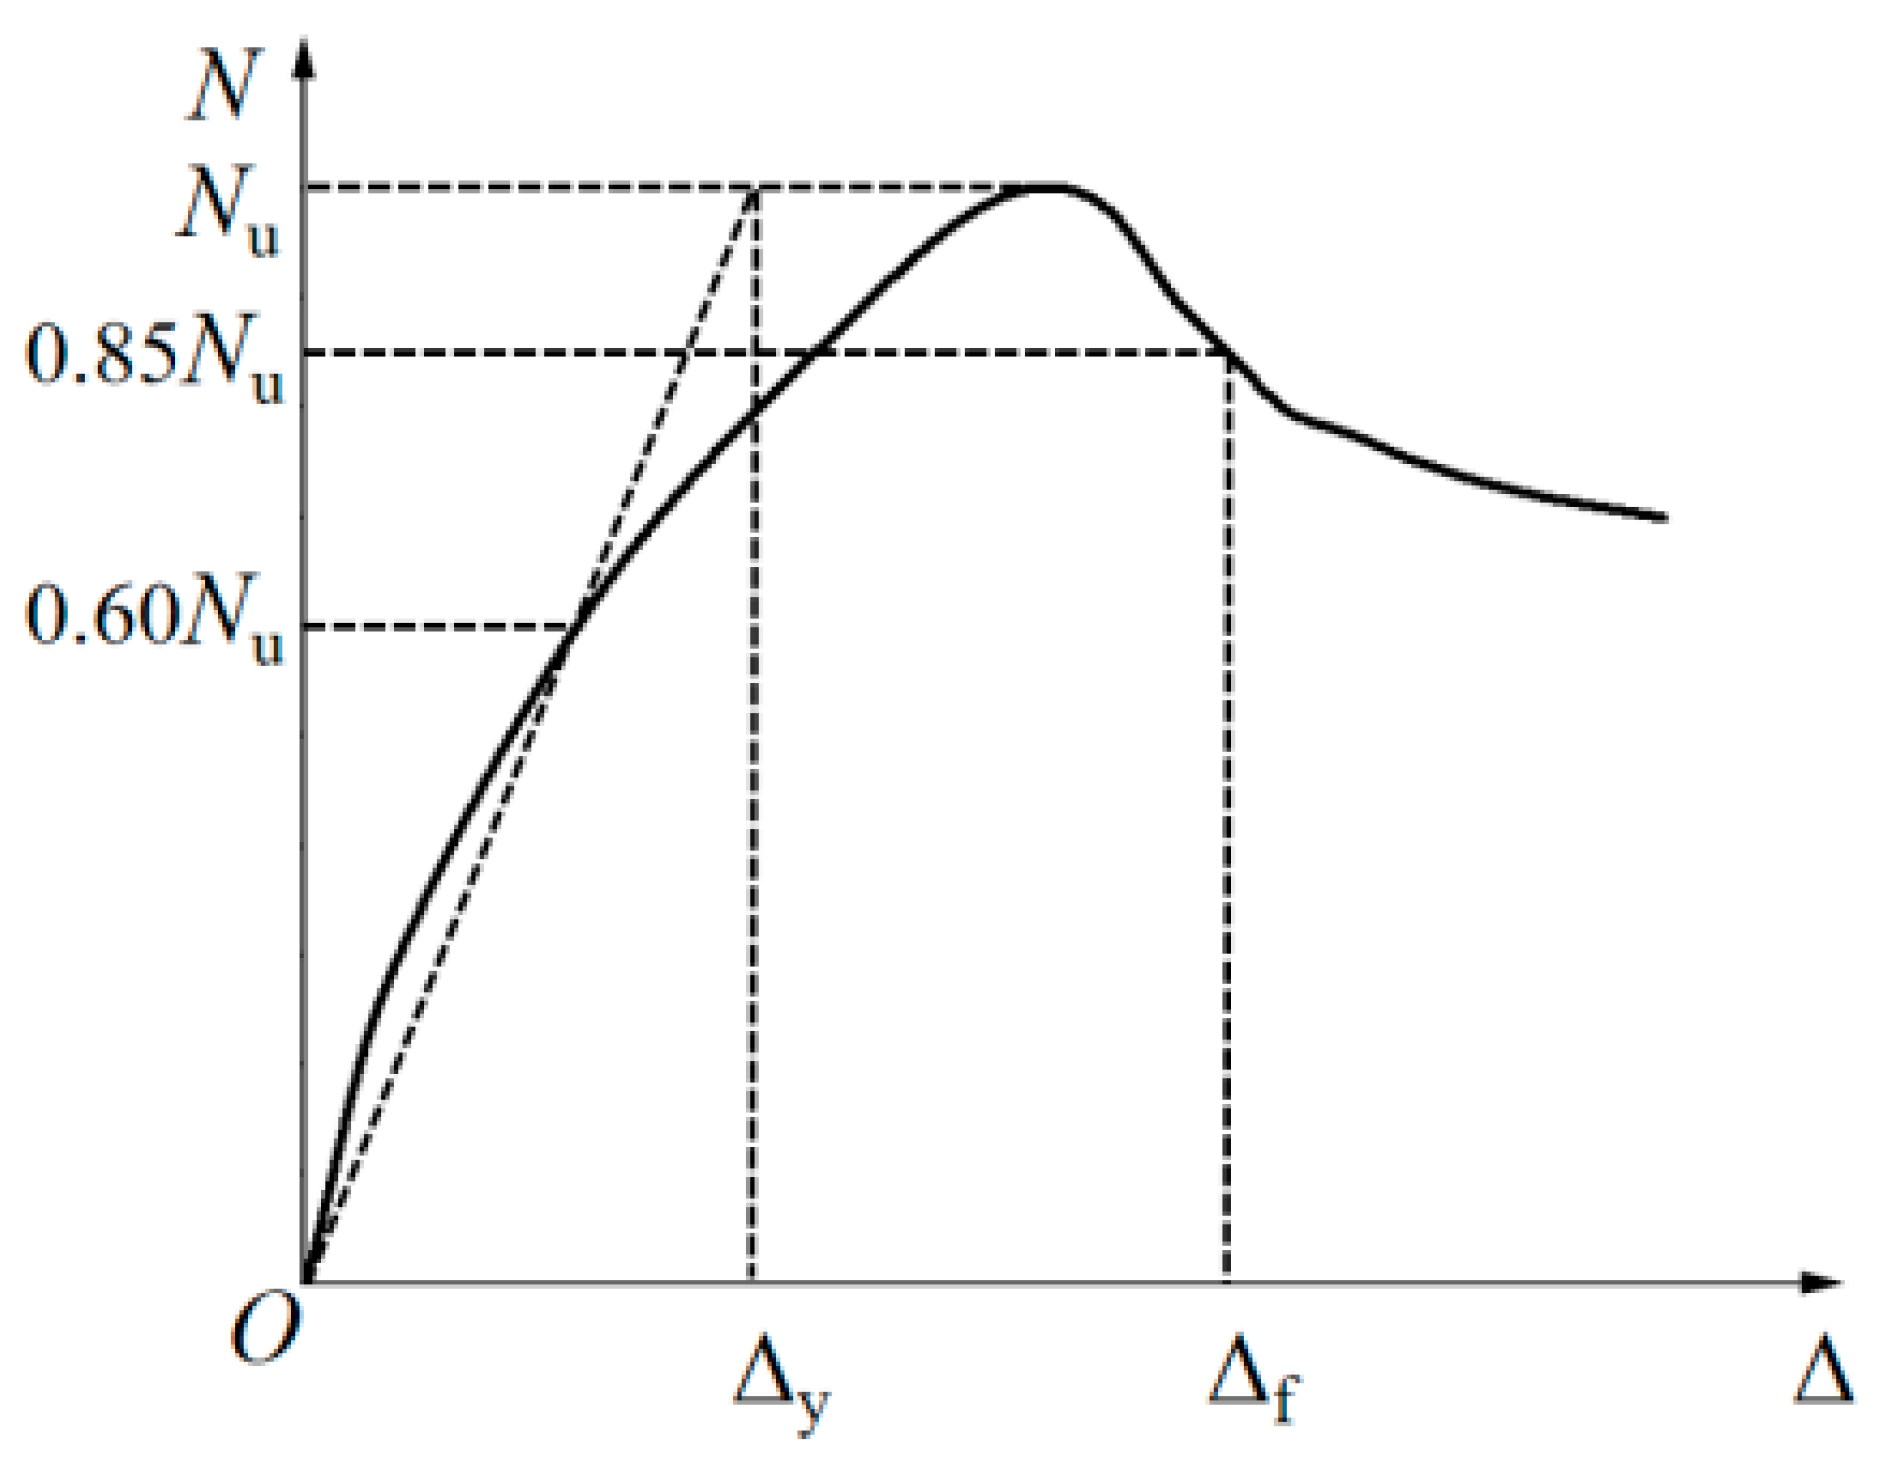
3.4. Analysis of the Bearing Capacity and Ductility

The test results of the bearing capacity and displacement of the specimens are provided in Table 4. According to the study of Chen and Huang [23], the displacement ductility factor μ is defined as μ= Δ f / Δ y , in which Δ f is the corresponding displacement when the bearing capacity of the specimen decreases to 0.85 N u ( N u is the ultimate bearing capacity), and Δ y is the nominal yield displacement of the specimen, as shown in Figure 8.

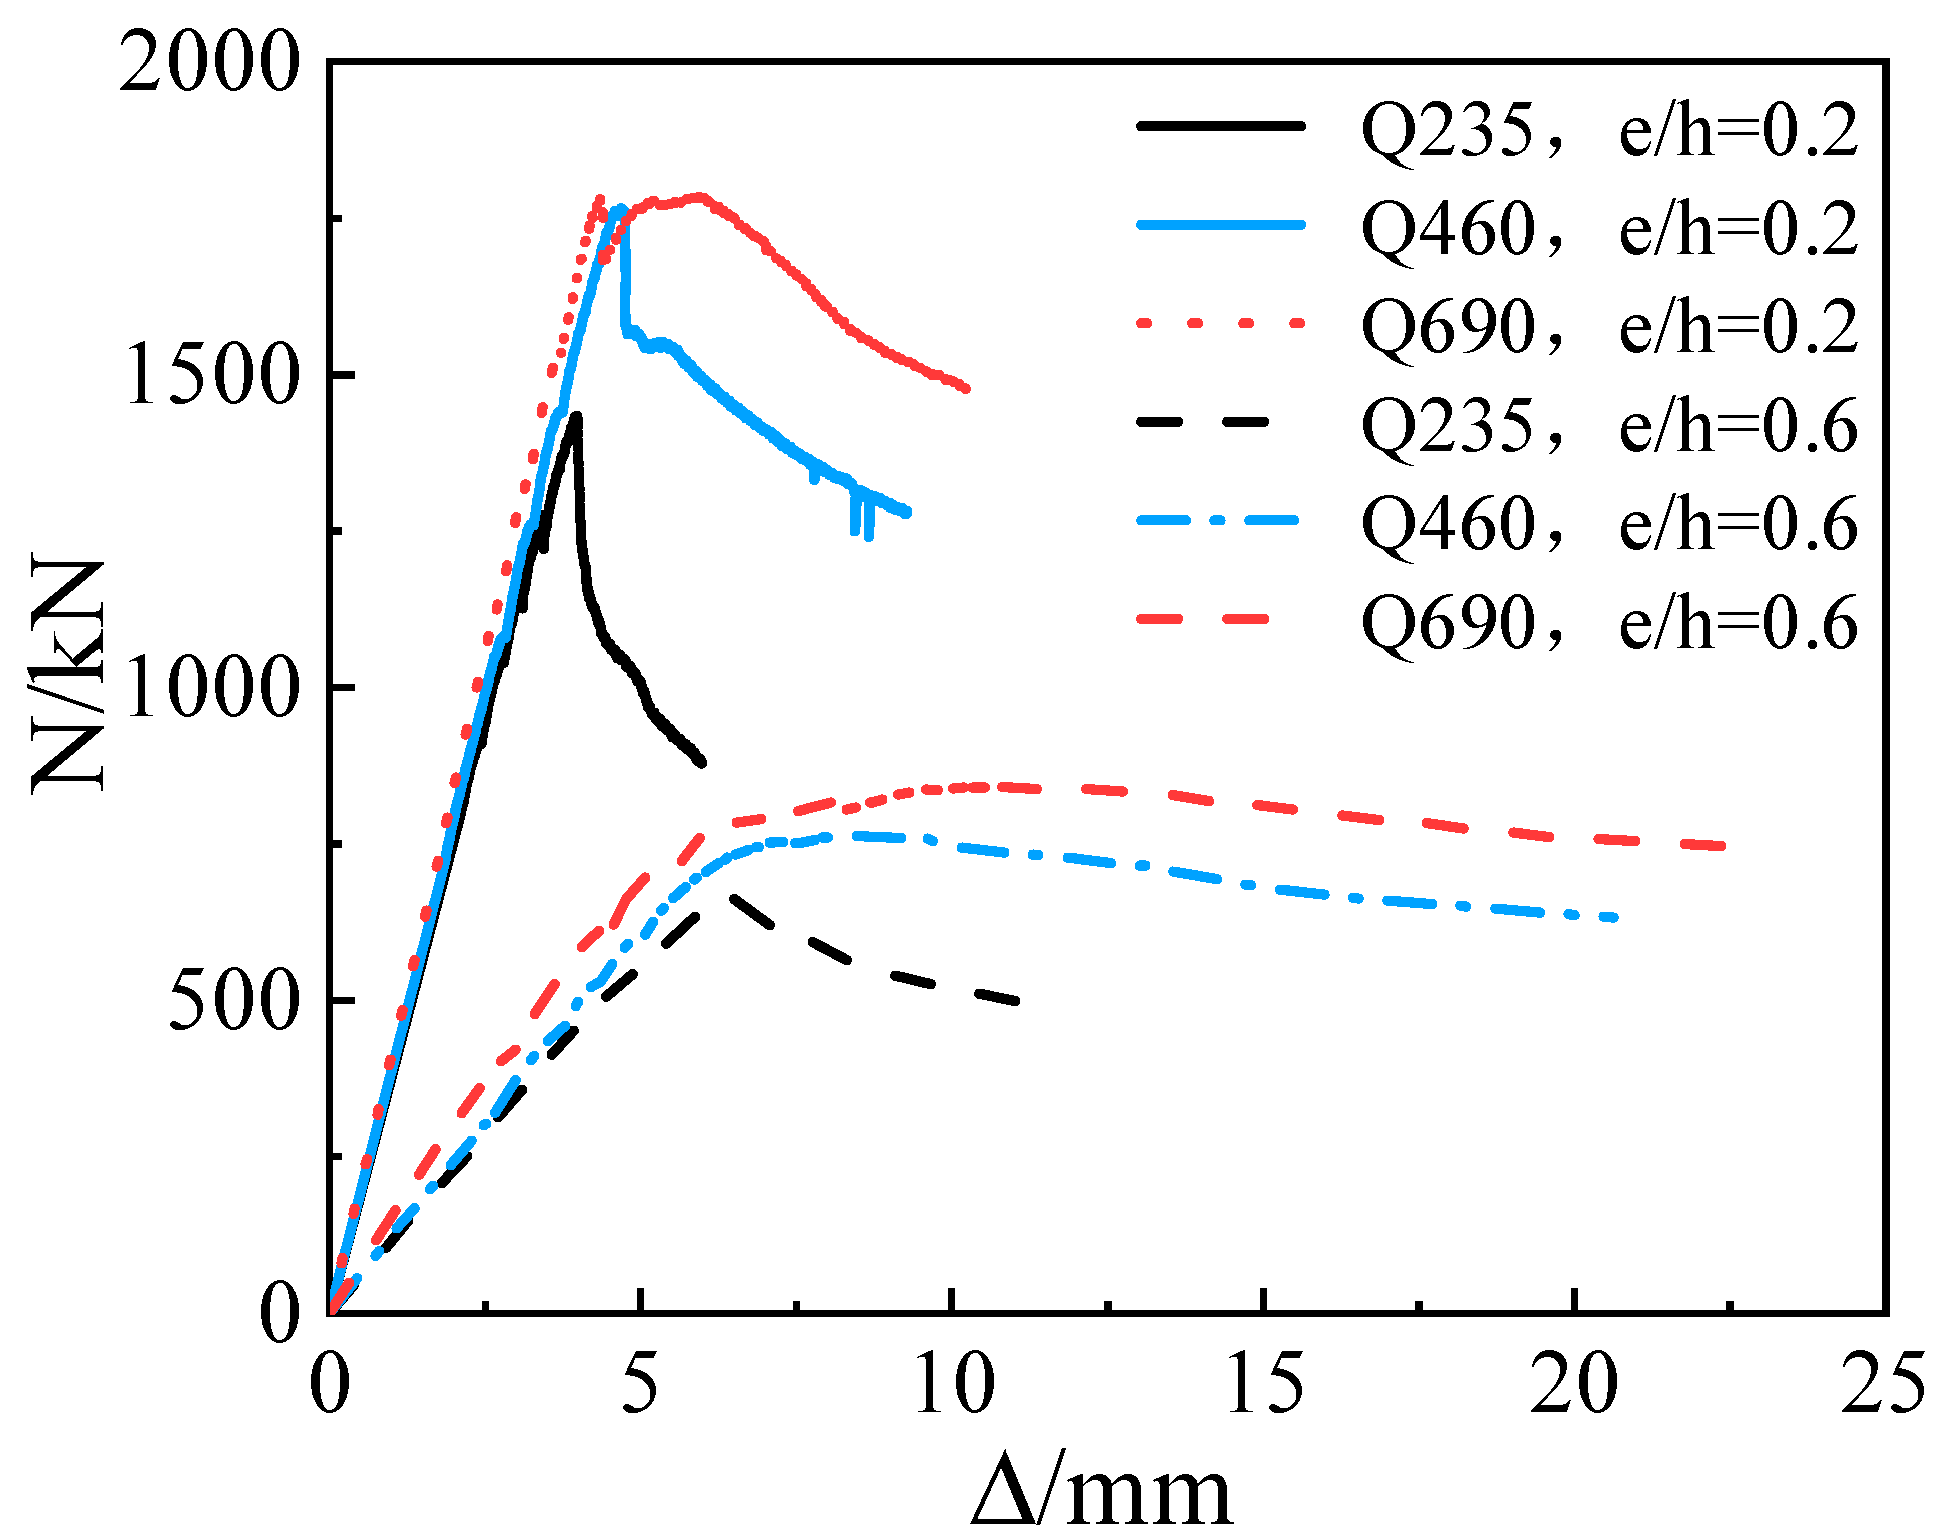
3.4.1. Influence of Steel Strength on Bearing Capacity and Ductility

Figure 9 shows the load-displacement curves of the specimens with different steel strength. For the specimens with the steel ratio equal to 6.63%, when the steel grade increased from Q235 to Q460 and from Q235 to Q690, the ultimate bearing capacity of the specimens with e/h = 0.2 increased by 22.9% and 24.8%, respectively. The ultimate bearing capacity of the specimens with e/h = 0.6 increased by 14.3% and 26.6%, respectively. Figure 9 also shows that the ultimate bearing capacity of the specimens increased with the increase of steel strength. Nevertheless, when e/h was equal to 0.2, the ultimate bearing capacity of Q6S6E2V1 did not increase obviously, as compared with Q4S6E2V1, because the compressive steel flange and the tensile steel flange of Q460 steel did not yield. Note that the contribution of Q690 steel was not maximized, which led to the slight increase of the ultimate bearing capacity.
In Table 4, it can be seen that the displacement ductility factor increased obviously with the increase of the steel strength. For the specimens with e/h = 0.2, when the steel grade increased from Q235 to Q460 and from Q235 to Q690, the displacement ductility factor increased by 18.2% and 90.9%, respectively. For specimens with e/h = 0.6, the displacement ductility factor increased by 114.3% and 242.9%, respectively.

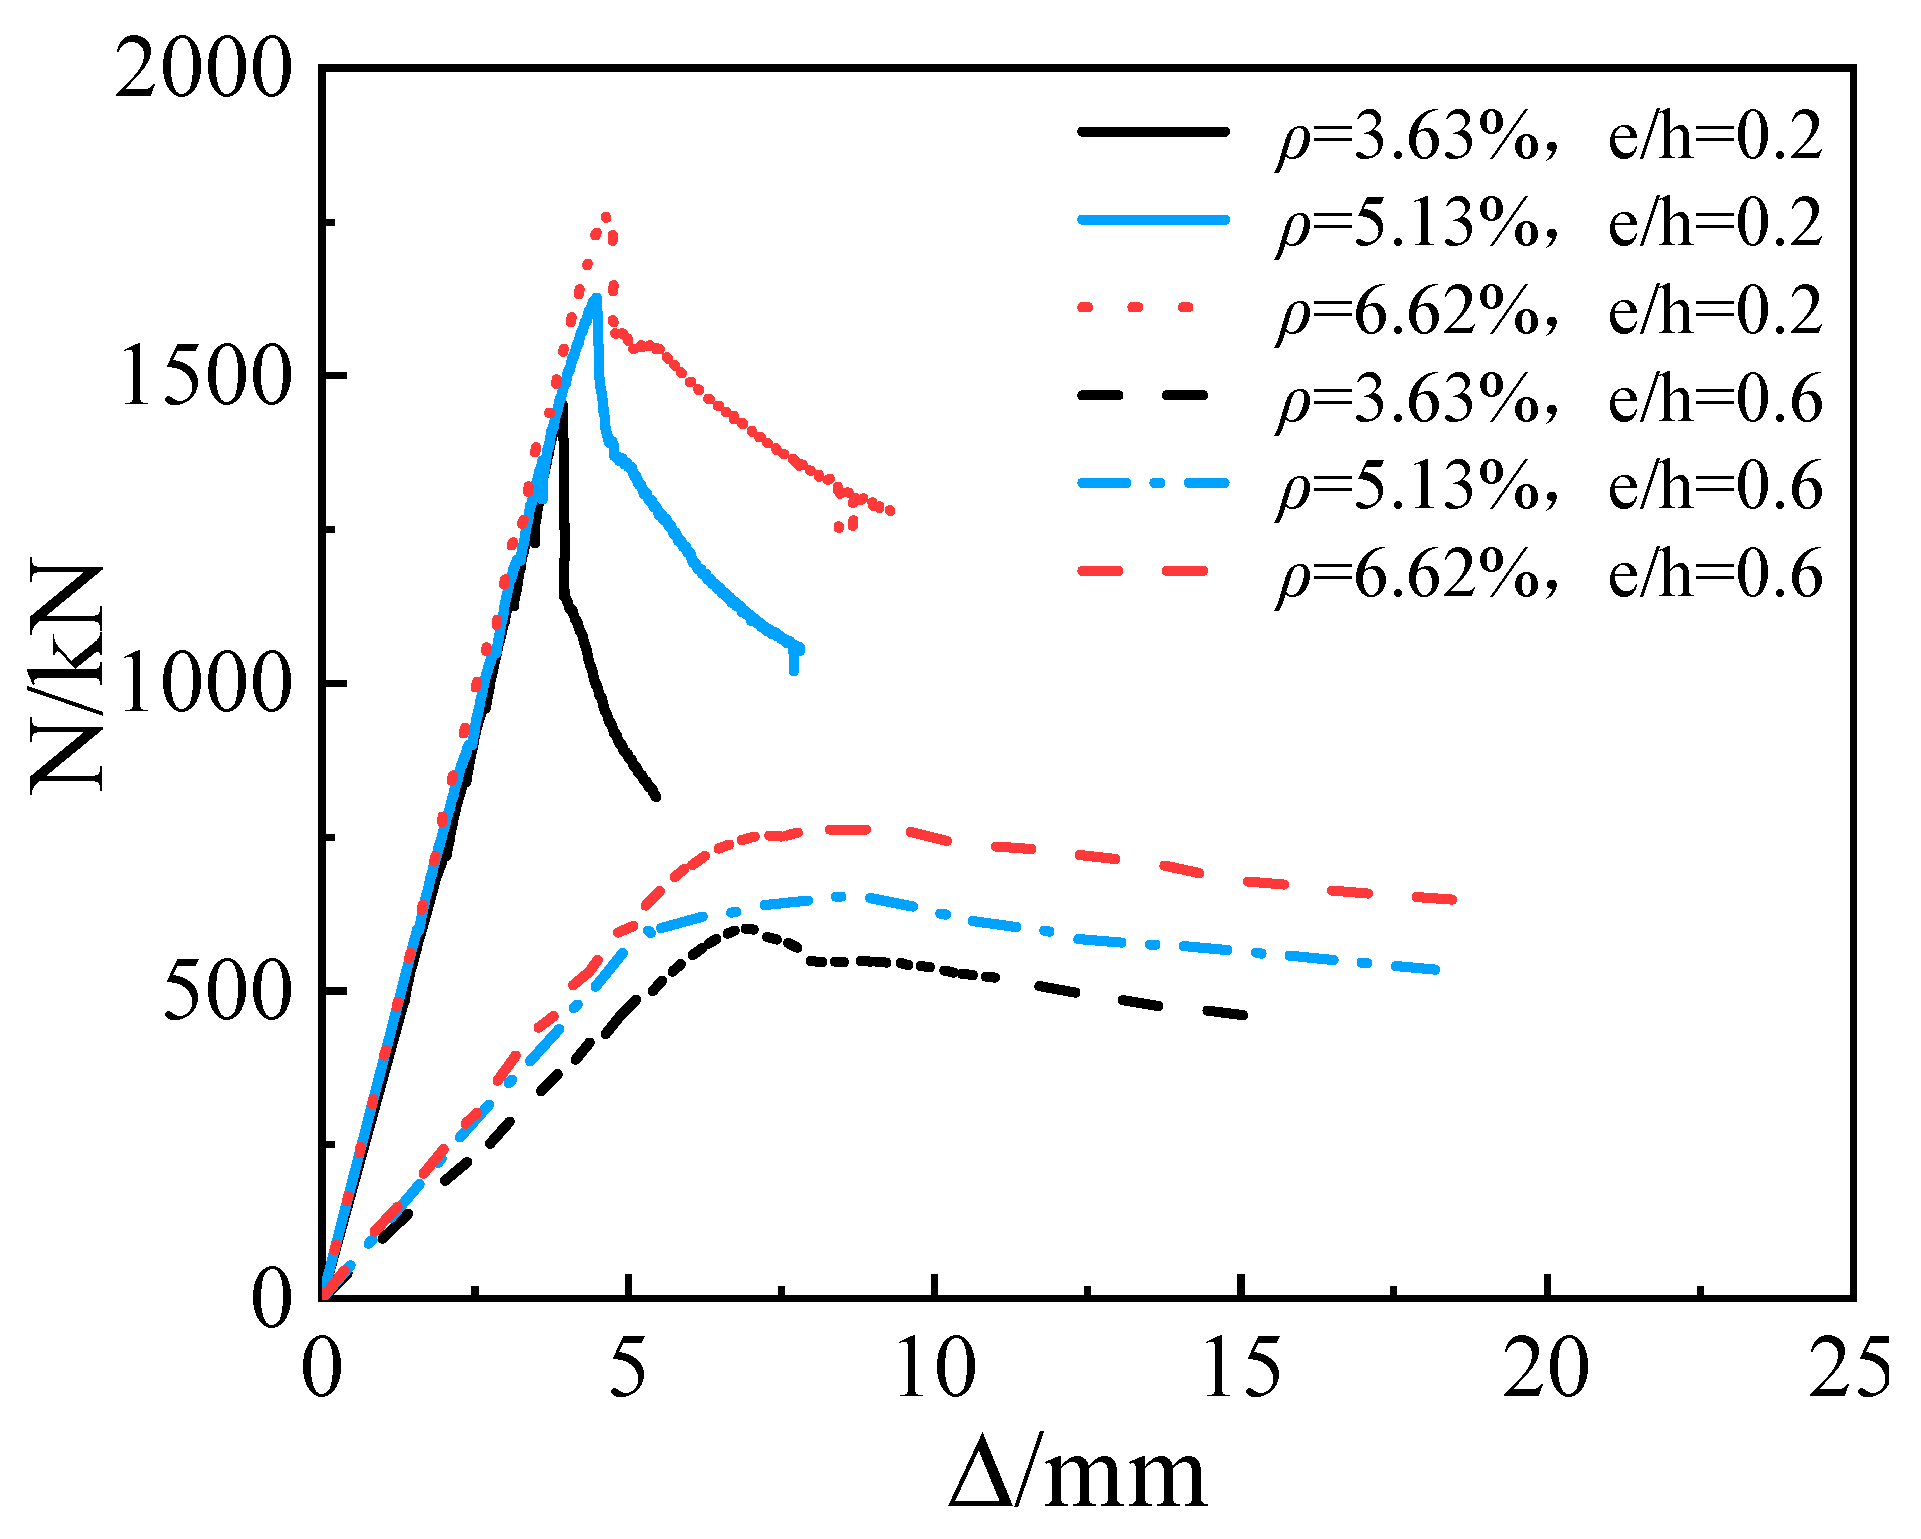
3.4.2. Influence of Steel Ratio on Bearing Capacity and Ductility

Figure 10 shows the load-displacement curves of Q460 SRC columns with different steel ratios. For the specimens with e/h = 0.2, when the steel ratio increased from 3.63% to 5.13% and 6.63%, the ultimate bearing capacity increased by 12.1% and 21.3%, and the displacement ductility factor increased by 10.0% and 30.0%, respectively. For the specimens with e/h = 0.6, when the steel ratio increased from 3.63% to 5.13% and 6.63%, the ultimate bearing capacity increases by 8.5% and 26.2%, and the displacement ductility factor increased by 55.6% and 66.7%, respectively. Therefore, the ultimate bearing capacity and displacement ductility factor of SRC columns can be effectively increased by increasing the steel ratio.

3.4.3. Influence of Relative Eccentricity on Bearing Capacity and Ductility

Figure 11 shows the load-displacement curve of the specimens at different relative eccentricity. When the relative eccentricity changed from 0.2 to 0.6, the ultimate bearing capacity of the specimens decreased remarkably. With either Q460 or Q690, the ultimate bearing capacity of the specimens with e/h = 0.6 is only 40–50% of that of the specimens with e/h = 0.2. In Table 3, it can be observed that the displacement ductility factor of the specimens with e/h = 0.6 can increased by 25–155% compared with the specimens with e/h = 0.2.

3.4.4. Influence of Stirrup Spacing on Bearing Capacity and Ductility

As shown in Table 4, it can be concluded that the bearing capacity and ductility of Q690 SRC columns can be improved by reducing the stirrup spacing. When the stirrup spacing increased from 100 mm to 50 mm, the bearing capacity and displacement ductility factor of the specimens with e/h = 0.2 increased by 3.9% and 28.6%, respectively. In addition, the ultimate bearing capacity and displacement ductility factor of the specimens with e/h = 0.6 increased by 10.6% and 14.6%, respectively. The load-displacement curves of the specimens with different stirrup spacing are shown in Figure 12.

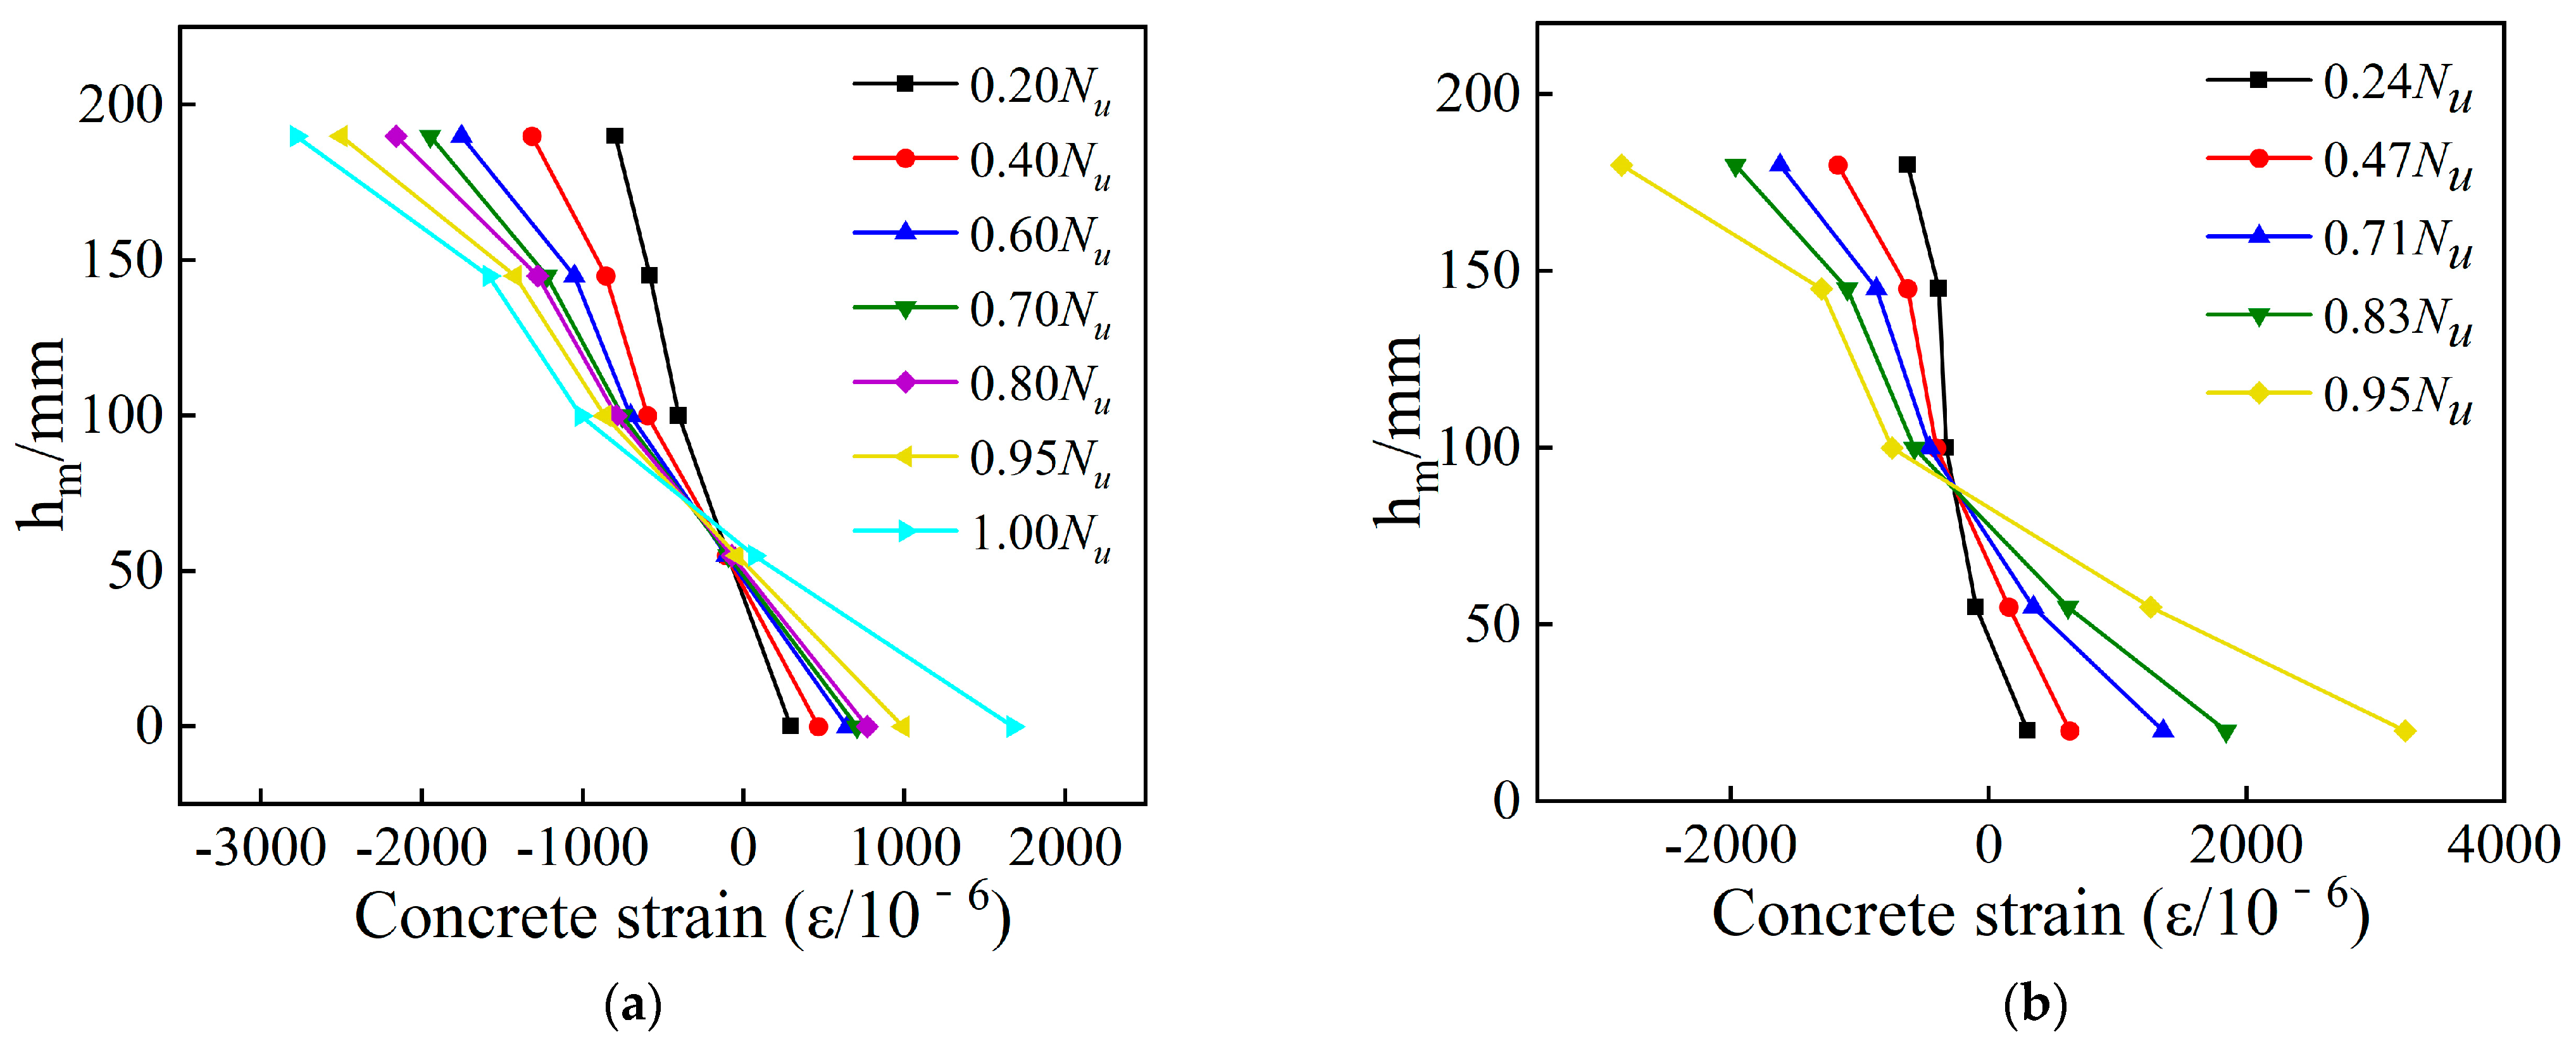
3.5. Concrete Cross-Sectional Strain Distribution

Figure 13 shows the concrete strain distribution along the height of a high strength SRC column. It can be observed that the concrete strain varies almost linearly along the column height, which is basically consistent with the plane section assumption. In addition, the neutral axis of the specimen with e/h = 0.6 moved to the compression side continuously with increasing load, and the neutral axis position of the specimens with e/h = 0.2 did not change significantly.

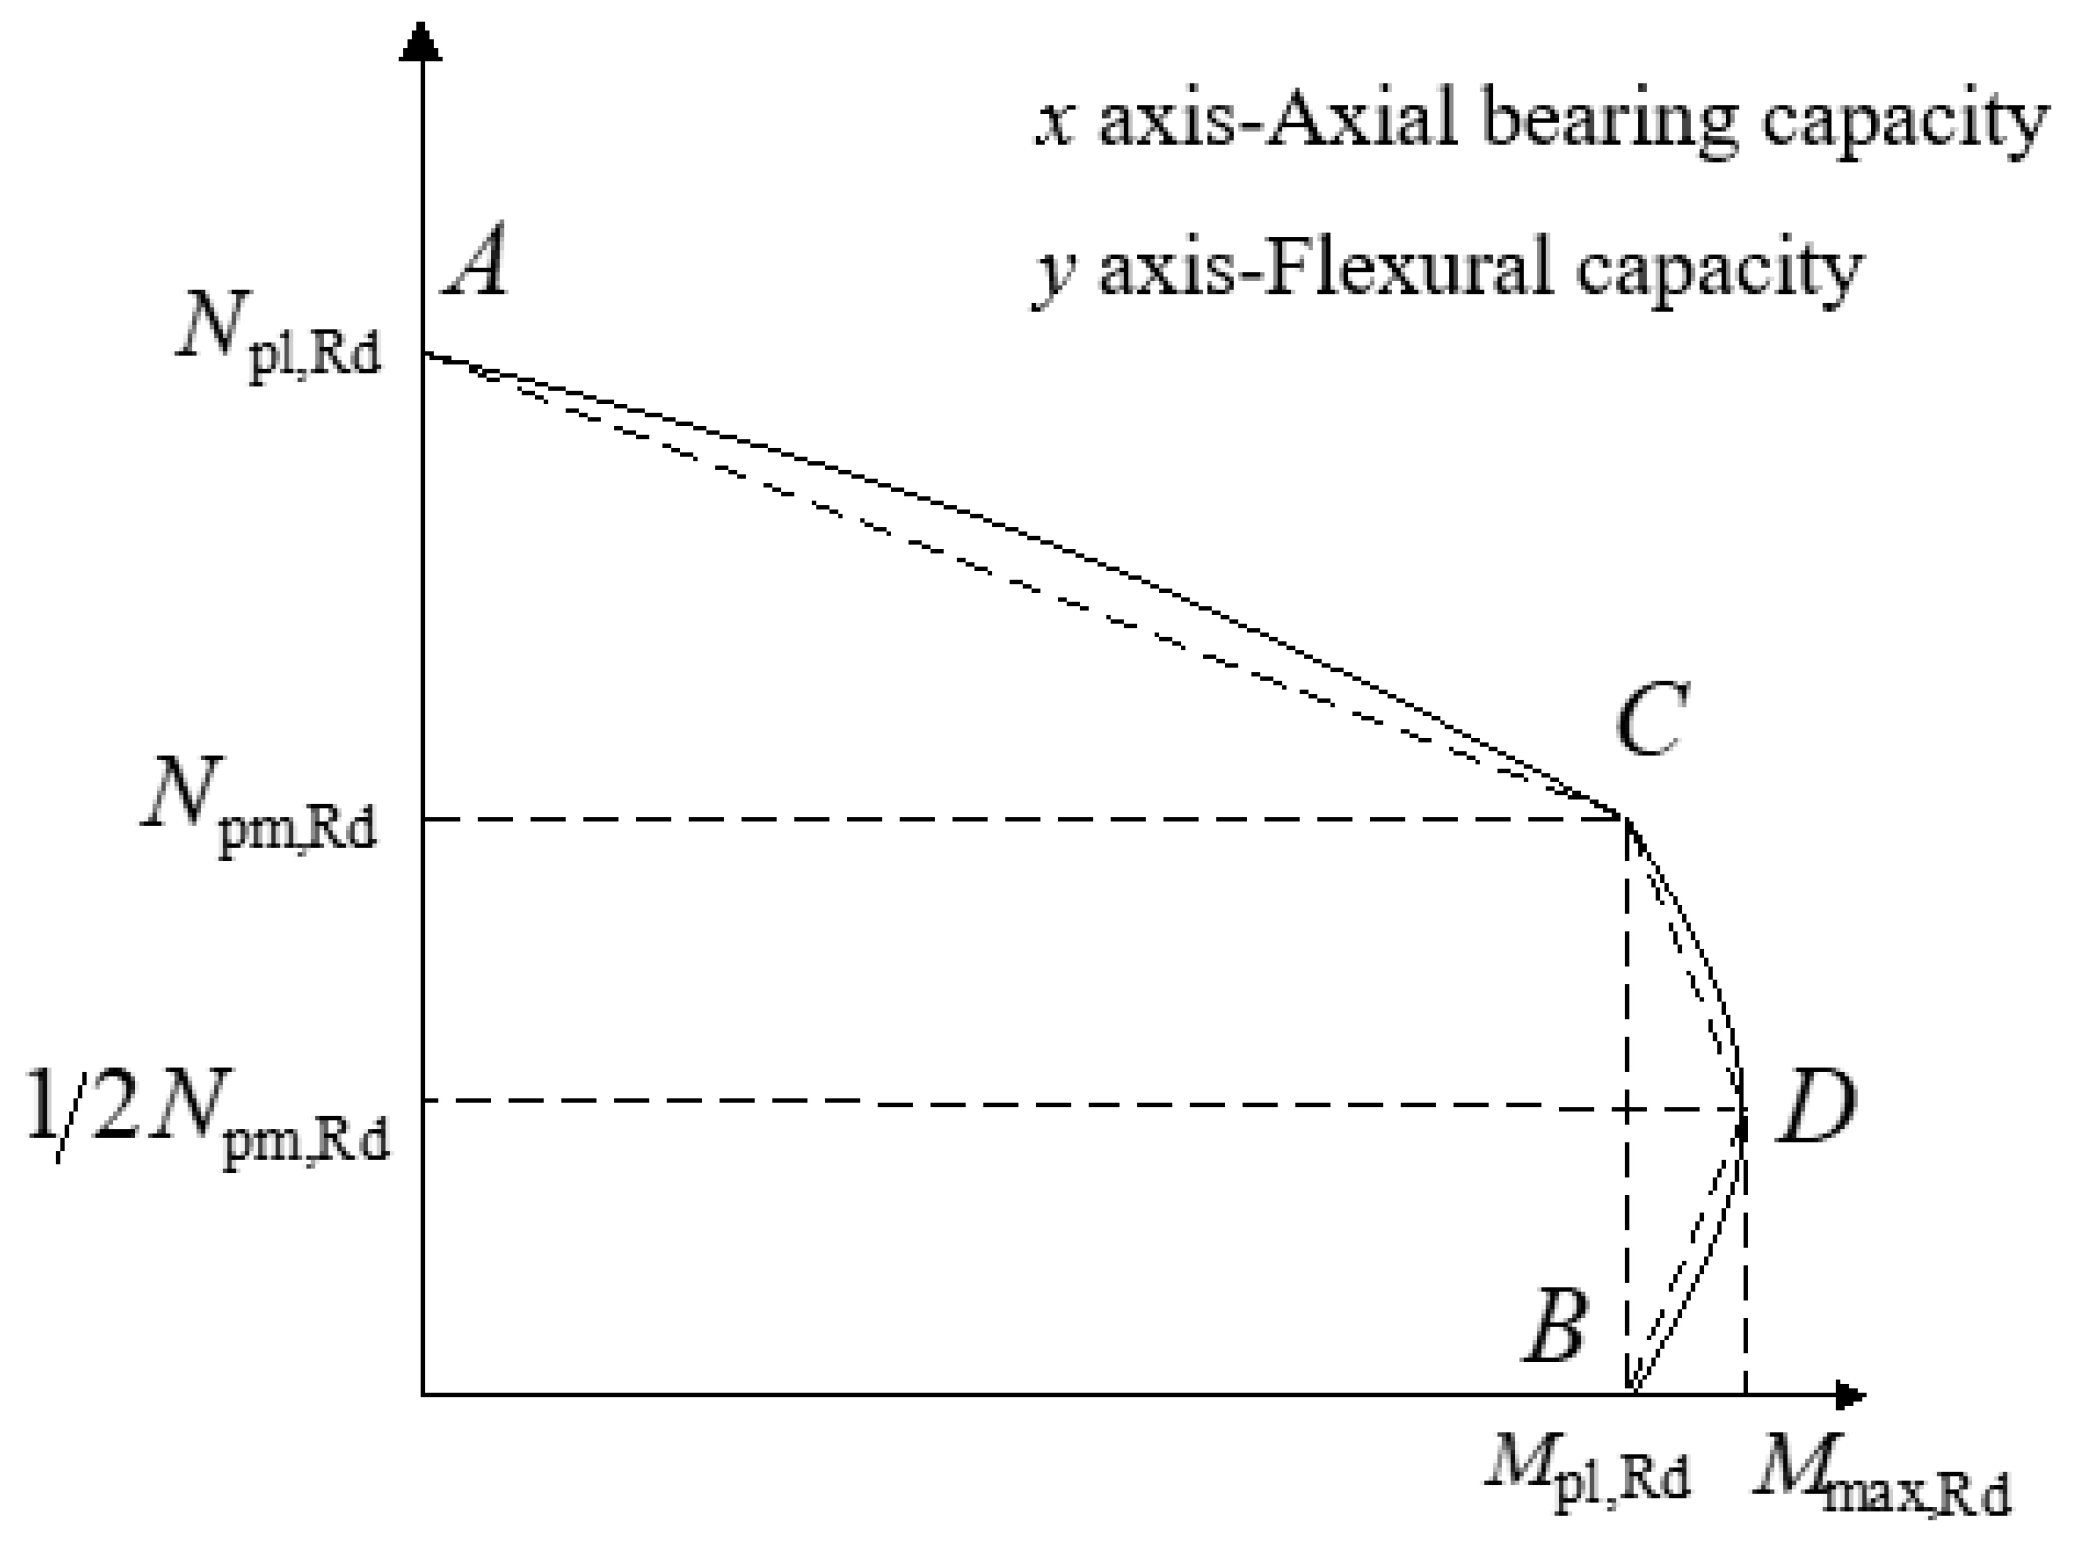
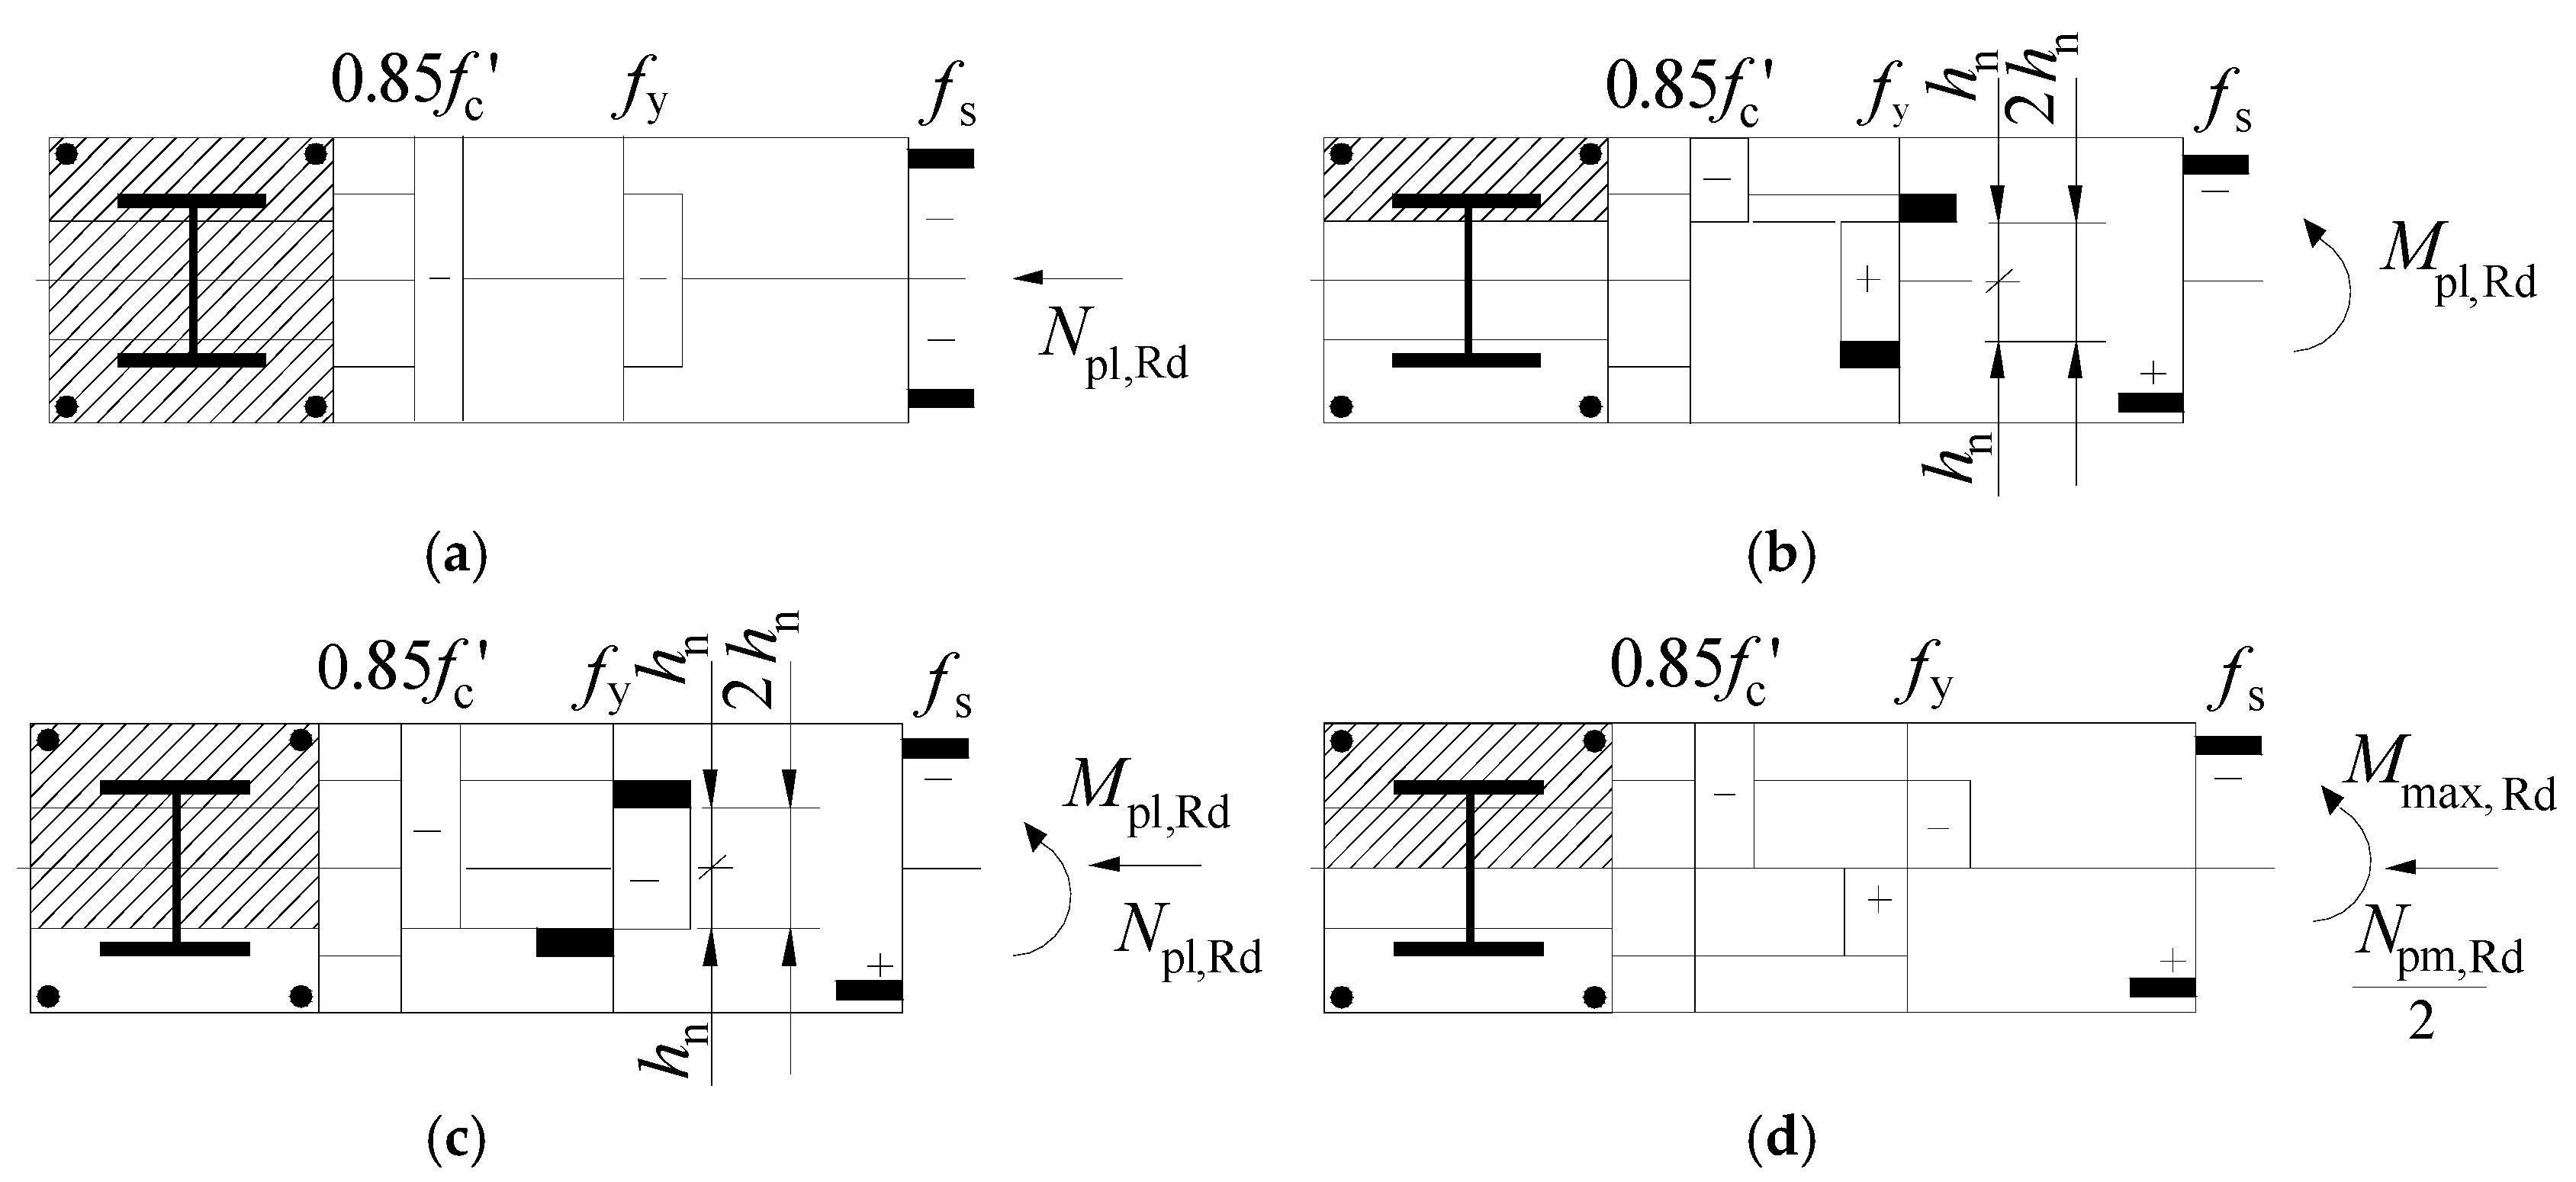
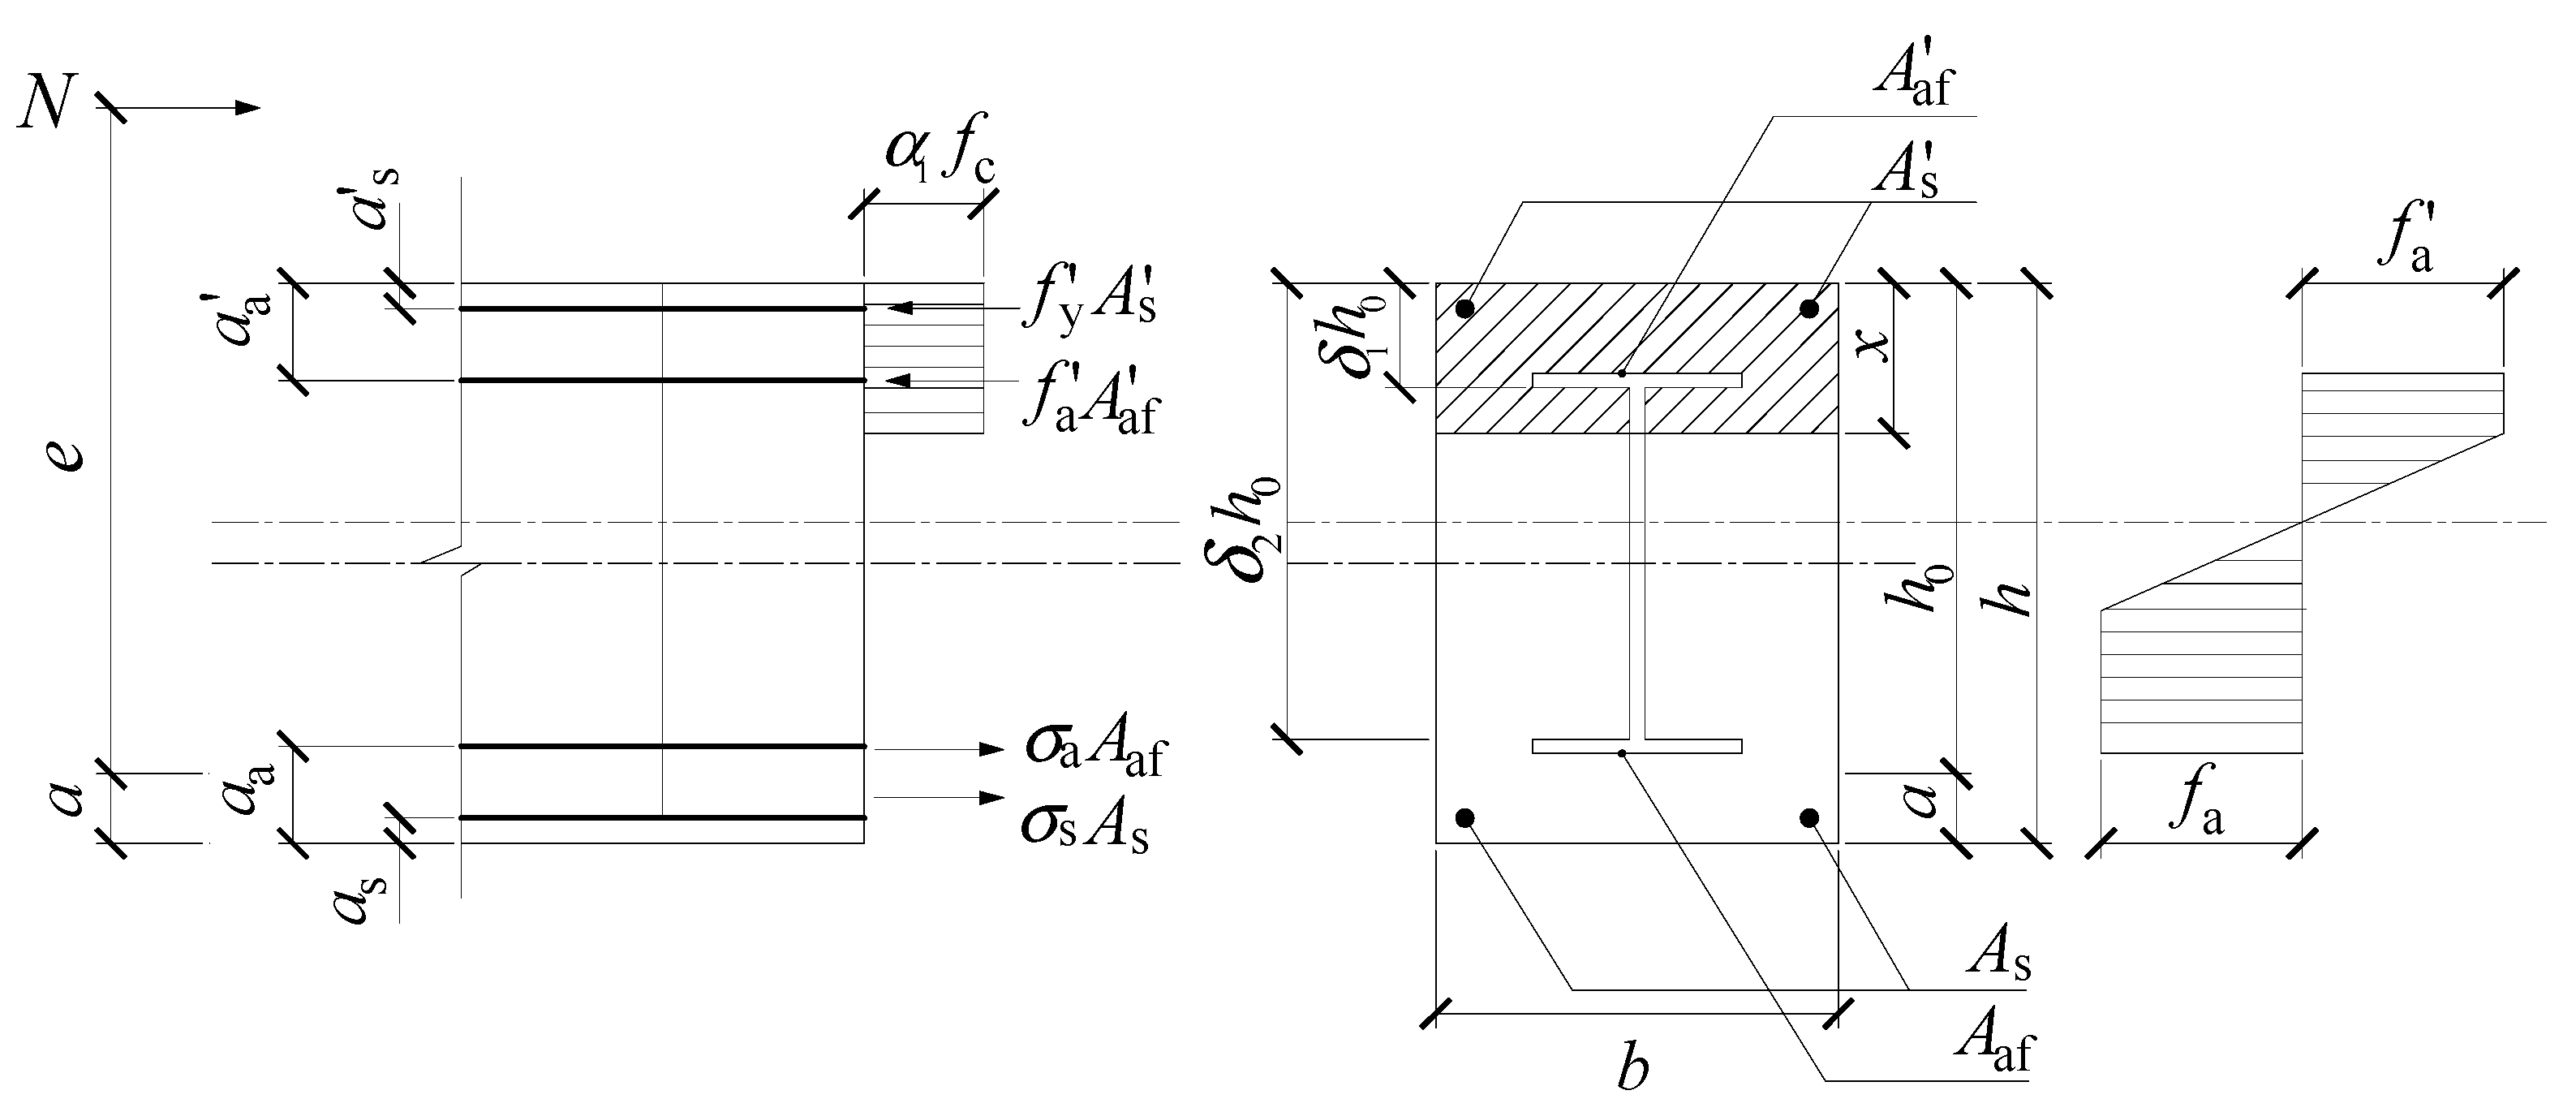
4. Comparison and Analysis of Test and Calculated Results

Section 3.3 of Eurocode 4-2004 and section I1-3 of AISC360-16 stipulate that the steel yield strength in SRC composite structures should not exceed 460 and 525 MPa, respectively. Section 3.1.6 of JGJ138-2016 stipulates that the steel grade of SRC composite structures should not exceed Q420. Note that the present paper uses the codes mentioned above to calculate the bearing capacity of specimens to investigate their applicability to high-strength SRC columns.
Eurocode 4-2004 defines the failure principle of SRC columns with a simplified M-N interaction curve, as shown in Figure 14. The points A, B, C, and D are the characteristic points of the curve under different load. The stress distribution of the characteristic points in the M–N interaction curve is shown in Figure 15.
Where N p l , R d is the maximum bearing capacity of SRC column only under axial load; N p m , R d stands for the bearing capacity of concrete at point C; M p l , R d is the flexural capacity of composite columns in pure bending state; M max , R d represents the flexural capacity of SRC column when tension steel flange and compression steel flange yield at the same time.
Point A represents the axial compression state of the SRC column. The mechanical equilibrium equation is:
N A = N p l , R d = 0.85 f c A c + f y A a + f s A s ,  M A = 0
Point B represents the pure bending state of the SRC column. The mechanical equilibrium equation is:
N B = 0 ,  M B = M pl,Rd = M D 0.85 W hc f ' hc /2 W ha f ha
Point C represents the eccentric compression state. Note that, points B and C have the same bending moment, and the mechanical equilibrium equation is:
N C = N p l , R d = 0.85 f c A c ,  M C = M B
Point D is the cut-off point between large eccentric compression and small eccentric compression. The mechanical equilibrium equation is:
N D = 0.5 N C ,   M D = 0.85 W c f c / 2 + W a f a + W s f s
where N A , N B , N C and N D stand for the axial bearing capacity of SRC column when at stress state of point A, B, C and D; N A , N B , N C and N D denote the flexural capacity of SRC column when at stress state of point A, B, C and D.
In general, the bearing capacity of SRC columns in different stages of the M–N interaction curve is obtained by:
{ N u N p m , R d N p l , R d N p m , R d + M u / α M M p l , R d = 1 ( A C ) N u 0.5 N p m , R d 0.5 N p m , R d + M u / α M M p l , R d M max , R d M p l , R d = 1 ( C D ) N u 0.5 N p m , R d + M u / α M M max , R d M p l , R d M max , R d = 1 ( B D )
where A c , A c , and A s denote the cross-sectional area of the concrete, steel, and longitudinal reinforcement; f y , f c , and f s are the compressive strength of the section steel, concrete, and reinforcement, respectively; α M is the reduction factor of bending capacity; W c , W a , and W s are the modulus of the bending section of concrete, steel, and reinforcement; and W h a , W h c are the modulus of the bending section of steel and concrete in the range of 2 h n .
The American code, AISC360-16, transforms the reinforced concrete section of SRC column into an equivalent steel section. This code stipulates the bearing capacity of SRC columns under eccentric load using the pure steel structure formula. The specific calculation method is:
{ P r P n + 8 M r 9 M n 1.0 P r P n 0.2 P r 2 P n + M r M n 1.0 P r P n 0.2
{ P n = P n 0 [ 0.658 ( P n 0 P e ) ] P n 0 P e 2.25 P n = 0.877 P e P n 0 P e 2.25
P n 0 = f y A s + f y s r A s r + 0.85 f c A c
where A s and A s r are the cross-sectional area of steel and longitudinal reinforcement, respectively. f y , f y s r , and f c represent the compressive strength of the steel, longitudinal reinforcement, and concrete, respectively; M r stands for the flexural bearing capacity; M n is the flexural bearing capacity under pure bending, and P e is the elastic critical yield load.
The concrete sectional stress distribution, calculated using Chinese code JGJ138-2016, is shown in Figure 16. The calculation method for the bearing capacity of SRC column is as follows:
N α 1 f c b x + f y A s + f a A a f σ s A s σ a A a f + N a w
N e α 1 f c b x ( h 0 x 2 ) + f y A s ( h 0 a s ) + f a A a f ( h 0 a a ) + M a w
where α 1 is the concrete pressure influence coefficient; A c , A s , and A a indicate the cross-sectional area of the concrete, reinforcement, and section steel, respectively; A a f and A a f are the area of steel tension flange and compression flange; f c , f y , and f a are the design value of the compressive strength of concrete, reinforcement, and section steel, respectively; b is the height of cross section, h 0 is the effective height of cross section, x is the equivalent compression height of concrete; σ a and σ s represent the stress of the tension section of steel and reinforcement; N a w and M a w are the axial force and bending moment of steel web.
The test results and numerical results of the bearing capacity calculated using Eurocode 4-2004, AISC360-16, and JGJ138-2016 are listed in Table 5.
The bearing capacity of Q235, Q460, and Q690 SRC columns using Eurocode 4-2004 is mostly less than the test results, except that the bearing capacity of the specimen Q6S6E2V1 is 1.8% larger than the test results. This is due to the flexural strength reduction factor in Equation (5), which prevents premature concrete collapse when the steel strength is high. However, for the specimen Q6S6E2V1, Q690 steel did not yield, thus, the test result is lower than calculated results [24,25]. For some specimens with ordinary steel, the differences between calculated and test results are high. Simultaneous reducing of the bending capacity of the steel and the concrete in Equation (7) causes the contribution of steel to become low, implying that the steel strength and the steel ratio are low. Thus, the reduction of the flexural bearing capacity of concrete is too large.
Note that AISC360-16 underestimates the bearing capacity of all specimens, and the deviation generally decreases with the increase of steel strength and steel ratio. It also presents safety design in formulas to prevent that when the steel strength and steel ratio are large, premature collapse of concrete leads to the large calculated results.
From Table 5, it can be found that JGJ138-2016 underestimated the bearing capacity of some specimens when the steel was fully functional. However, it also can be observed that the calculated results of some specimens overestimate the test results because the contribution of steel was not maximized, which is not safe for engineering.

5. Numerical Analysis

According to the method of strain compatibility method, the peak strain of C50 confined concrete is far less than the yield strain of Q690 steel. Thus, the peak load appears too early because the premature collapse of the concrete takes away most of the bearing capacity. Therefore, the contribution of Q690 steel cannot be maximized. It implies that, increasing the peak strain of confined concrete can improve the utilization ratio of high-strength steel, which can be interpreted from two aspects. One is to improve the strength of concrete grade, and the other is to improve the confinement degree of stirrups [26]. As the confined effect of the specimens Q6S6E2D5 and Q6S6E6V5 are raised by narrowing the stirrup spacing in the test, this paper mainly analyzed the expanding parameters from the aspect of improving the concrete grade. Hence, the finite element analysis was carried out to verify the accuracy of the strain compatibility method. Table 6 illustrates the bearing capacity of specimens calculated by finite element analysis.

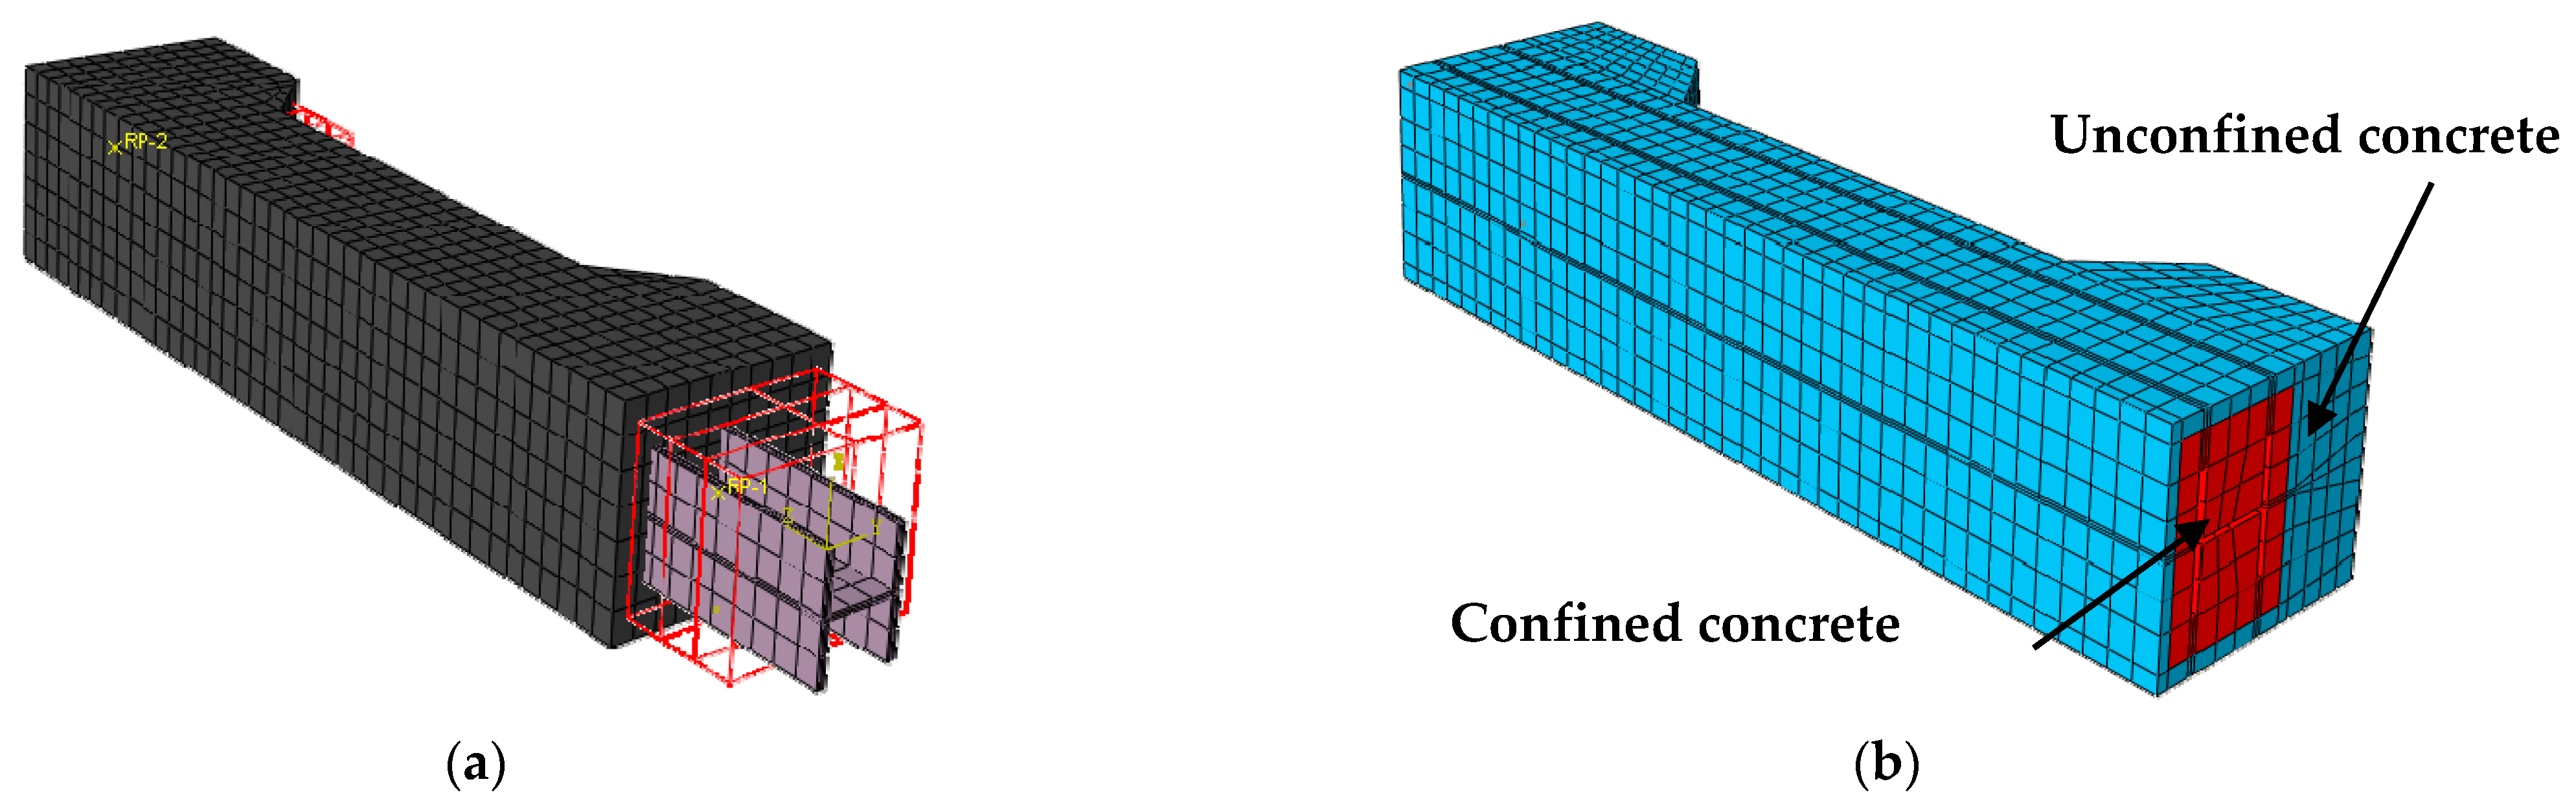
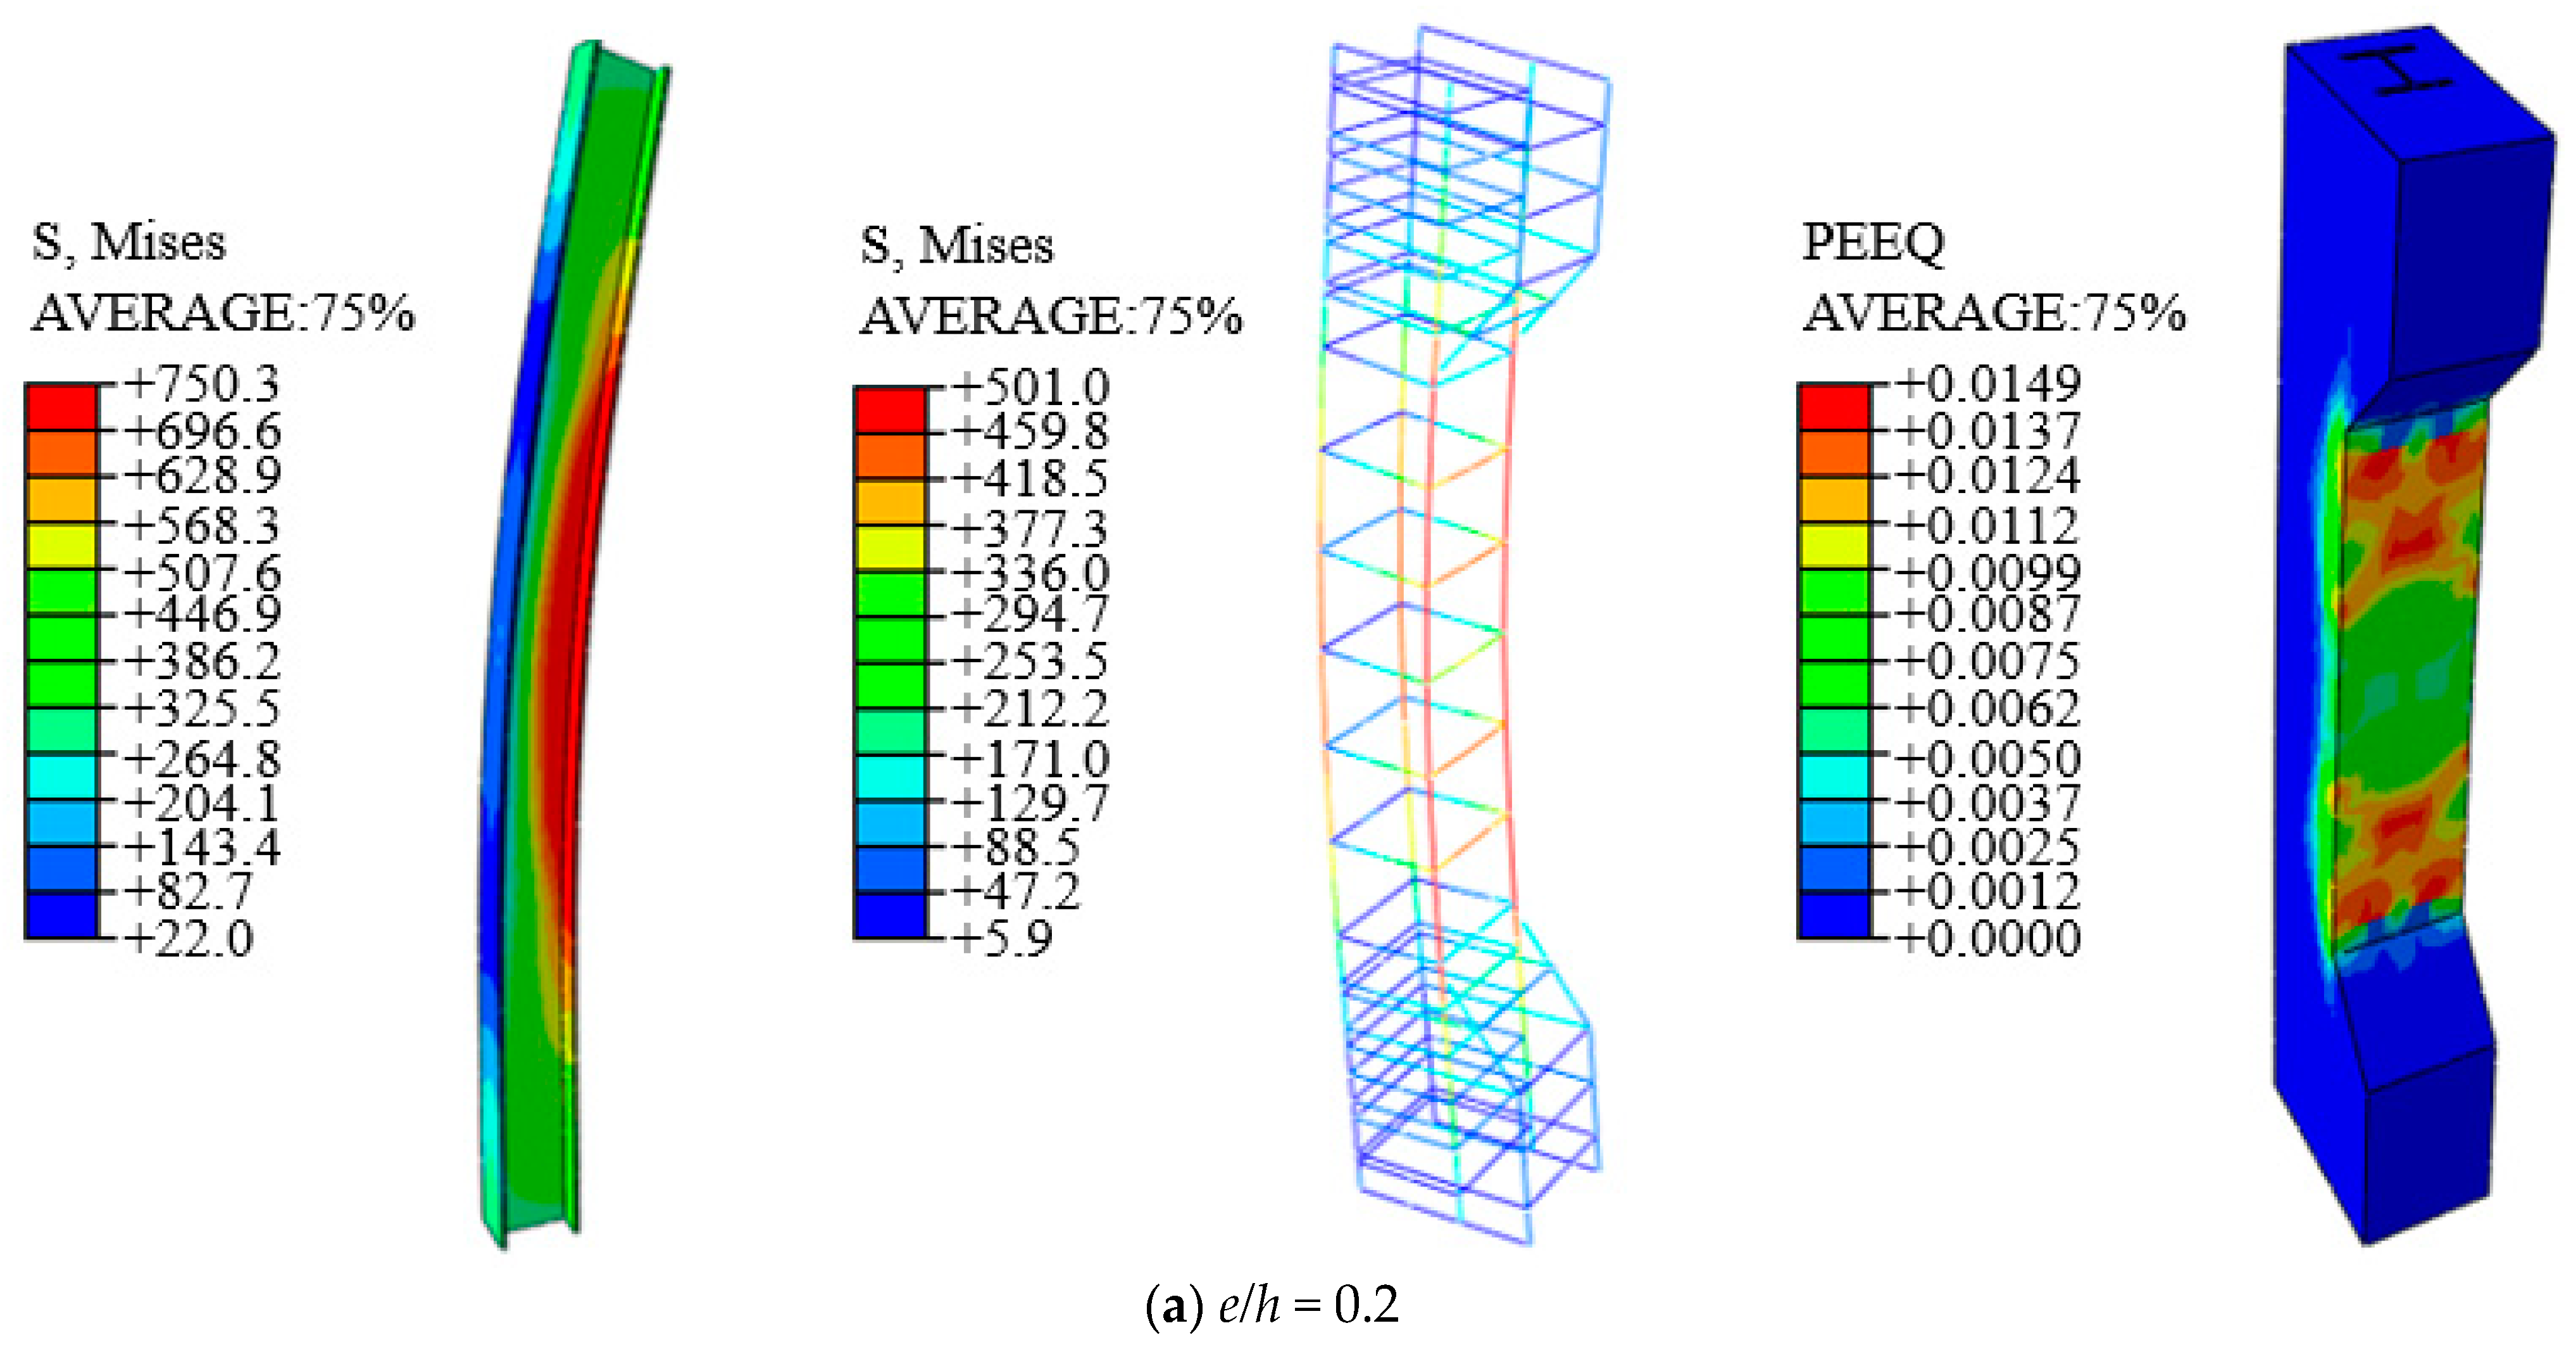
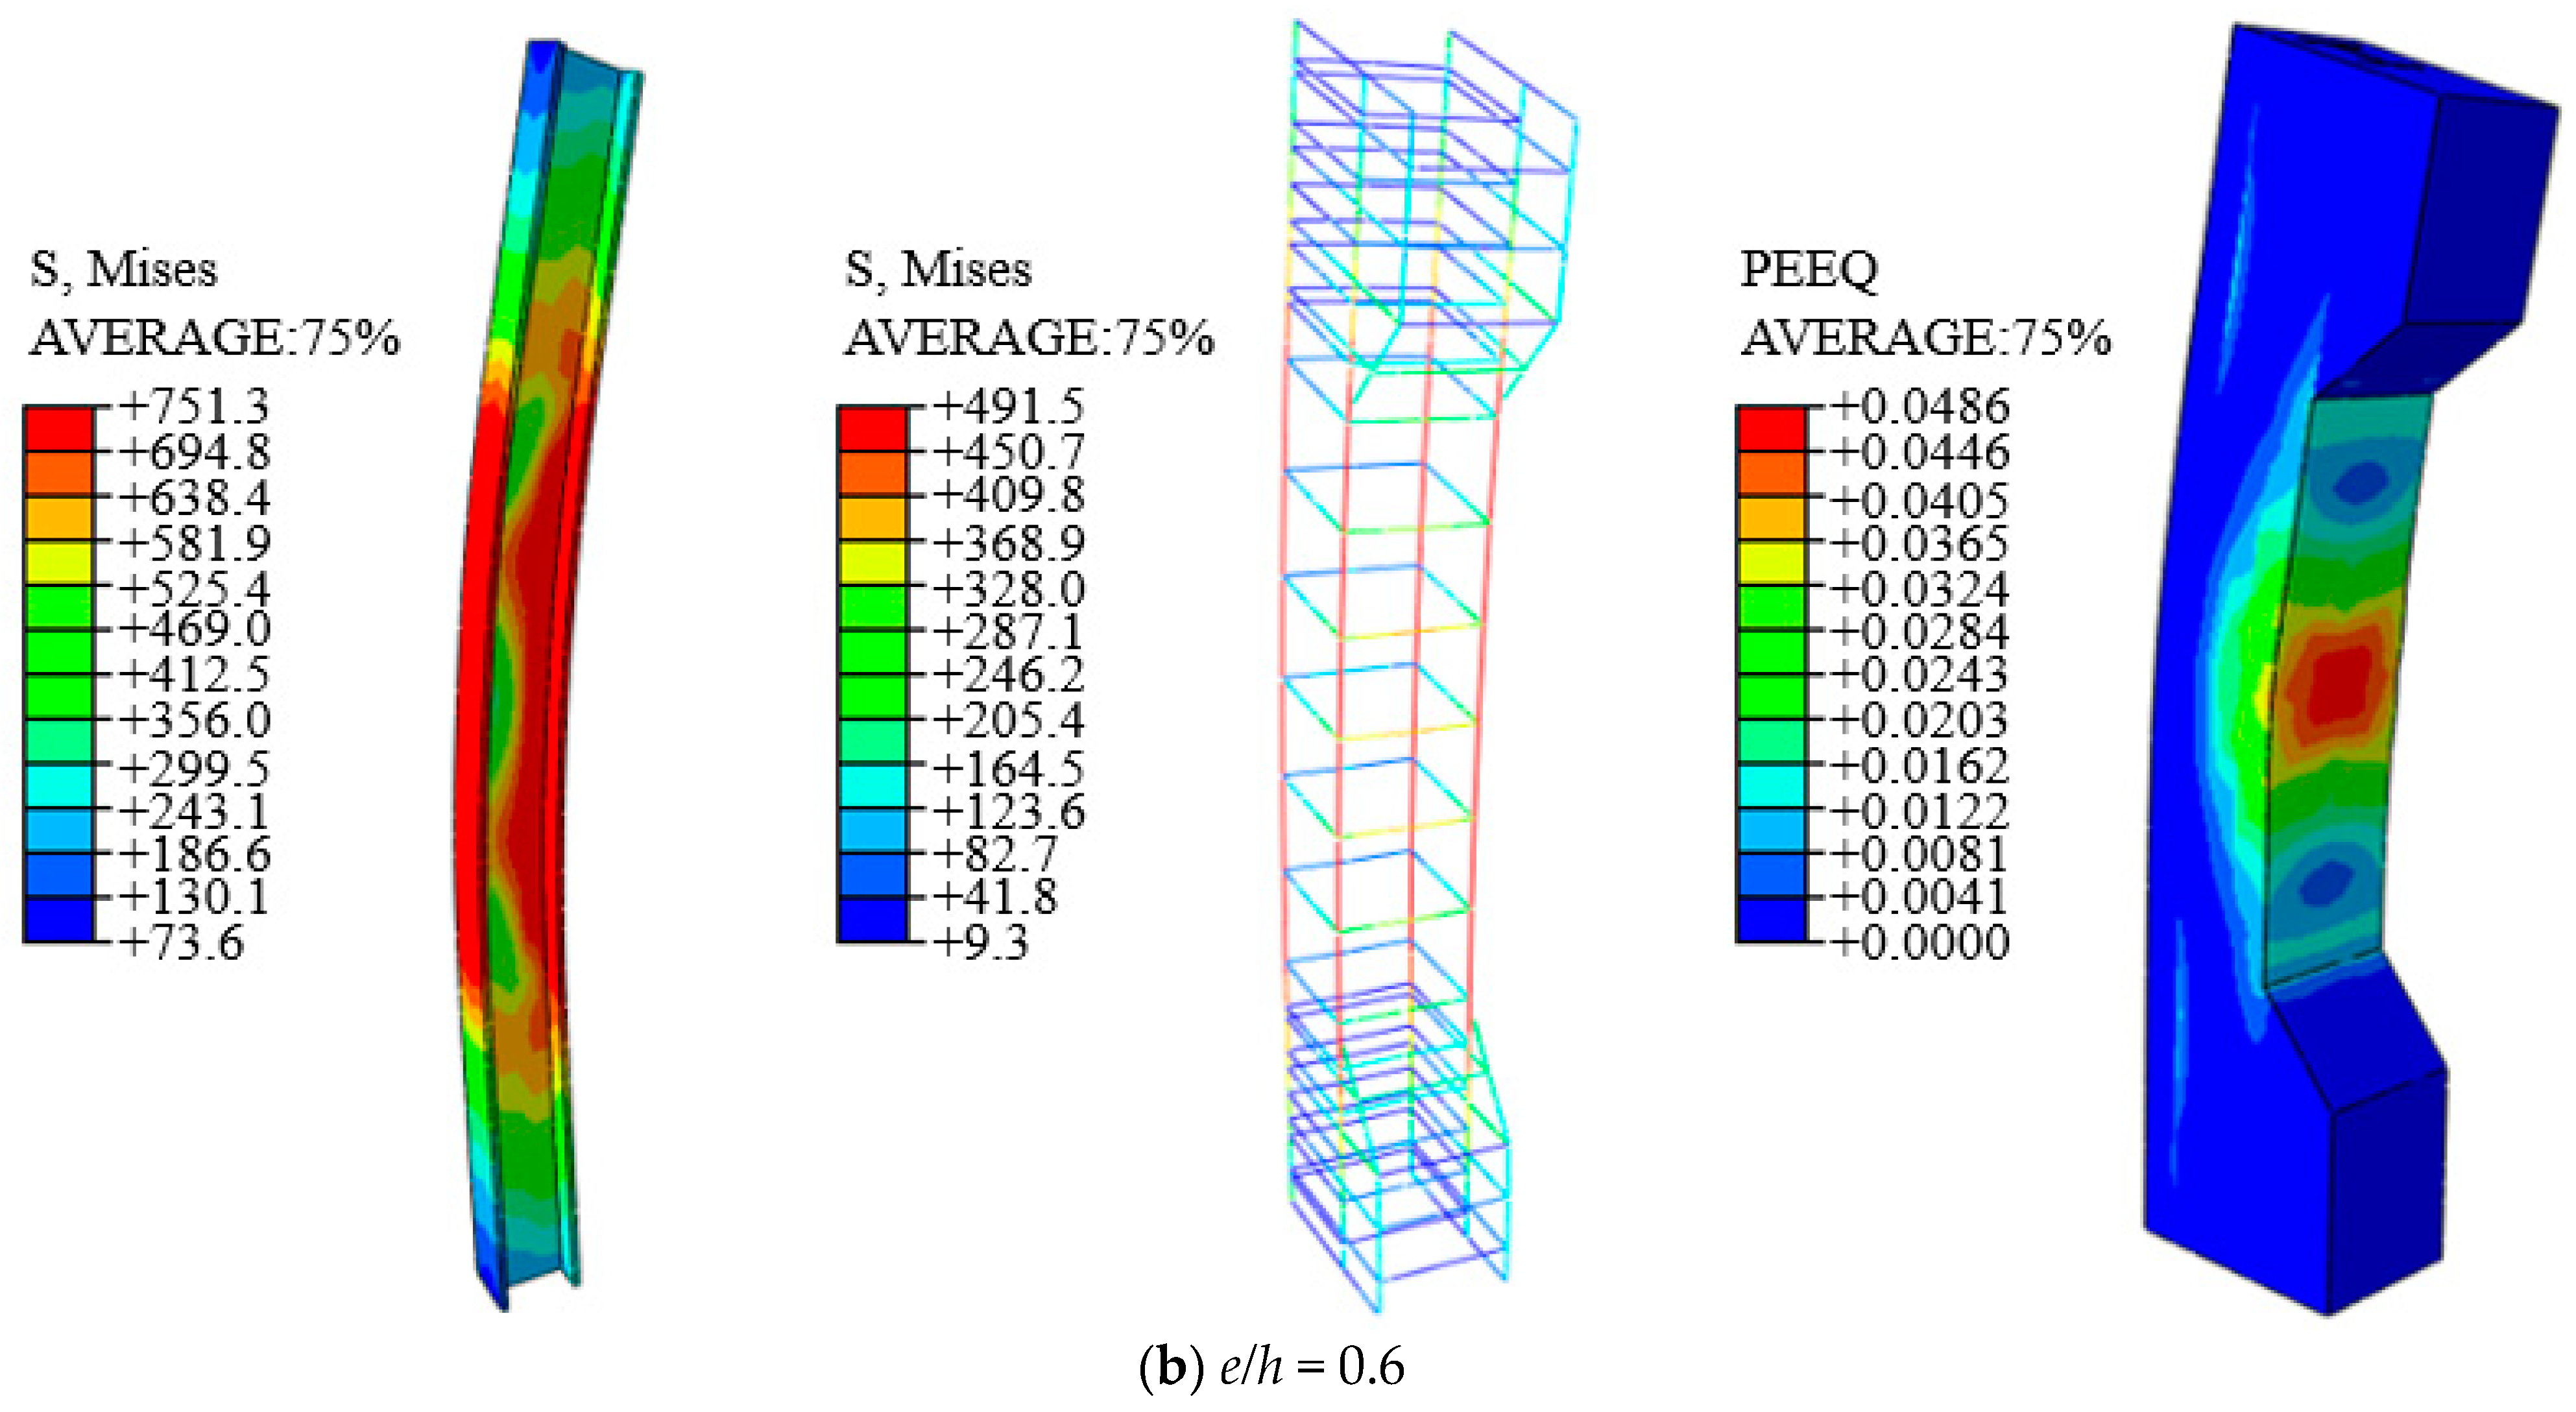
5.1. Establishment of Finite Element Model

Based on the material property test, a finite element model of the specimens was established using the ABAQUS software. Figure 17a displays the typical specimen models according to the test parameters. In addition, an eight-node hexahedral linear reduction integral stress element (C3D8R) was used for the concrete and steel in the finite element model. Two-node three-dimensional truss elements (T3D2) were employed for the reinforcement, as well. Friction was defined at the interface between the concrete and the steel to account for their bonding. The grid was divided according to the length:width:depth = 1.0:1.0:2.5 [27].
The material properties of the steel and reinforcement were obtained from the coupon tests. In addition, for the concrete, the confinement effect of the stirrups was considered. Figure 17b shows the concrete section. The uniaxial compression stress–strain curve of the concrete without any confinement was determined using the Concrete Structures (GB50010-2010) [28]. The stress–strain relationship of the stirrup confined concrete was calculated by Equation (11) [29]:
σ = f cc x r r 1 + x r
x=ε/ ε cc   r = E c / ( E c E s e c )   E s e c = f c c / ε c c   f c c = k f c 0   ε c c = [ 1 + 5 ( k 1 ) ] ε c 0
where σ is the stress of confined concrete; f c c is the compressive strength of confined concrete; E c , E s e c are the elasticity and secant modulus of concrete, respectively; f c 0 is the axial compressive strength of the unconfined concrete; k denotes the improvement efficient of the strength and strain.

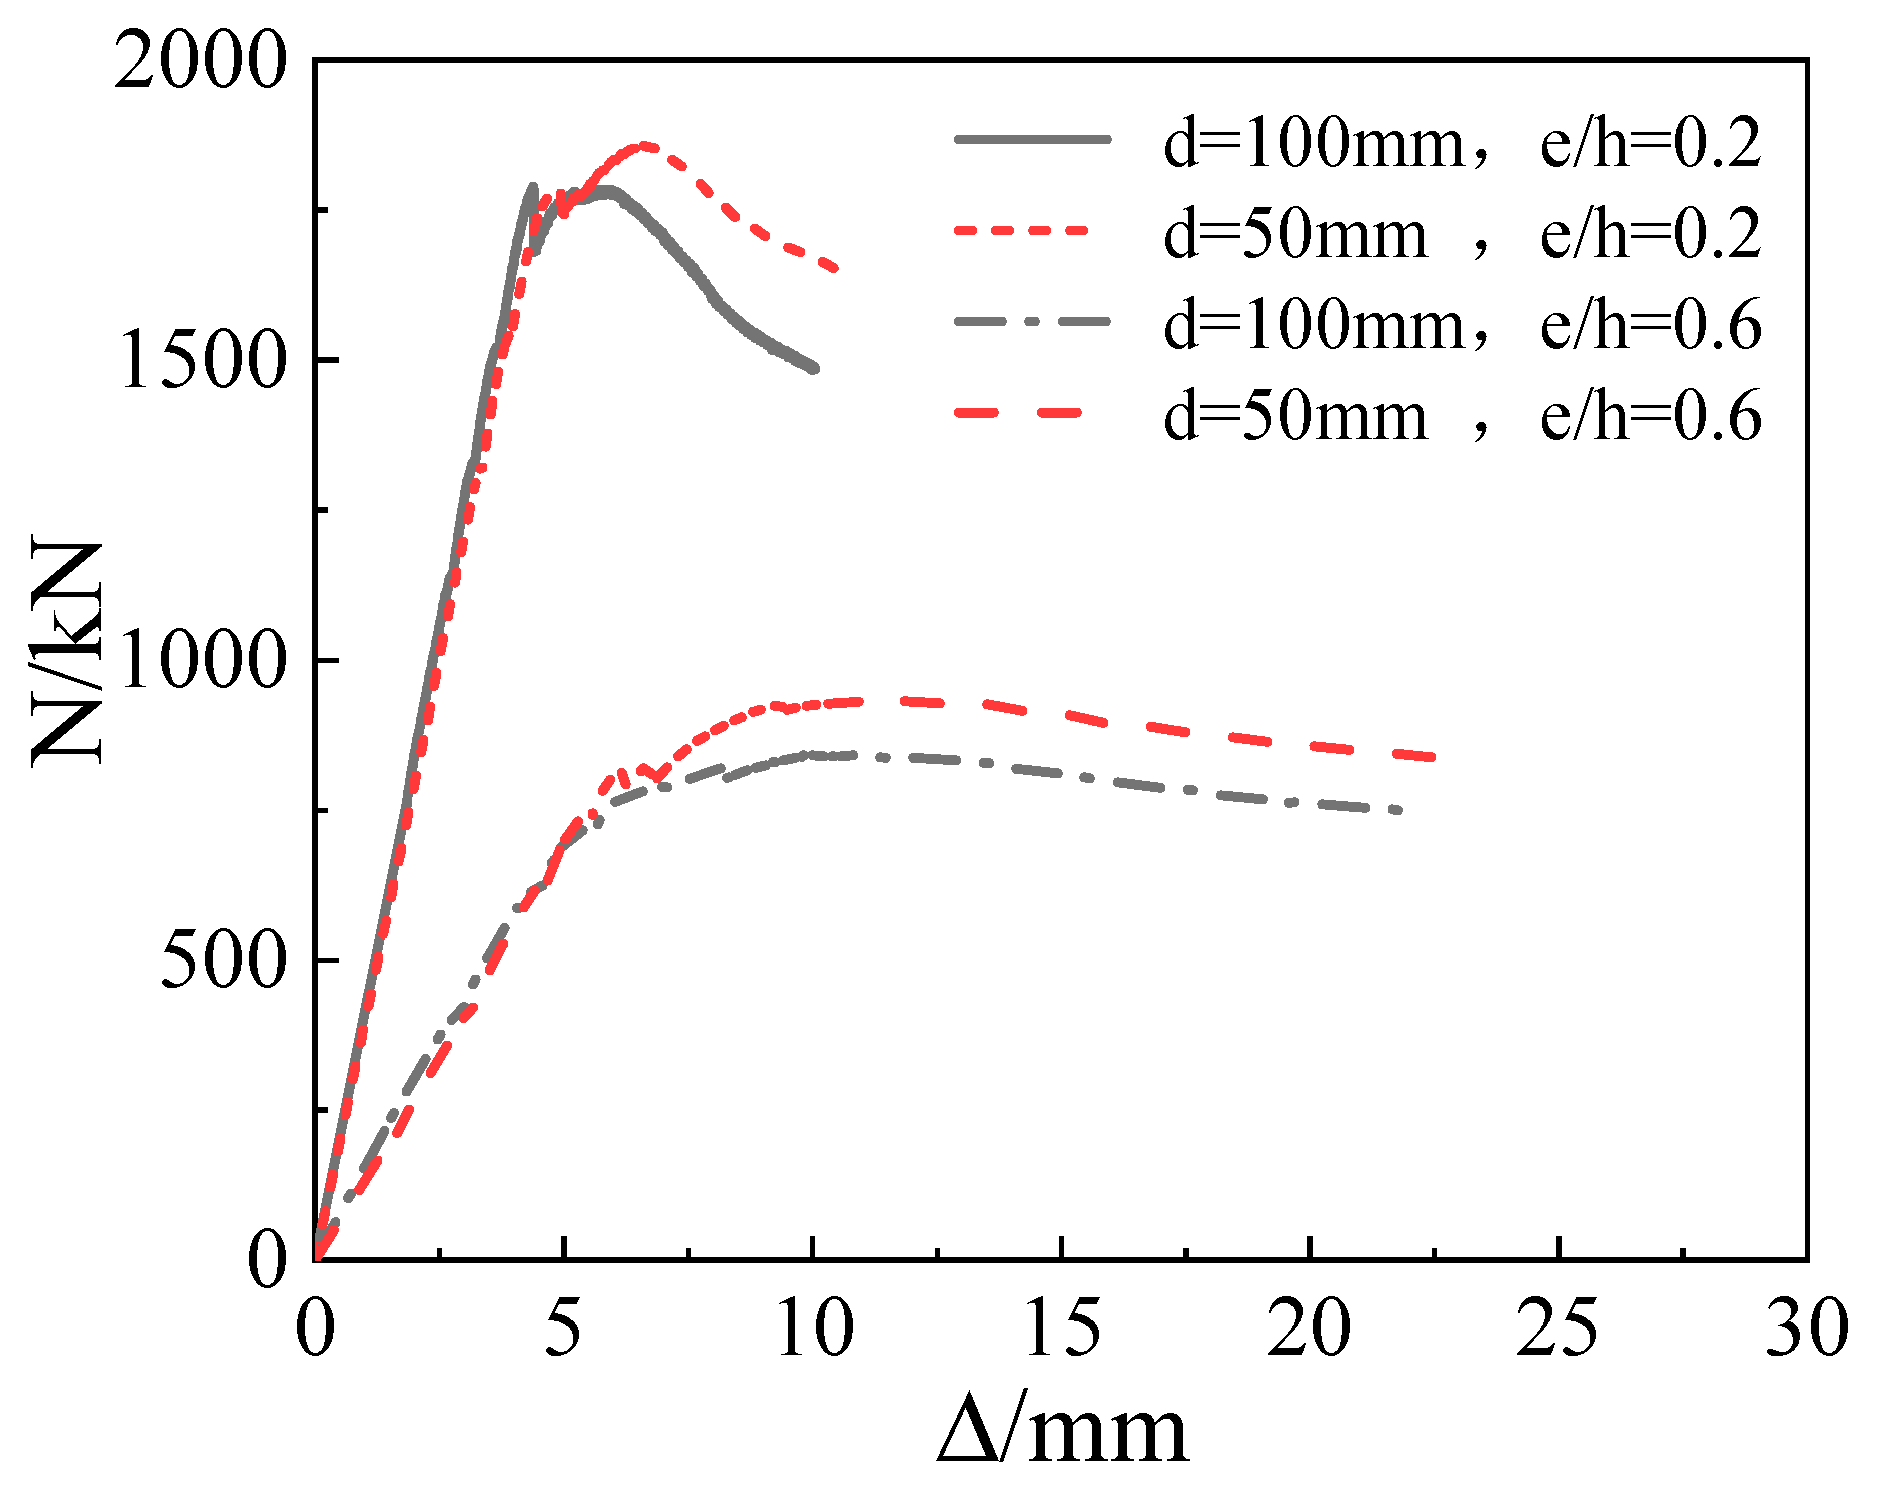
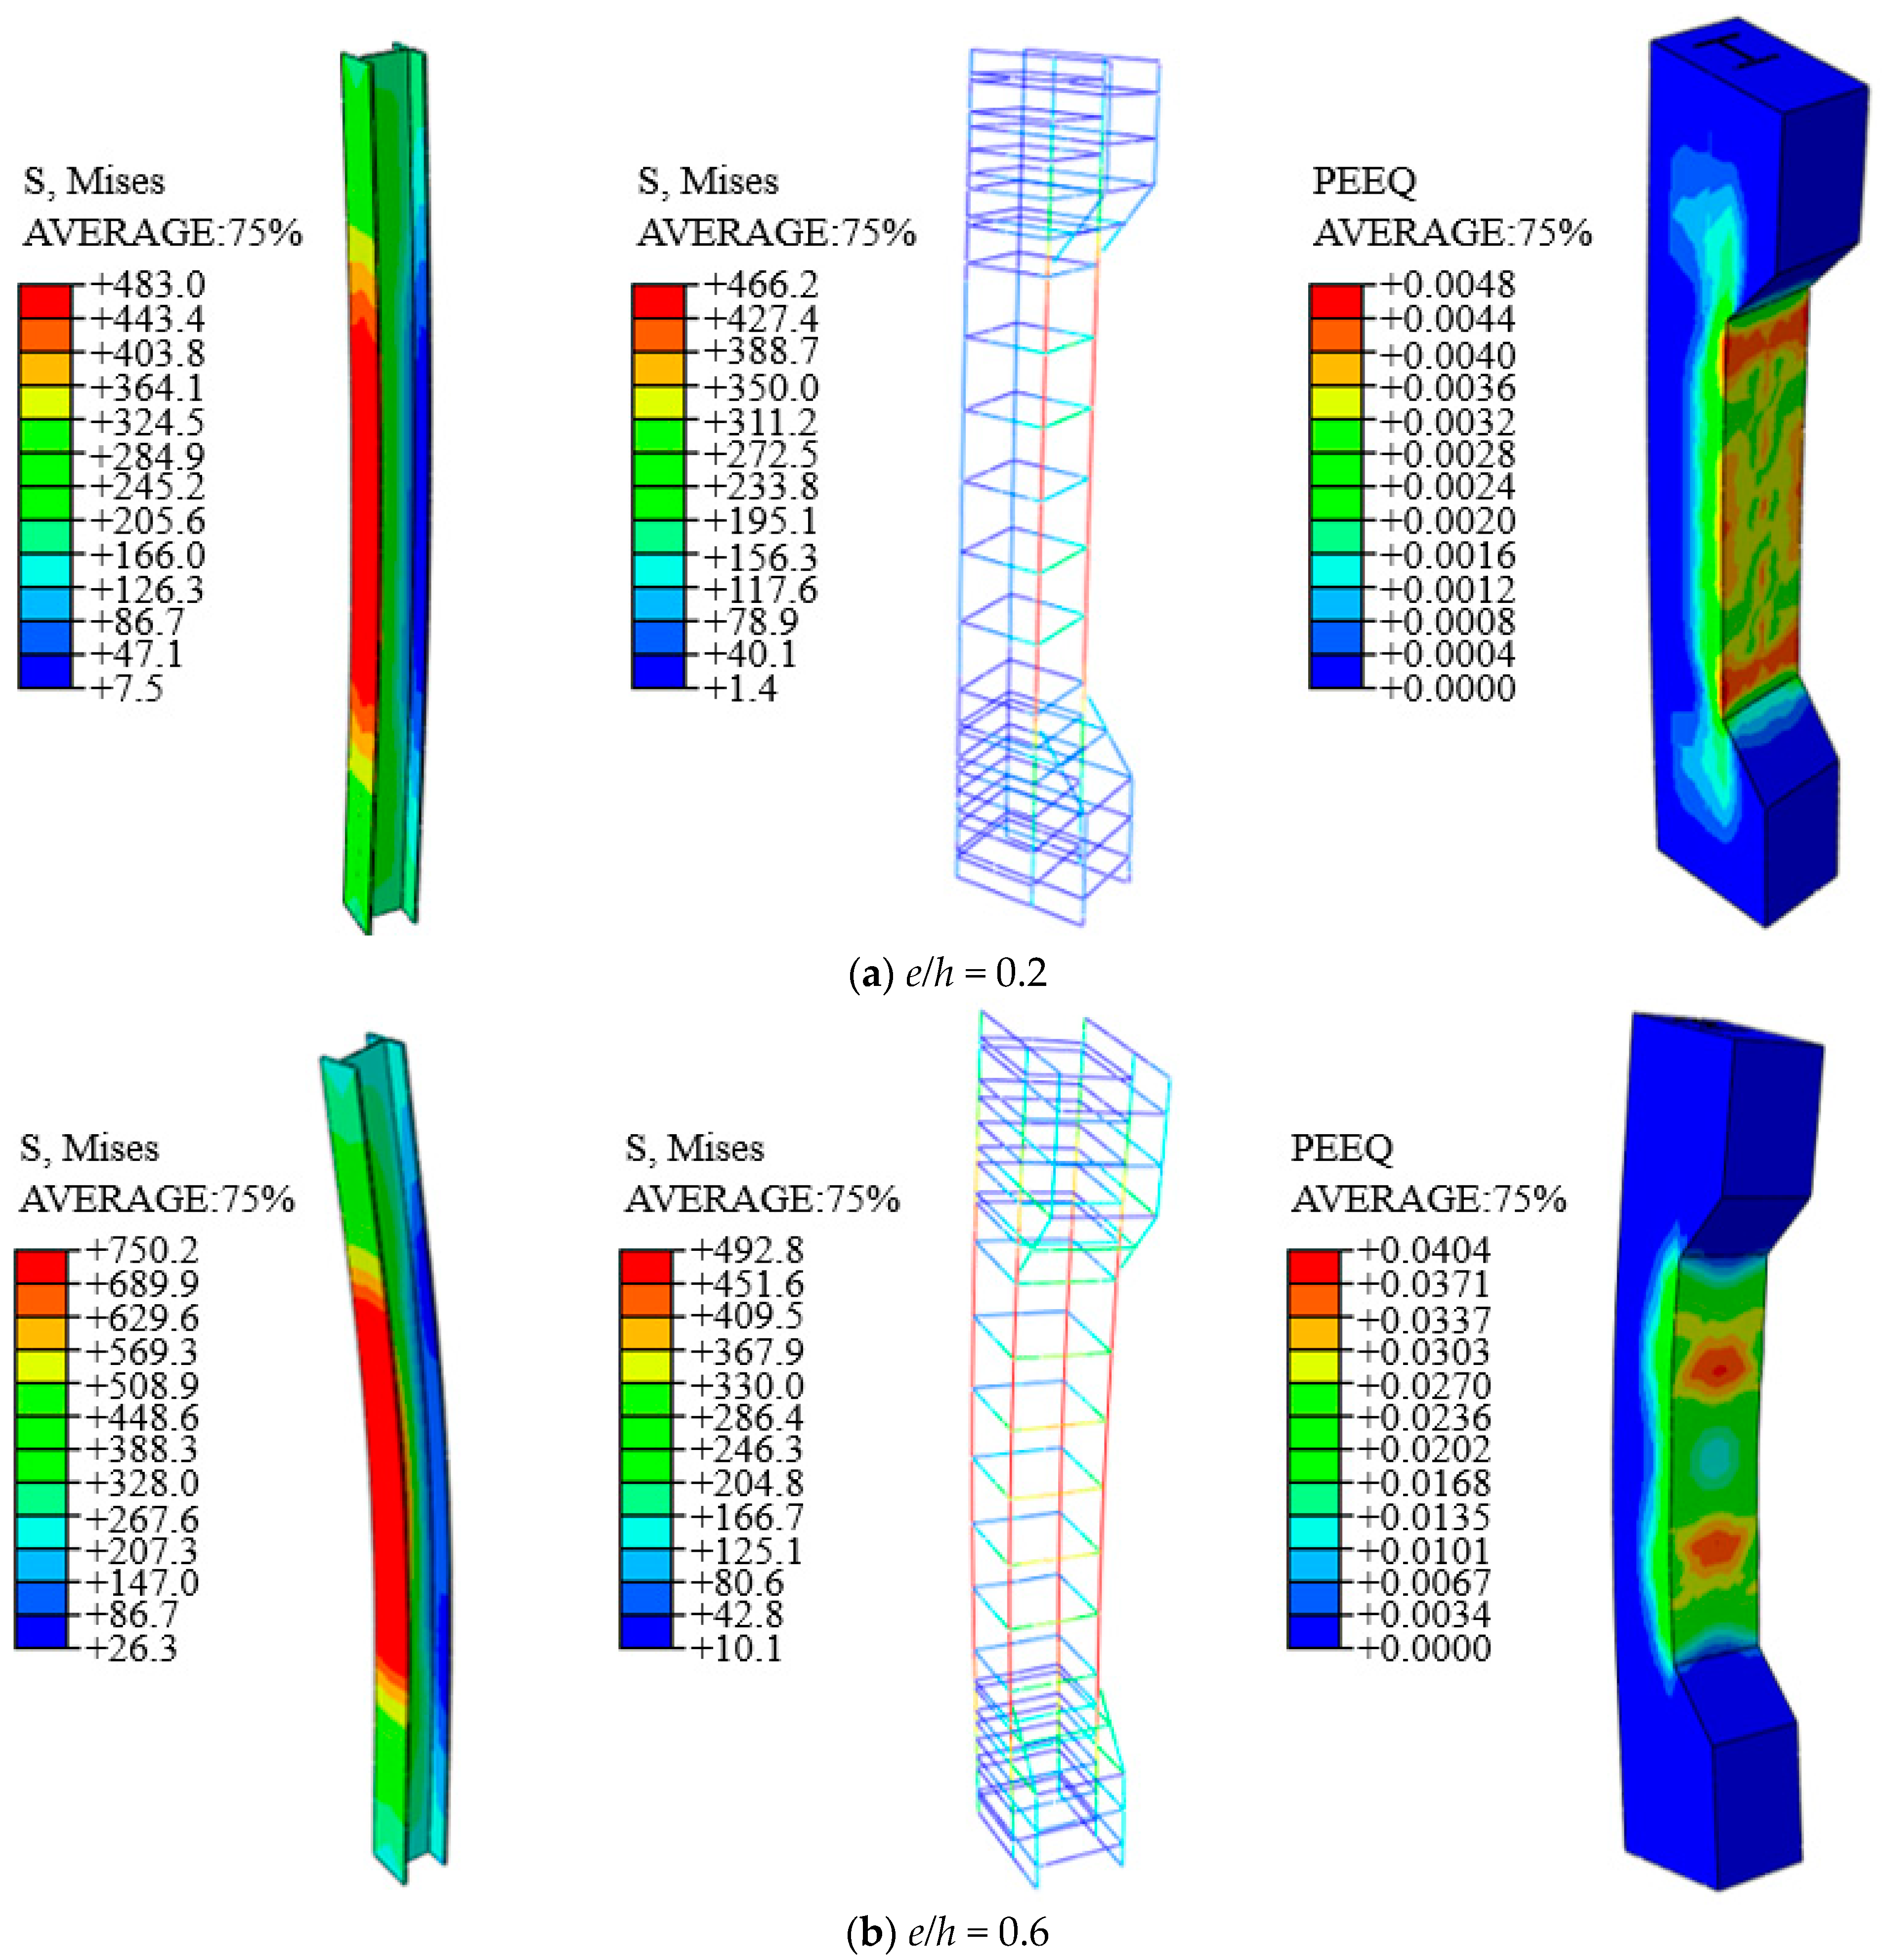
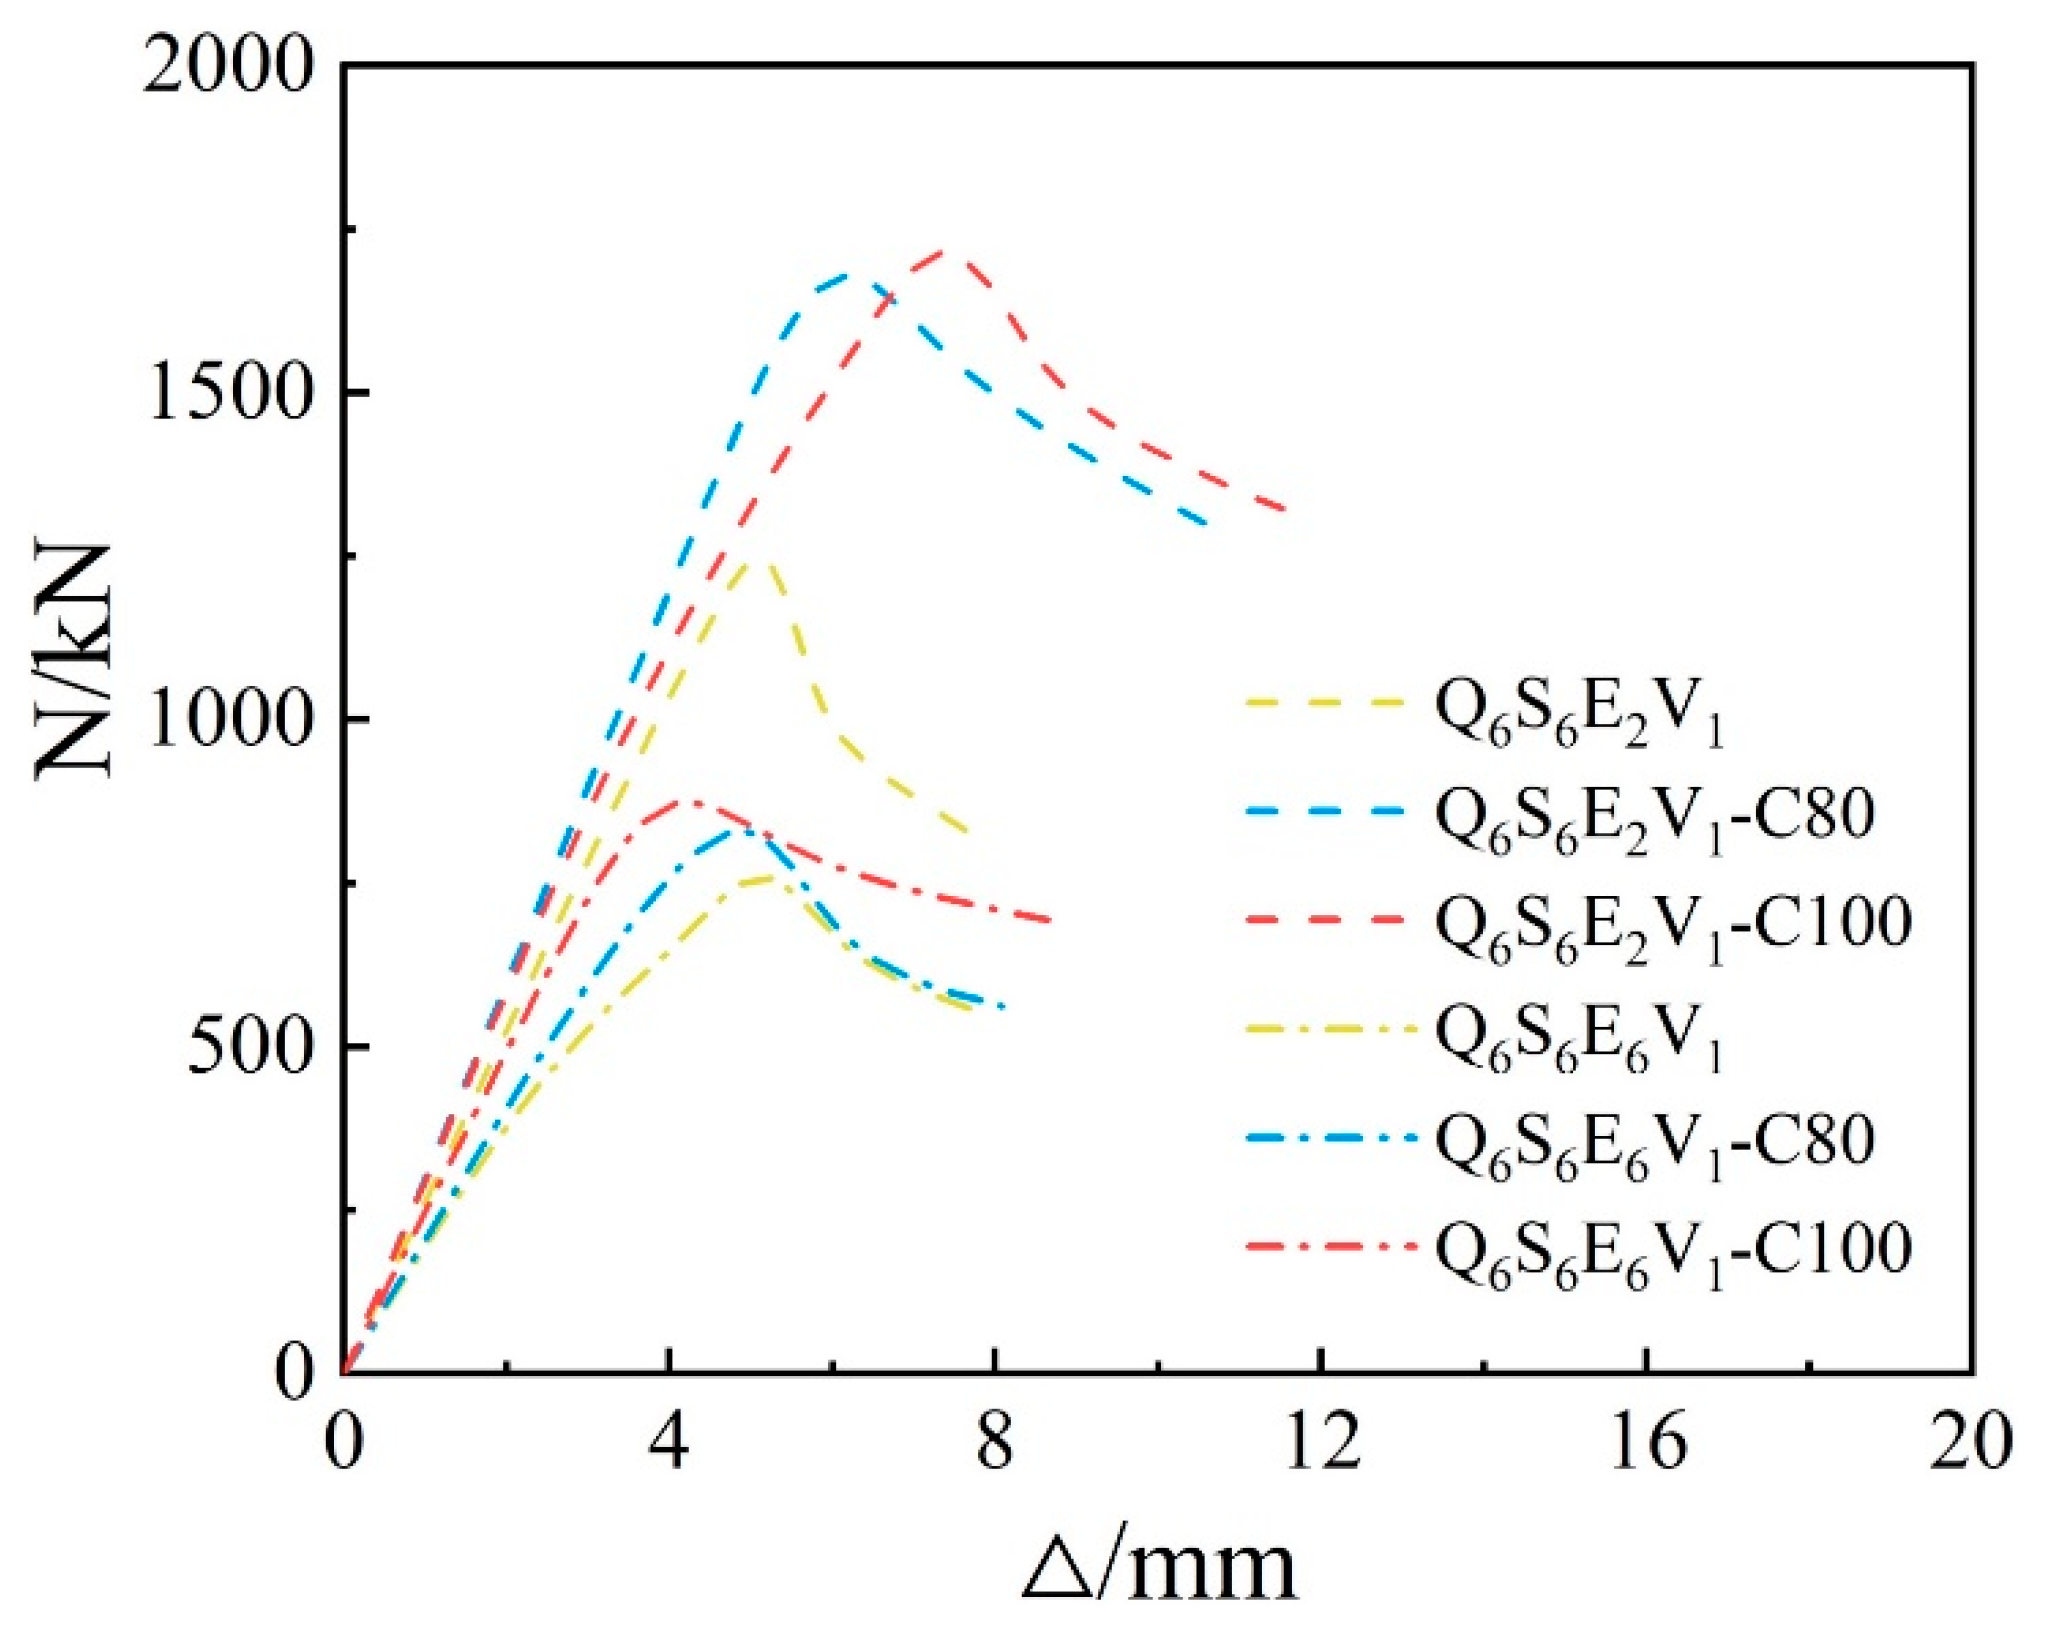
5.2. Finite Element Parametric Study

Table 6 presents the calculated results of the bearing capacity of the specimens by the finite element model. For both specimens Q6S6E2V1 and Q6S6E6V1, the calculated results are less than the test results. As shown in the Figure 18, when e/h = 0.2, the compression and tension flanges of Q690 steel did not yield. In addition, only the longitudinal reinforcement in the compression zone yielded, while it did not yield in the tensile zone. The maximum strength of the compression flange was only 64% of the yield strength. When e/h = 0.6, only the compression flange of Q690 steel yielded, while the longitudinal reinforcement in the tension and compression zones yielded together. These results are in good agreement with the test results.
Figure 19 shows the calculated load-displacement curves of specimens. For Specimen Q6S6E2V1-C80, the bearing capacity increased by 31.7% compared with the specimen Q6S6E2V1. However, the bearing capacity of the specimen Q6S6E2V1-C100 was only 6.1% higher than that of specimen Q6S6E2V1-C80, even though C100 was used in the specimen. Similarly, the bearing capacity of the specimen Q6S6E6V1-C80 increased by 13.4% compared with that of the specimen Q6S6E6V1. However, the bearing capacity of the specimen Q6S6E6V1-C100 was only 2.7% higher than that of the specimen Q6S6E6V1-C80. Combined with cloud graph analysis in Figure 20, it can be found that the utilization ratio of steel increases with the increase of concrete strength.
When e/h = 0.2, under the ultimate bearing capacity of specimens Q6S6E2V1-C80 and Q6S6E2V1-C100, the compression flanges of their Q690 steel both reached the yield strength, as shown in Figure 20a. In addition, the steel provided more bearing capacity so that the bearing capacity of the specimen Q6S6E2V1-C80 was higher than that of specimen Q6S6E2V1. Note that using concrete C80 and C100 can both make full use of the steel strain capacity. Thus, the increasing bearing capacity between the specimens Q6S6E2V1-C100 and Q6S6E2V1-C80 is only because the bearing capacity of concrete strength increases. In addition, the brittleness of super high-strength concrete is large, and the increasing magnitude of bearing capacity between the specimens Q6S6E2V1-C100 and Q6S6E2V1-C80 is smaller.
In addition, when e/h = 0.6, the tensile flange of Q690 steel in the specimens Q6S6E6V1-C80 and Q6S6E6V1-C100 yielded under the ultimate bearing capacity. As shown in Figure 20b, the utilization ratio of steel was improved as well. Note that the previous explanation for Q6S6E2V1-C100 can also justify the slight increasing magnitude in bearing capacity of the specimen Q6S6E6V1-C100.
It is worth mentioning that the behavior described above verifies the accuracy of the strain compatibility method. According to fib-CEB Model Code 2010 [24], the calculated peak strain of C50 confined concrete ( ε 0 ) is around 0.0015, and ε 0 of C80 confined concrete is about 0.0035 and that of C100 is around 0.004. In addition, the calculated yield strain of Q690 ( ε y ) is around 0.0034. The peak strain of C80 confined concrete is closest to ε y . Thus, the contribution of Q690 steel and C80 concrete can be maximized under the ultimate bearing capacity. Therefore, in this test, C80 concrete was more suitable for designing the Q690 SRC columns.

6. Discussion

The finite element analysis erifies the accuracy of the study and proves that the strain compatibility method is suitable for SRC columns under eccentric load. Therefore, the correct method of calculating the stress and strain of confined concrete should be given in this part.
In order to design the SRC columns more reasonably, the strain compatibility method can be used as the judgment criterion. The stress–strain curve of confined concrete can be calculated by the Equations (12)–(14) [17,30]:
σ 2 = w c f cd (1 s c a c )(1 s c b c )(1 b i 2 /6 a c b c )
f ck,c f ck =1+3.5 ( σ 2 f ck ) 3 4
ε c2,c = ε c2 [ 1+5( f ck,c f ck 1 )]
where σ 2 (= σ 3 ) is the effective lateral compressive stress at the ULS due to confinement; f ck stands for the characteristic compressive strength of concrete; f ck,c is the value of confined concrete; ε c2 is the strain at reaching the maximum strength; ε c2,c is the strain of confined concrete at reaching maximum strength.
ε c2,c ε y = f a / E a
where f a and E a represent the yield stress and elastic modulus of section steel, respectively. Then, according to Equation (15), the suitable steel strength, yield strain, and yield stress are deduced. In this way, the utilization ratio of various materials can be significantly improved.
Refer to [7,8,9,10,11,12,13,14,15,16,17] to observe whether the SRC column or CFT column under different load and the strain compatibility method has the research significance in the design of specimens. Nowadays, saving resources is still advocated by the world. It is necessary to improve the utilization rate of materials and avoid waste in any engineering project. In the future, such methods and ideas can continue to be developed and used in more areas to better maintain the sustainable development of human society.

7. Conclusions

In this paper, the mechanical properties of high-strength SRC columns under eccentric load and the applicability of current specifications for calculating the bearing capacity of high-strength SRC columns was studied. A total of 12 SRC columns were tested under eccentric load. The test results were analyzed using the parameters of steel strength, steel ratio, relative eccentricity, and stirrup spacing. The failure modes and load-displacement curves were also studied in detail. In addition, the bearing capacity of the specimens was calculated using some specifications, including Eurocode 4-2004, AISC360-16, and JGJ138-2016. Compared with the test results, it was found that the specifications are conservative. Based on these specifications, it was found that when Q690 steel is used, the steel did not yield at all for some specimens. Therefore, the idea of strain compatibility method can be used to increase the of concrete strength so that the peak strain of confined concrete and the utilization ratio of Q690 steel increase. The expanded parameter analysis was carried out by a finite element model, and the accuracy of the strain compatibility method was verified. Based on the numerical analysis, the reasonable design advice of SRC columns under eccentric load was discussed. The conclusions drawn from the experimental and numerical analyses are summarized as follows.
1.
The bearing capacity of SRC column increases with the steel (strength) grade increasing. The ductility coefficient of SRC column increases obviously when the steel grade is raised from Q235 to Q460 and Q690. In addition, the ductility coefficient of Q690 SRC column is much higher than that of Q460 steel specimens.
2.
The ductility of high-strength SRC columns can increase by 25–155% when the relative eccentricity increases from 0.2 to 0.6; the bearing capacity and ductility of high-strength SRC columns can be improved by increasing the steel ratio. Decreasing the stirrup spacing can improve the bearing capacity and ductility of Q690 SRC columns.
3.
The bearing capacity of SRC column measured in the test was compared with the bearing capacity calculated by Eurocode 4-2004, AISC360-16 and JGJ138-2016 specifications. It was found that the calculated results of Eurocode 4-2004 and AISC360-16 generally tend to be conservative, while the calculated results of JGJ138-2016 for high-strength SRC columns are generally safe when e/h is equal to 0.2 and unsafe when e/h is equal to 0.6.
4.
It was also found that the strain compatibility method should be used for designing SRC columns. In addition, the peak strain of confined concrete should be close to the yield strain of steel. In this way, the contribution of materials can be maximized when the ultimate bearing capacity of SRC columns is reached, and the waste of the materials can be avoided.

Author Contributions

Conceptualization, J.W.; methodology, J.W. and Y.D.; software, Y.D. and W.S.; validation, J.W., Y.D. and W.S.; formal analysis, J.W.; investigation, Y.D.; resources, W.S.; data curation, W.S.; writing—original draft preparation, J.W. and Y.D.; writing—review and editing, Y.D.; visualization, X.Y.; supervision, X.Y.; project administration, J.W.; funding acquisition, J.W. All authors have read and agreed to the published version of the manuscript.

Funding

This research is financially supported by the Natural Science Foundation of Heilongjiang Province in China (ZD2019E001) ‘Study on bearing capacity and seismic performance of Q460 high strength steel-reinforced concrete columns’, and the Special Fund for Basic Scientific Research Operation Expenses of Central University (2572019CT01).

Institutional Review Board Statement

Not applicable.

Informed Consent Statement

Not applicable.

Data Availability Statement

The data presented in this study are available on request from the corresponding author.

Conflicts of Interest

The authors declare no conflict of interest.

References

  1. Shokouhian, M.; Shi, Y. Flexural strength of hybrid steel I-beams based on slenderness. Eng. Struct. 2015, 93, 114–128. [Google Scholar] [CrossRef]
  2. Tsutsumi, S.; Kitamura, T.; Fincato, R. Ductile behaviour of carbon steel for welded structures: Experiments and numerical simulations. J. Constr. Steel Res. 2020, 172, 106185. [Google Scholar] [CrossRef]
  3. Al-Azzani, H.; Yang, J.; Sharhan, A.; Wang, W. A Practical Approach for Fire Resistance Design of Restrained High-Strength Q690 Steel Beam Considering Creep Effect. Fire Technol. 2021, 57, 1683–1706. [Google Scholar] [CrossRef]
  4. Nguyen, H.T.; Kim, S.E. Finite element modeling of push-out tests for large stud shear connectors. J. Constr. Steel Res. 2009, 65, 1909–1920. [Google Scholar] [CrossRef]
  5. Yang, Y.; Hou, Z.; Li, G. Mechanical properties of high strength steel reinforced concrete columns under small eccentric load. J. Harbin Inst. Tech. 2016, 48, 132–137. [Google Scholar]
  6. Yang, Y.; Hou, Z.; Li, G. Study on mechanical properties of Q460 high-strength SRC circular column under axial compression. Steel Constr. 2016, 31, 24–31. [Google Scholar] [CrossRef]
  7. Kim, C.-S.; Park, H.-G.; Chung, K.-S.; Choi, I.-R. Eccentric Axial Load Testing for Concrete-Encased Steel Columns Using 800 MPa Steel and 100 MPa Concrete. J. Struct. Eng. 2012, 138, 1019–1031. [Google Scholar] [CrossRef]
  8. Kim, C.-S.; Park, H.-G.; Choi, I.-R.; Chung, K.-S. Effect of Sustained Load on Ultimate Strength of High-Strength Composite Columns Using 800-MPa Steel and 100-MPa Concrete. J. Struct. Eng. 2017, 143, 04016189. [Google Scholar] [CrossRef]
  9. Kim, C.-S.; Park, H.-G.; Lee, H.-J.; Choi, I.-R.; Chung, K.-S. Eccentric Axial Load Test for High-Strength Composite Columns of Various Sectional Configurations. J. Struct. Eng. 2017, 143, 04017075. [Google Scholar] [CrossRef]
  10. Cusson, D.; Paultre, P. Stress-Strain Model for Confined High-Strength Concrete. J. Struct. Eng. 1995, 121, 468–477. [Google Scholar] [CrossRef]
  11. Chen, C.-C.; Lin, N.-J. Analytical model for predicting axial capacity and behavior of concrete encased steel composite stub columns. J. Constr. Steel Res. 2006, 62, 424–433. [Google Scholar] [CrossRef]
  12. American Concrete Institute (ACI). Building Code Requirements for Structural Concrete (ACI 318-14) and Commentary; American Concrete Institute (ACI): Farmington Hills, MI, USA, 2014. [Google Scholar]
  13. Lee, C.-H.; Kang, T.H.-K.; Kim, S.-Y.; Kang, K. Strain compatibility method for the design of short rectangular concrete-filled tube columns under eccentric axial loads. Constr. Build. Mater. 2016, 121, 143–153. [Google Scholar] [CrossRef]
  14. Chin, C.-L.; Ong, C.-B.; Tan, J.-Y.; Ma, C.-K.; Awang, A.Z.; Omar, W. Confinement-concrete interaction in pre-tensioned partial steel-confined concrete. Structures 2019, 23, 751–765. [Google Scholar] [CrossRef]
  15. Chen, C.-C.; Ko, J.-W.; Huang, G.-L.; Chang, Y.-M. Local buckling and concrete confinement of concrete-filled box columns under axial load. J. Constr. Steel Res. 2012, 78, 8–21. [Google Scholar] [CrossRef]
  16. Wang, J.; Su, Y.; Zhao, J.; Wang, X.; Sun, W. Study on axial compression performance of high strength H-section steel reinforced concrete composite column. J. Build. Struct. 2021, 1–10. [Google Scholar] [CrossRef]
  17. Wang, J.; Duan, Y.; Wang, Y.; Wang, X.; Liu, Q. Analysis and Modification of Methods for Calculating Axial Load Capacity of High-Strength Steel-Reinforced Concrete Composite Columns. Materials 2021, 14, 6860. [Google Scholar] [CrossRef] [PubMed]
  18. ANSI/AISC360-2016. Specification for Structural Steel Buildings; AISC Committee on Specifications: Chicago, IL, USA, 2016. [Google Scholar]
  19. Eurocode 4: Design of Composite Steel and Concrete Structures Part 1-1: General Rules for Buildings: EN 1994-1-1:2004; European Committee for Standardization: Brussels, Belgium, 2004.
  20. JGJ138-2016. Code for Design of Composite Structures; Architecture and Building Press: Beijing, China, 2016. [Google Scholar]
  21. GB/T228-2010. Chinese Standard for Metallic Materials-Tensile Testing at Ambient Temperature; Architecture and Building Press: Beijing, China, 2010. [Google Scholar]
  22. GB/T50152-2012. Standard for Test Methods of Concrete Structures; Architecture and Building Press: Beijing, China, 2012. [Google Scholar]
  23. Zongping, C.; Lezhang, H.; Qiuhong, T. Experimental study and analysis of concrete filled square steel tube columns with spiral reinforcement under eccentric compression. Eng. Mech. 2021, 38, 205–219. [Google Scholar]
  24. Hegger, J.; Doinghaus, P. High Performance Steel and High Performance Concrete in Composite Structures. Composite Construction in Steel and Concrete IV; American Society of Civil Engineers: New York, NY, USA, 2002; pp. 891–902. [Google Scholar]
  25. Hoffmeister, B.; Sedlack, G.; Muller, C.; Kuhn, B. High Strength Materials in Composite Structures. Composite Construction in Steel and Concrete IV; American Society of Civil Engineers: New York, NY, USA, 2002; pp. 903–914. [Google Scholar]
  26. Zhao, X.-Z.; Wen, F.-P. Theoretical study on confinement mechanism and stress-strain model for steel confined concrete in SRC columns. Eng. Mech. 2018, 35, 36–46. [Google Scholar]
  27. Sheikh, S.A.; Uzumeri, S.M. Strength and Ductility of Tied Concrete Columns. J. Struct. Div. 1980, 106, 1079–1102. [Google Scholar] [CrossRef]
  28. GB 50010-2010. Chinese Standard for Design of Concrete Structures; Architecture and Building Press: Beijing, China, 2010. [Google Scholar]
  29. Mander, J.B.; Priestley, M.J.N.; Park, R. Theoretical Stress-Strain Model for Confined Concrete. J. Struct. Eng. 1988, 114, 1804–1826. [Google Scholar] [CrossRef]
  30. Fib. Fib Model Code for Concrete Structures 2010; International Federation for Structural Concrete: Lausanne, Switzerland, 2010. [Google Scholar]
Figure 1. Geometric dimension of specimens.
Buildings 11 00639 g001
Figure 2. Labeling rule of specimens.
Buildings 11 00639 g002
Figure 3. Concrete cubes and the failure mode of concrete tubes: (a) concrete cube; (b) failure mode of concrete cube after test.
Buildings 11 00639 g003
Figure 4. Test up and strain gauge: (a) test up; (b) location of strain gauges and displacement transducers.
Buildings 11 00639 g004
Figure 5. Failure modes of specimens: (a) the failure mode of the specimens with small relative eccentricity; (b) the failure mode of the specimens with large relative eccentricity.
Buildings 11 00639 g005aBuildings 11 00639 g005b
Figure 6. Load-displacement curves of SRC columns: (a) specimens with Q235, ρ = 6.63%, d = 100 mm; (b) specimens with Q460, ρ = 3.63%, d = 100 mm; (c) specimens with Q460, ρ = 5.13%, d = 100 mm; (d) Q460, ρ = 6.63%, d = 100 mm; (e) specimens with Q690, ρ = 6.63%, d = 100 mm; (f) specimens with Q690, ρ = 6.63%, d = 50 mm.
Buildings 11 00639 g006
Figure 7. Load-lateral deflection curves of SRC columns: (a) specimens with e/h = 0.2, Q235; (b) specimens with e/h = 0.6, Q235; (c) specimens with e/h = 0.2, Q460; (d) specimens with e/h = 0.6, Q460; (e) specimens with e/h = 0.2, Q690; (f) specimens with e/h = 0.6, Q690.
Buildings 11 00639 g007aBuildings 11 00639 g007b
Figure 8. Meaning of displacement ductility coefficient.
Buildings 11 00639 g008
Figure 9. N-Δ curves of SRC columns with different steel strength.
Buildings 11 00639 g009
Figure 10. N-Δ curves of SRC columns with different steel ratio.
Buildings 11 00639 g010
Figure 11. N-Δ curves of SRC columns with different eccentricities.
Buildings 11 00639 g011
Figure 12. Load-displacement curves of SRC columns with different stirrup spacing.
Buildings 11 00639 g012
Figure 13. Strain distribution of concrete in the middle section of column: (a) the specimen Q4S6E2V1; (b) the specimen Q4S6E6V1.
Buildings 11 00639 g013
Figure 14. M–N interaction curve of Eurocode 4-2004.
Buildings 11 00639 g014
Figure 15. Stress distribution of characteristic points in M–N interaction curve: (a) stress state of point A; (b) stress state of point B; (c) stress state of point C; (d) stress state of point D.
Buildings 11 00639 g015
Figure 16. Stress distribution of SRC columns under eccentric compression based on JGJ138-2016.
Buildings 11 00639 g016
Figure 17. The typical specimen models: (a) basic model; (b) concrete section considered confinement.
Buildings 11 00639 g017
Figure 18. Stress–field nephogram of the specimens Q6S6E2V1 and Q6S6E6V1: (a) the specimen Q6S6E2V1; (b) the specimen Q6S6E6V1.
Buildings 11 00639 g018
Figure 19. The load-displacement curves of specimens in numerical analysis.
Buildings 11 00639 g019
Figure 20. Stress–field nephogram of the specimens Q6S6E2V1-C80 and Q6S6E6V1-C1s00: (a) the specimen Q6S6E2V1-C80; (b) the specimen Q6S6E6V1-C100.
Buildings 11 00639 g020aBuildings 11 00639 g020b
Table 1. Parameters of specimens.
SpecimensSteelRelative Eccentricity
e/h
Steel Ratio
ρ/%
Steel Size
hw × bf × tw × tf
Stirrup Spacing
d/mm
Q2S6E2V1Q2350.26.6390 × 110 × 5 × 10100
Q4S3E2V1Q4600.23.6390 × 100 × 5 × 5100
Q4S5E2V1Q4600.25.1390 × 100 × 5 × 8100
Q4S6E2V1Q4600.26.6390 × 110 × 5 × 10100
Q6S6E2V1Q6900.26.6390 × 110 × 5 × 10100
Q6S6E2V5Q6900.26.6390 × 110 × 5 × 1050
Q2S6E6V1Q2350.66.6390 × 110 × 5 × 10100
Q4S3E6V1Q4600.63.6390 × 100 × 5 × 5100
Q4S5E6V1Q4600.65.1390 × 100 × 5 × 8100
Q4S6E6V1Q4600.66.6390 × 110 × 5 × 10100
Q6S6E6V1Q6900.66.6390 × 110 × 5 × 10100
Q6S6E6V5Q6900.66.6390 × 110 × 5 × 1050
Explanation: e is the eccentricity; h is the height of cross section; hw is the height of steel web; bf is the width of steel flange; tw is the thickness of steel web; tf is the thickness of steel flange, as Figure 1.
Table 2. Mechanical properties of steel.
SteelThickness (Diameter)
t (dr)/mm
Yield Strength
fy/MPa
Ultimate Strength
fu/MPa
Elongation
δ/%
Q2355276.5455.031.7
Q23510281.2461.533.1
Q4605550.5619.723.2
Q4608520.0622.228.2
Q46010556.1620.423.5
Q6905769.6824.122.5
Q69010774.2830.523.9
HRB4008461.5586.528.6
HRB40012451.0570.327.8
Table 3. Results of compressive strength test.
Grade of Concrete f c u 0 f c u , m 0 f c 0 E c 0
C5056.458.042.435,826.1
59.7
57.1
59.3
57.5
58.2
57.9
56.8
59.1
Table 4. Test results.
SpecimenNu/kNΔy/mmΔf/mmμ
Q2S6E2V114333.74.11.1
Q4S3E2V114524.04.11.0
Q4S5E2V116274.34.81.1
Q4S6E2V117614.55.91.3
Q6S6E2V117894.49.22.1
Q6S6E2V518594.612.62.7
Q2S6E6V16665.88.21.4
Q4S3E6V16036.411.61.8
Q4S5E6V16545.715.72.8
Q4S6E6V17616.318.63.0
Q6S6E6V18436.129.04.8
Q6S6E6V59326.434.95.5
Table 5. Comparison of calculation results and test results of various codes.
SpecimensTest Results
Nu/kN
Eurocode 4-2004AISC360-16JGJ138-2016
NE/kNNE/Nu − 1NA/kNNA/Nu − 1NJ/kNNJ/Nu − 1
Q2S6E2V114331288−10.1%889−38.0%1303−9.1%
Q4S3E2V114521214−16.4%910−37.3%1282−11.7%
Q4S5E2V116271393−14.4%1063−34.7%1429−12.2%
Q4S6E2V117611565−11.1%1278−27.4%1693−3.9%
Q6S6E2V1178918211.8%1580−11.7%18644.2%
Q6S6E2V518591821−2.0%1580−15.0%18640.3%
Q2S6E6V1666491−26.3%412−38.1%656−1.5%
Q4S3E6V1603426−29.4%424−29.7%6111.3%
Q4S5E6V1654523−20.0%505−22.8%7068.0%
Q4S6E6V1761656−13.8%622−18.3%87214.6%
Q6S6E6V1843803−4.7%787−6.6%96414.4%
Q6S6E6V5932803−13.8%787−15.6%9643.4%
Table 6. Specimens under finite element analysis.
SpecimenConcreteRelative EccentricitySimulation Results
Q6S6E2V1C500.21317
Q6S6E2V1-C80C800.21735
Q6S6E2V1-C100C1000.21841
Q6S6E6V1C500.6815
Q6S6E6V1-C80C800.6924
Q6S6E6V1-C100C1000.6957
Publisher’s Note: MDPI stays neutral with regard to jurisdictional claims in published maps and institutional affiliations.

