Article

Optimization of Useful Daylight Illuminance for Vertical Shading Fins Covered by Photovoltaic Panels for a Case Study of an Office Room in the City of Wroclaw, Poland

1
Faculty of Architecture, Wroclaw University of Science and Technology, Prusa 53/55, 50-317 Wrocław, Poland
2
Faculty of Mechanical and Power Engineering, Wrocław University of Science and Technology, Wybrzeże Wyspiańskiego 27, 50-370 Wrocław, Poland
*
Author to whom correspondence should be addressed.
Buildings 2021, 11(12), 637; https://doi.org/10.3390/buildings11120637
Submission received: 2 November 2021 / Revised: 6 December 2021 / Accepted: 7 December 2021 / Published: 10 December 2021
(This article belongs to the Special Issue Buildings: 10th Anniversary)

Abstract

:
A building’s facade is its main interface with the external environment, as it controls almost all energy flows in the building—losses and gains. In this context, the most recent invention of adaptive façades allows for the introduction of an optimized system for both daylight management and electrical energy production. The authors of the presented paper propose a novel adaptive façade system that is equipped with vertical shading fins of 1 × 4 m that are covered with PV panels. The fins are kinetic and rotate around a vertical axis in order to optimize solar irradiation for producing electricity. The presented adaptive façade is analyzed in two stages. Firstly, the number of vertical shading fins is optimized in the context of useful daylight illuminance (UDI) and daylight glare probability (DGP) using Radiance-cored software. Next, two scenarios of PV installation are verified for fixed and the Sun-tracking solution. The results show that the Sun-tracking system is more efficient than the fixed one, but electricity production is only increased by 3.21%. The reason for this is the fact that—while following the Sun’s azimuth position—fins shade each other and reduce the effective area of the adjacent PV panels. Based on this, the authors conclude that the Sun-tracking system might be justified due to its protective or decorative function and not because of its improved effectiveness in generating electrical energy.

1. Introduction

Buildings account for 40% of the total energy consumption in the European Union, and even more in other countries in which energy-saving policies are not so up-to-date [1]. In December 2019, the European Council set a target of carbon neutrality by 2050 [2,3]. The construction industry is booming worldwide, which may substantially increase the energy demand. In order to help bring about a carbon-neutral future, it is necessary to reduce the consumption of energy from non-renewable sources, as well as to decrease the energy demand through energy-saving environmentally-friendly technologies. The increase in energy gain from renewable sources would simultaneously cut down greenhouse gas emissions.
In fact, more energy is required to cool buildings than to heat them [4]. Therefore—in light of the ongoing climate change and global warming, technologies designed to reduce energy consumption in the warm seasons of the year are receiving particular attention [5]. Any technology that prevents heat build-up in a building translates into energy savings and the reduction of CO2 emissions. This includes shading integration, which “leads to comfortable thermal conditions indoors and also may lead to significant energy savings when compared to a building without shading devices” [6].
A building’s facade is its main interface with the external environment, and it controls almost all energy flows in the building—losses and gains. Given the high expectations for the continuous reduction of CO2 emissions, it has become evident that the current building envelope systems will not be able to satisfy new EU requirements. The invention of the adaptive facade transforms a passive and static facade into a unique system that resembles a living organism, the elements of which react to the changes in the internal and external environment [7]. The hereby proposed adaptive facade is a “complex system that in terms of spatial configurations and the behavior of its external skin” [8] improves the indoor visual comfort in a test room and generates electricity as a building integrated photovoltaic (BIPV) system. On the one hand, this revolutionizes how a building works and how the user’s comfort is achieved, but on the other hand, it also tests the viability of vertical, rotating adaptive shading elements that simultaneously generate electricity. Shading systems are particularly important in this respect because they have a significant influence on the users’ visual comfort.

Identification of the Problem

All-glass facades are used in buildings worldwide, regardless of their orientation and location. All-glass facades originated as an act of protest against low dwelling standards in 19th-century tenement houses and became a part of the so-called “international style”, especially with regards to high-rise office blocks. However, fully glazed facades cause specific problems, especially concerning the microclimate in the room located behind such a facade; these problems include overheating and glare. To prevent problems, systems are being developed that regulate direct solar gain and reduce glare. At the beginning of the 20th century, a solution was to use thin layers of metal on glass, which in turn reflected a large part of the direct insolation. This solution, although effective to a limited extent, was widely criticized, which was mainly due to the broken contact between the inside and outside of the building, as well as the far-reaching unacceptable formal consequences in architecture. At the end of the 20th century, other daylight regulation systems were developed, among which the most popular and energy-efficient systems are those that block insolation before rays of light enter the room and cause the greenhouse effect. Such solutions include systems of external blinds, louvres, curtains, and fins [9].
The emergence of affordable photovoltaic (PV) systems has enabled the evolution of systems with dual functionality, which feature both shading and energy-generating elements. Such a system, in the form of fins that rotate around their vertical axis, is the subject of analysis in the presented article. Firstly, the number of vertical shading fins is optimized in the context of the useful daylight illuminance (UDI) metric. Next, the fins’ surface is considered as a surface covered by photovoltaic panels, which, while gaining solar irradiation, produce electricity. This idea allows the fins to be perceived as multifunctional elements that not only improve the daylight and thermal comfort of office rooms but also constitute an integral element of the building’s energy system.

2. State of the Art

The authors of the paper have provided a systematic literature review concerning the subject of daylight management and electrical energy gain. The data for the literature review were acquired from international scientific databases (WoS and Scopus—last search 20 September 2021). The authors have examined the words in the titles and abstracts of similar studies to specify candidate search terms (“keywords”). Search strategy for all databases included the papers with keywords: “daylight”; “PV facade”; “PV electricity production”. The scientific method applied in the paper includes the simulation of shading elements, therefore, the references from this were also included. Study selection was a multi-stage process. Screening of titles and abstracts allowed for the identification of potential studies for inclusion. It became evident that “daylight” and “PV electricity production” were a subject of many studies in the span of the last 20 years in the discipline of building engineering. In the discipline of daylight simulation, a single researcher (M.B.) reviewed the titles in approx. 970 published papers in the years 2017–2021. In the discipline of PV energy production, two researchers (P.R. and J.K.) reviewed titles in approx. 480 published papers in the years 2017–2021. After the removal of duplicates, the same team of researchers double screened the abstract from the years 2017–2021. Subsequently, 160 records were screened, from which 34 full-text documents were reviewed, and finally 24 (each cited) papers are included in the literature review: the authors have selected for their detailed studies 17 papers regarding daylight regulation using external blinds and PV blinds, and 7 papers referring to electricity production by PV systems.
The main scientific method for the literature study used was a desk study (a PC with an internet connection); no automation tools were used.

2.1. Literature Review: Standard Blinds and PV Blinds in Different Scenarios

Daylight assessment methodology has been thoroughly discussed in many scientific papers, and the issue of the UDI metric and glare, along with more details regarding the simulation procedure, are discussed in detail in Section 4.2.
Standard blinds in different orientations and PV blinds in different scenarios are a field of vibrant scientific discussion. In 2007, Gratia and De Herde [10] studied the most efficient position of shading devices in a double-skin facade; in 2010, Palmero-Marrero and Oliveira [6] showed the effect of louvre shading devices on the energy requirements of a building; in 2014, Manzan [11] employed a genetic algorithm for the analysis of the most efficient position of shading devices; in 2017, Azmi et al. [12] studied a west-facing window in the context of a green office building; in 2018, Atzeri et al. [13] conducted a performance analysis of different glazing systems coupled with three shading control strategies; in 2021, Brzezicki and Regucki presented a paper including the optimization of the number of shading fins according to two variables: daylight distribution and the drag force induced on the elements of the shading system [14].
PV systems are opaque, and therefore the idea of coupling the PV element with a shading system is a subject of many research papers and continues to be a matter of scientific debate. The most systematic theoretical background for the subject was provided in the Ph.D. dissertation of Alzoubi in 2005 [15]. In 2013, Bahr [16] investigated the performance of an external shading device with integrated photovoltaic panels, which was followed by a comprehensive assessment methodology of the building’s integrated photovoltaic blind system by the same author a year later [17]. In 2014, Kim et al. [18] published a paper concerning BIPV systems integrated with the power system of a building. In 2017, Hong et al. [19] developed a new control method for the slats of bi-directional blinds. Starting from the year 2018, two leading teams, Luo et at. and Kang et al., addressed the issue of PV blinds. The first team addressed multilayer glazing facades using shading blinds, and validated simulated results with experimental data [20,21,22]. The other team worked similarly (comparing simulation and experimental data) on sun-tracking methods for intelligent photovoltaic blinds [23]. The results of the study of Kang et al. in 2019 demonstrated that the technical performance of PV blinds could be improved by up to 24.8% by using the optimal solar tracking method [24,25]. Both teams worked on models and prototypes that featured horizontal louvres. None of the analyzed studies addressed the issues of shading elements in the vertical orientation.

2.2. Selection of Shading Elements

The selection of the type of shading elements was made according to the procedure described in the most recent paper published by the authors [14]. This analysis showed that various types of blinds and shutters are used, which have different angles and orientations. Vertical and horizontal shading devices for southern exposure facades in a dry climate were analyzed by Alzoubi and Al-Zoubi [15], with the conclusion that horizontal shading louvres “can simultaneously provide good daylighting and minimum heat gain in spaces”. Although these types of blinds are effective in terms of illumination uniformity, they also significantly reduce the visual contact between the interior and exterior of the room, in turn preventing the users of the room from observing what is happening outside. Therefore, it is likely that the European Standard EN17037 criteria for the horizontal view angle (required minimum angle of between 14° and 28°) are not met (for the view). In response to this, the presented paper concentrates on the optimization of rotating vertical shading fins that are located along the facade and which track the azimuthal position of the Sun. Moreover, the reasons for the choice of vertical fins are strictly utilitarian ones: (i) there is no accumulation of snow or dust on the vertical fins; (ii) fins in vertical orientation are optimal in terms of mechanical design because the vertical orientation is less susceptible to the forces generated by wind or gravity which lowers the material use and—in the result—the maintenance costs; (iii) fins in vertical orientation provide much better conditions for the outside view according to European Standard EN17037 because they block a smaller portion of the view; (iv) previous research proved that vertical fins can regulate the level of daylight inside a room successfully while significantly reducing the drag force, see [14]. However, it has to be noted that in areas without shading, patches of very high brightness occur, which disturbs the outside view in large offices, as addressed by Katunský et al. [26].

2.3. Photovoltaic Installations as a Part of a Building’s Energy System

Photovoltaic cells are a renewable energy source that is considered as an alternative to electricity production from fossil fuels. The three most popular types of photovoltaic cells can be distinguished: monocrystalline, polycrystalline, and amorphous silicon panels. They are widely used in numerous industrial and urban installations [27]. Reducing the weight of the PV cells, while also increasing the efficiency of solar energy conversion and the ease of installation has made photovoltaic panels an attractive architectural solution. The standard approach to the problem of a building-integrated PV installation is presented, e.g., by Bahr [28], who investigated a home building case study and considered different aspects, such as energy demand, energy price, and solar intensity. Particular attention when considering the utilization of PV installations is focused on public buildings, which usually have a high demand for electricity and heat all year round. Radomski et al. [29] presented a case study of a multicriteria decision for the selection of a PV installation that provides electrical energy to a public utility building. They identified the technical, economical, energy, and environmental aspects that need to be considered as the main criteria when making decisions concerning the planning and development of energy supply systems. A similar approach to the optimization model for a building envelope retrofit with a roof-top PV installation is presented by Fan and Xia in [30]. They considered the retrofitting of old buildings with a roof-top PV installation as an effective method for improving their energy efficiency. The idea of installing PV cells on the facades and roof-tops of newly erected and existing buildings in order to improve their long-term sustainability of energy was also studied in [31]. Atmaja [32] analyzed building-integrated photovoltaic (BIPV) systems for optimizing electricity production from a building envelope. He noticed that facades and roof-tops could be treated as a part of an external building’s envelope to be used for the PV installation. Vulkan et al. in [33] estimated the electricity generation by building-integrated PV systems in typical residential buildings in dense urban locations, accounting for shading by adjacent structures. They developed a 3D model of the shadows cast by adjacent objects with regards to different types of buildings., which was tested on a case-study neighborhood in Rishon LeZion, Israel.
In light of the above literature review, the vertical or horizontal fins initially installed on facades to shade the interior of office buildings can be seen as an attractive place for PV installations. Thus, the analysis of the BIPV system presented in this paper is part of a mainstream study concerning self-sufficient, intelligent building management systems. The estimation of electricity gain is conducted for both a fixed system and the Sun-tracking system of fins in order to evaluate the possible energy yields of an office room located in Wroclaw, Poland.

3. Objectives

The main goal of the presented study was to evaluate the effectiveness of the adaptive shading scenario of the south exposed facade of an office room (with an area of 72 m2) based on the results of computer simulations. Calculations were conducted for the case study of an office room located in the city of Wroclaw (Poland, 51 North latitude).
This effectiveness was the subject of a two-stage assessment with regards to the following criteria:
  • the appropriate level of daylight illumination based on useful daylight illuminance (UDI300-3000). The EN17037 standard states that at least 50% of an area should be illuminated for at least 50% of the time, and therefore the aim was to simultaneously maximize the time and the area;
  • the evaluation of the amount of electricity generated by PV panels covering shading fins in both the fixed and tracking scenario.
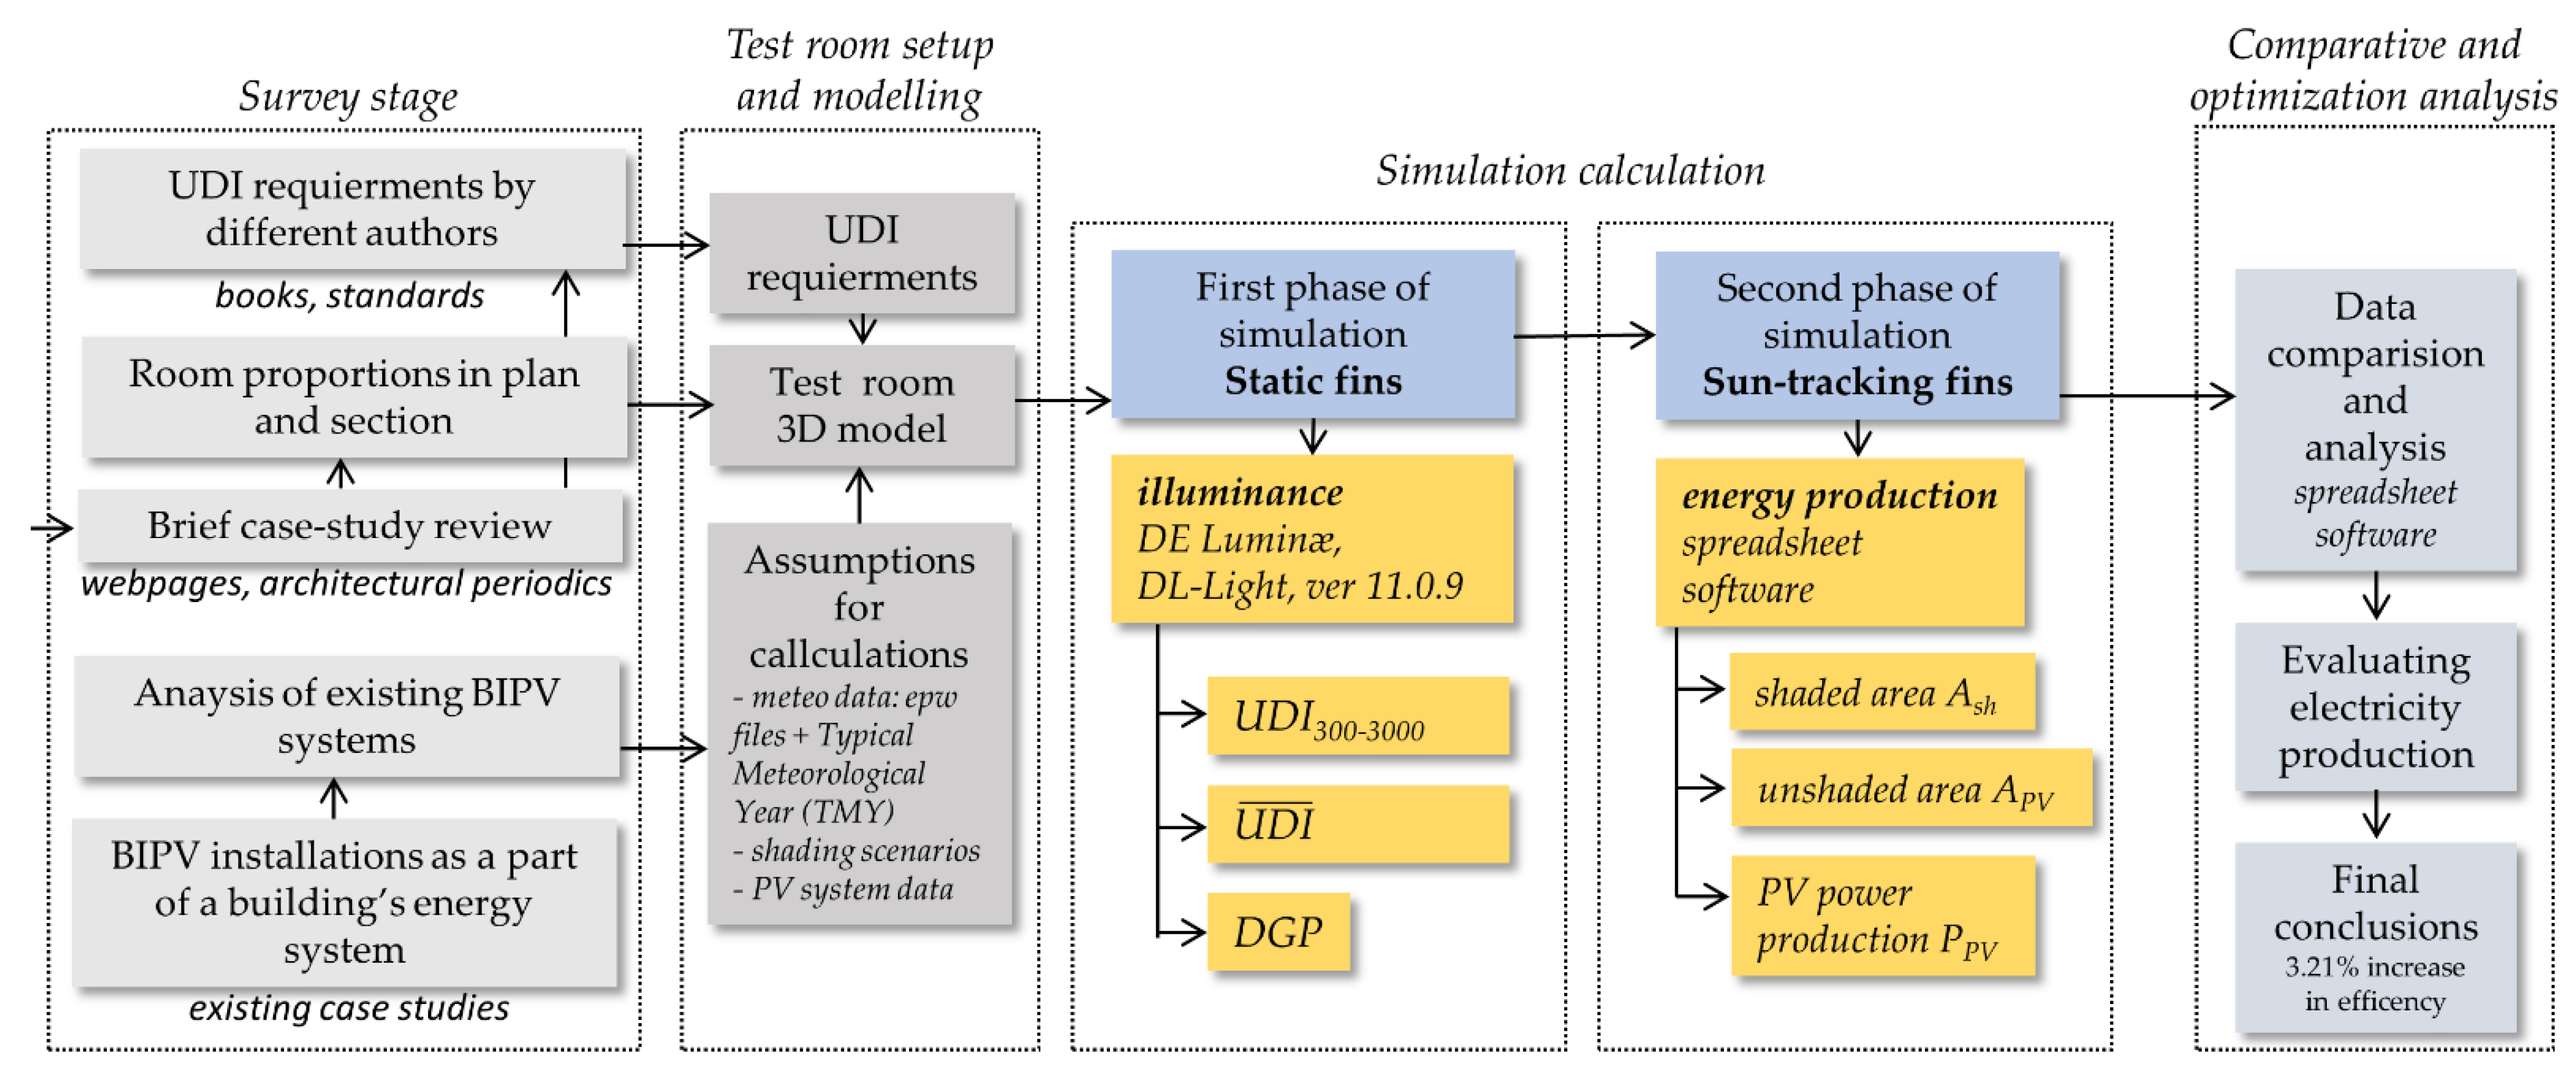
According to the presented methodology, the assumption is made that it is possible to determine the optimal number of vertical shading fins according to daylight requirements and assess the effectiveness (or not) of their kinetic scenario regarding the production of electricity from the BIPV system.

4. Method

4.1. Optimization Procedure

The optimization procedure was performed in two stages. In the first stage, the authors focused on defining the optimum number n of vertical fins while taking into account useful daylight illuminance (UDI) and DGP. The optimum solution should provide the maximum number of hours with the illumination in the range of 300–3000 lx for the maximum possible area in the room during the office hours 09:00–17:00. Fixed (static) fins located parallel to the surface of the facade were used in the first stage of the research. A clear facade (no fins, n = 0) was assumed as the reference. In the preparatory stage of the research, it became clear that the optimal number of fins nopt must be between 1 and 12. This is because the gradual increase of the number of fins leads to a situation of the total blockage of light for n = 12. Therefore, the first stage aimed to determine the proper number of fins nopt for the optimal illumination of the office room. In this solution, avoiding the over-illumination, glare, and potential overheating of the room (which might result from the excessive solar gain) should also be considered. The results, given in the UDI300-3000 metric, describe the percentage of the floor area that meets the range of 300–3000 lx for the number of hours according to the false color scale.
Daylight simulations were made using De Luminae software (DL-Light platform, ver. 11.0.9, DL-Instant, ver. 6.1.4). The core of the De Luminae engine uses a tool of established prestige—Radiance, which was previously validated by other researchers. Reinhart and Walkenhorst prove that Radiance based simulation methods “are able to efficiently and accurately model complicated daylighting elements” [34]. The validation studies, which were carried by Ng et al. [35] in Singapore, “showed that Radiance can be used to predict the internal illuminance with a high degree of accuracy”. Also, as Yoon et al. [36] state: “Radiance, which is validated computational software and is well known to provide reliable prediction results under various sky conditions”. Additionally, De Luminae is commercial software, which was also validated by the producer De Luminae SARL.
In the next stage, after the optimal number of fins was determined in daylight simulation, the authors verify which type of PV panel installation (either fixed or Sun-tracking) generates more electricity. The rationale is that if fixed fins provide adequate daylighting comfort, then presumably tracking fins will also provide at least the same comfort, as was the case in the fixed scenario.

4.2. The Choice of Daylight Metric

In the presented paper, two metrics were used to evaluate visual comfort: (i) useful daylight illuminance (UDI300-3000) and (ii) daylight glare probability (DGP).
  • UDI300-3000 metric specifies the percentage of the floor area that meets the illuminance range between 300–3000 lx for a given number of daylight hours (for detailed results, see Section 5). This metric was chosen as a result of the ongoing scientific discussion that was concluded in the paper titled “A comparison of four daylighting metrics in assessing the daylighting performance of three shading systems” by Boubekri and Lee [37]. UDI was proposed by Nabil and Mardaljevic in 2005 in the paper titled “Useful daylight illuminance: a new paradigm for assessing daylight in buildings” [38]. UDI, unlike the obsolete daylight metrics, e.g., the daylight factor, is constructed so that the real weather data are taken into account. Therefore “UDI represents the annual occurrence of daylight illuminances falling within the given range” [37]. In the literature, authors consider different intervals of illuminance values, but the value of 3000 lx is commonly used as the maximum threshold. Therefore, based on the scientific literature, this maximum value was also applied in the presented calculations. Suk et al. [39] published a review of different glare discomfort thresholds, the summary of which is presented in Table 1.
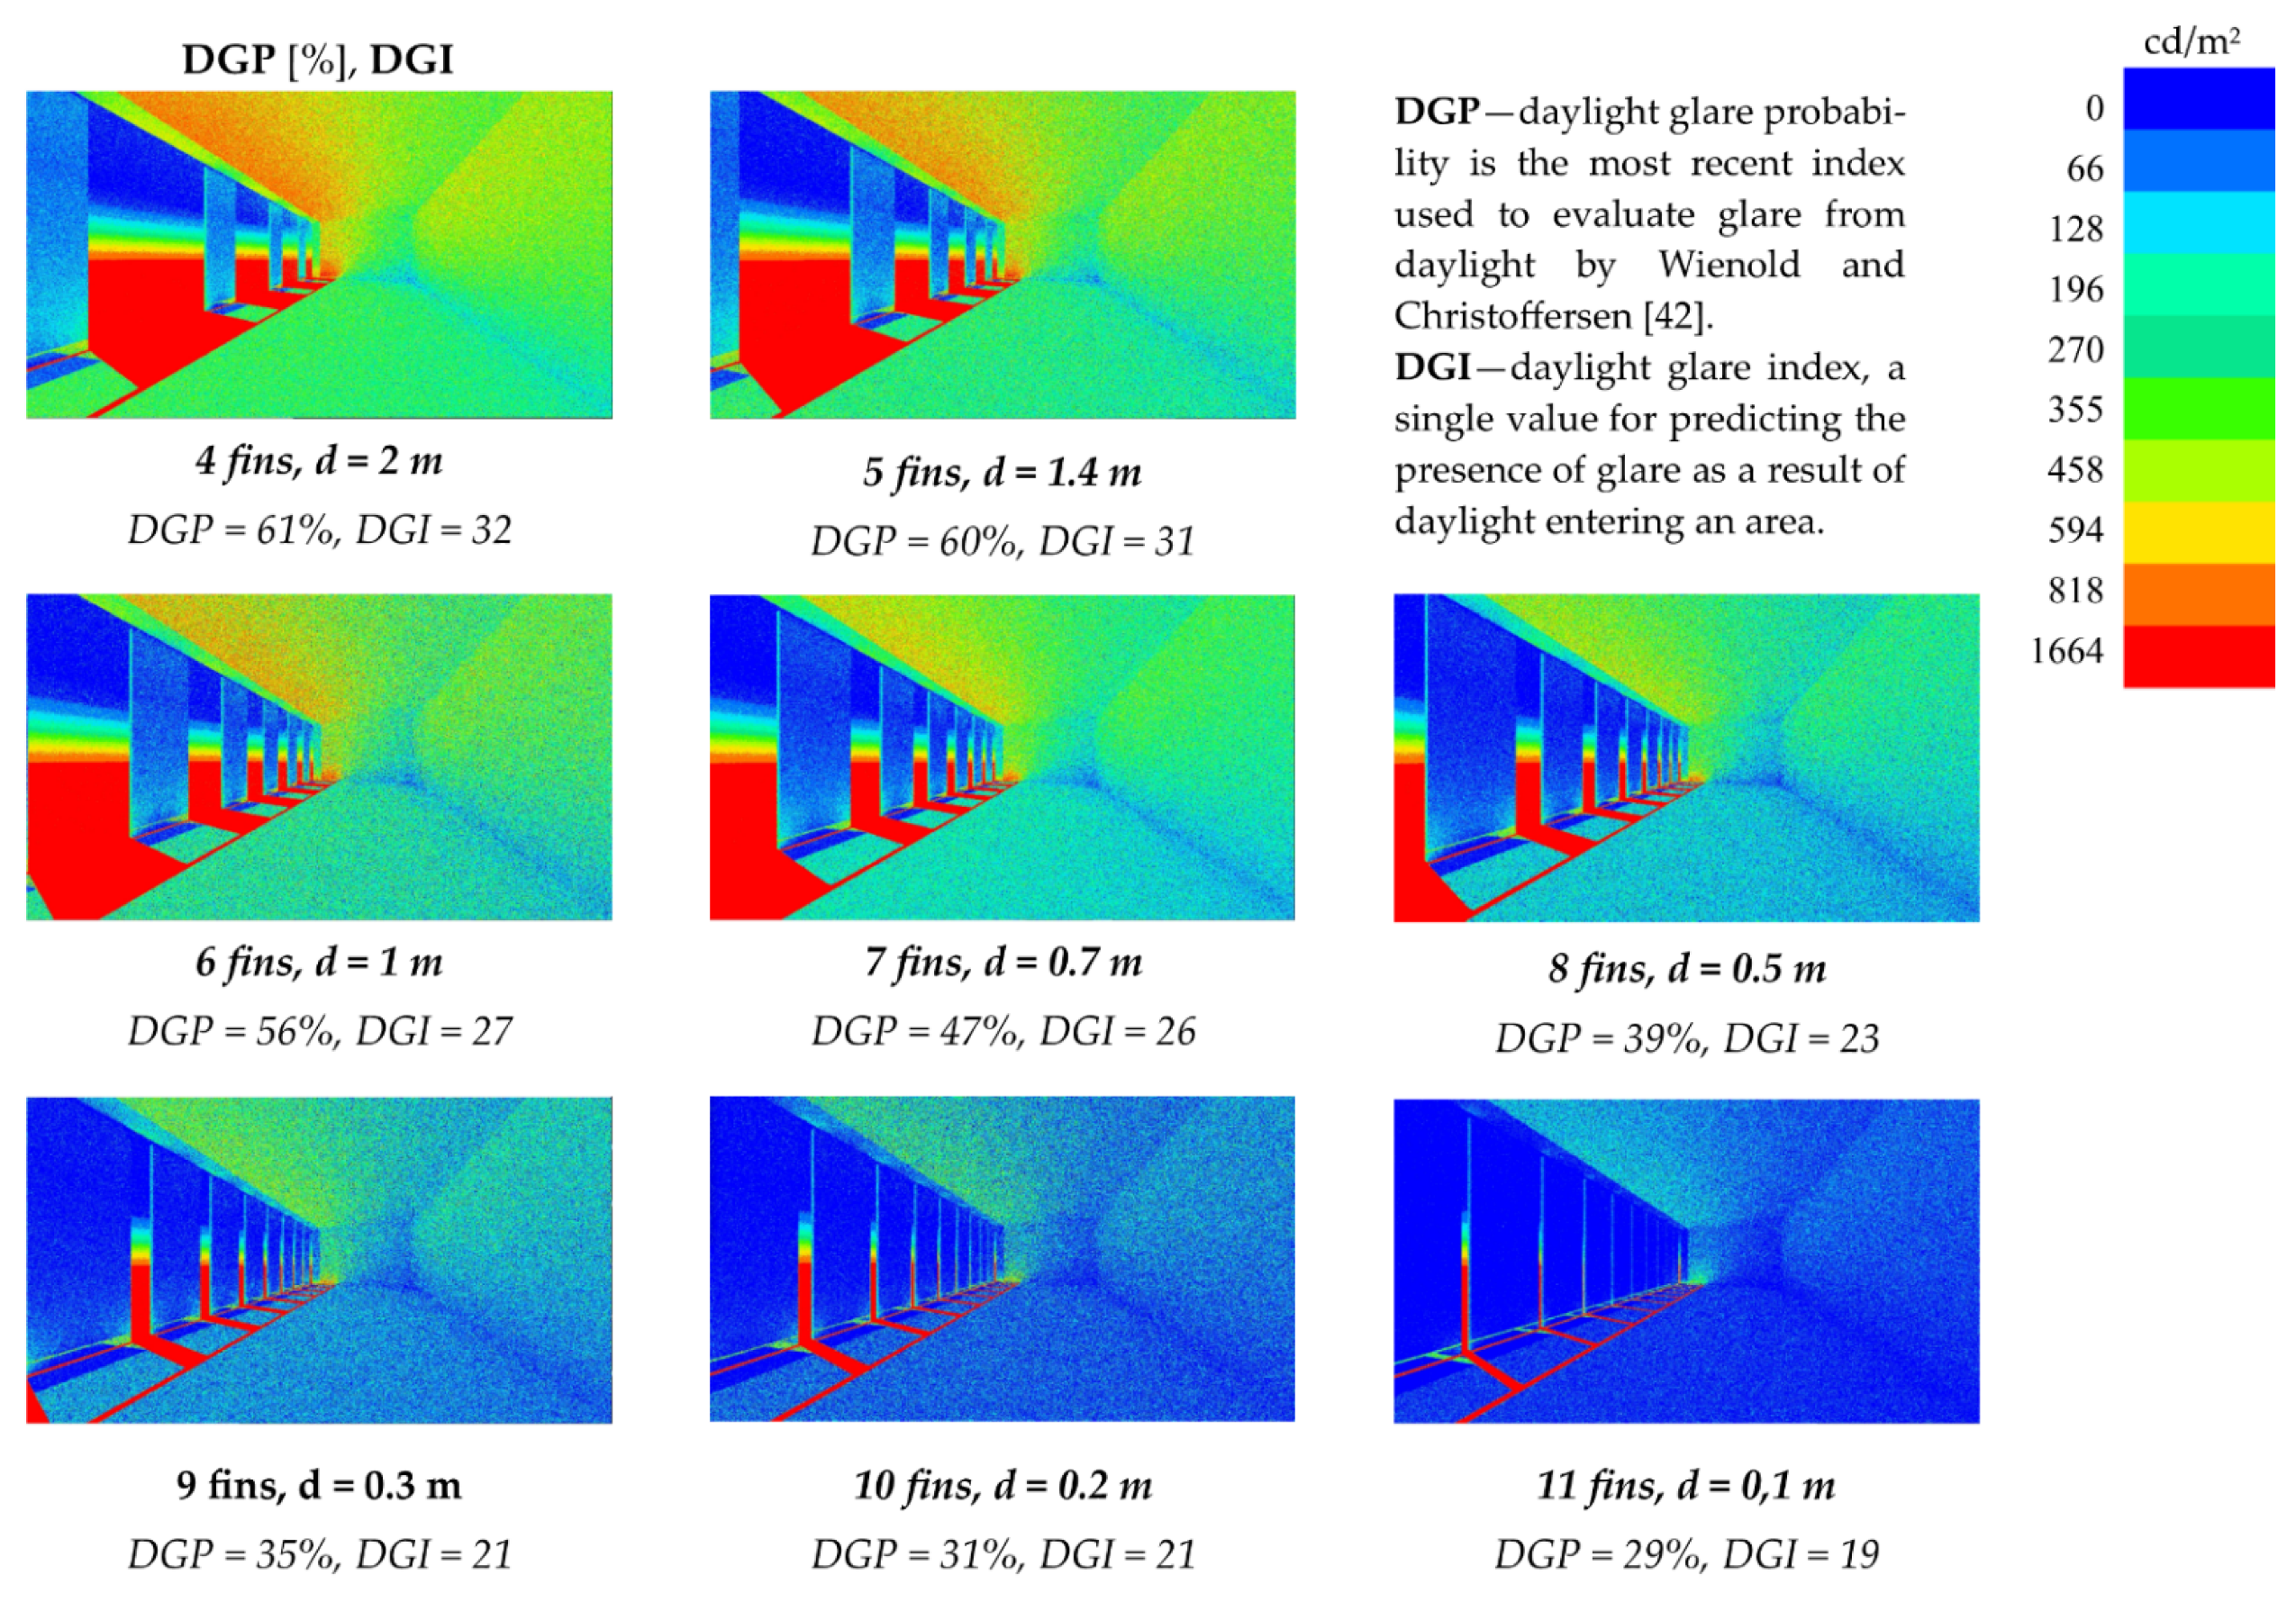
  • Daylight glare probability (DGP, expressed in %) was defined for the first time by Jan Wienold at the Fraunhofer Institute for Solar Energy Systems [40]. DGP is higher when the luminance increases, with some influence on the direction of the view. As Wienold and Christoffersen claim that DGP above 35% the glare is rated as “perceptible” while with DGP above 45% the glare is “intolerable”. DGP in the presented paper was calculated automatically using the below-presented Formula (1):
DGP = 5.87 · 10 5 · E v + 9.18 · 10 2 · log ( 1 + i L s ,   i 2 · ω s , i E v 1.87 · P i 2 )
where Ev is the vertical eye illuminance (lx); Ls is the luminance of the source (cd/m2); ωs is the solid angle of the source, and P is the position index (see Reference [40]).

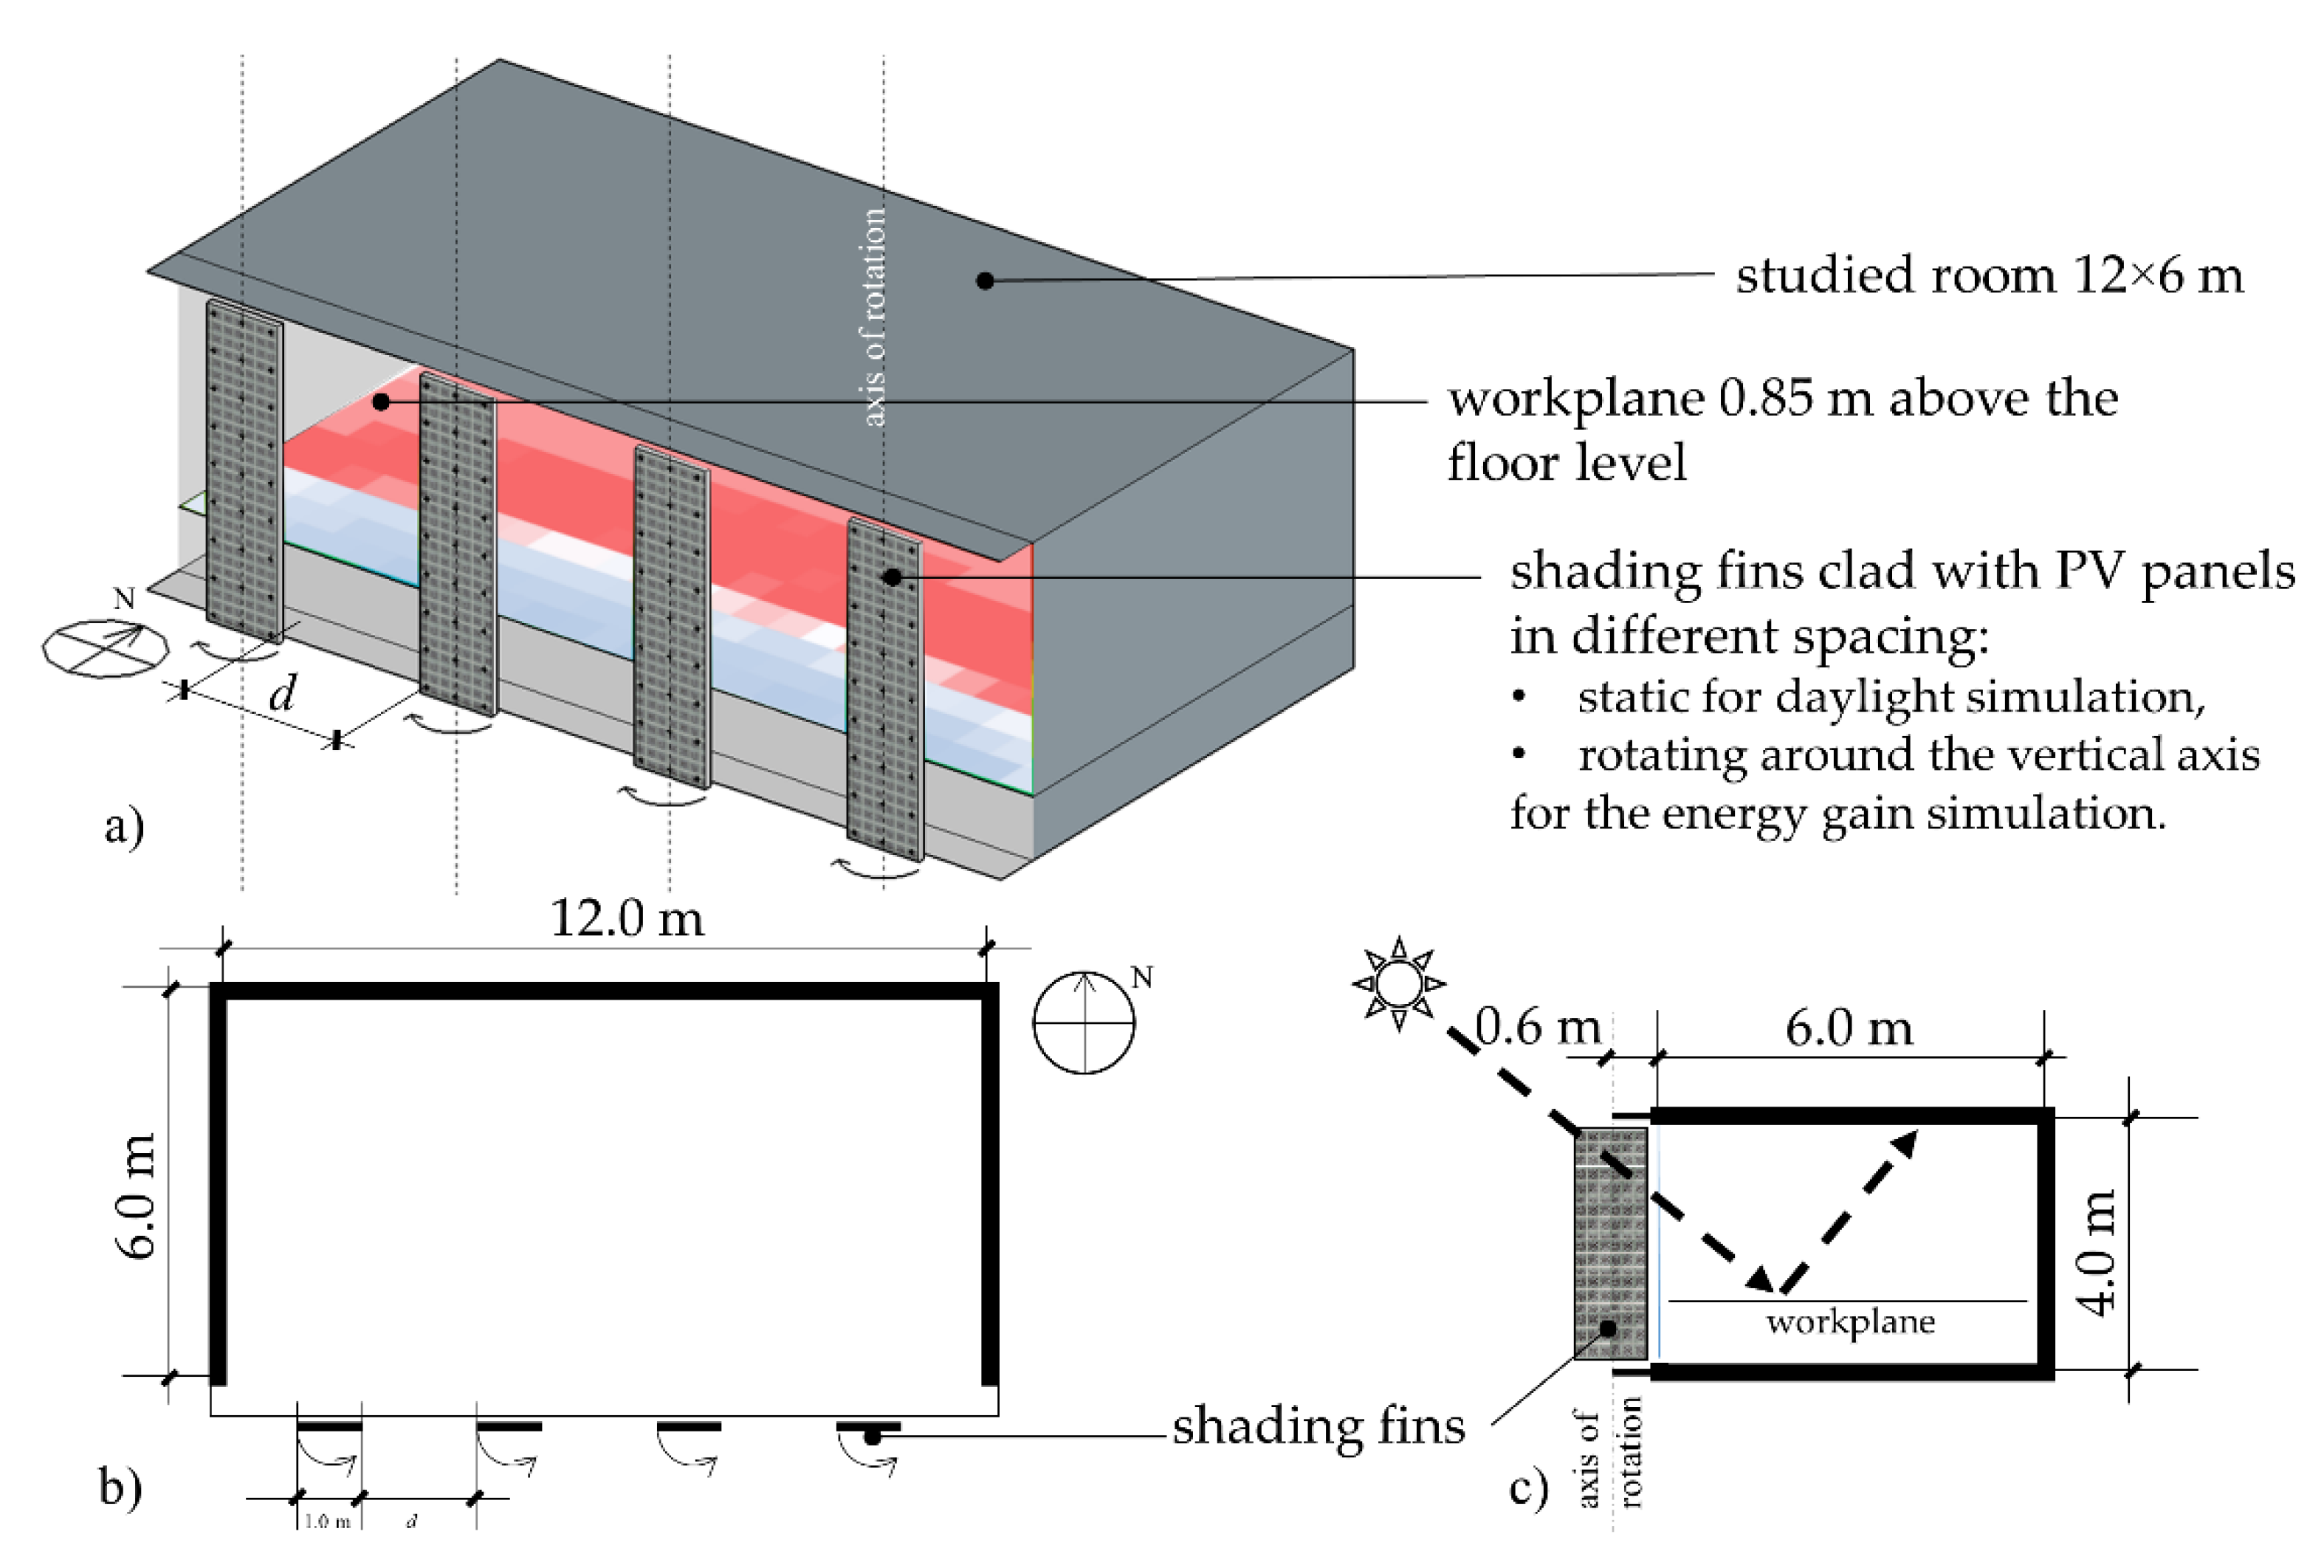
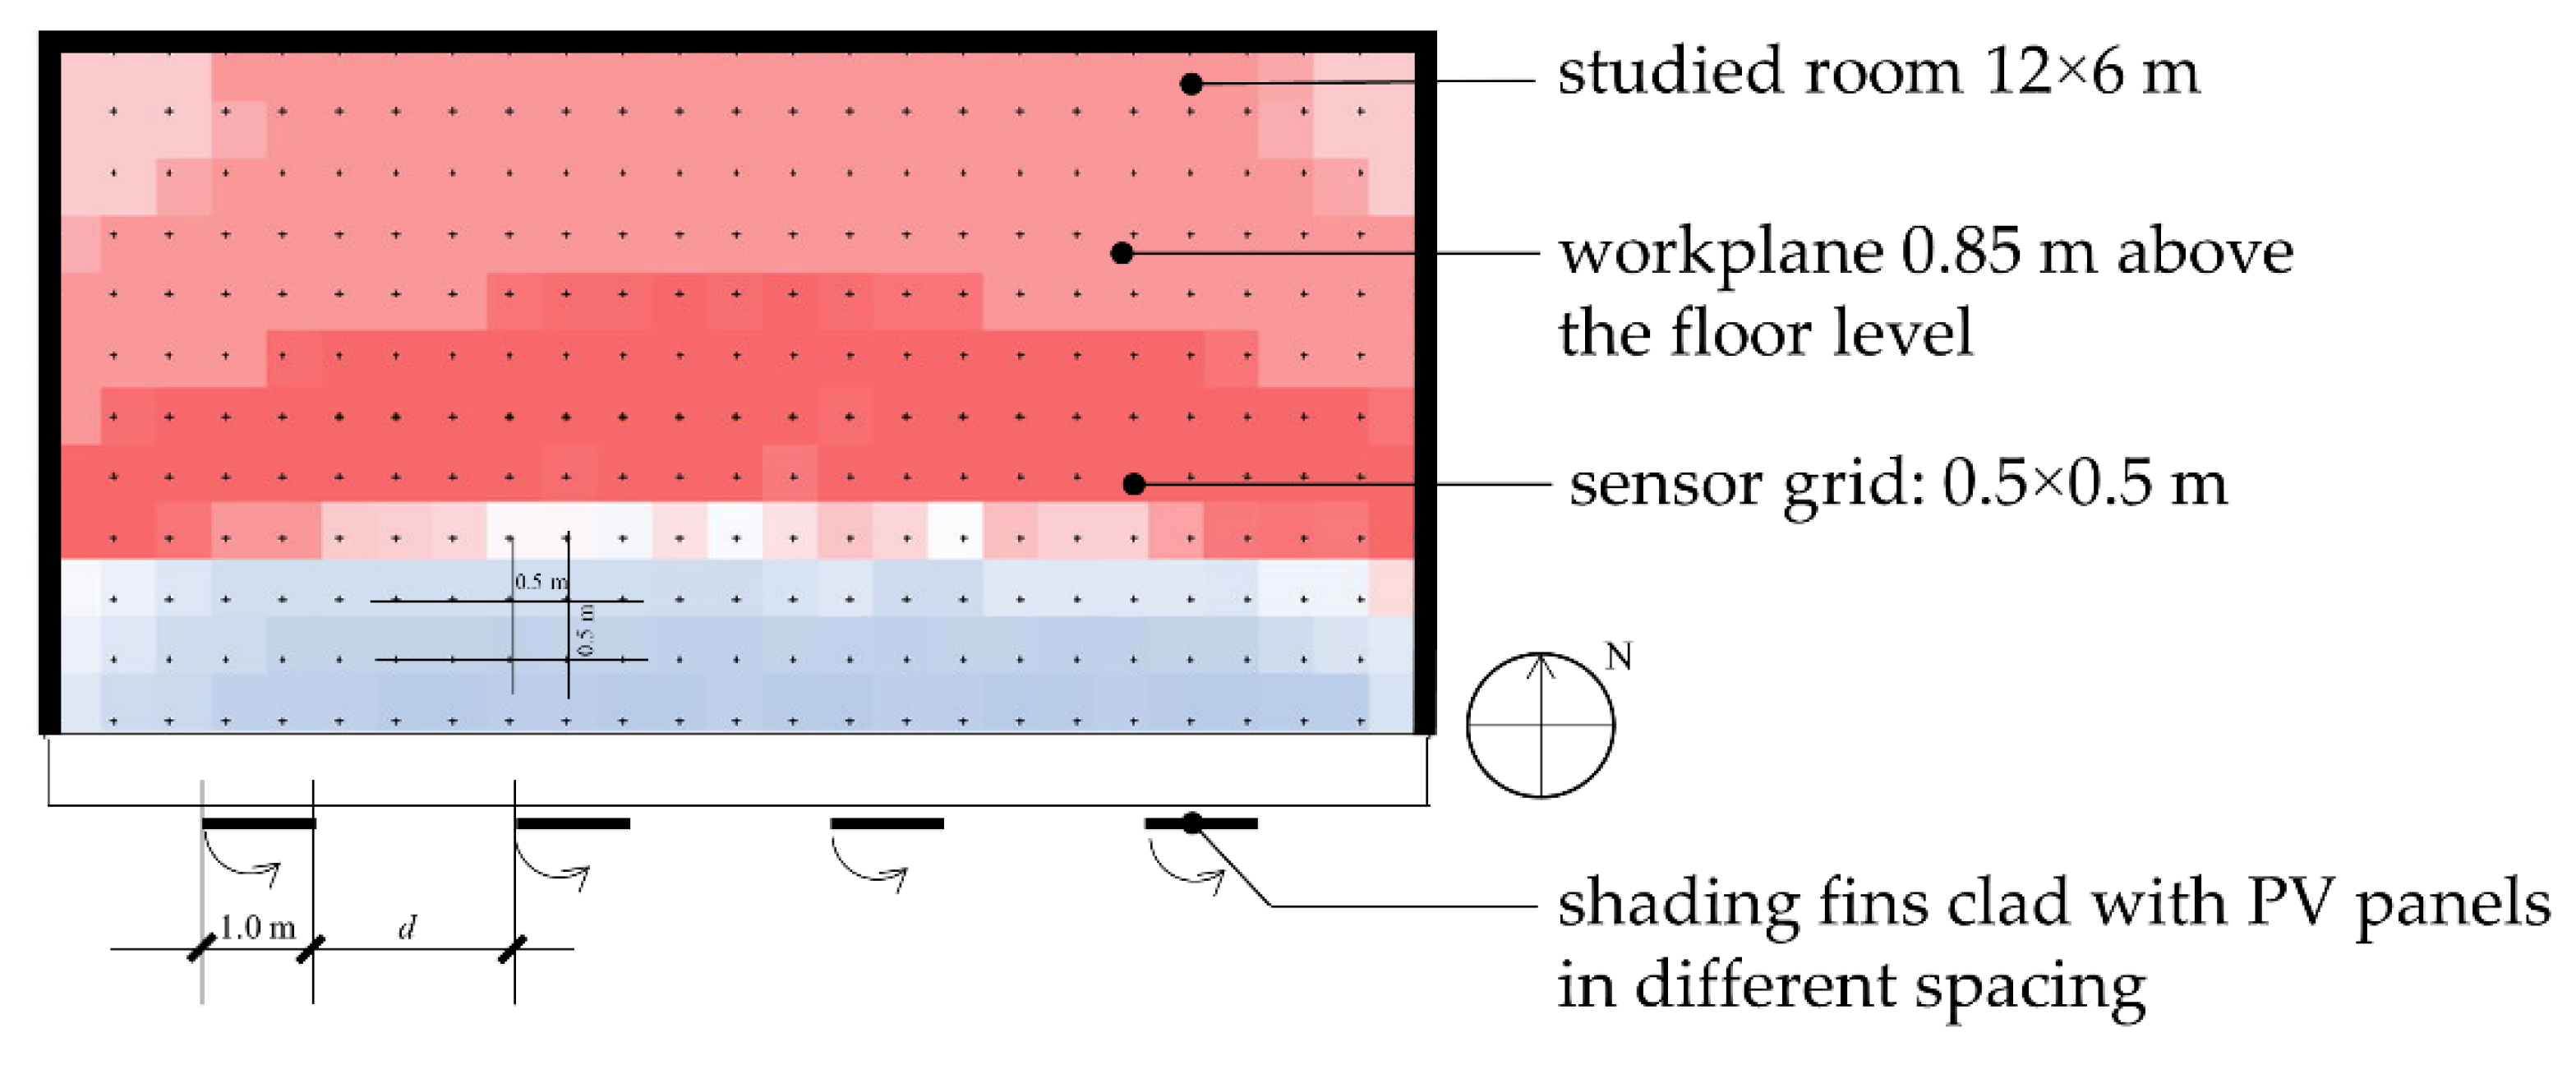
4.3. Experimental Setup for Simulating UDI, DGP/DGI, and Electricity Production

This paper aims to analyze the influence of different spacings between shading elements on the visual comfort measured using the UDI300-3000 metric and DGP/DGI. The room that is the subject of the analysis is a 12 × 6 m office room (72 m2 area, 6 m depth) with a height/clearance of 4.0 m. The long side of the room faces directly south, and the south facade is entirely clad in glass. In the simulation, the glass with the daylight transmittance of 0.52 is used, which is analogous to the Insulating Glass Unit made of Pilkington Suncool™ OW 50/25, as given by Pilkington in [45], which would be conventionally used at the surface of the south-exposed facade. The vertical fins were located at a distance of 0.6 m from the surface of the facade in a parallel position in relation to the surface of the facade. They have a rectangle shape and dimensions of 1 m (width) × 4 m (height). For the first stage of the simulation (daylight), the fins are in a fixed (static) position, parallel to the surface of the facade. For the second stage of the simulation (energy generation), the fins track the Sun position by rotating around their vertical axis of symmetry. The PV-covered surface of the fin is always perpendicular to the direction of the sunlight in the horizontal plane. Each fin has a surface of 4.0 m2, and the side of the fin, which is always oriented towards the Sun, is covered by PV cells. This PV system generates electricity as a sustainable and renewable source of energy to be used for the internal needs of the building. A schematic diagram of the method is given in Figure 1.

4.4. Assumptions for Daylight Analysis

The UDI300-3000 and DGP/DGI calculations were carried out for the city of Wroclaw, which is located in Poland (in Central Europe) on the 51 North latitude. The real weather data files, recorded by the Institute of Meteorology and Water Management of the National Research Institute in 2017, were used to simulate the insolation. The data was retrieved in *.epw format from the site of Energy Plus+ software [46]. The geometrical model of the office room was made using SketchUp (3D-modeling software), and the daylight simulations were made using De Luminae software (DL-Light platform, ver 11.0.9, DL-Instant, ver. 6.1.4). Figure 2 shows the simulation setup. The values of illuminance were calculated by virtual sensors placed at the grid of 0.5 × 0.5 m in the office room, as shown in Figure 3.
The UDI300-3000 calculations were performed for the worst-case scenario from the point of view of visual comfort in the room, for the days with the longest daylight duration in the year. This circumstance occurs in Wroclaw for the period of 31 days, from 9 June to 9 July. The simulation was carried out for every hour in the above defined period, however, the results were presented only for 168 working hours, taking into account the occupant schedule in the range of 09:00–17:00 h. Calculations were performed in incremental steps for the number of fins from 4 to 11. This range of fins was selected because the previous research conducted by the authors in [14] showed that: (i) less than 4 fins do not effectively change the daylight distribution in the room (half of the work plane is exposed to the values of 3000 lx and more); (ii) 12 fins block the daylight completely. In the numerical calculations, the 31-day period was selected in order to average the weather data and exclude the influence of single overcast days on the final results (if the shorter interval would be selected).
DGP/DGI was calculated automatically using the DL-Instant, ver. 6.1.4. The calculation of DGP/DGI and the estimation of glare were performed on 4 July (in the middle of the assumed test period), at 12:30 for a person of average height (1.8 m) standing inside the room looking west. This particular day and the time of the day was chosen because of the high Sun altitude in the sky. Bright patches of light were one of the most significant factors contributing to the glare sensation. The radiance materials (used both for UDI300-3000 and DGP/DGI) and the relative parameter values of the surfaces, glazing, and solar shading screens are shown in Table 2.

4.5. Electricity Generation Assumptions for the Calculations

Types of photovoltaic technologies and systems are well described in academic textbooks [47,48]. In the presented case study, the authors analyzed the possibility of producing electricity by a PV installation consisting of monocrystalline panels. This type of panel is popular in domestic and industrial systems due to its relatively low price, easy installation, and low operating costs. The product warranty given by the producer is 12 years, and the power warranty is 90% and 80% of the nominal output power after 10 and 25 years, respectively.
Solar radiation and ambient temperature have an important influence on the power production of a photovoltaic panel. The PV power production PPV is described by Equation [47,48,49]:
P PV = P m a x G I G STC ( 1 γ 100 ( T NOCT T c e l l ) ) · η i n v · η w i r e · N
where:
Pmax—the rated maximum power, W/panel;
GI—current global irradiance, W/m2;
GSTC—solar radiation in standard test conditions (STC), W/m2;
γ—the temperature coefficient of Pmax, %/°C;
Tcell—current cell temperature, °C;
TNOCT—normal operating cell temperature (NOCT), °C;
ηinv and ηwire—the efficiency of the inverter and wire, respectively;
N—the total number of PV panels.
For the considered panel, the standard test conditions are: GSTC = 1000 W/m2, cell temperature TSTC = 25 °C and AM1.5G. The cell temperature is TNOCT = 45 °C under normal operating conditions: GNOCT = 800 W/m2, ambient temperature Ta,NOCT = 20 °C, wind speed of 1 m/s and AM1.5G. The current cell temperature Tcell is described by the Equation:
T c e l l = T a , DBT + G I G NOCT ( T NOCT T a , NOCT )
where Ta,DBT is the current ambient temperature of the dry-bulb thermometer. During the day, the cell temperature Tcell changes with solar radiation GI. Therefore, the calculations of electricity production were done within 1-h time intervals applying the meteorological data collected in the Typical Meteorological Year (TMY) database for Wrocław city, Poland [50].

5. Results and Discussion
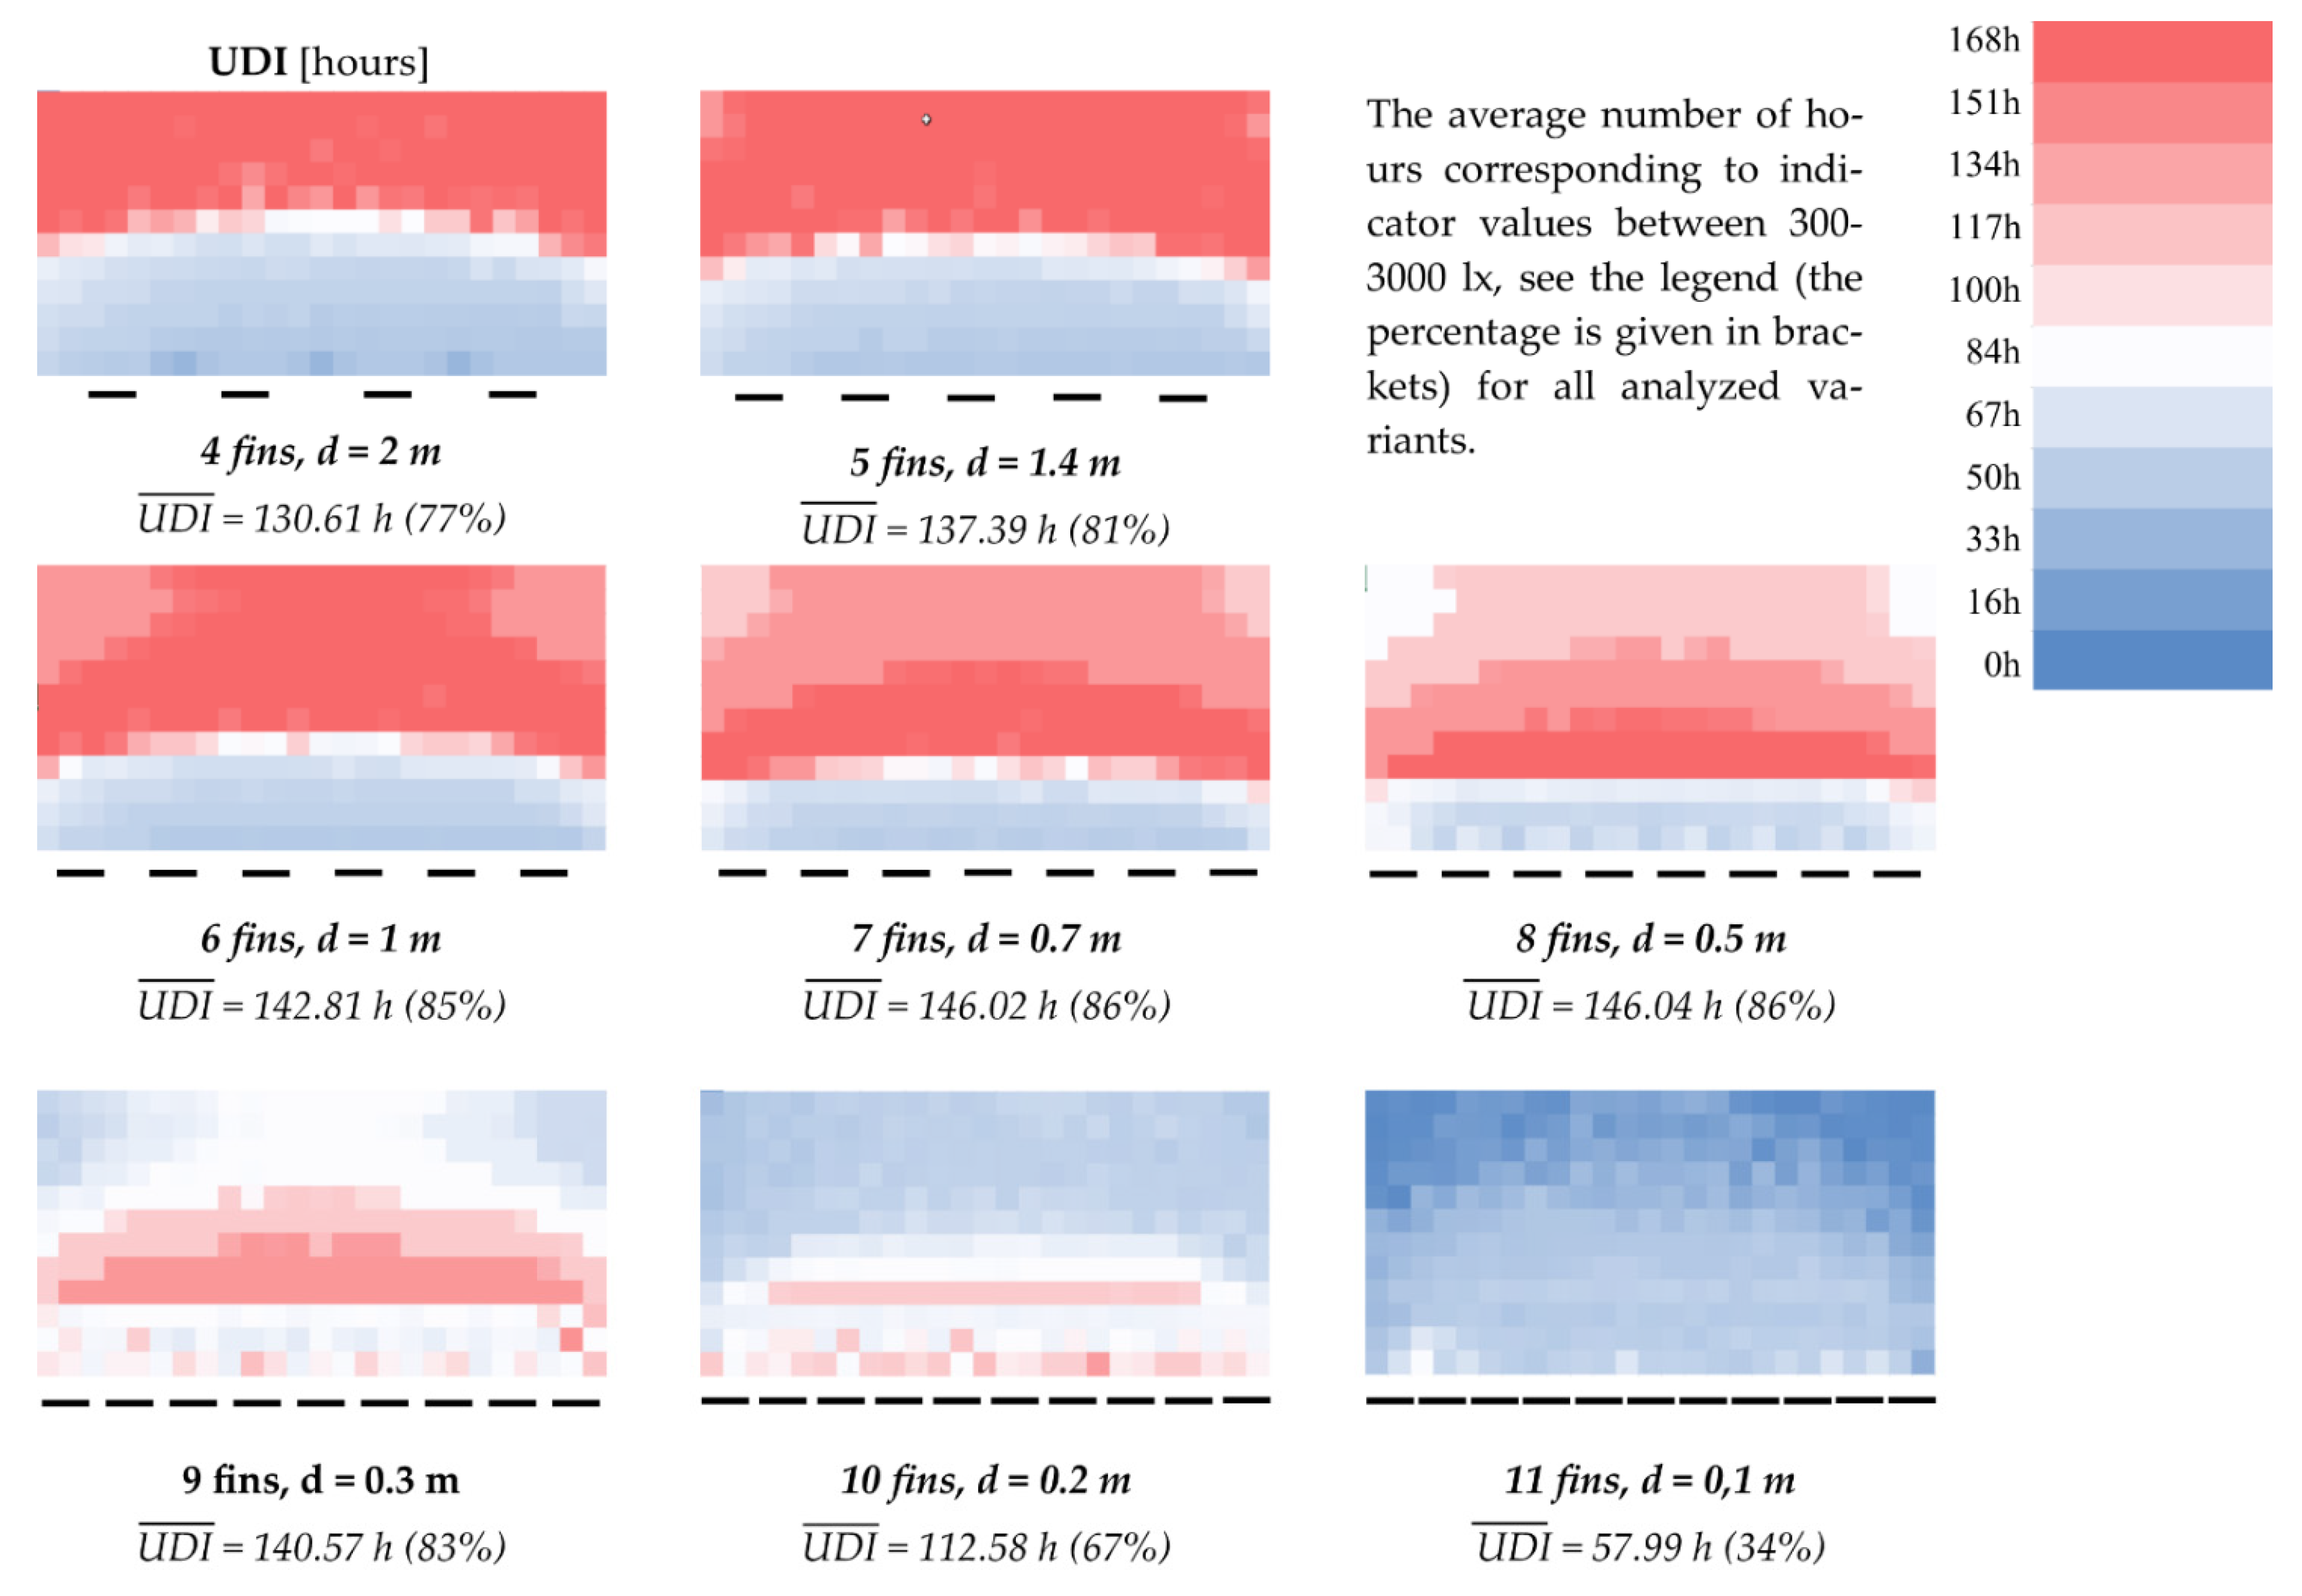
5.1. UDI Metric

Daylight analysis was carried out for fixed fins located parallel to the facade. The numerical calculations were conducted for the number of fins ranging from 4 to 11 evenly spaced along the length of the entire facade. The distance between adjacent fins was described as spacing d. The results of the daylight calculations are presented in the form of the false-color-scale diagrams in Figure 4 and the form of the data in Table 3.
In Figure 4, the colors refer to the number of hours that meet the illuminance conditions in the range of 300–3000 lx at the level of the work plane. Two metrics were used to assess the optimal number of fins: (i) percentage of the work plane area that falls in the range of 300–3000 lx for a specified number of hours and (ii) mean U D I ¯   (see Figure 4 and Supplementary Materials for the results).
All the UDI300-3000 results in Table 3 are calculated for 168 office hours in the 31-day period (from 9 June to 9 July). Generally, the results show that a large part of the work plane area was correctly daylit throughout the whole simulation period. This especially applied to the part which was located deeper into the office room (larger distance from the glazed facade). In turn, a part of the work plane area located closer to the glazed facade was overexposed, especially if a small number of fins was used for shading. For example, the simulation for four fins shows that more than half of the work plane area was overexposed for more than half of the simulation time (84 h out of 168 in total). However, for the specified model setup, the UDI300-3000 had an interesting tendency. From the data presented in Table 3, it can clearly be seen that the increase in the number of fins to seven caused a gradual increase in the work plane area for which the UDI criteria were satisfied for a longer period of time. From nine fins onward, the tendency was reversed, and the UDI values gradually decreased. This behavior is explained by the obvious fact that less daylight is admitted to the office room when there are more fins. Initially, the visual comfort is improved with the increasing number of fins (fewer hours and less area illuminated above 3000 lx), but the further addition of fins resulted in a worse penetration of daylight (more hours and more area illuminated below 300 lx). As was mentioned above, according to EN 17,037, at the first stage of simulation, the number of fins was optimized simultaneously towards two parameters: (i) the longest period of time (expressed in the number of office working hours) and (ii) the maximum area for which the illuminance satisfied the desired range of 300–3000 lx. When studying the data from Table 3, it is easy to notice that this percentage exceeded 70% of the work plane area for n = 7 and 8 fins. Simple observation showed that for n = 7, the largest part of the work plane area was occupied for the longest time interval (151–168 h), but it was not a decisive argument. The data presented in Table 3 must be analyzed using statistical tools. For each value of n, information about the work plane area is presented in the form of the surface distribution of grouped data arranged into 10 class intervals (from (0–16) up to (151–168)). Figure 5 presents the histograms of the surface distribution of the grouped data for n = 7 and 8.
When analyzing the histograms, it can clearly be seen that for n = 8, the largest work plane area was occupied for the longest time. Therefore, for the time period of 100–168 h, the UDI300-3000 metric was fulfilled on 66.94 m2 for n = 8 when only on 63.41 m2 for n = 7.
To decide which value of n is optimal (7 or 8), the mean value of office hours m ¯ (for which the UDI metric is satisfied) was calculated using the formula:
m ¯ = 1 A t o t   i = 1 10 m ¯ i · A i
where: Atot—total work plane area equal to 72 m2, m ¯ i —middle of the i hour interval; Ai—work plane area for the i hour interval. The i variable numerates the hour intervals (i = 1, …, 10).
Using (4), the mean value m ¯ is equal to 145.2 h and 147.6 h for n = 7 and 8, respectively. Based on this, the authors established that the optimum number of fins nopt is 8. The results of mean U D I ¯ and DGP (see below) also support this choice (146.02 h for 7 fins and 146.04 h for 8 fins, respectively).

5.2. DGP Metric

DGP/DGI analysis was carried out for fixed fins located parallel to the facade. The results of DGP calculations are presented in the form of the false-color-scale diagrams in Figure 6.
In general, the results of the glare analysis DGP/DGI confirm the results that were obtained using UDI300-3000. The variants with fins from 4 to 7 were characterized by very high or high values of DGP (61, 60, 56, 47%, respectively) or DGI (32, 31, 27, 26, respectively). With 8 fins, the value of DGP dropped below 39%, which generally signifies perceptible glare (35% ≤ DGP < 40%), but not disturbing (40% ≤ DGP < 45%), while the value of DGI is 23, which was in the range of acceptable values (22 ≤ DGI < 24). For variants with fewer fins, the glare was obviously lower, down to the level of imperceptible glare (DGP < 35%), but as could be concluded from the analysis of UDI, the illuminance dropped below the accepted levels, therefore, those variants were rejected. See the false-color diagrams presented in Figure 6.

5.3. Electricity Produced by the PV System

In the considered case study, the authors compared two variants of the PV panels:
  • fixed vertical panels that are always oriented towards the south and which are parallel to the facade;
  • vertical panels equipped with a tracking system that always orients their surface perpendicularly to the solar beams.
Each shading fin was constructed from two monocrystalline panels with standard geometrical dimensions (H/W/D) of 1960 × 991 × 40 mm. The maximum power of a single PV panel was Pmax = 350 Wp. Thus, for nopt = 8 shading fins, the total number of PV panels was N = 16. The total electrical power of the considered BIPV system was 5.6 kW. For the considered PV panels, the temperature coefficient of Pmax is equal to γ = −0.38%/°C, and the panel’s efficiency under STC was 18%. The inverter and wire efficiencies were ηinv = 0.97 and ηwire = 0.99, respectively [48,49]. The details of the analyzed PV installation are presented in Table 4.
Based on the Typical Meteorological Year (TMY) database for Wroclaw, Poland [50], the electricity production calculations were conducted for a 31-day period (9 June to 9 July) between the hours of 09:00–17:00. The meteorological data was stored at one-hour intervals, and therefore in the calculations, the authors used global irradiance GI and ambient temperature Ta,DBT as the fixed values during the one-hour intervals. In this approach, the unit of solar irradiance (W/m2) is identical to the unit of energy (Wh/m2).

5.3.1. Fixed Variant

In the first variant, the PV panels were oriented to the South and had a fixed distance from the facade. In this case, they did not shade each other. Based on the TMY database, Equations (2) and (3) allow the total electricity production in the period from 9 June to 9 July between the hours of 09:00–17:00 (8 h) to be calculated.
During these 31 days, the total global irradiance for the 8-h period was 106.2 kWh/m2, and for the 24-h period (whole day) it was 107.5 kWh/m2. This means that the PV panels were exposed to almost 98.8% of the daily solar irradiance during the designated office hours (09:00–17:00). This justifies the fact that the authors only calculate electricity production for the aforementioned office hours.
Based on (2), the production of electricity by 16 PV panels for the 8 h period is 420.7 kWh. It is worth mentioning that the overall energy conversion efficiency was at the level of 12.6% for the considered BIVP system. This is the result of the losses of energy in the inverter and wires, as well as the higher cell temperature Tcell when compared to the standard temperature TNOCT.

5.3.2. Tracking Variant

The tracking position (expressed by angle α) was calculated individually for every single hour from 09:00 to 17:00 for the city of Wroclaw. The TMY database [50] allowed to calculate the values of global irradiance GI for tracking angles α based on GI values for N, NE, E, SE, S, SW, and W azimuth direction. To find a GI value for a particular angle α, the interpolation polynomial of second-order was fitted using the Lagrange method [51].
It is worth mentioning that the rotation of panels could cause the partial shading of the fins by adjacent elements, as illustrated in Figure 7. It is easy to notice that for α = 0°, only the first PV panel was exposed to direct solar radiation. All the other panels were partially in the shadow of the first one. Thus, the shaded part of a panel was affected only by diffuse radiation. On the contrary, for the fixed variant α = 90° and all panels are exposed to direct solar radiation. The criterion that allows us to judge whether partial shading occurred can be formulated in the form of inequality:
z > 2 x + d
where d is the distance between adjacent fins and x, z are the lengths that are marked in Figure 7.
Based on the geometric and trigonometric relationships, one can derive the formulas for z and x:
z = L cos 2 ( α ) sin ( α ) ;     x = 0.5 L ( 1 sin ( α ) )
Formulas (5) and (6) allow the interval of tracking angles α for which shading does not occur to be found. The shading does not occur when (z ≤ 2x + d). For length L = 1 m and spatial distance d = 0.571 m (for nopt = 8 fins), the shading phenomenon does not occur if α ( 39.5 ° ,   140.5 ° ) . If condition (5) is satisfied, the shaded area Ash is calculated from the formula:
A s h = H · ( z ( 2 x + d ) ) sin ( α )
where H is the height of the fin, which is equal to 4 m. The resultant unshaded area of PV system APV, which consists of n fins, is defined as:
A PV = n · H · L ( n 1 ) · A s h
It is worth mentioning that the term (n − 1) in (8) refers to the number of fins that are partially shaded. Table 5 presents the tracking angles α for each office hour and the resultant unshaded area APV of the PV system. When analysing these data, it can clearly be seen that partial shading occurs during the morning (09:00–10:00) and afternoon (14:00–17:00) hours. The resultant unshaded area APV has the maximum value between the hours of 10:00 and 14:00.
The shading phenomenon limits the production of electricity because the direct solar radiation does not have access to the whole surface of the PV panels. In this case, only diffuse radiation affects the shaded area. Taking into account partial shading, the electricity production from the tracking PV system for the considered period (9 June to 9 July, 09:00–17:00) is equal to 434.2 kWh. In comparison to the fixed variant, the tracking solution gives an improvement in electricity production of only about 3.21%. This low improvement is mainly due to the partial shading of the panels during the morning and afternoon hours. The shadow that is cast reduces the area exposed to direct sunlight, and therefore the electricity production is reduced.
It is worth noting that the obtained result depends on many parameters, including orientation of the facade towards the side of the world, latitude, climatic zone (related to TMY), method of shading fins assembly (vertical or horizontal) and the period of time for which the calculations are made.

6. Conclusions

The conducted research and calculations allow the following conclusions to be formulated:
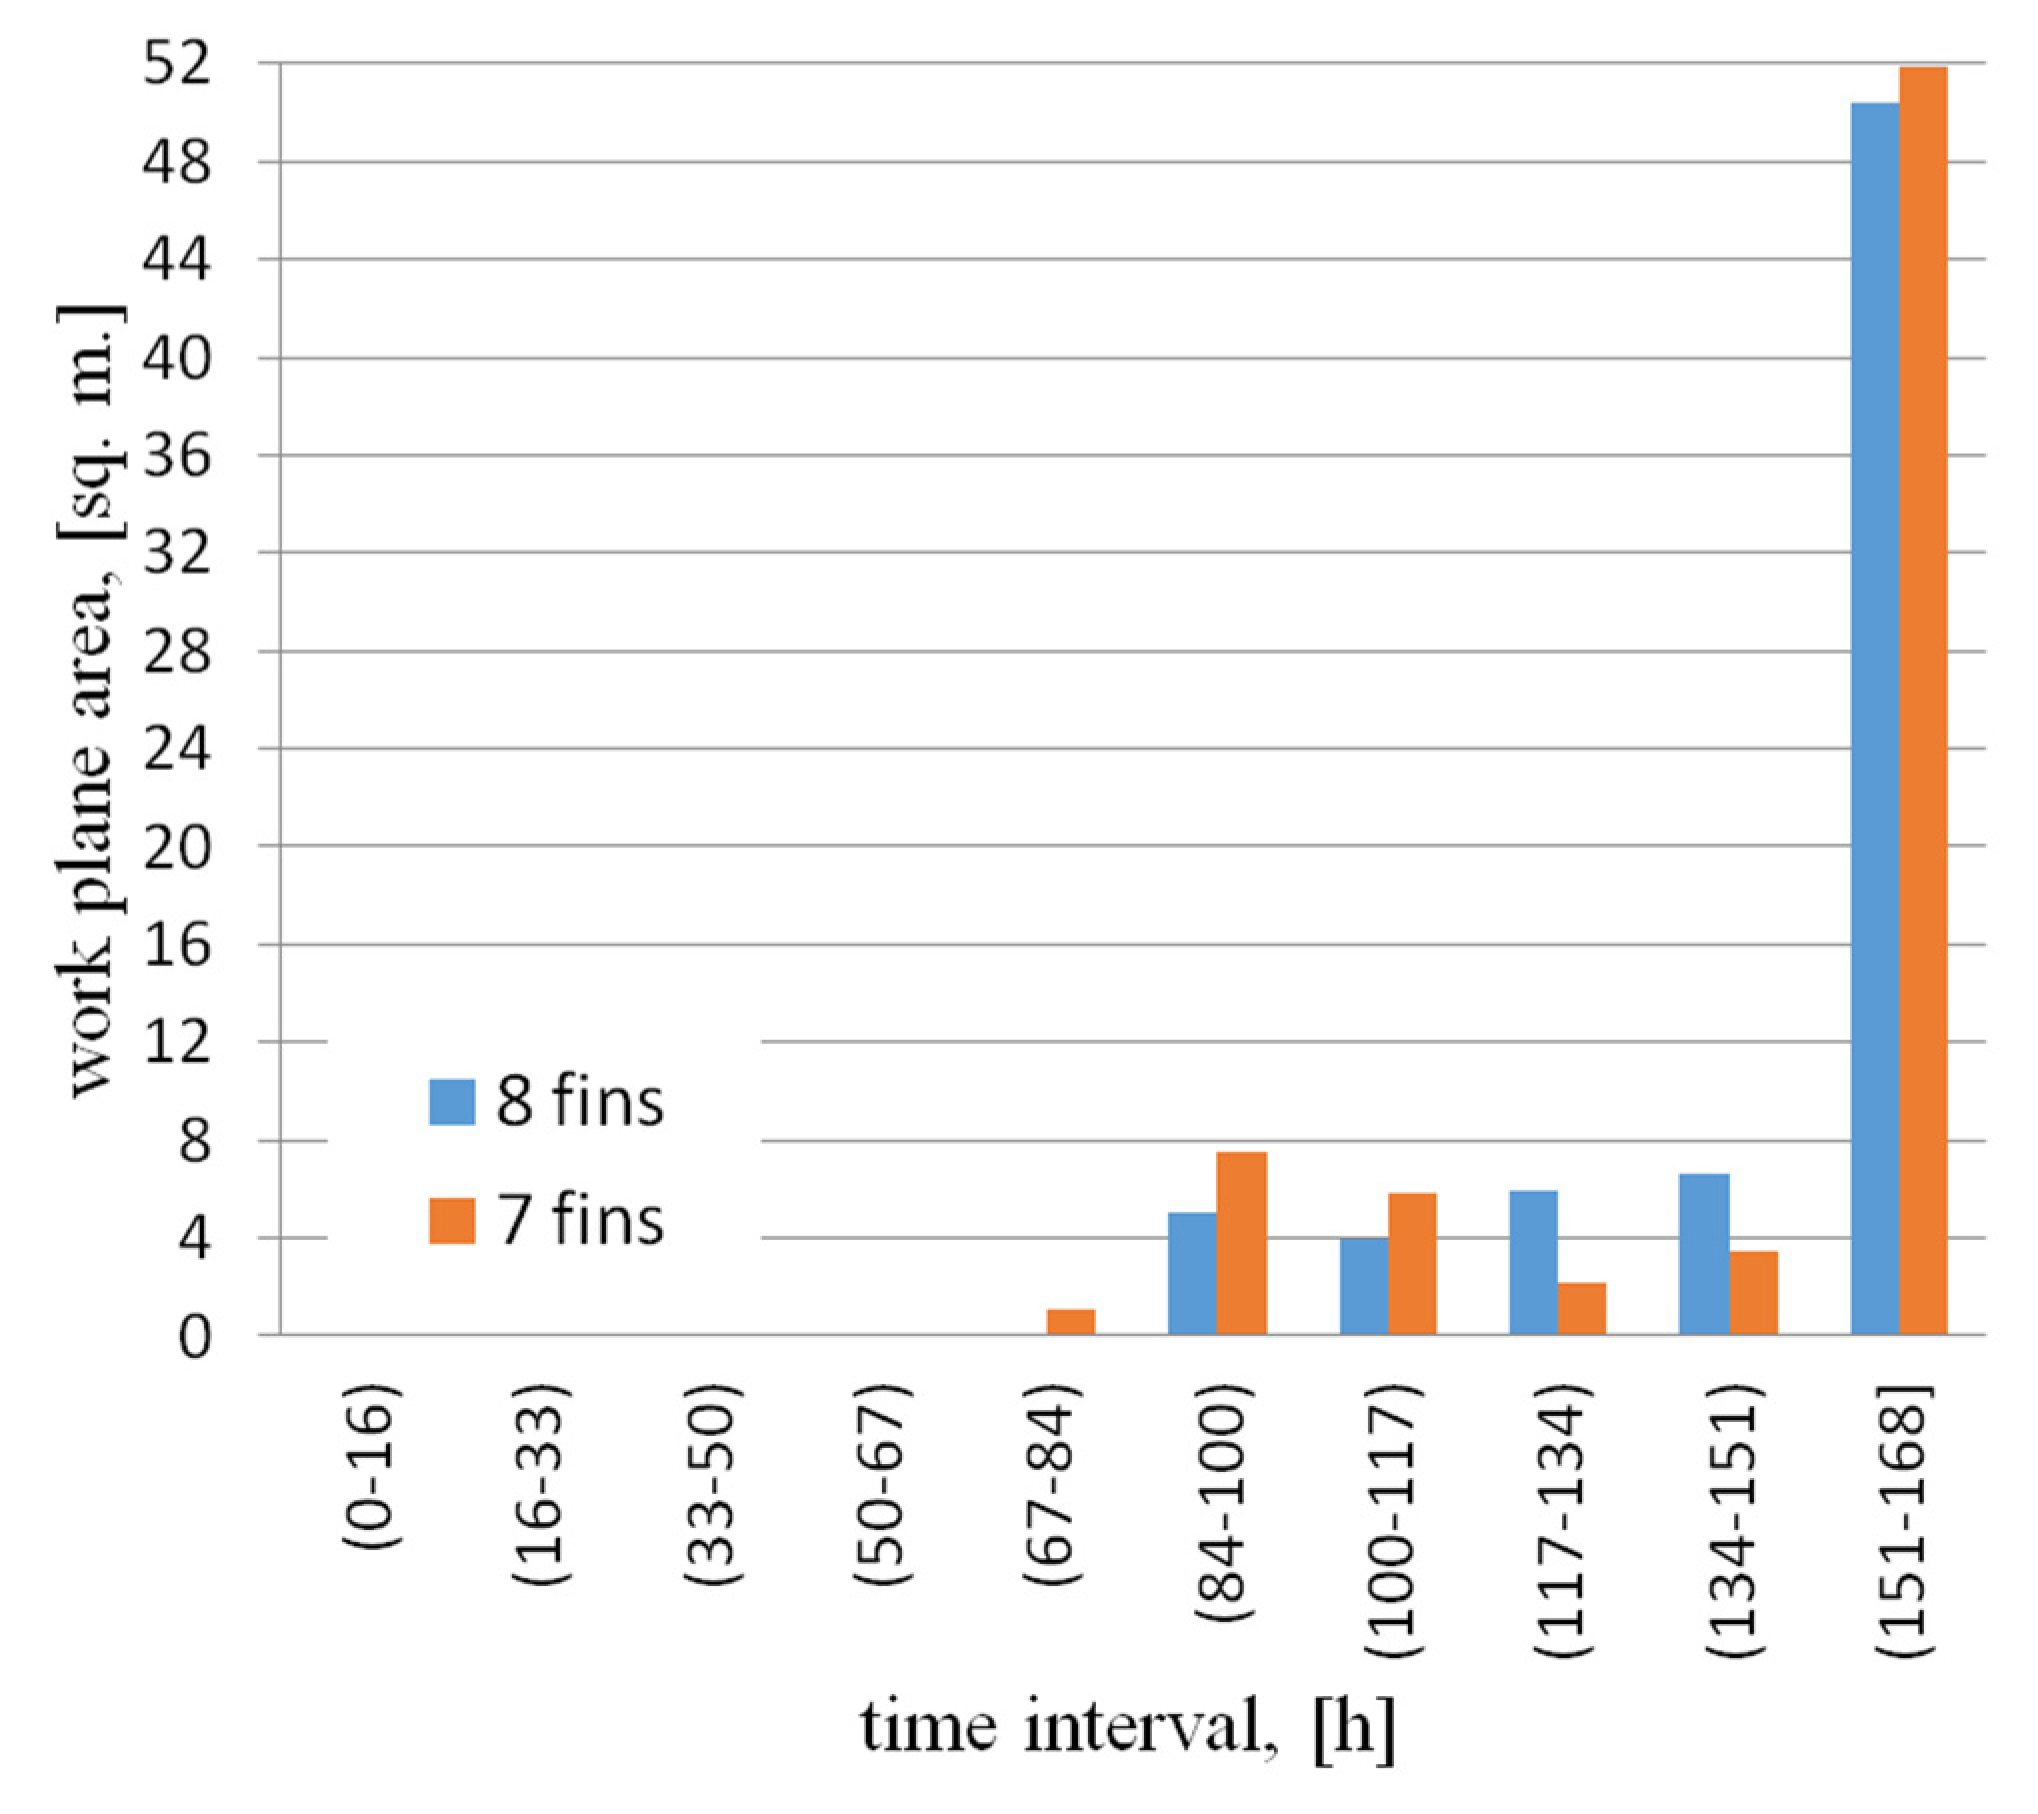
  • In the daylight analysis, the comparison of the quantitative parameter UDI300-3000 showed an interesting tendency. When the distance between fins is too large (e.g., d = 2 m), the room is overlit; however, when the fins are too close to each other, the illumination in the room is reduced and the office room is under-exposed (e.g., d = 0.1 m).
  • The maximum area in which the UDI300-3000 is met for the longest period is reached for the variant with 8 fins. The presented study confirms the publicly available recommendation that the window opening area should not exceed 25% of the room’s floor area (here 16 m2 of opening out of 72 m2 of clear floor space—22%).
  • For the variant with 8 fins, the electricity production for 16 PV panels in the considered period is 420.7 and 434.2 kWh for the fixed and the Sun-tracking variant, respectively. This shows that the tracking system is only 3.21% more efficient than the static system.
  • The study highlighted that the self-shading had a very high negative impact on the vertical kinetic PV systems for the South exposed facade. The authors conclude that the additional cost of the installation would not be justified by the increased production of electricity.
  • The obtained improvement of efficiency is very low, especially in the context of the values achieved by other researchers analyzing horizontal shading elements. This result provides important insight into the limitations associated with kinetic shading systems.
The main innovations of the study are:
  • a two-stage evaluation and assessment process based on computer simulations according to two criteria: visual comfort and electricity production,
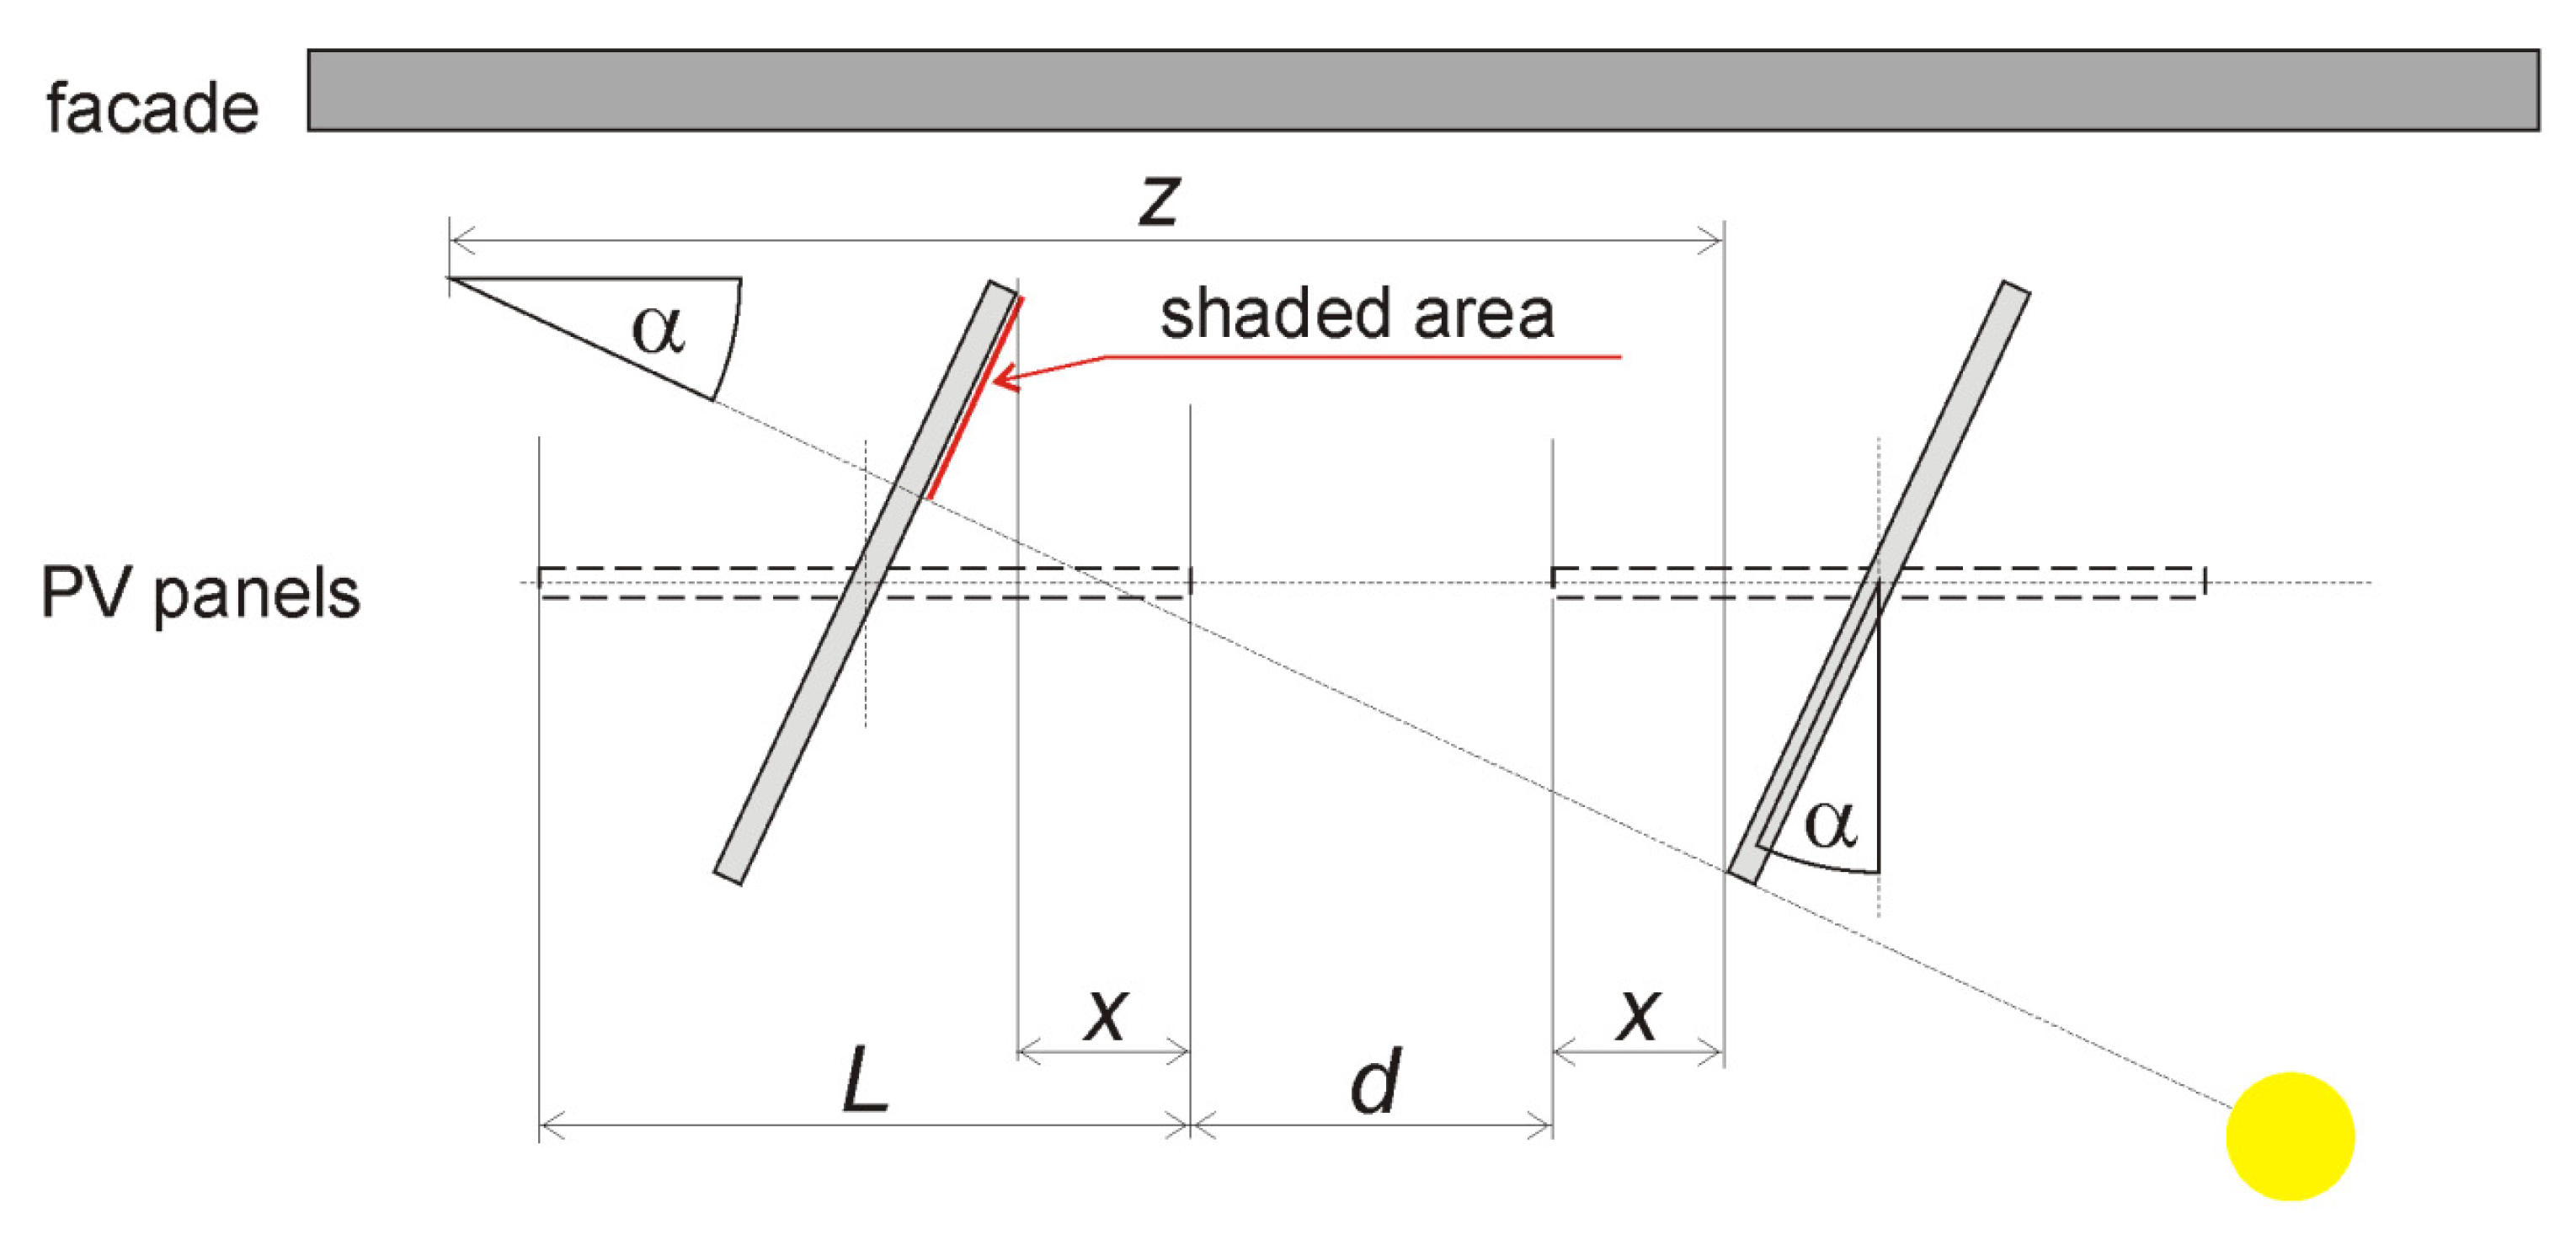
  • the introduction of a vertical Sun-tracking shading system covered with PV panels,
  • the recognition of the relationship between the size of the window opening area and visual comfort in an office room,
  • insights regarding the efficiency of the electricity production of the proposed shading system.

6.1. Limitation of the Study

However, the presented study has some limitations, which should be explicitly stated. First, due to the climatic considerations in Wroclaw (high probability of snow coverage in the winter), only vertical shading fins have been analyzed. The authors are aware that in hot climates, the horizontal orientation of fins is more effective, as shown by Mesloub et al. [52] and Mesloub et al. [53], resulting in higher electricity production, but this solution would entail much higher material and maintenance costs (deicing and snow removal). In addition and intentionally, analysis was conducted for a limited period, for 31 days between 9 June and 9 July, taking into account that in this period, potentially the most unfavorable sunlight conditions occur (high angle of incidence). Moreover, in daylight analysis, the static fins have been used. This decision is supported by the fact that mechanized fins would only improve the penetration of the daylight deep into the room. Therefore—in the perspective of the visual comfort—the use of the static fin is the worst-case scenario and can be used as a benchmark value for the conducted analysis. The readers should also be aware that external vertical fins with PV panels installed are at risk of being destroyed by violent weather phenomena. This issue was a subject of the previous papers by the authors of the presented research [14].

6.2. Future Research

Future studies for different climate zones should aim to analyze more variants with different possible geometries of PV panels, e.g., the horizontal ones. Furthermore, a fully retractable system of fins might be analyzed, allowing more light to penetrate the office room in the days with full cloud coverage. Visual comfort throughout the entire year should also be investigated with particular attention to the period of the equinox when the Sun altitudes are lower. Potential improvement of the credibility of results is associated with experimental research that might deliver data based on measurements, as previously discussed by Bodart and Cauwerts, in a room with a different geometry [54].
In further research, the authors plan to provide similar analyses for facades with horizontal shading elements (including facades with different orientations) and different kinetic scenarios. It might also be promising to check pantograph-based systems instead of simple vertical axis rotation systems. It is also necessary to state that vertical, kinetic PV systems for East or West exposed facades require additional research since the azimuth angles are different.

Supplementary Materials

The simulation data presented in this study are openly available on: https://drive.google.com/drive/folders/1ulkXwoCyJxSf18PUuBu784YwqLzJbYOj?usp=sharing (accessed on 2 November 2021). The figures presented in this study are available on request from the corresponding author.

Author Contributions

Conceptualization, M.B., J.K. and P.R.; methodology, M.B. and J.K.; daylight simulation and data analysis, M.B.; PV simulation and data analysis, J.K.; numerical calculation of mean value, P.R.; writing—original draft preparation, M.B. and P.R.; writing—review and editing, M.B. and P.R.; daylight visualization, M.B.; supervision, M.B. All authors have read and agreed to the published version of the manuscript.

Funding

This research was funded by Wroclaw University of Science and Technology, Poland, project number 8211104160/2021.

Institutional Review Board Statement

Not applicable.

Informed Consent Statement

Not applicable.

Conflicts of Interest

The authors declare no conflict of interest.

Nomenclature

UDI300-3000useful daylight illuminance,
U D I ¯ mean UDI,
Aarea, m2
ddistance between adjacent shading fins, m
Evvertical eye illuminance
GSTCsolar radiation in standard test conditions (STC), W/m2
GIglobal solar irradiance, W/m2
Hheight of shading fin, m
iinteger number,
Llength of shading fin, m
Lsluminance of the source, cd/m2
moffice hours, h
nnumber of fins,
Nnumber of panels in PV system,
Ppower, W
Piposition index (see Reference [36]).
ttime, h
Ttemperature, °C
x, zlength, m
Greek letter
αtracking angle, deg
γtemperature coefficient of the panel, %/°C
ηefficiency,
ωssolid angle of the source
Subscripts
aambient,
cellcell,
DBTdry-bulb temperature,
invinverter,
maxmaximum,
NOCTnormal operating cell temperature,
optoptimal,
tottotal,
PVphotovoltaic,
shshaded,
STCstandard test condition,
wirewire,

References

  1. Thewes, A.; Maas, S.; Scholzen, F.; Waldmann, D.; Zürbes, A. Field study on the energy consumption of school buildings in Luxembourg. Energy Build. 2014, 68, 460–470. [Google Scholar] [CrossRef]
  2. European Council Meeting Conclusions. 2019. Available online: https://www.consilium.europa.eu/media/41768/12-euco-final-conclusions-en.pdf (accessed on 13 September 2021).
  3. Going Climate-Neutral by 2050, A Strategic Long-Term Vision for a Prosperous, Modern, Competitive and Climate-Neutral EU Economy. Available online: https://op.europa.eu/en/publication-detail/-/publication/92f6d5bc-76bc-11e9-9f05-01aa75ed71a1 (accessed on 13 September 2021).
  4. Kolokotroni, M.; Ren, X.; Davies, M.; Mavrogianni, A. London’s urban heat island: Impact on current and future energy consumption in office buildings. Energy Build. 2012, 47, 302–311. [Google Scholar] [CrossRef] [Green Version]
  5. Datta, G. Effect of fixed horizontal louver shading devices on thermal perfomance of building by Trnsys simulation. Renew. Energy 2001, 23, 497–507. [Google Scholar] [CrossRef]
  6. Palmero-Marrero, A.I.; Oliveira, A.C. Effects of louver shading devices on building energy requirements. Appl. Energy 2010, 87, 2040–2049. [Google Scholar] [CrossRef]
  7. Brzezicki, M. A typology of adaptive façades. An empirical study based on the morphology of glazed facades. Cogent Arts Humanit. 2021, 8, 1960699. [Google Scholar] [CrossRef]
  8. Romano, R.; Aelenei, L.; Aelenei, D.; Mazzucchelli, S. What is an Adaptive Façade? Analysis of Recent Terms and Definitions from an International Perspective. J. Facade Des. Eng. 2018, 6, 65–76. [Google Scholar] [CrossRef]
  9. O’Brien, W.; Kapsis, K.; Athienitis, A.K. Manually-operated window shade patterns in office buildings: A critical review. Build. Environ. 2013, 60, 319–338. [Google Scholar] [CrossRef]
  10. Gratia, E.; De Herde, A. The most efficient position of shading devices in a double-skin façade. Energy Build. 2006, 39, 364–373. [Google Scholar] [CrossRef]
  11. Manzan, M. Genetic optimization of external fixed shading devices. Energy Build. 2014, 72, 431–440. [Google Scholar] [CrossRef]
  12. Azmi, N.A.; Kandar, M.; Toe, D. Daylight Optimization for Green Office Building: A Study of West Facing Window Design and Configuration. Adv. Sci. Lett. 2017, 23, 9177–9182. [Google Scholar] [CrossRef]
  13. Atzeri, A.M.; Gasparella, A.; Cappelletti, F.; Tzempelikos, A. Comfort and energy performance analysis of different glazing systems coupled with three shading control strategies. Sci. Technol. Built Environ. 2018, 24, 545–558. [Google Scholar] [CrossRef]
  14. Brzezicki, M.; Regucki, P. Optimization of useful daylight illuminance vs. drag force for vertical shading fins/panels. Sci. Technol. Built Environ. 2021, 27, 367–376. [Google Scholar] [CrossRef]
  15. Alzoubi, H.H.; Al-Zoubi, A.H. Assessment of building façade performance in terms of daylighting and the associated energy consumption in architectural spaces: Vertical and horizontal shading devices for southern exposure facades. Energy Convers. Manag. 2010, 51, 1592–1599. [Google Scholar] [CrossRef]
  16. Bahr, W. Optimal Design Parameters Of The Blinds Integrated Photovoltaic Modules Based On Energy Efficiency And Visual Comfort Assessments. In Proceedings of the Central Europe towards Sustainable Building 2013, CESB13 Prague, Prague, Czech Republic, 26–28 June 2013. [Google Scholar]
  17. Bahr, W. A comprehensive assessment methodology of the building integrated photovoltaic blind system. Energy Build. 2014, 82, 703–708. [Google Scholar] [CrossRef]
  18. Kim, S.-H.; Kim, I.-T.; Choi, A.-S.; Sung, M. Evaluation of optimized pv power generation and electrical lighting energy savings from the PV blind-integrated daylight responsive dimming system using led lighting. Sol. Energy 2014, 107, 746–757. [Google Scholar] [CrossRef]
  19. Hong, S.; Choi, A.-S.; Sung, M. Development and verification of a slat control method for a bi-directional PV blind. Appl. Energy 2017, 206, 1321–1333. [Google Scholar] [CrossRef]
  20. Luo, Y.; Zhang, L.; Wu, J.; Wang, X.; Liu, Z.; Wu, Z. Modeling of solar transmission through multilayer glazing facade using shading blinds with arbitrary geometrical and surface optical properties. Energy 2017, 128, 163–182. [Google Scholar] [CrossRef]
  21. Luo, Y.; Zhang, L.; Liu, Z.; Xie, L.; Wang, X.; Wu, J. Experimental study and performance evaluation of a PV-blind embedded double skin façade in winter season. Energy Part B 2018, 165, 326–342. [Google Scholar] [CrossRef]
  22. Luo, Y.; Zhang, L.; Su, X.; Liu, Z.; Lian, J.; Luo, Y. Improved thermal-electrical-optical model and performance assessment of a pv-blind embedded glazing façade system with complex shading effects. Appl. Energy 2019, 255, 113896. [Google Scholar] [CrossRef]
  23. Kang, H.; Hong, T.; Jung, S.; Lee, M. Techno-economic performance analysis of the smart solar photovoltaic blinds considering the photovoltaic panel type and the solar tracking method. Energy Build. 2019, 193, 1–14. [Google Scholar] [CrossRef]
  24. Kang, H.; Hong, T.; Lee, M. Technical performance analysis of the smart solar photovoltaic blinds based on the solar tracking methods considering the climate factors. Energy Build. 2019, 190, 34–48. [Google Scholar] [CrossRef]
  25. Kang, H.; Hong, T.; Lee, M. A new approach for developing a hybrid sun-tracking method of the intelligent photovoltaic blinds considering the weather condition using data mining technique. Energy Build. 2020, 209, 1–11. [Google Scholar] [CrossRef]
  26. Katunský, D.; Dolníková, E.; Dolník, B. Daytime Lighting Assessment in Textile Factories Using Connected Windows in Slovakia: A Case Study. Sustainability 2018, 10, 655. [Google Scholar] [CrossRef] [Green Version]
  27. O’Shaughnessy, E. Trends in the market structure of US residential solar PV installation, 2000 to 2016: An evolving industry. Prog. Photovolt. Res. Appl. 2018, 26, 901–910. [Google Scholar] [CrossRef]
  28. Bahr, W. A PV installation framework concerning electricity variable rates. Int. J. Ambient Energy 2018, 39, 802–812. [Google Scholar] [CrossRef]
  29. Radomski, B.; Ćwiek, B.; Mróz, T.M. The choice of primary energy source including PV installation for providing electric energy to a public utility building—A case study. In E3S Web of Conferences; EDP Sciences: Ulis, France, 2017; Volume 22, p. 00141. [Google Scholar] [CrossRef] [Green Version]
  30. Fan, Y.; Xia, X. A multi-objective optimization model for energy-efficiency building envelope retrofitting plan with rooftop PV system installation and maintenance. Appl. Energy 2017, 189, 327–335. [Google Scholar] [CrossRef] [Green Version]
  31. Kotak, Y.; Gago, E.J.; Mohanty, P.; Muneer, T. Installation of roof-top solar PV modules and their impact on building cooling load. Build. Serv. Eng. Res. Technol. 2014, 35, 613–633. [Google Scholar] [CrossRef] [Green Version]
  32. Atmaja, T.D. Façade and rooftop PV installation strategy for building integrated photo voltaic application. Energy Procedia 2013, 32, 105–114. [Google Scholar] [CrossRef] [Green Version]
  33. Vulkan, A.; Kloog, I.; Dorman, M.; Erell, E. Modeling the potential for PV installation in residential buildings in dense urban areas. Energy Build. 2018, 169, 97–109. [Google Scholar] [CrossRef]
  34. Reinhart, C.F.; Walkenhorst, O. Validation of dynamic radiance-based daylight simulations for a test office with external blinds. Energy Build. 2001, 33, 683–697. [Google Scholar] [CrossRef]
  35. Ng, E.Y.-Y.; Poh, L.K.; Wei, W.; Nagakura, T. Advanced lighting simulation in architectural design in the tropics. Autom. Constr. 2001, 10, 365–379. [Google Scholar] [CrossRef]
  36. Yoon, Y.; Moon, J.W.; Kim, S. Development of annual daylight simulation algorithms for prediction of indoor daylight illuminance. Energy Build. 2016, 118, 1–17. [Google Scholar] [CrossRef]
  37. Boubekri, M.; Lee, J. A comparison of four daylighting metrics in assessing the daylighting performance of three shading systems. J. Green Build. 2017, 12, 39–53. [Google Scholar] [CrossRef]
  38. Nabil, A.; Mardaljevic, J. Useful daylight illuminance: A new paradigm for assessing daylight in buildings. Lighting Res. Technol. 2005, 37, 41–59. [Google Scholar] [CrossRef]
  39. Suk, J.Y. Luminance and vertical eye illuminance thresholds for occupants’ visual comfort in daylit office environments. Build. Environ. 2019, 148, 107–115. [Google Scholar] [CrossRef]
  40. Wienold, J.; Christoffersen, J. Evaluation methods and development of a new glare prediction model for daylight environments with the use of CCD cameras. Energy Build. 2006, 38, 743–757. [Google Scholar] [CrossRef]
  41. Sutter, Y.; Dumortier, D.; Fontoynont, M. The use of shading systems in vdu task offices: A pilot study. Energy Build. 2006, 38, 780–789. [Google Scholar] [CrossRef]
  42. Linney, A. Maximum Luminances and Luminance Ratios and Their Impact on Users’ Discomfort Glare Perception and Productivity in Daylight Offices. Master’s Thesis, Victoria University of Wellington, Wellington, New Zealand, 2008. [Google Scholar]
  43. Wymelenberg, K.V.D.; Inanici, M. Evaluating a New Suite of Luminance-Based Design Metrics for Predicting Human Visual Comfort in Offices with Daylight. Leukos 2016, 12, 113–138. [Google Scholar] [CrossRef]
  44. Mardaljevic, J.; Andersen, M.; Roy, N.; Christoffersen, J. Daylighting metrics: Is there a relation between useful daylight illuminance and daylight glare probability? In Proceedings of the First Building Simulation and Optimization Conference Loughborough 2012, Leicester, UK, 10–11 September 2012. [Google Scholar]
  45. Pilkington. Glass Handbook. 2014. Available online: https:www.pilkington.com/-/media/pilkington/site-content/poland/trade/downloads/handbook_2014_eng.pdf (accessed on 13 September 2021).
  46. Energy Plus Weather Web Page. Available online: https://energyplus.net/weather (accessed on 14 October 2021).
  47. Kalogirou, S.A. Photovoltaic systems. In Solar Energy Engineering: Processes and Systems; Elsevier Inc.: London, UK, 2014. [Google Scholar]
  48. Duffie, J.A.; Beckman, W.A. Design of photovoltaic systems. In Solar Engineering of Thermal Processes; John Wiley & Sons, Inc.: Hoboken, NJ, USA, 2013. [Google Scholar]
  49. Ameur, A.; Berrada, A.; Loudiyi, K.; Aggour, M. Forecast modeling and performance assessment of solar PV systems. J. Clean. Prod. 2020, 267, 122167. [Google Scholar] [CrossRef]
  50. Data for Energy Calculation of Buildings in Poland. Available online: https://archiwum.miir.gov.pl/strony/zadania/budownictwo/charakterystyka-energetyczna-budynkow/dane-do-obliczen-energetycznych-budynkow-1/ (accessed on 13 September 2021). (In Polish)
  51. Mathews, J.H.; Fink, K.D. Numerical Methods Using MATLAB, 4th ed.; Pearson Prentice Hall: Upper Saddle River, NJ, USA, 2004. [Google Scholar]
  52. Mesloub, A.; Ghosh, A.; Touahmia, M.; Albaqawy, G.A.; Noaime, E.; Alsolami, B.M. Performance Analysis of Photovoltaic Integrated Shading Devices (PVSDs) and Semi-Transparent Photovoltaic (STPV) Devices Retrofitted to a Prototype Office Building in a Hot Desert Climate. Sustainability 2020, 12, 10145. [Google Scholar] [CrossRef]
  53. Mesloub, A.; Albaqawy, G.A.; Kandar, M.Z. The Optimum Performance of Building Integrated Photovoltaic (BIPV) Windows Under a Semi-Arid Climate in Algerian Office Buildings. Sustainability 2020, 12, 1654. [Google Scholar] [CrossRef] [Green Version]
  54. Bodart, M.; Cauwerts, C. Assessing daylight luminance values and daylight glare probability in scale models. Build. Environ. 2017, 113, 210–219. [Google Scholar] [CrossRef]
Figure 1. The schematic diagram of the adopted methodology and sequence of simulation.
Buildings 11 00637 g001
Figure 2. Simulation setup: (a) an axonometric view showing the test room, below: (b) the schematic plan showing the location of the shading fins; (c) the schematic section showing the location of the shading fins.
Buildings 11 00637 g002
Figure 3. Test room plan: the dimension of the working plane and the location of measuring sensors.
Buildings 11 00637 g003
Figure 4. Results of the first phase of the simulation: test room plan and spatial distribution of UDI300-3000 over the test period from 9 June to 9 July for the specified number of hours. Exact values are given in the data file in the Supplementary Materials.
Buildings 11 00637 g004
Figure 5. Histograms of the surface distribution of the grouped data for n = 7 and 8.
Buildings 11 00637 g005
Figure 6. Results of the first phase of the simulation: test room plan and spatial distribution of UDI300-3000 over the test period from 9 June to 9 July for the specified number of hours. Exact values are given in the data file in the Supplementary Materials.
Buildings 11 00637 g006
Figure 7. Example of the positioning of the adjacent PV panels’ shaded area and mathematical notation provided.
Buildings 11 00637 g007
Table 1. Different glare discomfort thresholds by different authors.
Ref. No.AuthorsYearThresholdsRemarks
[41]Sutter et al.2006>3200 lx
[42]Linney2008>2740 lx
[43]Van Der Wymelenberg and Inanici2016>4000 lx
[44]Mardaljevic et al.2012>3200 lx
[40]Wienold and Christoffersen2006<2000 lxPerceptible
>6000 lxIntolerable
Table 2. Materials and radiance parameters of the room surfaces and shading fins.
Vertical Surfaces of the Test RoomWork PlaneCeilingStandard WindowShading Fin
Shaded-Side
MaterialGrey concreteDark gray (RAL 7000)Grey concreteTransparent glassWhite
metal
Reflectance0.420.230.4200.28
Transmittance0000.52 10
1 Insulating Glass Unit made of Pilkington Suncool™ OW 50/25.
Table 3. Work plane area (in m2) for which the UDI300-3000 metric is satisfied for a given number of fins. The results for fins 7 and 8 are given in bold type because those values would be the subject of further consideration.
Interval, h(0–16)(16–33)(33–50)(50–67)(67–84)(84–100)(100–117)(117–134)(134–151)(151–168)
number of fins, n40.000.000.000.719.3113.636.773.223.8134.55
50.000.000.000.006.0311.617.493.144.1539.58
60.000.000.000.003.409.916.012.883.3746.43
70.000.000.000.001.077.525.882.183.4851.87
80.000.000.000.000.005.063.965.936.6550.41
90.000.000.000.000.001.014.2611.0432.0223.67
100.000.000.000.125.2327.905.919.9617.015.87
118.019.378.1210.6120.7413.391.330.260.170.00
Table 4. The details of the analyzed PV installation.
The maximum power of a single PV panel, Wp350
The total number of PV panels16
The total electrical power of the BIPV system, kW5.6
The temperature coefficient of Pmax γ, %/°C−0.38
The panel’s efficiency under STC conditions, %18
The geometrical dimensions of a single PV panel (H/W/D), mm1960/991/40
The inverter’s efficiency0.97
The wire’s efficiency0.99
Table 5. The tracking angles α for each office hour and the resultant unshaded area APV of the PV system consisting of 8 fins.
Office Hours09:00–10:0010:00–11:0011:00–12:0012:00–13:0013:00–14:0014:00–15:0015:00–16:0016:00–17:00
Tracking angle α, deg23416493121143160176
APV, m221.1932.0032.0032.0032.0030.4819.057.07
Publisher’s Note: MDPI stays neutral with regard to jurisdictional claims in published maps and institutional affiliations.

