High-Performance Self-Compacting Concrete with Recycled Aggregates from the Precast Industry: Durability Assessment


Abstract
:1. Introduction
2. Materials and Methods
2.1. Materials
2.1.1. Powdery Materials
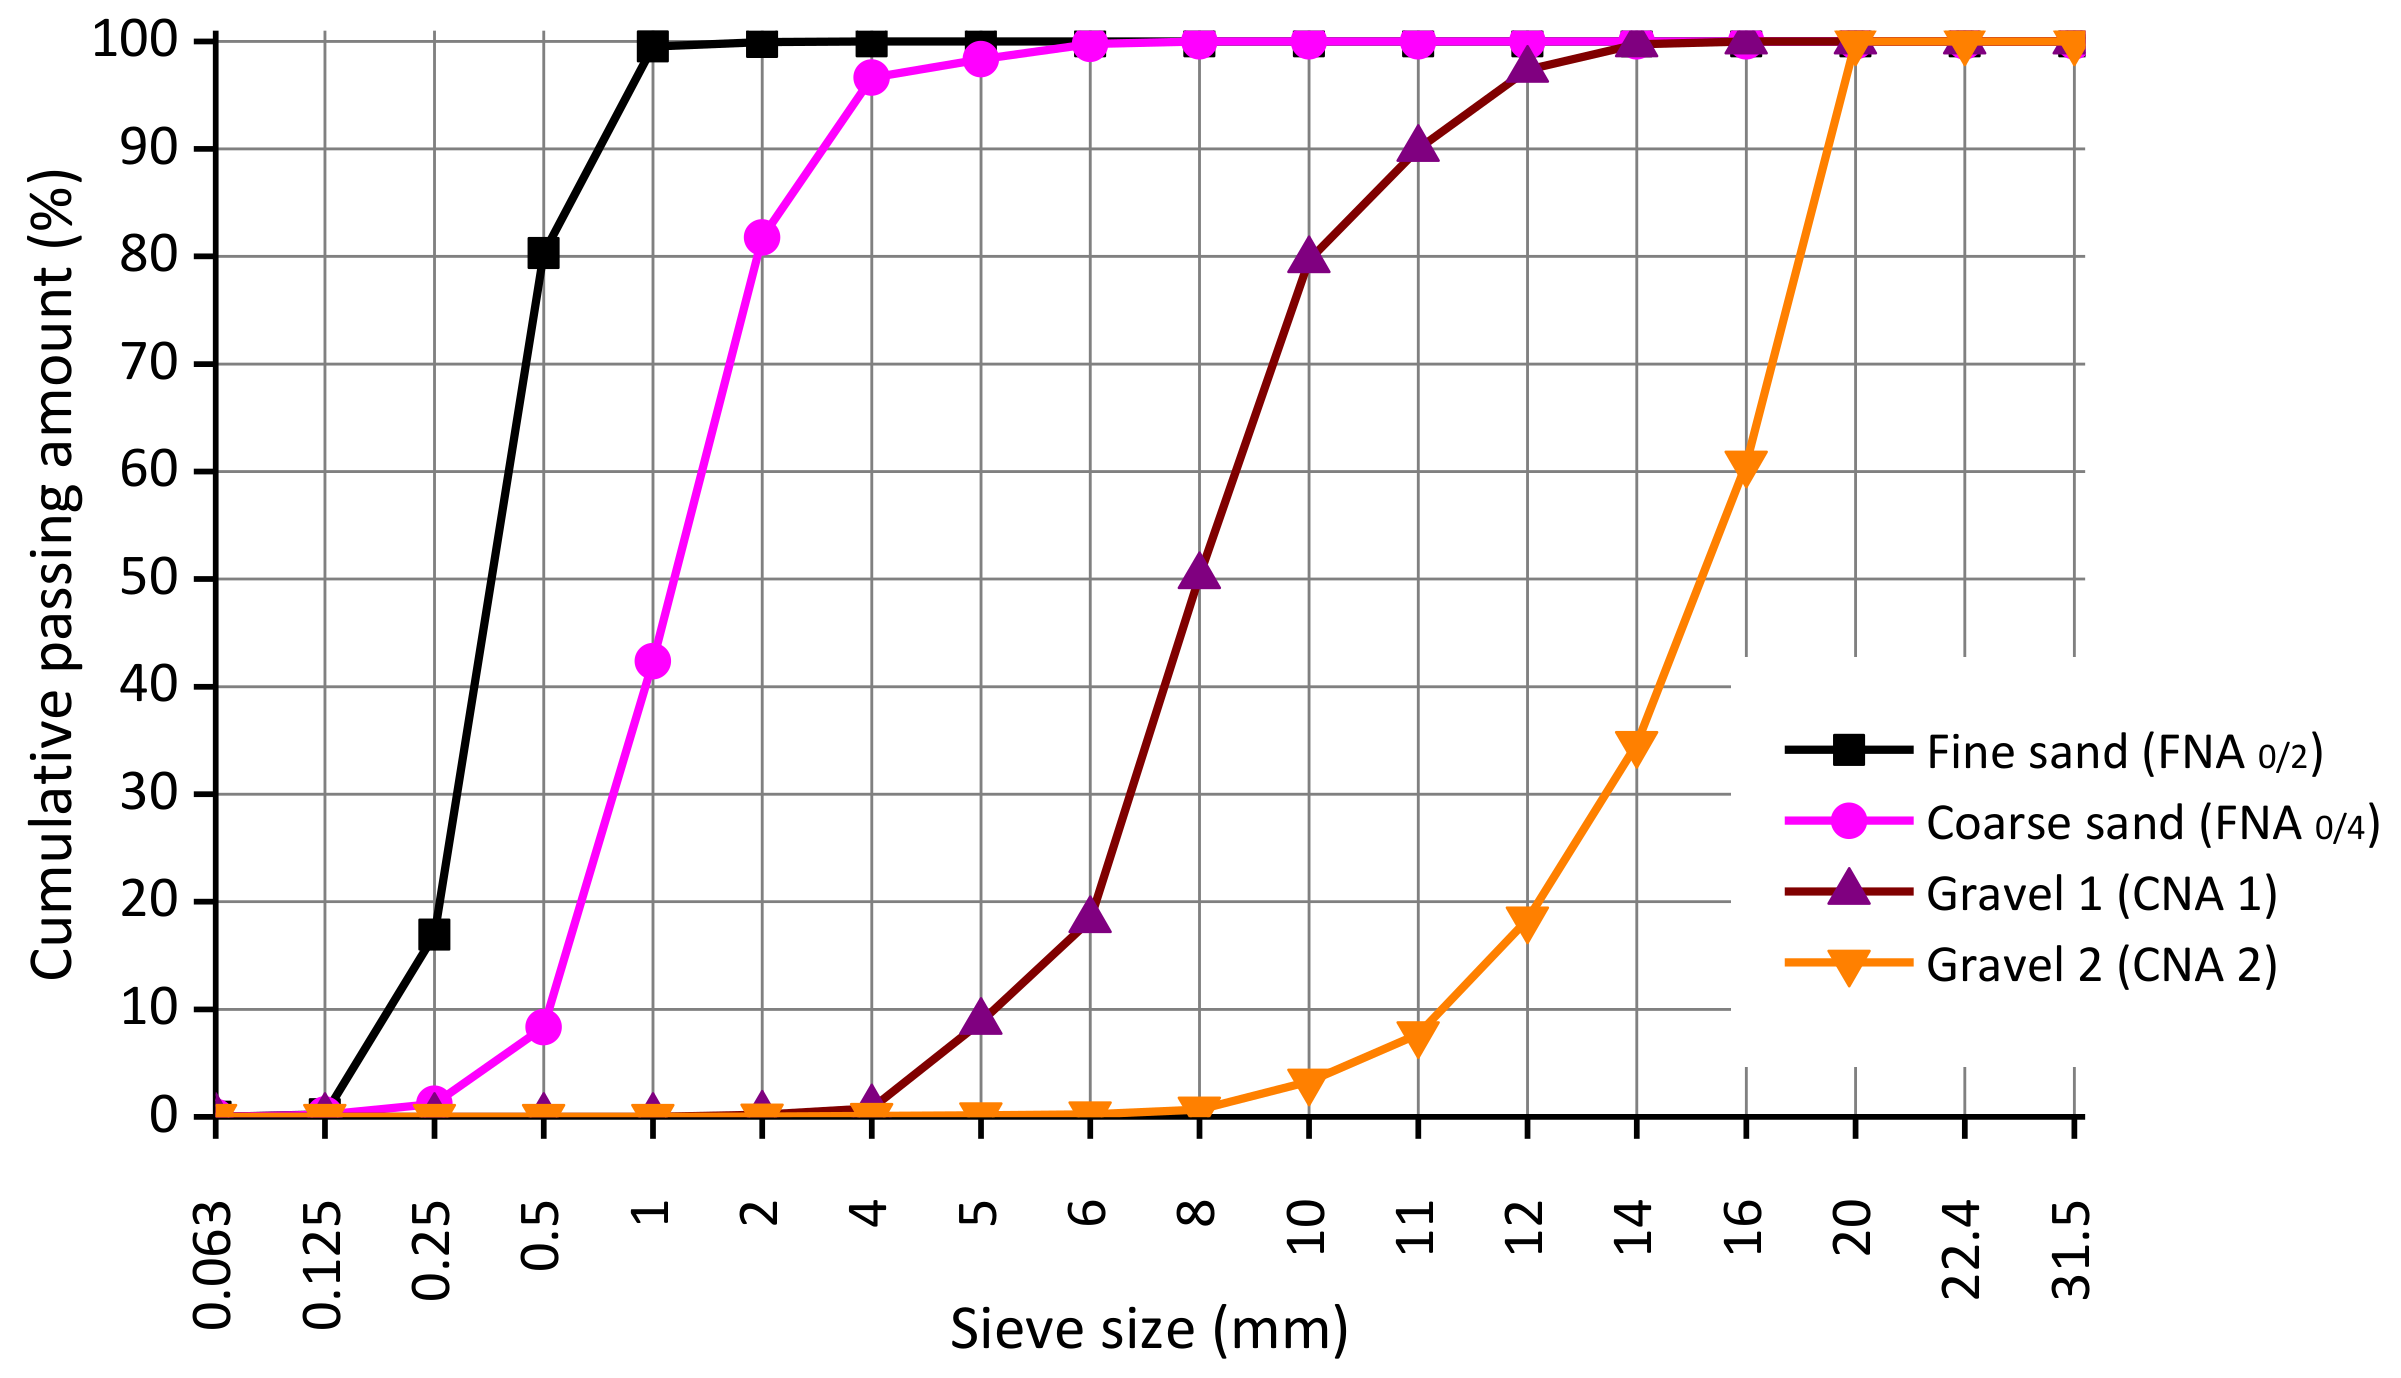
2.1.2. Natural and Recycled Aggregates
2.1.3. Water and Admixtures
2.2. Mix Proportions
2.3. Test Methods
2.3.1. Immersion Water Absorption Test
2.3.2. Capillary Water Absorption Test
2.3.3. Oxygen Permeability Test
2.3.4. Chloride Migration Test
2.3.5. Electrical Resistivity Test
2.3.6. Carbonation Test
3. Results and Discussion
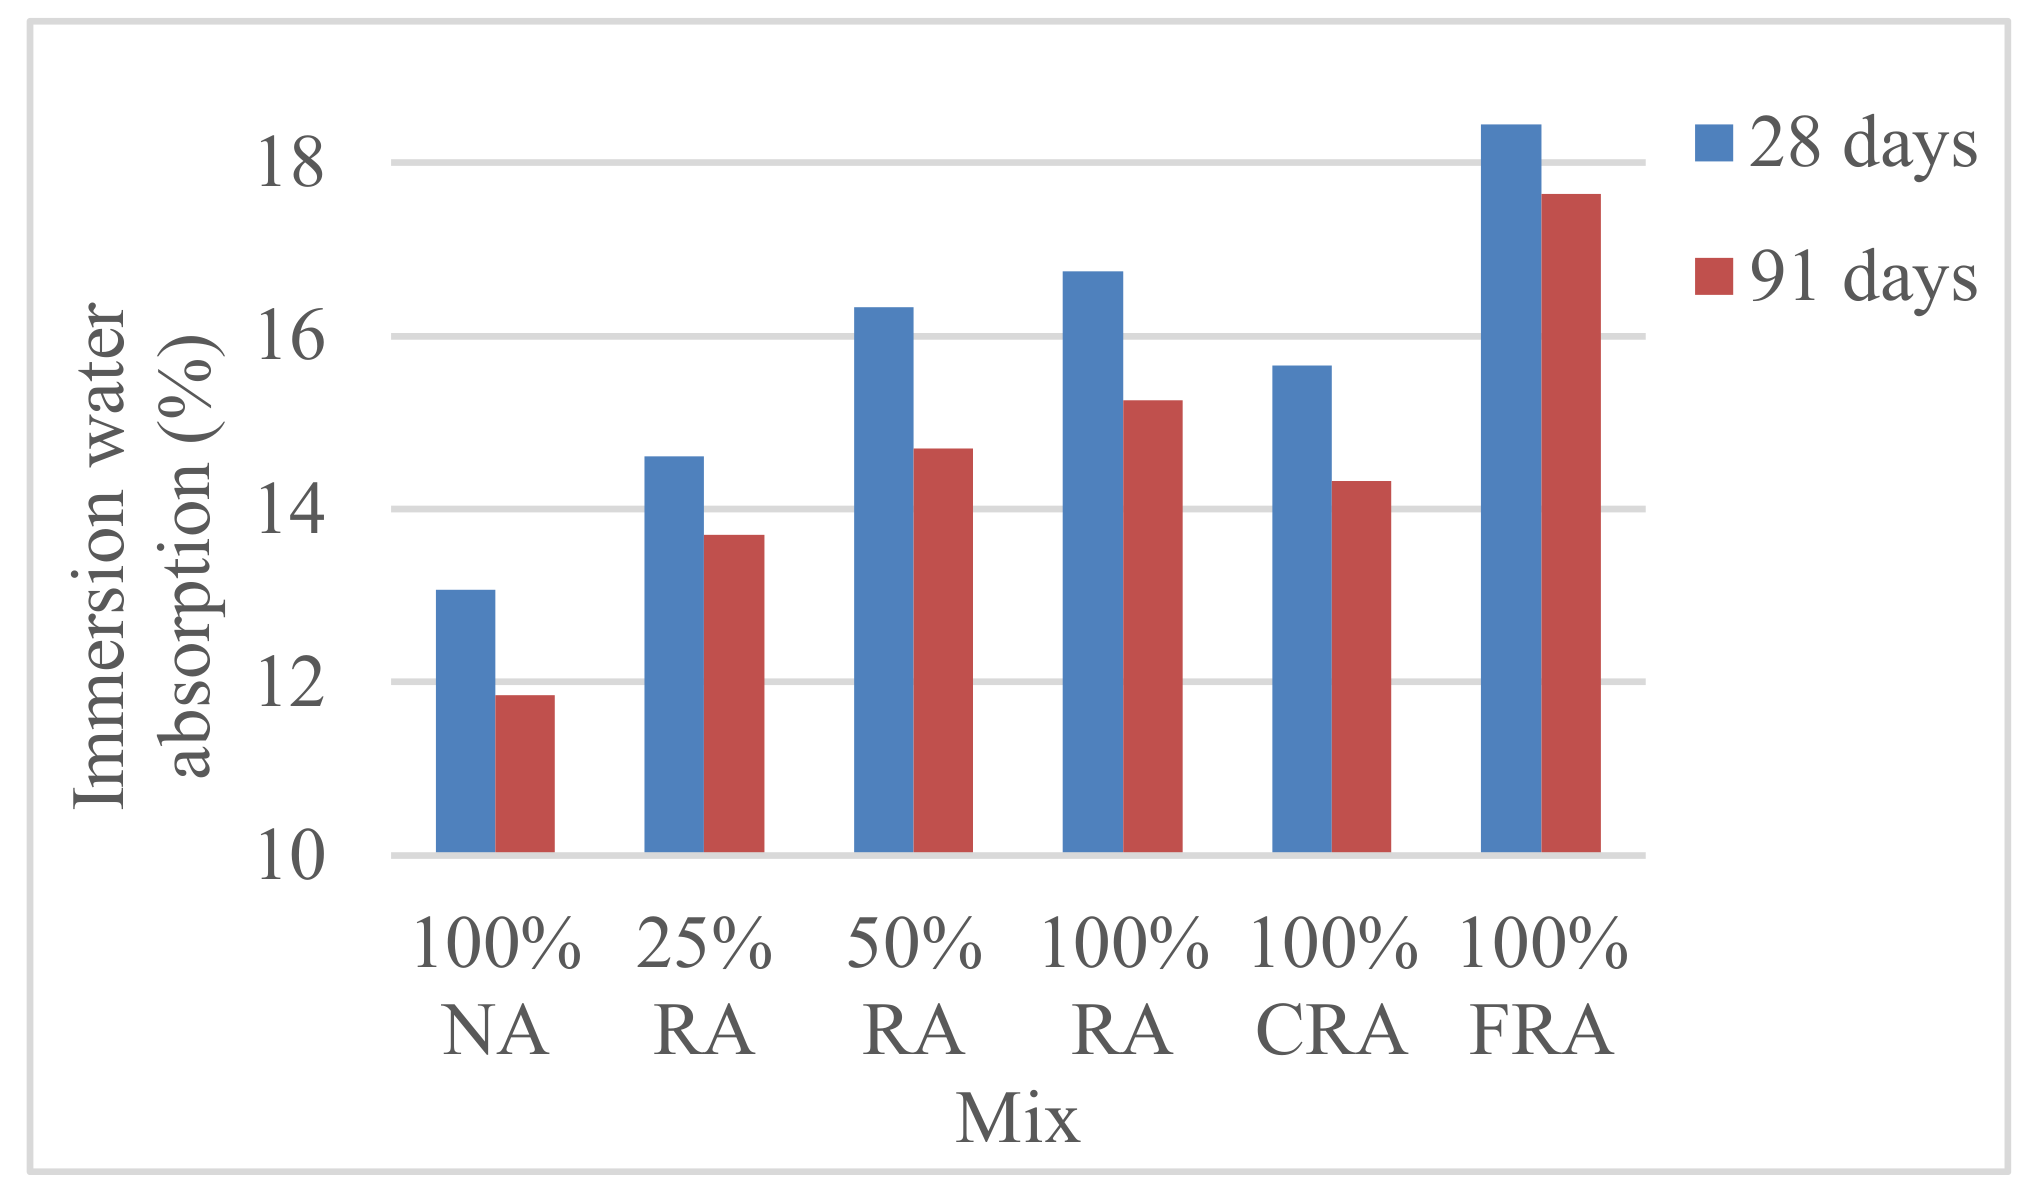
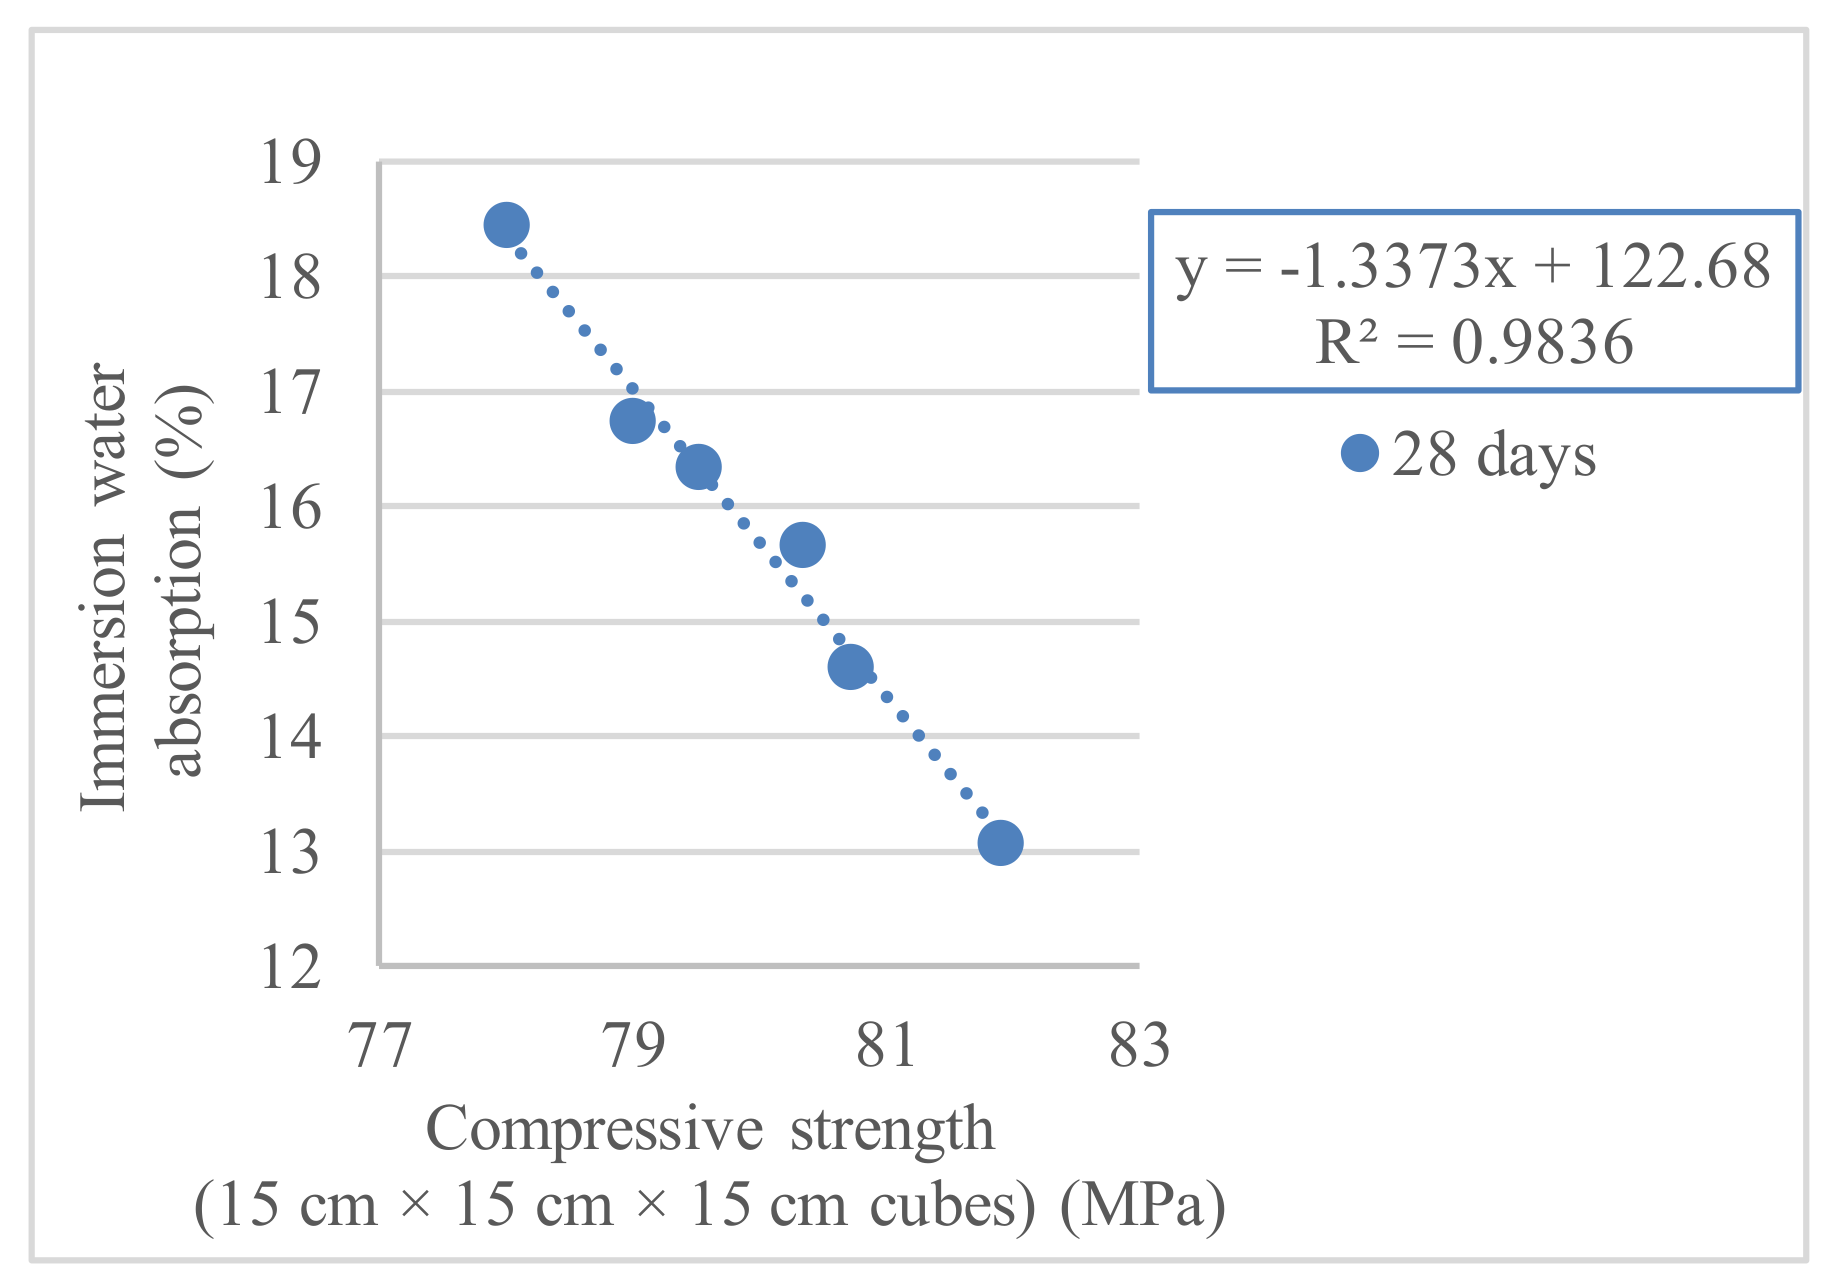
3.1. Immersion Water Absorption Test
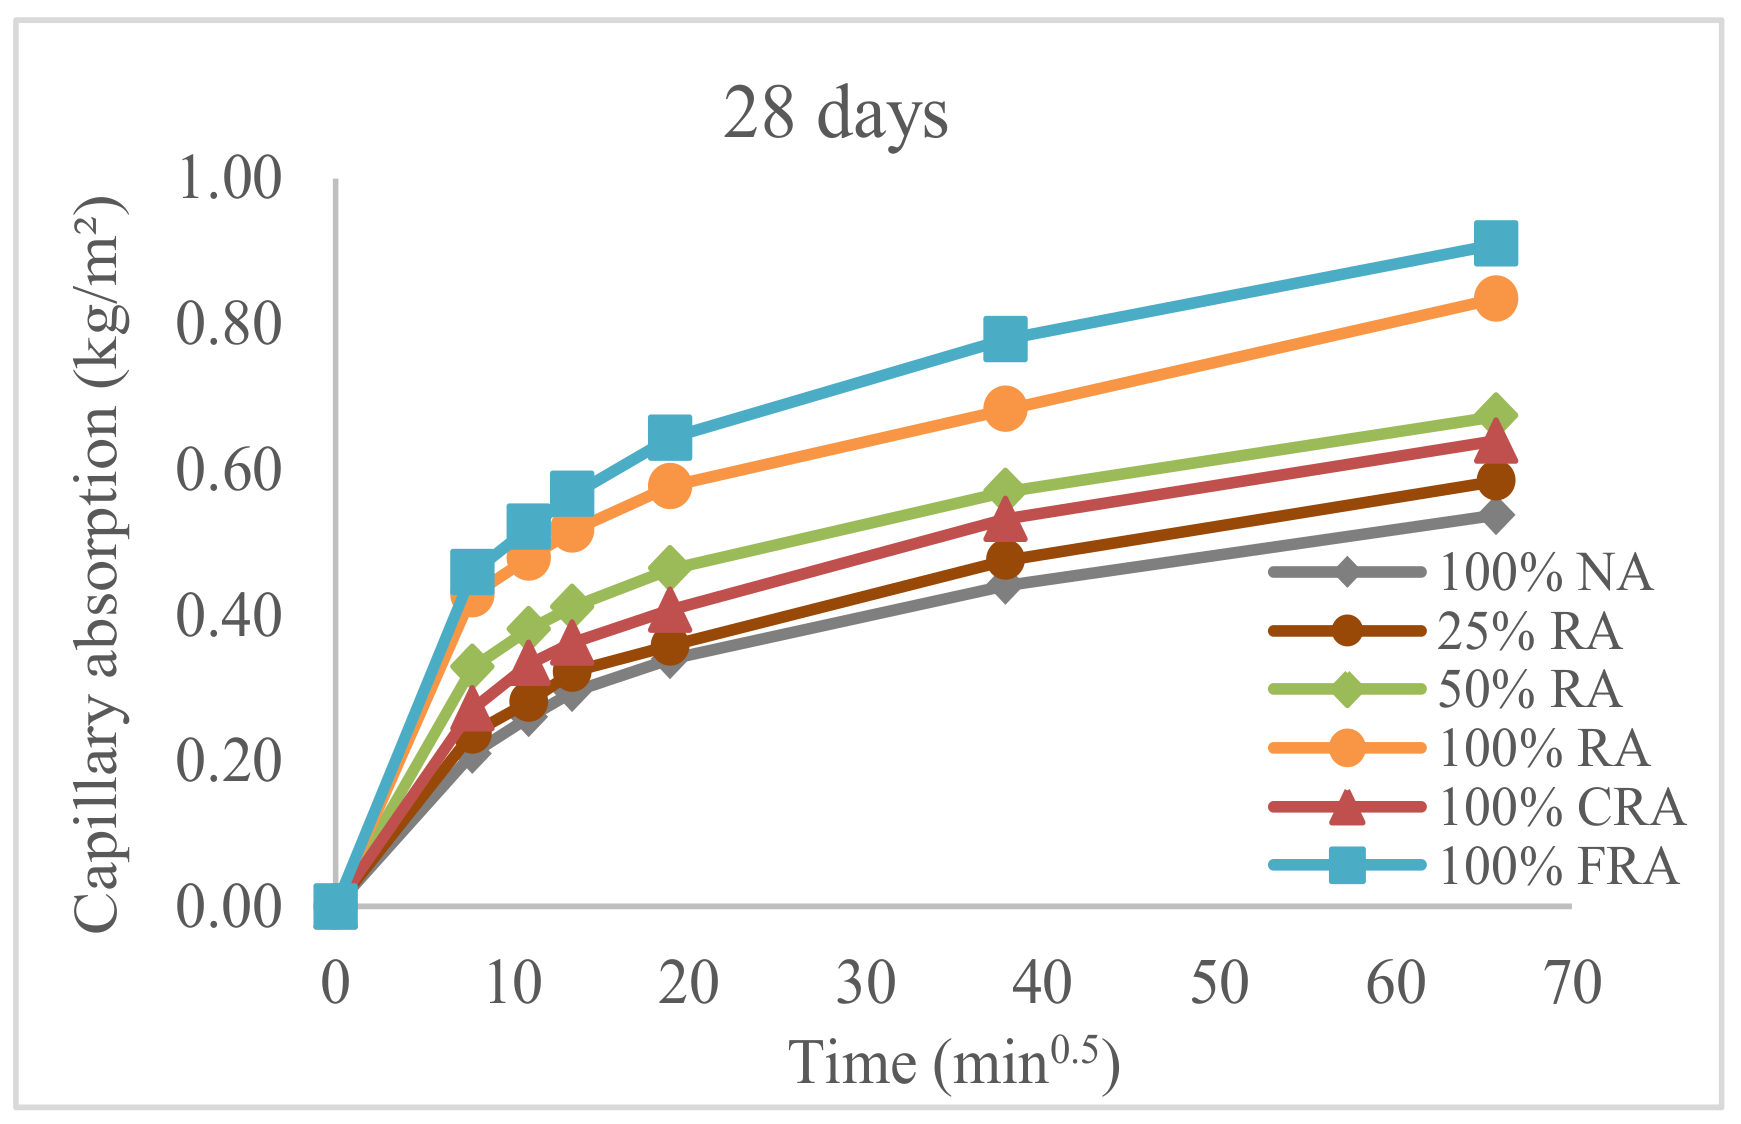
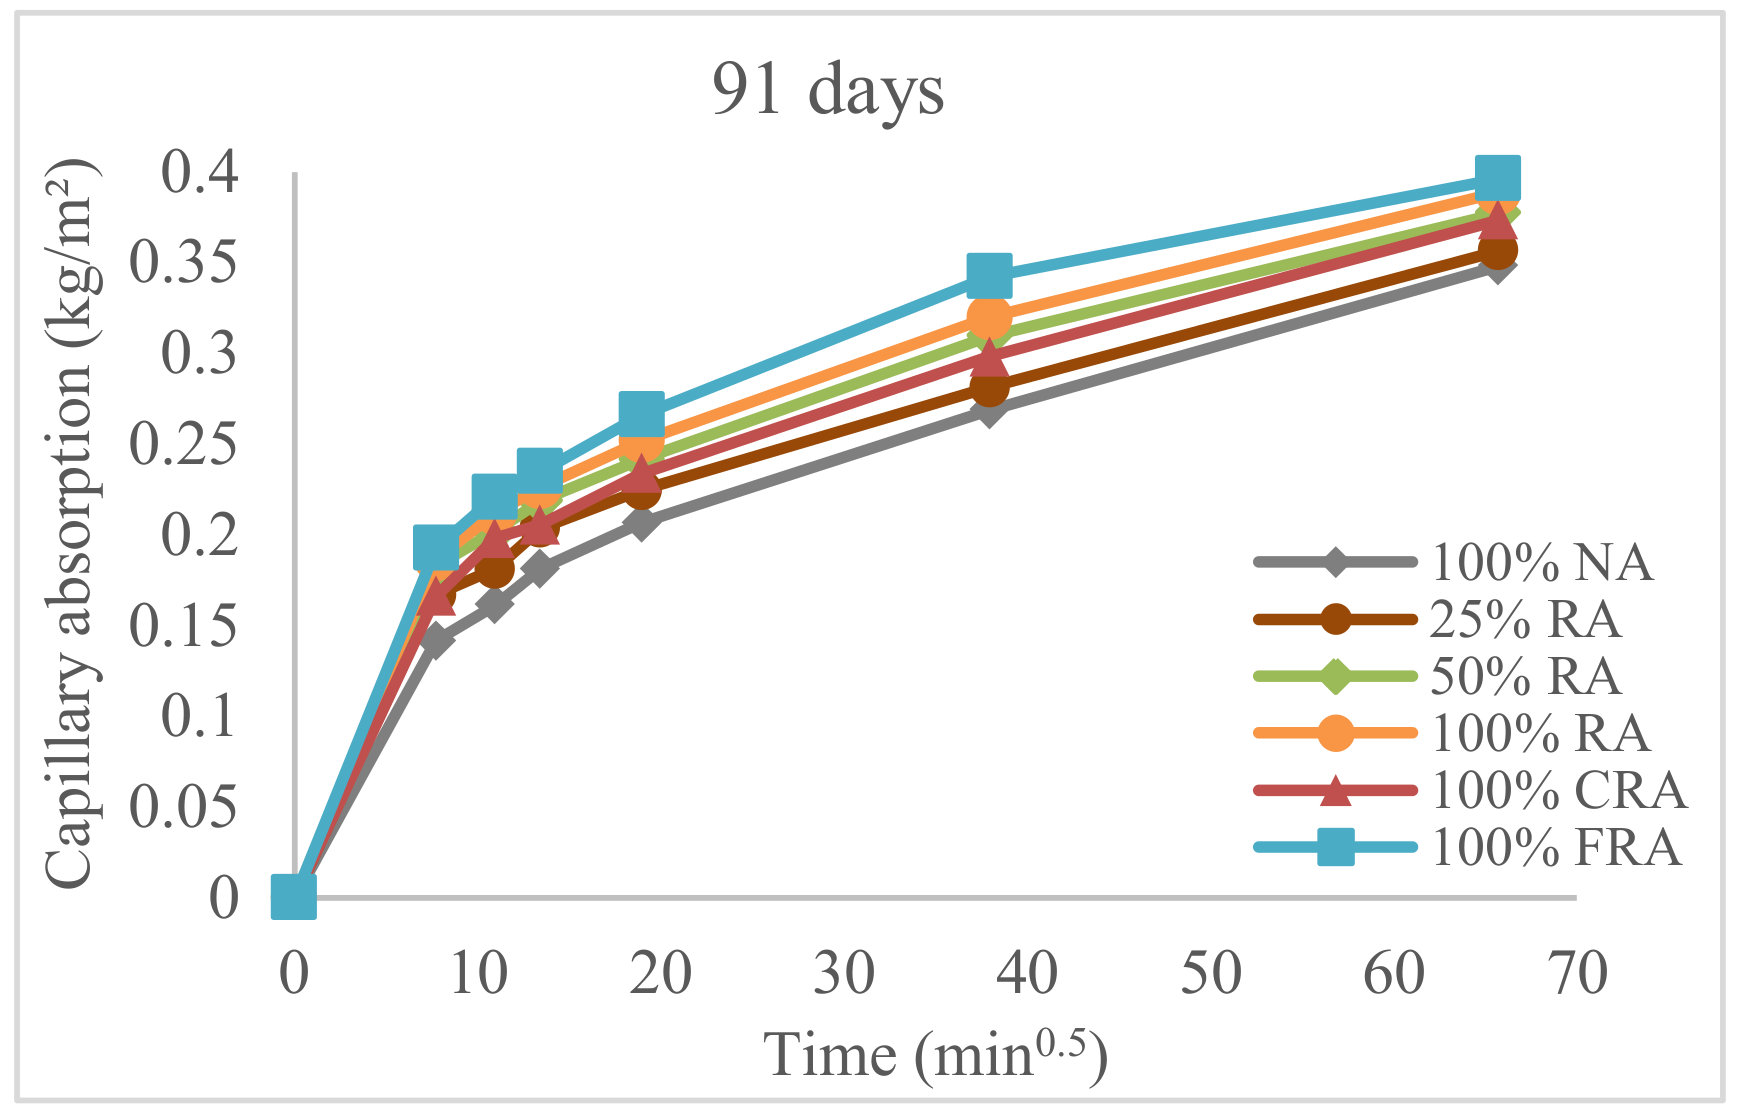
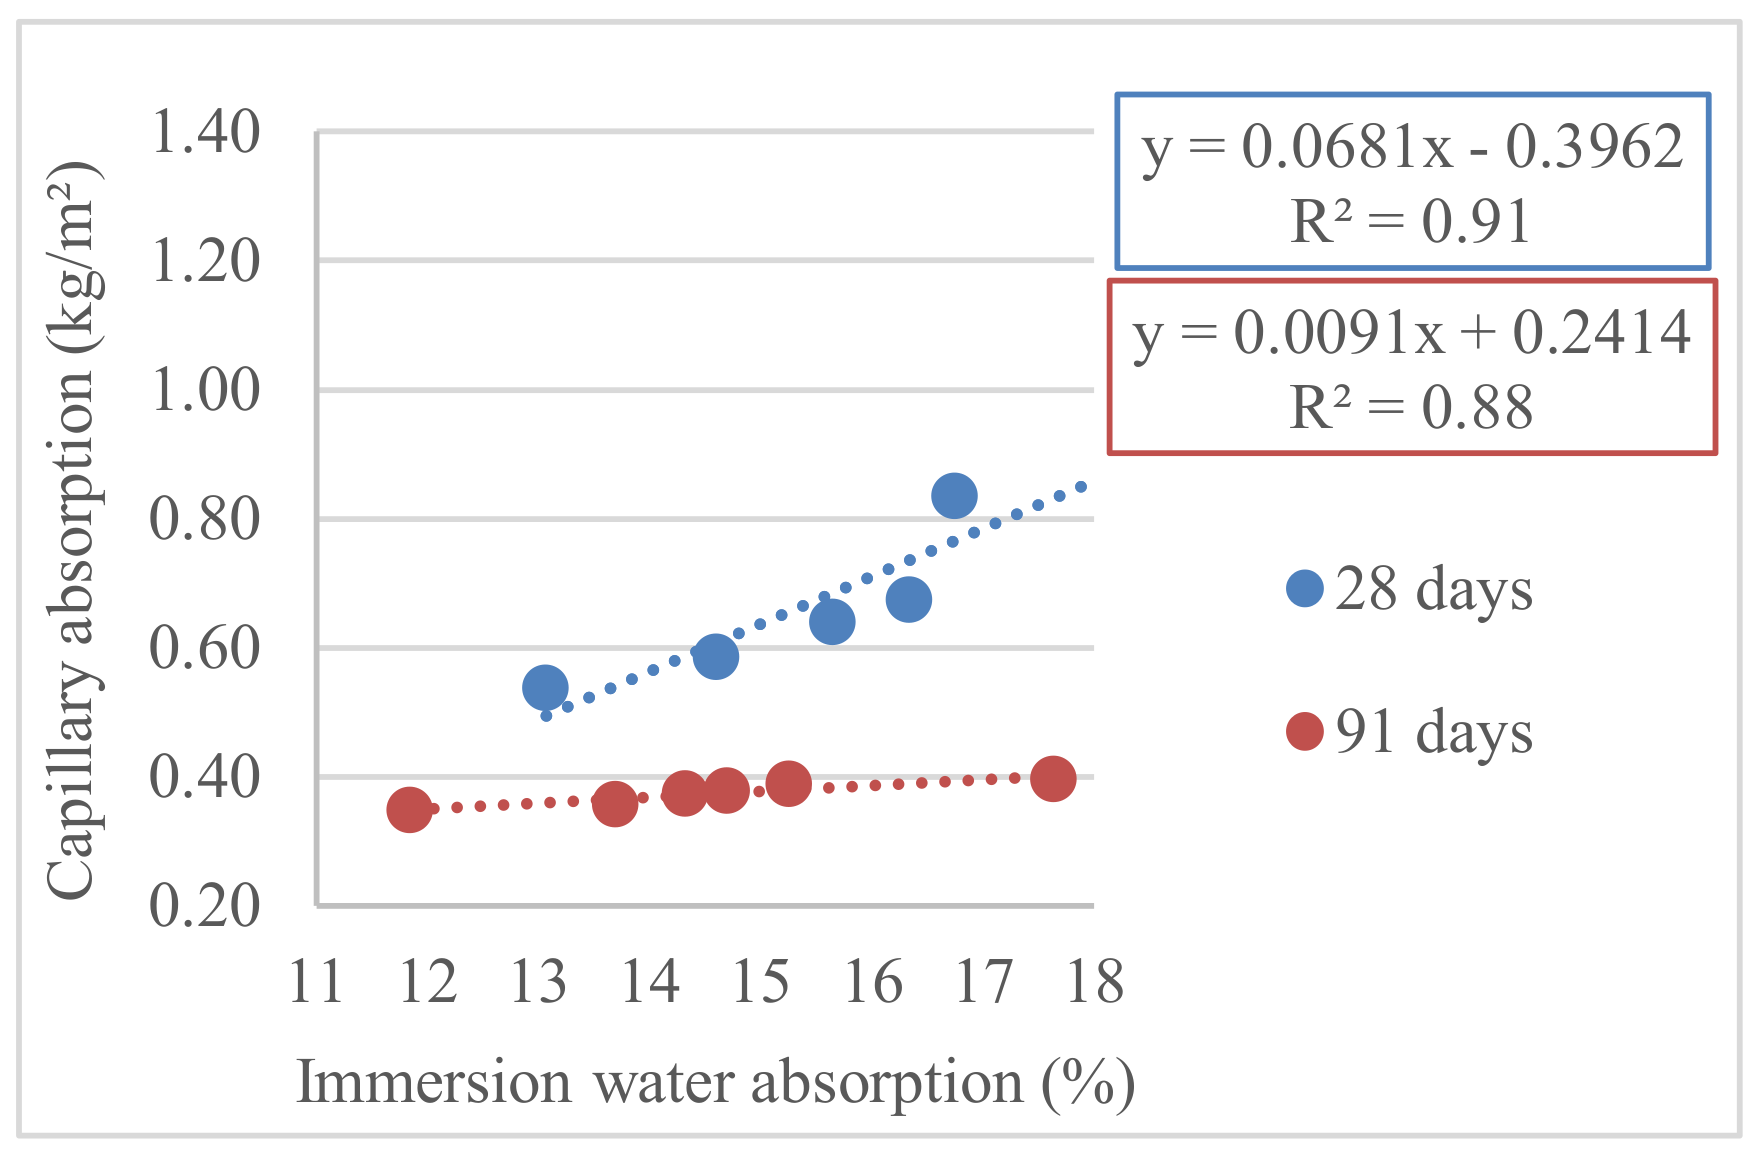
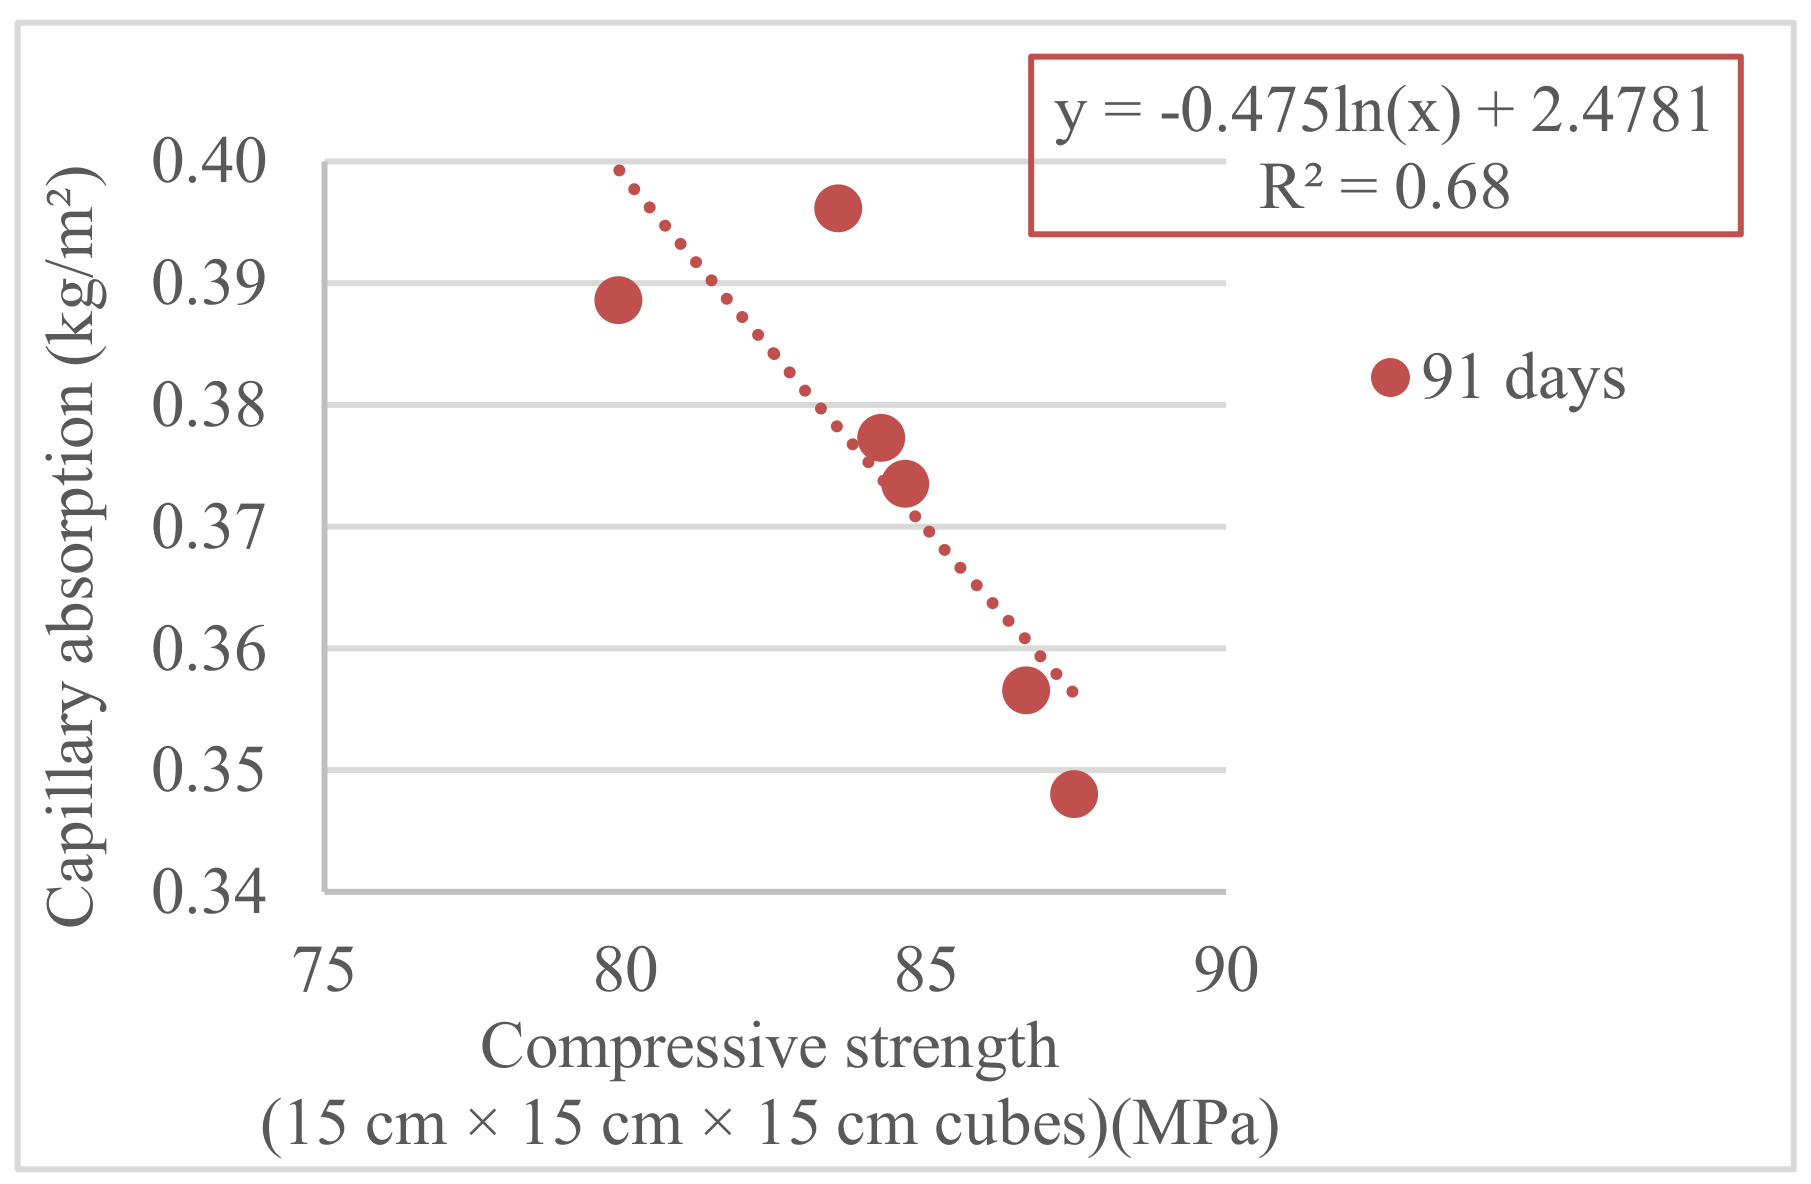
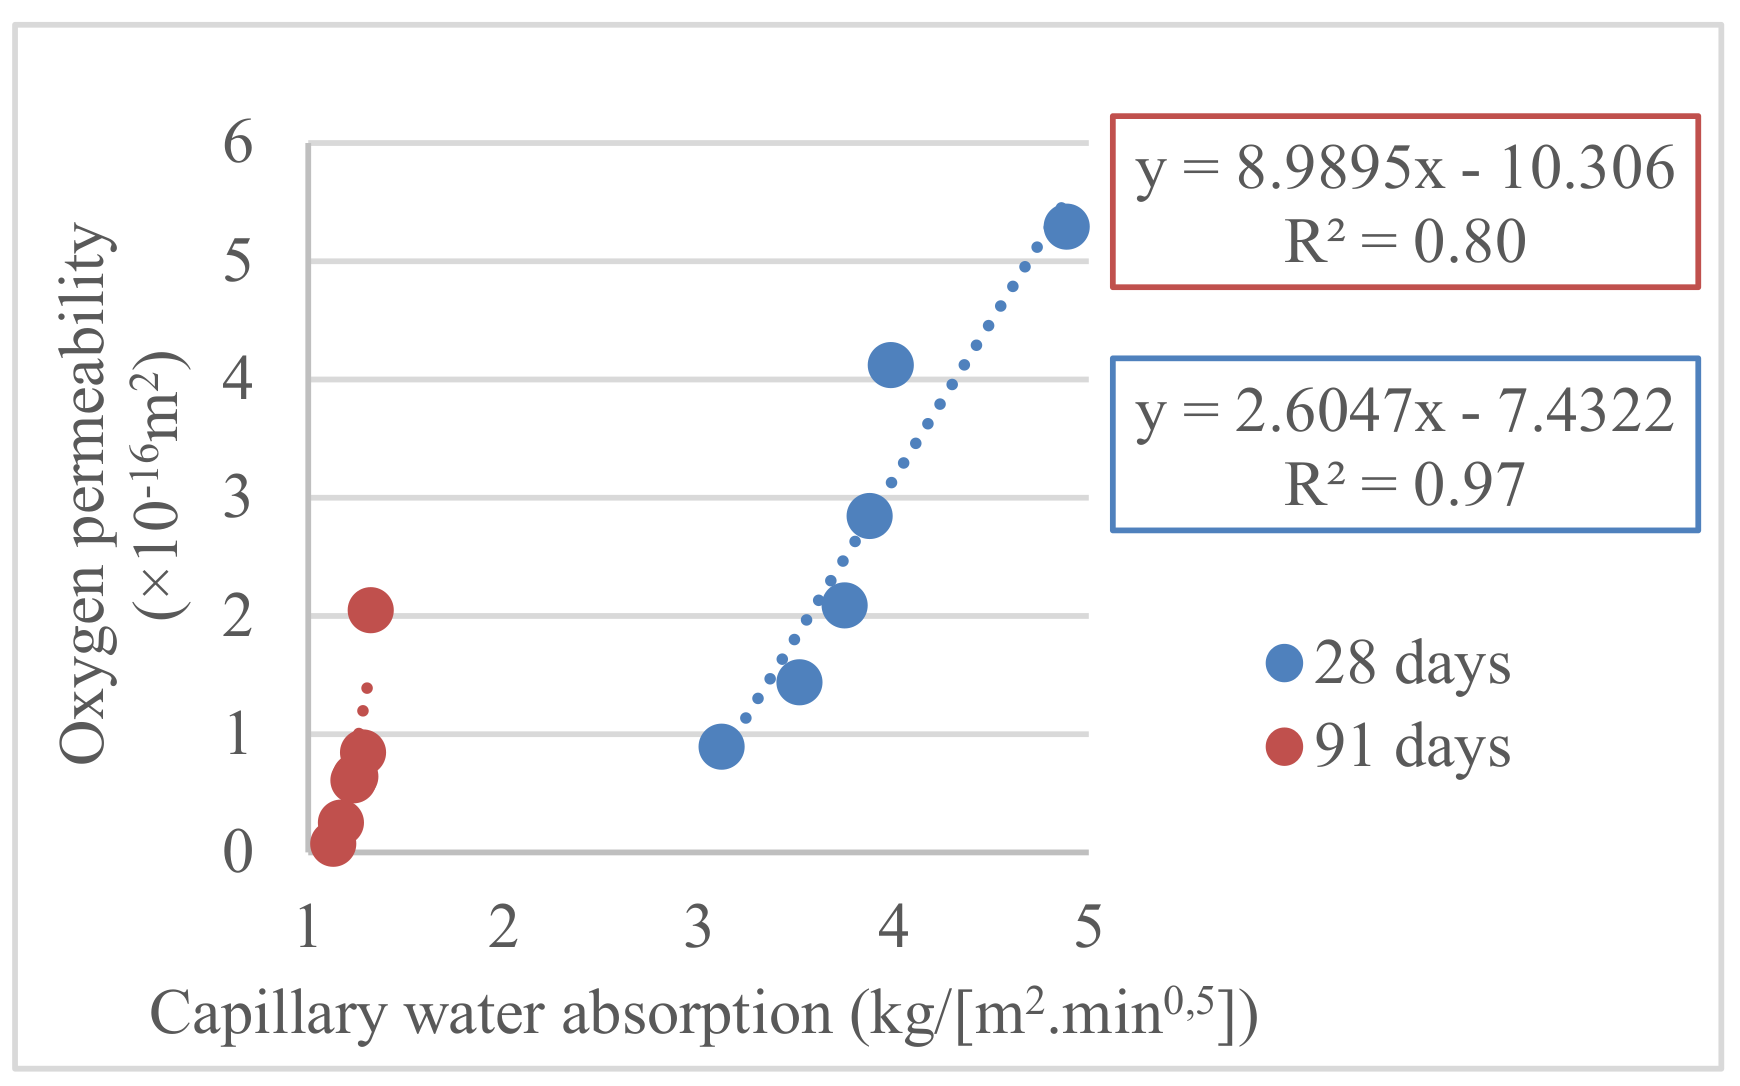
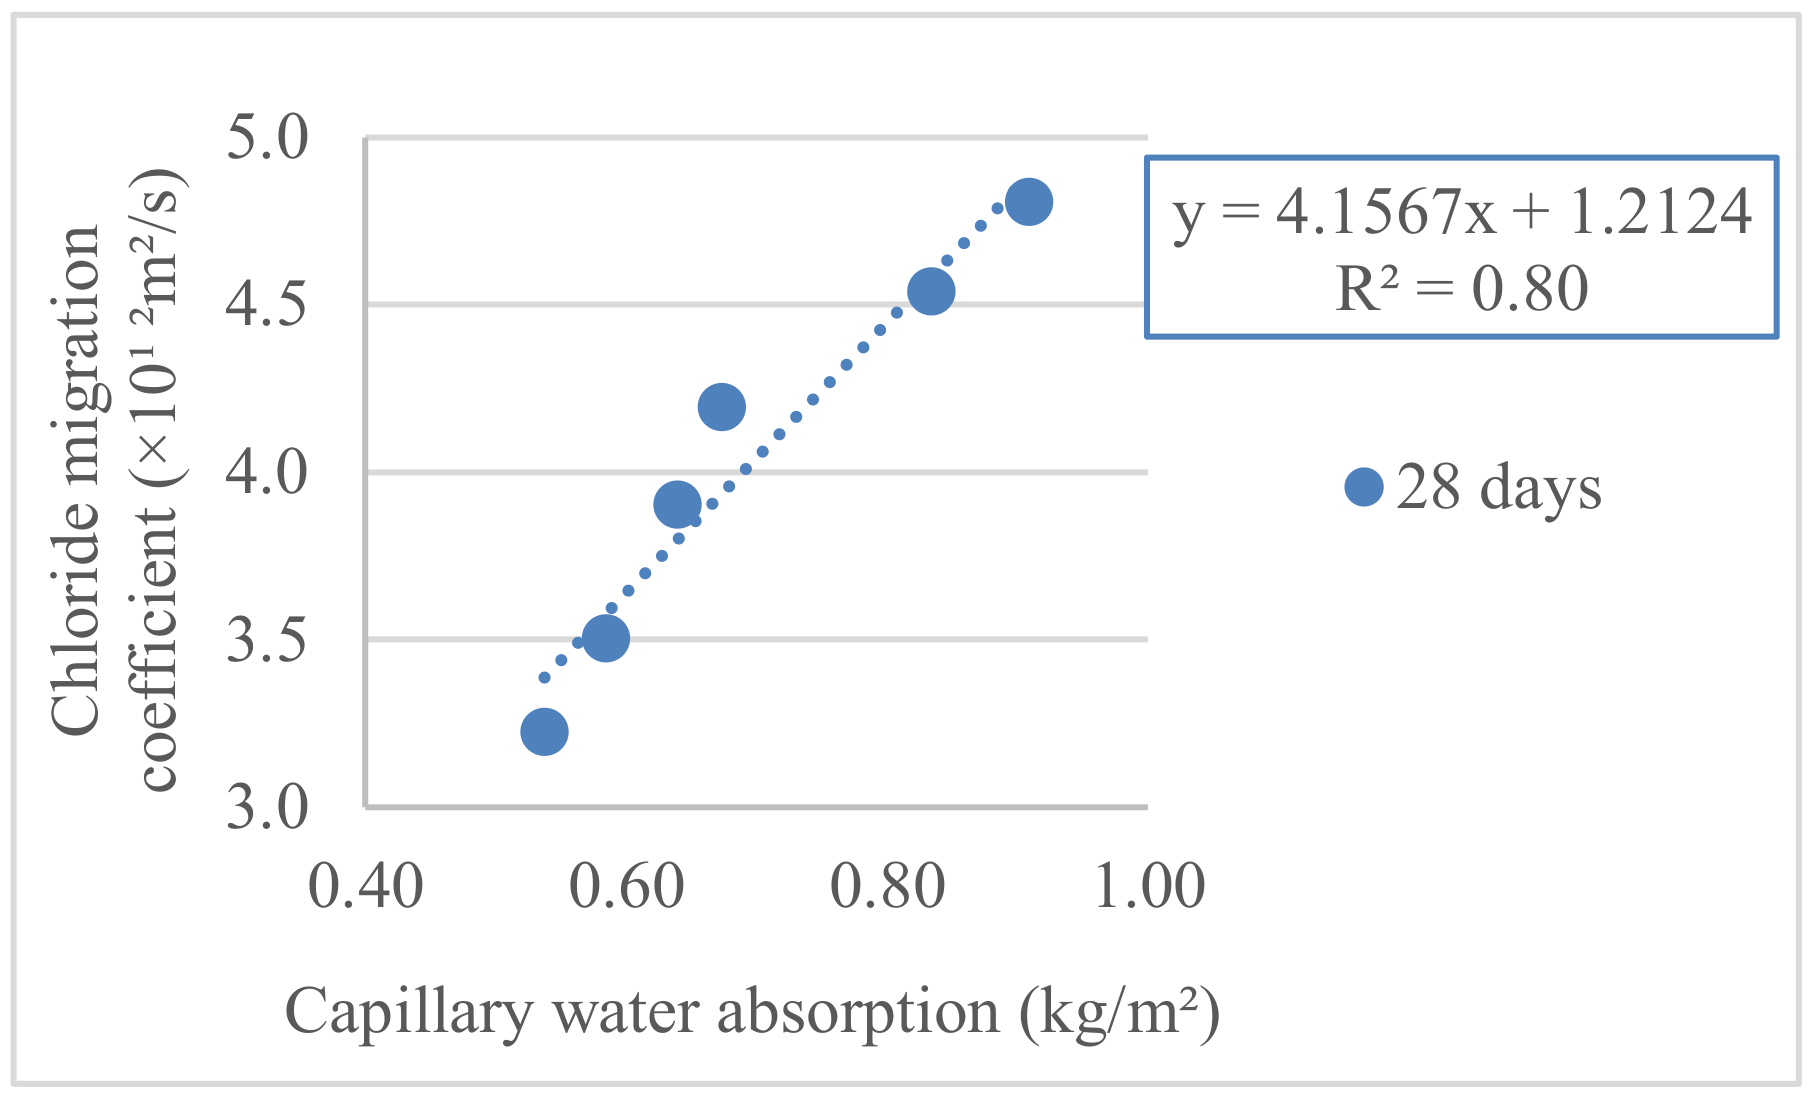
3.2. Capillary Water Absorption Test
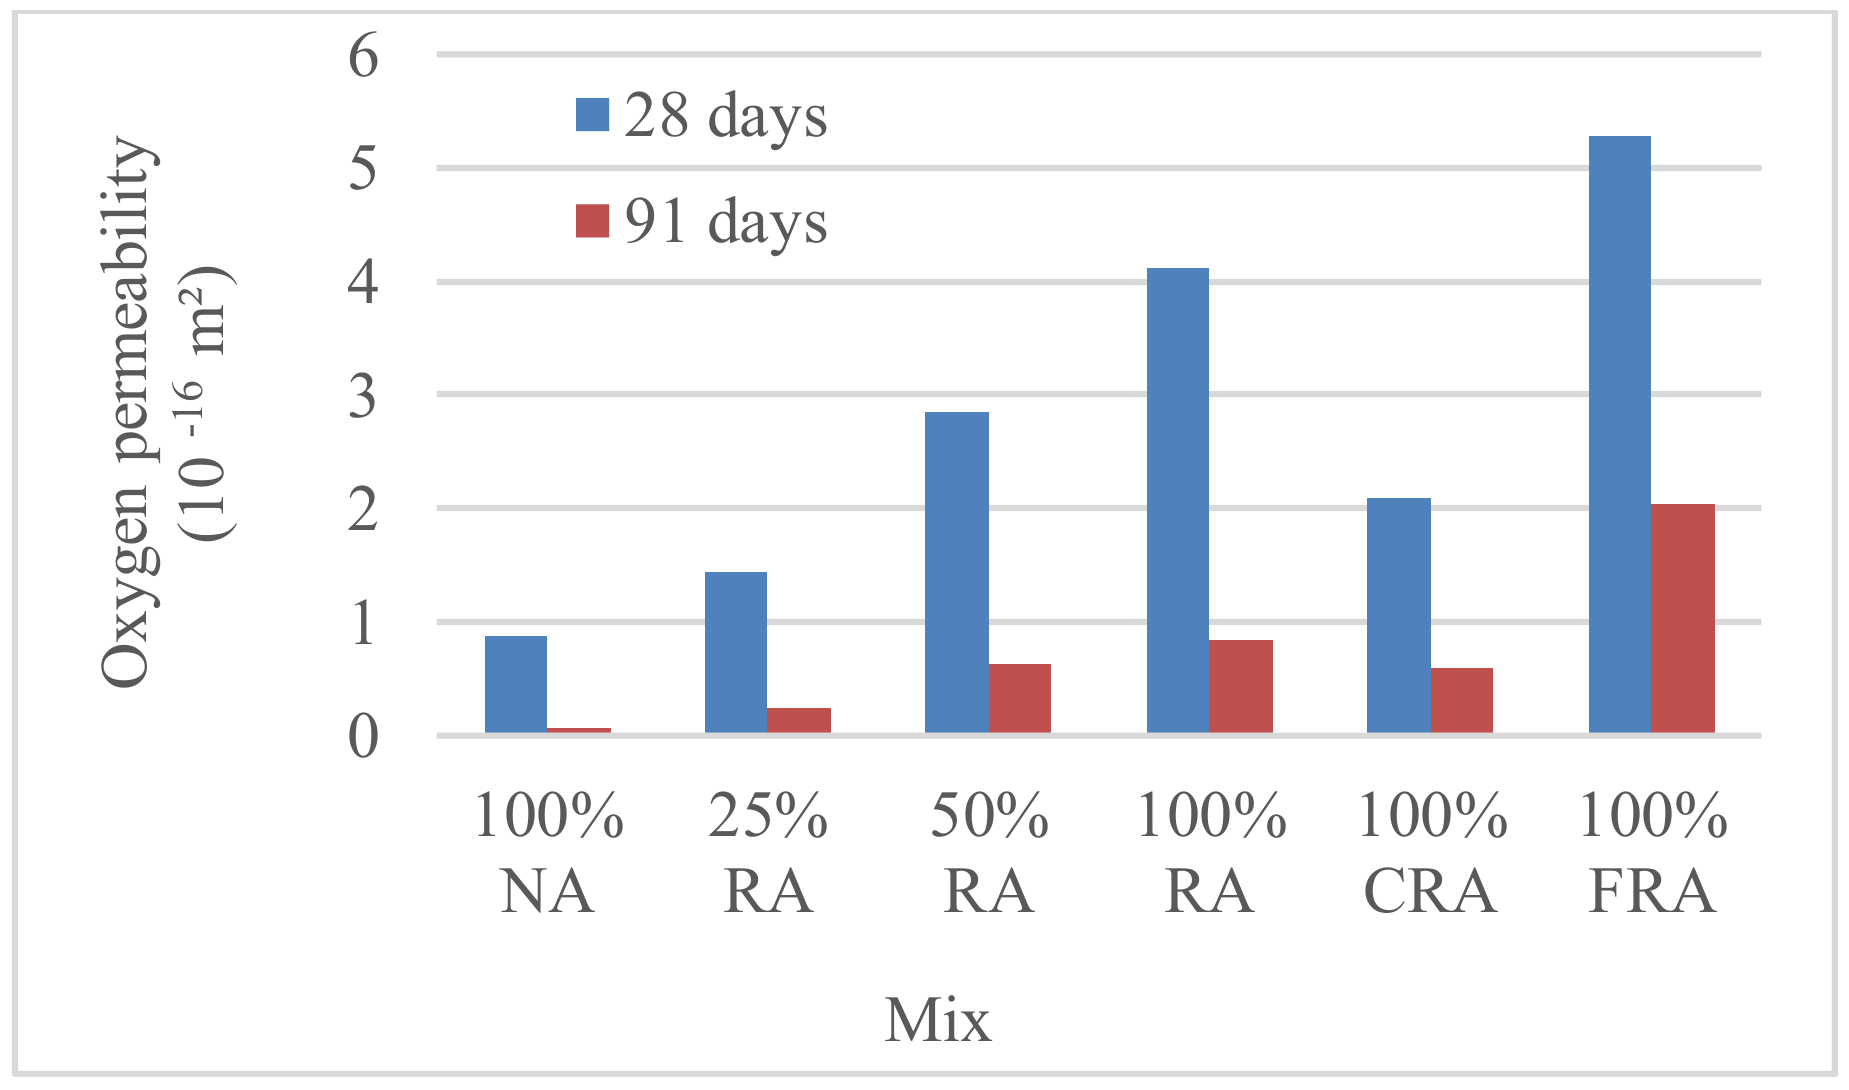
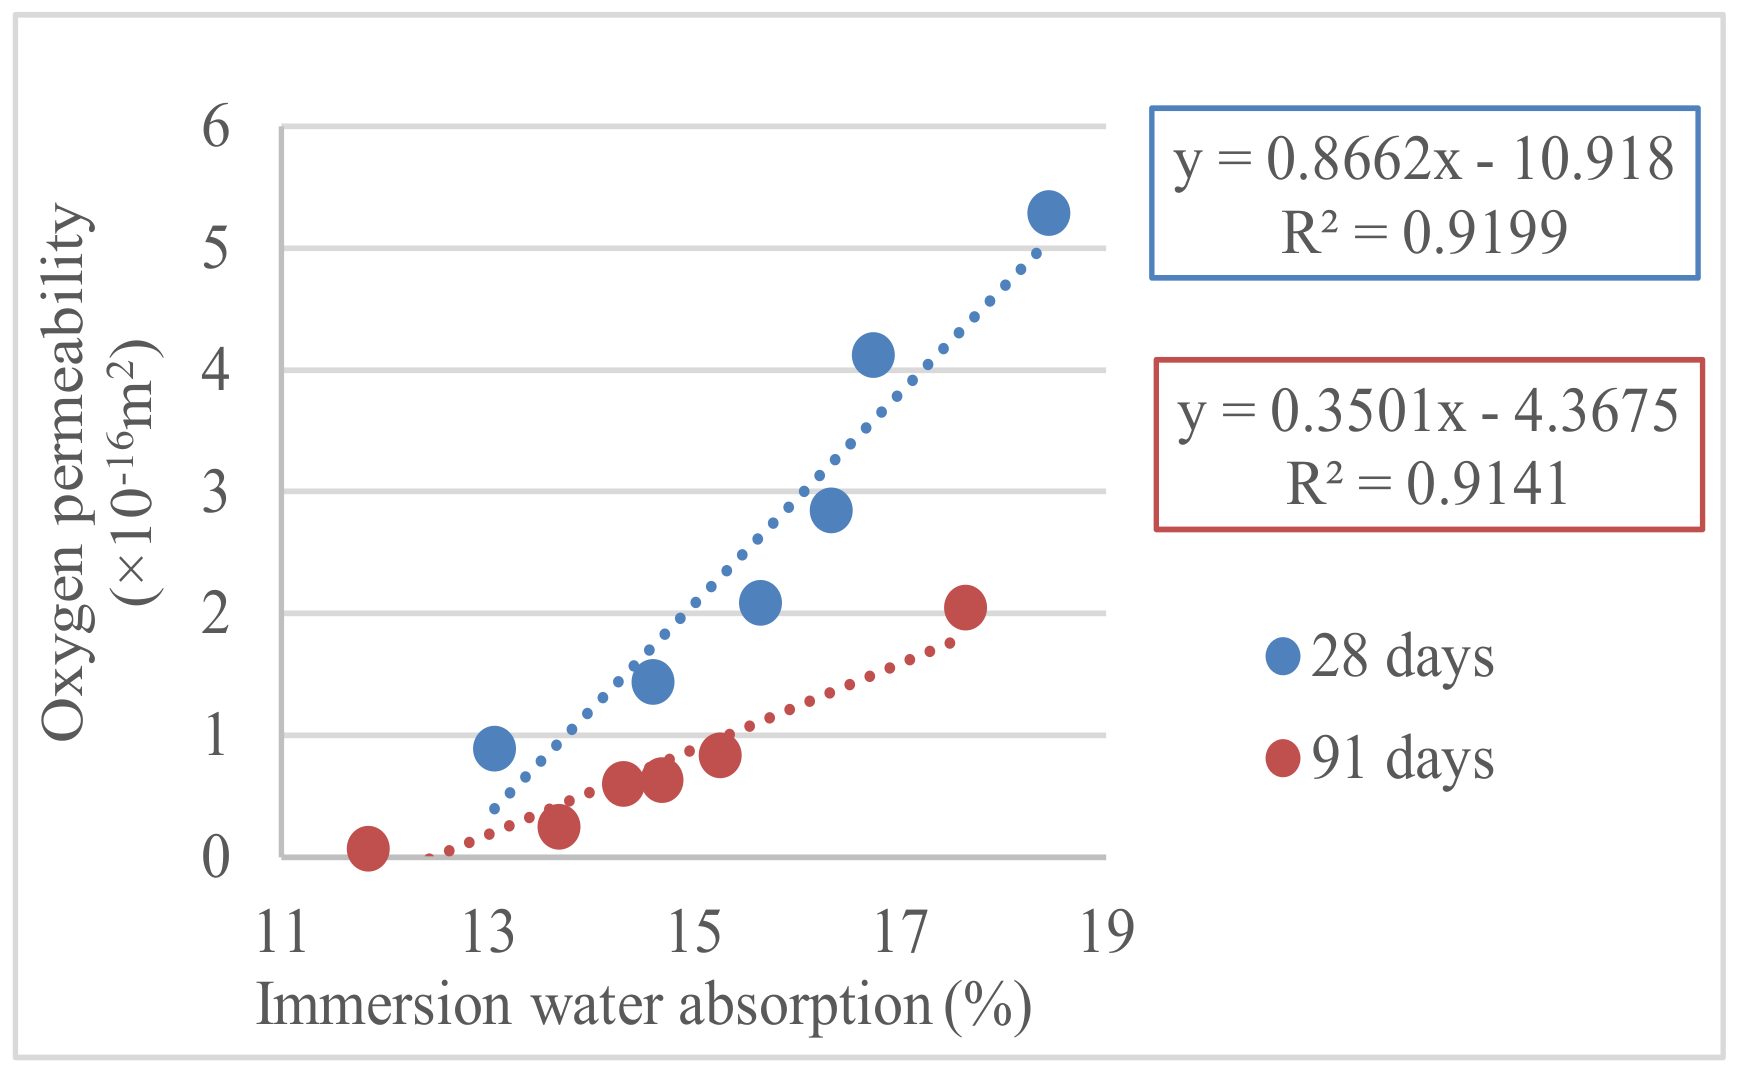
3.3. Oxygen Permeability Test
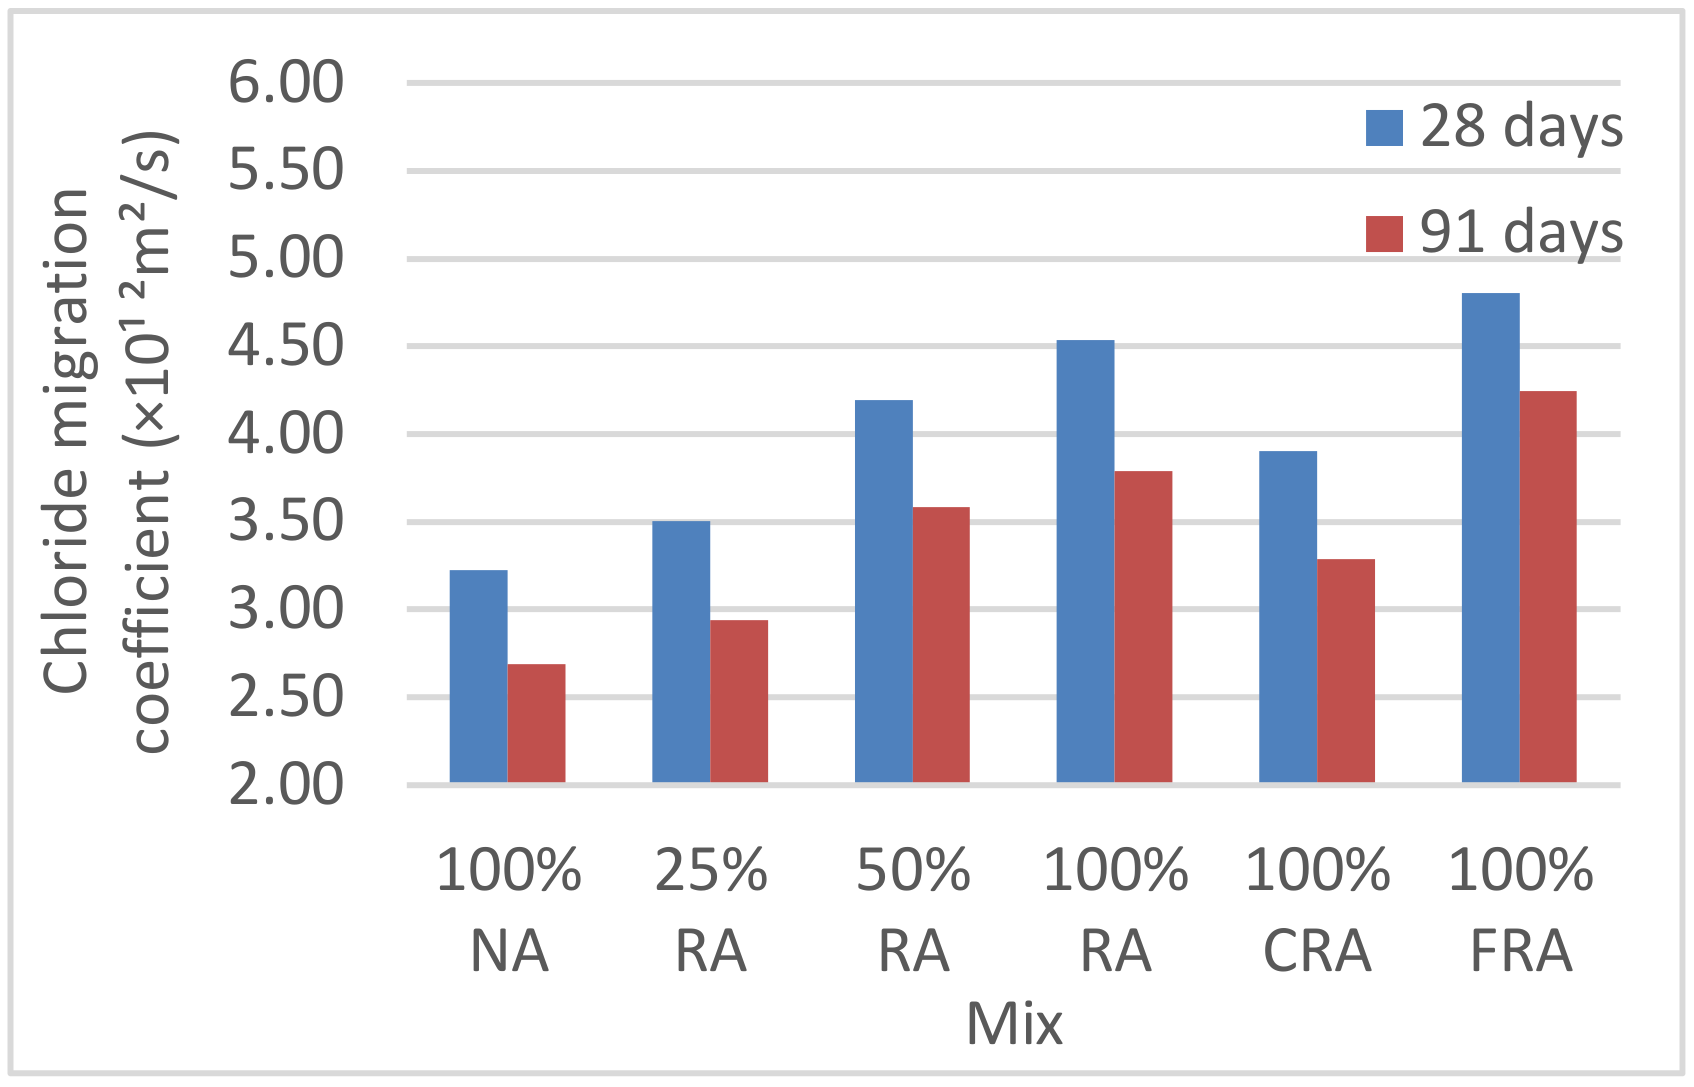
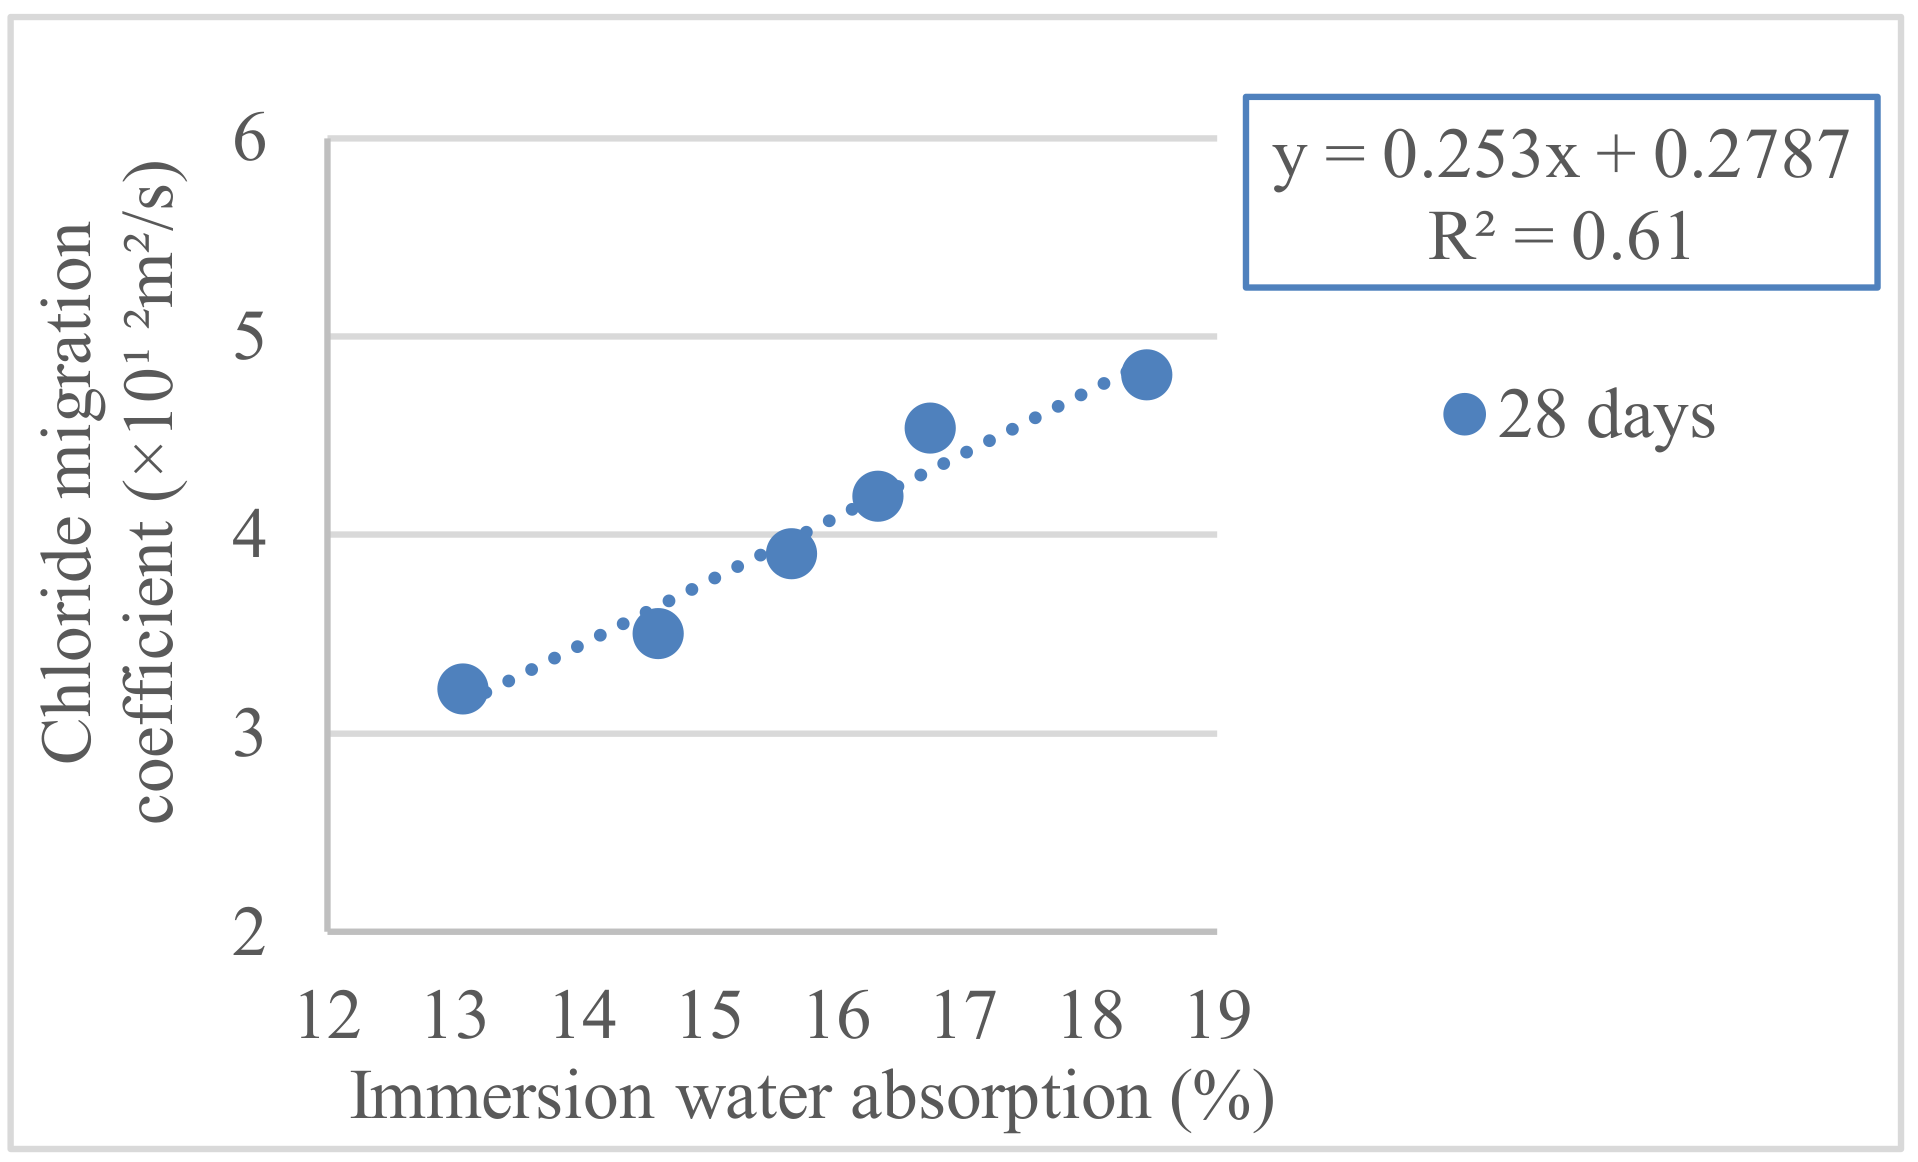
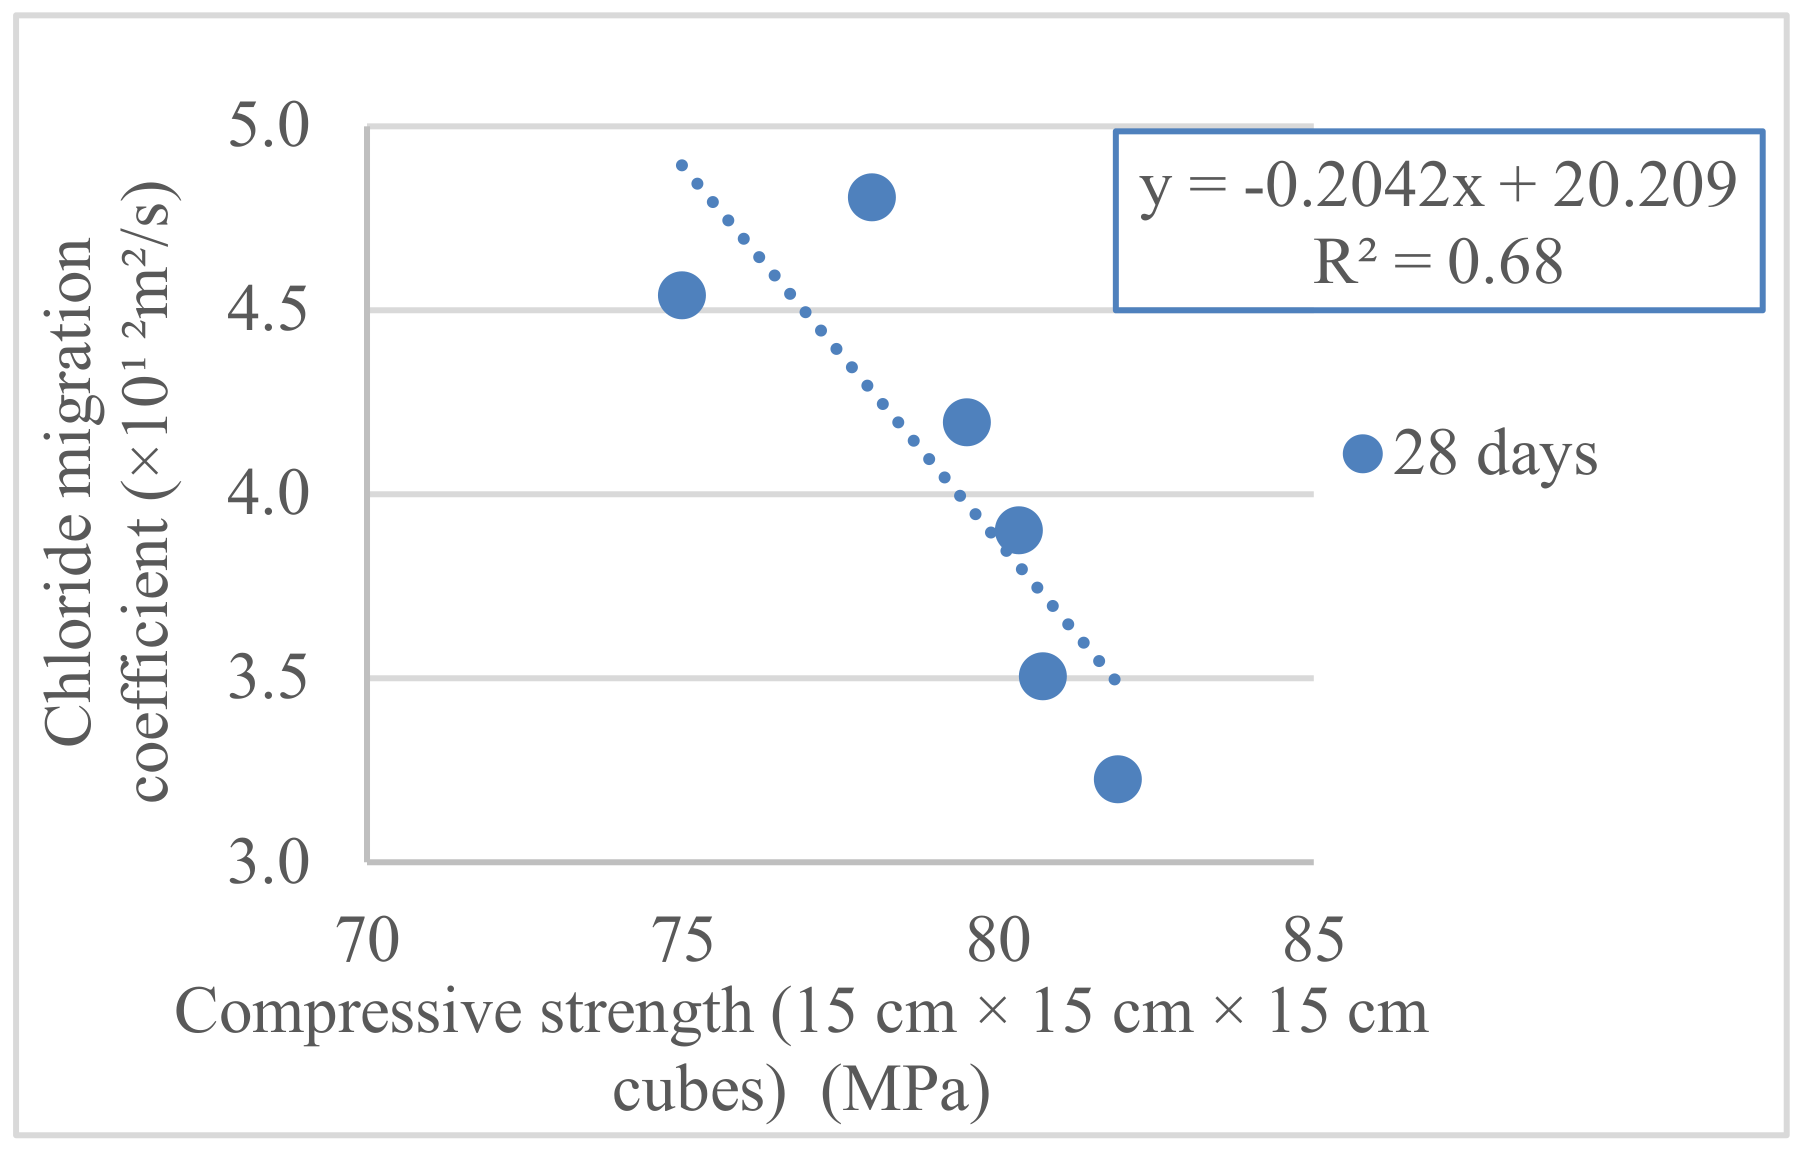
3.4. Chloride Migration Test
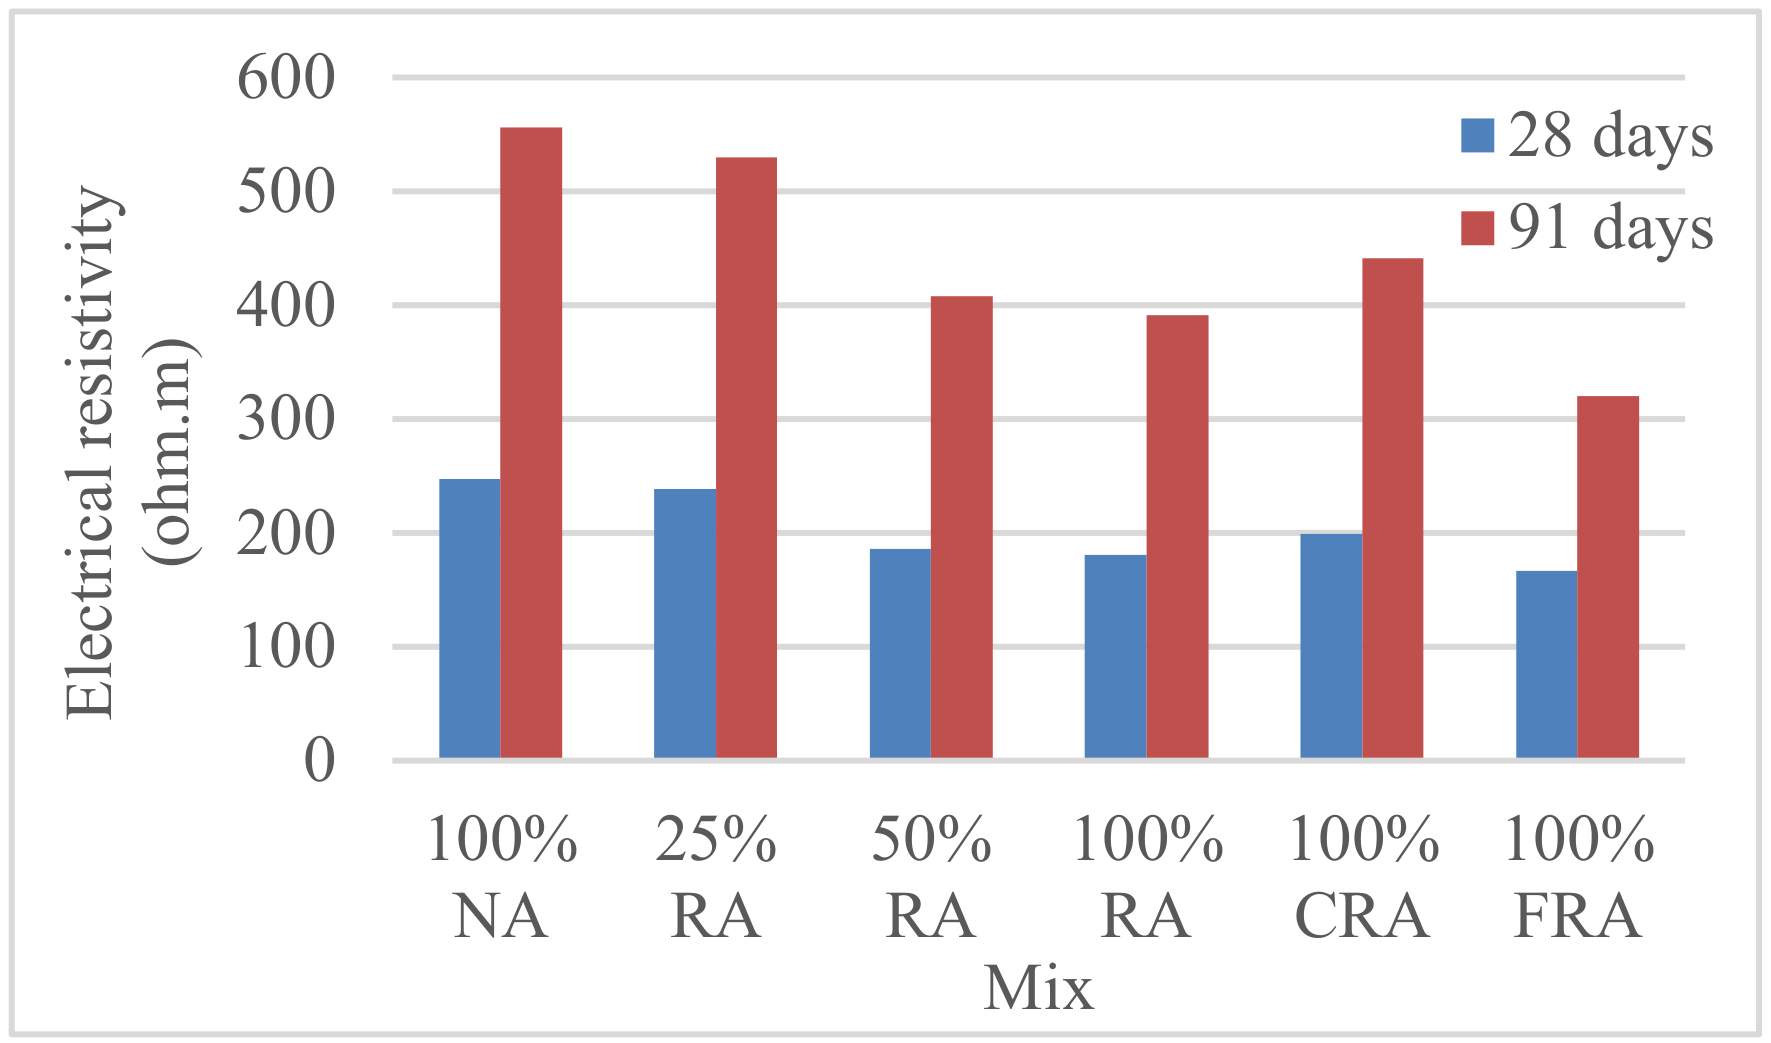
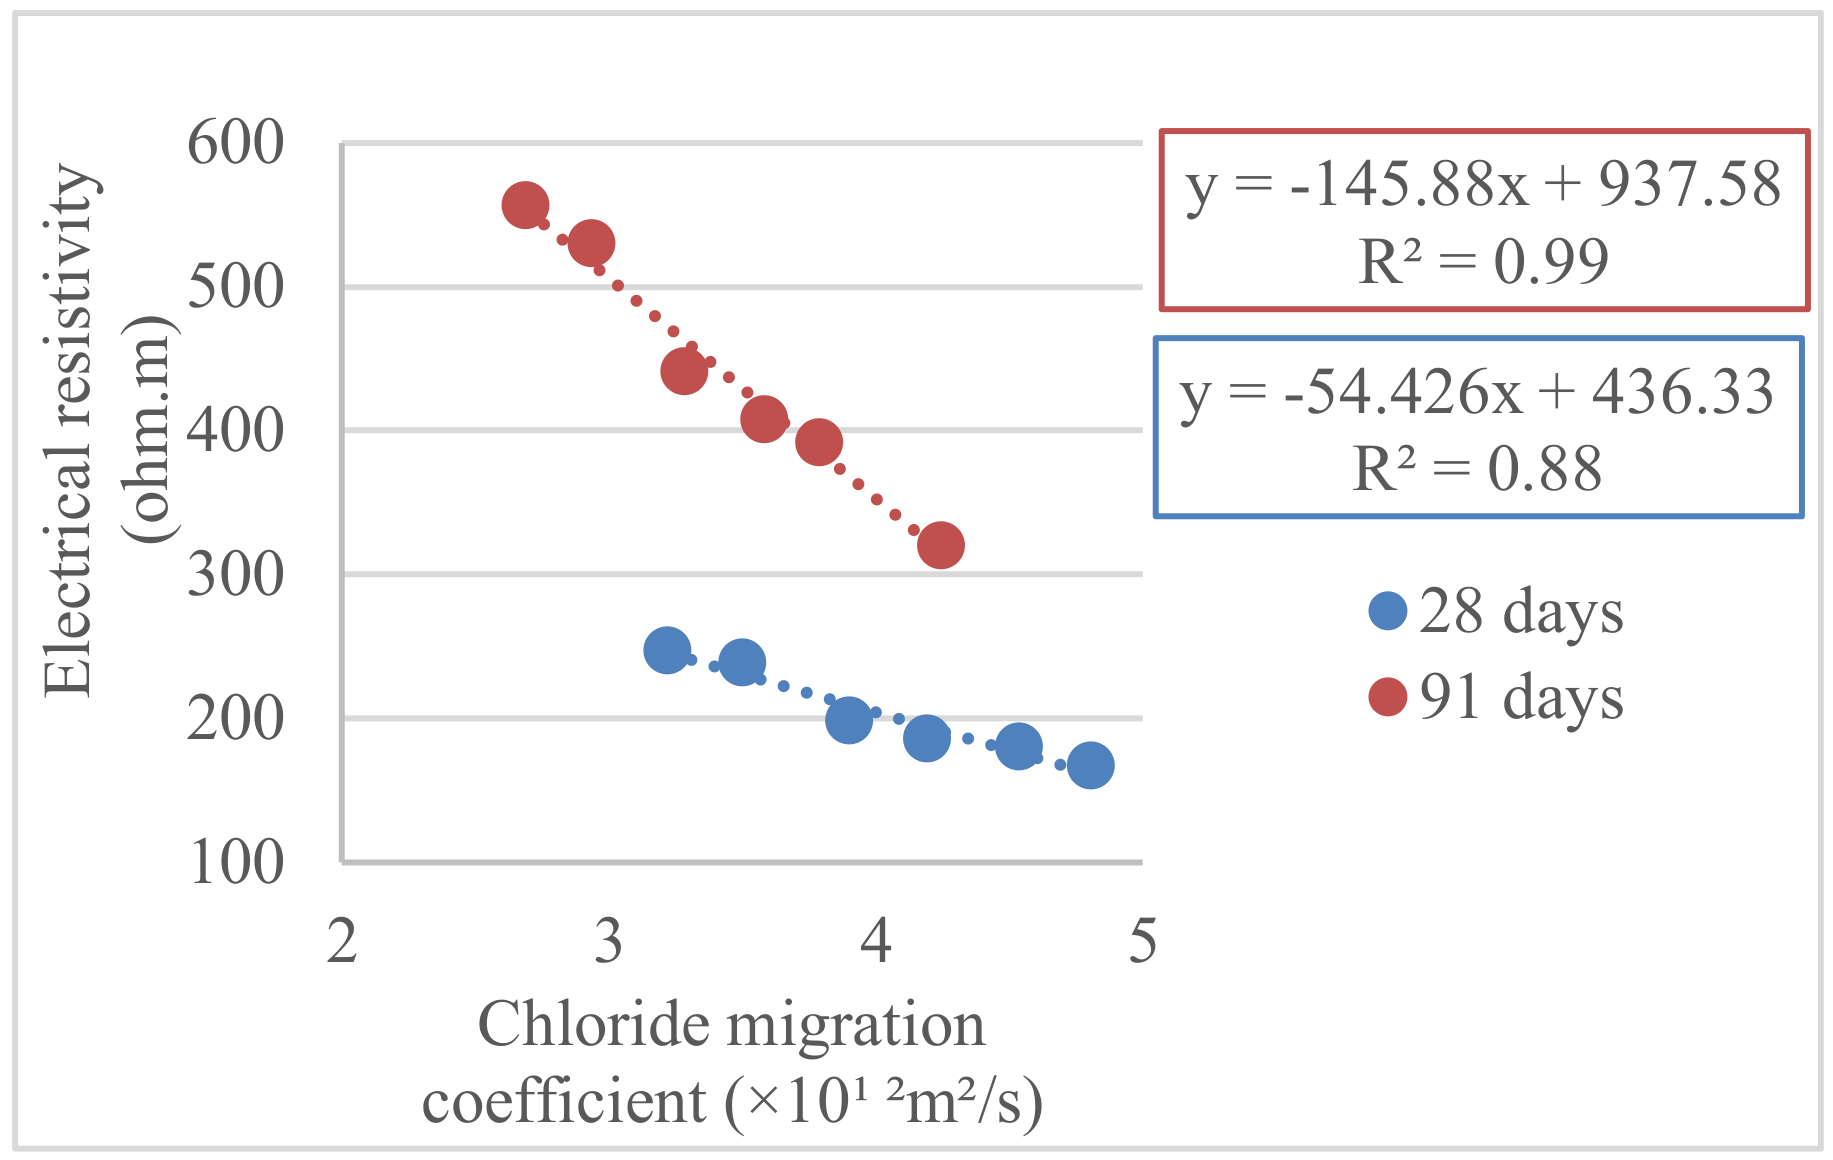
3.5. Electrical Resistivity Test
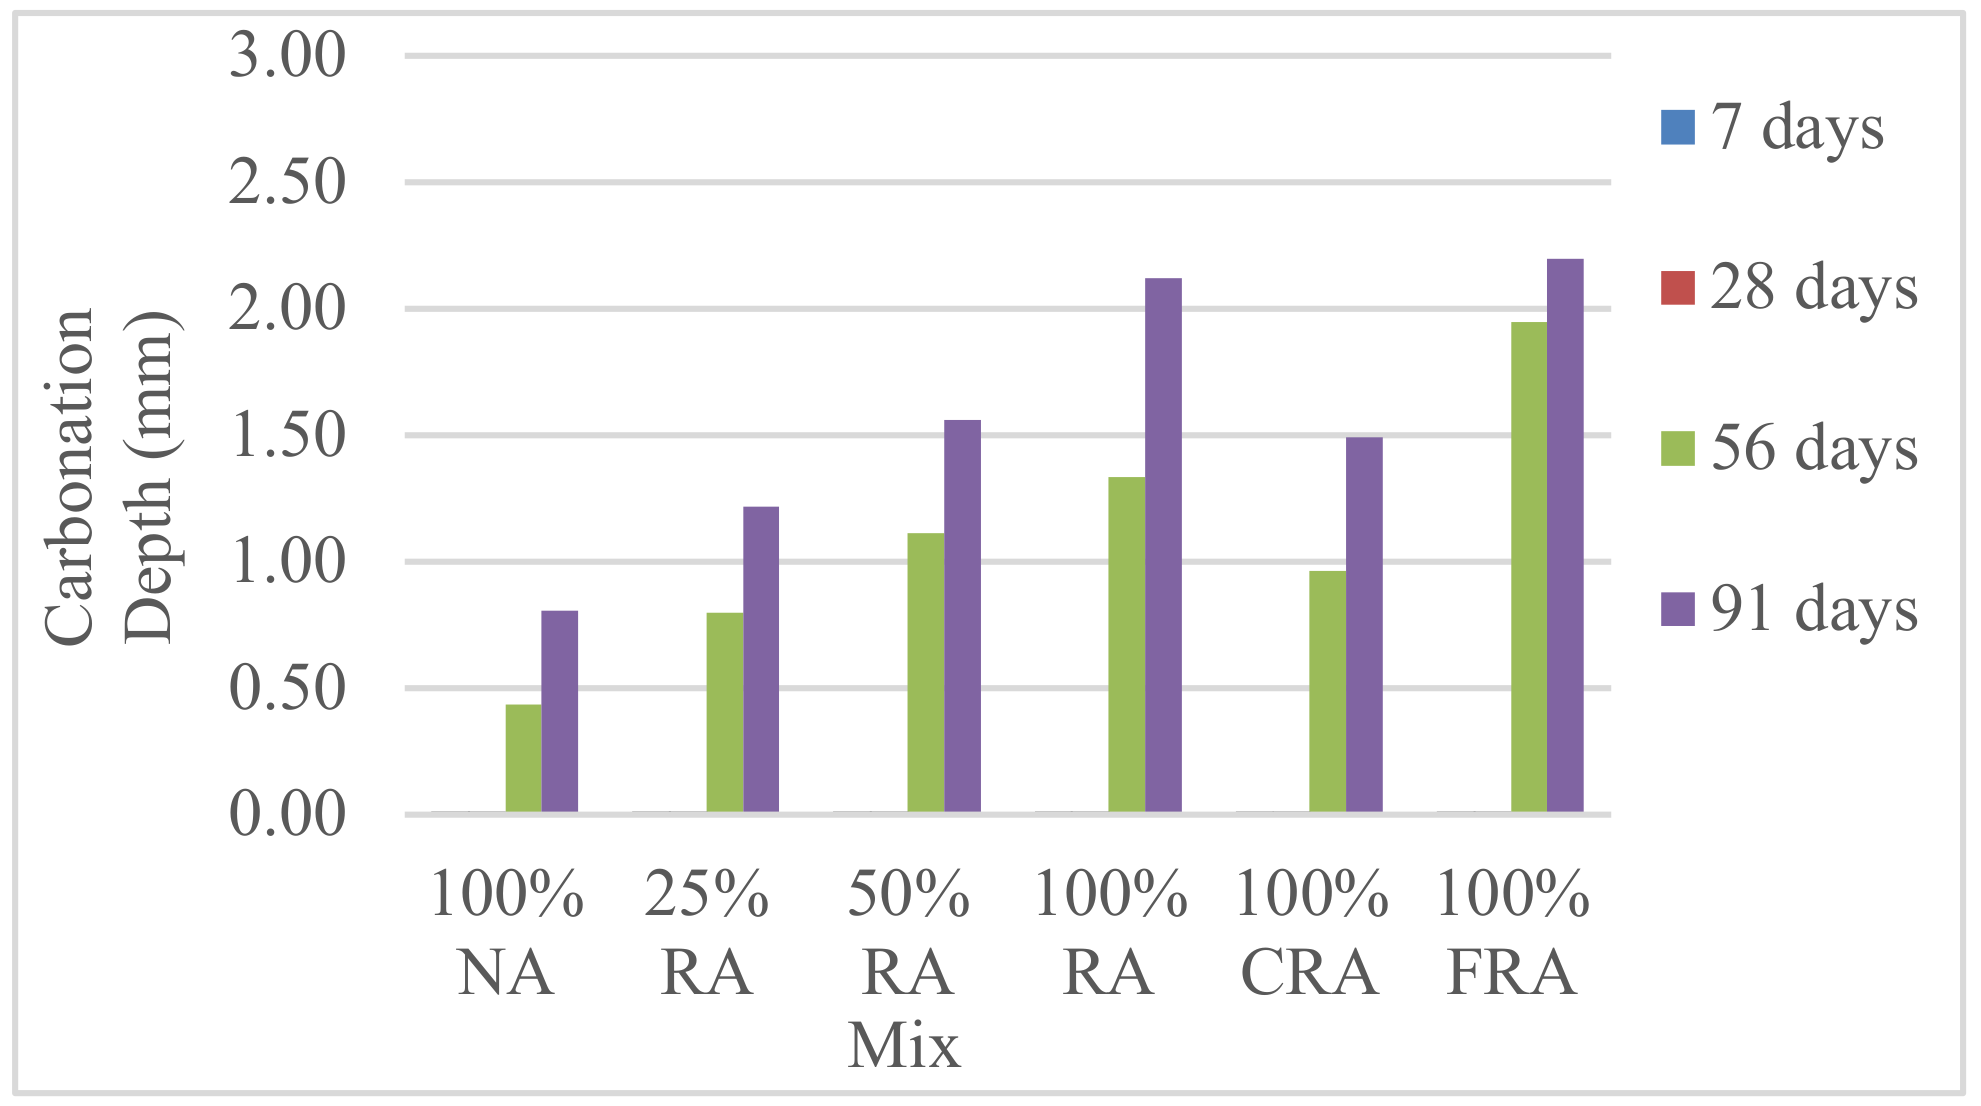
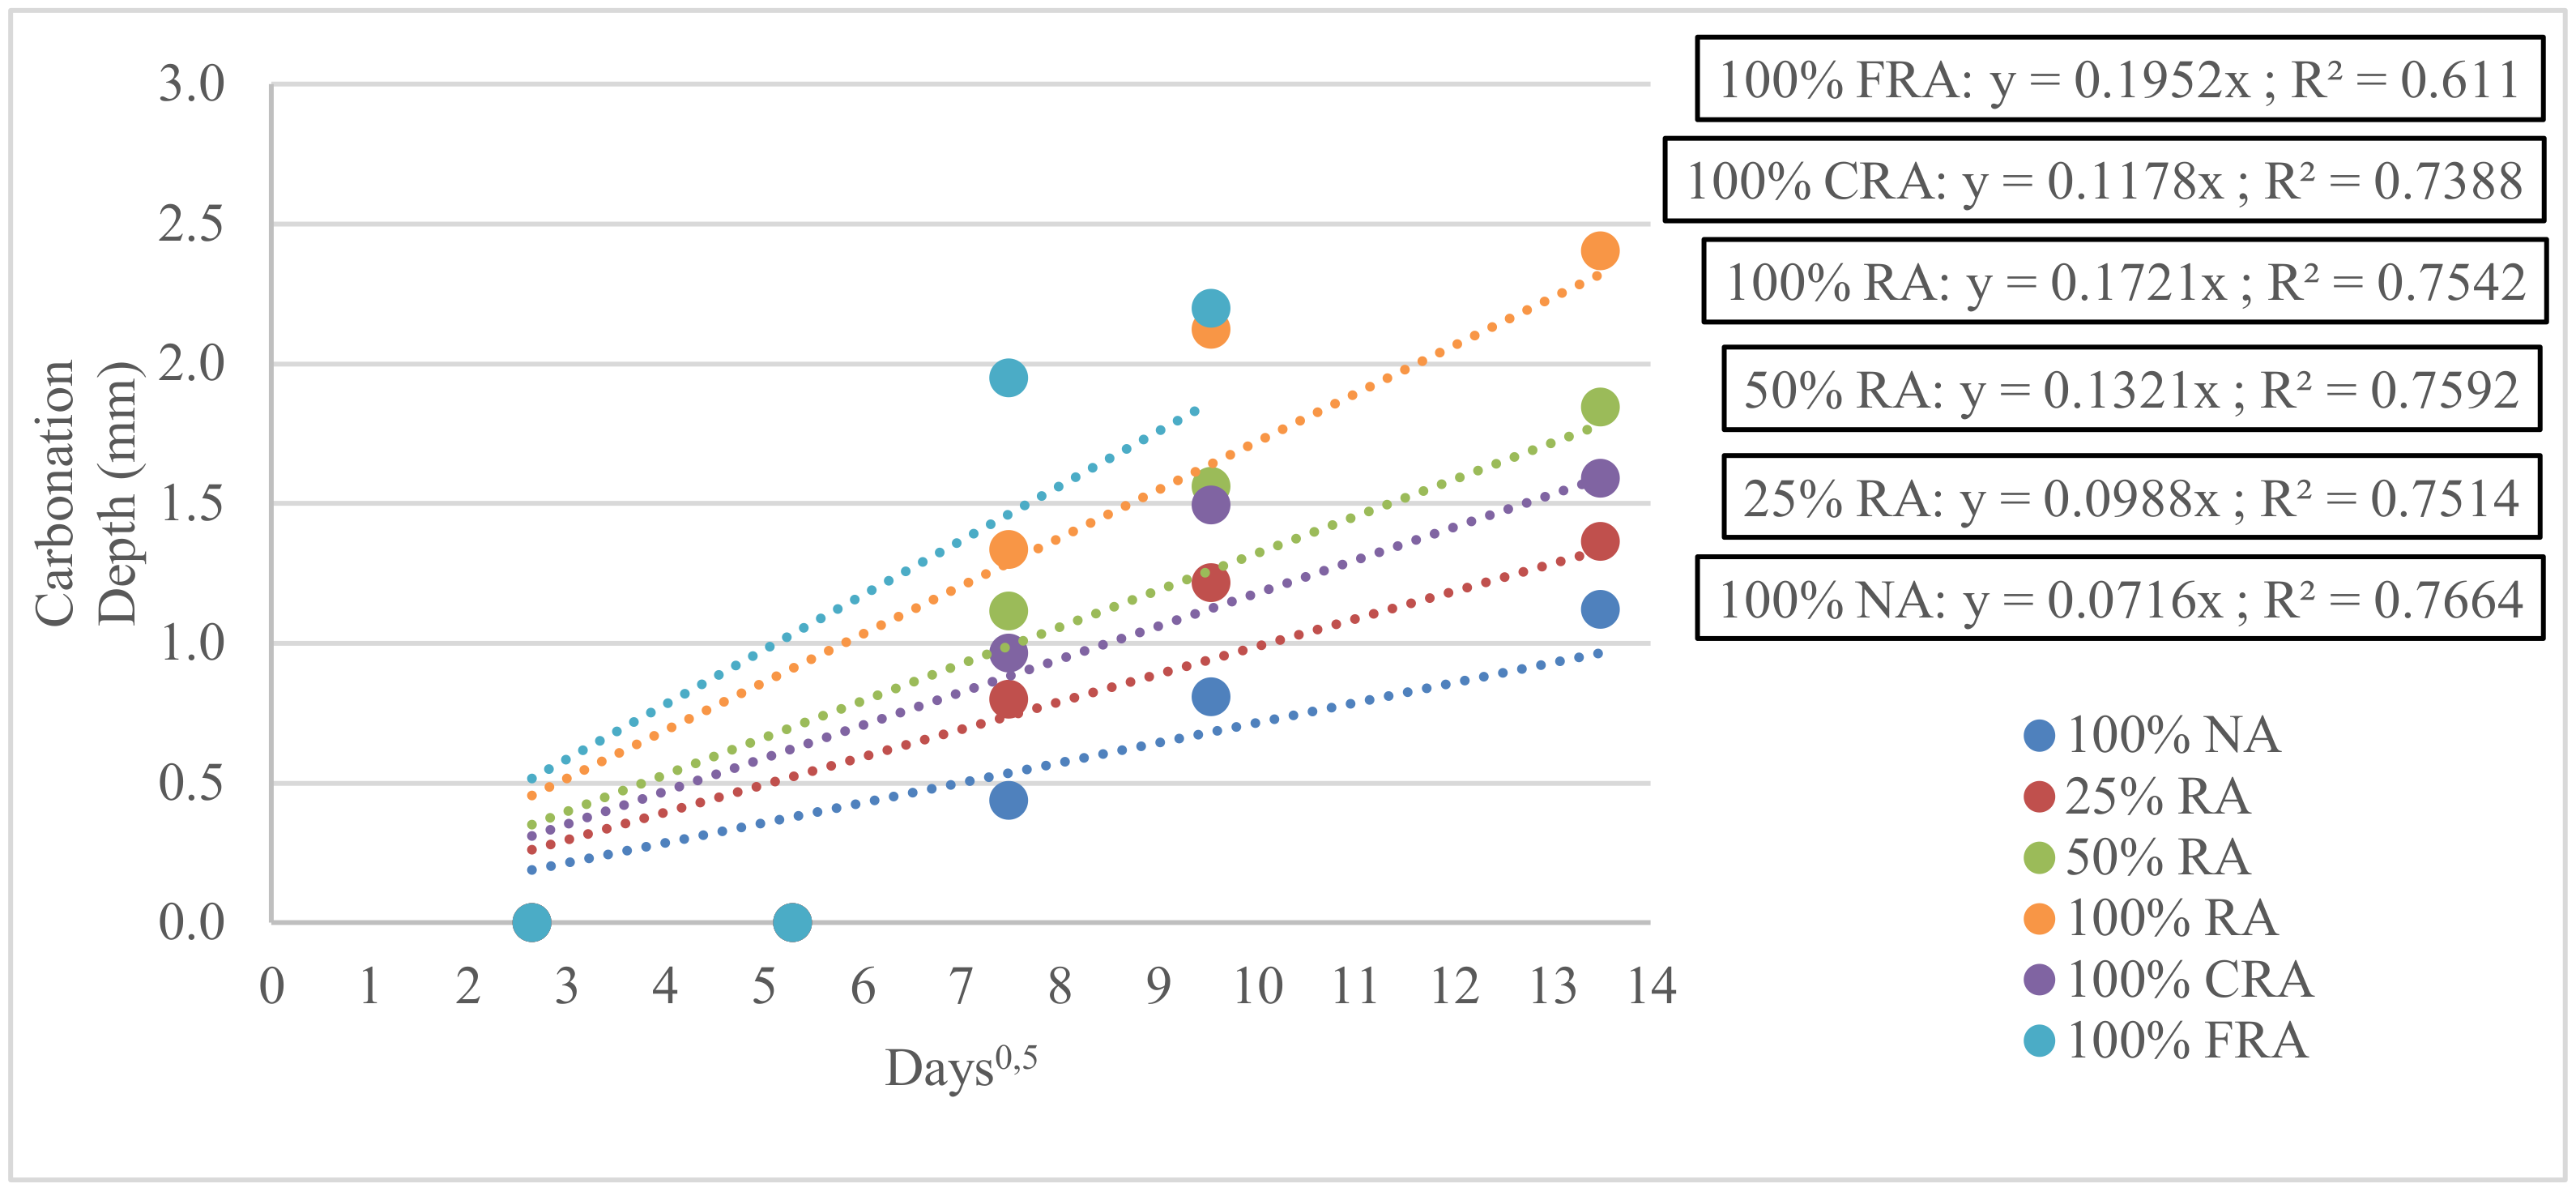
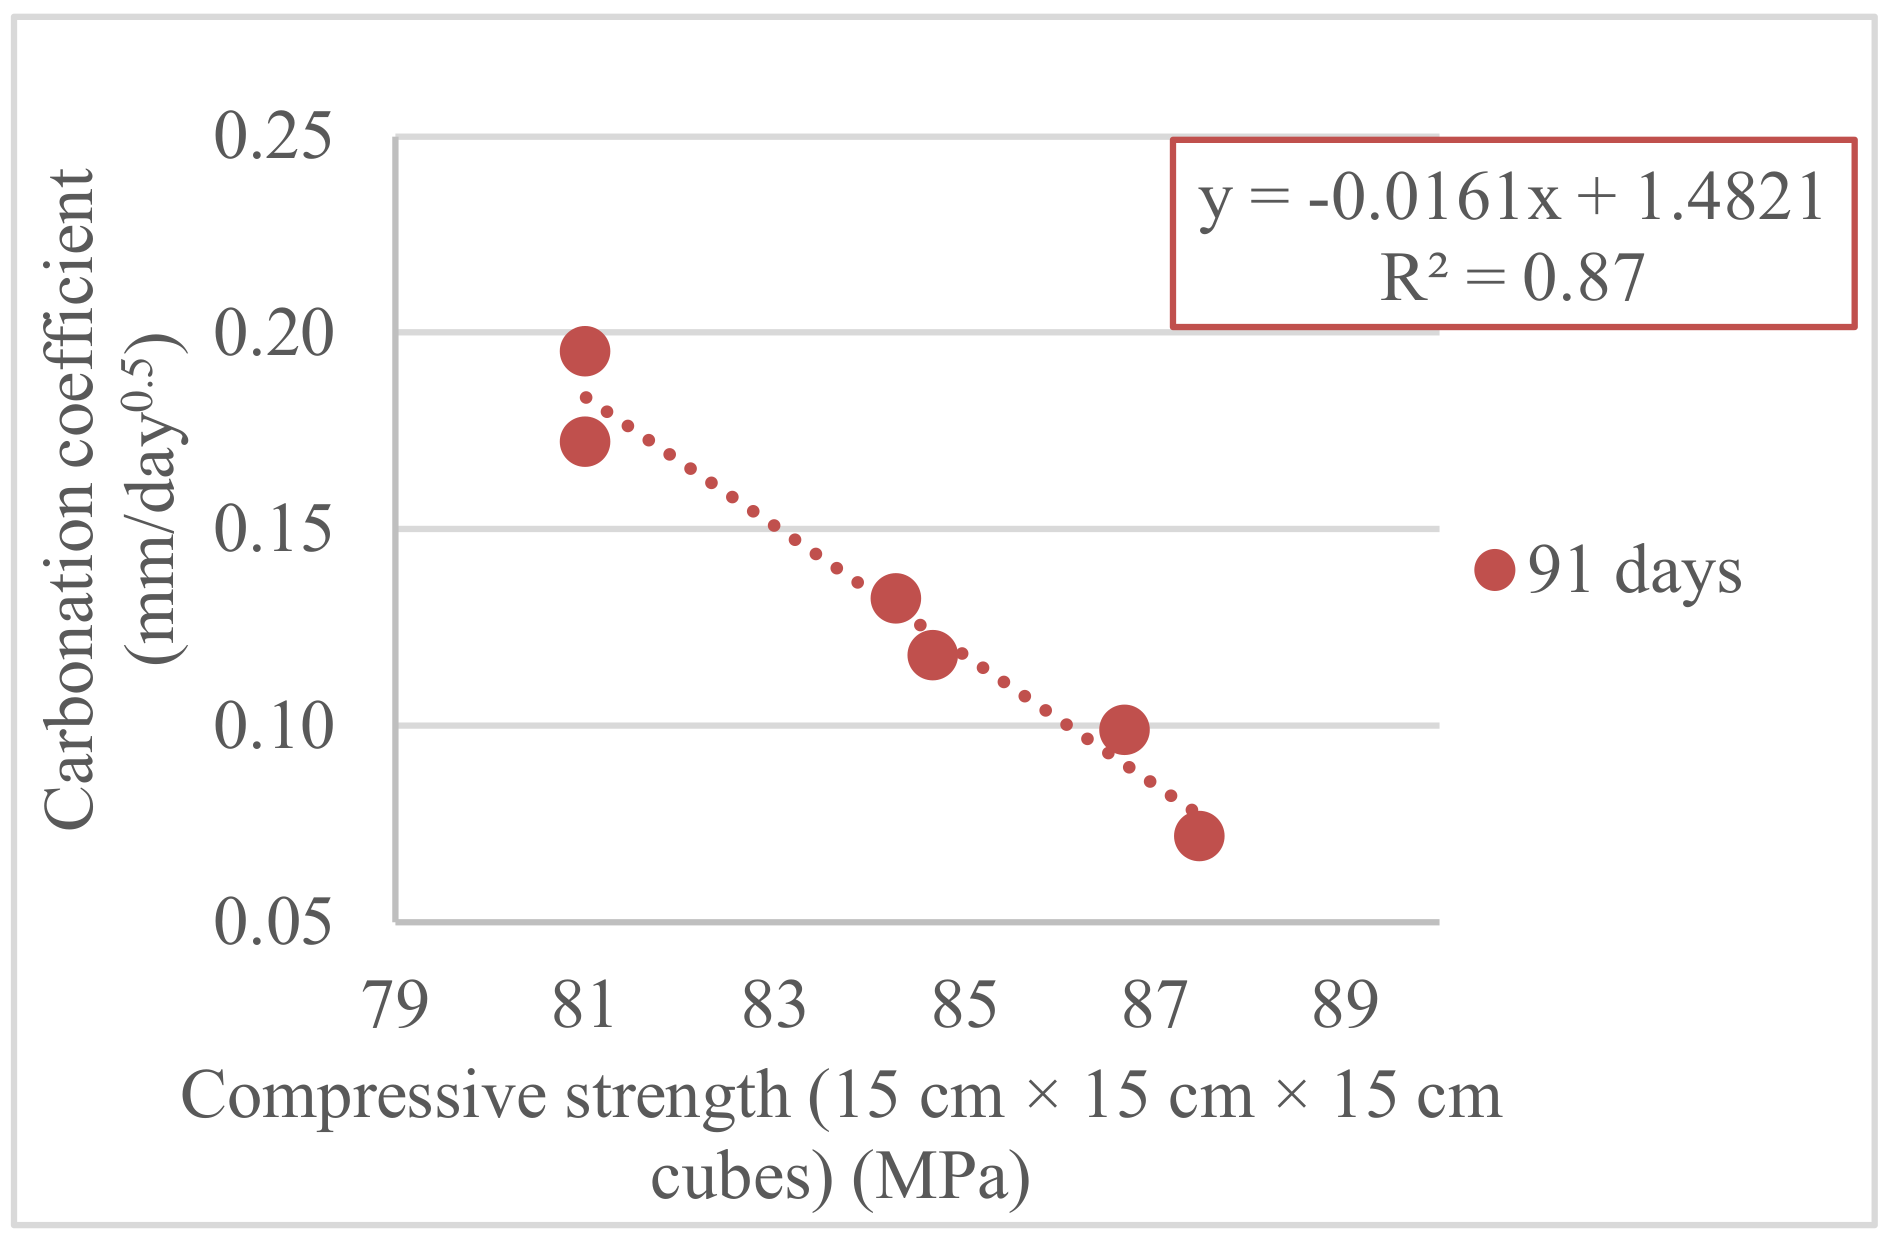
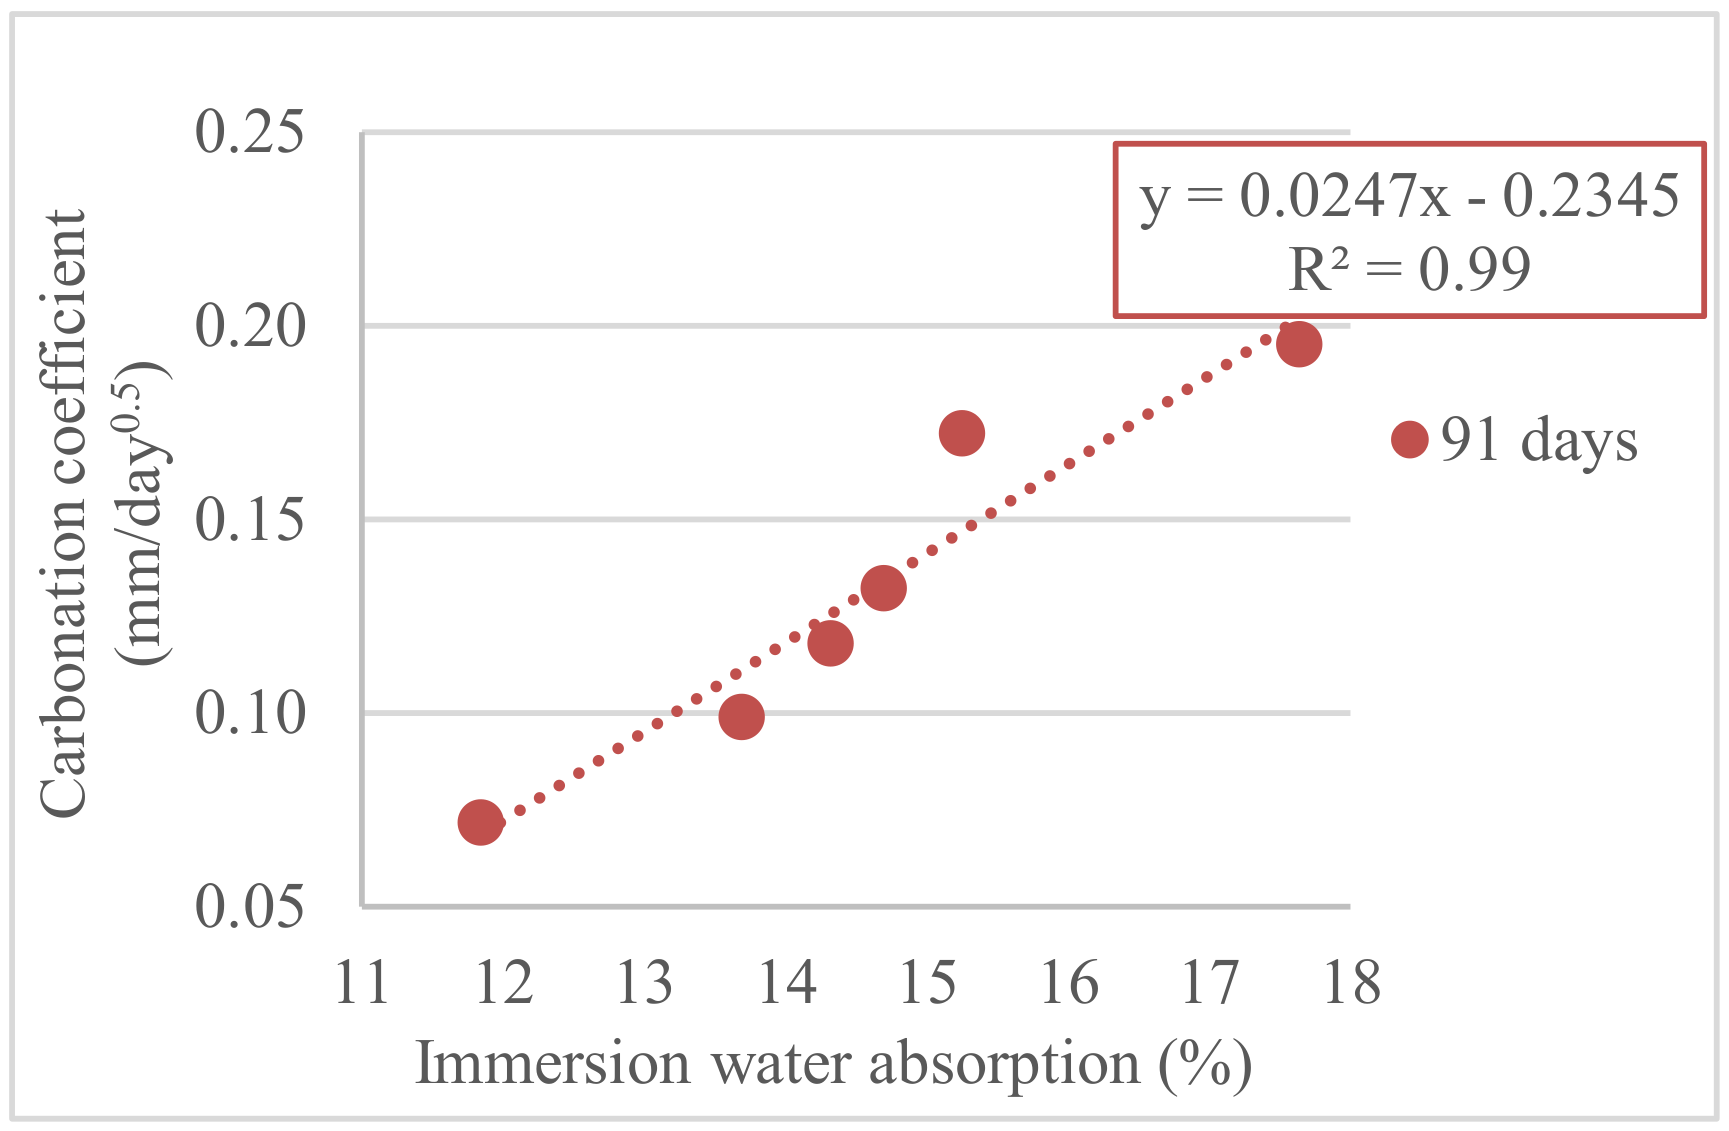
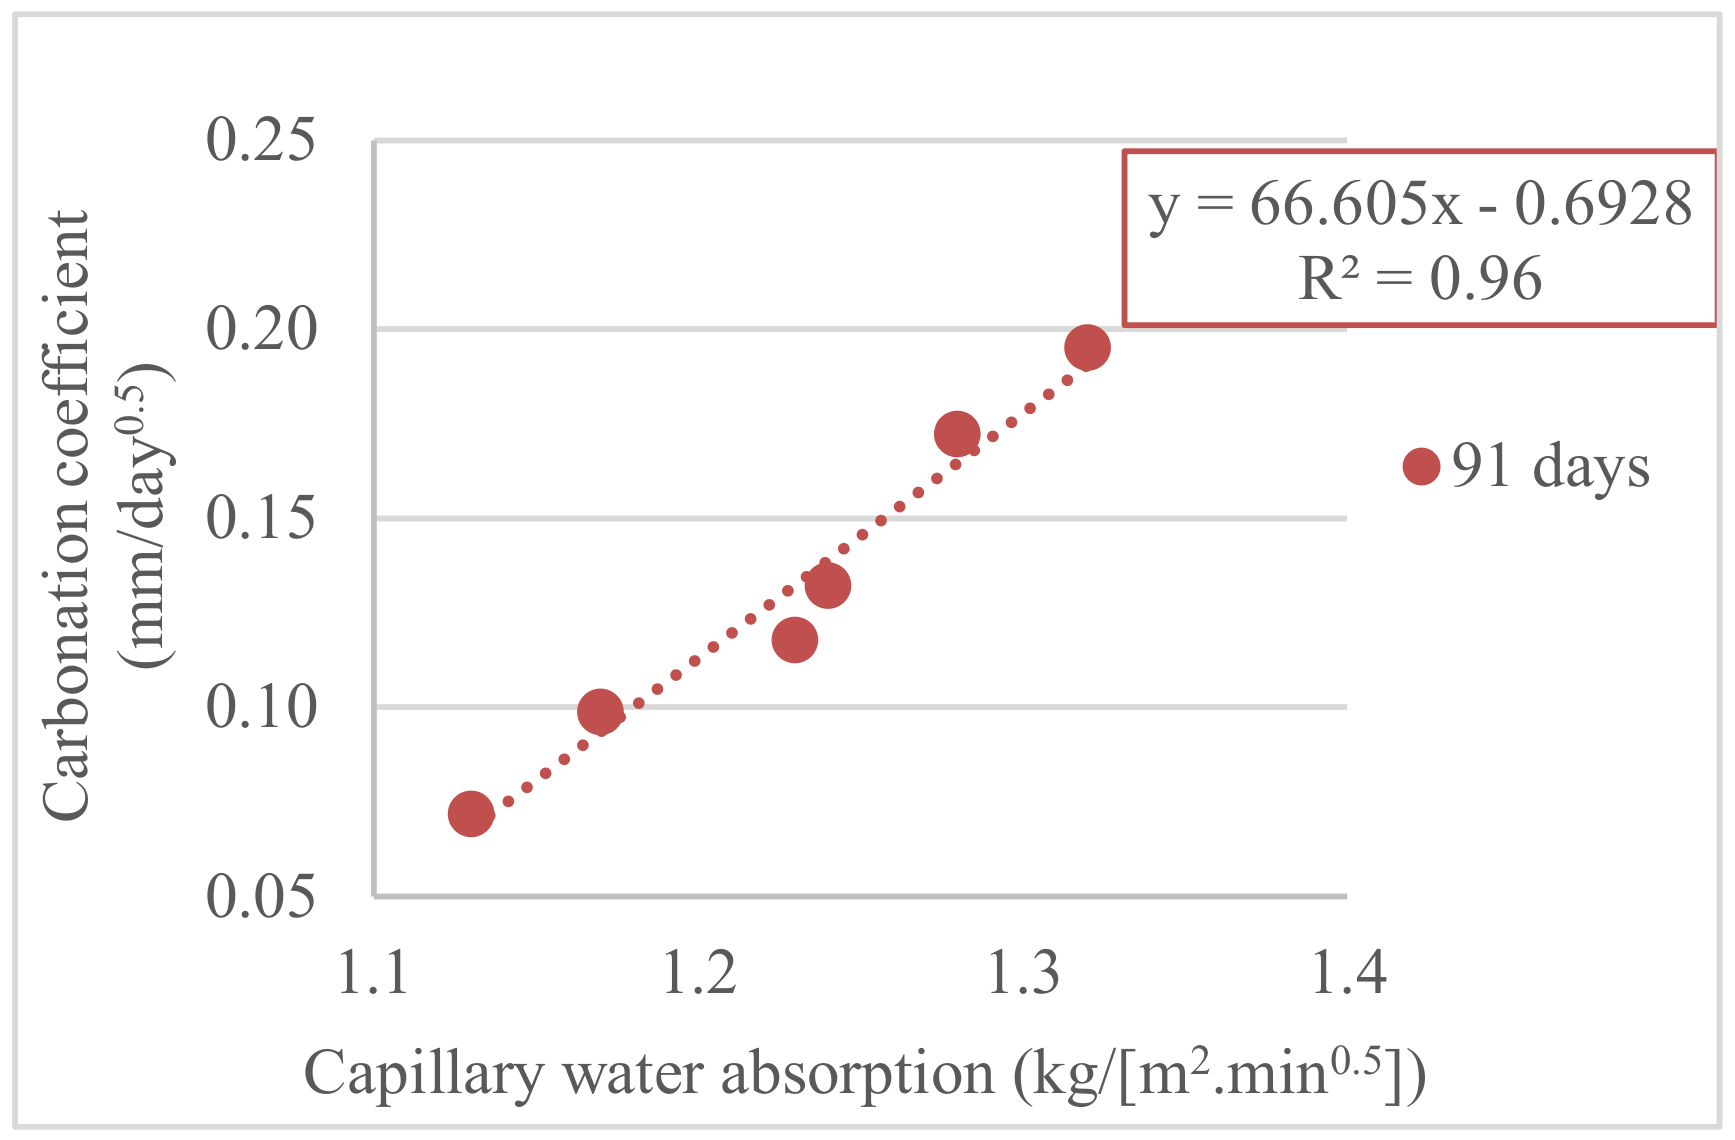
3.6. Carbonation Test
4. Concluding Remarks
Author Contributions
Funding
Acknowledgments
Conflicts of Interest
References
- World Business Council for Sustainable Development (WBCSD); International Energy Agency (IEA). Technology Roadmap, Low-Carbon Transition in the Cement Industry; IEA: Paris, France, 2018; p. 66. [Google Scholar]
- Department of Trade and Industry (DTI). Energy White Paper: Our Energy Future Creating a Low Carbon Economy; DTI: London, UK, 2003; p. 138.
- Zhang, T.; Gao, P.; Gao, P.; Wei, J.; Yu, Q. Effectiveness of novel and traditional methods to incorporate industrial wastes in cementitious materials: An overview. Resour. Conserv. Recycl. 2013, 74, 134–143. [Google Scholar] [CrossRef]
- Jani, Y.; Hogland, W. Waste glass in the production of cement and concrete: A review. J. Environ. Chem. Eng. 2012, 2, 1767–1775. [Google Scholar] [CrossRef]
- Silva, P.R.; de Brito, J. Fresh-State Properties of Self-Compacting Mortar and Concrete with Combined Use of Limestone Filler and Fly Ash. Mat. Res. Ib Am. J. Mat. 2015, 18, 1097–1108. [Google Scholar] [CrossRef] [Green Version]
- British Precast Concrete Association (BPCA). Precast Sustainability Strategy and Charter; BPCA: Leicester, UK, 2013. [Google Scholar]
- European Commission (EC). Directive 2008/98/EC of the European Parliament and of the Council of 19 November 2008 on waste. O. J. Euro. Un. 2008, 312, 11–22. [Google Scholar]
- Ozbakkaloglu, T.; Gholampour, A.; Xie, T. Mechanical and durability properties of recycled aggregate concrete: Effect of recycled aggregate properties and content. J. Mat. Civ. Eng. 2018, 30. [Google Scholar] [CrossRef]
- Dimitriou, G.; Savva, P.; Petrou, M.F. Enhancing mechanical and durability properties of recycled aggregate concrete. Constr. Build. Mater. 2018, 158, 228–235. [Google Scholar] [CrossRef]
- Alexandridou, C.; Angelopoulos, G.N.; Coutelieris, F.A. Mechanical and durability performance of concrete produced with recycled aggregates from Greek construction and demolition waste plants. J. Clean. Prod. 2018, 176, 745–757. [Google Scholar] [CrossRef]
- Poon, C.S.; Shui, Z.H.; Lam, L. Effect of microstructure of ITZ on compressive strength of concrete prepared with recycled aggregates. Constr. Build. Mater. 2004, 18, 461–468. [Google Scholar] [CrossRef]
- Poon, C.S.; Shui, Z.H.; Lam, L.; Fok, H.; Kou, S.C. Influence of moisture states of natural and recycled aggregates on the slump and compressive strength of concrete. Cem. Concr. Res. 2004, 34, 31–36. [Google Scholar] [CrossRef]
- Tam, V.W.Y.; Gao, X.F.; Tam, C.M. Microstructural analysis of recycled aggregate concrete produced from two-stage mixing approach. Cem. Concr. Res. 2005, 35, 1195–1203. [Google Scholar] [CrossRef] [Green Version]
- Evangelista, L.; de Brito, J. Mechanical behaviour of concrete made with fine recycled concrete aggregates. Cem. Concr. Compos. 2007, 29, 397–401. [Google Scholar] [CrossRef]
- Thomas, C.; Cimentada, A.; Polanco, J.A.; Setién, J.; Méndez, D.; Rico, J. Influence of recycled aggregates containing sulphur on properties of recycled aggregate mortar and concrete. Comp. Part B Eng. 2013, 45, 474–485. [Google Scholar] [CrossRef]
- Soares, D.; de Brito, J.; Ferreira, J.; Pacheco, J. Use of coarse recycled aggregates from precast concrete rejects: Mechanical and durability performance. Constr. Build. Mater. 2014, 71, 263–272. [Google Scholar] [CrossRef]
- Thomas, C.; Setién, J.; Polanco, J.A. Structural recycled aggregate concrete made with precast wastes. Constr. Build. Mater. 2016, 114, 536–546. [Google Scholar] [CrossRef] [Green Version]
- Xiao, J.; Jiang, X.; Huang, Y.; Gao, G. Test on the mechanical behavior of semiprecast recycled concrete elements, Tumu Gongcheng Xuebao/China. Civ. Eng. J. 2013, 46, 99–104. [Google Scholar]
- Chen, W.; Jin, R.; Xu, Y.; Wanatowski, D.; Li, B.; Yan, L.; Pan, Z. Adopting recycled aggregates as sustainable construction materials: A review of the scientific literature. Constr. Build. Mater. 2019, 218, 483–496. [Google Scholar] [CrossRef]
- Fiol, F.; Thomas, C.; Muñoz, C.; Ortega-López, V.; Manso, J.M. The influence of recycled aggregates from precast elements on the mechanical properties of structural self-compacting concrete. Constr. Build. Mater. 2018, 182, 309–323. [Google Scholar] [CrossRef]
- Instituto Português da Qualidade (IPQ). Cement, Part 1: Composition, Specifications and Conformity Criteria for Common Cements; IPQ: Lisbon, Portugal, 2008; p. 8. [Google Scholar]
- Instituto Português da Qualidade (IPQ). NP EN 450-1, A1, Fly Ash for Concrete, Part 1: Definition, Specifications and Conformity Criteria; IPQ: Lisbon, Portugal, 2008; p. 35. [Google Scholar]
- Instituto Português da Qualidade (IPQ). NP EN 450-2, 2006, Fly Ash for Concrete, Part 2: Conformity Evaluation; IPQ: Lisbon, Portugal, 2006; p. 29. [Google Scholar]
- LNEC E 466. Limestone Fillers for Hydraulic Binders; National Laboratory for Civil Engineering: Lisbon, Portugal, 2005; p. 2. (In Portuguese) [Google Scholar]
- Instituto Português da Qualidade (IPQ). 25 Silica Fume for Concrete—Part 1: Definitions, Requirements and Conformity Criteria (Includes Amendment A1:2009); IPQ: Lisbon, Portugal, 2005. [Google Scholar]
- Instituto Português da Qualidade (IPQ). NP EN 196-6, Methods of Testing Cement—Part 6: Determination of Fineness; IPQ: Lisbon, Portugal, 2010; p. 20. [Google Scholar]
- Instituto Português da Qualidade (IPQ). NP EN 12620, Aggregates for Concrete; IPQ: Lisbon, Portugal, 2010; p. 61. [Google Scholar]
- Santos, S.; Silva, P.R.; de Brito, J. Mechanical performance evaluation of self-compacting concrete with fine and coarse recycled aggregates from precast industry. Materials 2017, 10, 904. [Google Scholar] [CrossRef] [Green Version]
- Instituto Português da Qualidade (IPQ). Mixing Water for Concrete, Specification for Sampling, Testing and Assessing the Suitability of Water, Including Water Recovered from Processes in the Concrete Industry, as Mixing Water for Concrete; IPQ: Lisbon, Portugal, 2003; p. 22. [Google Scholar]
- Instituto Português da Qualidade (IPQ). Admixtures for Concrete, Mortar and Grout, Part 1: Common Requirements; IPQ: Lisbon, Portugal, 2008; p. 13. [Google Scholar]
- Instituto Português da Qualidade (IPQ). Admixtures for Concrete, Mortar and Grout, Part 2: Concrete Admixtures, Definitions, Requirements, Conformity, Marking and Labelling; IPQ: Lisbon, Portugal, 2009; p. 28. [Google Scholar]
- Nepomuceno, M.; Oliveira, L. Parameters for self-compacting concrete mortar phase. ACI Mat. J. 2008, 253, 323–340. [Google Scholar]
- Nepomuceno, M.; Oliveira, L.; Lopes, S.M.R. Methodology for mix design of the mortar phase of self-compacting concrete using different mineral additions in binary blends of powders. Constr. Build. Mater. 2012, 26, 317–326. [Google Scholar] [CrossRef]
- Silva, P.; de Brito, J.; Costa, J. Viability of two new mix design methodologies for SCC. ACI Mat. J. 2011, 108, 579–588. [Google Scholar]
- Okamura, H.; Ozawa, K.; Ouchi, M. Self-compacting concrete. Struct. Conc. J. 2000, 1, 3–17. [Google Scholar] [CrossRef] [Green Version]
- JSCE (Japan Society of Civil Engineers). Recommendation for construction of self-compacting concrete. In Proceedings of the International Workshop on Self-compacting Concrete, Kochi, Japan, 23–26 August 1998; pp. 417–437. [Google Scholar]
- Bogas, J.; Gomes, A.; Pereira, M. Self-compacting lightweight concrete produced with expanded clay aggregate. Constr. Build. Mater. 2012, 35, 1013–1022. [Google Scholar] [CrossRef]
- Rao, S.V.; de Brito, J.; Silva, P. Experimental study of the mechanical properties and durability of self-compacting mortars with nano materials (SiO2 and TiO2). Constr. Build. Mater. 2015, 96, 508–517. [Google Scholar] [CrossRef]
- Silva, P.; de Brito, J. Experimental study of mechanical properties and shrinkage in self-compacting concrete with binary and ternary mixtures of fly ash and limestone filler. Eur. J. Environ. Civ. Eng. 2017, 21, 430–453. [Google Scholar] [CrossRef]
- Santos, S.; Silva, P.; Brito, J. Durability evaluation of self-compacting concrete with recycled aggregates from the precast industry. Mag. Concr. Res. 2019, 71, 1265–1282. [Google Scholar] [CrossRef] [Green Version]
- Barroqueiro, T.; Silva, P.; Brito, J. Fresh-state and mechanical properties of high-performance self-compacting concrete with recycled aggregates from the precast industry. Materials 2019, 2, 3565. [Google Scholar] [CrossRef] [Green Version]
- Instituto Português da Qualidade (IPQ). Testing Hardened Concrete, Part 7: Density of Hardened Concrete; IPQ: Lisbon, Portugal, 2009; p. 14. [Google Scholar]
- LNEC E393. Concrete. Determination of the Absorption of Water through Capillarity; National Laboratory for Civil Engineering: Lisbon, Portugal, 1993; p. 2. [Google Scholar]
- LNEC E392. Concrete. Determination of the Oxygen Permeability; National Laboratory for Civil Engineering: Lisbon, Portugal, 1993. [Google Scholar]
- LNEC E463. Concrete. Determination of Diffusion Coefficient of Chlorides from Non-Steady-State Migration Test; National Laboratory for Civil Engineering: Lisbon, Portugal, 2004; p. 8. [Google Scholar]
- Nordtest NT Build 492. Concrete, Mortar and Cement-Based Repair Materials, Chloride Migration Coefficient from Non-Steadystate Migration Experiments; Nordtest: Espoo, Finland, 1999. [Google Scholar]
- Polder, R. Test methods for on-site measurement of resistivity of concrete, Rilem TC 154-EMC: Electrochemical techniques for measuring metallic corrosion. Mater. Struct. 2000, 15, 125–131. [Google Scholar]
- Ibero-American Program Science and Technology for Development. DURAR, Thematic Network XV.B Durability of Rebars, Manual for Inspecting, Evaluating and Diagnosing Corrosion in Reinforced Concrete Structures. CYTED, Ibero-American Program Science and Technology for Development, Subprogram XV, Corrosion/Environmental Impact on Materials, Maracaibo, Venezuela; Ibero-American Program Science and Technology for Development: Maracaibo, Venezuela, 2000; ISBN 980-296-541-3. [Google Scholar]
- Luping, T. Guidelines for Practical Use of Methods for Testing the Resistance of Concrete to Chloride Ingress, EU-Project Chlortest (EU Funded Research Project under 5FP GROWTH Programme). Swedish National Testing and Research Institute: Boras, Sweden, 2005. [Google Scholar]
- LNEC E391. Concrete, Determination of Carbonation Resistance; National Laboratory for Civil Engineering: Lisbon, Portugal, 1993; p. 2. [Google Scholar]
- RILEM (Réunion Internationale des Laboratoires et Experts des Matériaux). CPC-18: Measurement of hardened concrete carbonation depth. Mater. Struct. 1998, 21, 453–455. [Google Scholar]
- Grdic, Z.J.; Toplicic-Curcic, G.A.; Despotovic, I.M.; Ristic, N.S. Properties of self-compacting concrete prepared with coarse recycled concrete aggregate. Constr. Build. Mater. 2010, 24, 1129–1133. [Google Scholar] [CrossRef]
- Gómez-Soberón, J. Porosity of recycled concrete with substitution of recycled concrete aggregate: An experimental study. Cem. Concr. Res. 2002, 32, 1301–1311. [Google Scholar]
- RILEM (Réunion Internationale des Laboratoires et Experts des Matériaux). Report 7, Fly Ash in Concrete, Properties and Performance, Report of Technical Committee 67-FAB use of Fly Ash in Building; Wesche, K., Ed.; RILEM Publications: Bagneux, France, 1991; p. 284. ISBN 0-203-62641-9. [Google Scholar]
- Tuyan, M.; Mardani-Aghabaglou, A.; Ramyar, K. Freeze–thaw resistance, mechanical and transport properties of self-consolidating concrete incorporating coarse recycled concrete aggregate. Mater. Des. 2014, 53, 983–991. [Google Scholar] [CrossRef]
- Modani, P.O.; Mohitkar, V.M. Self-compacting concrete with recycled aggregate: A solution for sustainable development. Int. J. Civ. Struct. Eng. 2014, 4, 430–440. [Google Scholar]
- Pereira-de-Oliveira, L.; Nepomuceno, M.C.S.; Castro-Gomes, J.P.; Vila, M.F.C. Permeability properties of self-compacting concrete with coarse recycled aggregates. Constr. Build. Mater. 2014, 51, 113–120. [Google Scholar] [CrossRef]
- Wirquin, E.; Hadjieva-Zaharieva, R.; Buyle-Bodin, F. Use of water absorption by concrete as a criterion of the durability of concrete—Application to recycled aggregate concrete. Mater. Struct. 2000, 33, 403–408. [Google Scholar] [CrossRef]
- Ferreira, R. Probability-Based Durability Analysis of Concrete Structures in Marine Environment. Ph.D. Thesis, Civil Engineering, University of Minho School of Engineering Department of Civil Engineering, Guimarães, Portugal, 2004; p. 339. [Google Scholar]
- Siddique, R.; Cachim, P. Waste and Supplementary Cementitious Materials in Concrete, Characterisation, Properties and Applications, 1st ed.; Woodhead Publishing Series in Civil and Structural Engineering; Woodhead Publishing: Cambridge, UK, 2018; p. 640. [Google Scholar]
- Zong, L.; Fei, Z.; Zhang, S. Permeability of recycled aggregate concrete containing fly ash and clay brick waste. J. Clean. Prod. 2014, 70, 175–182. [Google Scholar] [CrossRef]
- Lotfi, S.; Eggimann, M.; Wagner, E.; Mróz, R.; Deja, J. Performance of recycled aggregate concrete based on a new concrete recycling technology. Constr. Build. Mater. 2015, 95, 243–256. [Google Scholar] [CrossRef]
- RILEM (Réunion Internationale des Laboratoires et Experts des Matériaux). Recommendation of TC 116-PCD—Tests for gas permeability of concrete. Mater. Struct. 1999, 32, 1359–5997. [Google Scholar]
- Camões, A. Betões de Elevado Desempenho com Incorporação de Cinzas Volantes. Ph.D. Thesis, University of Minho, Guimarães, Portugal, 2002. (In Portuguese). [Google Scholar]
- Xiao, J.; Li, J.; Zhang, C. Mechanical properties of recycled aggregate concrete under uniaxial loading. Cem. Concr. Res. 2005, 35, 1187–1194. [Google Scholar] [CrossRef]
- Surya, M.; Rao, K.; Lakshmy, P. Recycled aggregate concrete for transportation infrastructure. Procedia Soc. Behav. Sci. 2013, 104, 1158–1167. [Google Scholar] [CrossRef] [Green Version]
- Andreu, G.; Miren, E. Experimental analysis of properties of high performance recycled aggregate concrete. Constr. Build. Mater. 2014, 52, 227–235. [Google Scholar] [CrossRef]
- Siddique, R. Properties of self-compacting concrete containing class F fly ash. Mater. Des. 2011, 32, 1501–1507. [Google Scholar] [CrossRef]
- Parande, A. Role of Ingredients for High Strength and High Performance Concrete—A Review; CSIR-Central Electrochemical Research Institute Karaikudi: Tamil Nadu, India, 2013; p. 12. [Google Scholar]
- Ramezanianpour, A.; Rezaei, H.; Savoj, H. Influence of Silica Fume on Chloride Diffusion and Corrosion Resistance of Concrete—A Review; Department of Civil and Environmental Engineering, Amir Kabir University of Technology: Tehran, Iran, 2014; p. 21. [Google Scholar]
- Kou, S.; Poon, C. Compressive strength, pore size distribution and chloride-ion penetration of recycled aggregate concrete incorporating class-F fly ash, J.W. Uni. Tech. Mater. Sci. Ed. 2006, 21, 130–136. [Google Scholar]
- Neville, A.M. Properties of Concrete, 4th ed.; Pearson: London, UK, 1995; p. 844. [Google Scholar]
- Bertolini, L.; Elesener, B.; Pedeferri, P.; Polder, R. Corrosion of Steel in Concrete, Prevention, Diagnosis, Repair; WILEY-VCH Verlag GmbH & Co. KGaA: Weinheim, Germany, 2004; p. 392. [Google Scholar]


| Chemical Composition * | CEM I | FA | LF | SF |
|---|---|---|---|---|
| Al2O3 | 5.24 | 24.7 | 0.13 | 0.54 |
| CaCO3 | - | - | 98.35 | - |
| CaO | 62.71 | 2.63 | - | 0.43 |
| Cl− | 0.01 | <0.01 | - | - |
| Fe2O3 | 3.17 | 5.4 | 0.03 | 1.15 |
| K2O | - | 1.11 | 0.02 | 0.86 |
| MgO | 2.23 | 1.01 | 0.4 | 0.43 |
| Na2O | - | 0.89 | - | 0.29 |
| SiO2 | 19.59 | 54.7 | 0.3 | 93.67 |
| SO3 | 3.13 | 1.38 | - | 0.25 |
| TiO2 | - | - | 0.01 | - |
| Insoluble Residue | 1.37 | - | - | - |
| Density (kg/m3) | 3200 | 2300 | 2720 | 2010 |
| Loss of Ignition | 2.94 | 5.1 | 43.8 | 2.54 |
| Particle Size, in Microns * | Passing (%) | |||
| 1000 | 100 | 100 | 100 | 100 |
| 100 | 98 | 96 | 60 | 100 |
| 10 | 38 | 45 | 20 | 80 |
| 1 | 5 | 2 | 0 | 10 |
| 0.1 | 0 | 0 | 0 | 2 |
| Surface Area (BET) (m2/kg) | 325 | 430 | 456 | 15,000 |
| (NP EN 196-6 [26]) | ||||
| Properties | FNA | CNA | RA | ||
|---|---|---|---|---|---|
| Fine Sand 0/2 | Coarse Sand 0/4 | Gravel 1 | Gravel 2 | ||
| Density (kg/m3) | 2580 | 2550 | 2640 | 2690 | 2450 |
| Water absorption (%) | 0.7 | 1.1 | 1.6 | 0.8 | 7.5 |
| Dmáx (mm) | 2 | 4 | 11 | 20 | 20 |
| Mix Proportions (kg/m3) | 100% NA | 25% RA | 50% RA | 100% RA | 100% CRA | 100% FRA | |
|---|---|---|---|---|---|---|---|
| CEM I 52.5 R (C) | 437 | ||||||
| Fly Ash (FA) | 145 | ||||||
| Limestone Filler (LF) | 29 | ||||||
| Silica Fume (SF) | 27 | ||||||
| Superplasticizer (Sp) | 8 | ||||||
| Water (W) | 193 | ||||||
| Sand0/2 (FNA0/2) | 162 | 122 | 81 | - | 162 | - | |
| Sand0/4 (FNA0/4) | 484 | 363 | 242 | - | 484 | - | |
| FRA | - | 145 | 290 | 581 | - | 581 | |
| Gravel1 (CNA1) | 389 | 292 | 195 | - | - | 389 | |
| Gravel2 (CNA2) | 398 | 299 | 199 | - | - | 398 | |
| CRA | - | 184 | 369 | 737 | 737 | - | |
| Mix Parameters | |||||||
| Vp/Vs | 0.800 | ||||||
| Vw/Vp | 0.920 | ||||||
| Sp/p% | 1.240 | ||||||
| W/C Ratio | 0.442 | ||||||
| W/CM Ratio | 0.317 | ||||||
| W/FM Ratio | 0.303 | ||||||
| Basic Fresh-state Properties | |||||||
| Flow Time (t500) | [sec] | 1.8 | 2.3 | 2.6 | 3.8 | 2.4 | 2.0 |
| Slump-flow Diameter (SF) | [mm] | 810 | 730 | 715 | 620 | 708 | 690 |
| V-funnel (Tv) | [sec] | 9.1 | 10.8 | 11.1 | 19.6 | 14.1 | 19.3 |
| L-box (PL) | 0.92 | 0.89 | 0.83 | 0.80 | 0.88 | 0.80 | |
| Segregated Portion (SR) | [%] | 20.5 | 18.7 | 17.0 | 13.7 | 19.1 | 12.7 |
| J-ring Passing Ability PJ | [mm] | 5.0 | 7.5 | 9.0 | 10.8 | 8.3 | 1.7 |
| Basic Mechanical Properties | |||||||
| fcm,c,7d | [MPa] | 78.4 | 76.8 | 74.5 | 70.8 | 75.9 | 72.6 |
| fcm,c,28d | [MPa] | 81.9 | 80.7 | 79.5 | 75.0 | 80.3 | 78.0 |
| fcm,c,91d | [MPa] | 87.5 | 86.7 | 84.3 | 79.9 | 84.7 | 83.6 |
| Ecm,28d | [GPa] | 41.7 | 39.6 | 36.6 | 30.8 | 37.0 | 32.8 |
| Ecm,91d | [GPa] | 42.8 | 41.2 | 38.3 | 34.2 | 39.5 | 36.8 |
| Mix | 28 Days | 91 Days | ||||
|---|---|---|---|---|---|---|
| Water Absorption (%) | S.D. (%) | ∆100% NA (%) | Water Absorption (%) | S.D. (%) | ∆100% NA (%) | |
| 100% NA | 13.07 | 0.16 | 0.0 | 11.85 | 0.14 | 0.0 |
| 25% RA | 14.60 | 0.32 | 11.8 | 13.70 | 0.07 | 15.6 |
| 50% RA | 16.34 | 0.06 | 25.0 | 14.70 | 0.04 | 24.1 |
| 100% RA | 16.75 | 0.11 | 28.2 | 15.26 | 0.30 | 28.8 |
| 100% CRA | 15.65 | 0.16 | 19.8 | 14.32 | 0.34 | 20.9 |
| 100% FRA | 18.45 | 0.18 | 41.2 | 17.65 | 0.27 | 49.0 |
| Mix | 28 Days | 91 Days | ||||
|---|---|---|---|---|---|---|
| Capillary Absorption (kg/m2) | S.D. (kg/m2) | ∆100% NA (%) | Capillary Absorption (kg/m2) | S.D. (kg/m2) | ∆100% NA (%) | |
| 100% NA | 0.54 | 0.05 | 0.0 | 0.35 | 0.02 | 0.0 |
| 25% RA | 0.58 | 0.02 | 8.8 | 0.36 | 0.01 | 2.4 |
| 50% RA | 0.67 | 0.02 | 25.3 | 0.38 | 0.02 | 8.4 |
| 100% RA | 0.83 | 0.02 | 55.3 | 0.39 | 0.01 | 11.7 |
| 100% CRA | 0.64 | 0.04 | 18.9 | 0.37 | 0.01 | 7.3 |
| 100% FRA | 0.91 | 0.04 | 69.1 | 0.40 | 0.02 | 13.8 |
| Mix | 28 Days | 91 Days | ||||
|---|---|---|---|---|---|---|
| Capillary Absorption Coefficient (10−2kg/[m2.min0.5]) | R2 | ∆100% NA (%) | Capillary Absorption Coefficient (10−2kg/[m2.min0.5]) | R2 | ∆100% NA (%) | |
| 100% NA | 3.12 | 0.98 | 0.0 | 1.13 | 0.99 | 0.0 |
| 25% RA | 3.52 | 0.98 | 12.8 | 1.17 | 0.97 | 3.5 |
| 50% RA | 3.88 | 0.98 | 24.4 | 1.24 | 0.98 | 9.7 |
| 100% RA | 3.99 | 0.88 | 27.9 | 1.28 | 0.85 | 13.3 |
| 100% CRA | 3.75 | 0.98 | 20.2 | 1.23 | 0.97 | 8.8 |
| 100% FRA | 4.89 | 0.99 | 56.7 | 1.32 | 0.98 | 16.8 |
| Mix | 28 Days | 91 Days | ||||
|---|---|---|---|---|---|---|
| Oxygen Permeability (10−16m2) | S.D. (10−16m2) | ∆100% NA (%) | Oxygen Permeability (10−16m2) | S.D. (10−16m2) | ∆100% NA (%) | |
| 100% NA | 0.89 | 0.10 | 0.0 | 0.06 | 0.02 | 0.0 |
| 25% RA | 1.43 | 0.09 | 0.5 | 0.25 | 0.04 | 0.2 |
| 50% RA | 2.84 | 0.17 | 2.0 | 0.63 | 0.02 | 0.6 |
| 100% RA | 4.12 | 0.79 | 3.2 | 0.84 | 0.14 | 0.8 |
| 100% CRA | 2.09 | 0.58 | 1.2 | 0.60 | 0.06 | 0.5 |
| 100% FRA | 5.29 | 0.36 | 4.4 | 2.04 | 0.84 | 2.0 |
| Mix | 28 Days | 91 Days | ||||
|---|---|---|---|---|---|---|
| Chloride Migration Coefficient (×10−12 m2/s) | S.D. (×10−12 m2/s) | ∆100% NA (%) | Chloride Migration Coefficient (×10−12 m2/s) | S.D. (×10−12 m2/s) | ∆100% NA (%) | |
| 100% NA | 3.2 | 0.5 | 0.0 | 2.7 | 0.1 | 0.0 |
| 25% RA | 3.5 | 0.8 | 8.7 | 2.9 | 0.6 | 9.2 |
| 50% RA | 4.2 | 0.5 | 30.1 | 3.6 | 0.5 | 33.2 |
| 100% RA | 4.5 | 0.5 | 40.8 | 3.8 | 0.2 | 41.0 |
| 100% CRA | 3.9 | 0.4 | 21.1 | 3.3 | 0.2 | 22.2 |
| 100% FRA | 4.8 | 0.7 | 49.2 | 4.2 | 0.4 | 58.0 |
| Mix | 28 Days | 91 Days | ||||
|---|---|---|---|---|---|---|
| Electrical Resistivity (Ω.m) | S.D. (Ω.m) | ∆100% NA (%) | Electrical Resistivity (Ω.m) | S.D. (Ω.m) | ∆100% NA (%) | |
| 100% NA | 247.0 | 11.4 | 0.0 | 556.2 | 18.0 | 0.0 |
| 25% RA | 238.5 | 9.9 | −3.4 | 530.1 | 31.9 | −4.7 |
| 50% RA | 185.4 | 10.3 | −24.9 | 407.9 | 14.4 | −26.7 |
| 100% RA | 180.2 | 6.0 | −27.0 | 391.4 | 34.3 | −29.6 |
| 100% CRA | 198.6 | 1.3 | −19.6 | 441.0 | 22.8 | −20.7 |
| 100% FRA | 166.7 | 22.8 | −32.5 | 320.2 | 11.1 | −42.4 |
| Mix | 7 Days | 28 Days | 56 Days | 91 Days | ||||||||
|---|---|---|---|---|---|---|---|---|---|---|---|---|
| Carbonation Depth (mm) | S:D: (mm) | ∆100% NA (%) | Carbonation Depth (mm) | S:D: (mm) | ∆100% NA (%) | Carbonation Depth (mm) | S:D: (mm) | ∆100% NA (%) | Carbonation Depth (mm) | S:D: (mm) | ∆100% NA (%) | |
| 100% NA | 0 | 0 | 0 | 0 | 0 | 0.0 | 0.4 | 0.1 | 0.0 | 0.8 | 0.2 | 0.0 |
| 25% RA | 0 | 0 | 0 | 0 | 0 | 0.0 | 0.8 | 0.2 | 83.4 | 1.2 | 0.3 | 50.7 |
| 50% RA | 0 | 0 | 0 | 0 | 0 | 0.0 | 1.1 | 0.6 | 155.8 | 1.6 | 0.4 | 93.4 |
| 100% RA | 0 | 0 | 0 | 0 | 0 | 0.0 | 1.3 | 0.4 | 206.8 | 2.1 | 0.4 | 162.9 |
| 100% CRA | 0 | 0 | 0 | 0 | 0 | 0.0 | 1.0 | 0.1 | 121.6 | 1.5 | 0.4 | 85.0 |
| 100% FRA | 0 | 0 | 0 | 0 | 0 | 0.0 | 1.9 | 0.9 | 347.4 | 2.2 | 0.2 | 172.2 |
| Mix | Carbonation Coefficient (mm/day0.5) | R2 | ∆100% NA (%) |
|---|---|---|---|
| 100% NA | 0.0716 | 0.7664 | 0.0 |
| 25% RA | 0.0988 | 0.7514 | 38.0 |
| 50% RA | 0.1321 | 0.7592 | 84.5 |
| 100% RA | 0.1721 | 0.7542 | 140.4 |
| 100% CRA | 0.1178 | 0.7388 | 64.5 |
| 100% FRA | 0.1952 | 0.6110 | 172.6 |
| Durability Properties | Mix and Respective Increase/Decrease Relative to the Reference 100% NA (%) | ||||
|---|---|---|---|---|---|
| 25% RA | 50% RA | 100% RA | 100% CRA | 100% FRA | |
| Immersion Water Absorption | (a) 12 | 25 | 28 | 20 | (b) 41 |
| Capillary Water Absorption | (a) 9 | 25 | 55 | 19 | (b) 69 |
| Oxygen Permeability | (a) 63 | 221 | 365 | 136 | (b) 497 |
| Chloride Migration | (a) 9 | 30 | 41 | 21 | (b) 49 |
| Electrical Resistivity | (a) −3 | −25 | −27 | −20 | (b) −33 |
| Carbonation Test (91 days) | (a) 51 | 93 | 163 | 85 | (b) 172 |
© 2020 by the authors. Licensee MDPI, Basel, Switzerland. This article is an open access article distributed under the terms and conditions of the Creative Commons Attribution (CC BY) license (http://creativecommons.org/licenses/by/4.0/).
Share and Cite
Barroqueiro, T.; da Silva, P.R.; de Brito, J. High-Performance Self-Compacting Concrete with Recycled Aggregates from the Precast Industry: Durability Assessment. Buildings 2020, 10, 113. https://doi.org/10.3390/buildings10060113
Barroqueiro T, da Silva PR, de Brito J. High-Performance Self-Compacting Concrete with Recycled Aggregates from the Precast Industry: Durability Assessment. Buildings. 2020; 10(6):113. https://doi.org/10.3390/buildings10060113
Chicago/Turabian StyleBarroqueiro, Tiago, Pedro R. da Silva, and Jorge de Brito. 2020. "High-Performance Self-Compacting Concrete with Recycled Aggregates from the Precast Industry: Durability Assessment" Buildings 10, no. 6: 113. https://doi.org/10.3390/buildings10060113