Article

Evaluation of the Impact of the Envelope System on Thermal Energy Demand in Hospital Buildings

by
Katia Jiménez Mejía
*,
María del Mar Barbero-Barrera
and
Manuel Rodríguez Pérez
Department of Construction and Technologies in Architecture, Universidad Politécnica de Madrid, Avd: Juan Herrera 4, 28040 Madrid, Spain
*
Author to whom correspondence should be addressed.
Buildings 2020, 10(12), 250; https://doi.org/10.3390/buildings10120250
Submission received: 5 November 2020 / Revised: 2 December 2020 / Accepted: 12 December 2020 / Published: 19 December 2020

Abstract

:
Construction materials and systems for the thermal building envelope have played a key role in the improvement of energy efficiency in buildings. Urban heat islands together with the upcoming rising global temperature demand construction solutions that are adapted to the specific microclimate conditions. These circumstances are even more dramatic in the case of healthcare buildings where the need to preserve constant indoor temperatures is a priority for the proper recovery of patients. A new neonatal hospital, located in Madrid (Spain), has been monitored, and building energy simulations were performed to evaluate the effect of the building envelope on the energy demand. Based on the simulation results, the design of the building envelope was found to be insufficiently optimised to properly protect the building from the external heat flow. This is supported by the monitored results of the indoor temperatures, which went over the standard limit for about 50% of the hours, achieving up to 27 °C in June and July, and 28 °C in August. The results showed, on one hand, that solar radiation gains transmitted through the façade have an important impact on the indoor temperature in the analysed rooms. Heat gains through the opaque envelope showed an average of 8.37 kWh/day, followed by heat gains through the glazing with an average value of 5.29 kWh/day; while heat gains from lighting and occupancy were 5.21 kWh/day and 4.47 kWh/day, respectively. Moreover, it was shown that a design of the envelope characterised by large glass surfaces and without solar protection systems, resulted in excessive internal thermal loads that the conditioning system was not able to overcome.

Graphical Abstract

1. Introduction

Climate change has become a key priority worldwide [1,2,3,4]. An increase in temperatures together with global heatwaves [4,5] and temperature anomalies [6] are some of the visible effects of climate change. The effect of the increase in temperature is even more dramatic in urban areas due to the urban heat island (UHI) effect [7,8,9]. The main consequence of this is the increase in temperature compared to the surrounding non-urbanised areas due to different sources of emission (domestic heating, industrialised establishments, road traffic, etc.). Additionally, there are other heat effects produced by the built space (asphalt, building materials, the layout of the road network, natural vegetation removal, etc.) that increase the effect of UHI due to heat accumulation. These are factors that modify the radiation balance between the ground and the air, reduce evaporation, increase surface water runoff and decrease wind speed [10,11]. These effects are of great importance in the urban exchange of energy in addition to the energy efficiency of buildings that has been widely researched [12,13].
Madrid has been one of the areas of analysis and different research has been performed to analyse the frequency and intensity of thermal effects according to atmospheric conditions [11,14]. Despite the extended effects of climate, the highest incidences were observed during the summer due to difficulties in releasing heat accumulated in building [15]. The cooling demand was therefore too high for the conditioning system which was designed for lower capacities and consequently, it resulted in an increase in indoor air temperatures compromising comfortable conditions. Additionally, different research has shown the influence of high indoor temperatures on health [16,17], especially in those that are the most vulnerable to temperatures such as elderly people and the very young [18,19]. An increase in the number of deaths has been recorded [20,21] which has become particularly dramatic in the case of hot and warm climates [22,23]. These circumstances have been commonly analysed in dwellings [24,25], however, there is little research on the consequences of inadequate thermal comfort for public buildings such as healthcare buildings.
Among different types of buildings, public buildings have an energy consumption of, on average, 40% higher than residential buildings [26]. Similarly, hospital buildings have a higher energy consumption in comparison with other public buildings [27] due to their facilities, medical equipment and ventilation supply requirements. Verheyen, Pourshaghaghy, Sattayakorn and Alotaibi evaluated the thermal condition standards for hospitals taking reference patients [28,29,30,31] and staff and concluded a lack of suitability of current standards in health-related spaces (UNE-100713) [32]. Other studies refer to different temperature ranges to maintain the thermal comfort of patients, which vary between 20 and 24 °C [33] or between 25 and 27.7 °C [34]. There are standard regulated temperature values for different uses such as hospitalisation, operating rooms, common areas, and special care rooms. However, there is no specific range of temperatures for maternity areas for which the vulnerability of newborns is taken into consideration. This sector of the population is especially susceptible to temperature changes and must be kept in a neutral thermal environment, avoiding thermal stress caused by cold or heat [35]. Additionally, different research has shown that any changes in temperatures constitute a risk to the newborn’s health [36,37] and could affect the increase in the neonatal mortality rate in non-climate-controlled settings, especially in periods where the outdoor temperatures reach extreme values [38]. The World Health Organisation (WHO) recommended to maintain the temperature in the delivery rooms between 25 and 28 °C and also determined that the maximum tolerable air temperature for an unclothed baby is about 35 °C and slightly less for a dressed baby [39]. Another study recommended a different temperature range in delivery rooms, between 24 and 26 °C [40]. According to the ASHRAE Handbook for HVAC applications in healthcare facilities, temperature and humidity can inhibit or promote the growth of bacteria and activate or deactivate viruses [41].
In Spain, there has been the development of large real estate parks for the new construction of hospital buildings, so much so that, from 2000 to 2017, 344 public hospitals were built [42]. The majority of these hospitals were built according to the energy efficiency regulations established since 2008, and therefore the energy efficiency measurements were adopted and included a commitment to reduce energy demand. However, most of the healthcare buildings did not take into consideration of the microclimate conditions and the same construction type could be found independently of geographical latitude or specific location. As, construction materials and the envelope systems have a key role in the improvement of the thermal performance and reducing energy demand [43,44] by the mitigation of heatwaves, this research presents, an evaluation of a hospital built during this period in terms of indoor setpoint temperature and energy efficiency.
The research aims to evaluate the influence of the envelope system on the preservation of the indoor set temperatures. To address this, a preliminary selection of the typology of buildings has been developed. A neonatal hospital in the city centre of Madrid has been chosen for the study. Indoor conditions in selected rooms, as well as the external conditions, were monitored in the summer of 2018. Additionally, an energy simulation of the fifth floor of the hospital has been performed to quantify the effect of different parameters on the building energy demand.

2. Materials and Methods

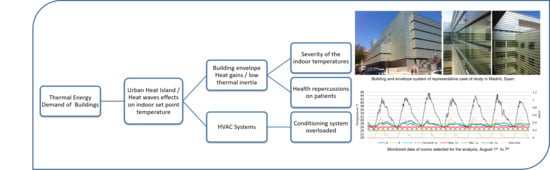
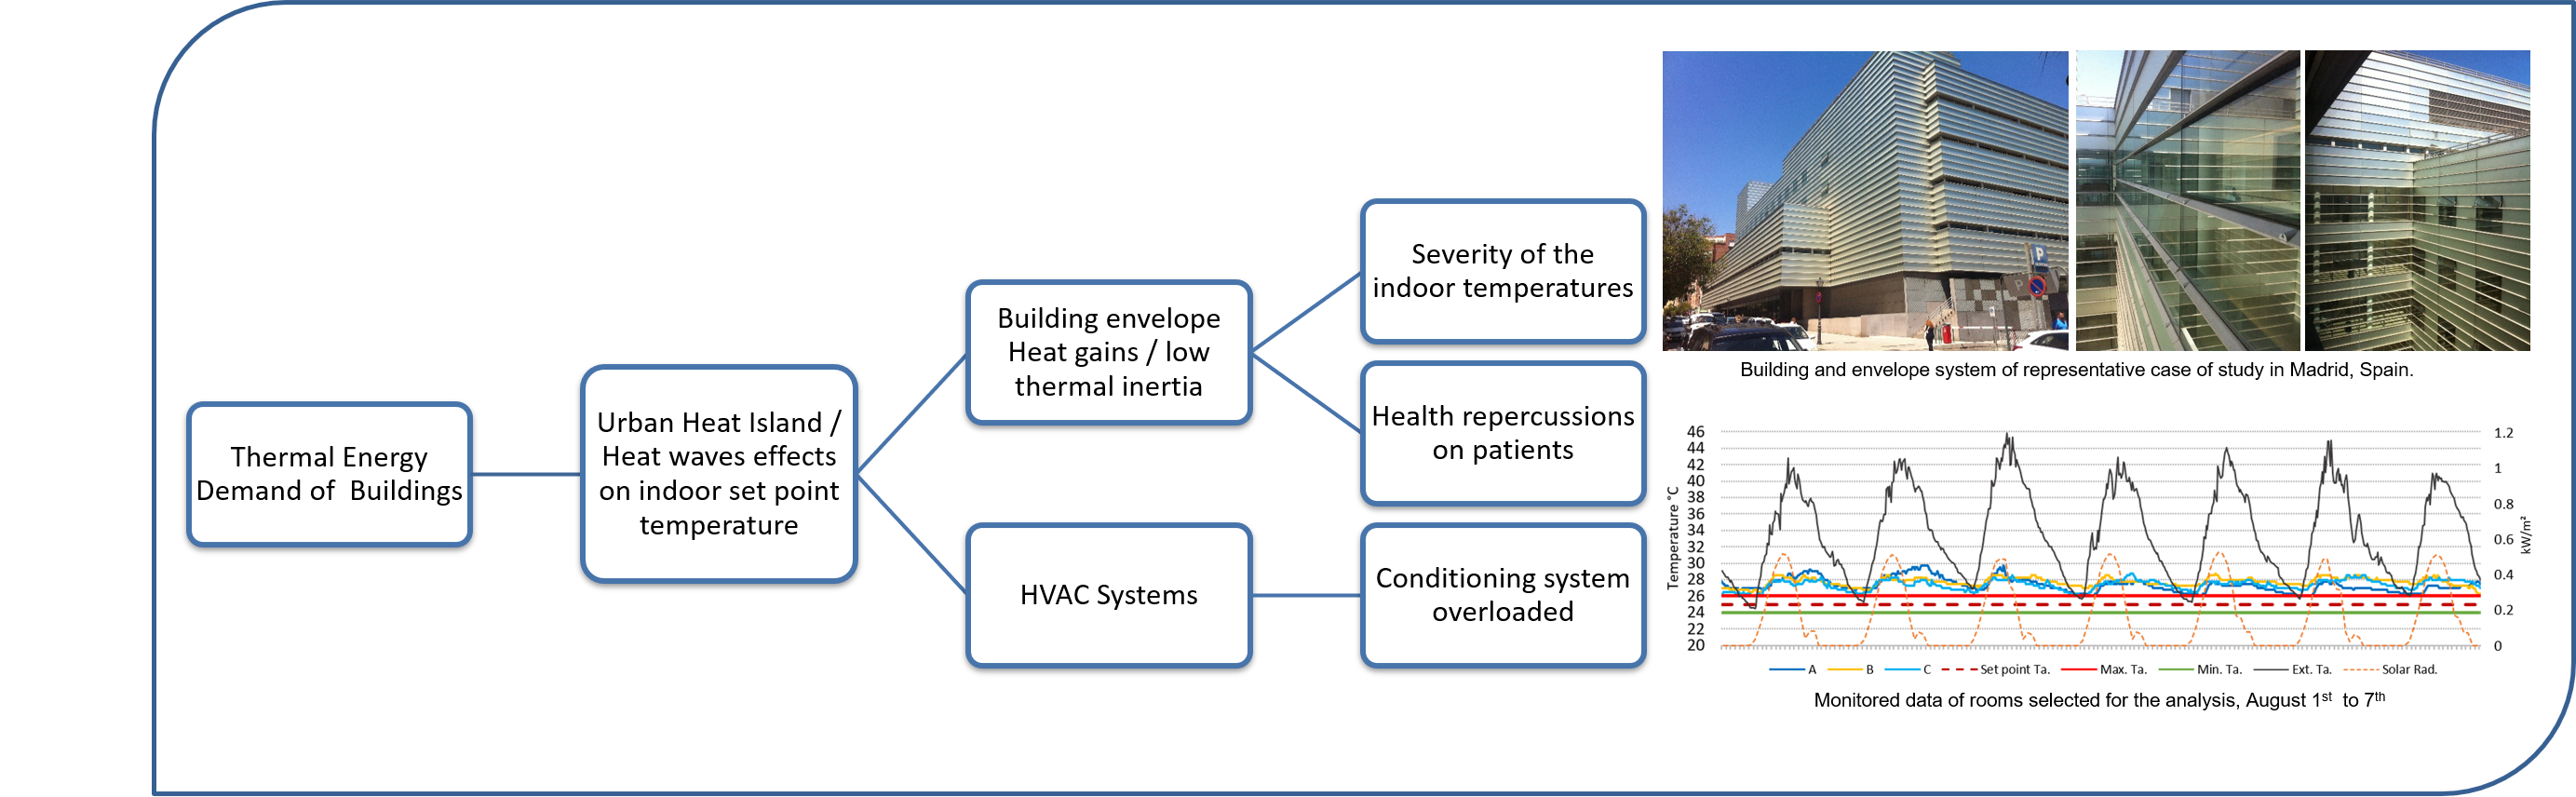
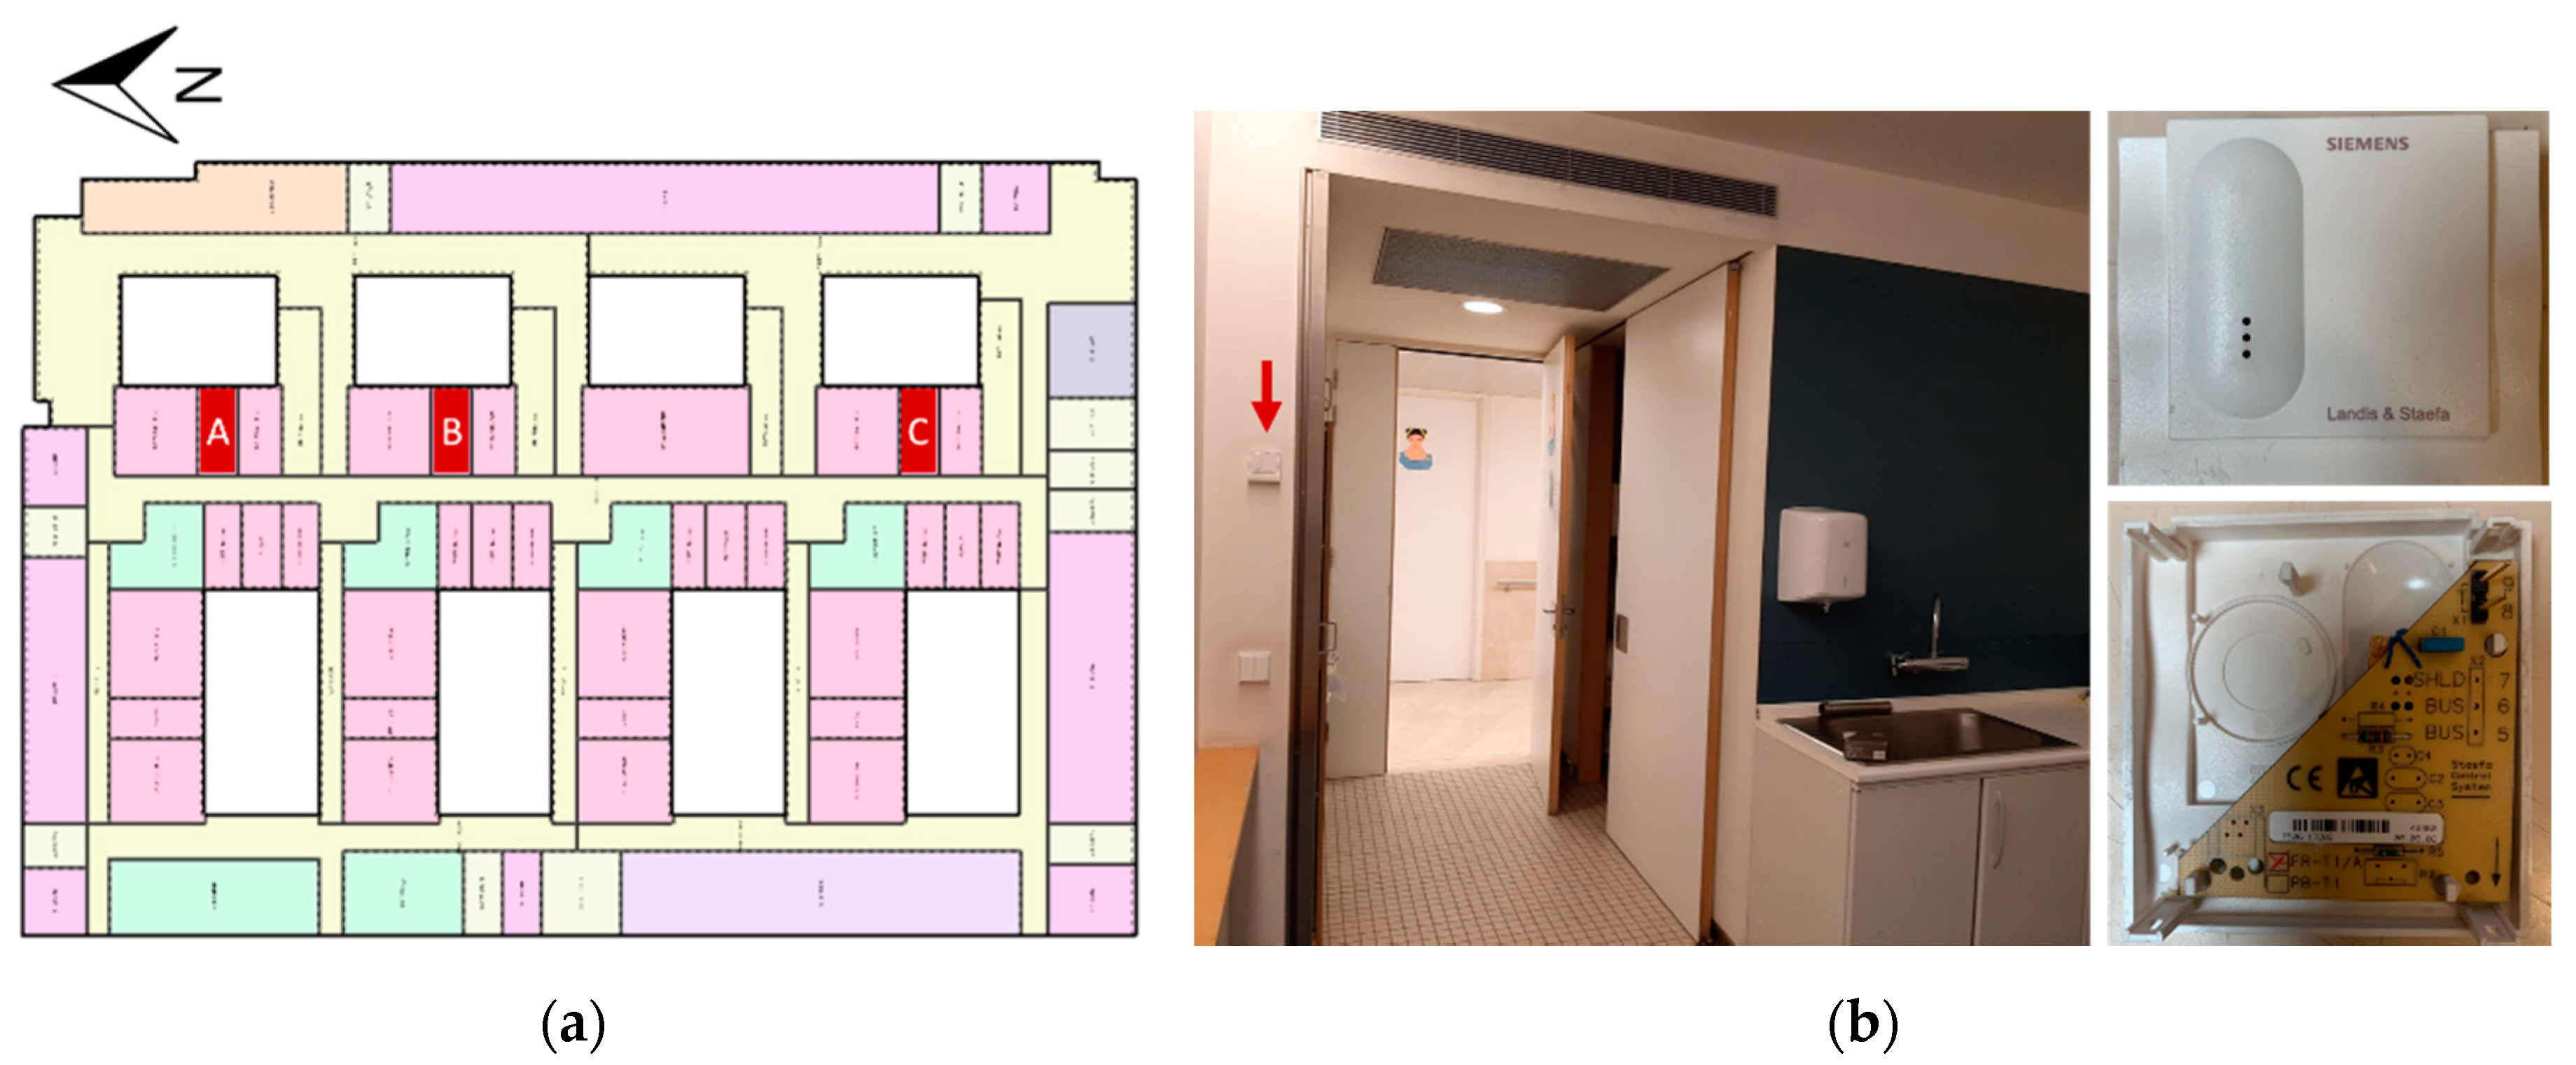
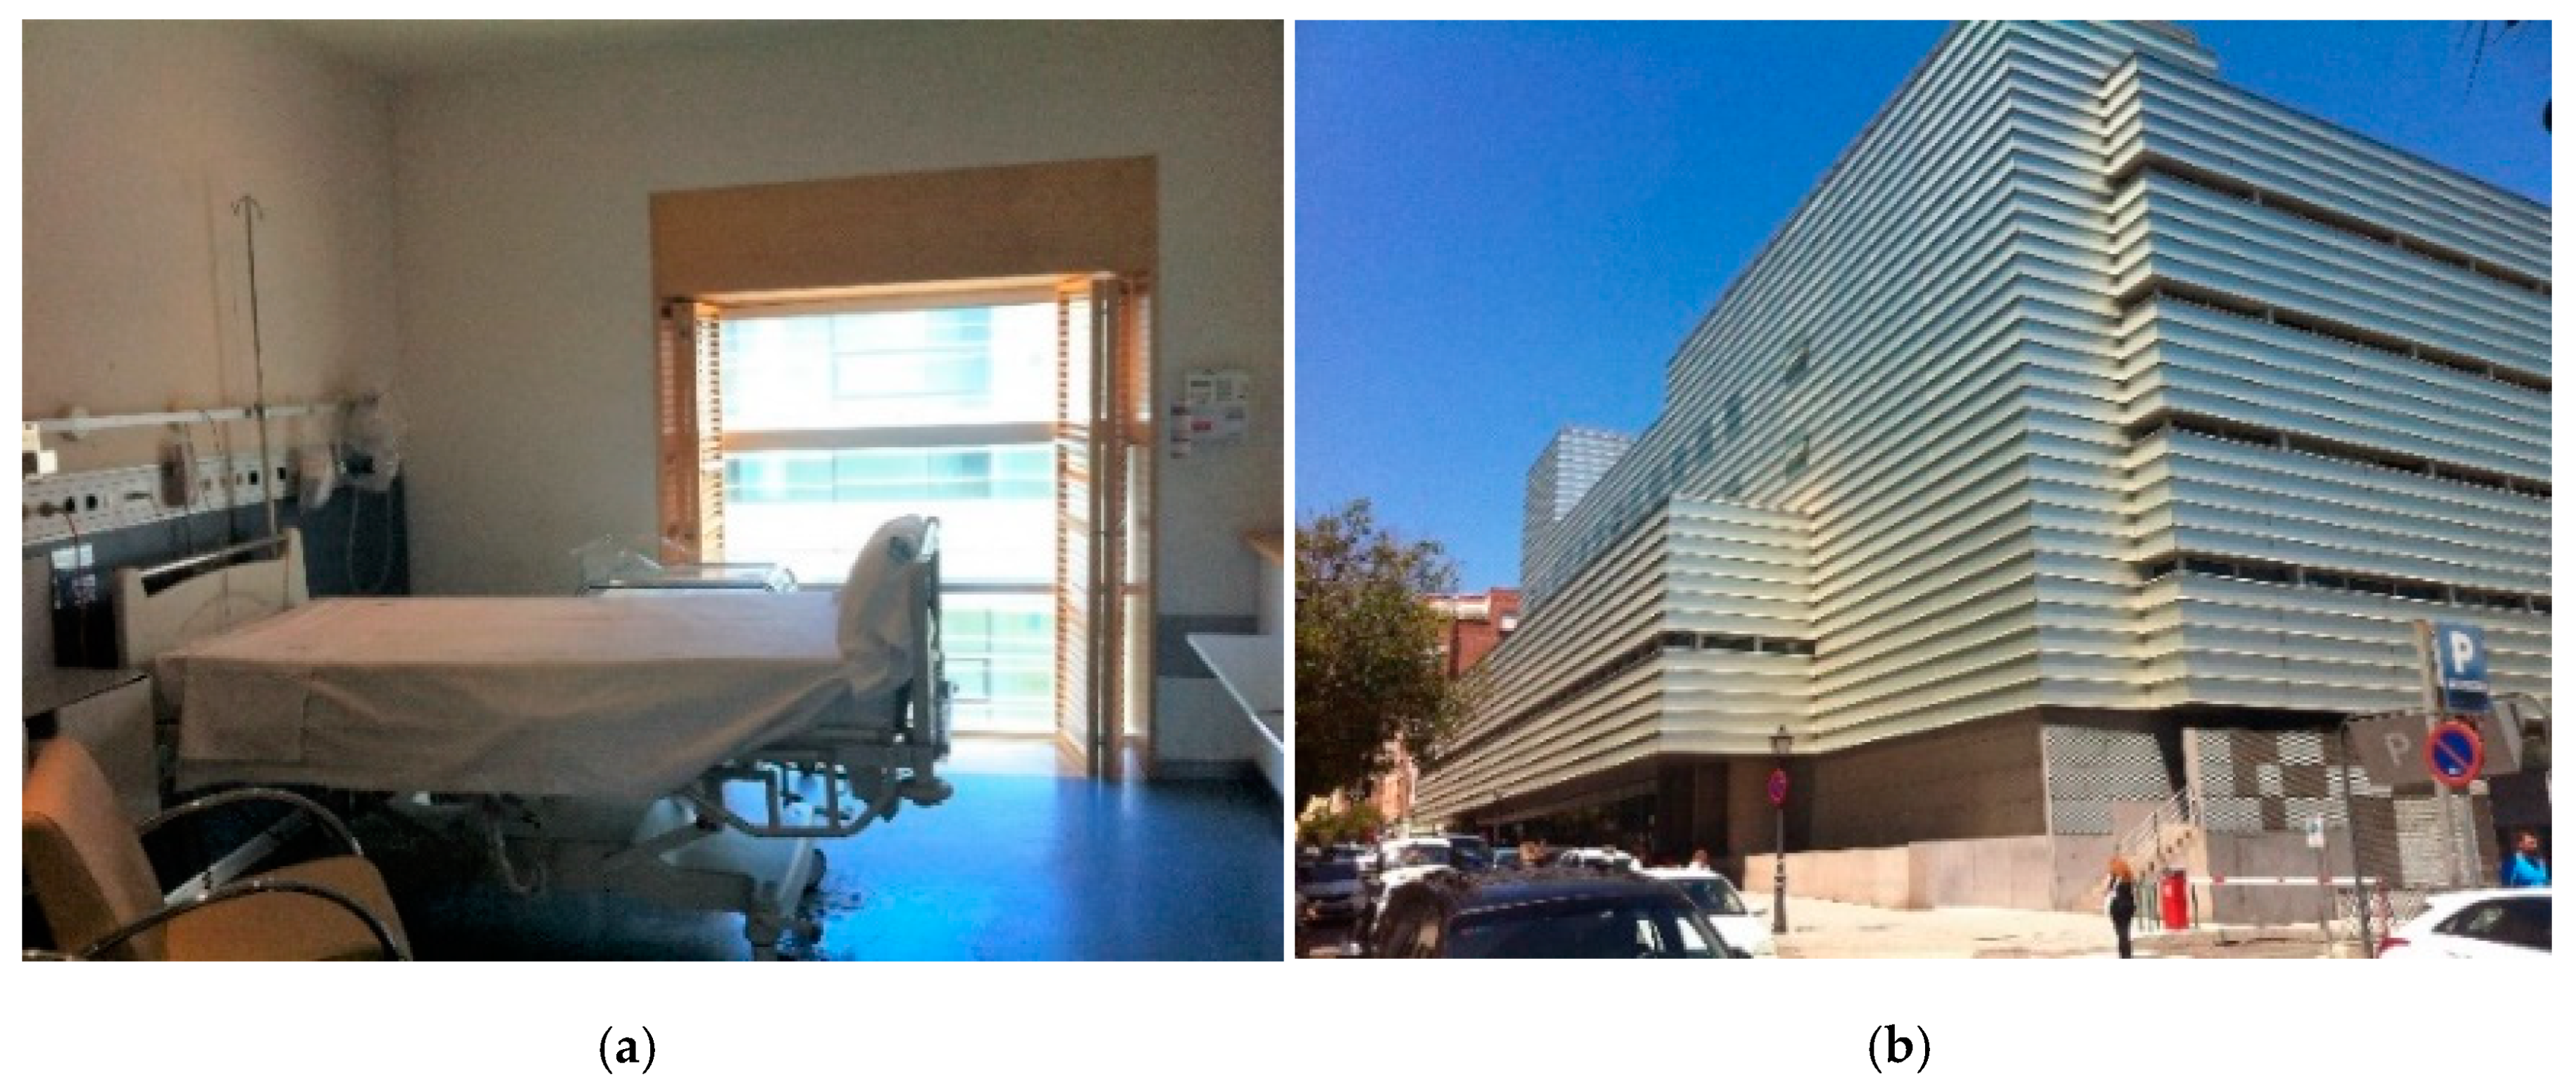
2.1. Selection of a Representative Case of Study and Building Description

Following the aim of the research, a preliminary analysis of the common architectural typology and construction systems used in the last decade in hospitals has been carried out. The first phase has been to select the representative typology and construction systems used. In a second phase, a healthcare building was selected and a deep analysis of the indoor conditions was performed.
Additionally, a dynamic energy simulation was carried out to evaluate quantitatively how the building envelope affects the rooms’ set temperatures and energy demand. The simulation was performed on the 5th floor of the hospital building and the results of the rooms selected for the study were analysed.
The building for this study was selected based on preliminary research regarding the typology of hospital buildings constructed in the last decade in Europe. All of them were located in an urban area in different cities between 38° to 52° N latitude. One of the key parameters in the design of these types of buildings is the layout. Most cases showed courtyards shaped like a “cross-comb” with an east/west orientation. Furthermore, buildings commonly showed 3 to 7 floors and 2 underground levels. However, it is noteworthy that independently of the latitude, the most common construction system was a lightweight construction type. Additionally, sun control and shading devices were not frequently used, although windows/wall ratios achieved an average of approximately 70% coverage. The façade construction systems were curtain walls or ventilated panel systems. Opaque and transparent glass in addition to aluminium boards were the most popular materials implemented in the hospital building facades. Usually, these opaque and transparent glass panels have a multi-layer film to regulate sun radiation and provide an aesthetic appearance. It must be highlighted that the analysed cases showed high similarities of the construction design independently of the latitude.
A building of this construction period, situated in Madrid, with a latitude of 40 °N and longitude of 3° W (Spain) had been selected as a case study. The hospital was built between the years 1996–2003. It has an area of 42,000 m2 and comprises of six floors with a rectangular layout and eight interior courtyards (enclosed poly-block). Patient rooms are oriented towards interior courtyards with large windows reaching down to floor level. The fifth floor (the last one) comprised newborn hospitalisation with rooms and offices. The non-transparent glass façades characterise the architecture of the building. One of the main key points of the building is that it is located in the central area of the city which is directly affected by heatwaves [45], this is a phenomenon that occurs mainly at night, being more frequent and more intense during warm periods [11]. According to the Köppen classification, the Madrid climate is between CSA (temperate with a dry and hot summer) and BSK (cold steppe). The average temperature in the coldest months is between 0 ° and 18 °C and in the hottest month, the average temperature is above 22 °C.

2.2. Methods—Monitoring Process

As mentioned above in the previous section, the floor in which newborns were placed, was selected for analysis Figure 1a presents the layout of the fifth floor. As newborn children represent one of the most sensitive groups of the population, the thermal environment in those rooms must be controlled, and it should be guaranteed to have a neutral temperature with minimum fluctuations [35]. Location of those room on the last floor has however a drawback. The internal conditions are more influenced by thermal transfer through the roof with a large surface area exposed to solar radiation. Three post-delivery rooms (A-B-C), shown in Figure 1a, were selected for analysis. Their selection was based on a search for similar conditions with the same orientation (east) and their placement alongside a corridor. In addition, all of them showed the same ventilation and air-conditioning systems, so variations in terms of temperature impacted by the equipment were decreased. The occupancy profile was similar in all of the rooms, which were occupied 80% of the time during the measurement period. The temperature set-point was 26 °C for cooling and 24 °C for heating in all of the rooms. The only difference between those spaces was the location in the building. Room A is located in the north side of the building, Room B in the central side and Room C in the south side Figure 1a. The hospital building and the typology of rooms selected for the study are shown in Figure 2.
Real-time values of outdoor and indoor temperature were monitored and recorded. An outside sensor model Siemens T1-PTC (Positive temperature coefficient) (MR − 50 + 70 °C) was used. It was located on the south-facing façade on the last floor of the building and attached to a wall. Complementary to the previous sensor, indoor air temperature sensors, PB-T1 (Pronto bus) (MR 0 + 50 °C) were used. Interior sensors were installed in the same place in the rooms selected and located on the wall as showed in Figure 1b. Sensors were mounted at a height of 1.5 m and were installed in accordance with the instructions from the manufacturer.
Global solar radiation data was collected from the closest meteorological station placed in the Ciudad Universitaria of Madrid and data was provided by the Meteorological Agency of Spain (AEMET). Summertime was the selected period to evaluate the performance of the building [46,47] as the most unfavourable conditions in hospitals require demand for cooling [46,48], due impart to the internal loads together with the forecasted increase in temperature and the heat island effect. The hospital was monitored from June 2018 to August 2018. Data were collected every 15 min by the DESIGO-INSIGHT [49] management system program. A daily data file was generated by the software. Calibration procedures were applied in accordance with the parameters included in the UNE-EN 62974-1 regulation [50]. During the summertime, the most critical hottest week of each month was selected for the study.

2.3. Simulation

The building was modelled by the software Design-Builder V 6.1 while EnergyPlus V 8.9 software was used for determining building’s internal heat balance. The heat balance is generally modelled with four, coupled heat-transfer components: (1) conduction through the building element, (2) convection to the air, (3) short wave radiation absorption and reflectance and (4) longwave radiant interchange. The incident short wave radiation is from the solar radiation entering the zone through windows and emittance from internal sources such as lights. The longwave radiation interchange includes the absorption and emittance of low-temperature radiation sources, such as all other zone surfaces, equipment, and people [51].
The model of the hospital building was simulated with the weather conditions of Madrid climate zone D3, created according to the official regulations for energy simulations in Spain ([52]). The selected rooms had similar conditions with the same orientation (east), and 26 m2 of area. A validation process for the simulation results was carried out by comparing the simulated indoor air temperatures vs. those measured for several days and the occupancy rates for different building thermal zones. By means of the comparative analysis, a satisfactory agreement of the results was obtained.
To establish the limits of indoor temperature, 24 and 26 °C as minimum and maximum temperature values respectively were taken for the analysis. This limitation was based on the temperature requirements for healthcare buildings in the patient rooms (UNE-EN 100713-2005) for environmental conditioning in hospitals [32]. Moreover, the same temperature limits were established as set point temperature values for the air conditioning systems in patient rooms of the studied building (26 °C for cooling and 24 °C for heating). Besides climatological variables (indoor/outdoor temperature and solar radiation), other types of variables were also considered for this research (Table 1).
Indeed, occupancy rates, set temperatures, types of air conditioning systems and the system characteristics of the building envelope (Table 2).
Concerning the HVAC (Heating Ventilation and Air conditioning) systems, the cooling, heating and ventilation systems are controlled by a centralised technical management system [49]. Heating was supplied by natural gas boilers, in a thermal power station placed on the second floor and a refrigeration station powering an air-water chiller placed on the roof. For the terminal devices, variable air volume boxes (VAV) are used to supply patient rooms; while fan coils are used in other spaces. The set temperature considered for air conditioning systems is 26 °C for cooling and 24 °C for heating while the relative humidity is 60% for dehumidification and 40% for humidification, according to the Regulation of Thermal Installations in Buildings in Spain [53].
All rooms have mechanical ventilation and the systems used air handling units (AHU). The ventilation requirements for patient rooms were 0.023 m3/s.m2 and 2.7 ACPH (Air changes per hour) (UNE 1007-13). Natural ventilation is rarely used. In addition, the light system was supplied by fluorescent luminaires in most of the rooms without a control system, with a power of 7 W/m2 ASHRAE 90.I (American Society of Heating, Refrigerating and Air conditioning Engineers) [54]. Requirements for equipment were not considered for the selected patient room because these types of rooms do not have fixed equipment inside that can generate internal loads.
The opaque surface of the façades was constructed as a continuous concrete wall with a non-ventilated air gap. 5 cm thick polyurethane insulation was chosen for thermal wall protection, followed by an aluminium auxiliary structure which supports opaque glass sheets as well as the fixed and practicable windows. Table 2 describes the components for the opaque construction systems and the thermal transmittance. Regarding the translucent envelope, it shows a thermal transmittance of 2.7 W/m2K, with double glazing type Climalit 6 + 12 + 6 and a solar factor (g) of 78%. The frames are made of metal with thermal breaks and a U factor of 4.5 W/m2K. The frame to glass ratio is 20%.
Additionally, the window-wall ratio (WWR) of the building was evaluated (Table 3).
The north and south façades presented the highest WWR, 33 and 27% respectively, while the east façade showed 24% and the west, 27%. The rooms (A, B, C) selected and placed on the east side showed 25% of WWR. The WWR of the building is within the allowed values for the thermal transmittance of windows (2.7 W/m2K) in the climatic zone of Madrid (D3), in accordance with the energy efficiency regulations in Spain. In the case of the north façade, the WWR exceeds the allowed limits of the U value of the windows (2.2 W/m2K) because the building project was developed before these limits were introduced into the regulations.

3. Results and Discussion

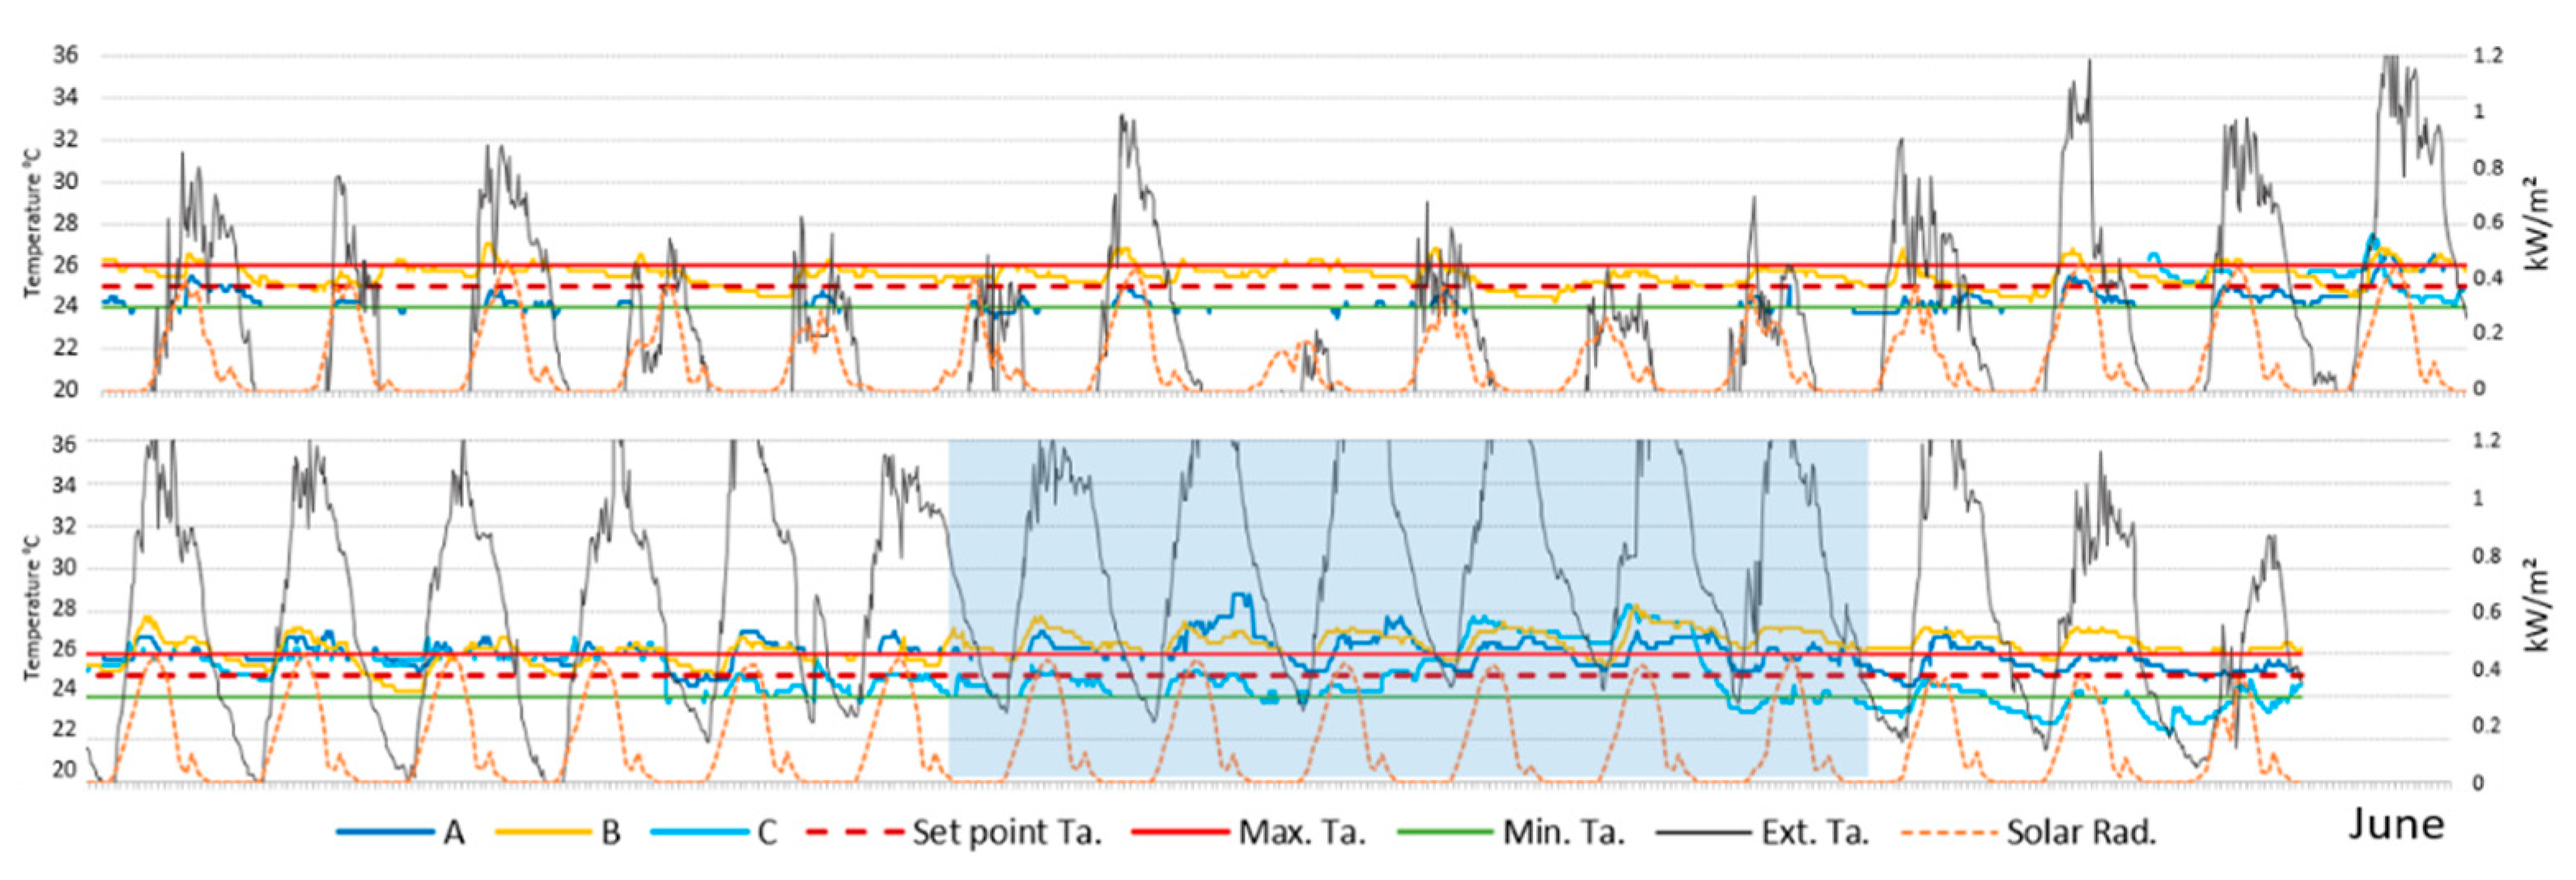
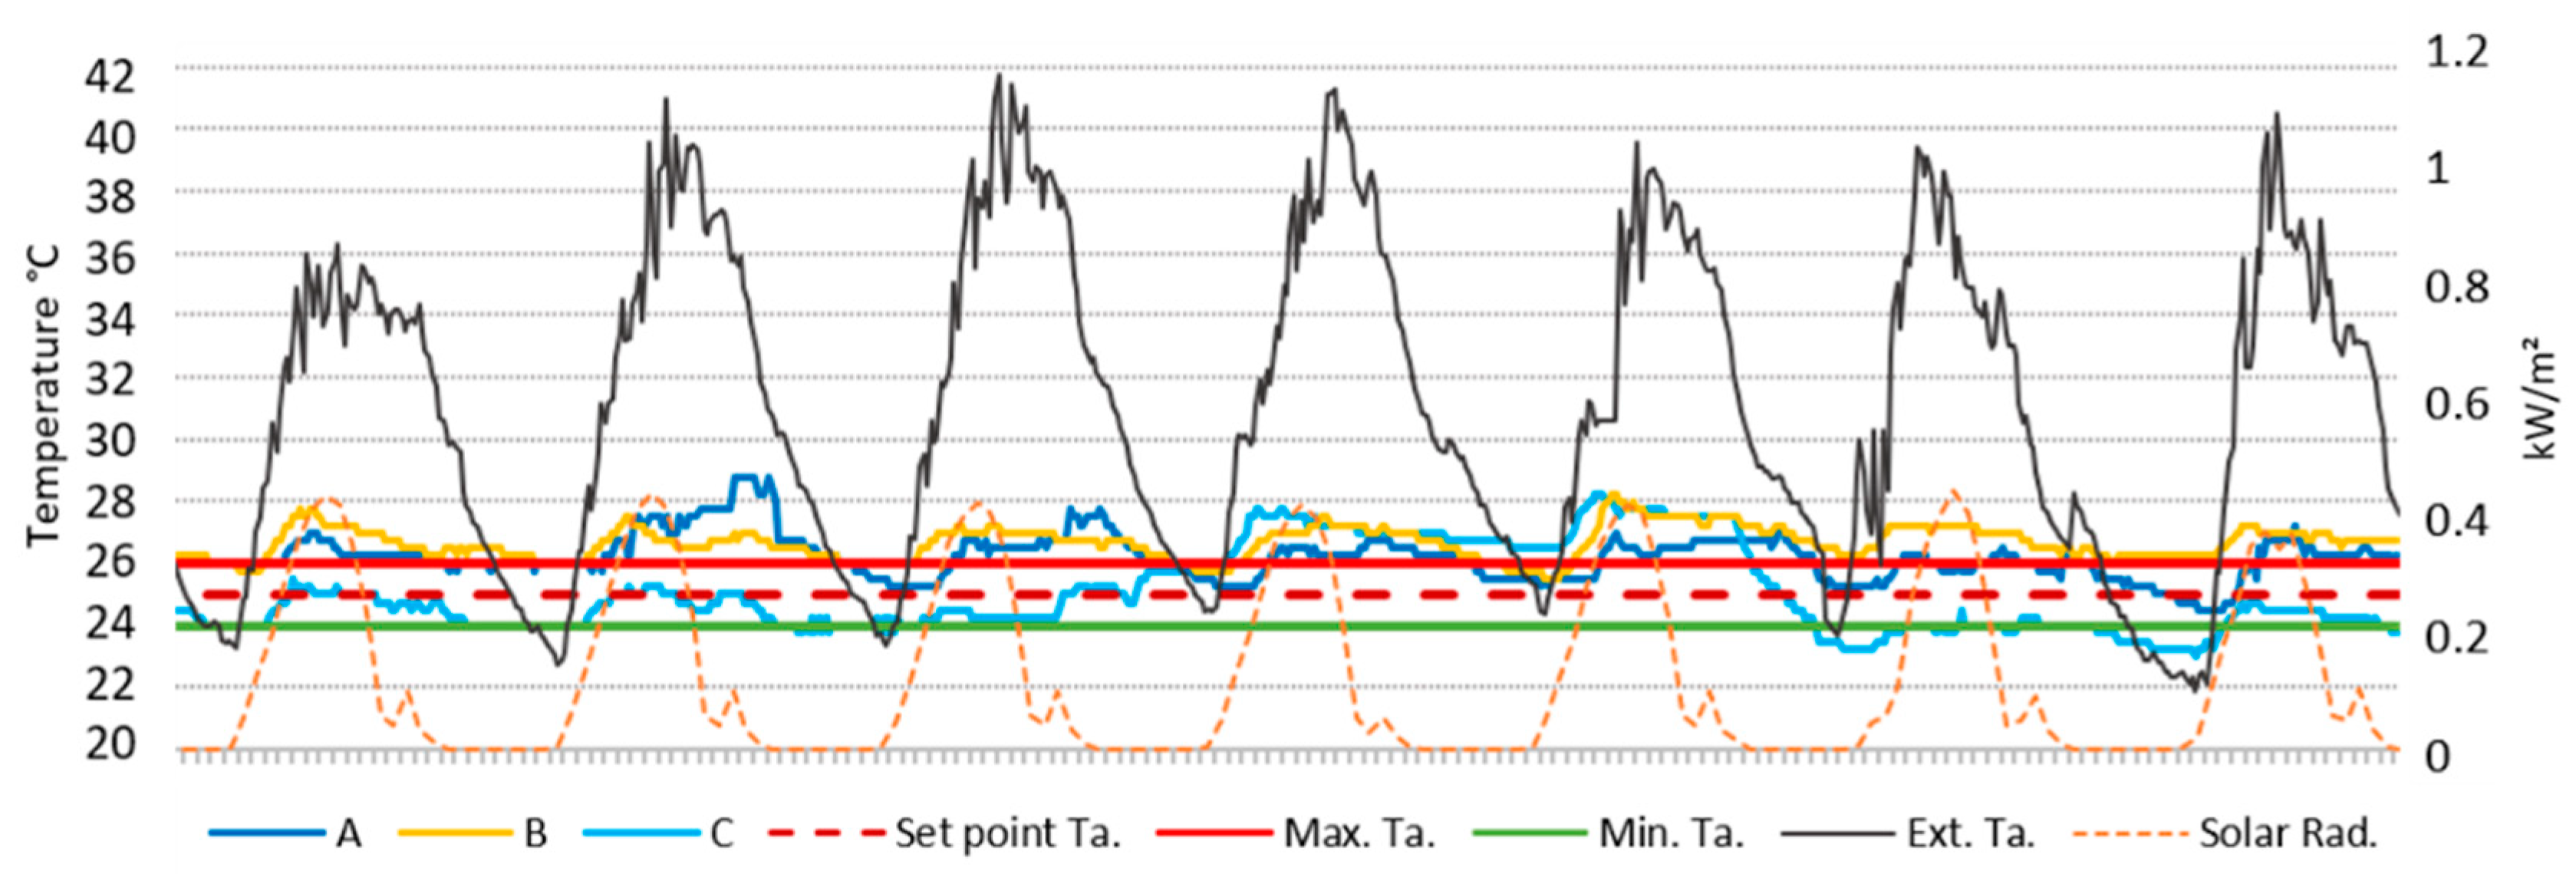
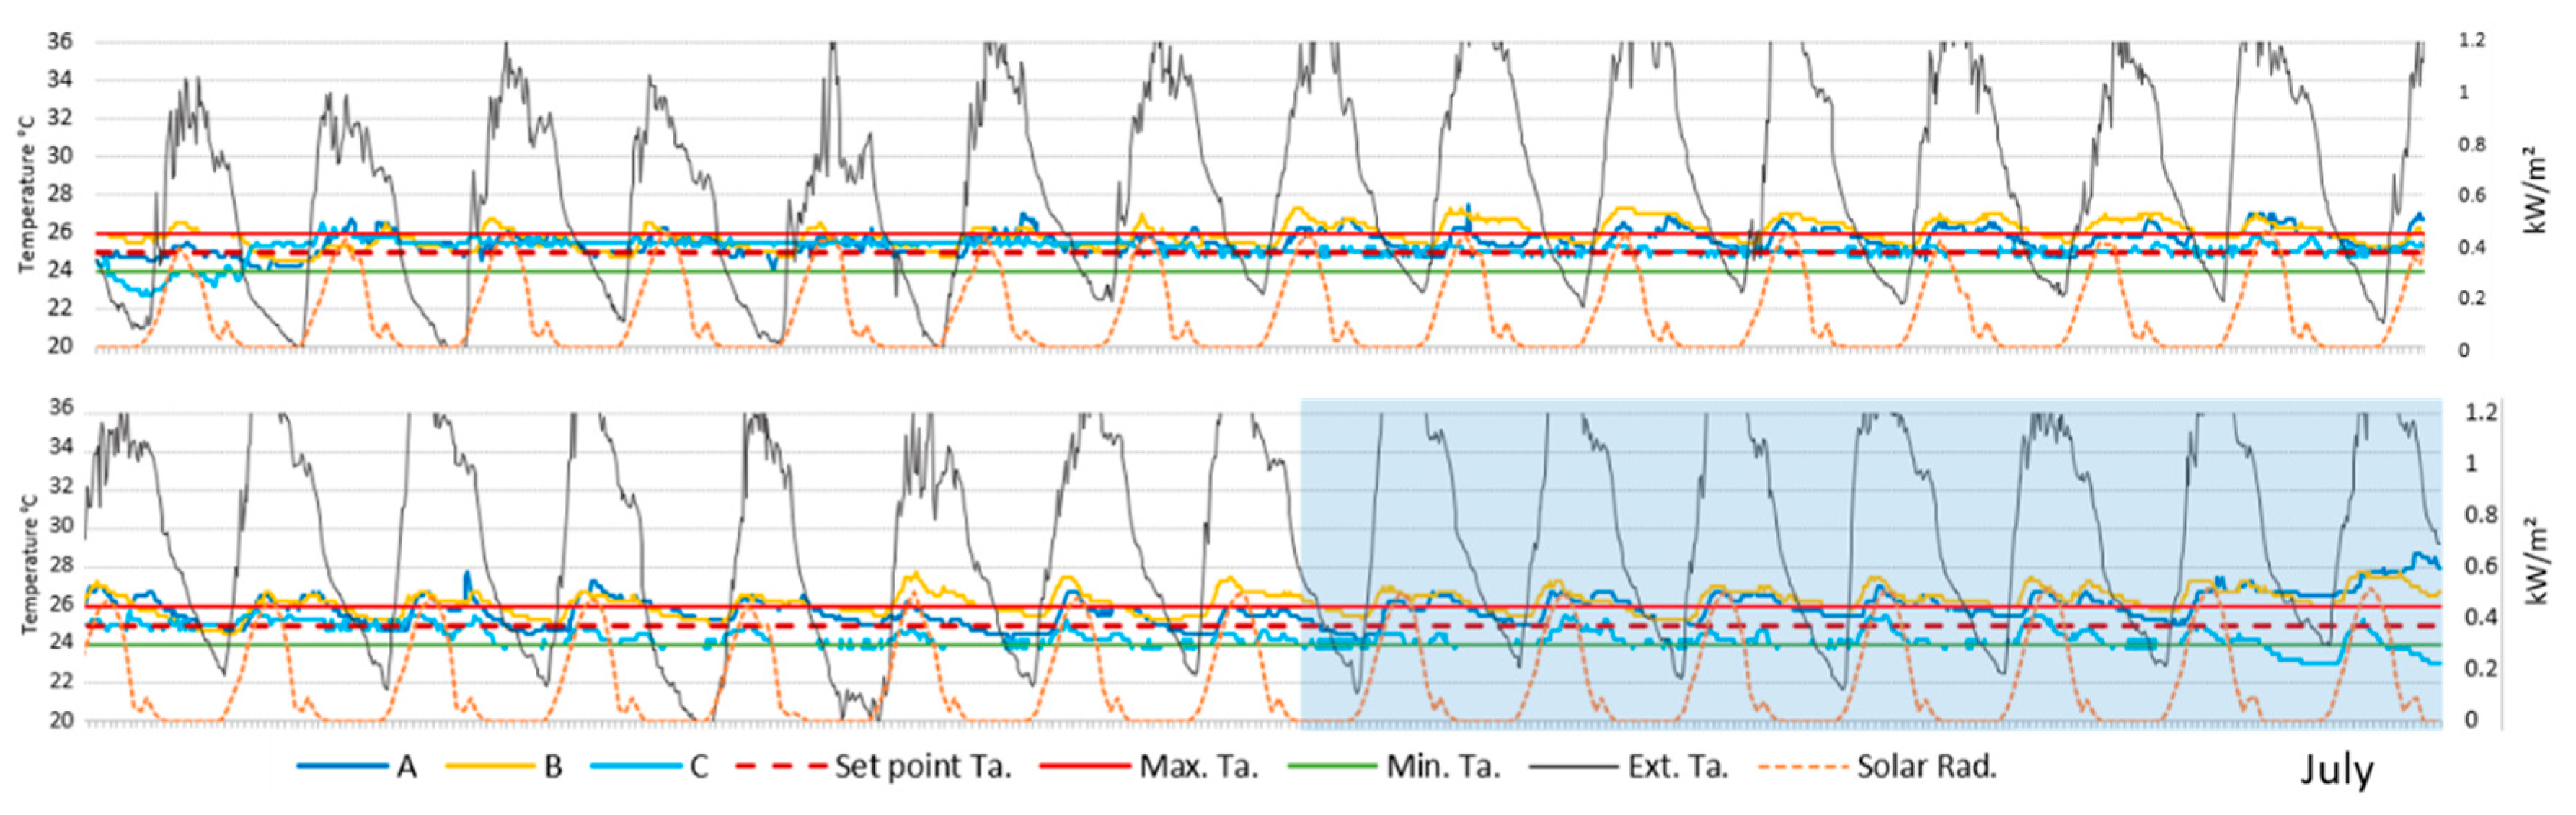
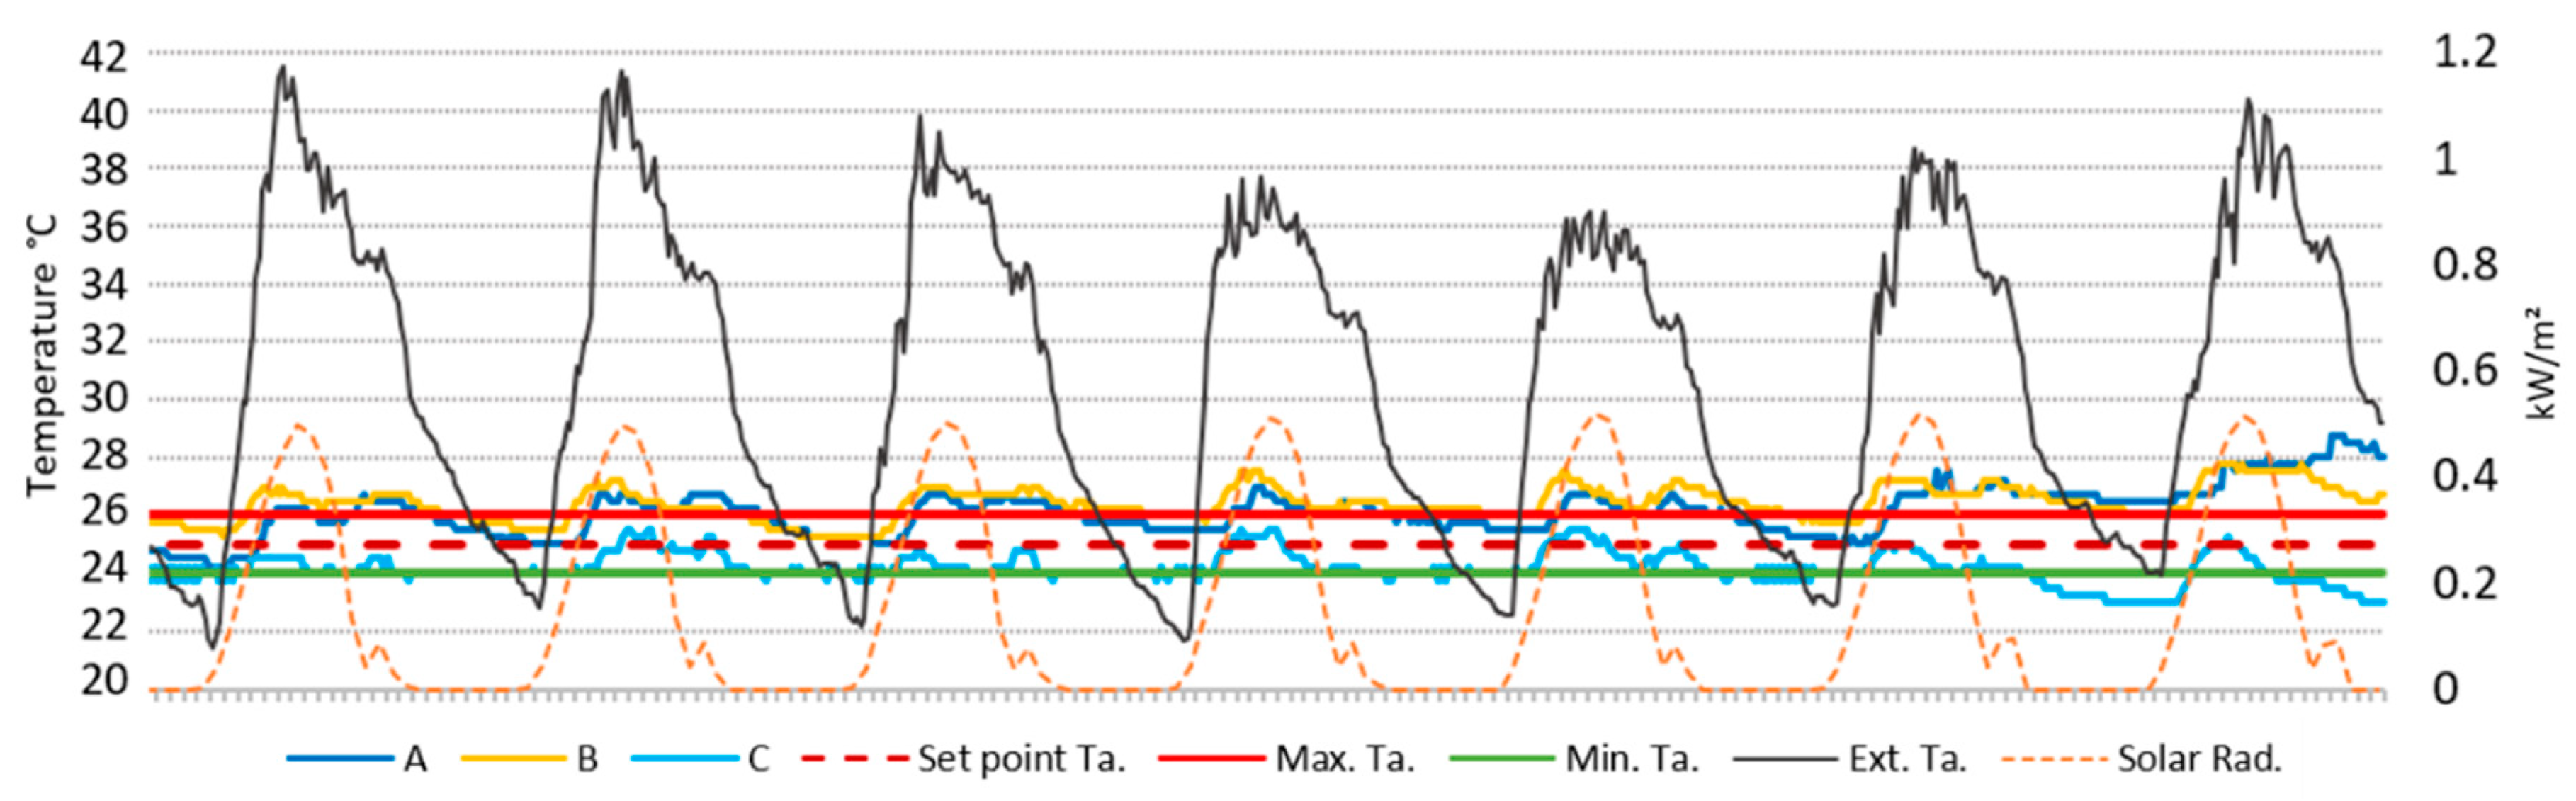
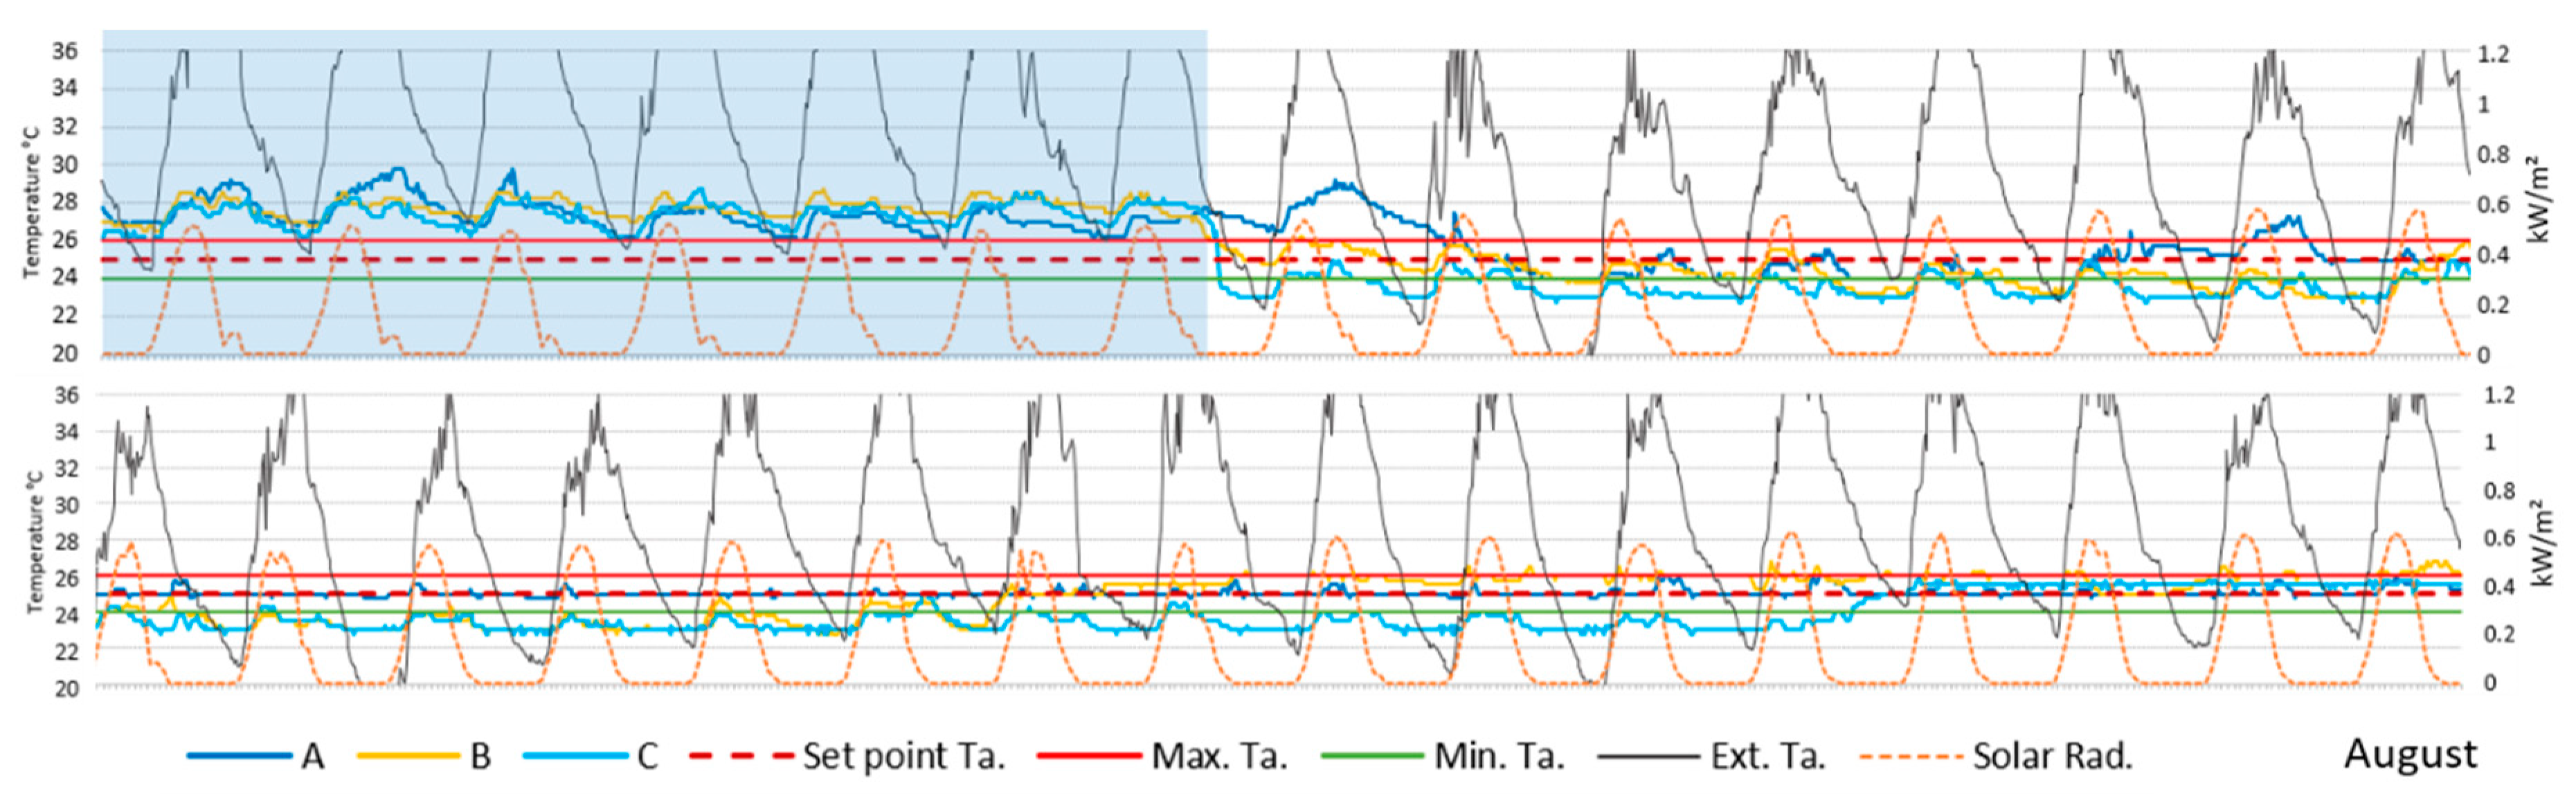
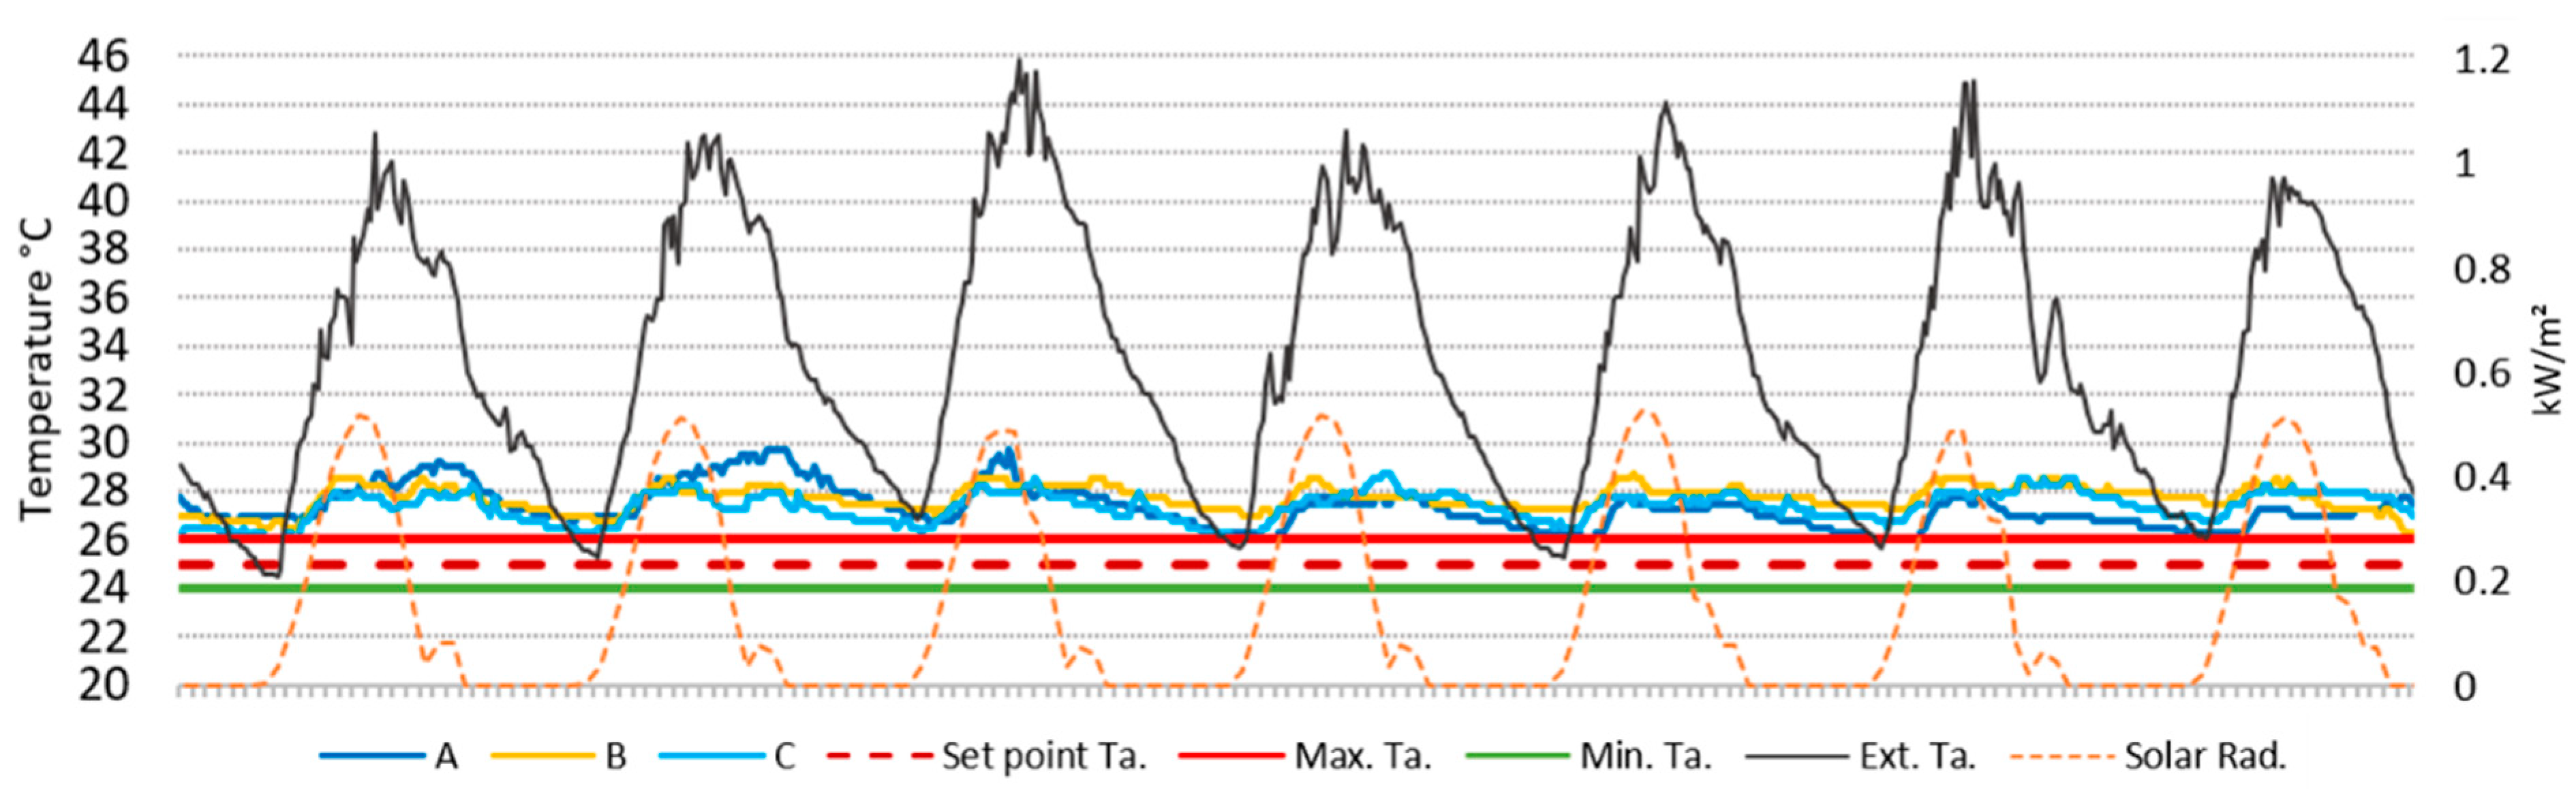
3.1. Measurements Results

During the summer of 2018 the indoor air temperature, outdoor air temperature and solar radiation were monitored to evaluate the influence of the envelope on the internal conditions in selected rooms in the hospital. Results of this study are shown in Figure 3, Figure 4, Figure 5, Figure 6, Figure 7 and Figure 8.
The indoor temperature increased gradually in the last fortnight of June directly affecting indoor set temperatures in the rooms analysed. This performance is in relation to the maximum values of solar radiation on the 15th of June. Figure 3 shows in detail the extreme indoor conditions reaching the temperature of 27 °C with more than 50% of the hours exceeding the upper-temperature limit in all of the rooms. Additionally, the minimum recorded outdoor temperature was 23 °C which was 2 °C higher than in the previous week; at the same time, an increase in the maximum temperatures was observed ranging from 37 °C to 40 °C.
In general, temperatures stared to increase around 10.30 a.m. and began to decrease at 3.30 p.m., which was directly related to solar incidence. The results of the simulations showing (Figure 9) hourly ranges of solar gains were found to be very similar to those measured in situ.
However, small differences can be observed between the rooms, and the first to suffer an increase in temperatures was Room B which is positioned on the central side. The indoor temperature began to increase at 9.00 a.m. compared to Room C (south side) (10.00 a.m.) and Room A (north side) (11.00 a.m.). So, the influence of the surrounding conditions is clear and the effect is higher for the room located in the middle of the building and followed by the south side location since this is the position in which the effect of solar radiation begins at 6.00 a.m. In the room placed to the north side, the effect of the solar radiation starts to be visible from 8.00 a.m. These circumstances together with the 4 °C fluctuation in temperature (with the maximum at 12.00 a.m. and the minimum at 4.00 a.m. is a clear consequence of the lack of thermal inertia in the building [55] and the lack of passive cooling strategies. In general, to implement passive cooling systems to adapt the building to the local environmental conditions, it is necessary to understand the sources of heat gains that are affecting thermal comfort in the building [56]. These circumstances have been reported in the literature as dependent on use and orientation [18,57].
During July, outdoor temperatures remain high (Figure 4). However, its influence on thermal comfort is mainly noticeable in the last week (25th to 31st) related to the increase in solar radiation in addition to the low thermal resistance of the building (Figure 5). In contrast to June, indoor temperatures recorded in July show minor fluctuations. However, the temperature values remain generally above the limit values due to the continuous overheating of the building [58]. The average value of the maximum outdoor temperature during the last week was 39 °C and the minimum was 22 °C (Figure 6).
The effect of solar radiation is once again clear in the case of the room which is shown to the time lag for Room A, compared to B and C. In August, the first week was the most unfavourable one, both values (the maximum and minimum averages) for external temperature increased by 4 °C in comparison with the values recorded in the last week of July. Consequently, the thermal comfort level in the monitored rooms was lower. The average maximum indoor temperature for this week reached 43 °C and the minimum remained at 26 °C (Figure 7). During this month extreme temperatures had been registered due to a heatwave episode reported by AEMET (Meteorology Statal Agency of Spain) [59] (Figure 8).
During the day, temperatures began to rise at 9.00 a.m. in Room A, while in Rooms B and C the level of the temperature start to rise from 10.00 a.m., and the rooms were overheated for the rest of the day (Figure 8). Once again, solar radiation showed a huge influence on the thermal performance of rooms [60]. In the contrast to July, indoor temperatures monitored in August show higher fluctuations, reaching the values of 29.5 °C, 28 °C and 28.7 °C registered in Room A, B and C respectively.
Under these circumstances, it must be highlighted that the air conditioning systems were not able to supply cooling to counteract the climate conditions. This is due to two reasons: (I) they were designed to supply energy under common climatic conditions without considering the effect of heatwaves [61,62]. (II) Overheating of the envelope is due to the lack of thermal mass and low thermal resistance of its outer opaque glass layer [60].
A low rate of efficiency was achieved in those cases when the temperatures outside were constantly high. This circumstance is even worst when lightweight construction is considered and the results of this study rectify previous studies about the potential need for air conditioning in this type of building [63]. Indeed, this research confirmed the fact that conventional set point temperature is not suited for hospital environments [31].

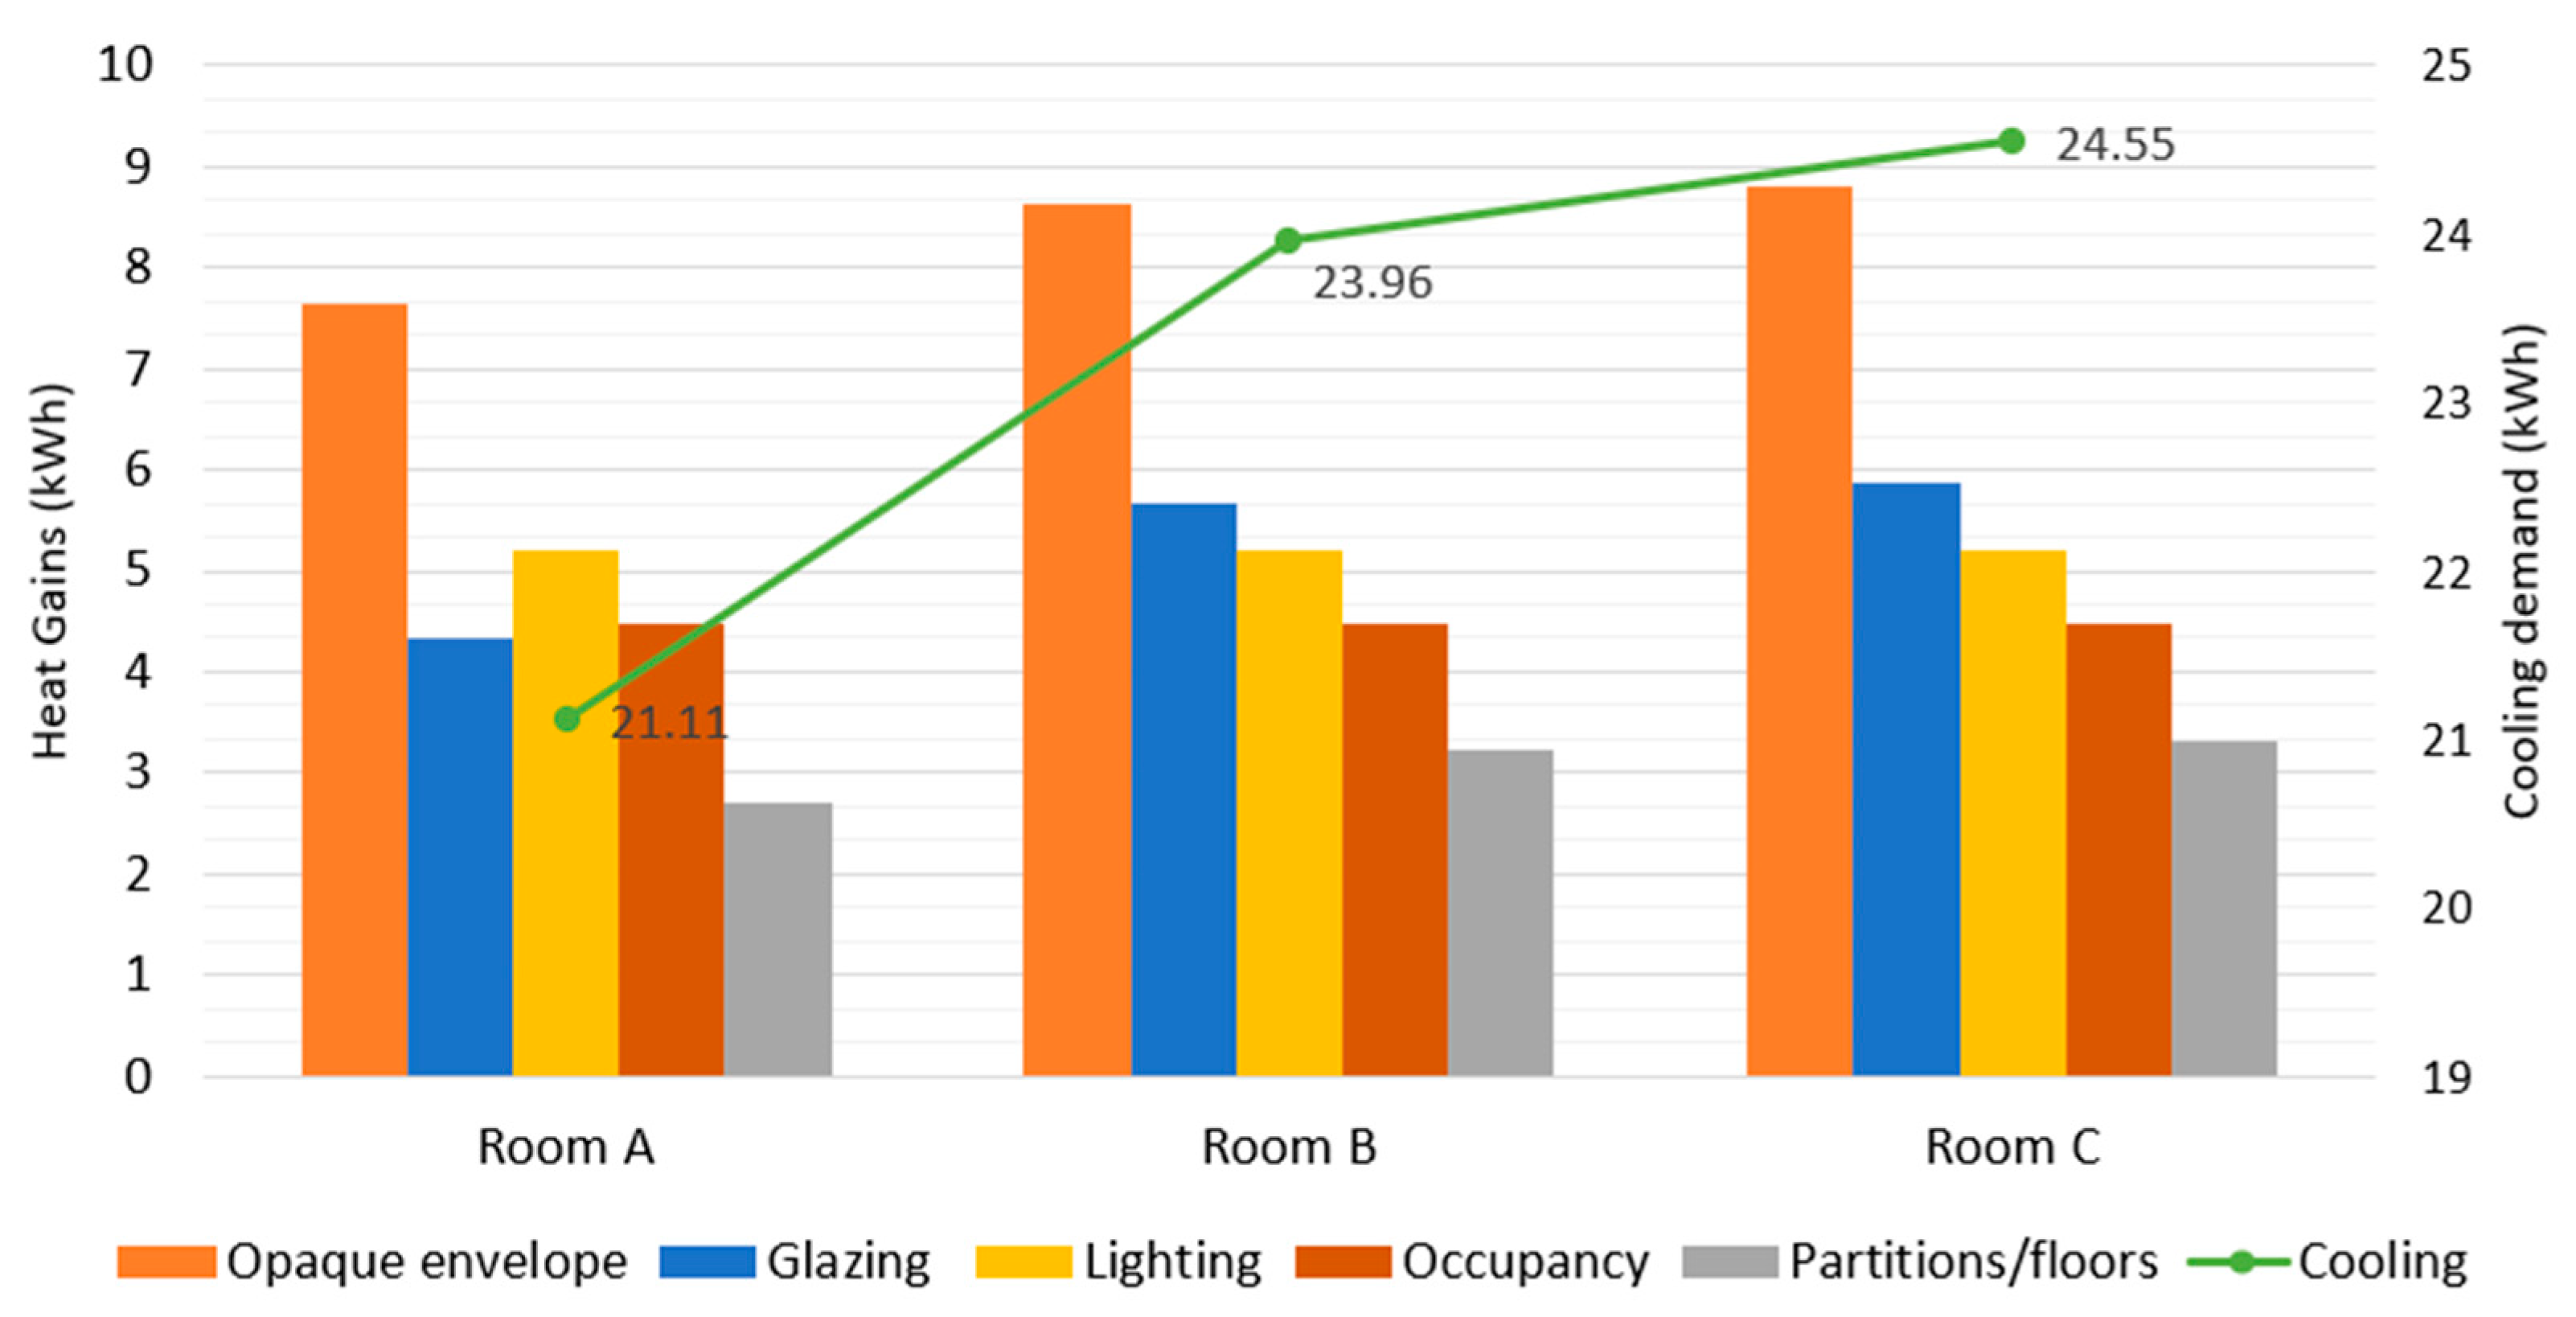
3.2. Simulation Results

The dynamic simulations of the rooms were carried out for July 15th, since this day represented a typical summer day for the Madrid climate. Table 4 show the values of internal heat loads of the rooms selected for the study.
In the case of this study, the occupancy data was collected and compared with the indoor temperature peaks. In general, the occupancy rate influences HVAC systems and their operation [64,65]. However, a direct correlation has not been found between the occupancy rate and the increase in indoor temperature in the rooms. Therefore, for this research, we have not considered it as a factor that directly affects the performance of the building [66].
The impact of the envelope on the thermal performance and cooling energy demand in analysed rooms are presented in (Figure 9) As can be seen, transmittances through the walls, caused by solar radiation and heat gains caused by conduction and convection, have a high impact on the thermal behaviour of the rooms. The values of internal heat gains from lighting and occupancy present the same values in the three rooms, 5.21 kWh per day from lighting and 4.47 kWh per day from occupancy. In the case of Room C, heat gains through the walls showed a higher value reaching 6.23 kWh per day than from lighting or occupancy. This value represents a 20% higher heat gains through the walls than the heat gains from lighting, and 39% higher than heat gains from occupancy. In the same manner, Room B showed a value of internal heat loads of 6.12 kWh per day through the walls. This value constitutes a 17% higher load through the walls than from the lighting, and 37% higher heat gains than from occupancy.
In comparison with Rooms B and C, the lower heat gains through the walls are presented by Room A where walls showed a value of 5.24 kWh per day, this represents only a 1% higher value than the lighting heat loads and 17% than occupancy. Transmittances through windows and glazing, caused by direct sun rays also contribute to the indoor environment and energy demand of the rooms. The heat transfer from glazing in Room C showed a high value of internal heat loads reaching 5.88 kWh per day. This value represents 13% higher loads than the light and 32% higher than heat loads from occupancy. In the cases of Room B, glazing showed a value of heat loads of 5.68 kWh per day. These heat gains represent a 9% higher value than the lighting and 27% higher than from occupancy. However, in Room A heat gains through the glass presented an internal heat load of 4.32 kWh per day. This value is 17% lower than the heat gains through light and 3% lower than from occupancy. Additionally, differences in solar gains in terms of the placement of rooms were found Room C presented 2.19 kWh per day of solar gains, Room B showed a value of solar gains of 2.11 kWh per day and Room A only showed 1.43 kWh per day of solar gains. The values of Room C represent 54% higher solar gains than Room A, and 4% higher than Room B. While, Room B showed 48% higher solar incidence than Room A.
Cooling demand values of the rooms analysed has been presented in Table 4. Room A showed a value of 21.11 kWh per day, that is the lower cooling demand in comparison with Room B, that presented a cooling demand of 23.96 kWh per day and Room C has shown a cooling demand of 24.55 kWh per day. In general, the peak load of the heat gains in the rooms are presented between 8.30 a.m. to 10.00 a.m. Room A presented the peak load value from walls and glazing at 9.30 a.m. while Room B and C showed the peak load through walls and glazing at 9.00 a.m. In the case of solar gains, Room A showed the peak load at 9.30 a.m. then Room B and C at 8.30 a.m. The cooling demand peak load has been shown at 10.00 a.m. by the three rooms (Figure 9). These peaks presented on internal loads correspond to the increase in temperatures measured inside the rooms (from 10.30 a.m. to 3.30 p.m.) showed in the analysis in Section 3.1. These results have highlighted the lack of thermal inertia of the buildings especially the envelope system.
Once again, differences in results based on the position of rooms were found also in the simulation performance (Figure 10).
Room A positioned on the north side, showed lower solar gains than Room B (central side) and Room C (south side). While in Rooms B and C solar radiation presented the same percentage of gains. In the same manner, internal gains by glazing in Room A are 33% lower than for Room B and 38% lower in comparison with Room C. Similarly, Room A presents 19% lower internal gains through the walls than Room B and 20% lower than Room C.
These circumstances occurred due to the reduced thermal time constant (TTC) of the thermal mass of the envelope. As reported, indoor temperatures remained outside the limit values throughout the whole day, especially in the first week of August. These conditions are a consequence of lack of diurnal heat capacity (DHC) of the façade materials. In this context, the relative values of TTC are particularly important when the building is affected by heat flux, while the values of DHC are important when the solar gain affecting the building is considerable [56]. The influence of the envelope thermal efficiency in the interior temperature of rooms is evident. However, internal gains presented by lighting and occupancy in the daytime period have a lower heat incidence in the cases of the post-delivery rooms. Partitions and floors are the elements of the envelope that have presented insignificant heat losses of the rooms.
The comparison between internal heat gains of rooms demonstrates that the location of the rooms is affected by high solar radiation and therefore has a direct impact on the behaviour of the envelope and the heat transfer inside the rooms. This causes the overheating of the facades during the hours marked by the high incidence of solar gains, which the small mass of the façade construction system is not able to retain. As a consequence, the temperature of the rooms is maintained for a large percentage of the day outside the limits of the set-point temperature according to current regulations.
The thermal performance of buildings could be improved by implementing some passive strategies. Several studies have confirmed that the application of shading devices [56], higher thermal mass materials [44,61] incorporation of vegetation [67] and higher insulation value [43], could help to mitigate the UHI effect and reduce the energy demand of buildings. In the case of this building, we recommend the implementation of a shading device system that can be operated accordingly during summer and winter based on the prevailing heat conditions.

4. Conclusions and Future Work

Control of the indoor environmental conditions is critical in healthcare buildings to guarantee the recovery of patients. These circumstances are even more dramatic in the case of newborn children when temperatures must be controlled to avoid thermal stresses. This is the reason why the European standards for healthcare buildings establish that the temperature in patient rooms must be between 24 and 26 °C, which is conservative compared to the AHSRAE standard which establishes values between 21 and 24 °C.
In spite of the importance of control indoor temperatures and adapt to climate conditions, the new buildings for healthcare showed similar construction systems and solutions independently of their geographical latitude and microclimate. Among the new hospitals, a neonatal hospital placed in the city centre of Madrid (Spain) was selected. It showed a commonly used lightweight construction system of façade with a non-ventilation system. In addition, its placement in the city centre implied that it was exposed to the effect of climate change in addition to the effects of the UHI.
The results highlighted the importance of passive strategies in this type of building in which construction systems of the envelope determined the indoor conditions. Large glazing areas worsen the thermal performance, mainly due to the increase in solar radiation loads and implied that indoor conditions were subjected to huge fluctuations in temperature. Indeed, as exposed, temperatures went over the standard limits on about 50% of the hours in June and July, achieving up to 27 °C in the rooms. These circumstances during heatwave episodes, in which external temperatures raised up to 40 °C, causing the HVAC systems to inefficient and, as a result, the indoor temperature exceeded 28 °C. This implied a considerable CO2 emission due to the huge number of working hours of the air conditioning systems. What is even more important, this increase in temperature had repercussions on patients’ health and recovery, especially when neonates’ care was considered.
These circumstances provoked by heat loads have also been confirmed in the results shown by the energy simulation of rooms. Transmittances through the walls, caused by solar radiation and heat gains have a high impact on the thermal behaviour of rooms. Heat gains through the opaque envelope of the three rooms showed a high average, reaching 8.37 kWh/day, followed from glazing average value of 5.29 kWh/day, while average heat gains from lighting were 5.21 kWh/day and 4.47 kWh/day from occupancy. Internal partitions and floors showed a low level of heat loads average of 3.09 kWh/day. The cooling demand average of rooms showed a value of 23.21 kWh/day. In general, the peak of the heat gains in rooms occurred between 8.30 a.m. to 10.00 a.m., which corresponds to an increase in temperatures inside the rooms from 10.30 a.m. to 3.30 p.m. These results have highlighted the lack of thermal inertia of the buildings especially the envelope system.
Accordingly, a re-thinking must be promoted in the case of this type of building so that the promotion of zero energy buildings can be guaranteed together with providing desired and required thermal conditions. This is required to minimise the use of active energy and the adaption of design and construction systems is needed to meet specific climatic conditions. In addition, the design must include the reconsideration of air conditioning systems. Finally, this research has confirmed the fact that conventional methods used to establish the setpoint temperatures for hospital environments are not suited.
Future work of the authors includes the implementation of strategies that allow for improving the interior comfort conditions of the building and its behaviour in the face of consequences in climate changes. For example, a study of different shading system to determine the optimum system that could be implemented for the building. Given that the construction systems of the last decades are lightweight, they do not respond to the Mediterranean or continental climate, and much less to a climate with acute heat islands such as in Madrid.

Author Contributions

Concept, M.d.M.B.-B. and M.R.P.; methodology, M.d.M.B.-B. and M.R.P.; software, K.J.M.; validation, M.R.P. and K.J.M.; formal analysis, K.J.M.; investigation, K.J.M.; resources, K.J.M.; data curation, K.J.M.; writing—original draft preparation, K.J.M.; writing—review and editing, M.d.M.B.-B. and K.J.M.; visualisation, K.J.M.; supervision, M.d.M.B.-B. and M.R.P.; All authors have read and agreed to the published version of the manuscript.

Funding

This research received no external funding.

Acknowledgments

The authors acknowledge the support of the hospital and the Engineering and Maintenance Department, as well as the administrative department of the hospital. Special thanks are given to the deputy director of the hospital’s engineering department.

Conflicts of Interest

The authors declare no conflict of interest.

References

  1. Intergovernmental Panel on Climate Change (IPCC). Climate Change 2014: Synthesis Report. Contribution of Working Groups I, II and III to the Fifth Assessment Report of the Intergovernmental Panel on Climate Change; IPCC: Geneva, Switzerland, 2014. [Google Scholar]
  2. Allen, M.R.; Dube, O.P.; Solecki, W.; Aragon-Durand, F.; Cramer, W.; Humphreys, S.; Zickfeld, K. Framing and Context in: Global Warming of 1.5 °C. An IPCC Special Report on the Impacts of Global Warming of 1.5 °C Above Pre-Industrial Levels and Related Global Greenhouse Gas Emission Pathways, in the Context of Strengthening the Global Response to the Threat of Climate Change, Sustainable Development, and Efforts to Eradicate Poverty; Technical Report; IPCC: Geneva, Switzerland, 2018. [Google Scholar]
  3. Climate Signals. European Heat Wave. 2003. Available online: https://www.climatesignals.org/events/european-heat-wave-2003 (accessed on 16 June 2020).
  4. Meehl, G.A.; Tebaldi, C. More Intense, More Frequent, and Longer Lasting Heat Waves in the 21st Century. Science 2004, 305, 994–997. [Google Scholar] [CrossRef] [Green Version]
  5. Dong, B.; Sutton, R.; Shaffrey, L.; Wilcox, L. The 2015 European Heat Wave. Bull. Am. Meteorol. Soc. 2016, 97, 57–62. [Google Scholar] [CrossRef]
  6. Black, E.; Blackburn, M.; Harrison, G.; Hoskins, B.; Methven, J. Factors contributing to the summer 2003 European heatwave. Weather 2004, 59, 217–223. [Google Scholar] [CrossRef]
  7. Habeeb, D.; Vargo, J.; Stone, B. Rising heat wave trends in large US cities. Nat. Hazards 2015, 76, 1651–1665. [Google Scholar] [CrossRef]
  8. Hardin, A.W.; Liu, Y.; Cao, G.; Vanos, J.K. Urban heat island intensity and spatial variability by synoptic weather type in the northeast U.S. Urban Clim. 2018, 24, 747–762. [Google Scholar] [CrossRef]
  9. He, B. Potentials of meteorological characteristics and synoptic conditions to mitigate urban heat island effects. Urban Clim. 2018, 24, 26–33. [Google Scholar] [CrossRef]
  10. The European Espace Agency. Urban Heat Island and Urban Thermography; Techical Report I, DUE (Data User Element); ESA: Bari, Italy, 2011. [Google Scholar]
  11. Fernández García, F.; Allende Álvarez, F.; Alcaide Muñoz, J.; Rasilla Álvarez, D.; Martilli, A. Estudio de Detalle del Clima Urbano de Madrid; Área de Gobierno de Medio Ambiente y Movilidad, Ayuntamiento de Madrid: Madrid, Spain, 2016. [Google Scholar]
  12. Ward, K.; Lauf, S.; Kleinschmit, B.; Endlicher, W. Heat waves and urban heat islands in Europe: A review of relevant drivers. Sci. Total Environ. 2016, 569–570, 527–539. [Google Scholar] [CrossRef] [PubMed]
  13. Martin-Vide, J.; Moreno-Garcia, M.C. Probability values for the intensity of Barcelona’s urban heat island (Spain). Atmos. Res. 2020, 240, 104–877. [Google Scholar] [CrossRef]
  14. Yagüe, C.; Zurita, E.; Martinez, A. Statistical analysis of the Madrid urban heat island. Atmos. Environment. Part B. Urban Atmos. 1991, 25, 327–332. [Google Scholar] [CrossRef]
  15. Núñez Peiró, M.; Román López, E.; Sánchez-Guevara Sánchez, C.; Neila González, F. Towards a Dynamic Model for the Urban Heat Island of Madrid. An. Edif. 2016, 2, 49–58. [Google Scholar] [CrossRef] [Green Version]
  16. Oudin Åström, D.; Bertil, F.; Joacim, R. Heat wave impact on morbidity and mortality in the elderly population: A review of recent studies. Maturitas 2011, 69, 99–105. [Google Scholar] [CrossRef] [PubMed]
  17. Phung, D.; Thai, P.K.; Guo, Y.; Morawska, L.; Rutherford, S.; Chu, C. Ambient temperature and risk of cardiovascular hospitalization: An updated systematic review and meta-analysis. Sci. Total Environ. 2016, 550, 1084–1102. [Google Scholar] [CrossRef] [PubMed]
  18. Ormandy, D.; Ezratty, V. Health and thermal comfort: From WHO guidance to housing strategies. Energy Policy 2012, 49, 116–121. [Google Scholar] [CrossRef]
  19. Xiong, J.; Lian, Z.; Zhou, X.; You, J.; Lin, Y. Effects of temperature steps on human health and thermal comfort. Build. Environ. 2015, 94, 144–154. [Google Scholar] [CrossRef]
  20. Mapped: How Climate Change Affects Extreme Weather around the World. Available online: https://www.carbonbrief.org/mapped-how-climate-change-affects-extreme-weather-around-the-world (accessed on 9 June 2020).
  21. World Meteorological Organization and World Health Organization Heatwaves and Health. Guidance on Warning System-Development; WHO: Geneva, Switzerland, 2015. [Google Scholar]
  22. Barriopedro, D.; Sousa, P.M.; Trigo, R.M.; García-Herrera, R.; Ramos, A.M. The Exceptional Iberian Heatwave of Summer 2018. Bull. Am. Meteor. Soc. 2020, 101, S29–S34. [Google Scholar] [CrossRef] [Green Version]
  23. Herring, S.C.; Hoell, A.; Hoerling, M.P.; Kossin, J.P.; Schreck, C.J., III; Stott, P.A. Explaining Extreme Events of 2015 from a Climate Perspective. Bull. Am. Meteor. Soc. 2017, 97, S57–S62. [Google Scholar] [CrossRef] [Green Version]
  24. Taylor, J.; Davies, M.; Mavrogianni, A.; Shrubsole, C.; Hamilton, I.; Das, P.; Jones, B.; Oikonomou, E.; Biddulph, P. Mapping indoor overheating and air pollution risk modification across Great Britain: A modelling study. Build. Environ. 2016, 99, 1–12. [Google Scholar] [CrossRef]
  25. Pyrgou, A.; Castaldo, V.L.; Pisello, A.L.; Cotana, F.; Santamouris, M. On the effect of summer heatwaves and urban overheating on building thermal-energy performance in central Italy. Sustain. Cities Soc. 2017, 28, 187–200. [Google Scholar] [CrossRef]
  26. European Commission. Consumption of non-Residential Buildings per m² (Normal Climate). Available online: https://ec.europa.eu/energy/content/energy-consumption-m%C2%B2-2_en (accessed on 18 August 2020).
  27. Ma, H.; Lu, W.; Yin, L.; Shen, X. Public Building Energy Consumption Level and Influencing Factors in Tianjin. Energy Procedia 2016, 88, 146–152. [Google Scholar] [CrossRef] [Green Version]
  28. Verheyen, J.; Theys, N.; Allonsius, L.; Descamps, F. Thermal comfort of patients: Objective and subjective measurements in patient rooms of a Belgian healthcare facility. Build. Environ. 2011, 46, 1195–1204. [Google Scholar] [CrossRef]
  29. Pourshaghaghy, A.; Omidvari, M. Examination of thermal comfort in a hospital using PMV–PPD model. Appl. Ergon. 2012, 43, 1089–1095. [Google Scholar] [CrossRef] [PubMed]
  30. Sattayakorn, S.; Ichinose, M.; Sasaki, R. Clarifying thermal comfort of healthcare occupants in tropical region: A case of indoor environment in Thai hospitals. Energy Build. 2017, 149, 45–57. [Google Scholar] [CrossRef]
  31. Alotaibi, B.S.; Lo, S.; Southwood, E.; Coley, D. Evaluating the suitability of standard thermal comfort approaches for hospital patients in air-conditioned environments in hot climates. Build. Environ. 2020, 169, 106561. [Google Scholar] [CrossRef]
  32. Spanish Association for Standardization and Certification (AENOR) Air Conditioning Installations in Hospitals; AENOR: Madrid, Spain, 2005.
  33. Balaras, C.A.; Dascalaki, E.; Gaglia, A. HVAC and indoor thermal conditions in hospital operating rooms. Energy Build. 2007, 39, 454–470. [Google Scholar] [CrossRef]
  34. Azizpour, F.; Moghimi, S.; Salleh, E.; Mat, S.; Lim, C.H.; Sopian, K. Thermal comfort assessment of large-scale hospitals in tropical climates: A case study of University Kebangsaan Malaysia Medical Centre (UKMMC). Energy Build. 2013, 64, 317–322. [Google Scholar] [CrossRef]
  35. Quiroga, A.; Chattas, G.; Gil, A.; Ramírez, M.; Montes, M.T.; Iglesias, A.; Plasencia, J.; López, I.; Carrera, B. Practical Guide to Thermoregulation in Newborns; SIBEN: Buenos Aires, Argentina, 2010. [Google Scholar]
  36. Knobel, R.; Guenther, B.D.; Rice, H.E. Thermoregulation and thermography in neonatal physiology and disease. Biol. Res. Nurs. 2011, 13, 274–282. [Google Scholar] [CrossRef] [Green Version]
  37. Lubkowska, A.; Szymański, S.; Chudecka, M. Surface Body Temperature of Full-Term Healthy Newborns Immediately after Birth-Pilot Study. Int. J. Environ. Res. Public Health 2019, 16, 1312. [Google Scholar] [CrossRef] [Green Version]
  38. Kakkad, K.; Barzaga, M.L.; Wallenstein, S.; Shah Azhar, G.; Sheffield, P.E. Neonates in Ahmedabad, India, during the 2010 Heat Wave: A Climate Change Adaptation Study. J. Environ. Public Health 2014, 2014, 8. [Google Scholar] [CrossRef] [Green Version]
  39. World Health Organization (WHO). Maternal and Newborn Health/Safe Motherhood Thermal Protection of the Newborn: A Practical Guide; WHO: Geneva, Switzerland, 1997; pp. 11–64. [Google Scholar]
  40. Jia, Y.S.; Lin, Z.L.; Lv, H.; Li, Y.M.; Green, R.; Lin, J. Effect of delivery room temperature on the admission temperature of premature infants: A randomized controlled trial. J. Perinalology 2013, 33, 264–267. [Google Scholar] [CrossRef] [Green Version]
  41. ASHRAE. Handbook for HVAC Applications in Health Care Facilities; ASHRAE: Atlanta, GA, USA, 2019; Charpter 9; pp. 1–20. [Google Scholar]
  42. Number of Public Hospitals in Spain from 2000 to 2017. Available online: https://www.statista.com/statistics/557228/publicly-owned-hospitals-in-spain/ (accessed on 20 August 2020).
  43. McKelvey, D.; Foster, K.; Copley, D.; Wilson, A. Overcladding for Thermal Performance and Building Resiliency, Thermal Performance of the Exterior Envelopes of Whole Buildings; American Society of Heating, Refrigeration, and Air-Conditioning Engineers (ASHRAE): Miami, FL, USA, 2016. [Google Scholar]
  44. Kandya, A.; Mohan, M. Mitigating the Urban Heat Island effect through building envelope modifications. Energy Build. 2018, 164, 266–277. [Google Scholar] [CrossRef]
  45. MODIFICA Project. Predictive Model of the Behavior of Residential Buildings under the Effects of the Madrid Heat Island. Available online: http://abio-upm.org/project/modifica/ (accessed on 26 August 2020).
  46. Terés-Zubiaga, J.; Escudero, C.; García-Gafaro, C.; Sala, J.M. Methodology for evaluating the energy renovation effects on the thermal performance of social housing buildings: Monitoring study and grey box model development. Energy Build. 2015, 102, 390–405. [Google Scholar] [CrossRef]
  47. Cuce, P.M.; Cuce, E. Toward cost-effective and energy-efficient heat recovery systems in buildings: Thermal performance monitoring. Energy 2017, 137, 487–494. [Google Scholar] [CrossRef]
  48. Madsen, H.; Holst, J. Estimation of continuous-time models for the heat dynamics of a building. Energy Build. 1995, 22, 67–79. [Google Scholar] [CrossRef]
  49. SIEMENS Building Technology DESIGO-INSIGHT Building Automation & Control System; Zug, Switzerland, 2004.
  50. Spanish Association of Standardization and Certification (AENOR) UNE-EN 62974-1 Monitoring and Measuring Systems Used for Data Collection, Gathering and Analysis-Part 1: Device Requirements; AENOR: Madrid, Spain, 2017.
  51. Big Ladder Software. Available online: https://bigladdersoftware.com/epx/docs/8-0/engineering-reference/page-021.html (accessed on October 2020).
  52. Spain Ministry of Development Regulations of Technical Building Code (CTE). Energy Saving Regulations in Buildings (HE); HE-1; Spain Ministry of Development Regulations of Technical Building Code: Madrid, Spain, 2017. [Google Scholar]
  53. Spain Ministry of Industry. Tourism and Commerce in collaboration with the Ministry of Housing Thermal Installations in Buildings (RITE); IT 1.2.4.5; Spain Ministry of Industry: Madrid, Spain, 2013. [Google Scholar]
  54. AHSRAE 90.I Standard; Energy Standards for Buildings except Low-Rise Residential Buildings; ASHRAE: Atlanta, GA, USA, 2010.
  55. Brás, A.; Rocha, A.; Faustino, P. Integrated approach for school buildings rehabilitation in a Portuguese city and analysis of suitable third party financing solutions in EU. J. Build. Eng. 2015, 3, 79–93. [Google Scholar] [CrossRef]
  56. Freewan, A. Advances in Passive Cooling Design: An Integrated Design Approach. In Zero and Net Zero Energy; Hailu, G., Ed.; IntechOpen: London, UK, 2019; pp. 187–211. [Google Scholar]
  57. Aguirre Piña, A.L. Indoor thermal effects of different wall configurations in warm humid climates. In Passive and Low Energy Ecotechniques; Bowen, A., Ed.; Pergamon, Turkey, 1985; pp. 988–993. [Google Scholar]
  58. Wu, S. 4-Heat energy storage and cooling in buildings. In Materials for Energy Efficiency and Thermal Comfort in Buildings; Hall, M.R., Ed.; Woodhead Publishing: Cambridge, UK, 2010; pp. 101–126. [Google Scholar]
  59. State Meteorological Agency of Spain (AEMET). Weather Summary-Summer 2018; AEMET: Madrid, Spain, 2018. [Google Scholar]
  60. Hwang, R.; Lin, T.; Lin, F. Evaluation and mapping of building overheating risk and air conditioning use due to the urban heat island effect. J. Build. Eng. 2020, 32, 101726. [Google Scholar] [CrossRef]
  61. Kendrick, C.; Ogden, R.; Wang, X.; Baiche, B. Thermal mass in new build UK housing: A comparison of structural systems in a future weather scenario. Energy Build. 2012, 48, 40–49. [Google Scholar] [CrossRef]
  62. Rodriguez, C.M.; D’Alessandro, M. Indoor thermal comfort review: The tropics as the next frontier. Urban Clim. 2019, 29, 100488. [Google Scholar] [CrossRef]
  63. Elias-Ozkan, S.; Summers, F.; Surmeli, N.; Yannas, S. A Comparative study of the thermal performance of building materials. In Proceedings of the 23rd Conference on Passive and Low Energy Architecture (PLEA), Geneva, Switzerland, 6–8 September 2006. [Google Scholar]
  64. Ding, Y.; Wang, Z.; Feng, W.; Marnay, C.; Zhou, N. Influence of occupancy-oriented interior cooling load on building cooling load design. Appl. Therm. Eng. 2016, 96, 411–420. [Google Scholar] [CrossRef]
  65. Yang, Z.; Becerik-Gerber, B. How Does Building Occupancy Influence Energy Efficiency of HVAC Systems? Energy Procedia 2016, 88, 775–780. [Google Scholar] [CrossRef] [Green Version]
  66. Pacific Northwest National Laboratory. The Influence of Occupancy on Building Energy use Intensity and the Utility of an Occupancy-Adjusted Performance Metric; Pacific Northwest National Laboratory: Richland, WA, USA, 2017. [Google Scholar]
  67. Shafiee, E.; Faizi, M.; Yazdanfar, S.; Khanmohammadi, M. Assessment of the effect of living wall systems on the improvement of the urban heat island phenomenon. Build. Environ. 2020, 181, 106923. [Google Scholar] [CrossRef]
Figure 1. The last floor of the building, selected for the study. (a) Rooms location on the plan from the model view; (b) indoor temperature sensor type and location in the rooms.
Buildings 10 00250 g001
Figure 2. Interior and exterior photos for the case study. (a) Typology of patient rooms; (b) hospital building for the study.
Buildings 10 00250 g002
Figure 3. Monitored outdoor/indoor room temperature data and global solar radiation data for June 2018.
Buildings 10 00250 g003
Figure 4. Monitored data collected for rooms during the selected week, June 22nd to 28th.
Buildings 10 00250 g004
Figure 5. Monitored outdoor/indoor room temperature data and global solar radiation data for July 2018.
Buildings 10 00250 g005
Figure 6. Monitored data collected for rooms during the selected week, July 25th to 31st.
Buildings 10 00250 g006
Figure 7. Interior and exterior temperature data and global solar radiation data for August 2018.
Buildings 10 00250 g007
Figure 8. Monitored data collected for rooms during the selected week, August 1st to 7th.
Buildings 10 00250 g008
Figure 9. Internal heat balance of the rooms and outside dry-bulb temperature on July 15th. Peak load from solar gains1 and peak load from cooling demand2 in rooms analysed.
Buildings 10 00250 g009
Figure 10. Average heat gains and cooling demand per room.
Buildings 10 00250 g010
Table 1. List of parameters for the simulation of the building model. * Data provided by the Integrated Information Department of the hospital.
Inputs Newborn Patient Rooms A, B, C
Setpoint temperatureCooling 26 °C/Heating 24 °C
RH%Humidification 40%/Dehumidification 60%
ACPH 2.7
Workday profile (h)0:00–24:00 Mon–Sun
Occupancy density (p/m2) 0.10
Occupancy schedule (h) 9:00–21:00, 80% Occup. Rate
22:00–8:00, 50% Occup. Rate
Occupancy heat gain (W/M2)Sens. 63 Lat. 52
Lighting heat gain (W/m2)7
Illuminance (lx) 500
Table 2. Construction solution of the opaque envelope.
ElementConstruction SystemU Factor W/(m2)K
E1.
Façade wall
Buildings 10 00250 i0010.42
E2. Flat roof Buildings 10 00250 i0020.52
E3. Floor Buildings 10 00250 i0030.47
E4.
Ground floor
Buildings 10 00250 i0040.52
Table 3. Bulging window-wall ratio.
Wall/Window AreaTotalNorthEastSouthWestRooms (A B C)/East
Wall (m2)16,446.063869.3344,222.783775.44378.5513
Window opening (m2)4500.171266.51070.31031.961131.413.25
Window-Wall Ratio (%)273324272625
Table 4. Rooms values of internal heat loads for July 15th.
Heat SourceRoom A (kWh/Day) Room B (kWh/Day)Room C (kWh/Day)
Walls 5.246.126.23
Glazing 4.325.685.88
Solar gains1.432.112.19
Roof2.412.522.58
Partitions1.161.341.35
Floor1.561.901.97
Light5.215.215.21
Occupancy4.474.474.47
Cooling demand21.1123.9624.55
Publisher’s Note: MDPI stays neutral with regard to jurisdictional claims in published maps and institutional affiliations.

