1. Introduction
The European Union and the whole world are now facing climate change caused by the emissions of greenhouse gases [
1]. According to the action plan developed by the United Nations, “Agenda 21”, in regards to sustainable development, environmentally friendly technologies are considered those that protect and reduce the adverse environmental impact throughout the material life cycle—from the extraction of raw materials and ending with the product/material further use or recycling. The building sector is responsible for approximately two-thirds of halocarbon [
2,
3]. Renewable raw materials, including natural fiber sources, are seen as possible carbon storage resources in the future with a variety of positive effects on both the planet ecosystem and the living environment, and the energy consumption of delivering the required functionality [
4,
5,
6]. In addition to the traditional methods of hemp stalk separation into fibers and shives, the utilization of the whole plant material has become relevant in the past several years [
7,
8]. Studies have been carried out to analyze different natural resources usability in board materials [
9,
10,
11]. One of the very important targets is to achieve good characteristics for thermal specific heat capacity where, to reach high utility, they use innovative technologies—such as Nano-encapsulated phase-change materials (PCMs) [
12,
13,
14,
15]. Phase change materials are recognized as an effective way to improve a building’s energy management and increase thermal mass. This can enhance the building’s thermal mass, thus leading to energy efficiency [
16,
17,
18,
19,
20]. The PCM can be incorporated in lightweight materials and construction materials [
21,
22,
23,
24,
25,
26,
27,
28].
2. Materials and Methods
2.1. Materials
To produce wallboard material, three different components have been chosen due to the following criteria: functional concordance, impact on the environment (extraction, manufacturing, use), and local availability.
Hemp (Cannabis sativa L.) was grown at the experimental plot of Agriculture Science Center of Latgale (ASCL, 56°33′03.5″ N 26°55′17.8″ E) in 2017. The Polish variety Bialobrzeskie (owner: Institute of Natural Fibres & Medicinal Plants, Poznan) has been chosen for the experimental part. The industrial hemp variety Bialobrzeskie is a very promising plant that enables the production of high yields of hemp stems in the Latvian soil and climatic conditions, and it is also a regenerating plant for the soil. For raw material preparation, traditional preparation technology was used. Among other European locations, they have been cultivated under agricultural conditions as well in Vilani, Latvia (56°33′09″ N 26°55′29″ E). The harvest and material preparation was carried out in August 2017. One must follow the procedures of harvesting, retting, baling, pre-cutting, decorticating, and cleaning to get shives from hemp (
Figure 1).
The phase change material microcapsule (PCMs) MikroCaps Ltd. (Ljubljana, Slovenia) products have been selected and incorporated directly into the insulation wallboard material prototypes. According to the datasheet of MikroCaps Ltd., PCM-S50 has a melting temperature of 23–28 °C, latent heat of 160–180 J/g, pH 6.0–9.0, density 900–970 g/L, viscosity (at 25 °C) 100–1.000 cPs, the appearance of white aqueous dispersion of formaldehyde-free slurry, average microcapsules particles size 1–15 μm, polyurethane (formaldehyde-free) as a type of membrane, and a Biobased type of PCM.
Commercial Urea Formaldehyde Resins (UF) Kleiberit 862.0 (Intarsija Ltd., Riga, Latvia) with hardener for cold pressing were used as adhesives for the manufacturing of board prototypes. The adhesive is selected based on its physical and chemical properties. An additional important factor is that it can be used in cold and hot pressing. As the PCM material was in the water emulsion slurry, the choice of a water-soluble binder was important. The binder is supplied in the form of a white powder and is mixed with water (18–20 °C) in a ratio of 2:1. Its preparation ratio is determined by the technical datasheet, where part of the required water is from PCMs material and the rest of the required amount is added additionally. Pressing time at 20 °C is 270 min, hemp shive material moisture content should be in the range of 8–10%, application time is 150 min, and binder volume in the board is 10%. UF adhesives are a larger class of amino resins and are the most widely used binder for indoor fiber boards [
29].
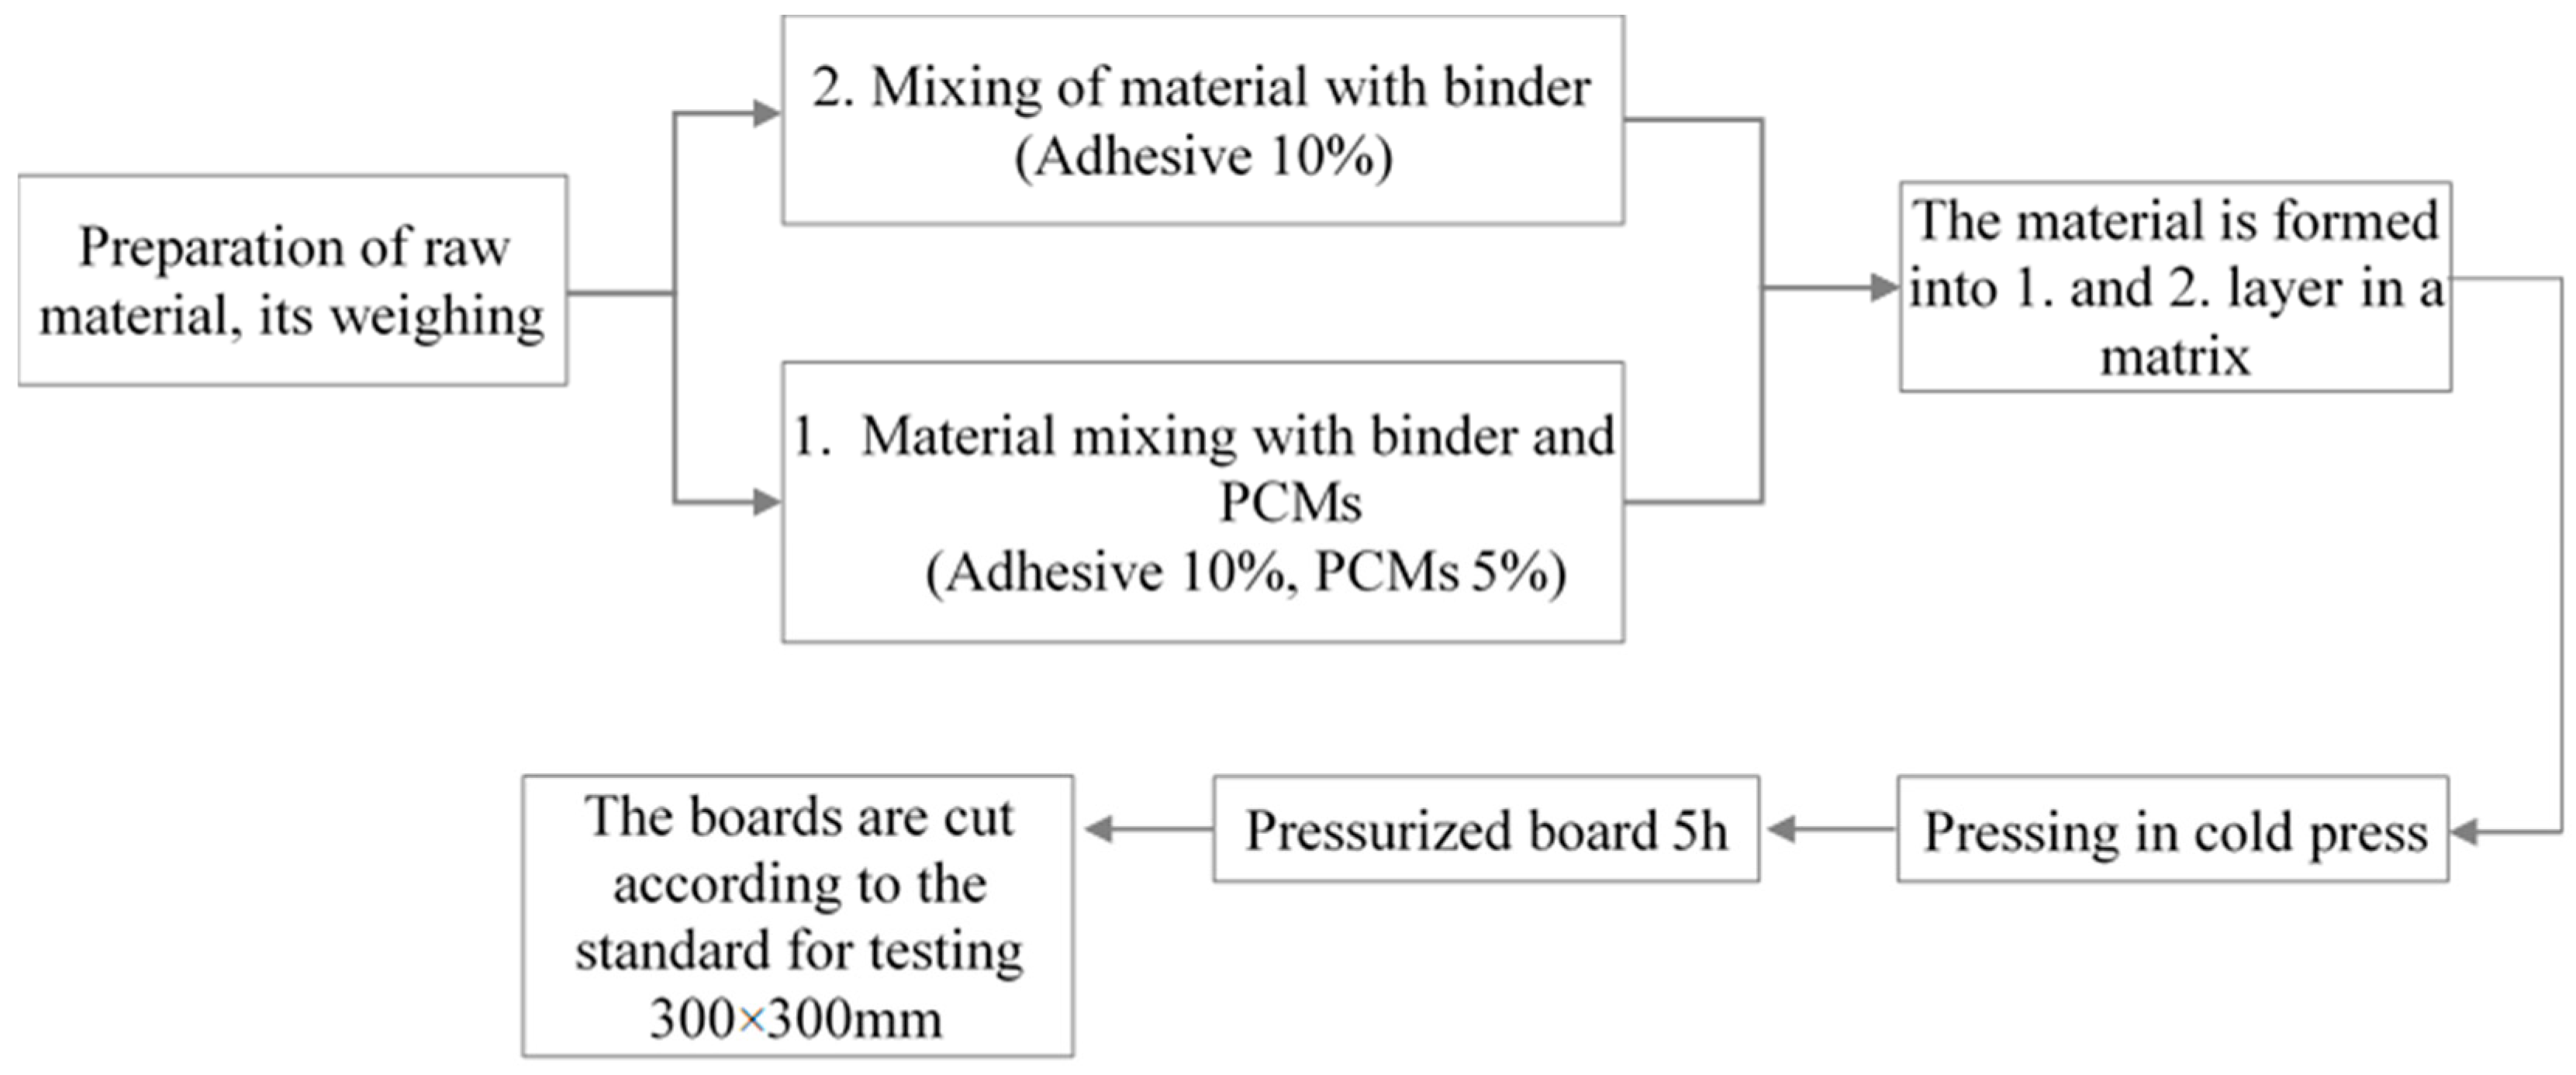
2.2. Cold Pressing Technology
Board samples are manufactured using cold pressing (template and punch) 400 mm × 400 mm. These linear dimensions are selected considering the planned test methods and the necessary samples configurations for the tests. The prototypes of the material are made based on layers. Resin powder with hardener and water are dosed at the ratio of 2:1 according to the technical datasheet of the producer. Dosing cups are used to determine the binder amount. When the required homogenous mixture of the binder is obtained the Phase Change Material microcapsule, concentrated dispersion is added in the amount of 5% of the material dry weight. The stirring of the components is being done for 300 s to obtain a homogenous consistency. The binder is added gradually using a spray gun for shives to obtain a homogenous mixture, and at the same time, stirring is performed with an electric mixer over a period of 300 s. Hemp shives and binder mixture are formed by hand in the 400 × 400 mm template. This is done in two steps: during the first step, a part of the mixture is pressed to the thickness of 50 mm, and during the second step, the second part of the mixture is pressed, and the material is compressed to the required thickness of 25 mm. The template and punch form are immersed in a hydraulic press and pressed for 270 min at 20 ± 2 °C under 10 bar pressure taking into consideration the polymerization time of the Urea Formaldehyde Resin (
Figure 2).
2.3. Distribution of Particle Masses
All products are characterized by a particle size distribution after the sieving process. With this method, it is possible to display and compare the size distribution of the components. The sieving test was determined according to the standard of LVS EN 933:2012 [
30]. It is the simplest and most widely used particle size analysis method [
31]. Samples taken from the storage point immediately after drying are placed in a climatic chamber until the test. Before sifting, each sample is divided into five small sub-samples of mass not exceeding 6 g. Partitioning is necessary to ensure a proper representative of the original raw material in the sample. Sifting was performed in a sieve test apparatus with six different round shapes, mesh sizes of 2 mm, 1 mm, 500 µm, 355 µm, 160 µm, and 90 µm, made of stainless steel or brass wire mesh. The sieves are arranged in ascending order, sieving material with the largest mesh size placed on the highest sieve. The sieving was performed using an interrupted cycle with a vibration time of 58 s and an interruption of 2 s, and the total sieving cycle of each sample lasts 9 min at a vibration intensity of 80 W/m
2. After the sieving process, sieves are taken from the machine one by one, each sieve is poured into a metal container, the material residues are cleaned from the sieve with a 25 mm wide brush, and the particles of the respective sieve are weighed. The results are expressed as a percentage of the mesh size of each sieve.
2.4. Determination of Board Moisture
Based on the moisture determination standard LVS EN 322 [
32], the water moisture content in board materials was determined using the mass method. Board samples were prepared using 250 g hemp shives and a 10% UF binder. Immediately after pressing, the samples were weighed and kept under laboratory conditions for 14 days, observing the change in weight, weighed on a “Kern” digital balance EMB 600-2 (KERN & SOHN GmbH, Balingen-Frommern, Germany; accuracy 0.01 g) at the same time each day. During the experiment, the laboratory conditions were recorded using the temperature and humidity data recording device Testo 184H1 (Testo SE & Co. KGaA, Titisee-Neustadt, Germany), obtaining an average room temperature of 22.7 °C and average humidity of 56.5%. After a period of 14 days, the masses of the samples are fixed by weighing and are placed in an oven at 105 ± 2 °C for 24 h. After a specified time, they are reweighed, and the change in humidity after the change in mass of the samples is calculated using Equation (1) and the humidity change is compared for the two samples.
mH—mass of content specimen at normal climate, g.
m0—mass of specimen after drying, g.
In parallel, by setting the optimal amount of binder, the amount of moisture in the board is determined depending on the amount of binder used. This experiment was performed to find out how quickly the mass becomes uniformly stable for further sample testing. Six groups of plates with different binder volumes ranging from 4% to 14% were made to analyze the moisture of the samples. After pressing the samples, the initial mass was found. To determine the change in mass of the respective samples, the samples were weighed after 120 h.
2.5. Density
The density of board materials is determined according to the standard LVS EN 323:2000 [
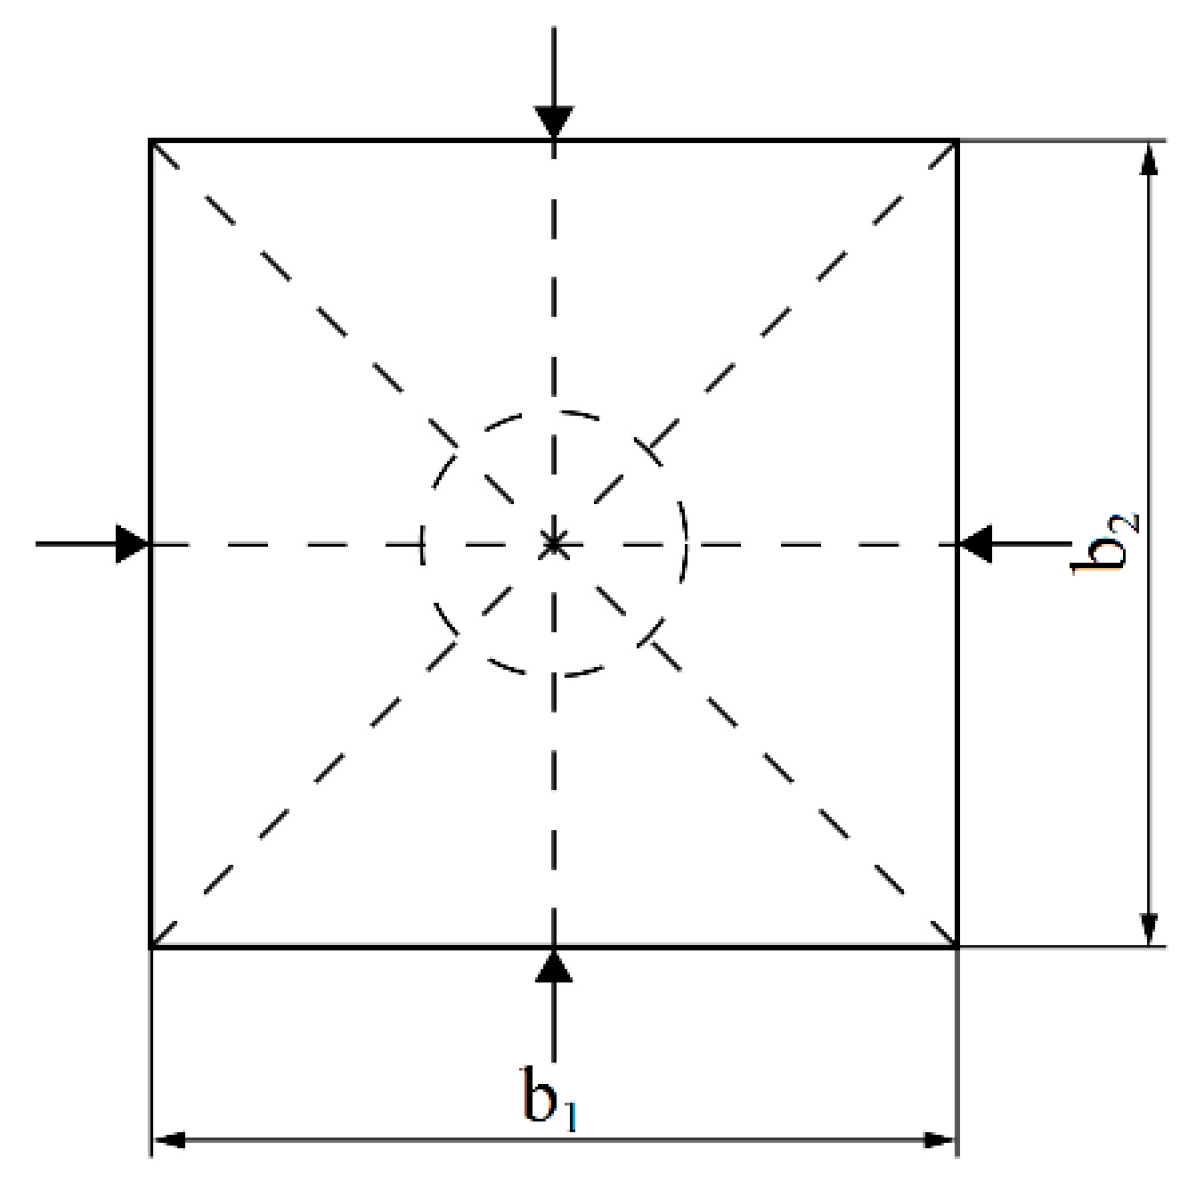
33]. According to the standard, samples 50 × 50 mm were cut from the pressed board and weighed on the scales “Kern” EMB 600-2. The external dimensions and thickness of the sample are measured with a digital caliper KS Tools 300.0532 (KS TOOLS Werkzeuge-Maschinen GmbH, Heusenstamm, Germany) with an accuracy of 0.01 mm. To determine the thickness of the samples more accurately, measurements are made in four places (
Figure 3) and the average slab thickness is calculated. Based on the obtained measurement results, the board density can be calculated by the Equation (2) with accuracy up to 1% correlation:
—board density at standard humidity, kg/m
3.
mw—mass of the test specimen, g.
aw,
bw—length and width of the test specimen, mm.
lw—thickness of the test specimen, mm
. vw—volume, m
3.
2.6. Thermal Conductivity and Specific Heat Capacity
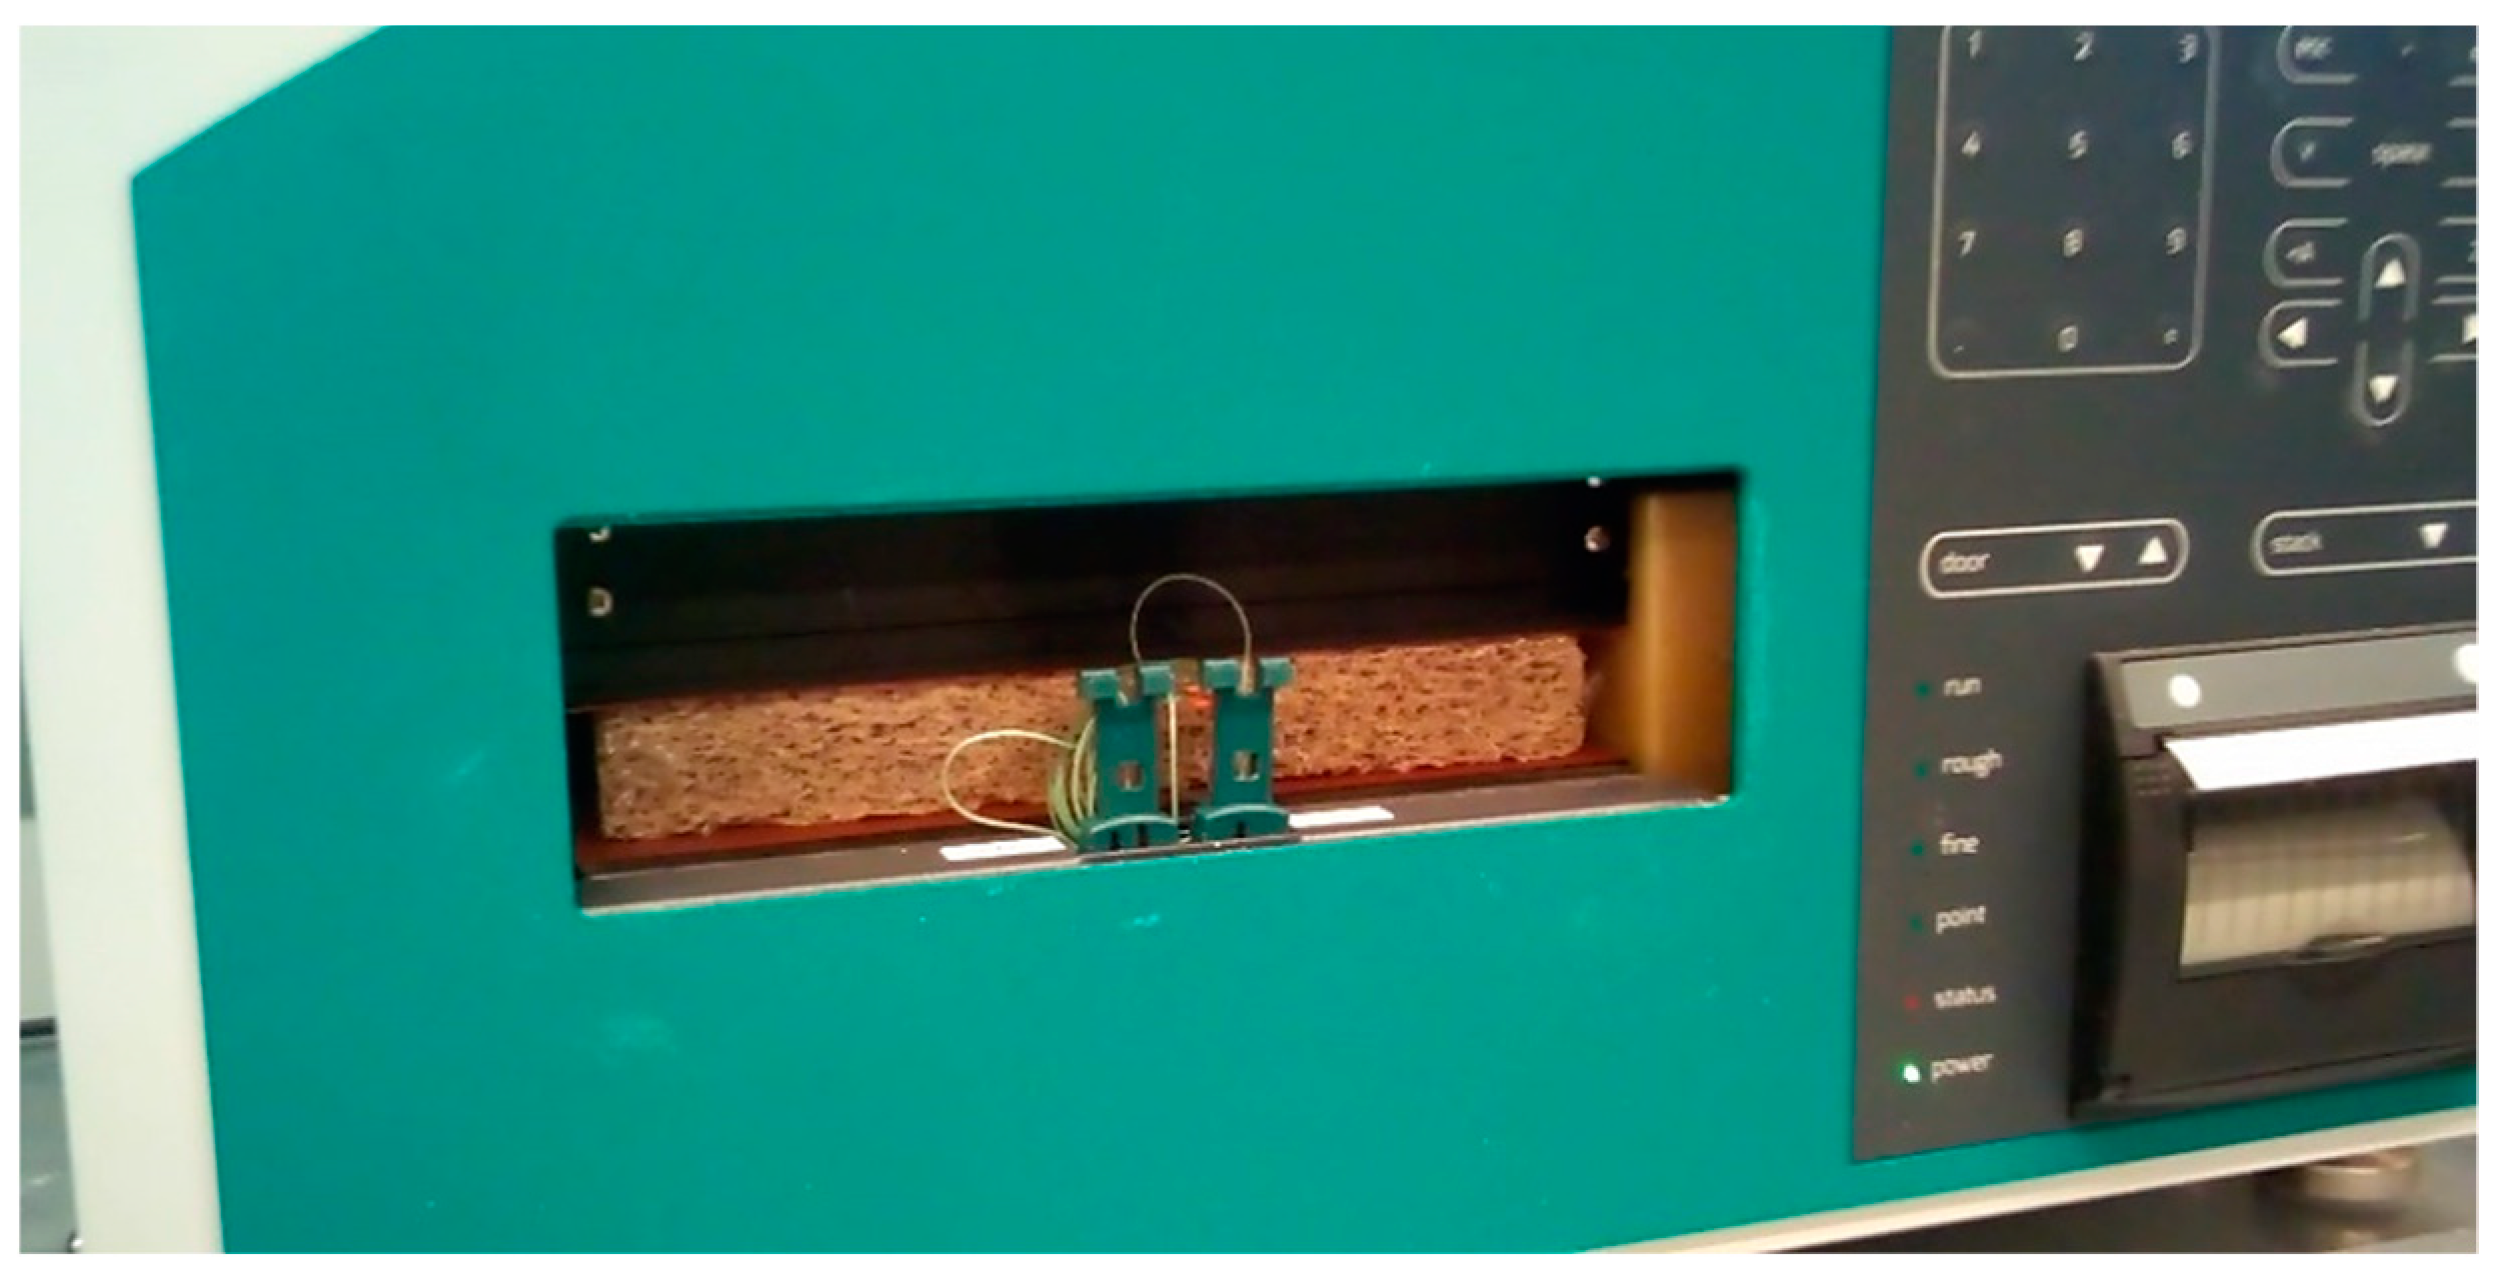
The most important property describing the efficiency of insulation materials is thermal conductivity λ (W/(m·K)). One of the most accurate and widely used approaches for the measurement of thermal transmission parameters in steady-state conditions is the use of the heat flow meter apparatus (HFMA) [
34,
35]. The Netzsch HFM 446 Lambda Small device (NETZSCH Holding, Selb, Deutschland) was used to determine thermal conductivity (
Figure 4).
The measurement principle is relatively simple: the test specimen is placed between two plates controlled to a user-defined mean sample temperature and temperature difference Δ
T (K). The heat flow
Q (W) flowing through the specimen with thickness
L (m) and surface area
A (m
2) is measured by two calibrated heat flux transducers on both sides of the specimen. After reaching thermal equilibrium, the test is done. For the calculation of thermal conductivity
λ, Equation (3) is used:
Dependence of thermal conductivity on mean temperature can be estimated by conducting the measurements with different surface temperatures [
36].
Besides measurement of the thermal conductivity, the hardware and software of the used device allow for non-direct measurement and determination of the specific heat capacity cp (J/(kg·K)) by using the dynamics heat flow meter method (DHFMA). The differential scanning calorimetry (DSC) method, which is a common method for PCM, is valid only for small and homogenous specimens and is not applicable to building-scale products with different additives.
The principle used in DHFMA measurements is a rapid temperature ramp [
37,
38] with the following analysis of dynamic thermal information generated by a heat flow meter instrument. During the phase transition process, the change in enthalpy Δ
H is equal to absorbed heat Δ
Q. The heat capacity
cp is defined as the temperature derivative of the enthalpy
H. Assuming a linear relationship between enthalpy and temperature, heat capacity can be expressed as:
During the measurement process, the temperature of a PCM-containing sample is increased by a step of 10 °C, and the resulting heat flow in the specimen is measured, determining the heat capacity the mean temperature using Equation (4). At first, the upper and lower heating/cooling HFMA plates are held at the initial temperature, imposing a uniform temperature across the specimen. Then a step temperature change is introduced on both plates, and heat flows through the plates are measured until equilibrium at the next temperature is reached. Change in enthalpy (or absorbed heat Δ
Q) is calculated by integrating the heat flow rate measurements over time [
38].
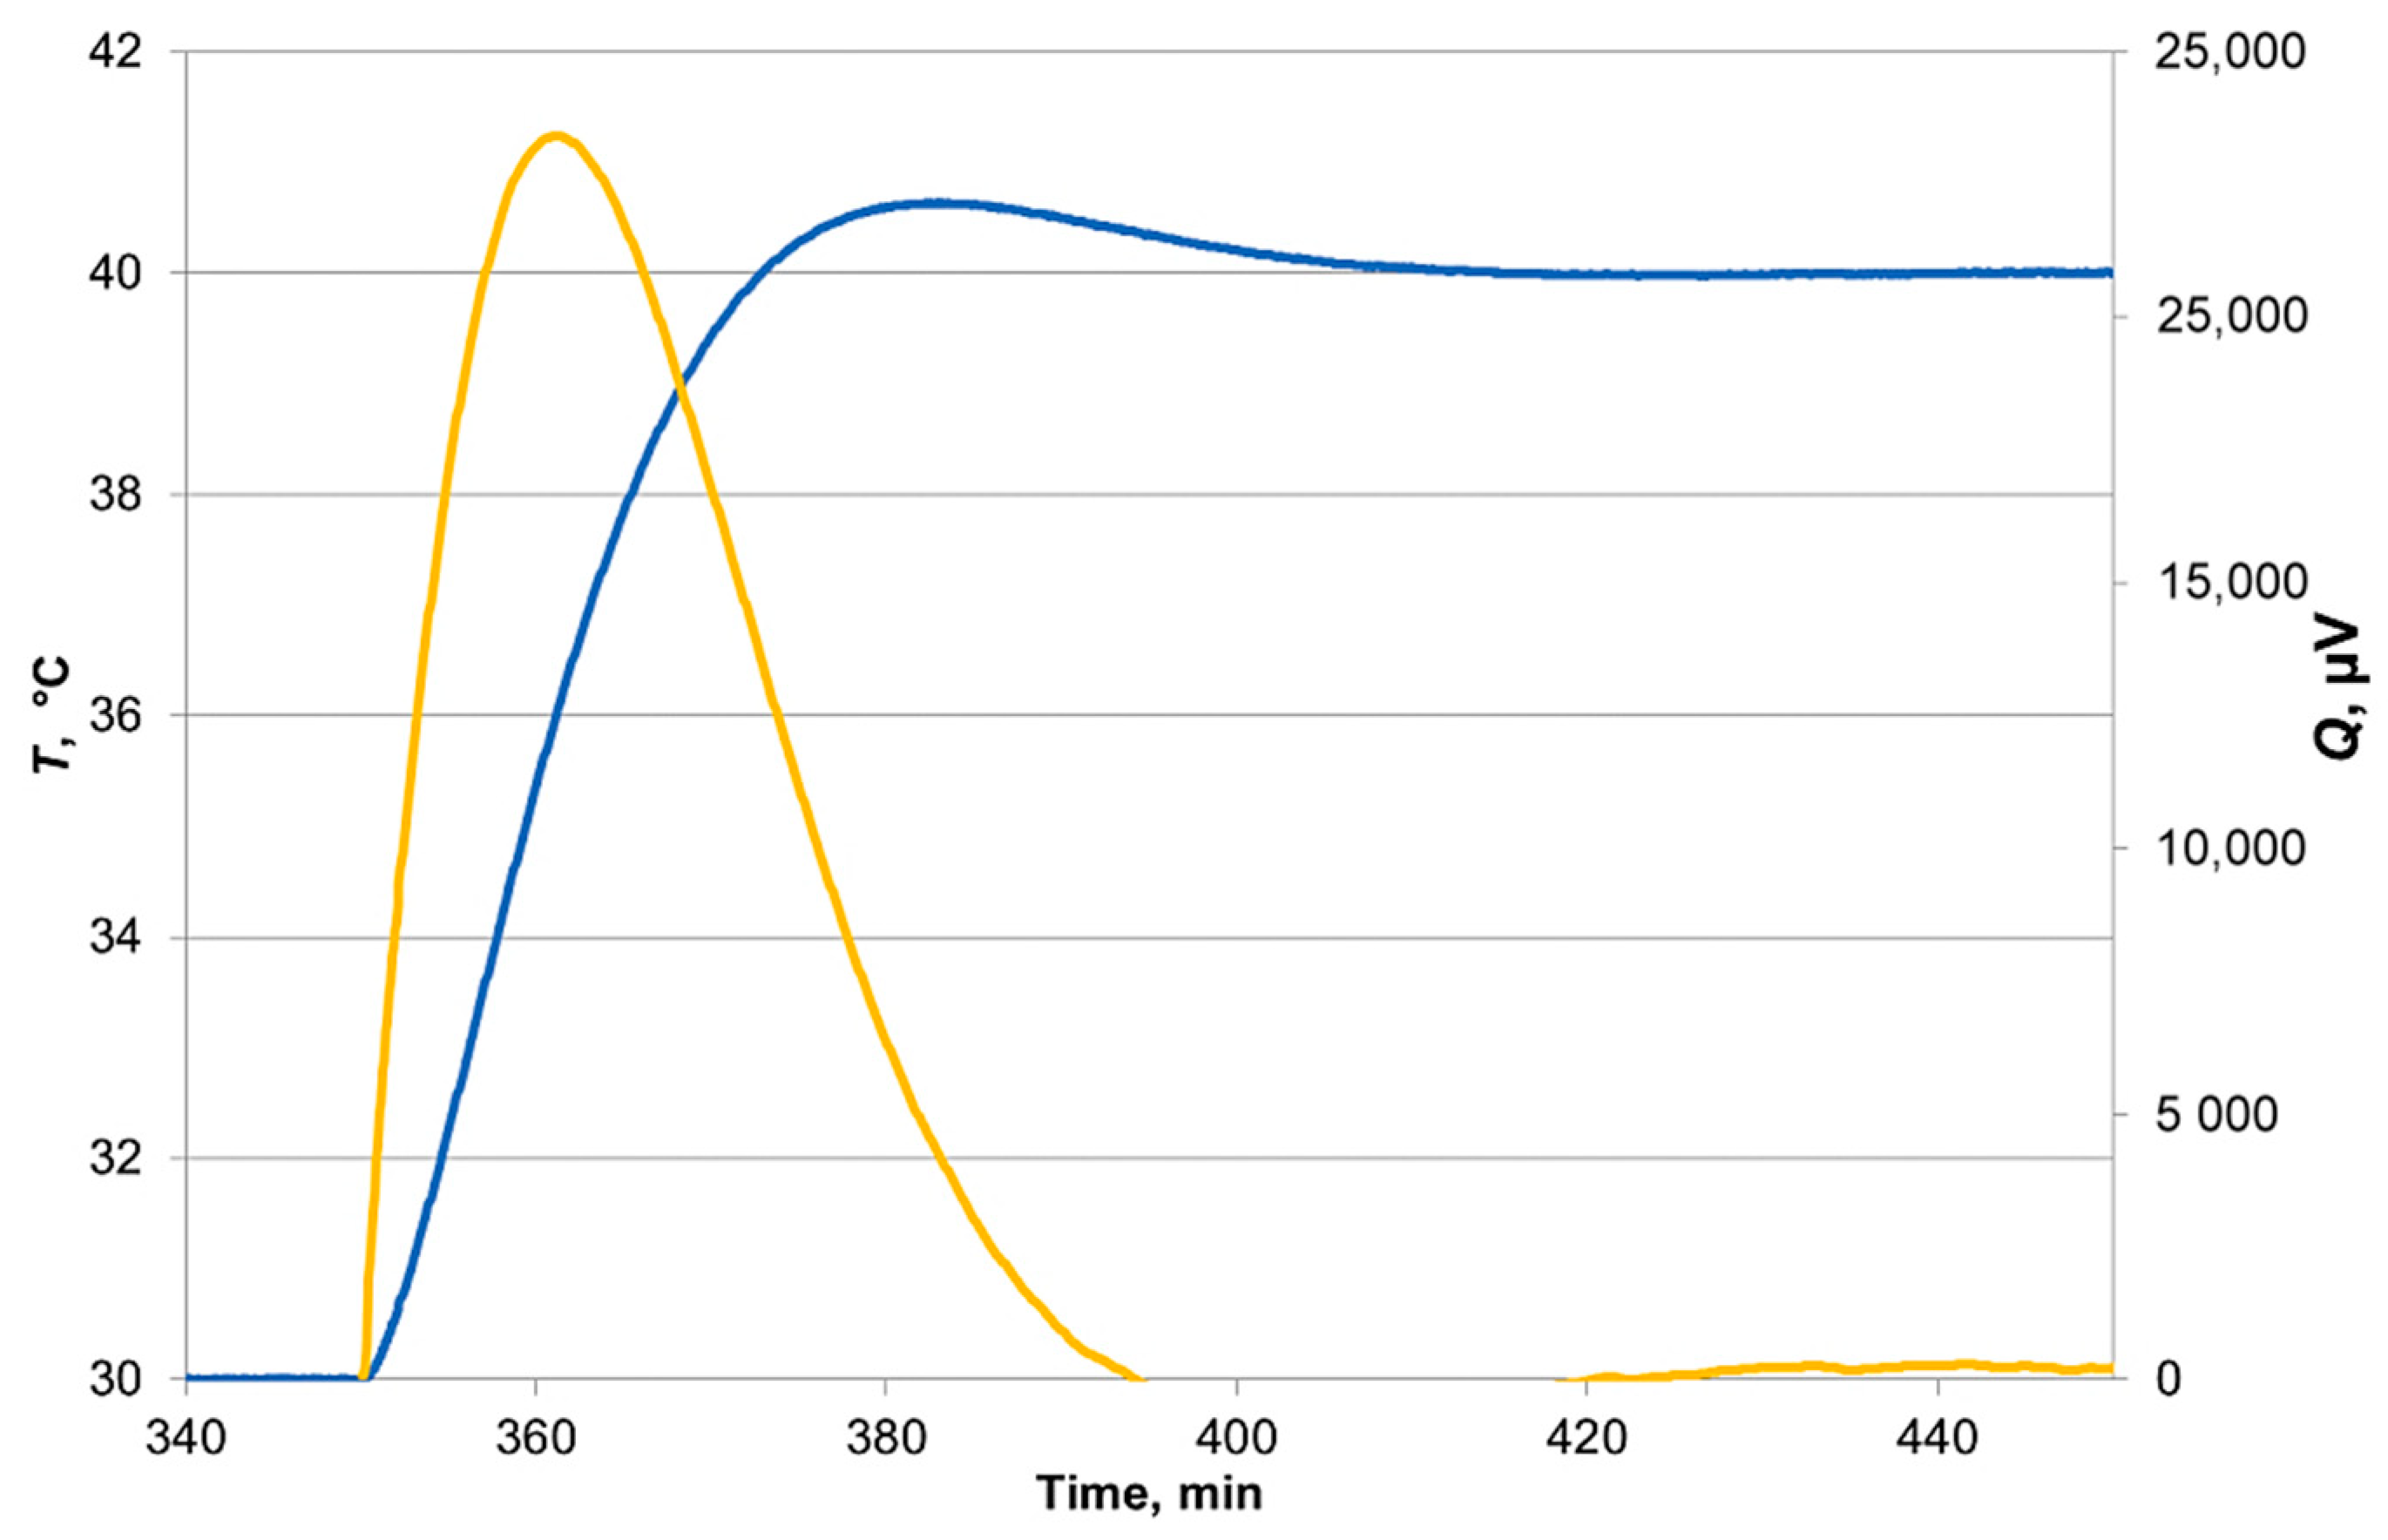
An example of determining the
cp using a temperature ramp approach is shown in
Figure 5. The yellow curve represents the heat flow meter output versus time for a heating step between 30 °C and 40 °C (blue line). Based on the integrated
Q peak, specific heat capacity can be determined at a mean temperature of 35 °C for the chamber and inserted sample. The registered electric signal in subtracting the amount of absorbed energy for the heating of the empty chamber
QE (which was obtained previously during calibration) gives the
cp value for the analyzed sample:
where 𝑁
λ is heat flux sensor calibration factor, and
A—area of the specimen with mass
m.
Like thermal conductivity measurements, specific heat capacity can also be determined for different mean temperatures (see next chapter).
2.7. Latent Heat
For the PCM, the most important thermophysical property is latent heat or phase transitions heat, which quantitatively describes the ability to accumulate or release energy amounts during the phase change process. Adding heat to a sample changes it from solid into a liquid, but having heat release a sample can result in the phase changing in the opposite direction. During a phase change, energy is added or subtracted from a system, but the temperature during this process does not change. The temperature will change only when the phase change has completely finished. The temperature at which the phase transitions occur is called the melting point and this temperature is the same as the temperature of freezing. The heat
Q (W) required to change the phase of a sample of mass
m (kg) is given by:
where
mL is the latent heat (J/kg) of fusion (amount of heat needed to cause a phase change between solid and liquid) or vaporization (in case of phase change between liquid and gas).
Use of the DSC method is absolutely necessary for comprehensive analysis of the melting process, precisely determining the temperature at which PCM starts melting and at which the melting process is finished, thus obtaining the heat of phase change as the function of temperature, as well as investigation of possible hysteresis effects. A detailed analysis of PCM latent heat properties was not within the scope of this research; therefore, the DSC method was not used, but an approximated approach described below was applied to determine latent heat approximately as an integral value in the large temperature range for the complete phase change process.
An approximate but fast and easy calculation of latent heat
L can be done by analyzing the heat flow from measurements of
cp (see previous chapter) for a specimen with PCM admixture by performing measurements at temperatures that are lower and higher than the melting point (where there is no phase change expected), as well as around the melting point. An approximate value of the phase change heat for a specimen with added PCM can be estimated as an increase in heat flow Δ
Q in temperature range that includes phase change, compared with linear regression (
Figure 6).
For the PCMs, when using them in combination with building materials, it is important that their melting temperature must be compatible with the room’s operating temperature, normally between 22 and 28 °C. In the experiments carried out, heating up was provided in three ranges: between 10 °C and 20 °C, between 20 °C and 30 °C (this range includes phase change), and between 30 °C and 40 °C. As it is seen from
Figure 6, the energy amount needed for sample heating from 20 °C to 30 °C is higher than for linear interpolation, meaning that it includes also phase transitions heat. If the mass of added PCM as well as time and temperature difference is known, it is possible to calculate the latent heat using Equation (6).
3. Results and Discussion
3.1. Distribution of Particle Masses
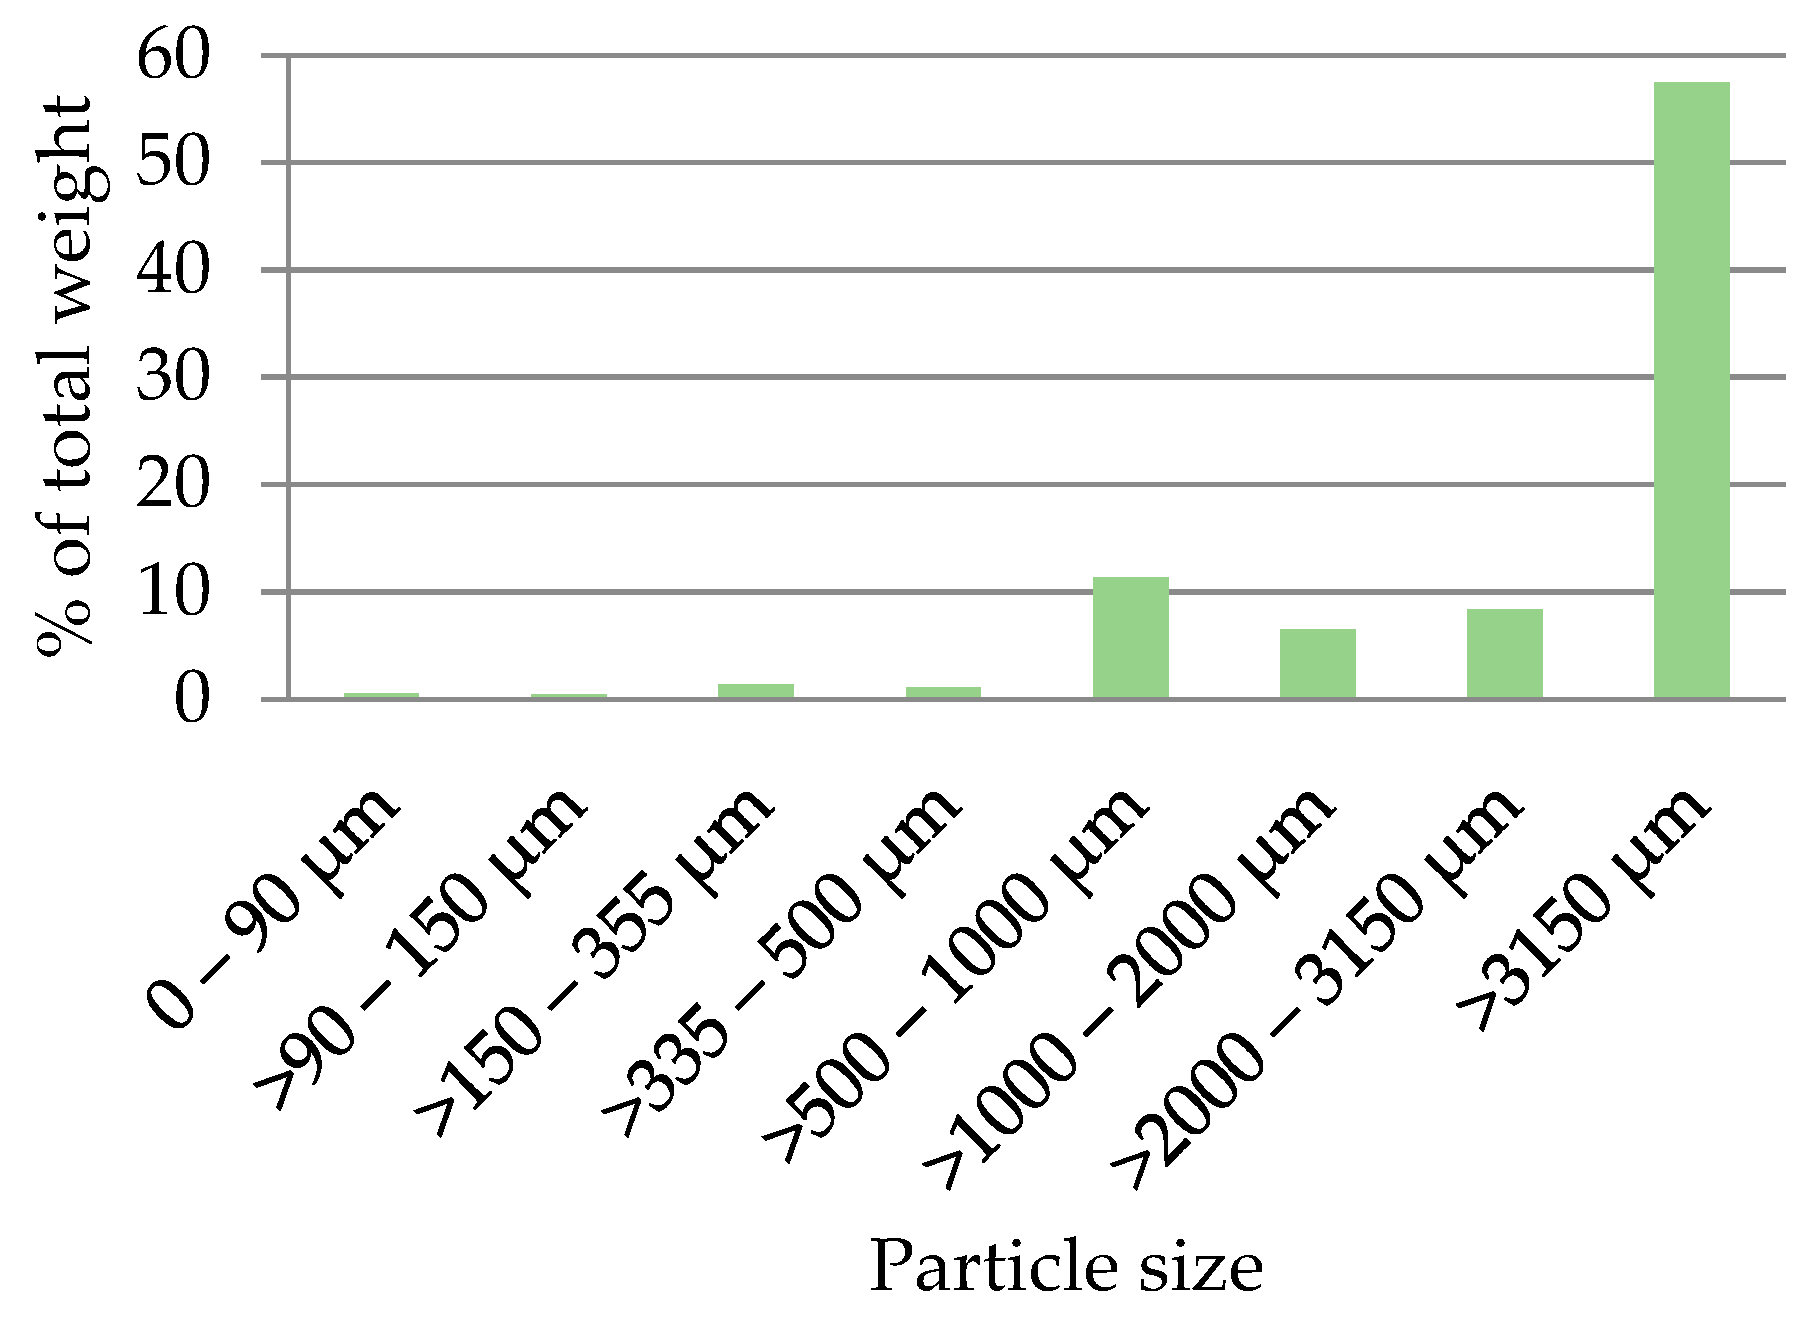
The seven sieves used for sieving enabled the determination of the particle mass distribution according to the dimensions of the sieve’s mesh (
Figure 7). The largest proportion is the fraction exceeding 3150 μm—57 % of the total amount (
Figure 8a). A significant proportion is measured also in sizes 500 μm to 1000 μm—12% of the total. The smallest amounts were determined for fractions with sizes less than 500 μm, and those less than 150 μm are just 3.5% of the total (
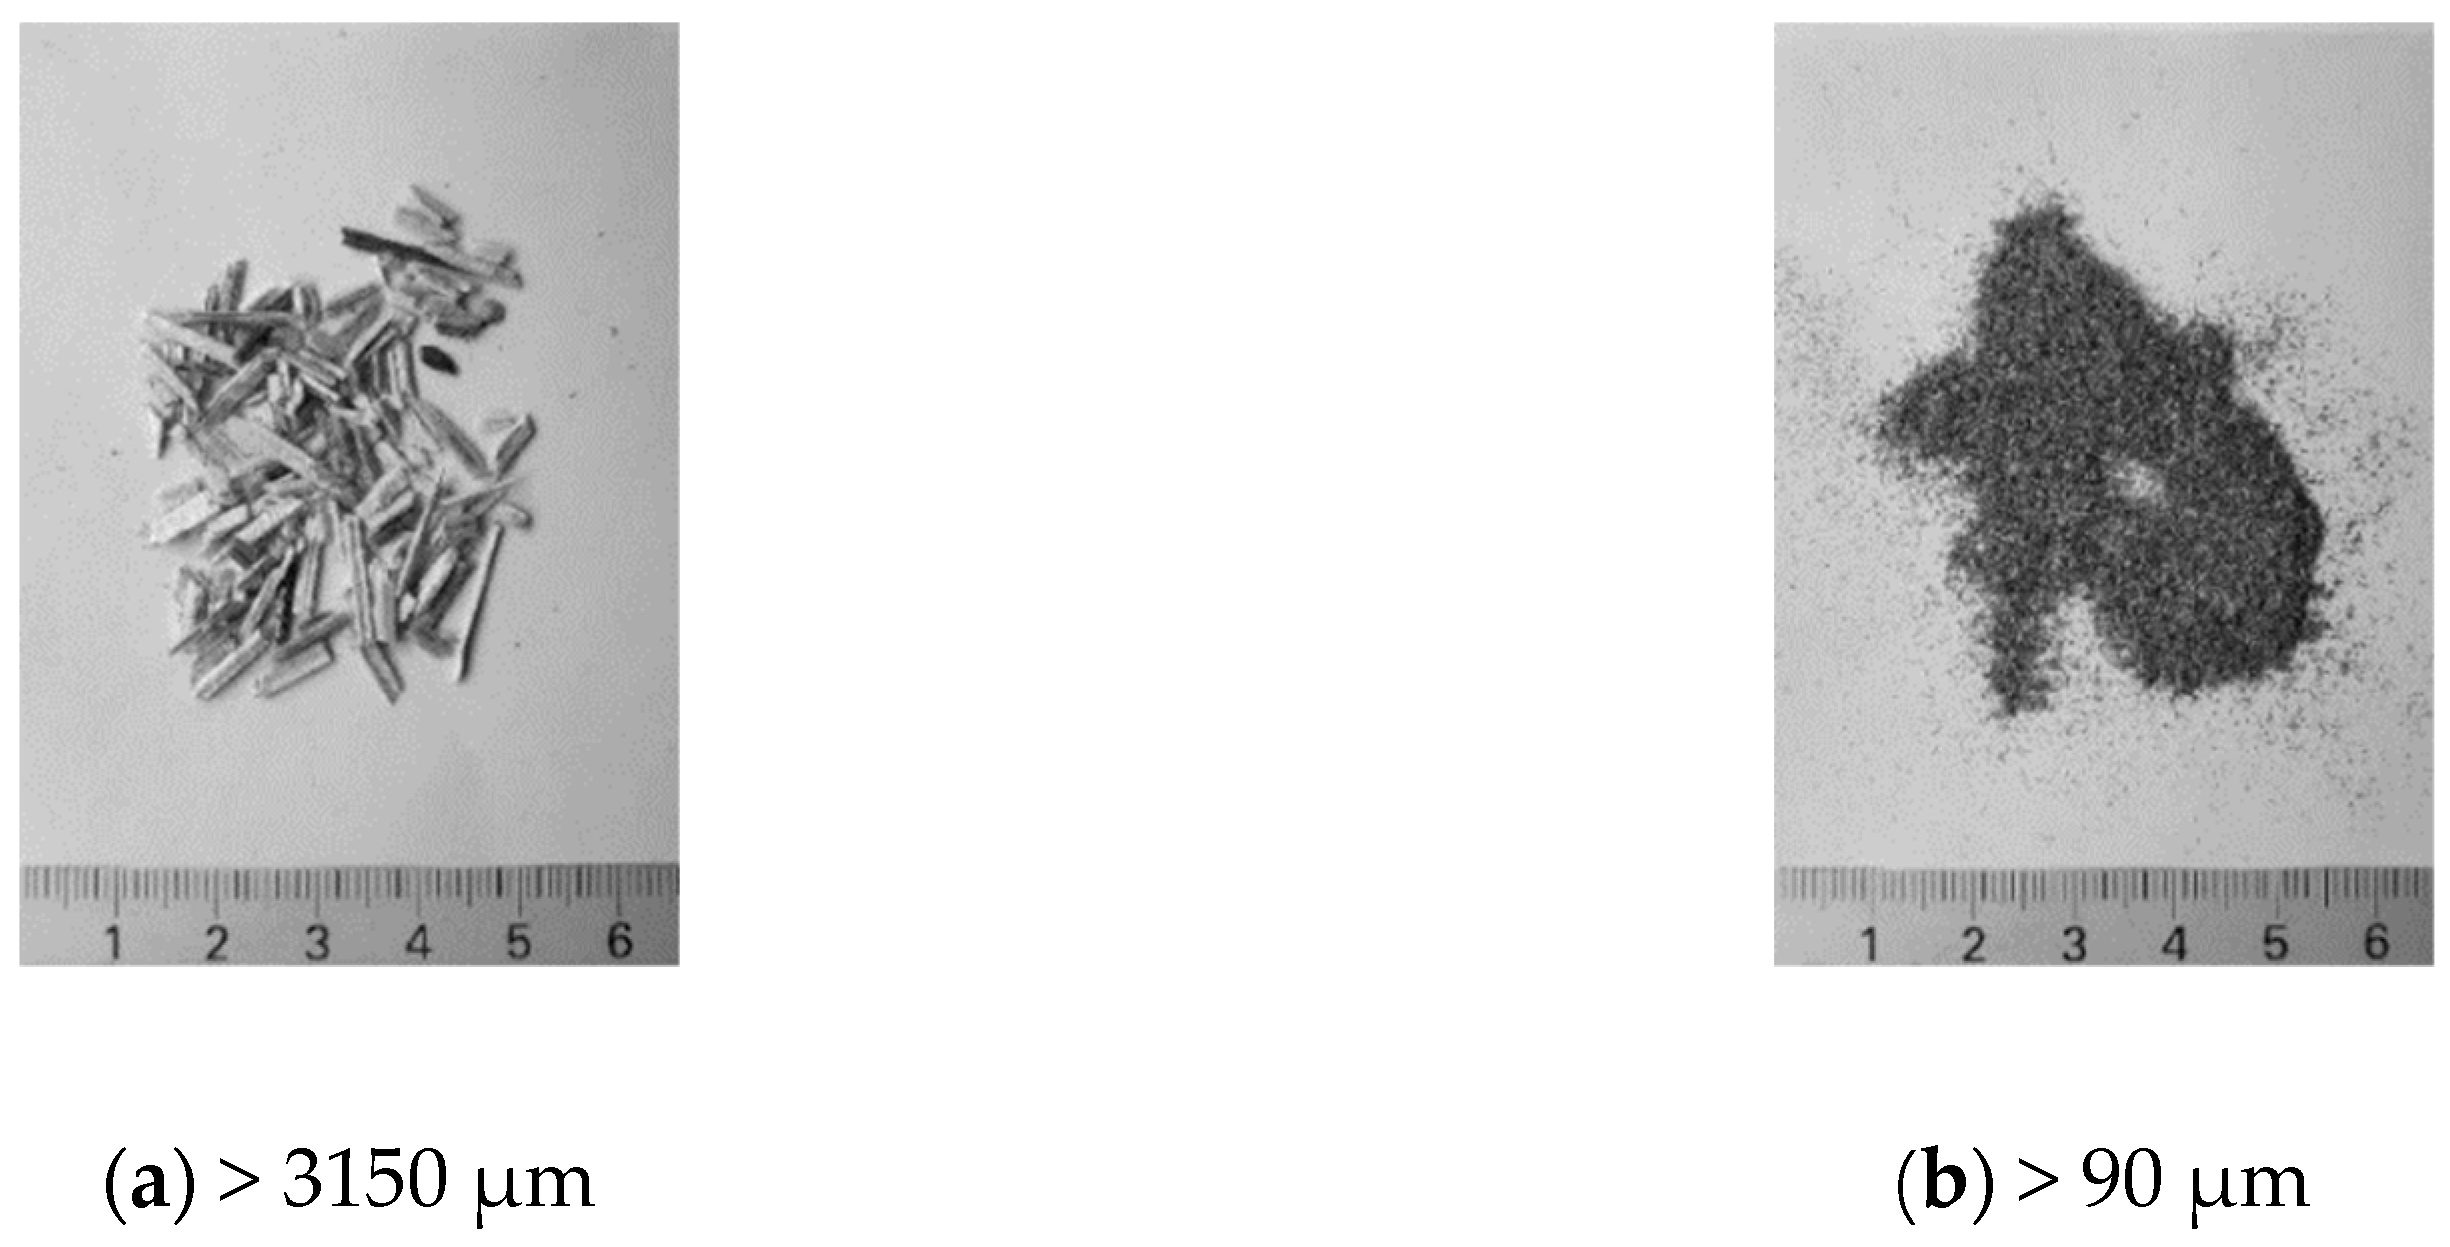
Figure 8b). From the visual observation, it can be concluded that particles in a fraction above 3150 μm are uneven by their structure and size. There is a tendency for the particles to agglomerate when removing them from the sieve.
3.2. Determination of Board Mass
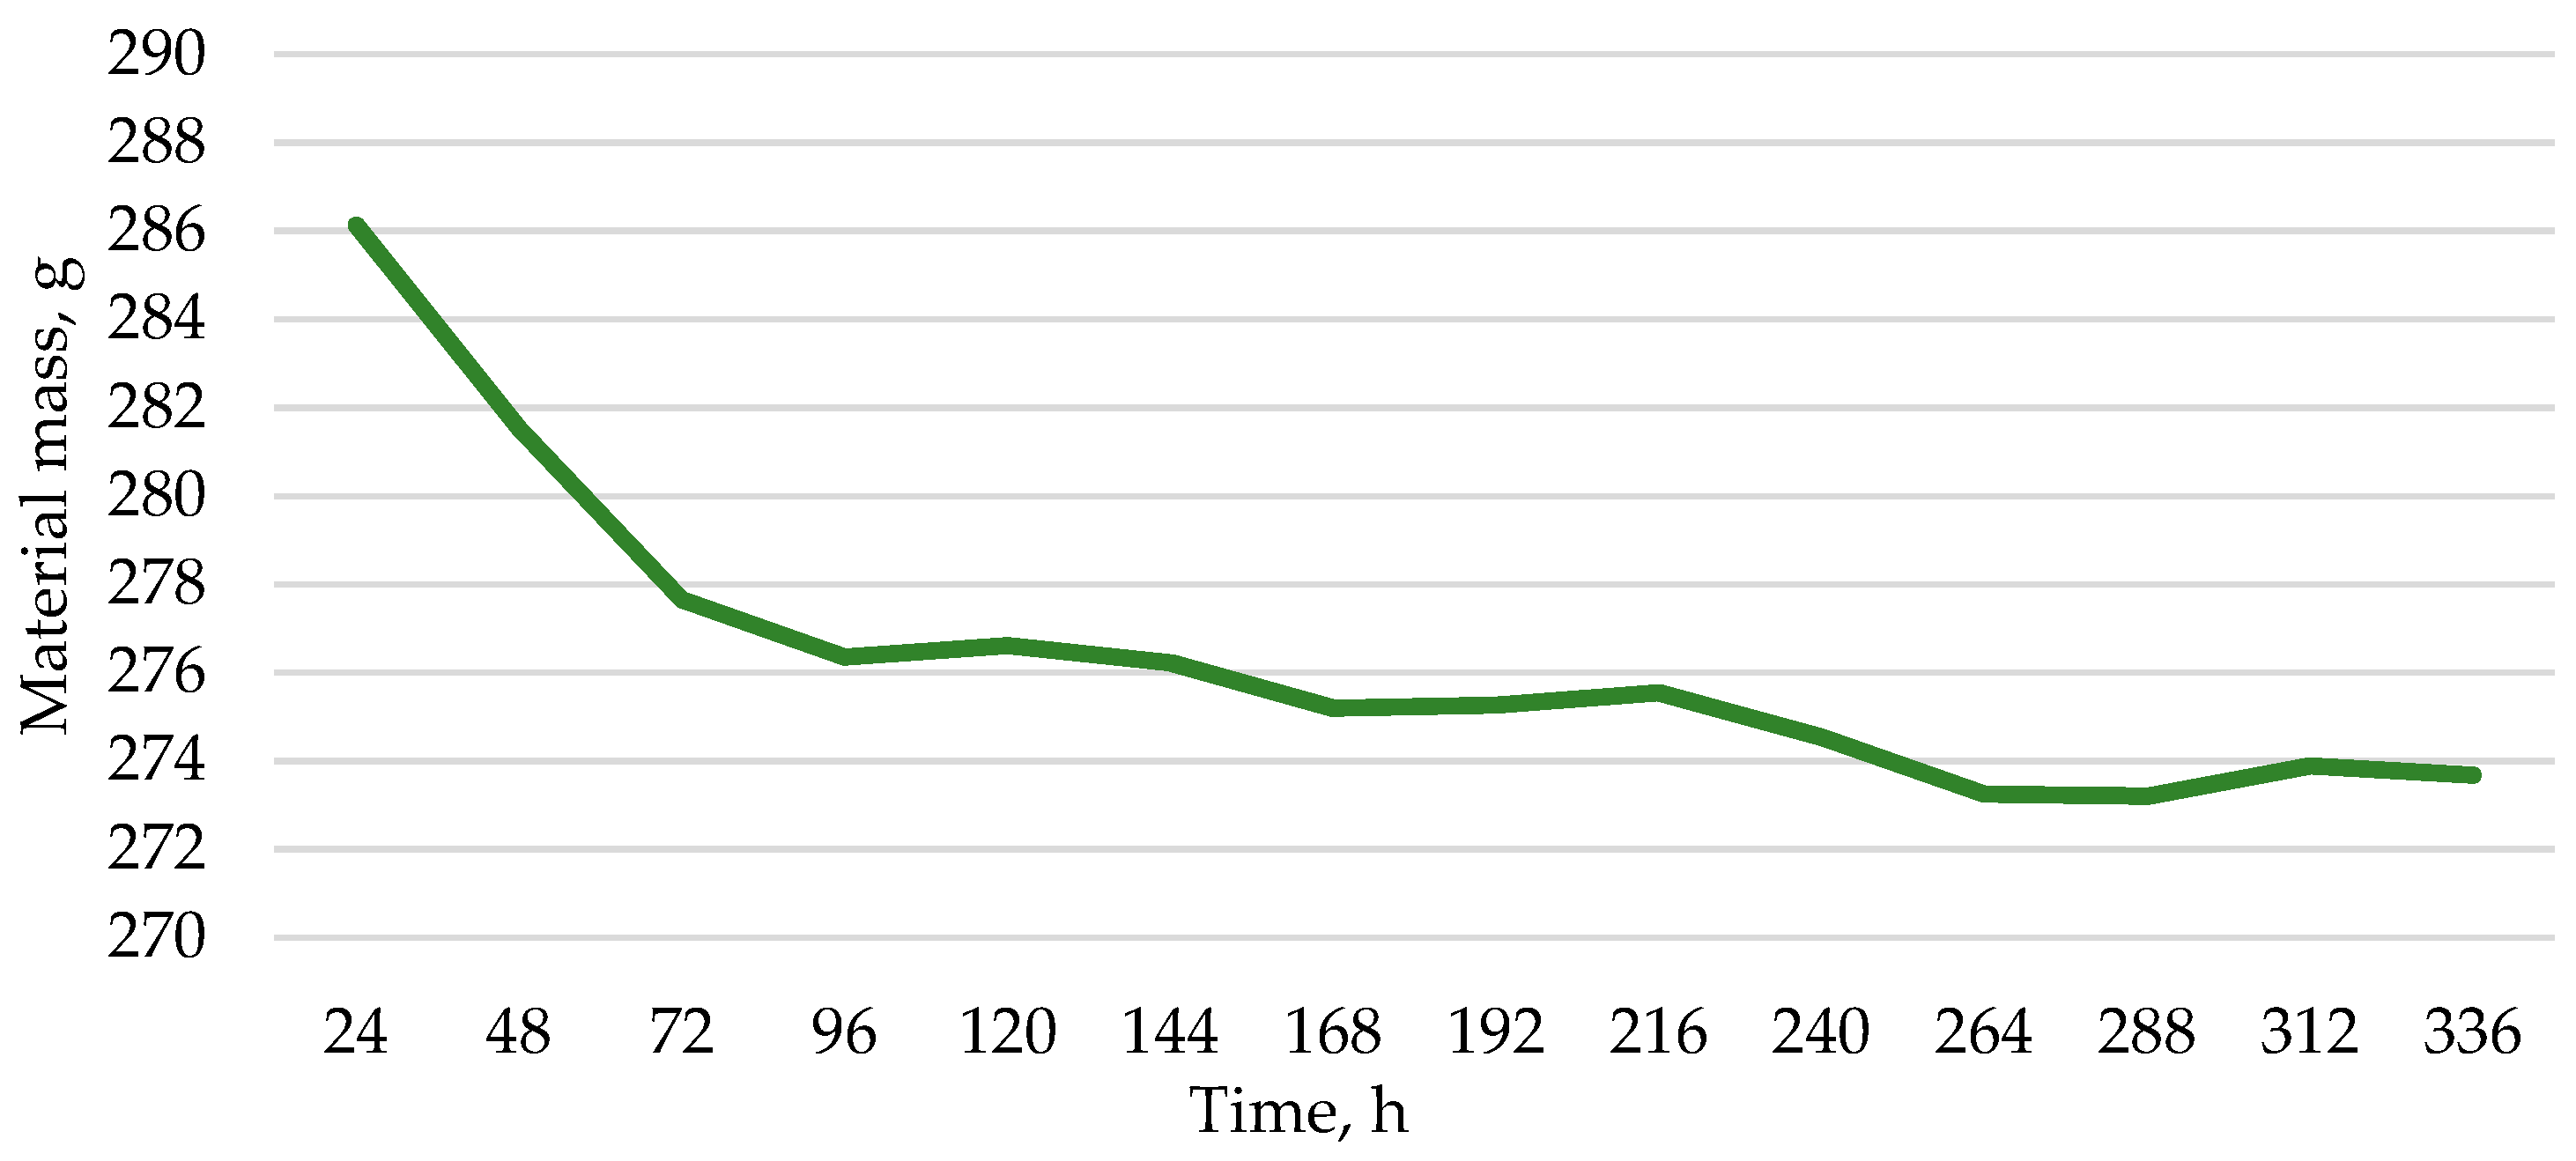
The initial mass of the sample is 286 g, but after 72 h the mass of the sample has decreased by 3% to 277 g. When recording the mass for up to 14 days, it can be observed that the change in mass fluctuates within 1.5%, which is normal for a material made of natural raw materials and that is based on moisture absorption and release. The obtained data are inserted in Equation (1), and the calculation results in the moisture content of the board of 4.5%. After 14 days, samples are placed in an oven at 105 ± 2 °C for 24 h. The initial sample weighs 286 g for the first sample and 273 g for the second sample. As a result of drying, the samples lose 8% and 10% of their weight, and the moisture content of the samples is 9% and 11%, respectively (
Figure 9).
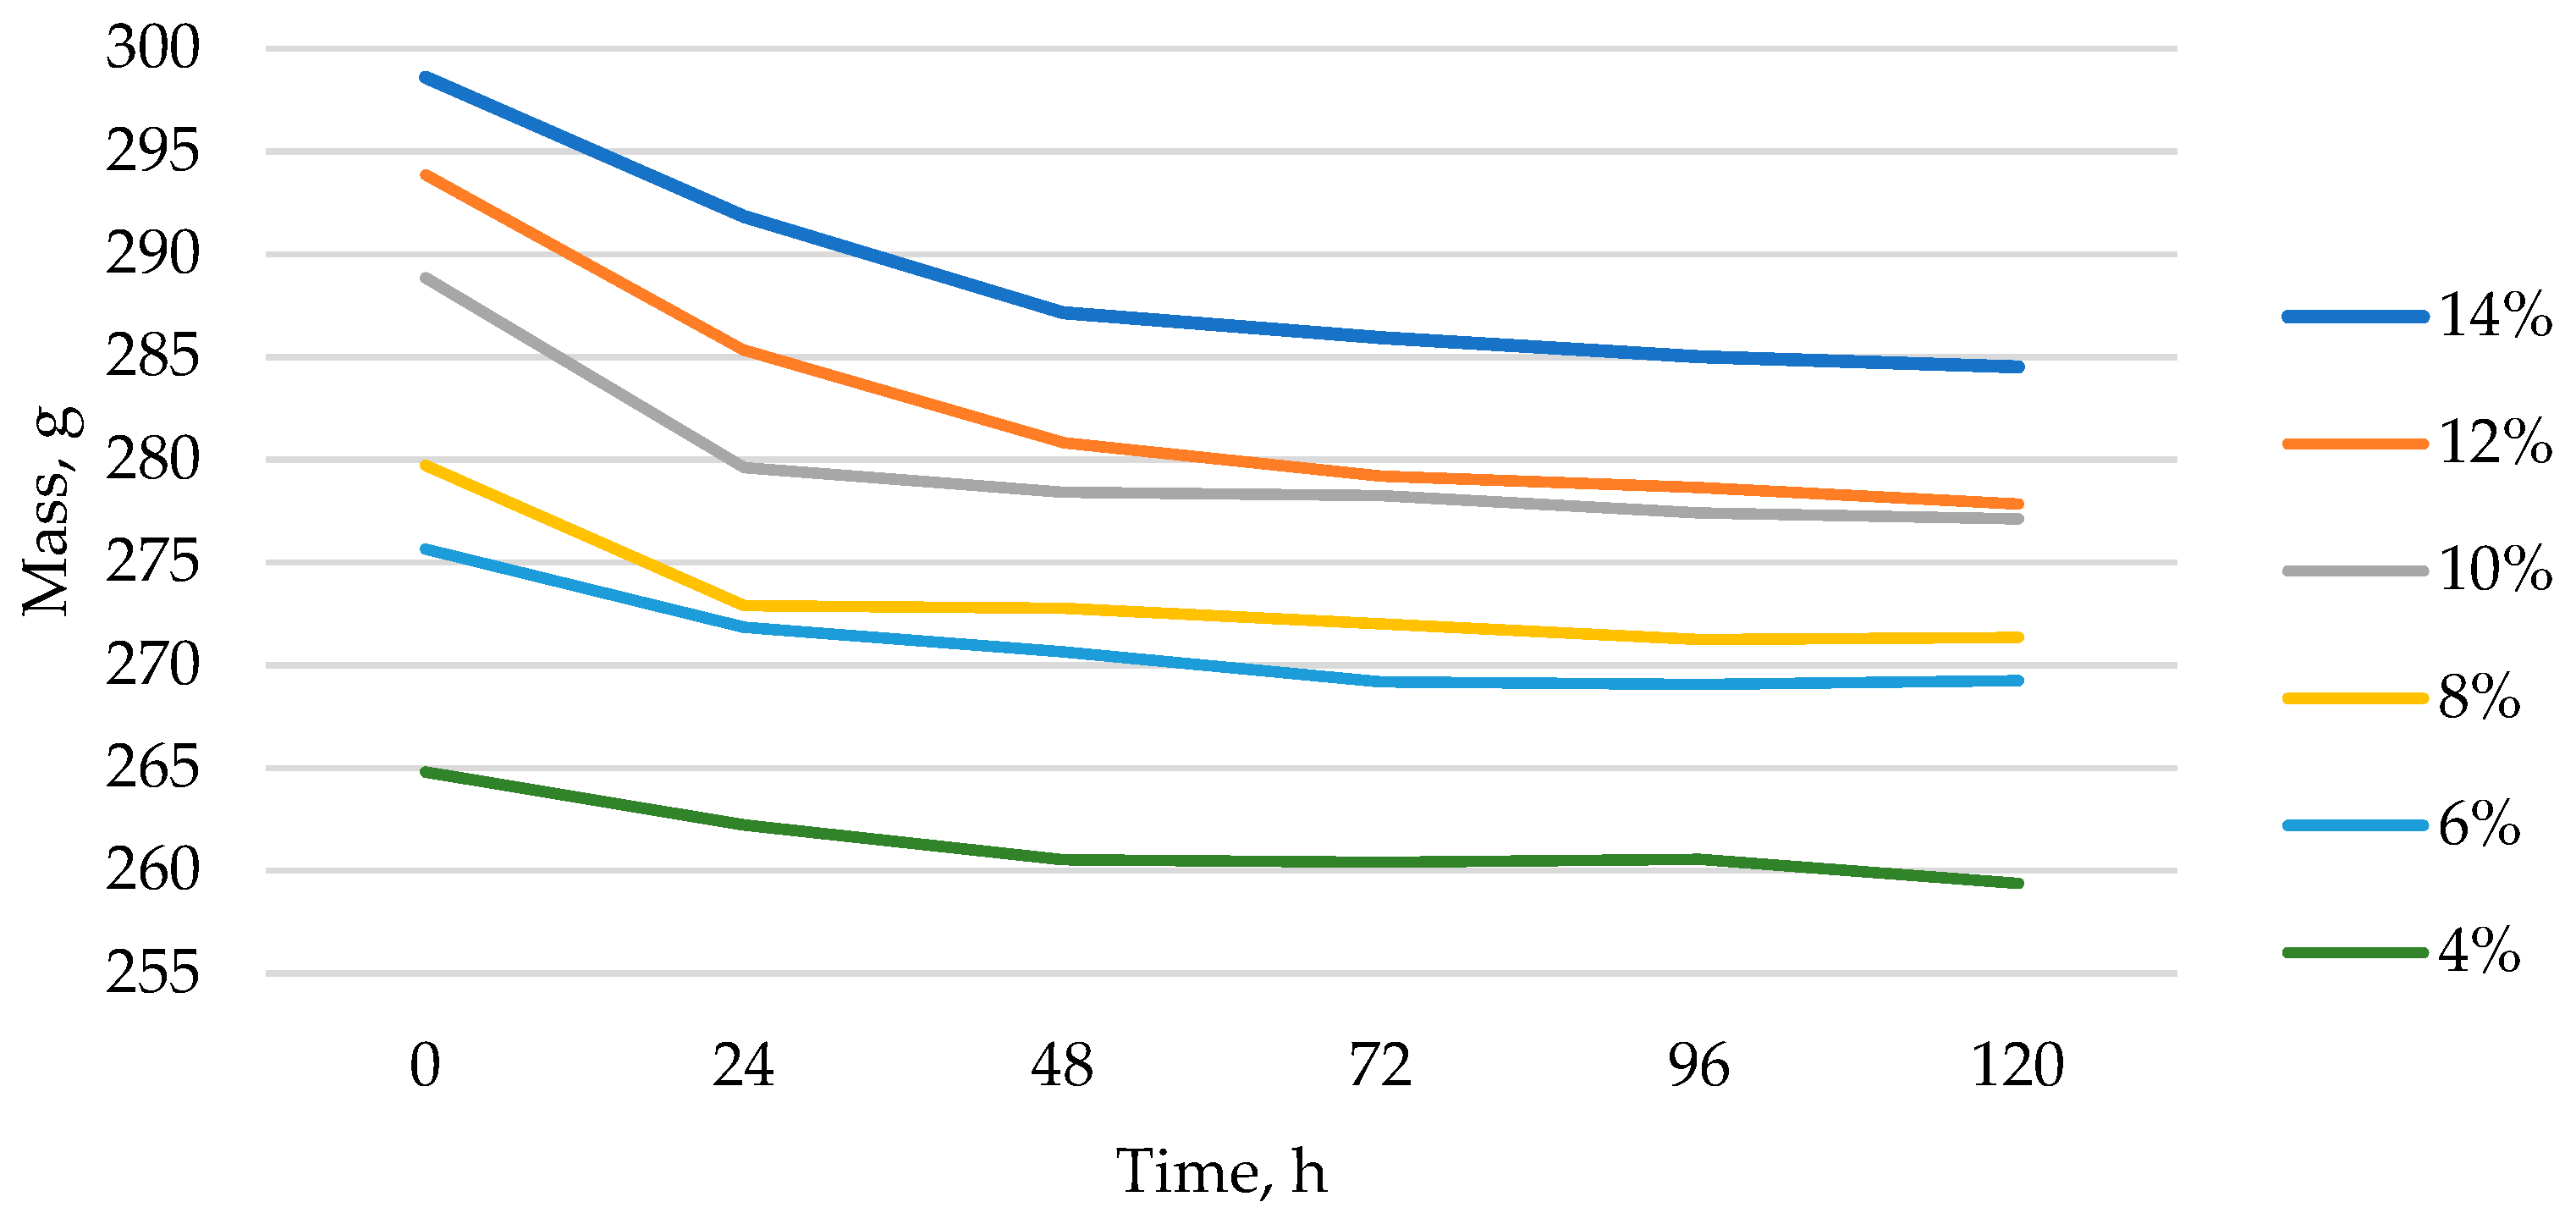
The largest mass drop for all boards occurs in the first 24 h, where depending on the amount of binder (amount of added water), the mass varies in the range of 1–4%, but in the following days, it goes up to 2% (
Figure 10). According to the obtained results, it can be seen that on average, after 72 h, the mass changes are within 1%, which is related to the laboratory room, humidity and temperature fluctuations, and the natural origin of the raw material. Depending on the percentage of water added to the binder, a correlation can be seen in the first few days on how much water evaporates from the sample. With the addition of less water, much less moisture evaporates, but at higher amounts, and the moisture from the sample dries much faster with more frequent deformation of the samples. For a group of samples to which 4% of the binder has been added in the first day, the weight changes by a percentage, but not more than 3% of the initial weight. For boards with 10% of binder in the first day, the weight changes from 3.6% of the initial weight to a maximum of 4.8%. Moisture, depending on the amount of binder, was also determined for double-thickness boards with the same proportion of raw material and amount of binder, and the results by specific percentage were identical. Analyzing the results, it can be concluded that in the given situation, the thickness of the board does not affect the result.
3.3. Density
The density of the 200 × 200 mm sample of the manufactured board is 300 ± 20 kg/m3. Furthermore, 50 × 50 mm large samples are cut from the board and the individual density of each sample is determined. When analyzing small samples, their values range from 284 to 302 kg/m3, from which it is calculated that the density fluctuations are within 6%. Based on the obtained results, an average sample density was calculated to be 290 kg/m3. Comparing the density of the whole board with the density of 50 × 50 mm samples, it can be concluded that the fluctuations of the density of the board samples are in the range of 2%.
3.4. Thermal Conductivity
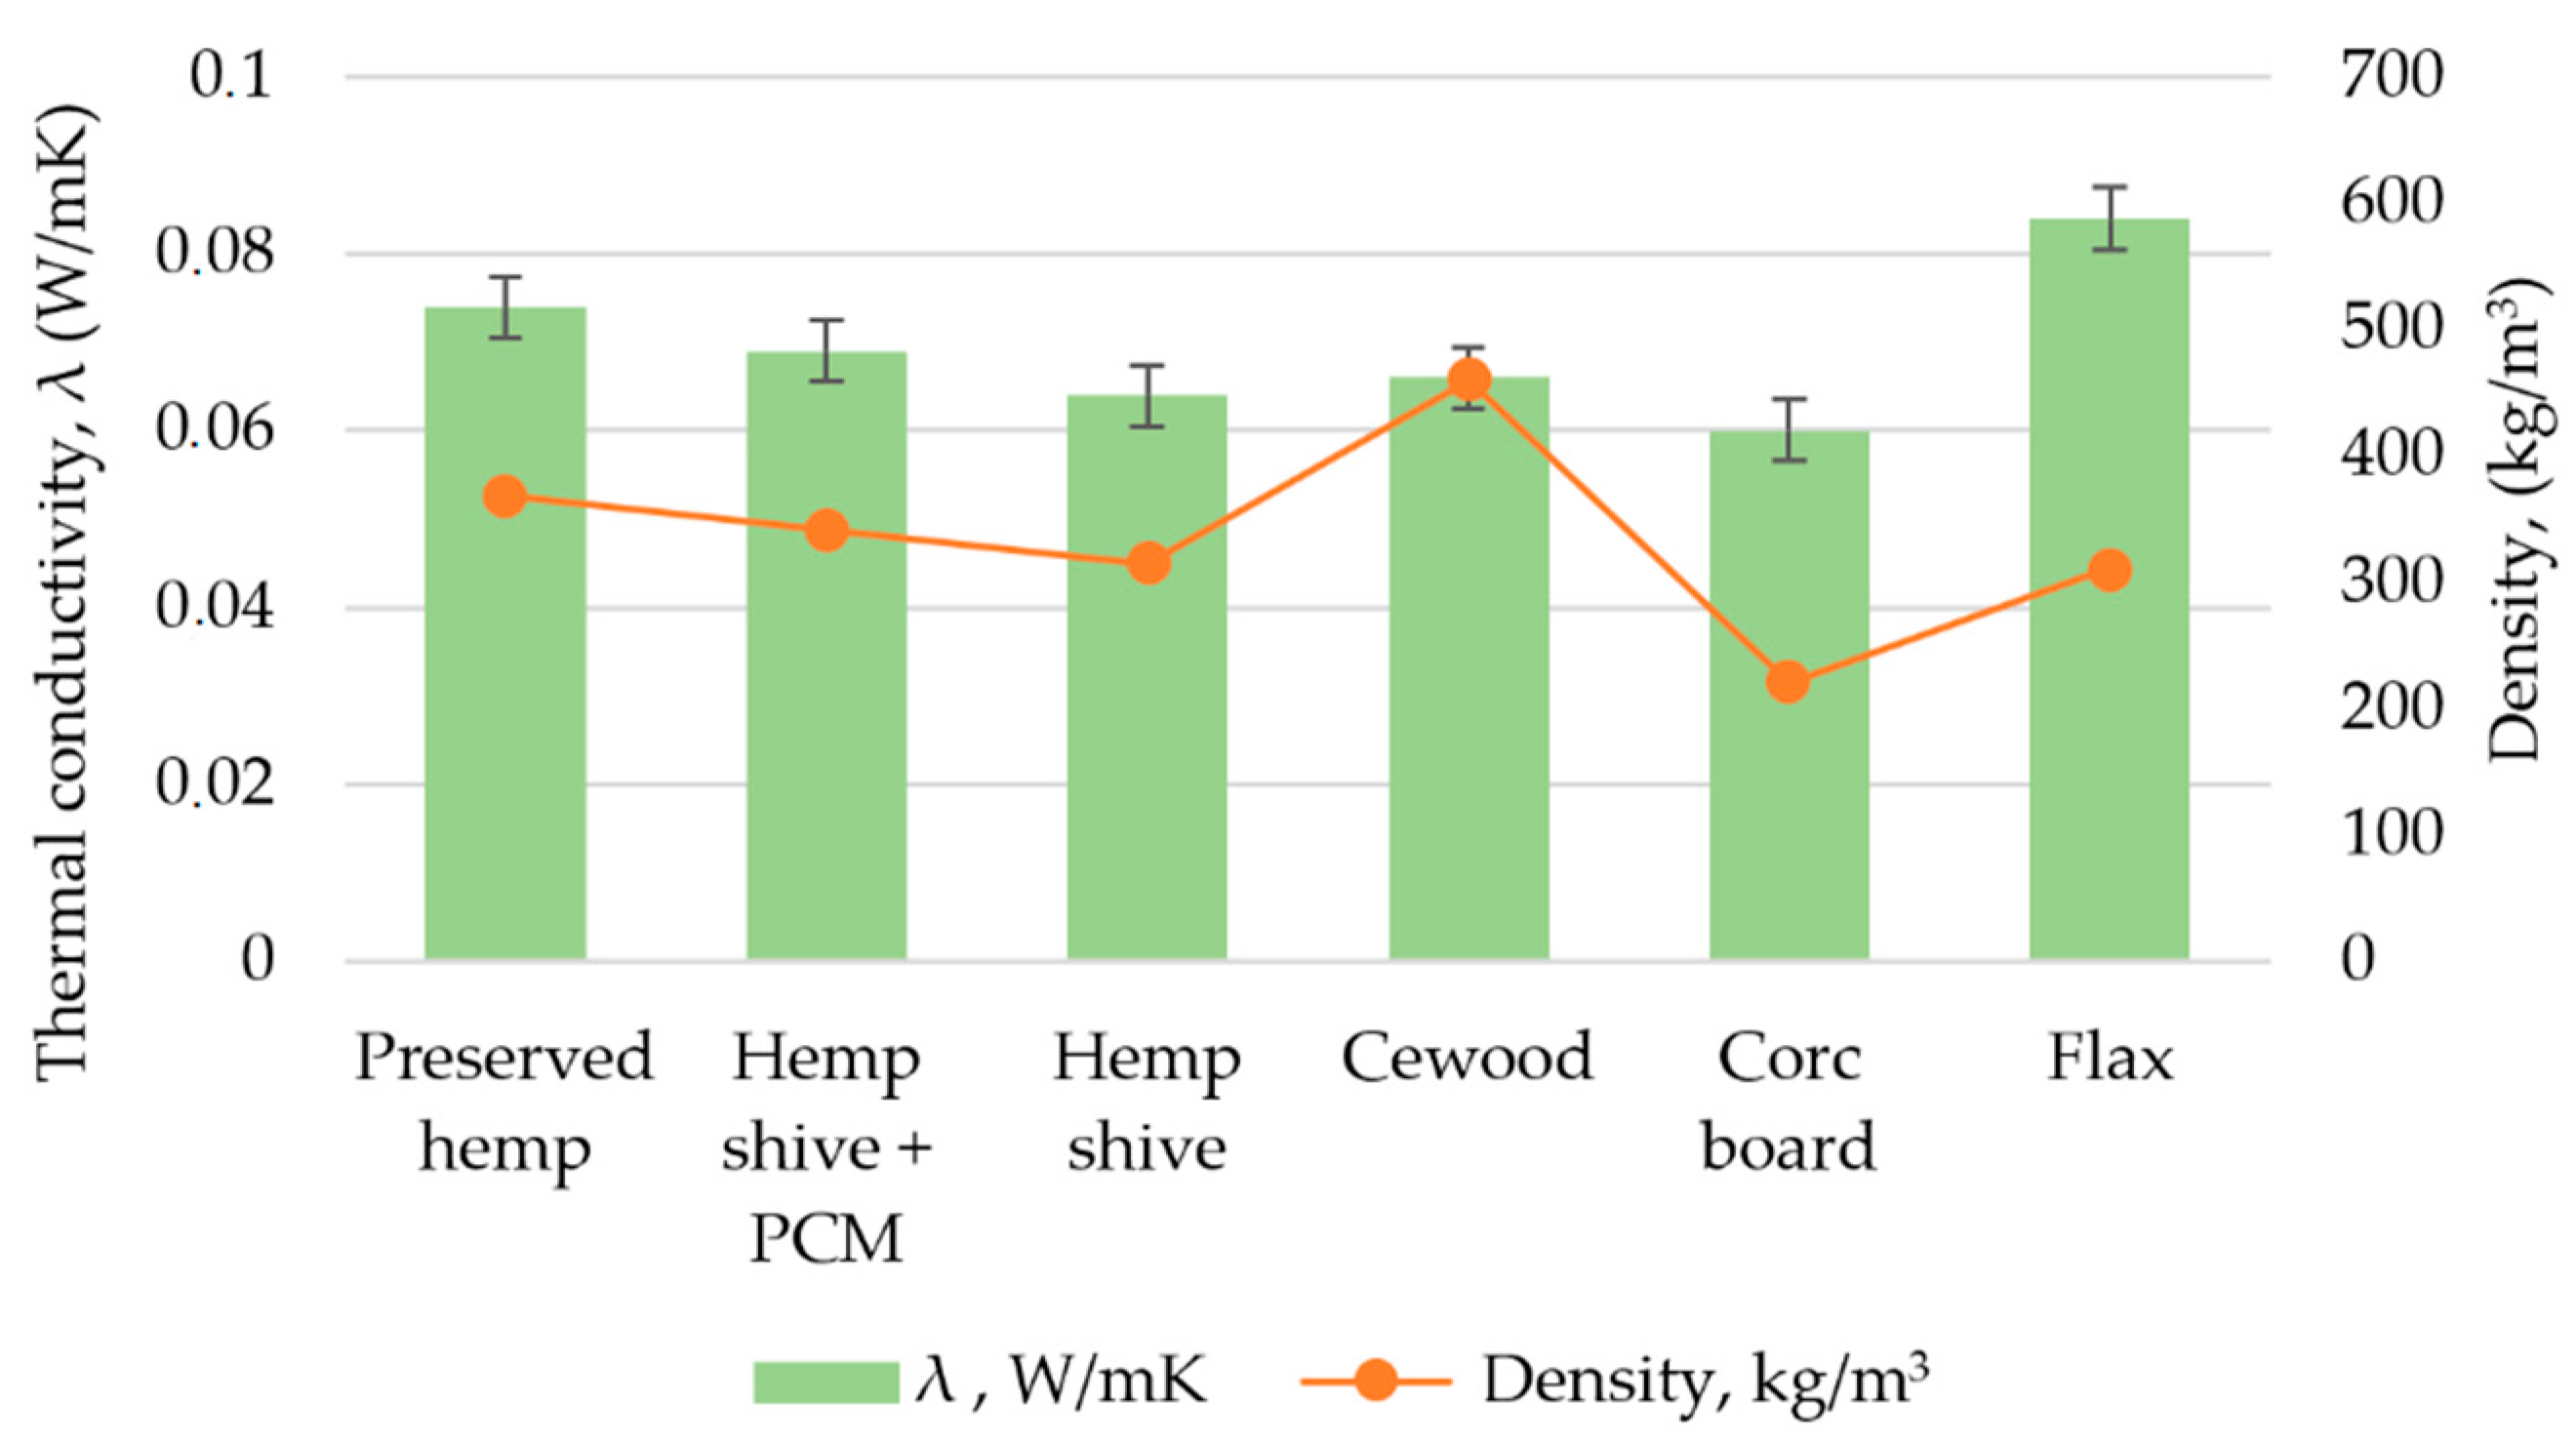
Thermal conductivity of the board samples changed within the range from 0.064 to 0.074 W/m K. In the sample with added PCM, the thermal conductivity is 7% lower than that of a hemp board without added PCM, which is 7% higher than that of a preserved hemp-shives mixture board (
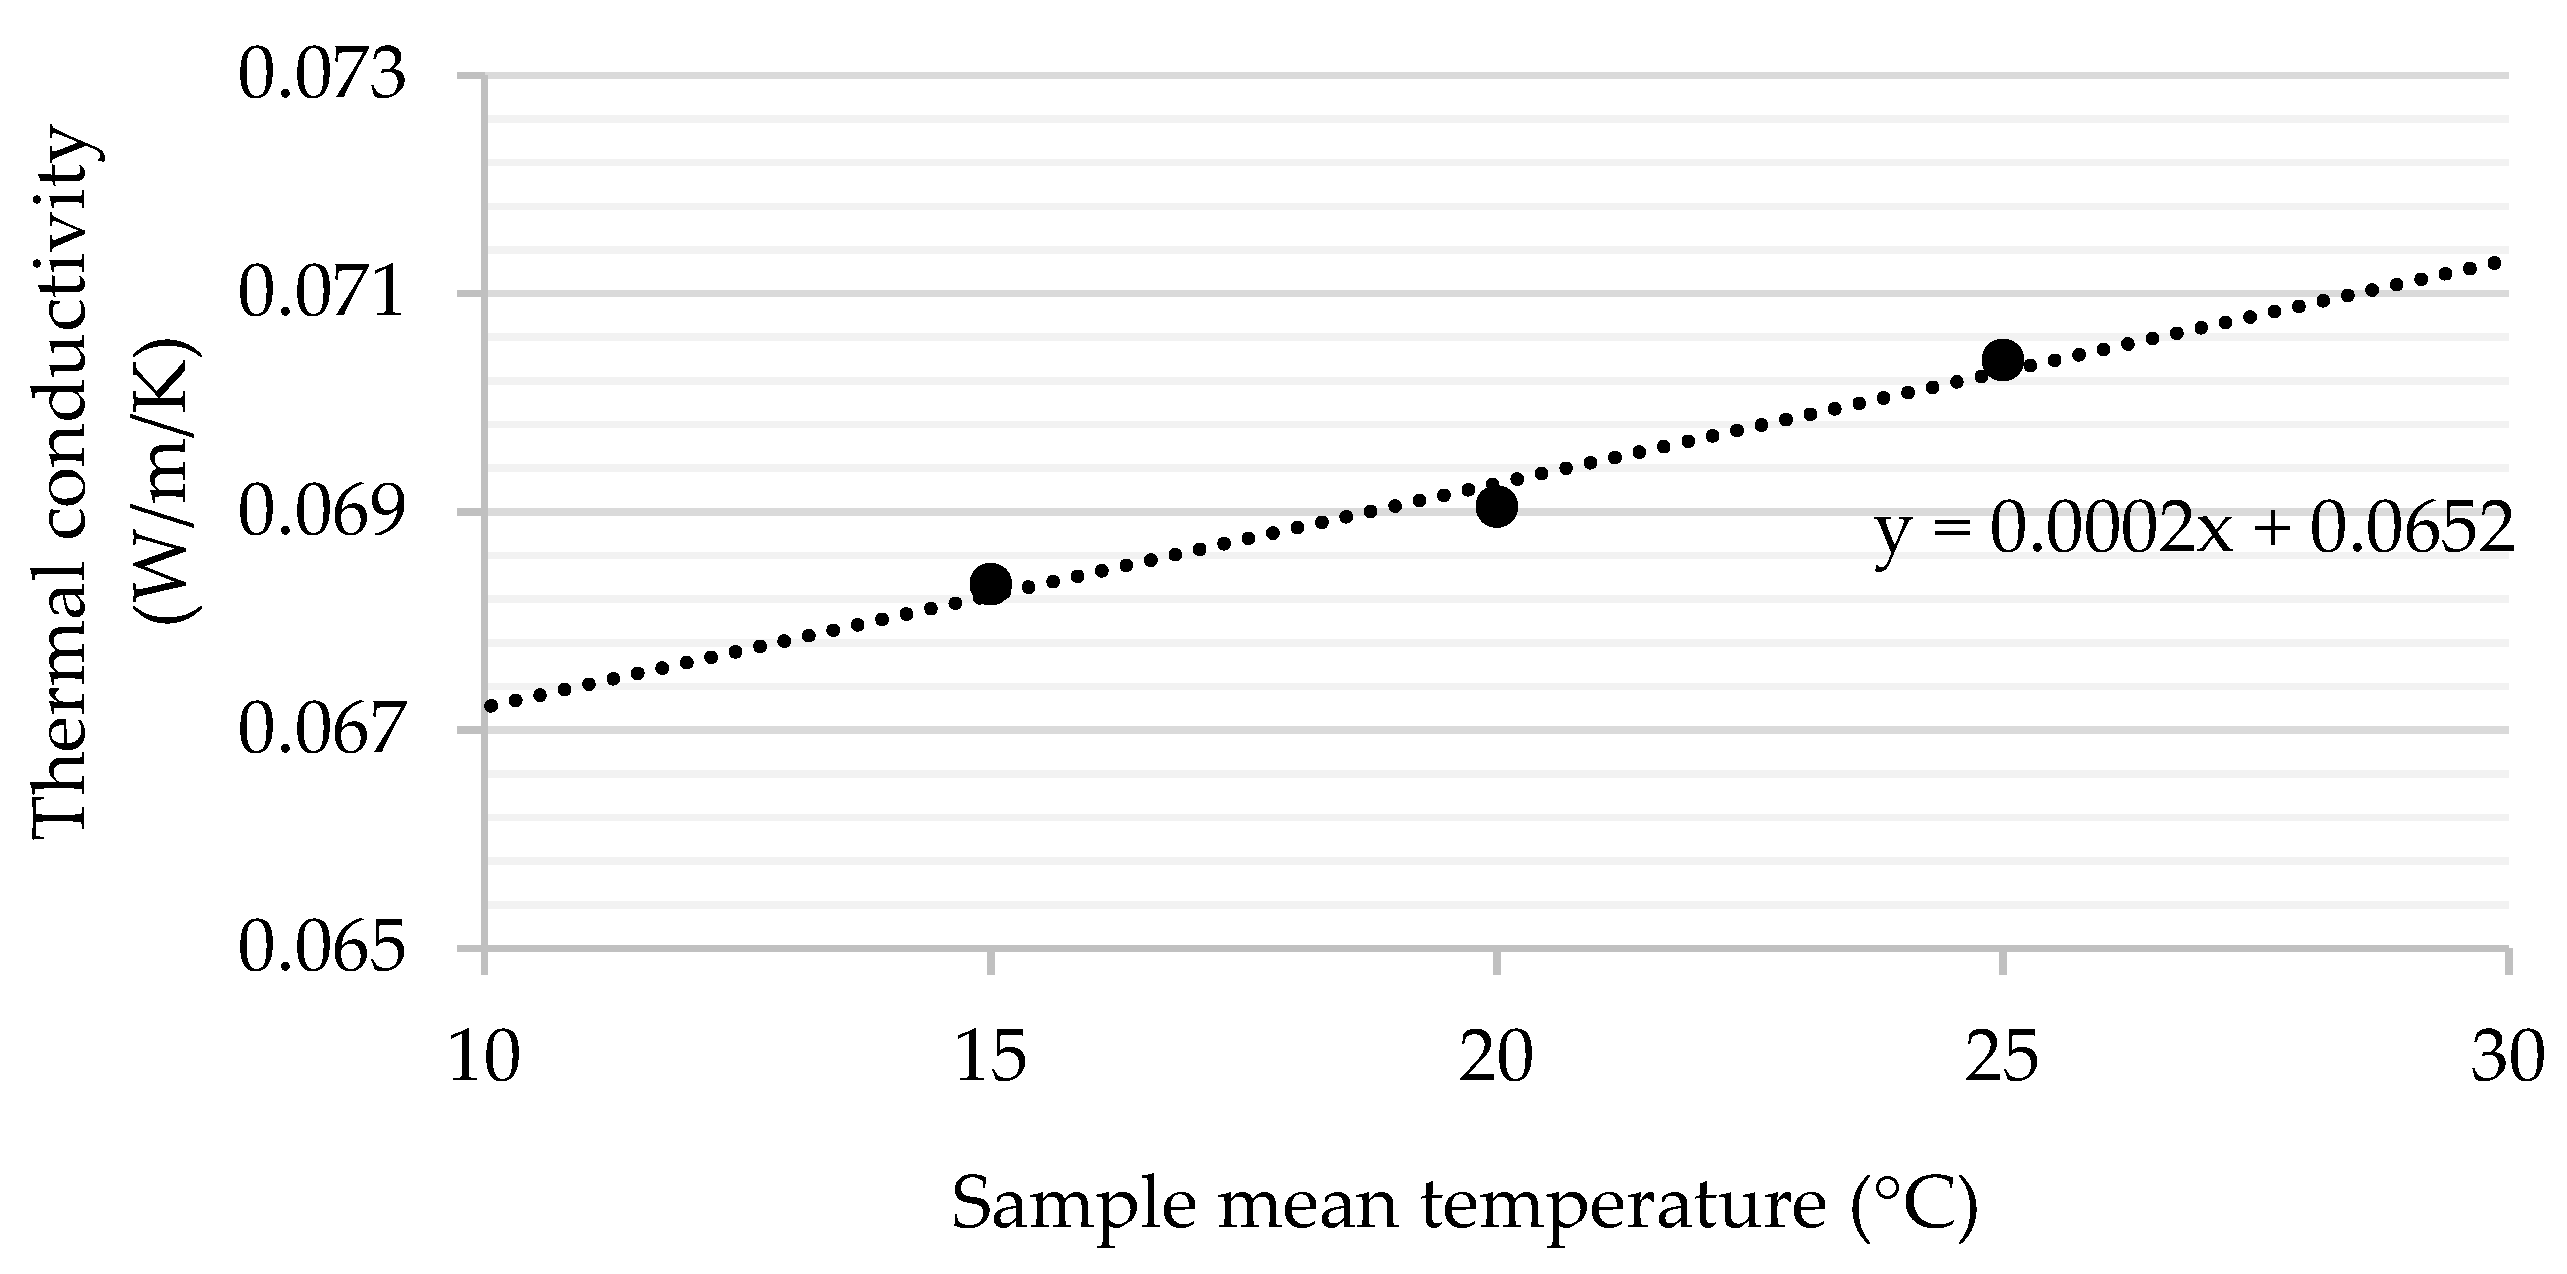
Figure 11). In the tests performed, it can be observed that if the density is 8% lower, then the coefficient of heat conduction is 7% better. To put it simpler, in this case, the increase in conductivity is determined by the decrease in the porosity of the insulating material. An example of temperature dependence is shown in
Figure 12, where thermal conductivity of hemp shives samples with the integrated PCMs increase linearly with the temperature increase in a range from 15 to 25 °C. Thermal conductivity for similar unconventional natural raw materials like flax, reed, wood fiber, cement, wood, and wool ranges from 0.6 to 1.0 W/(m·K) [
36,
39,
40,
41,
42], which is very close to the measured values.
3.5. Specific Heat Capacity
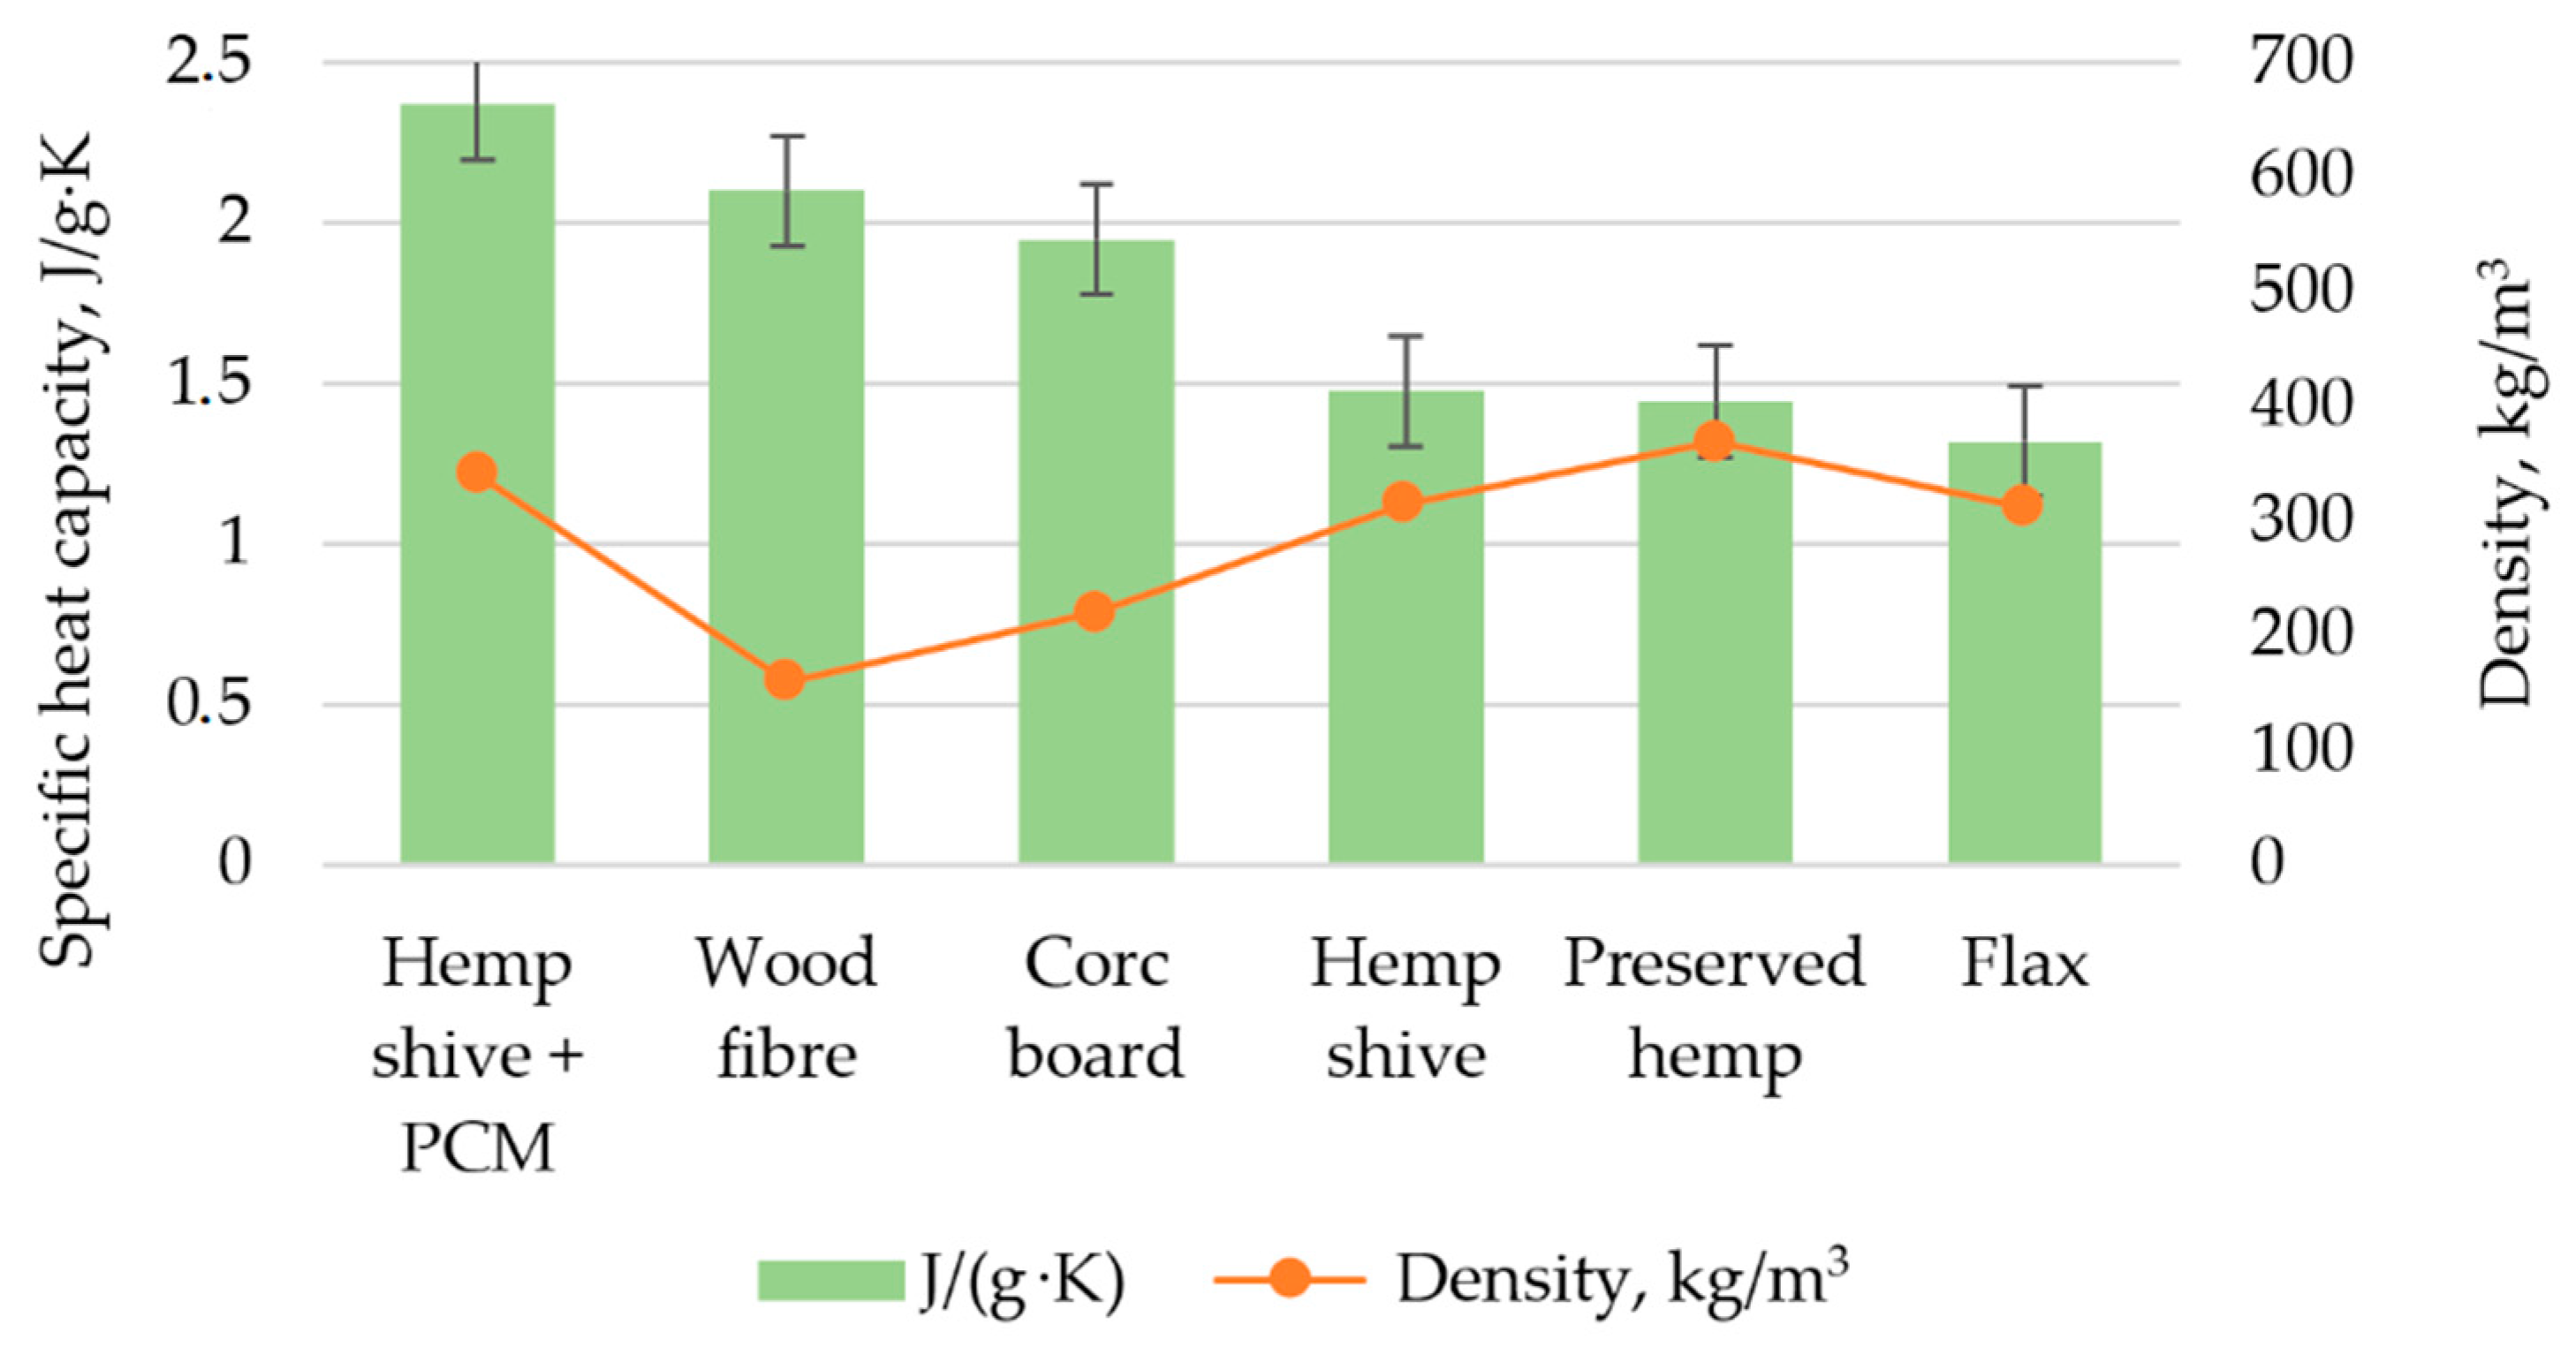
Another important performance indicator related to thermal properties of insulation materials is high specific heat capacity. This property can be beneficial in buffering indoor temperature—during the summer it can reduce the need for cooling. As seen in
Figure 13, the specific heat capacity of the experimental materials is in a range from 1.444 to 2.369 J/g·K. According to the data analysis, it can be concluded that the thermal conductivity of the material samples is mainly influenced by the quantity of the components of the material. The highest value of material-specific heat is for hemp shive with integrated encapsulated phase change material, and this value is 63% higher than material without phase change material. Values of specific heat capacity for similar unconventional natural raw materials like flax, wood fiber, cement, wood, and wool range from 1.280 to 2.100 J/g·K [
40,
41], whichis very close to the measured values. The hemp shive sample has a 12% higher specific heat capacity than commercial material with a higher value.
3.6. Latent Heat
Characteristic values of latent heat of fusion
L for PCM are in a wide range from 90 to 250 kJ/kg depending on the type and components [
11,
43], but for added microcapsules, it is 160 to 180 kJ/kg. In the case of a material mixture, the resulting latent heat normalized to total volume or mass will be lower proportionally to the PCM content.
Calculated difference of specific heat capacity interval 20, …, 30 °C for hemp shive samples containing PCM according to Equation (5) are in the range of 3.6 to 5.5 kJ/kg. Further calculations consider the mass ratio (6) of 5% of the PCM in a sample, resulting in latent heat values 70 to 110 kJ/kg, which is essentially lower than expected. The possible reason for this difference may be the unknown exact weight of the PCM in a sample, e.g., decreasing in calculations PCM part for 1%, resulting in maximum latent heat value increasing to 140 kJ/kg, which is closer to theoretical and manufacturer data.
4. Conclusions
For the first time, a thermal insulation material has been developed using hemp shive mass mixing phase change material microcapsule (PCMs) MikroCaps Ltd.
The minimum volume for hemp shives is below 150 μm, which is 1% of the total weight, but it is dust that adversely affects the mechanical properties of the board.
Comparing the density of the whole board with the density of 50 × 50 mm samples, it can be concluded that the fluctuations of the density of the board sample are in the range of 2%, which is the optimal limit.
The material must be kept for at least 5 days in laboratory conditions before other tests, but preferably for 7–10 days, as then the maximum mass/moisture in the sample varies within 1.5%. The material changes in mass up to 4%, respectively, and the more binder (water) that is added to the sample, the greater the change in mass.
Thermal conductivity is one of the most important parameters of any insulating material. The thermal conductivity of the experimental samples is the range of 0.064–0.074 W/(m∙K), which fits in the commercially available hemp insulation product class, and which thermal conductivity is in the range of 0.066–0.074 W/(m∙K) at the density range 315–490 kg/m3—i.e., it falls within the thermal conductivity ranges of all generic groups of the insulation and is comparable with that of other fibrous insulation materials.
As the material tests show, the specific heat capacity value of the boards, in which 5% encapsulate phase change material is mixed in the mass during the manufacturing process, has increased by 62%, reaching 2.369 J/(g·K). This property can be beneficial in buffering indoor temperatures—during the summer it can reduce the need for cooling.
Measurements of integral latent heat showed differences in theoretical and calculated values, which can be explained by not exactly knowing the weight of the PCM in the sample after mixture processing and drying. Potentially, the use of the DSC method in the future will give more comprehensive and detailed information about physical properties during the phase change process, providing additional data, e.g., shift in melting and freezing points.
Author Contributions
E.K., I.Z., conducted the experimental works and prepared the original draft paper; S.K., E.K. and I.Z., developed the conceptualization and methodology of research work; H.J.-G., S.G. and V.S., reviewed and edited the draft paper; E.K., S.G. and S.K., data curation and visualization; E.K., I.Z. and S.G., translated the article, analyzed the results and provided manuscript formatting. All authors have read and agreed to the published version of the manuscript.
Funding
This research was funded by the European Regional Development Fund within the Activity 1.1.1.2 “Post-doctoral Research Aid” grant number No. 1.1.1.2/VIAA/1/16/152.
Conflicts of Interest
The authors declare no conflict of interest.
References
- Torgal, F.P. Eco-efficient construction and building materials research under the EU Framework Programme Horizon 2020. Constr. Build. Mater. 2014, 51, 151–162. [Google Scholar] [CrossRef] [Green Version]
- El Wazna, M.; Gounni, A.; El Bouari, A.; El Alami, M.; Cherkaoui, O. Development, characterization and thermal performance of insulating nonwoven fabrics made from textile waste. J. Ind. Text. 2019, 48, 1167–1183. [Google Scholar] [CrossRef]
- U.S. Energy Information Administration. International Energy Outlook 2017. US Energy Information Administration Report. September 2017. Available online: https://www.eia.gov/outlooks/ieo/pdf/0484(2017).pdf (accessed on 23 September 2019).
- Murphy, D.P.L.; Behring, H.; Wieland, H. The use of flax and hemp materials for insulating. Proc. Flax Other Bast Plants Symp. 1997, 30, 79–84. [Google Scholar]
- Kymäläinen, H.-R.; Sjöberg, A.-M. Flax and hemp fibres as raw materials for thermal insulations. Build. Environ. 2008, 43, 1261–1269. [Google Scholar] [CrossRef]
- Elfordy, S.; Lucas, F.; Tancret, F.; Scudeller, Y.; Goudet, L. Mechanical and thermal properties of lime and hemp concrete (“hempcrete”) manufactured by a projection process. Constr. Build. Mater. 2008, 22, 2116–2123. [Google Scholar] [CrossRef]
- Lühr, C.; Pecenka, R.; Budde, J.; Hoffmann, T.; Gusovius, H.-J. Comparative investigations of fiberboards resulting from selected hemp varieties. Ind. Crops Prod. 2018, 118, 81–94. [Google Scholar]
- Pecenka, R.; Furll, C.; Idler, C.; Grundmann, P.; Radosavljevic, L. Fibre boards and composites from wet preserved hemp. Int. J. Mater. Prod. Technol. 2009, 36, 208–220. [Google Scholar] [CrossRef]
- Lee, S.; Shupe, T.F.; Hse, C. Mechanical and physical properties of agro-based fiberboard. Eur. J. Wood Wood Prod. 2005, 64, 74–79. [Google Scholar] [CrossRef]
- Rofie, S. Novel Low Density Particleboard from Hemp Shives. Doctoral Thesis, University of Wales, Cardiff, UK, 2005. [Google Scholar]
- Manaia, J.P.; Manaia, A.T.; Rodrigues, L.H.M. Industrial Hemp Fibers: An Overview. Fibers 2019, 7, 106. [Google Scholar] [CrossRef] [Green Version]
- Zalba, B.; Marín, J.M.; Cabeza, L.F.; Mehling, H. Review on thermal energy storage with phase change: Materials, heat transfer analysis and applications. Appl. Therm. Eng. 2003, 23, 251–283. [Google Scholar] [CrossRef]
- Pomianowski, M.Z.; Heiselberg, P.; Jensen, R.L.; Cheng, R.; Zhang, Y. A new experimental method to determine specific heat capacity of inhomogeneous concrete material with incorporated microencapsulated-PCM. Cem. Concr. Res. 2014, 55, 22–34. [Google Scholar] [CrossRef]
- Whiffen, T.; Russell-Smith, G.; Riffat, S. Active thermal mass enhancement using phase change materials. Energy Build. 2016, 111, 1–11. [Google Scholar] [CrossRef]
- Ryms, M.; Klugmann-Radziemska, E. Possibilities and benefits of a new method of modifying conventional building materials with phase-change materials (PCMs). Constr. Build. Mater. 2019, 211, 1013–1024. [Google Scholar] [CrossRef]
- Memon, S.A. Phase change materials integrated in building walls: A state of the art review. Renew. Sustain. Energy Rev. 2014, 31, 870–906. [Google Scholar] [CrossRef]
- Cao, L.; Su, D.; Tang, Y.; Fang, G.; Tang, F. Properties evaluation and applications of thermal energy storage materials in buildings. Renew. Sustain. Energy Rev. 2015, 48, 500–522. [Google Scholar] [CrossRef]
- Rao, Z.; Wang, S.; Zhang, Z. Energy saving latent heat storage and environmental friendly humidity-controlled materials for indoor climate. Renew. Sustain. Energy Rev. 2012, 16, 3136–3145. [Google Scholar] [CrossRef]
- Madad, A.; Mouhib, T.; Mouhsen, A. Phase Change Materials for Building Applications: A Thorough Review and New Perspectives. Buildings 2018, 8, 63. [Google Scholar] [CrossRef] [Green Version]
- Ryms, M.; Januszewicz, K.; Kazimierski, P.; Łuczak, J.; Klugmann-Radziemska, E.; Lewandowski, W.M. Post-Pyrolytic Carbon as a Phase Change Materials (PCMs) Carrier for Application in Building Materials. Materials 2020, 13, 1268. [Google Scholar] [CrossRef] [Green Version]
- Mathis, D.; Blanchet, P.; Lagière, P.; Landry, V. Performance of Wood-Based Panels Integrated with a Bio-Based Phase Change Material: A Full-Scale Experiment in a Cold Climate with Timber-Frame Huts. Energies 2018, 11, 3093. [Google Scholar] [CrossRef] [Green Version]
- Ramakrishnan, S.; Sanjayan, J.; Wang, X. Experimental Research on Using Form-stable PCM-Integrated Cementitious Composite for Reducing Overheating in Buildings. Buildings 2019, 9, 57. [Google Scholar] [CrossRef] [Green Version]
- Castell, A.; Martorell, I.; Medrano, M.; Pérez, G.; Cabeza, L. Experimental study of using PCM in brick constructive solutions for passive cooling. Energy Build. 2010, 42, 534–540. [Google Scholar] [CrossRef]
- Bravo, J.P.; Venegas, T.; Correa, E.; Álamos, A.; Sepúlveda, F.; Vasco, D.A.; Barreneche, C. Experimental and Computational Study of the Implementation of mPCM-Modified Gypsum Boards in a Test Enclosure. Buildings 2020, 10, 15. [Google Scholar] [CrossRef] [Green Version]
- Zhu, N.; Ma, Z.; Wang, S. Dynamic characteristics and energy performance of buildings using phase change materials: A review. Energy Convers. Manag. 2009, 50, 3169–3181. [Google Scholar] [CrossRef]
- Kuznik, F.; Virgone, J. Experimental assessment of a phase change material for wall building use. Appl. Energy 2009, 86, 2038–2046. [Google Scholar] [CrossRef] [Green Version]
- Schossig, P.; Henning, H.-M.; Gschwander, S.; Haussmann, T. Micro-encapsulated phase-change materials integrated into construction materials. Sol. Energy Mater. Sol. Cells 2005, 89, 297–306. [Google Scholar] [CrossRef]
- Lai, C.-M.; Chen, R.; Lin, C.-Y. Heat transfer and thermal storage behaviour of gypsum boards incorporating micro-encapsulated PCM. Energy Build. 2010, 42, 1259–1266. [Google Scholar] [CrossRef]
- Hughes, M.; Ormondroyd, G.; Jones, G.L. Testing and Analysis of Hemp Fibre and Hurd and Formed Biocomposites; The Bio Composites Centre: Gwynedd, UK, 2006. [Google Scholar]
- Tests for Geometrical Properties of Aggregates—Part 1: Determination of Particle Size Distribution—Sieving Method; LVS EN 933-1:2012; Latvian Standard: Riga, Latvia, 2012.
- Zarei, A. Characterization of Szego-Milled Hemp Fibres. Ph.D. Thesis, University of Toronto, Toronto, ON, Canada, 2010. [Google Scholar]
- Wood-Based Panels—Determination of Moisture Content; LVS EN 322:1993; Latvian Standard: Riga, Latvia, 1993.
- Wood-Based Panels—Determination of Density; LVS EN 323:2000; Latvian Standard: Riga, Latvia, 2000.
- Thermal Insulation: Determination of Steady-State Thermal Resistance and Related Properties. Heat Flow Meter Apparatus; ISO 8301:1991; International Organization for Standardization: Latvian Standard, Riga, Latvia, 1991.
- ASTM C518—17 Standard Test Method for Steady-State Thermal Transmission Properties by Means of the Heat Flow Meter Apparatus; ASTM International: West Conshohocken, PA, USA, 2017.
- Gendelis, S. Analysis of the efficiency of non-traditional thermal insulation materials. In Proceedings of the 18th International Multidisciplinary Scientific GeoConference SGEM2018, Albena, Bulgaria, 2–8 July 2018. [Google Scholar]
- Bittle, R.R.; Taylor, R.E. Thermal Conductivity; Ashworth, R., Smith, D.R., Eds.; Springer: Boston, MA, USA, 1984; pp. 379–390. [Google Scholar]
- Shukla, N.; Kosny, J. DHFMA Method for Dynamic Thermal Property Measurement of PCM-integrated Building Materials. Curr. Sustain. Energy Rep. 2015, 2, 41–46. [Google Scholar] [CrossRef] [Green Version]
- Gendelis, S.; Jakovičs, A.; Engelhardt, M. Thermal and moisture adsorption/desorption properties for a selection of vegetal insulation materials. MATEC Web Conf. 2019, 282, 02062. [Google Scholar] [CrossRef]
- Kozlowski, R.; Wladyka-Przybylak, M. Uses of Natural Fiber Reinforced Plastics. In Natural Fibers, Plastics and Composites; Wallenberger, F.T., Weston, N., Eds.; Springer: Boston, MA, USA, 2004; pp. 249–274. [Google Scholar] [CrossRef]
- Pfundstein, M.; Gellert, R.; Spitzner, M.; Rudolphi, A. Insulating Materials: Principles, Materials, Applications; Edition Detail: Regensburg, Germany, 2008. [Google Scholar]
- Asdrubali, F.; D’Alessandro, F.; Schiavoni, S. A review of unconventional sustainable building insulation materials. Sustain. Mater. Technol. 2015, 4, 1–17. [Google Scholar] [CrossRef]
- Cabeza, L.F.; Castell, A.; Barreneche, C.; De Gracia, A.; Fernández, A. Materials used as PCM in thermal energy storage in buildings: A review. Renew. Sustain. Energy Rev. 2011, 15, 1675–1695. [Google Scholar] [CrossRef]
| Publisher’s Note: MDPI stays neutral with regard to jurisdictional claims in published maps and institutional affiliations. |
© 2020 by the authors. Licensee MDPI, Basel, Switzerland. This article is an open access article distributed under the terms and conditions of the Creative Commons Attribution (CC BY) license (http://creativecommons.org/licenses/by/4.0/).


 ,
, 


