Article

Robustness Assessment of Redundant Structural Systems Based on Design Provisions and Probabilistic Damage Analyses

by
Panagiotis Spyridis
1,* and
Alfred Strauss
2
1
Faculty of Architecture and Civil Engineering, TU Dortmund University, 44227 Dortmund, Germany
2
Institute of Structural Engineering, University of Natural Resources and Life Sciences (BOKU), 1190 Vienna, Austria
*
Author to whom correspondence should be addressed.
Buildings 2020, 10(12), 213; https://doi.org/10.3390/buildings10120213
Submission received: 19 October 2020 / Revised: 16 November 2020 / Accepted: 19 November 2020 / Published: 24 November 2020
(This article belongs to the Section Building Energy, Physics, Environment, and Systems)

Abstract

:
Typically in structural design, foreseeable loads are assumed in a structural design and dimensioning exercise and design material properties may be handled in a semi-probabilistic approach. Structures can, however, be exposed to largely unforeseeable events such as intense environmental phenomena, accidents, malicious acts, and planning or execution errors, in addition to degradation with time. Recent significant collapses have highlighted the fact that robustness is an indispensable integral part of the structural design and provisions in upcoming codes are currently expanding in this respect. The paper examines the practical significance of quantitative robustness indicators included in recent research and upcoming standards and it assesses their efficiency based on case studies. Moreover, it proposes a probabilistic numerical methodology for robustness assessment under uncertainty, and it demonstrates its practical applicability based on computations with indicative structural truss systems, i.e., multi-component systems. The proposed method allows for quantifiable and comparable robustness measures, which can be integrated in reliability-based design and structural health monitoring of engineering systems. The redundancy aspect of robustness is pronounced as a plausible quantitative performance indicator for multi-component systems. In particular, the robustness index combining reliability and redundancy of the elements is proven to be the most useful one out of the examined approaches. This probabilistic elaboration does not only account for the reasonable treatment of variability and randomness, but it allows for an inverse identification of the critical failure paths and the characterization of weak links in the systems.

1. Introduction

Notable failures have shown that robustness is a vital integral part of design and dimensioning. This is concluded from severe fatal incidents including the collapse of the prefabricated blocks of the Ronan Point tower in London in 1968 [1], ceiling collapses in the I-90 Fort Point Channel tunnel in Boston in 2006 [2], and in the Sasago tunnel in Tokyo in 2012 [3], the collapses of the Florida International University pedestrian bridge in Sweetwater [4] and the Polcevera Viaduct in Genoa [5] in 2018. In this context, the redundancy of load-bearing structures has lately become increasingly important. In the current standards and guidelines, only qualitative measures are essentially proposed in order to ensure robustness [6]. Robustness, understood as a systematic property, is the ability of the system to avoid a disproportionate collapse after the failure of individual elements.
Critical evaluation parameters are the global load—displacement response of the system, as well as the reduction of stiffness and load capacity due to damage incidents, i.e., when the individual elements (nodes or members) are lost. Truss systems offer a typical example of interacting components within an engineering system, which are connected to each other to form planar or spatial structures by means of node connections. With focus on a quantitative evaluation of the truss systems’ robustness, the static functionality of a truss after the failure of its components is guaranteed by the presence of more than necessary elements to fulfil alternative load paths. This excess of load-bearing elements is expressed by the term “redundancy” [7,8,9].
In most design situations, foreseeable actions are assumed in dimensioning exercises, and the respective material properties are elaborated in a deterministic or semi-probabilistic approach of member verification. Structures in general can, however, be exposed to largely unforeseeable events such as intense natural phenomena (hurricanes, floods and earthquakes), accidents (vehicle and vessel impacts, fires), war and crime acts, and planning or execution errors. Existing structures run particular risks, as damage to the load-bearing structure can also be caused by deterioration processes, which are governed by uncertainties and hidden defects. Recent significant collapses have highlighted the fact that robustness, as an integral part of design, is indispensable. However, current standards and directives offer generalized, qualitative robustness measures, and they have so far had little practical significance [10,11,12]. Redundancy, as a decisive factor influencing robustness plays, an important role in the design of a structural system.
In this study, the open problem of how to quantify and implement indicators for robustness is addressed. The effects of member or node failure on the system’s performance are discussed based on state-of-the-art robustness assessment concepts, and a prevalent robustness design methodology is described in detail. A methodology for evaluating the robustness of truss constructions is developed, and indicative multi-component structural systems (truss type) are comparatively analyzed to evaluate different quantitative robustness measures. As a basis for the probabilistic elaboration, the material parameters of the members are generated as distributed random variables. Randomization of material parameters leads to different failure scenarios. For this study, a MATLAB algorithm based on Finite Element Modelling (FEM) was developed which is presented herein. The outcome of the study aims to provide insight to the effects of redundancy on structural robustness, and to serve as a paradigm for performance-based design for structural robustness [13,14]. The practical significance of robustness indicators proposed by current standards and directives is also examined. This is done based on a comparison of two truss systems of similar type and function, yet with different redundancy characteristics. Furthermore, a numerical methodology for robustness assessment under uncertainty is presented and validated through the analysis of truss systems. In this case the robustness of one of the abovementioned systems is calculated, and the effects of different material properties’ reliability on the comprehensive system’s probabilistic robustness performance are demonstrated. The novelty of this study lies in the fact that widely referenced quantitative indicators are put into comparison, moreover with a probabilistic elaboration. This comparative assessment of selected redundancy indices for multi-component systems is for the first time presented in international literature and it is expected to serve as an important application paradigm, as well as insight for the formation of robustness performance assessments in future research.

2. Background

2.1. Robustness Assessment Concepts and Design Provisions

The technical literature contains a large number of definitions to describe robustness. In general, robustness is the capacity of a structure to withstand events without being damaged in any way disproportionate to the original cause [10]. An interpretation by the guidance document of the UK’s Department for Communities and Local Government [15], states that structural robustness describes a quality in a structure of insensitivity to local failure, in which modest damage causes only a modest change in the structural behavior, and that a robust structure redistributes the additional load effects, exhibiting ductile rather than brittle global failure modes in the event of local damage. In Eurocode 0 [16], this concept is only mentioned implicitly, where it is dictated that events such as explosions, shocks or human error should not cause damage that is disproportionate to the cause of the damage. Eurocode 1 [17] and the existing fib Model Code 2010 [18] describe robustness as the ability of a structure to withstand events like fire, explosions, impact or the consequences of human error without collapsing or being damaged or distressed to an extent disproportionate to the original cause/local damage. Both effectively cover only the phenomenon of disproportionate collapse, but [18] addresses this explicitly as a safety aspect of design. Eurocode 2 [19] includes provisions to prohibit progressive and disproportionate collapse, specifically for structures that are not designed to withstand accidental loads. It prescribes a suitable tying system, to prevent progressive collapse by providing alternative load paths after local damage, by use of simple rules for the structural layout and detailing. However, the mathematical (and moreover probabilistic) treatment in these contexts is difficult, due to the multitude of influencing factors and topological particularities. Due to the large variety in the design of such systems, it is not fully possible to perform a plausible evaluation using system performance indicators in a standardized form. Nevertheless, failure analyses at the discretion of the planning engineer, can deliver possible measures to avoid a disproportionate collapse. A common form of disproportionate collapse is progressive failure [20].
Regarding the robustness of truss structures, the contribution of the individual components in relation to the overall load-bearing capacity and stabilization of the overall system depends essentially on the geometric-topological conditions. The term structural redundancy implicitly expresses the ability of a system to transfer residual loads from failed element to alternative paths [8]. Consequently, the redundancy distribution is an important instrument for describing the shape properties of a static system. Depending on the geometric and topological relationships between the system components, the storage conditions, the material and the cross-sectional distribution, each member has a redundancy value. This is a value between 0 and 1, which indicates the importance of the respective element in the global system. The total of redundancies is equal to the sum of the individual values and it is equivalent to the degree of static indeterminacy. The static indeterminacy alone, however, cannot provide information about the system reserves in the event of a loss. It must be known where the reserves are present in the system and where damage cannot be tolerated due to a lack of alternative load paths. As such, the individual redundancy indexes [21] can prove very helpful.
Some further approaches for quantifying robustness are already known from the literature [11,22,23]. These were generally developed on the basis of static indeterminacy and redundancy, topology of structural elements, material behavior (ductile or brittle), vulnerability and resistance. In the context of this work, the relevance for the robustness evaluation of truss systems is assessed. These include the probabilistic robustness index, stiffness-based robustness index and robustness index by combination of reliability indices and redundancy components of the beam elements. The strength of a structural component in a structural system is decisive for the course of damage accumulation, local, and then global failure. Furthermore, and as noted in the previous paragraphs, ductility of the materials of the individual components can play a vital role in the overall force redistribution across a truss system and hence influence the system’s robustness in all concepts analyzed below. Enhanced ductility, as a material property in the components comprising the structural system, can lead to load retention and delay failure throughout the damage propagation process, which is also highlighted for example in [8,22]. In the context of this study, failure is discussed at the level of failing components with identical properties, and the influence of individual cross-sectional or material characteristics are not further considered.
According to the current state-of-the-art design provisions, which are also to be included in the new fib Model Code MC2020 [24], it should be adequately assured that no accidental and/or exceptional events or damage to structural components would result in disproportional consequences for the structural system or even total collapse of the whole structure during its lifetime. Hence, the robustness of the system would be adequately considered in terms of structural risk. Design for robustness should be an integral part of the conceptual design phase of the structure taking into account different strategies that can be applied.
It is noted, that the code documents generally represent a minimum standard that buildings must meet, and stakeholders may occasionally increase load values based on own judgement and engineering justification.

2.2. Design Concept in Current Developments of the Fib Model Code 2020

The provisions of the upcoming fib Model Code 2020, which relies on a global expert community and which can serve as a basis for further standardization documents, deal with robustness in a risk framework [25]. The design of a structure for robustness must at first identify the hazards (H) the possible local (or direct) damage (D), the follow-up or indirect systemic damage (S) that describes also a progressive collapse, and the direct Cdir and indirect Cind human, economic and environmental monetarized consequences [26,27]. Direct consequences are generally localized, resulting from damage of individual components, while indirect consequences are related to a further loss of system functionality as a result of the direct consequences. The total risk Rtot from accidental/exceptional events is calculated with the following equation [11], accounting for risk associated to local (direct) damage and systemic (follow-up) damage, which can also form the basis of a respective risk management exercise:
R t o t = i j C d i r , i j P [ D j | H i ] P [ H i ] + i j k C i n d , i j k P [ S k | D j H i ] P [ D j | H i ] P [ H i ]
where:
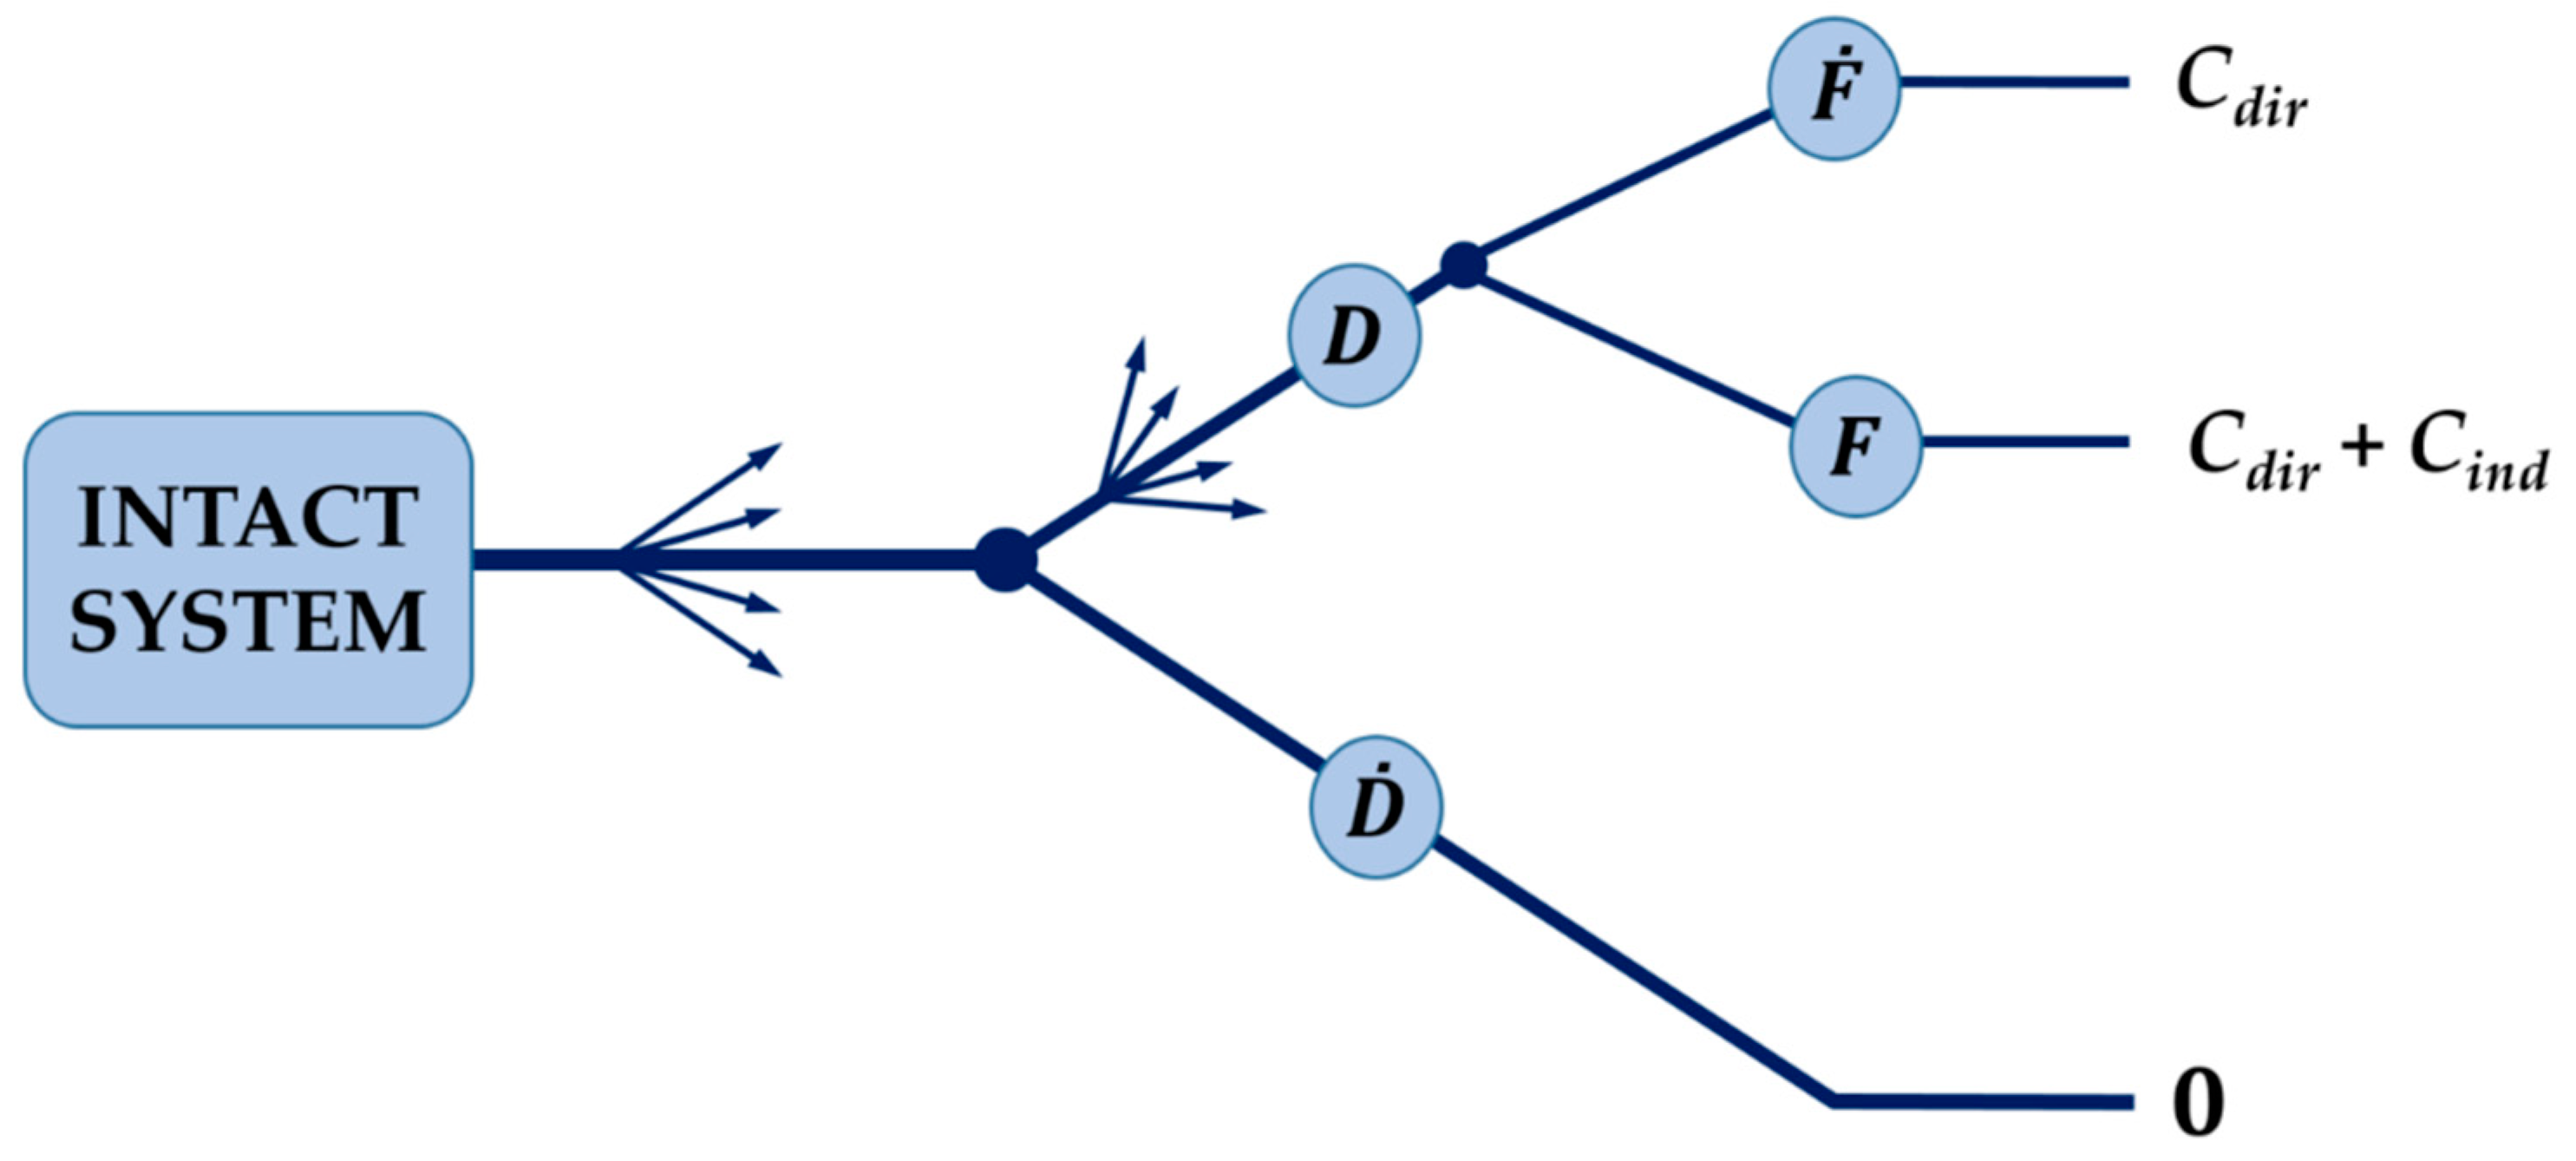
  • P[Hi], the probability of occurrence of exposure to hazard Hi,
  • P[Dj|Hi], the probability of (direct) damage Dj conditional on exposure to hazard Hi,
  • P[Sk|DjHi], the probability of systemic damage Sk conditional on the damage Dj and the exposure to hazard Hi,
  • Cdir, the direct consequences and
  • Cind, the indirect consequences
Consequently, the risk mitigation strategies should focus on reducing the hazard occurrence probabilities P[Hi], the direct damage probabilities P[Dj|Hi], the systemic damage probabilities P[Sk |Dj ∩ Hi], and the direct Cdir and indirect Cind consequences.

2.2.1. Design Scenarios

In order to achieve the risk assessment and mitigation, a typical risk management procedure applies. At first, design scenarios have to be identified and assessed. Such design scenarios can be identified across a stakeholders’ panel with respect to specific accidental actions, as well as notional (unspecified), instant or gradually developing, damage or loads. Design for specified threats requires the identification and quantification of all abnormal events that could possibly affect the structure and the resulting actions on it. In the design checks, load combination rules should reflect the low probability of concurrence of the accidental action and the design live loads, for example by appropriate partial safety factors. In case of unspecified threats, a differentiation to notional loads and notional damage scenarios facilitates the treatment of design scenarios. Notional loads can be defined as uniformly distributed static loads, applied in the most unfavorable configuration. Notional damage scenarios can include (i) notional removal scenarios, and (ii) notional deterioration scenarios. Then the analysis of the structural system can be performed considering the accidental load combination, and the structure is structurally analyzed and checked with respect to the resulting consequences. Also preliminary structural analyses can be used to identify the critical elements (e.g., columns, parts of walls, structural connections) to be notionally removed. In case of notional deterioration scenarios, the geometrical and/or material properties of one or more structural elements can be deliberately reduced in the analyses followed by additional design checks.

2.2.2. Design Strategies

Design strategies for robustness according to the robustness concepts of the fib Model Code 2020 can be divided into two types, namely direct, and indirect design methods. The method to be applied depends on the design considerations and the designer’s philosophy. Direct design methods explicitly aim to limit the effect of local failure. They require structural analyses in order to evaluate the performance of the structure for a certain damage scenario and they generally rely on either a “alternative load path” or a “consequence reduction” strategy. Given that these strategies may not prove satisfactory under some circumstances, secondary options, such as the “event control” or the “specific load resistance/key element” strategy can apply (see also [11] and [12] for a more profound elaboration of the terms). On the contrary, indirect design methods do not explicitly consider the capacity of a structure to sustain an abnormal load effect.
The alternative load path strategy explicitly considers the resistance to progressive collapse (i.e., ‘indirect’ or ‘follow-up’ failure) when the level of damage is specified. Hence, the alternative load path strategy is understood as a way of reducing the probability P[S|D ∩ H]. Measures to achieve this include the provision of redundancy and integrity or the use of ductile elements.
The consequence reduction strategy aims to limit unacceptable (disproportionate) consequences (Cind and/or P[S|D ∩ H]) resulting from the local damages D. Measures associated with the consequence reduction strategy can include the structural segmentation or compartmentalization, and changing the context of the structure.
The event control strategy consists of preventing the occurrence of a previously identified set of hazards and limiting its occurrence rate to an acceptable value. This strategy does not increase the intrinsic resistance. Measures associated with event control might include, changes in the building site or access to it, restrictions in the use of the structure, installation of warning systems; implementation of passive protective measures, but also quality management plans to prevent human errors and maintenance exercises.
The specific load resistance/key element design strategy aims at preventing or limiting the local damage D (often referred to as ‘direct damage’) caused by a certain hazard H. Therefore, the key element design strategy is a hazard-oriented approach focusing on reducing the probability P[D|H]. Key elements can be understood as structural elements and connections, which are essential to the resistance of the structure. Failure of a key element typically results in significant consequences since, in its absence, the structure is usually unable to develop adequate alternative load paths. Measures associated with specific load resistance comprise enhancing the key element’s structural properties (resistance, stiffness, ductility), and employing active or passive element isolation techniques.
Regarding indirect design methods, prescriptive instead of performance-based design rules, can provide for a resort, and these often rely on engineering judgement on each specific project. However, a very common such prescriptive rule relates to providing horizontal and/or vertical tension ties, as per Eurocode 2 [19].

2.3. Quantitative Robustness Assessment and Redundancy Performance Indicators

In parallel to the robustness design concepts discussed in the previous section, quantification of robustness can allow for an efficient decision-making process in order to decide the most adequate structure configuration or design strategy. Robustness quantification should be based on the comparison of the amount and extent of initial damage or the corresponding follow-up consequences [28,29]. Robustness metrics can be divided into the following levels with decreasing complexity:
  • Risk-based quantification based on a complete risk analysis in which the consequences are divided into direct and indirect consequences
  • Reliability based quantification derived from e.g., the reliability of the structural system in the damaged and in the undamaged situation;
  • Deterministic quantification based on structural parameters such as the load-bearing capacity, stiffness, damage energy, etc.
Verification of the performance indicators can be performed against predefined robustness criteria. An operational criterion for verification of the robustness of a structure assuming a local damage due to failure of one or several of his structural members is represented by Equation (2). This criterion is consistent with the criteria proposed in the fib Model Code 2010 [18] and it is envisaged that it will form the basis for the respective provisions of Model Code 2020 [24].
Ed(A = 0, ΔEd,col) ≤ Rd
where the combinations to be considered for the establishment of the design value of the effects of actions, Ed, refer to situations after an accidental event. In this case, an explicit accidental action not accounted for, and the accidental action may be assumed to apply on the initially affected components and leave the rest of the structure unaffected (hence A = 0). However, dynamic effects due to sudden element collapse must be taken into account when redistributing (e.g., by means of catenary action) internal forces and moments to the remaining part of the structure, ΔEd,col.

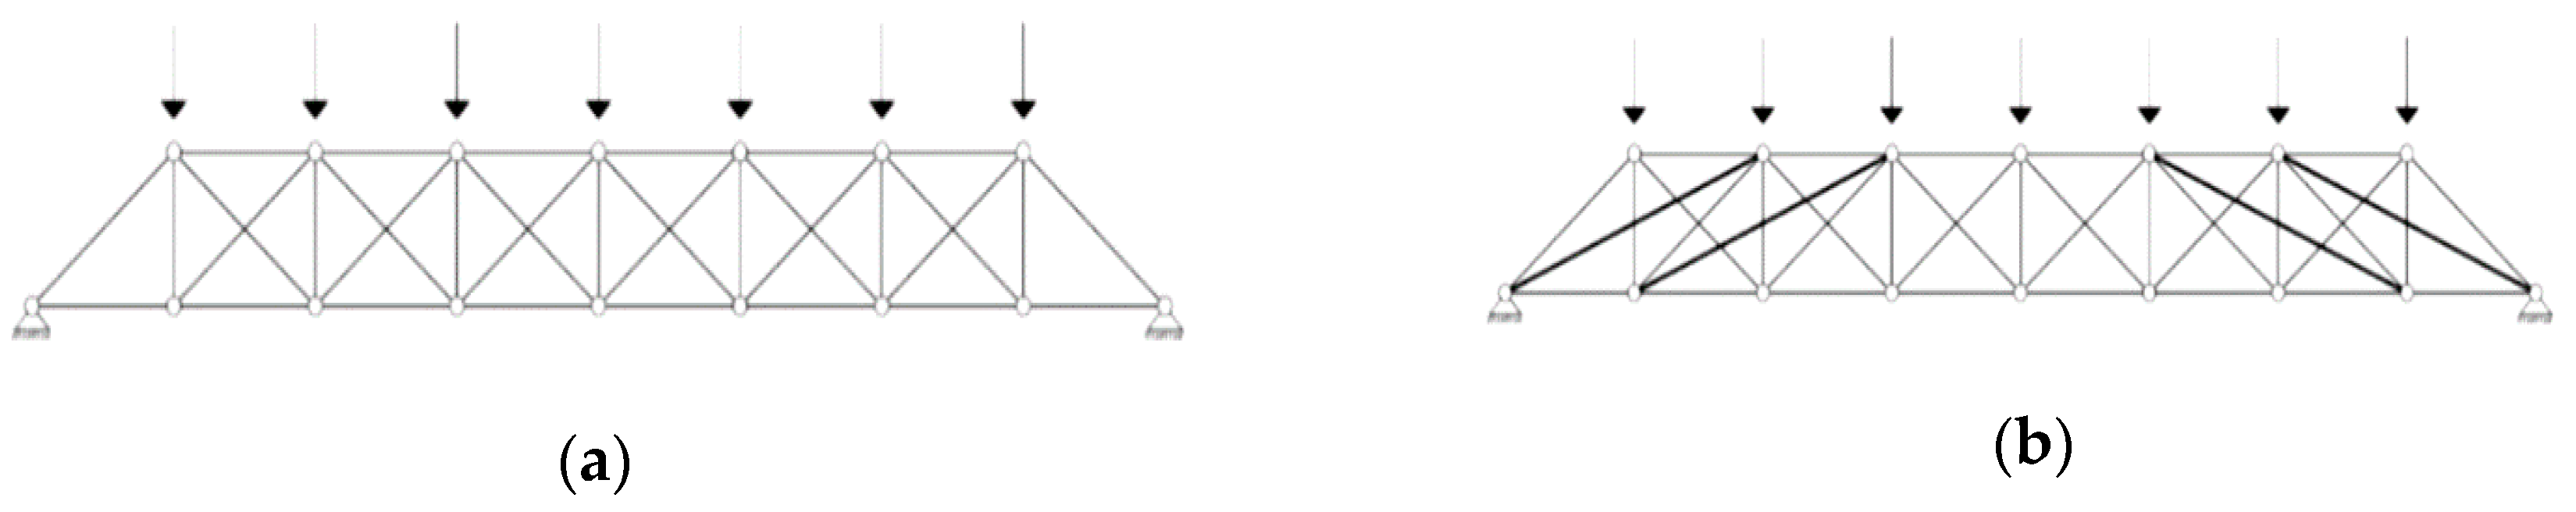
3. Implemented Methodology—Redundancy Concepts

Redundant systems are designed to provide alternative load paths, which is one of the main possible robustness design strategies discussed in the previous section. In this case, if some structural components are lost or weakened, the loads can still be redistributed within the system, and then they can be absorbed and transferred safely to the boundary or foundation. In addition, the geometric/topological configuration of a system can be expressed by redundancy indices. Redundancy indices are quantified evaluations, demonstrating how efficiently the static indeterminacy is nested in a system. They show the importance of the individual components for the global system and the interaction of these components with each other [30]. Since these indices give information about the coordination between the structural components as well as about weak points of a system, they are important for the evaluation of the robustness.
Approaches for the quantification of robustness that are proposed in international scientific literature, and noted above as quantifiable and comparable robustness measures, include the “stiffness-based robustness index”, the “probabilistic robustness index”, and the “robustness index by combined reliability and redundancy of the elements”. These approaches are presented below for truss systems, which mainly rely on redundancy in order to fulfill the required robustness criteria. A comparative implementation, and a plausibility check of each approach, is performed exemplarily on this basis.
A straightforward and computation-friendly approach is represented by the stiffness-based robustness index by [31], and similarly by [32], shown in Equation (3). det(Kdamaged) and det(Kintact) are the determinants of the stiffness matrices of the damaged and the intact structure respectively, and rii the ratio between them. In this approach, damage results in a reduction of structural capacity. In this case, the change in the structural property cumulative “system stiffness” is measured. The ratio of the determinants of the stiffness matrices in the damaged and intact state can be conceived as the redundancy part of the failed component. The index takes values between zero and one, and it increases for higher degrees of robustness, i.e., if the system stiffness remains at its full level after a failure, the failed component has no influence on the system behavior.
From this perspective, the stiffness of a structural system decreases most when the component with the lowest redundancy rate fails. In statically determined systems, the index disappears after any failure, because the global stiffness is no longer given (instability). For comparison, two statically indeterminate systems are presented in Figure 1, where the system on the right poses a higher robustness due to a higher number of (theoretically redundant) components as compared to the system on the left.
A consideration regarding this index, is that it defines robustness based only on the structure characteristics and ignoring the loading situation and load redistribution within the system. It can serve toward a comparison of some general systems, assuming the load effects are identical and linear, but it may exhibit limitations in realistically describing robustness. In order to ensure the load dependency, the ratios (λ) before and after a failure can also be used (reaction-based measurements), as seen in Equations (4) and (5). Equation (4) is based on a utilization factor (η), which defines the ration of the actual over the failing force (or stress) in each component, and it may be understood as an index related to the Ultimate Limit State. The utilization factor in Equation (5) refers to the ratio of actual over permissible deformation; it may be related to a Serviceability Limit State.
ρ s t i f f n e s s = m i n [   d e t ( K d a m a g e d ) d e t ( K i n t a c t )   ] = min   [ r i i ]
λ η = η   ( d a m a g e d ) η   ( i n t a c t )
λ w = w   ( d a m a g e d ) w   ( i n t a c t )
The probabilistic robustness index is formed by the ratio of the failure probability of the intact pf(intact) and the damaged pf(damaged) structure [33], as proposed in Equation (6). Values between zero and infinity result, whereby lower values result in a higher degree of robustness. By definition, robustness is characterized by the fact that initial and local damage does not significantly affect the system structural reliability. To determine this index, a probabilistic analysis can be performed, with the system’s input parameters such as material strength, cross-section and loads translated to stochastic variables, in order to account for the influence of variabilities and uncertainties on the damage scenaria. Specifically the loads can be random sets for different design situations. The failure probabilities can be alternatively derived through expert judgement elicitations, e.g., in the form of an expert panel Delphi process or a risk management workshop, of course with the respective compromise in the accuracy of quantifiable results.
This is an appropriate reliability method for the assessment of a system’s overall robustness, and it can be implemented in a strategic decision-making procedure notwithstanding consistency with current design and reliability standards, nor industry practice in general. However, this procedure entails substantial computational effort and a sound variability modelling, a good collection of supporting data, and expertise at technical level.
ρ p r o b = p f   ( d a m a g e d )       p f   ( i n t a c t ) p f   ( i n t a c t )   =   p f   ( d a m a g e d ) p f   ( i n t a c t ) 1
The possibility of formulating a risk-based robustness index (see Equation (7)) should also be mentioned at this instance. This relies on the consideration of the possible consequences of progressive damage, with the classical definition [Risk] = [Probability of occurrence] × [Consequence]. The index lies between zero and one and is composed of the ratio between the direct risk Rdir and the total risk R = Rdir + Rind. A higher degree of robustness is represented by an increasing index. Should the index have a value of one, would imply that the support structure in question is absolutely robust, and no damage propagation takes place. In this case, no indirect risk Rind is generated from local damage (e.g., failure of a strut in a truss system). If, however, the indirect risk Rind increases disproportionately in relation to the initial damage, the index tends towards zero. A risk is formed from the product of the probability of damage and the resulting consequences, such as economic losses. Direct risk and the risks are calculated through Equations (8) and (9), in accordance with the formulation of Equation (1) (see also [26]).
ρ r i s k = R d i r R d i r +   R i n d = 1 1 +   R i n d R d i r
R d i r = i j   C d i r ,     i j   P ( D j | E j )   P ( E i )
R i n d = k i j   C i n d ,     i j k   P ( S k | D j E j )   P ( D j | E j )   P ( E i )
As seen in Figure 2, in the event of a threat, the system remains either in an undamaged state (no consequences) or in a damaged state D, with the ensuing direct consequences Cdir.
Any damage that occurs in the further course of the event will either lead to the final failure of the support system due to lack of robustness with the resulting indirect consequences Cind or the support system is able to withstand the damage progress F. In this case, the damage is limited to the direct consequences that are directly related to the exposure.
Based on [21,30], a robustness index is proposed, which accounts for the individual contributions to redundancy by the system components and for their failure probabilities. It can be understood as a robustness index by combination of the structural reliability and the redundancy degree of the structural components. As seen in the definition of the index in Equation (10), the reliability of the individual truss elements (βi) is estimated and combined with their redundancy components (rii). The reliability indices (βi) participate though their function Φ, which is the standard normal probability function, and the expression Φ(−βi) can be assumed to express the element’s failure probability. This approach implicitly accounts for the influence of the degree of indeterminacy on the assessment of structural robustness, i.e., by assigning a contribution to each component according to their redundancy. The definition of static indeterminacy is given in Equation (11), where a is the number of external reactions, p the number of solid components, and k the number of nodes (it is noted that this definition is valid for “classic” trussed structures only, i.e., trusses with hinges at every nodes, without continuous chords). The sum of the individual redundancy contributions sums up to the total system indeterminacy f. Based on this index, the influences from the correlation between the elements (non-diagonal entries of a redundancy matrix e.g., in a truss system) remain dissociated, although, for a sensible evaluation of the robustness, these influences should be regarded. On the example of a truss system, it is clear that the structural system consists of a certain number of interrelated linear components, whereas the non-diagonal entries of the redundancy matrix reflect the influence of a localized failure on the adjacent components:
ρ r e d u n d a n c y = i = 1 n r i i ( 1 Φ ( β i ) ) i = 1 n ( 1 r i i )
f = a + p − 3k

4. Case Studies of Computations of Robustness Performance Indicators

In order to examine the plausibility of the presented robustness concept and redundancy estimates, the proposed performance indicators are computed by use of a custom-made linear Finite Element Model (FEM) and calculation algorithm. The details of the structural analysis are presented in [34] and an overview of the probabilistic procedure is given in [35], and the flow-chart in Figure 3.
To that end, typical truss systems with comparable configurations are selected to accommodate the assessment of their general structural response and their performance indicators.
Figure 4 presents the selected two-layer truss systems. They are supported at both ends in both directions. Variant 1 consists of 25 bars, which are connected to each other at 13 nodes. Equation (8) results in an external static indeterminacy of fVar.1 = 8. In Variant 2, one node is omitted and additional diagonal elements are arranged in the upper field area. This change increases the degree of external static indeterminacy by one degree (fVar.2 = 9). In both variants, all bars are assumed to consist of a uniform cross-section QRO 80 × 6.3 and material S355 (EA = 176,400 kN, Iy = Iz = 62.3 cm4). The elements are assumed without flexural stiffness, and stability for compression members is taken into account according to EN 1993-1-1 [36,37]. Some further case studies for deterministic and probabilistic case studies in the context of the investigations presented herein can be found in [38].
The deformation behavior of both systems in case of successively occurring failures is juxtaposed in Figure 5.
The member with the highest degree of utilization fails first. After redistribution of the loads, the next member exposed to the highest stress fails. This process is continued until the systems can no longer accommodate the loads, due to instability. The computation is carried on while retaining the original loads. Any load or resistance adjustments to account for dynamic effects of sudden load redistribution, or fracture propagation are not considered in this case. The deformed shapes indicate that variant 1 obtains a significant vertical deformation on one side after the 3rd component loss. Variant 2, on the other hand, deforms gradually and almost symmetrically. Table 1 shows the deformations and utilization ratios at each step; each step corresponds to a subsequent component loss. Figure 6 indicates the development of the maximum deformations graphically for the two variants.
Up to three component failures, no instabilities can be detected, yet afterwards variant 2 shows significantly lower deformation increases (steep course of the graph). If the deformations and degrees of utilization are compared for a loss of five members, the reaction-based indices for variant 2 show a lower increase. The reaction-based measurements (λ) per Equation (4) are shown to exhibit plausible robustness assessments, since variant 2 achieves more favorable (lower) indices. The values for system deformations (w) and utilization ratios (η) as derived from the structural analysis are provided in Table 1:
λ w , V a r 1 = w   ( d a m a g e ) w   ( i n t a c t ) =   125.6 4.8 = 26.2 > λ w , V a r 2 = w   ( d a m a g e ) w   ( i n t a c t ) =   35.6 8.2 = 4.3
λ η , V a r 1 = η   ( d a m a g e ) η   ( i n t a c t ) = 2.54 0.55 = 4.6 > λ η , V a r 2 = η   ( d a m a g e ) η   ( i n t a c t ) = 1.23 0.72 = 1.7
To determine the stiffness-based robustness indices, the ratios of the determinants of the global stiffness matrices in the damaged and intact state are generated. As seen in the calculation below per Equation (3), there is a rather small difference between the two variants, because both systems have a low degree of static indeterminacy and several members with significantly low redundancies. This index only considers the weak points of a system and it is narrowly defined.
ρstiffness,Var1 = 0.028 < ρstiffness,Var2 = 0.076
The probabilistic robustness index can be formulated by comparing the failure probability of the damaged system with that of the intact system as shown in Equations (15)–(20). All possible failure paths must be determined in advance. Herein only those cases are considered, in which the truss systems initially lose only one component randomly, without a utilization criterion. The failure then progresses the most stressed members consequently. In order to demonstrate the computation of the probabilistic indices, the failure probability of a member is assumed to be 10−2. Based on this assumption and assuming independent failure probabilities for each member, the probabilistic redundancy indices for Variants 1 and 2 are calculated below. Final system failure occurs as soon as the instability limit is reached, based on the static indeterminacy calculation (i.e., at loss of one element after reaching static determinacy and transformation of the system to a mechanism). The possible failure paths for the intact and damaged systems are plotted below in Figure 7 for variant 1, and Figure 8 for variant 2.
The failure probabilities can then be calculated from the root-to-leave event trees. Inversely, the failure paths can be identified by following the failing member numbers from bottom to top. The most critical or high-sensitivity elements are identified as those that belong to the shortest failure paths, as for example the diagonal elements 25 and 26 for Variant 1.
The probability evaluation discloses that the probabilistic robustness indices of both variants are of very similar values. Variant 2 achieves a somewhat more favorable value. Due to the higher total redundancy, and the failure path lengths are somewhat longer compared to the variant 1. This is also the case in damaged state. The paths with the shortest (critical) lengths significantly influence the probability of a system failure, and they indicate the critical components for robustness. Contributions of most other paths in the event tree have negligible influence.
With truss variant 1, the girders at the load introduction points are at risk as soon as diagonal elements 25 and 26 (lowest redundancy components) fail. The redistribution of loads is only local. Therefore, the adjacent components (struts 5 and 19) are subsequently exposed to the highest load level. By failure of these components, the system comprising these components will collapse totally. Although the truss does not collapse as a whole without these components in place, the system functionality is no longer available due to the lack of load transfer capacity. Variant 2, however, allows for a better spread of the load at more locations. Hence, the failure paths are significantly longer.
Still, the proportionality between the failure probabilities in the damaged and the intact state is quite close for both systems, because the path lengths in the damaged state are shortened by one strand on average, a robustness quality which is not captured by the probabilistic robustness index. The probabilistic index does not allow for an entirely rational characterization of the systems, at least at comparative level, if the failure path lengths in the systems differ significantly.
Variant 1:
pf(intact) = 2 × (10−2)2 + 6 × (10−2)6 + 12 × (10−2)7 + 6 × (10−2)8 = 2.00 × 10⁻⁴
pf(damage) = 2 × (10−2)1 + 4 × (10−2)5 + 12 × (10−2)6 + 7 × (10−2)7 = 2.00 × 10⁻²
ρ prob   =   p f   ( damage ) p f   ( intact )     1   =   2.00   × 10 2 2.00   × 10 4 1   =   99.0
Variant 2:
pf(intact) = 6 × (10−2)7 + 8 × (10−2)8 + 11 × (10−2)9 = 6.08 × 10⁻¹⁴
pf(damage) = 6 × (10−2)6 + 7 × (10−2)8 + 11 × (10−2)9 = 6.00 × 10⁻¹²
ρ prob   =   p f   ( damage ) p f   ( intact )     1   =   6.00   ×   10 12 6.08   ×   10 14 1   =   97.68
In order to compute the combined redundancy and reliability based robustness index, the redundancy factor rii of each individual truss member (the ratio between the determinants of stiffness matrices and a respective reliability index are needed, as seen from Equations (21)–(26)). These values are plotted in Table 2 and Table 3 for each truss member.
Compared to the deterministic and the probabilistic approaches noted above, this index provides a more comprehensive description of uncertainty, because the structural robustness is evaluated as a smeared quality over all bars (evaluation of the overall structure), with their individual contributions to the system’s redundancy. This index can strongly be controlled by the member’s reliability level. Hence, an intervention strategy can be planned in a performance-based design framework by improving the member reliability profile, e.g., through non-destructive testing and structural health monitoring. In the example below, the components’ reliability index is assumed to be β = 4.75 equally for all members. This leads to (1 − Φ(−βi)) ≈ 1 and this term can be neglected in the calculation per Equations (23) and (26). As it can be seen from the computations, the robustness advantage of variant 2 is reflected by the respective robustness indicator:
Variant 1:
i = 1 26 r i i   =   8
i = 1 26 ( 1 r i i )   =   18
ρredundancy,Var1 = 8/18 = 0.44
Variant 2:
i = 1 24 r i i   =   9
i = 1 24 ( 1 r i i )   =   16
ρredundancy,Var2 = 9/16 = 0.56

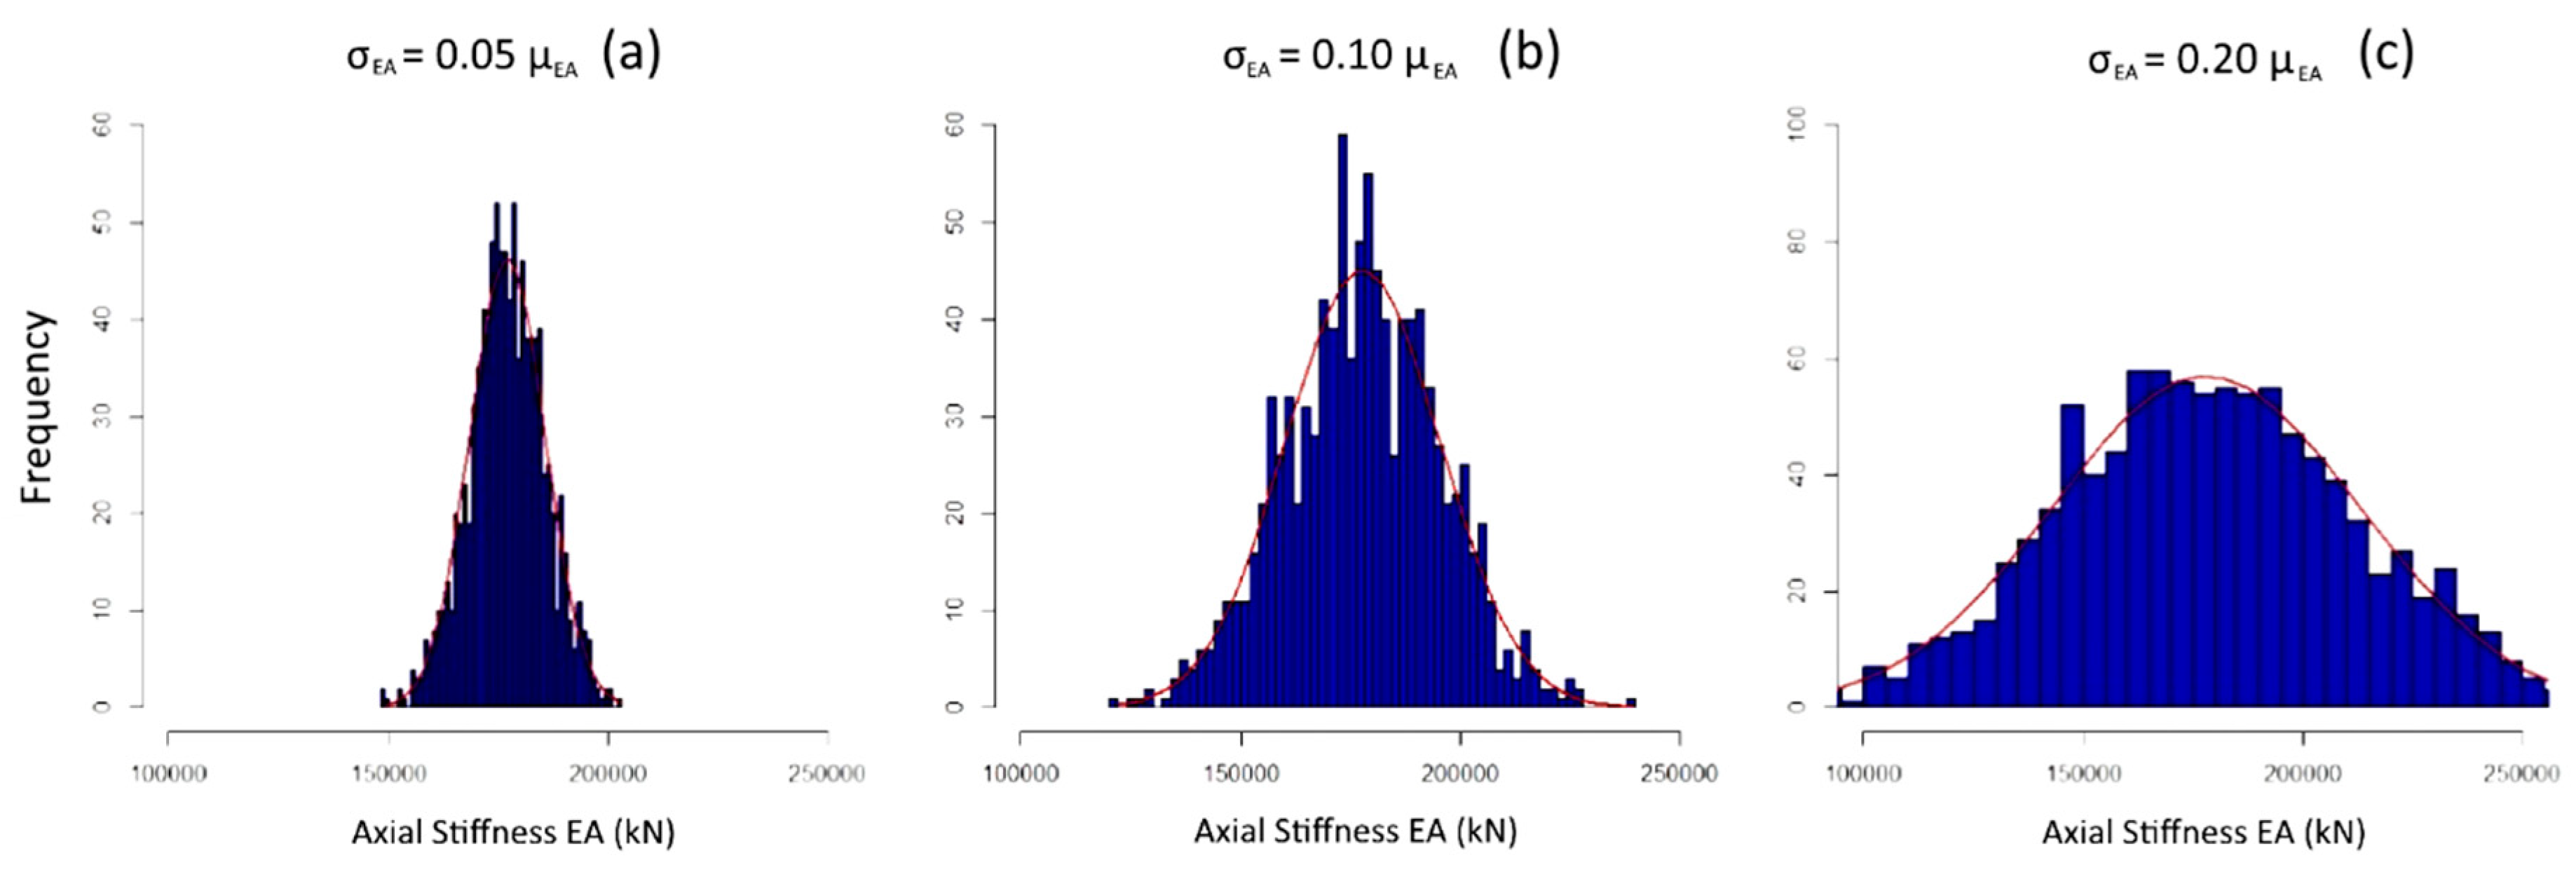
5. Probabilistic Elaborations

As discussed above, the influence of uncertainties and randomness needs to be adequately elaborated for a real-life robustness assessment, for systems with redundancies. In addition to the geometrical-topological structure, load conditions, load combinations and load application points, the stresses in the members of a statically indeterminate system are also influenced by the distribution of the member stiffness, as component stiffness plays a role in the load allocation within the system. Material degradation (e.g., corrosion) and localized damage (e.g., fatigue cracking) may also mean that the desired or planned properties are no longer retained. The weakening of certain components can then entirely change the load pattern in the components. In the extreme cases, the respective component can be considered as completely failed, in line with the procedures discussed in the previous section.
Under these considerations, a method for robustness assessment was developed and implemented with a probabilistic analysis of the developed FEM program. In this case, the influence of the axial stiffness variability on the robustness behavior can be considered. To perform the analyses and examine the sensitivity of a system to varying input variables on the resistance side, the axial stiffness is transformed to a normally distributed random variable. Although this theoretical and simplified probabilistic distribution does not guarantee positive values of the uncertain axial stiffness, it is additionally checked in the sample that all values are non-negative, and that the sample is at sufficiently distance to the coordinate origins. Using a randomly distributed axial stiffness by use of the Monte Carlo method, the FEMs are calculated iteratively and the results are statistically interpreted and evaluated using scatter distributions and probabilistic terms. The investigated system successively loses the most stressed members until system stability is achieved. Due to the variability of the material parameters, different sequences of failure events can occur. After each component loss, the results, such as global deformations with different distribution of the input variables, are obtained as distributed values. The distribution of the system deformations represents the uncertainties in the results. For sensitive systems, the largest deformations that deviate significantly from the expected value are decisive. The uncertainties result from certain failure paths, which can be inversely calculated. Consequently, the critical elements can be determined from these paths and treated in a redesign or strengthening, as well as a health monitoring and strategic maintenance plan.
In order to illustrate this approach, an example is computed for variant 1 of the previous Section herein. All members of the 8-fold statically indeterminate truss system are assigned a mean axial stiffness of μEA,Var1 = 1.764 × 10⁵ kN, with a range of possible coefficients of variations (5%, 10%, and 15%—see also Figure 9), which constitutes the stochastic model’s random variables. The standard deviations (σEA) in particular are:
  • σEA,Var1(5%) = 0.05 × 176,400 = 8820 kN (Coefficient of variation = 5%)
  • σEA,Var1(10%) = 0.10 × 176,400 = 17,640 kN (Coefficient of variation = 10%)
  • σEA,Var1(15%) = 0.20 × 176,400 = 35,280 kN (Coefficient of variation = 20%)
Figure 9. Probabilistic distributions of the strain stiffness EA with the variability 5% (a), 10% (b) and 20% (c). The red line represents the best-fit theoretical distribution function.
Buildings 10 00213 g009
A probabilistic elaboration requires a large number of calculations to adequately capture the quantified probability distributions of the results, moreover with emphasis on the tail variable. In this example, a thousand analysis repetitions were performed by a MATLAB operator, and they were linked directly to the custom-made FEM program built for this study. Each iteration is programmed to run until the system stability is eliminated. In the present case, this occurs generally after loss of four members. The distributions gained from this procedure are shown in the histograms of Figure 10.
Figure 10 presents the variation of the system deformations, in terms of probabilistic distributions in (mm). In the intact system, this shows that a variation of 5% has minor influence on the system behaviour with a coefficient of variation of 0.014. This becomes 0.026 and 0.048 for an input variation of 10% and 20% respectively, i.e., the change in input uncertainty is proportionally transferred to the output variation.
However, as failed elements increase, considerable differences in the deformations can be observed, with the deviations being multiple to the expected deformation value. In the base case of deterministic elongation stiffness, a deflection of approx. 10 mm is anticipated after the failure of three components. However, a randomly distributed axial stiffness with a dispersion of 10% or 20% causes a different sequence of failure events, which are associated with significantly larger deflections. The respective failure paths can be used to locate the critical elements. Critical elements in this case are the diagonals 2 and 22, since these stimulate weakening of the system on the entire side, with the following process: At the beginning, one of the struts 25 or 26 fails. Due to a possibly adverse axial stiffness distribution in the system, instead of symmetrical failure on the opposite side, the tensioned element 2 or 22 on the same side as the previously failed component is subjected to the highest load. If this component fails, only components 4 or 24, respectively, remain capable of ensuring continuation of the load transfer system. After failure of these elements, the system acts as a cantilever supported on the two hinges on either the right or the left side, and the vertical deformations are significantly higher, than in a damaged system which still acts as supported no both sides.
Furthermore, a positive skewness is observed in Figure 9 for increasing variabilities and damage degrees. This indicates the tendency of the system to develop cases of excessive deformations, due to altering failure modes. This is also linked to the emergence of alternative, weak critical paths, and it is an additional indicator of progressive collapses. The shape and multi modal distribution of frequencies is also a criterion for significant loss of stability. Hence it is becoming evident that higher uncertainty in the structural properties (e.g., coefficients of variation 0.10 and 0.20 for the axial stiffness) does not only lead to a higher variation in the response but to a multiplication of possible failure paths. This in turn allows extreme control values (herein deformations) to appear in the system’s possible responses. In the histograms, the uncertainties are represented as the largest values in terms of deformations. These “outliers” result from certain failure paths which significantly reduce the system stiffness of the truss system.

6. Discussion and Conclusions

This study addresses specific methodologies to evaluate the robustness of structures with multiple redundant components, such as truss structures. State-of-the-art concepts for structural robustness are initially presented, where redundancy as a factor of robustness is disclosed. Furthermore, significant approaches for the quantification of robustness from international scientific literature are described. These include the stiffness-based robustness index, the probabilistic robustness index, and the robustness index by combined reliability and redundancy of the elements. These approaches are showcased for truss systems, which mainly rely on redundancy in order to fulfill the required robustness criteria. The examples are solved in a custom-made program which allows the automated computation of the various geometries and robustness measures. A comparative implementation, and a plausibility check of each approach, is performed on the basis of quantifiable indices and event trees, and the strengths and weaknesses of each method are made evident. Finally, one of the showcases systems is elaborated probabilistically by use of the Monte Carlo method and the developed FEM program, which discloses the importance of quantifying variabilities and uncertainties in regards to system robustness. From the investigations, the following conclusions can be drawn:
  • Robustness is a multifaceted discipline. Although basic principles can apply globally, the redundancy aspect of robustness is de facto crucial for multi-component systems. Without excluding a different possibility, this study has managed to treat truss systems with tools and methodologies that are customized for only these certain types of structures. The definition of individual members and the assessment with the stiffness- and the redundancy-based robustness indices presented in Equations (3) and (7), can become more intricate in case of monolithic or composite structures, as it requires separate treatment of the connection details.
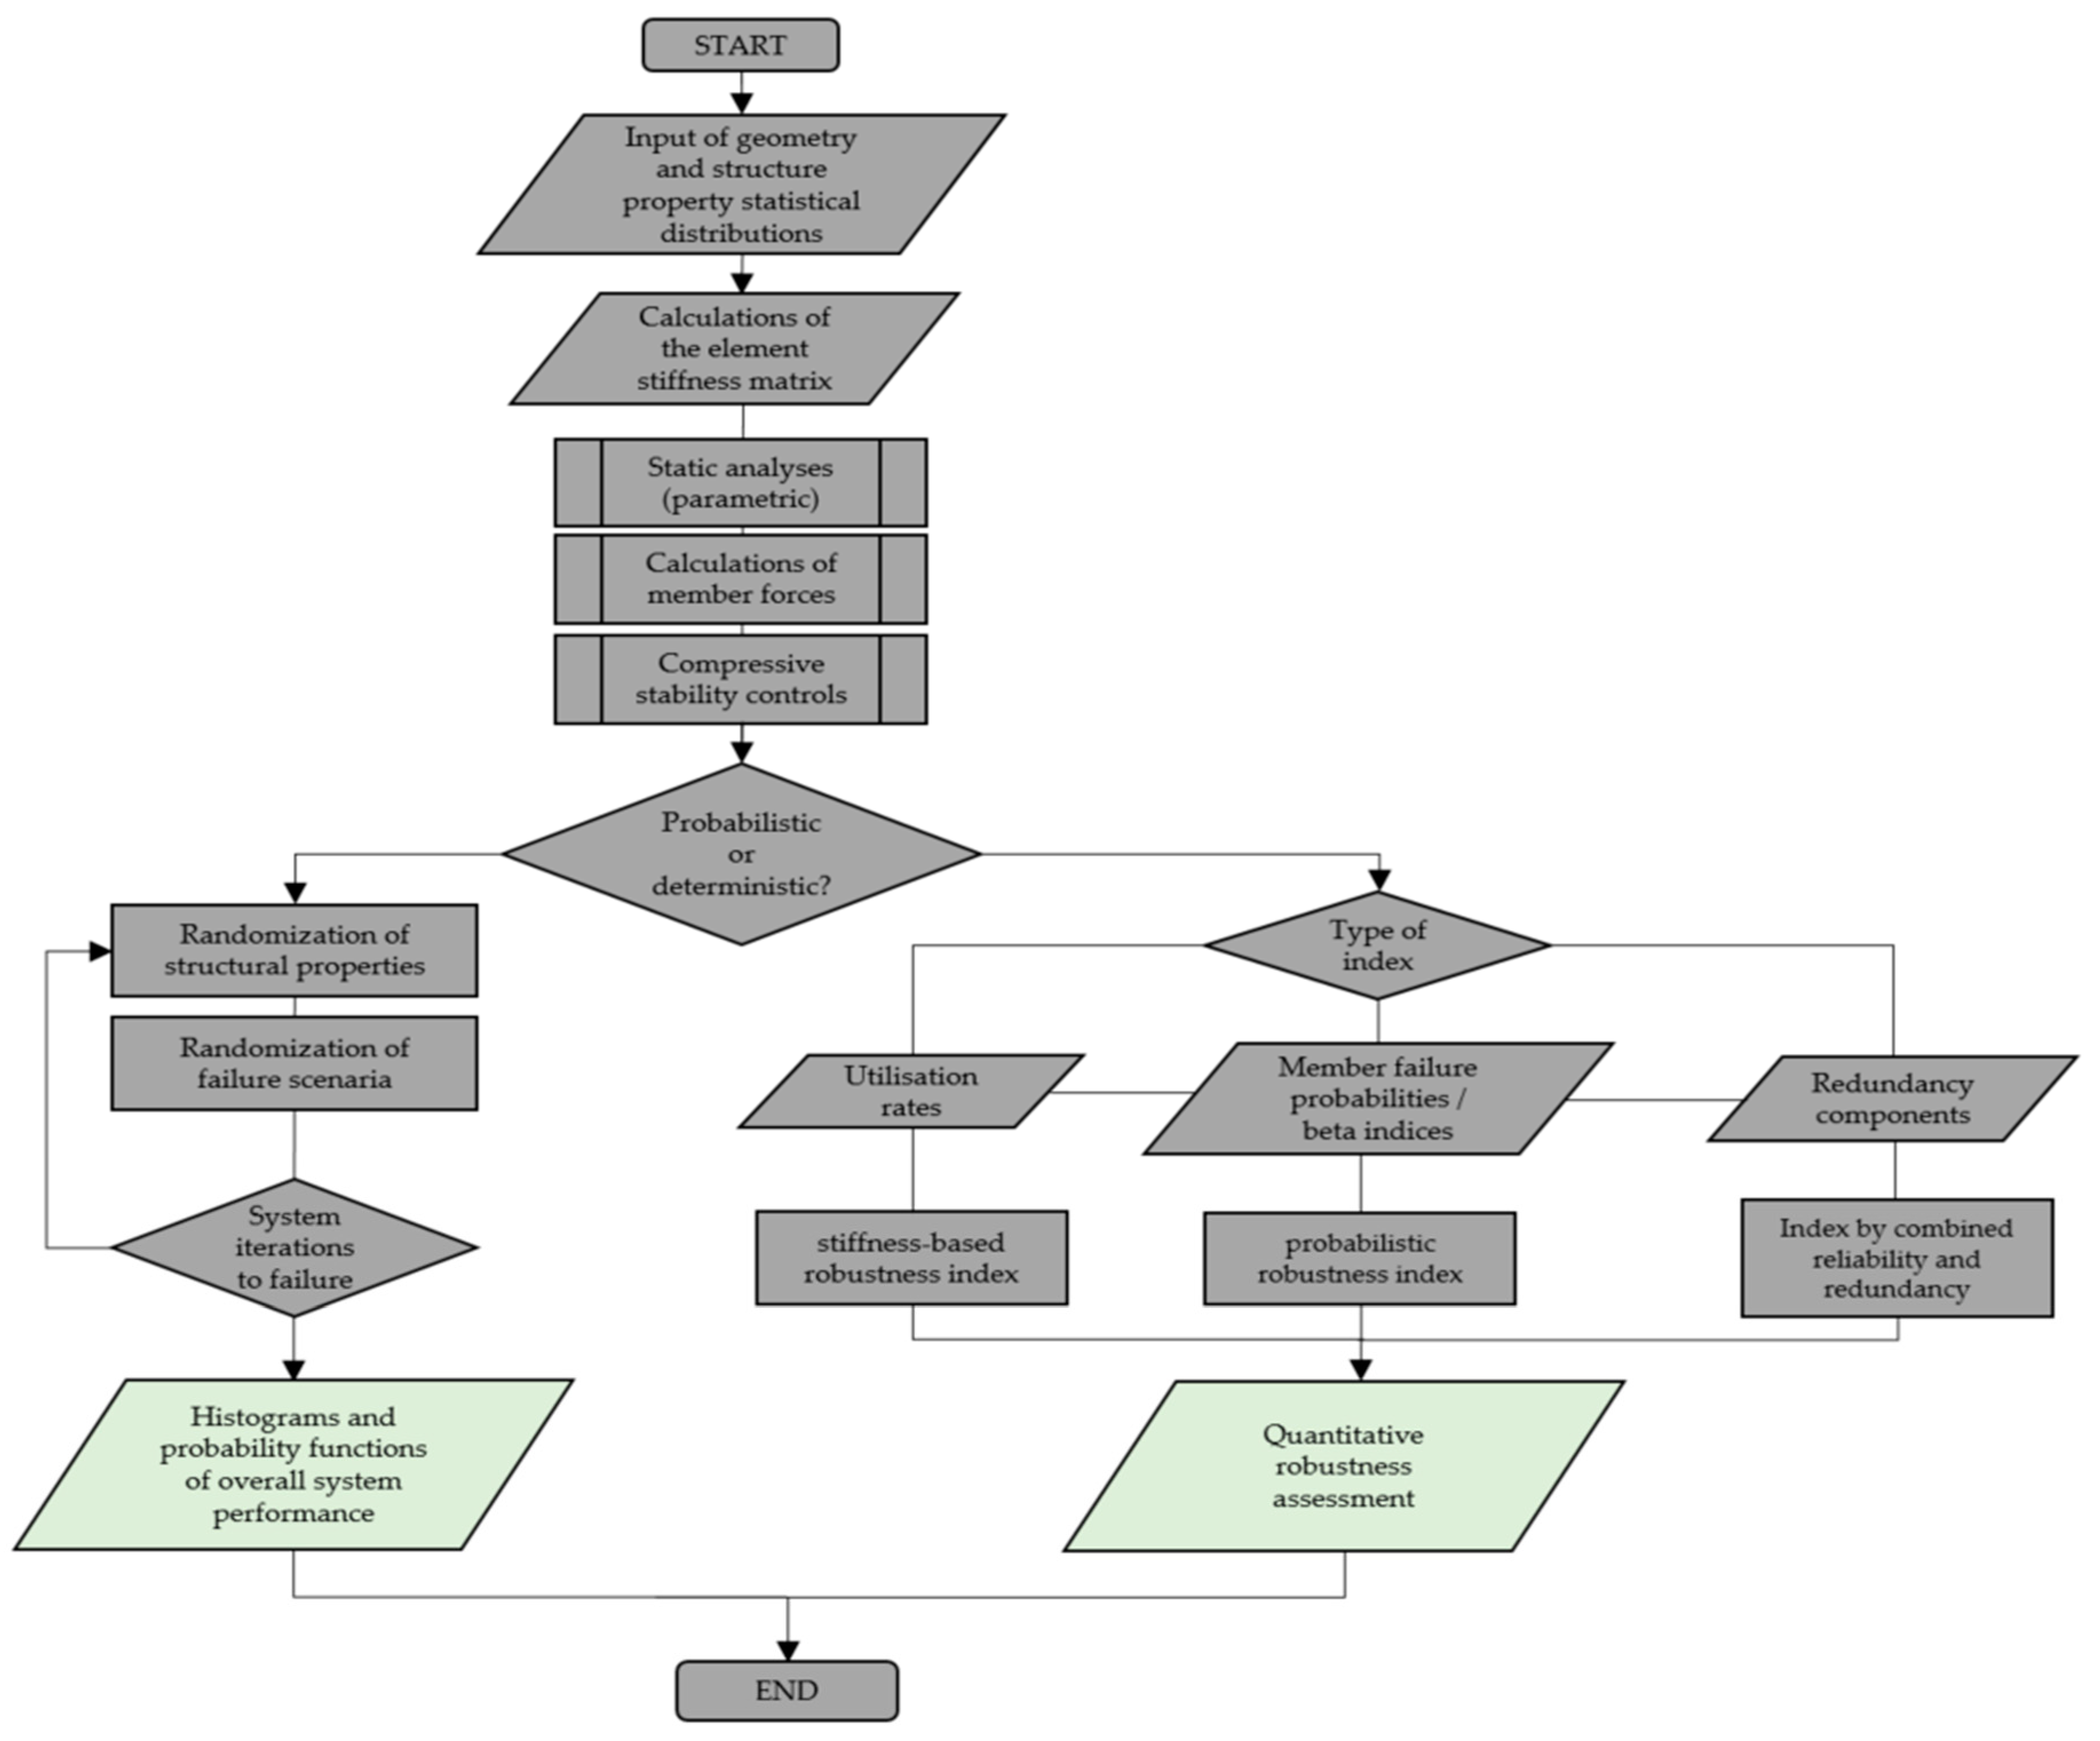
  • Quantification of the robustness can be translated to performance indicators, which can be computed and measured for individual structures. These can then be used in a life-cycle engineering approach by relating these performance indicators to performance criteria for progressive collapse. Furthermore, it is feasible to link these performance indicators with actual risks, with which structure stakeholders are typically concerned, as opposed to prescriptive structural characteristics. These performance indicators can in turn be associated with the condition assessment at section or member level. In the case of the probabilistic robustness index, the failure probability of a single member can be directly included in the calculations, as demonstrated in Equations (11) and (12). In the case of the stiffness-based index, a recalculation of the entire system with the altered or degraded parameters in one or more members needs to be carried out, as shown in Equation (10). For the robustness index by combined reliability and redundancy of the elements, both a member failure probability and a structural reanalysis of the system is integrated (see Equations (13) and (14), and Table 2).
  • All the discussed robustness performance indicators are plausible. However, they are not necessarily equally beneficial to robustness assessment. As the degree of information involved with the assessment decreases, the indicators become generic, and they may fail to reveal the order of differences in the robustness of compared solutions or systems. The most useful index out of the ones evaluated is the robustness index by combined reliability and redundancy of the elements, since it accounts for a combined contribution of individual components on redundancy, and the individual components’ safety and reliability (see Equations (13) and (14), and Table 2). This indicates that this index is a more comprehensive representation of the system’s performance and it allows for a sensible measure to the system’s global safety and reliability assessment. Furthermore, it is seen that the probabilistic robustness indices in the examined truss variants have a very small difference in numerical value (99.0 and 97.68 for Variant 1 and 2 respectively), while it is clear from the calculations that the actual probability of failure of Variant 1 is several orders of magnitude higher to that of Variant 1. Based on this example, it is evident that the probabilistic robustness index does not always facilitate a decision process.
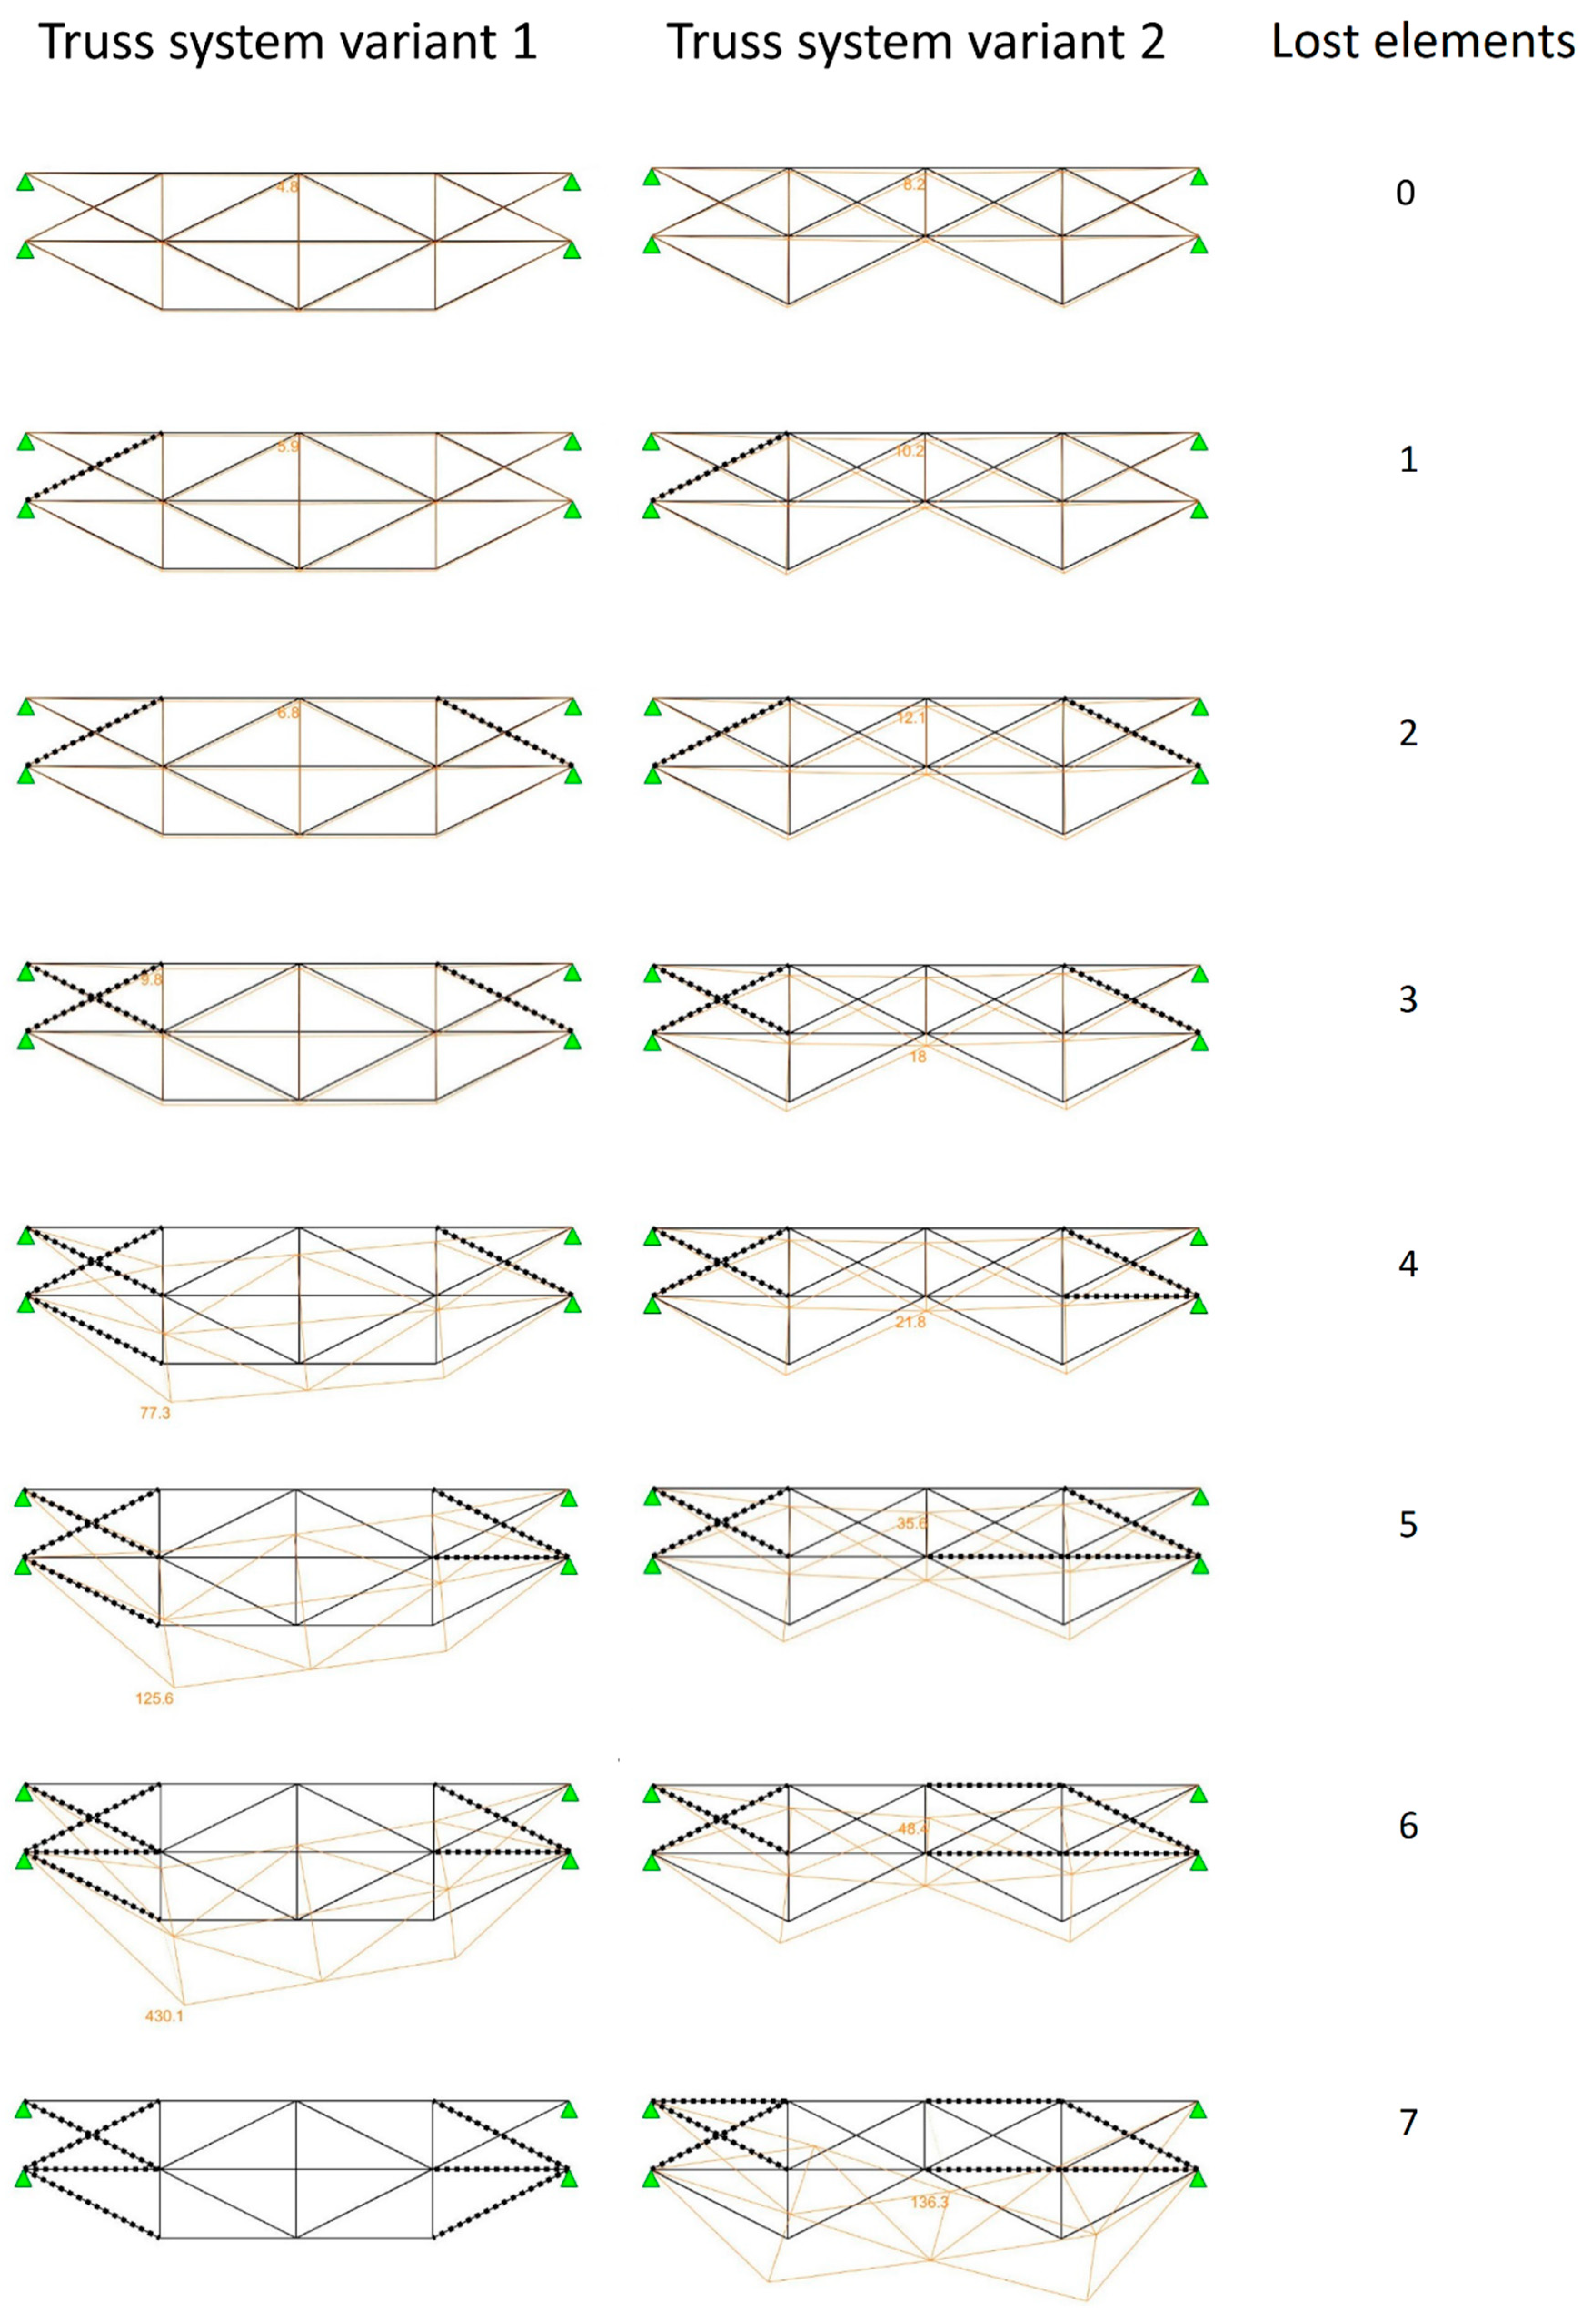
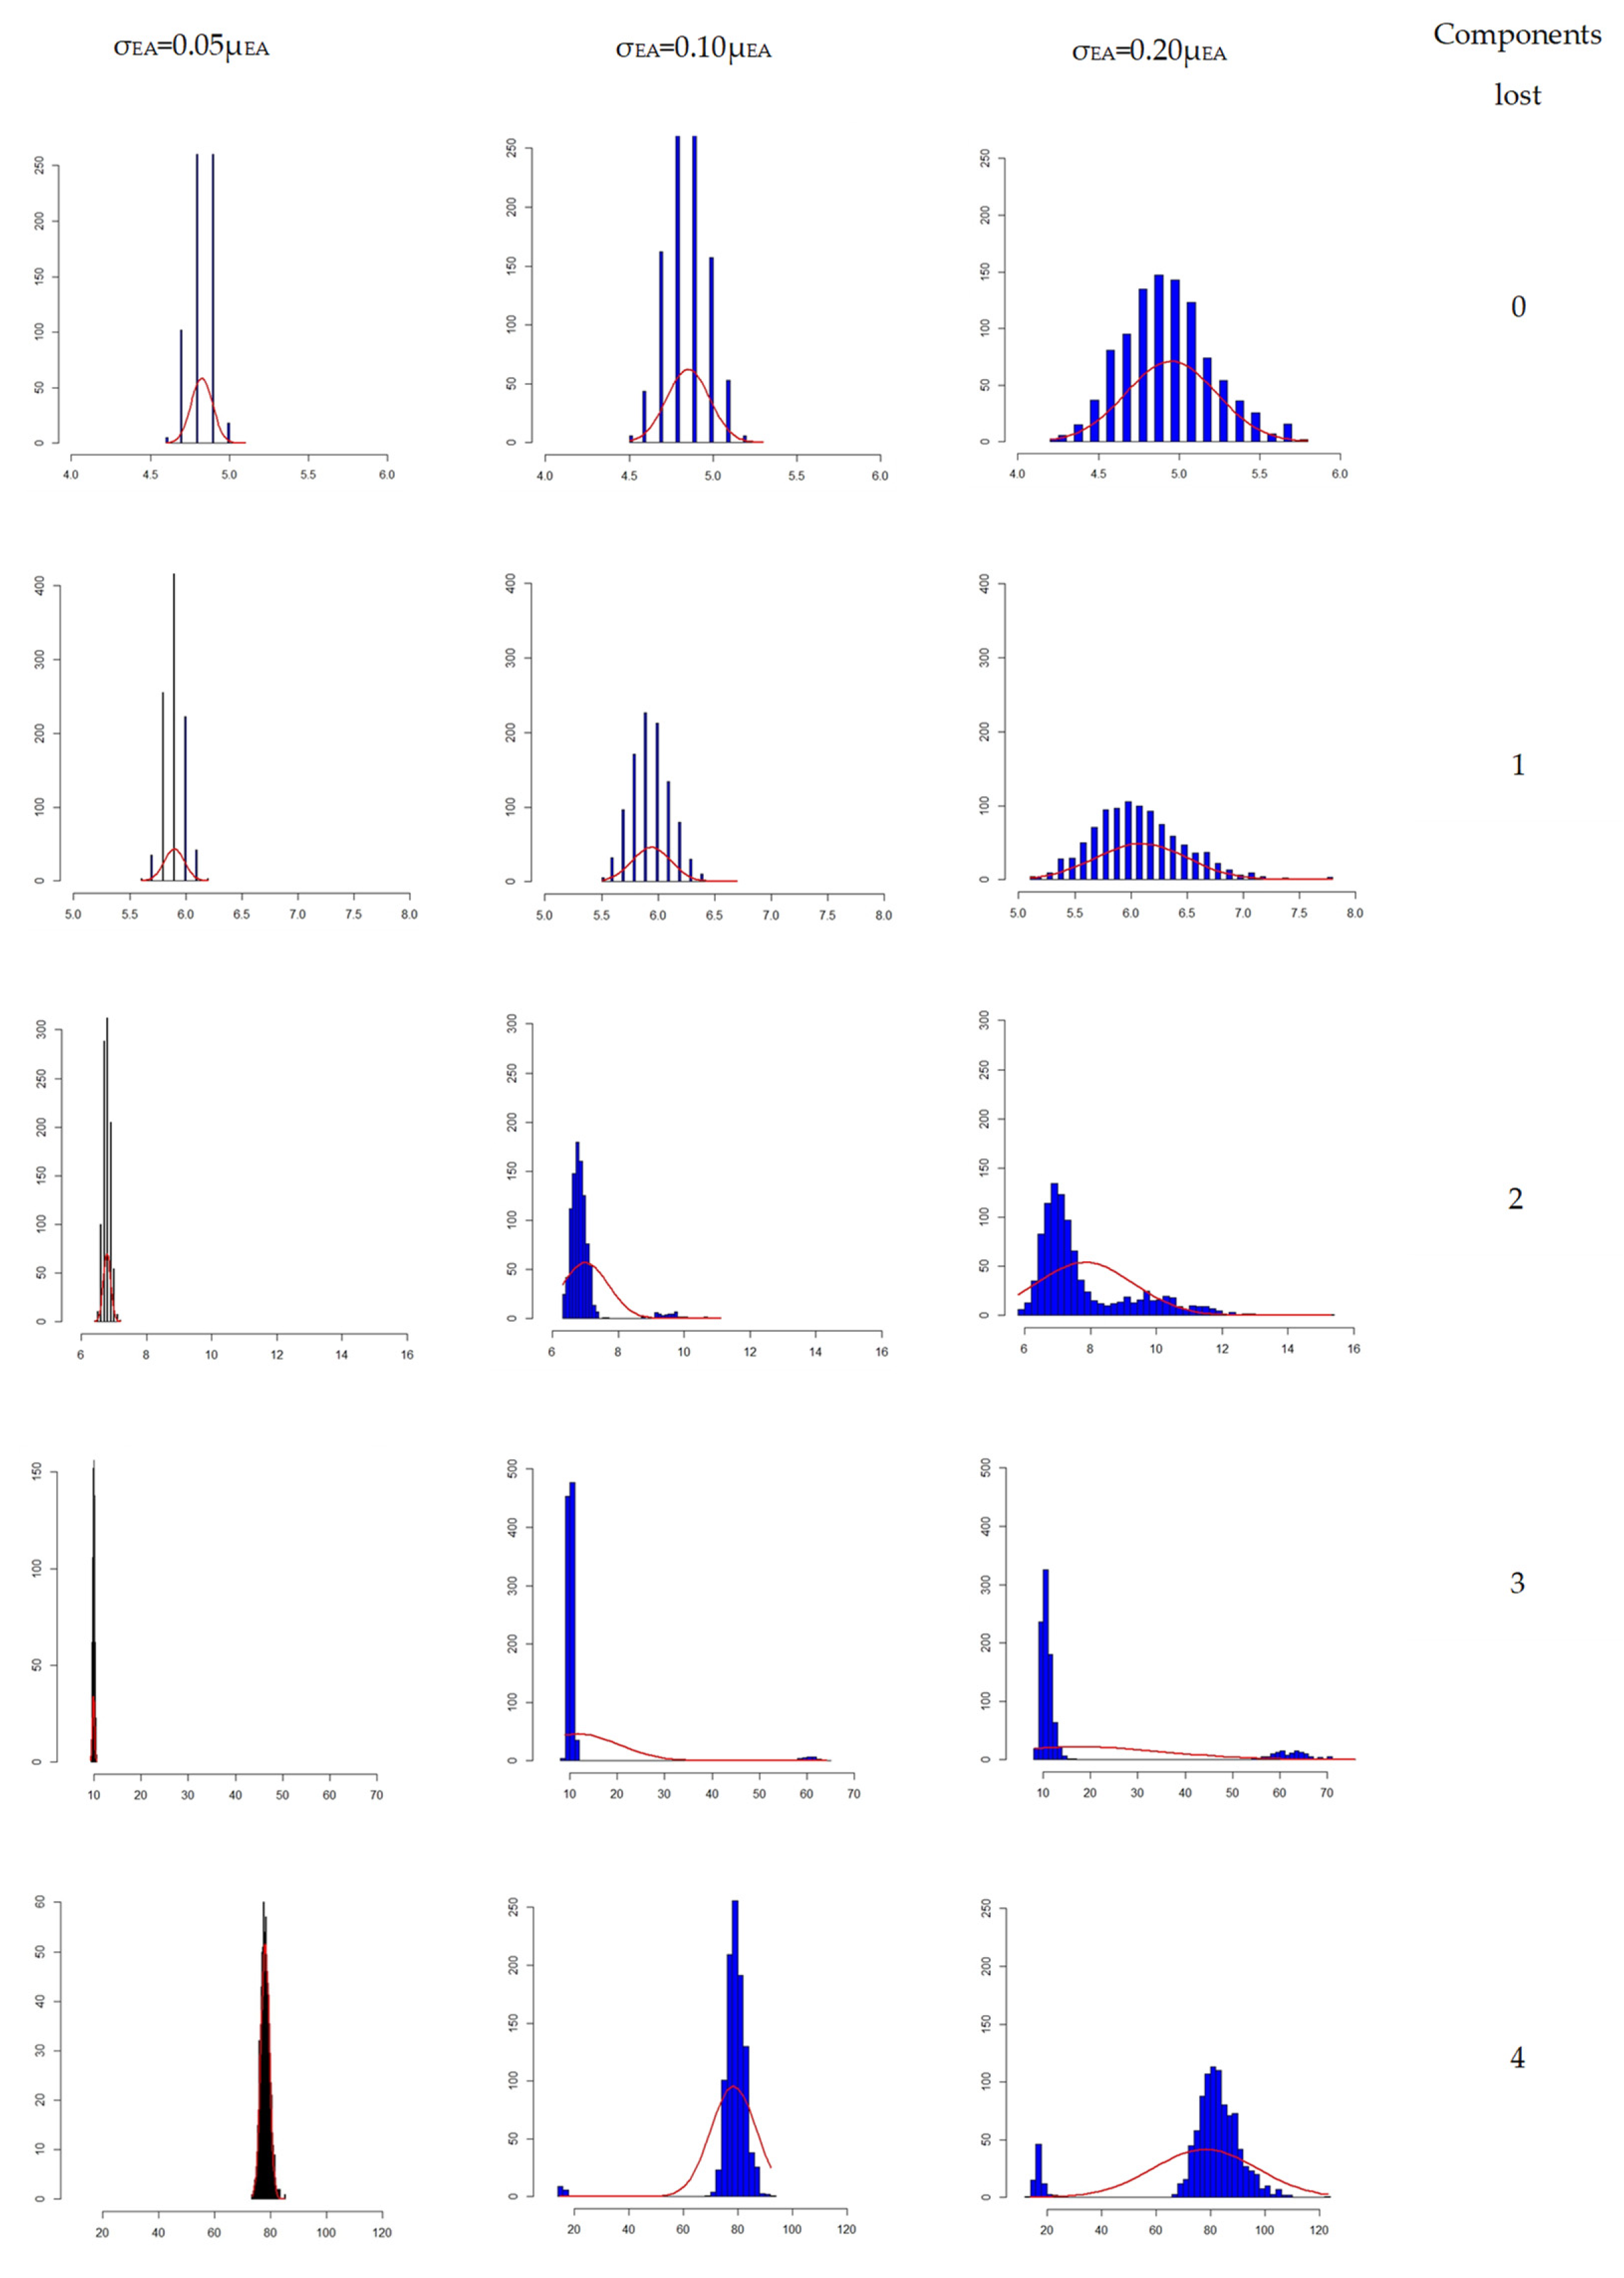
  • Variability and randomness as regards the component strength and actions on the structure can have a substantial influence on the robustness assessment. Reasonably high variabilities have been shown to dramatically affect, not only the possible dispersion in certain the performance measures (e.g., deformations), but on the prevailing failure modes of the structure. In particular, a change in the truss components axial stiffness variability from 5% to 20%, led from contained and stable performance, to a high probability of progressive collapse, under the same loading conditions. As the results in Figure 10 show, actually multiple modes (peaks) appear in the output distributions for structures with a higher input variation, which implies not only high uncertainties in the load bearing capacity and reliability of the progressively damaged system, but uncertainty on the type of critical failure type. This starts to become evident at the systems with 10% and 20% variations after loss of 2 and 3 members respectively.
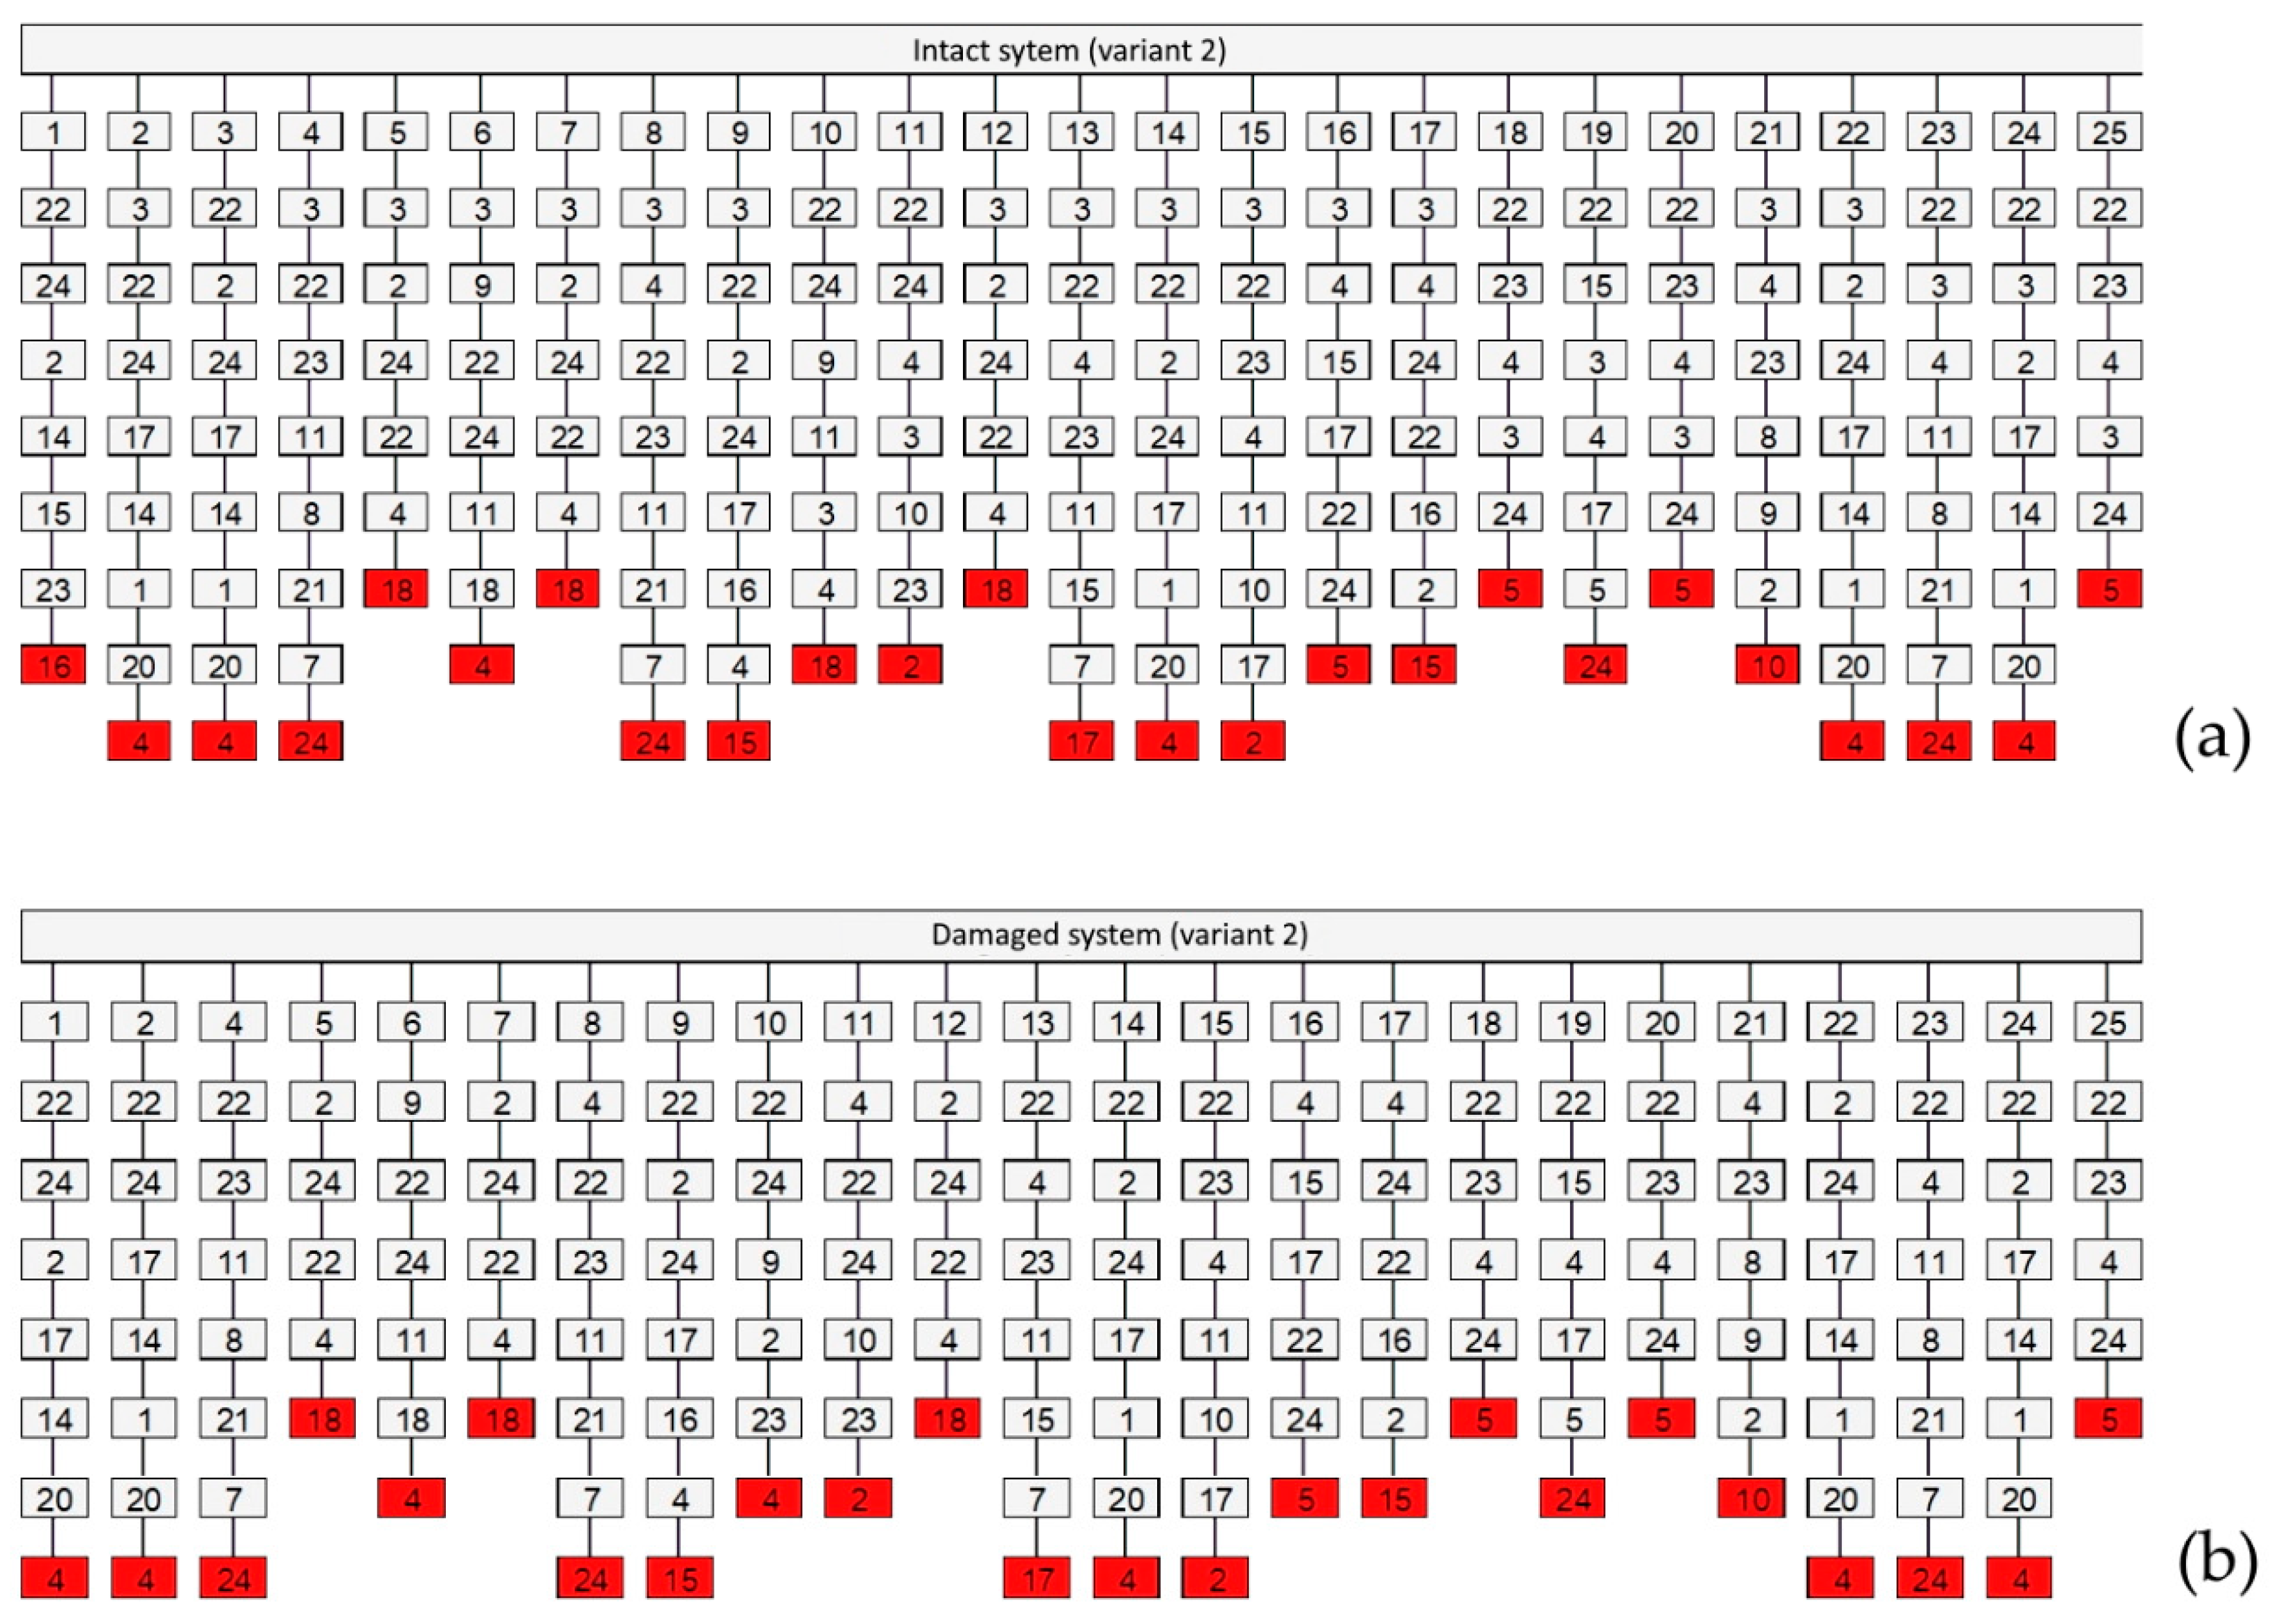
  • A probabilistic elaboration of the structure’s collapse characteristics has proven to be very insightful, not only due to the appreciate treatment of uncertainty and randomness mentioned above, but because they also enable an inverse identification of the critical failure paths (see Figure 7 and Figure 8) and the characterization of weak links in a multicomponent system. On the example of Variant 1 analyzed in Section 4, prioritization of maintenance would be assigned primarily to elements 25 and 26, and perhaps secondarily to element 5 and 19 (although improvement of elements 25 and 26 may alter the originally anticipated failure paths). On the example of Variant 2, key elements are the ones identified as 5 and 18 in Figure 8. In turn, this can facilitate a rational design for robustness, as well as an efficient strategy for the design of, as for example the elements mentioned above, ‘key elements” as defined in Section 2.2.2. This further allows for a robustness-based strategy for structural maintenance, including health monitoring optimization and targeted strengthening. Alternatively, elements of high significance for the survival of the structure under an unexpected event, can be specifically designed as redundant or adaptive components in innovative structural concepts.

Author Contributions

Conceptualization, A.S. and P.S.; methodology, A.S. and P.S.; formal analysis, P.S.; investigation, P.S.; writing—original draft preparation, A.S. and P.S.; writing—review and editing, A.S. and P.S. All authors have read and agreed to the published version of the manuscript.

Funding

This research received no external funding.

Conflicts of Interest

The authors declare no conflict of interest.

References

  1. Pearson, C.; Delatte, N. Ronan point apartment tower collapse and its effect on building codes. J. Perform. Constr. Facil. 2005, 19, 172–177. [Google Scholar] [CrossRef] [Green Version]
  2. NTSB (National Transportation Safety Board). Highway Accident Report NTSB/HAR-07/02. In Ceiling Collapse in the Interstate 90 Connector Tunnel, Boston, Massachusetts, July 10 2006; NTSB: Washington DC, USA, 2006. [Google Scholar]
  3. Stacy, M.; Denton, S.; Pottle, S. Management of Safety-Critical Fixings. Guidance for the Management and Design of Safety-Critical Fixings (C778); CIRIA-Construction Industry Research and Information Association: London, UK, 2019; ISBN 978-0-86017-793-7. [Google Scholar]
  4. NTSB (National Transportation Safety Board). Highway Accident Report NTSB/ HAR-19/02 PB2019-101363. In Pedestrian Bridge Collapse over SW 8th Street, Miami, Florida, March 15 2018; NTSB: Washington DC, USA, 2019. [Google Scholar]
  5. Morgese, M.; Ansari, F.; Domaneschi, M.; Cimellaro, G.P. Post-collapse analysis of Morandi’s Polcevera viaduct in Genoa Italy. J. Civ. Struct. Health Monit. 2020, 10, 69–85. [Google Scholar] [CrossRef]
  6. Starossek, U.; Haberland, M. Measures of Structural Robustness—Requirements and Applications. In Proceedings of the Structures Congress 2008, Vancouver, BC, Canada, 24–26 April 2008. [Google Scholar]
  7. Frangopol, D.M.; Curley, J.P. Effects of damage and redundancy on structural reliability. J. Struct. Eng. 1987, 113, 1533–1549. [Google Scholar] [CrossRef]
  8. Biondini, F.; Frangopol, D.M.; Restelli, S. On Structural Robustness, Redundancy, and Static Indeterminacy; ASCE Press: Reston, VA, USA, 2008; pp. 1–10. [Google Scholar] [CrossRef]
  9. Kanno, Y.; Ben-Haim, Y. Redundancy and robustness, or when is redundancy redundant? J. Struct. Eng. 2011, 137, 935–945. [Google Scholar] [CrossRef]
  10. Kokot, S. Literature Survey on Current Methodologies of Assessment of Building Robustness and Avoidance of Progressive Collapse; JRC Scientific and Technical Reports; European Communities, Joint Research Centre, Institute for the Protectionand Security of the Citizen: Ispra, Italy, 2009. [Google Scholar]
  11. COST Action TU0601. Robustness of Structures. In Structural Robustness Design for Practicing; Canisius, T.D.G., Ed.; European Cooperation in Science & Technology: Brussels, Belgium, September 2011. [Google Scholar]
  12. Droogné, D. Reliability-Based Design for Robustness: Evaluation of Progressive Collapse in Concrete Structures Taking into Account Membrane Action. Ph.D. Thesis, Ghent University, Ghent, Belgium, 2019. [Google Scholar]
  13. Urban, S.; Strauss, A.; Macho, W.; Bergmeister, K.; Dehlinger, C.; Reiterer, M. Concrete structures under cyclic loading-robustness and redundancy considerations for residual lifetime optimization. Bautechnik 2012, 89, 737–752. [Google Scholar] [CrossRef]
  14. Strauss, A.; Vidovic, A.; Zambon, I.; Grossberger, H.; Bergmeister, K. Monitoring information and probabilistic-based prediction models for the performance assessment of concrete structures. J. Perform. Constr. Facili. 2016, 30, 04015081. [Google Scholar] [CrossRef]
  15. DCLG–Department for Communities and Local Government. Review of International Research on Structural Robustness and Disproportionate Collapse. (Report Commissioned from Arup Group); Department for Communities and Local Government (DCLG) and the Centre for the Protection of National Infrastructure (CPNI): London, UK, 2011.
  16. CEN (European Committee for Standardization). EN 1990, Eurocode 0: Basis of Structural Design, + A1:2005/AC:2010; CEN/TC 250 2010; European Committee for Standardization: Brussels, Belgium, 2010. [Google Scholar]
  17. CEN (European Committee for Standardization). EN 1991-1-7:2006. Eurocode 1: Actions on Structures-Part 1-7: General Actions-Accidental Actions. + A1:2014; CEN/TC 250 2014; European Committee for Standardization: Brussels, Belgium, 2014. [Google Scholar]
  18. Fib–International Federation of Structural Concrete. Fib Bulletin 65: Model Code for Concrete Structures; Fib–International Federation of Structural Concrete: Lausanne, Switzerland, 2012. [Google Scholar]
  19. CEN (European Committee for Standardization). EN 1992-1-1:2004. Eurocode 2: Design of Concrete Structures – Part 1–1: General Rules and Rules for Buildings. + A1:2014; CEN/TC 250 2014; European Committee for Standardization: Brussels, Belgium, 2014. [Google Scholar]
  20. Starossek, U. Progressiver Kollaps von Bauwerken. Beton-und Stahlbetonbau 2005, 100, 305–317. [Google Scholar] [CrossRef]
  21. Eriksson, A.; Tibert, A.G. Redundant and force-differentiated systems in engineering and nature. Comput. Methods Appl. Mech. Eng. 2006, 195, 5437–5453. [Google Scholar] [CrossRef]
  22. Ghosn, M.; Dueñas-Osorio, L.; Frangopol, D.M.; McAllister, T.P.; Bocchini, P.; Manuel, L.; Ellingwood, B.R.; Arangio, S.; Bontempi, F.; Shah, M.; et al. Performance indicators for structural systems and infrastructure networks. J. Struct. Eng. 2016, 142, F4016003. [Google Scholar] [CrossRef]
  23. Adam, J.M.; Parisi, F.; Sagaseta, J.; Lu, X. Research and practice on progressive collapse and robustness of building structures in the 21st century. Eng. Struct. 2018, 173, 122–149. [Google Scholar] [CrossRef]
  24. Matthews, S.; Bigaj-van Vliet, A.; Walraven, J.; Mancini, G.; Dieteren, G. fib Model Code 2020: Towards a general code for both new and existing concrete structures. Struct. Concr. 2018, 19, 969–979. [Google Scholar] [CrossRef]
  25. Maes, M.A.; Fritzsons, K.E.; Glowienka, S. Structural robustness in the light of risk and consequence analysis. Struct. Eng. Int. 2006, 16, 101–107. [Google Scholar] [CrossRef]
  26. Baker, J.W.; Schubert, M.; Faber, M.H. On the assessment of robustness. Struct. Saf. 2008, 30, 253–267. [Google Scholar] [CrossRef]
  27. Weigand, J.M.; Bao, Y.; Main, J.A. Acceptance criteria for the nonlinear alternative load path analysis of steel and reinforced concrete frame structures. In Proceedings of the Structures Congress 2017, Denver, CO, USA, 6–8 April 2017; pp. 222–232. [Google Scholar]
  28. Zhu, B.; Frangopol, D.M. Reliability, redundancy and risk as performance indicators of structural systems during their life-cycle. Eng. Struct. 2012, 41, 34–49. [Google Scholar] [CrossRef]
  29. Ghosn, M.; Frangopol, D.M.; McAllister, T.P.; Shah, M.; Diniz, S.M.C.; Ellingwood, B.R.; Manuel, L.; Biondini, F.; Catbas, N.; Strauss, A.; et al. Reliability-based performance indicators for structural members. J. Struct. Eng. 2016, 142, F4016002. [Google Scholar] [CrossRef]
  30. Kou, X.; Li, L.; Zhou, Y.; Song, J. Redundancy Component Matrix and Structural Robustness. Int. J. Civ. Environ. Eng. 2017, 11, 1150–1155. [Google Scholar]
  31. Praxedes, C.; Yuan, X.X. Development of a design-oriented structural robustness index for progressive collapse. In Life Cycle Analysis and Assessment in Civil Engineering: Towards an Integrated Vision, Proceedins of the Sixth International Symposium on Life-Cycle Civil Engineering, Ghent, Belgium, 28–31 October 2018; Caspeele, R., Taerwe, L., Frangopol, D.M., Eds.; IALCCE 2018; CRC Press: London, UK, 2018; ISBN1 978-1-315-22891-4. ISBN2 978-1-138-62633-1. [Google Scholar]
  32. Starossek, U.; Haberland, M. Approaches to measures of structural robustness. Struct. Infrastruct. Eng. 2011, 7, 625–631. [Google Scholar] [CrossRef]
  33. Fu, G.; Frangopol, D.M. Balancing weight, system reliability and redundancy in a multiobjective optimization framework. Struct. Saf. 1990, 7, 165–175. [Google Scholar] [CrossRef]
  34. Guevenc, M.; Spyridis, P. Redundancy in truss systems under uncertainty considerations. In Proceedings of the 29th European Safety and Reliability Conference (ESREL), Hannover, Germany, 22–26 September 2019; pp. 3248–3254. [Google Scholar]
  35. Guevenc, M.; Spyridis, P. Probabilistic robustness assessment for multi-component assemblies based on realistic case studies. In Proceedings of the 17th International Probabilistic Workshop (IPW), Edinburgh, UK, 11–13 September 2019; pp. 190–195. [Google Scholar]
  36. CEN (European Committee for Standardization). EN 1993-1-1: Eurocode 3—Part 1–1, Design of Steel Structures—General rules and Rules for Buildings, AC:2009. CEN/TC 250 2009; CEN: Brussels, Belgium, 2009. [Google Scholar]
  37. Bijlaard, F.; Feldmann, M.; Naumes, J.; Sedlacek, G. The “general method” for assessing the out-of-plane stability of structural members and frames and the comparison with alternative rules in EN 1993—Eurocode 3—Part 1-1. Steel Constr. Design Res. 2010, 3, 19–33. [Google Scholar] [CrossRef]
  38. Guevenc, M. Robustheit und Redundanzverhalten von Traversensystemen Mit Mehreren Knoten. (Robustness and Redundancy Behavior of Truss Systems with Multiple Nodes). Master’s Thesis, Technische Universität Dortmund, Dortmund, Germany, 2019. [Google Scholar]
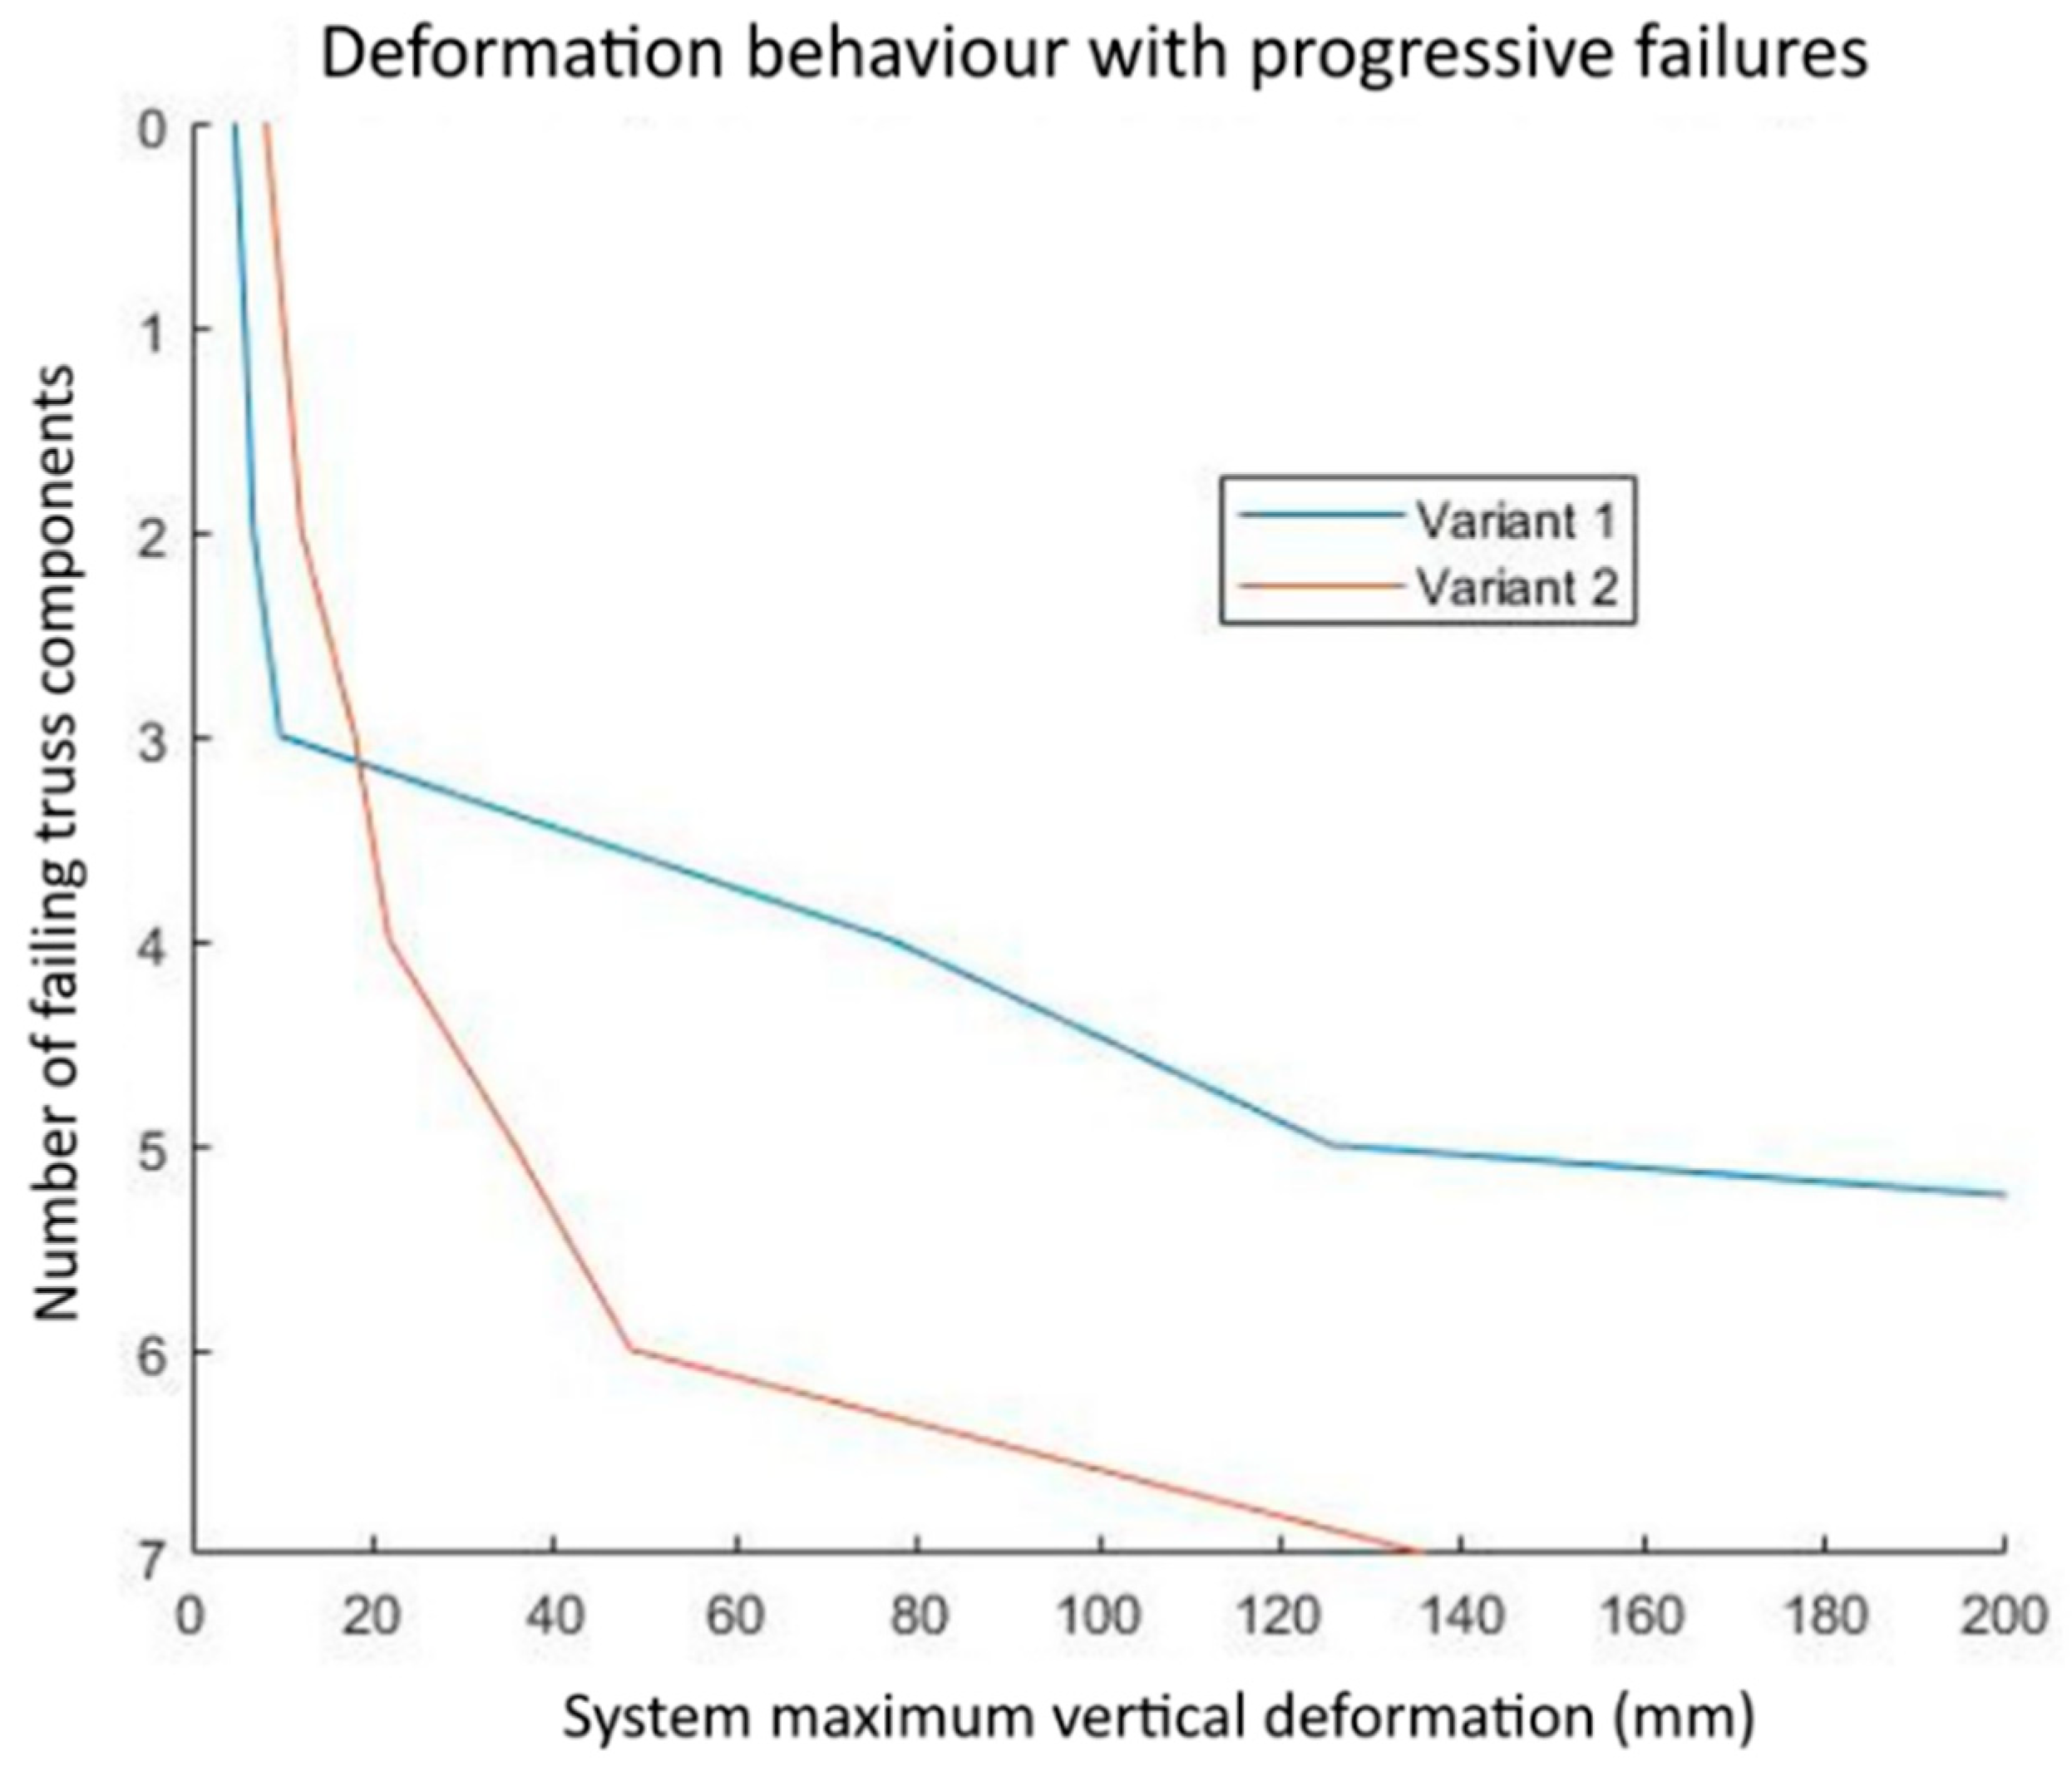
Figure 1. Increase of redundancy on the example of a truss system (a), by the addition of members and increase of its static indeterminacy (b).
Buildings 10 00213 g001
Figure 2. Direct and indirect consequences, adapted from [26].
Buildings 10 00213 g002
Figure 3. Flowchart of the structural and probabilistic analysis.
Buildings 10 00213 g003
Figure 4. Description of the investigated system and labelling of individual elements.
Buildings 10 00213 g004
Figure 5. Deformation patterns of the investigated systems at sequences of component losses.
Buildings 10 00213 g005
Figure 6. Deformation patterns of the investigated systems at sequences of component losses of truss system variants 1 and 2 (FEM results).
Buildings 10 00213 g006
Figure 7. Failure paths of variant 1; intact system (a); damaged system after loss of component 25 (b).
Buildings 10 00213 g007
Figure 8. Failure paths of variant 2; intact system (a); damaged system after loss of component 25 (b).
Buildings 10 00213 g008
Figure 10. Distribution of system deformations of Variant 1 in the intact and different damage states, under the assumptions of variable axial stiffness (5%, 10% and 20% scatter of strain stiffness, for loss of 0 to 4 components); X-axes: vertical deformations ranging (mm); Y-axes: frequencies (-).
Buildings 10 00213 g010
Table 1. System deformations (w) [mm] and utilization ratios (η) [–] during successive failure of the truss system components; element i.d. numbers according to Figure 4.
Number of Failing ComponentsVariant 1Variant 2
wηElementwηElement
04.80.55258.20.723
1 5.90.512610.20.6922
26.80.50212.10.642
39.80.684180.9324
477.32.652321.80.8117
5125.62.54335.61.2314
6430.16.022448.41.141
7136.31.9620
Table 2. Redundancy contributions (rii) and reliability indexes (βi) for components of variant 1.
iriiβiiriiβi
1; 210.5414.758; 150.2494.75
2; 220.5284.759; 160.3624.75
3; 230.6234.7510; 170.2494.75
4; 240.3114.7511; 180.2234.75
5; 190.0384.7512; 130.0504.75
6; 200.0284.7525; 260.4304.75
7; 140.3684.75---
Table 3. Redundancy contributions (rii) and reliability indexes (βi) for components of variant 2.
iriiβiiriiβi
1; 210.5824.757; 200.0884.75
2; 230.5074.758; 140.4354.75
3; 220.4234.759; 150.3814.75
4; 240.5874.7510; 160.4004.75
5; 250.2464.7511; 170.4904.75
6; 200.0794.7512; 180.2464.75
130.0764.75---
Publisher’s Note: MDPI stays neutral with regard to jurisdictional claims in published maps and institutional affiliations.

