Article

Effect of Nonmetallic Inclusions on Fatigue Properties of Superelastic Ti-Ni Fine Wire

1
Department of Applied Science for Electronics and Materials, Interdisciplinary Graduate School of Engineering Science, Kyushu University, Fukuoka 816-8580, Japan
2
Technology Development Department, Special Metals Division, Furukawa Techno Material Co., Ltd., Hiratsuka 254-0016, Japan
3
Department of Materials Processing, Tohoku University, Sendai 980-8579, Japan
4
Special Metals Division, Furukawa Techno Material Co., Ltd., Hiratsuka 254-0016, Japan
5
Department of Advanced Materials Science and Engineering, Faculty of Engineering Sciences, Kyushu University, Fukuoka 816-8580, Japan
*
Author to whom correspondence should be addressed.
Metals 2019, 9(9), 999; https://doi.org/10.3390/met9090999
Submission received: 5 August 2019 / Revised: 4 September 2019 / Accepted: 6 September 2019 / Published: 11 September 2019

Abstract

:
This study investigated the effects of the types and length of nonmetallic inclusions on fatigue properties in rotating bending fatigue testing of Ti-Ni alloy fine wire. It was fabricated to include titanium carbides Ti(C,O) and titanium oxides Ti4Ni2Ox as either single phases or a mixture of both phases as nonmetallic inclusions in Ti-Ni alloy. The fatigue strength of Ti-Ni alloy depended on the number of nonmetallic inclusions of a length of ≥2 μm. Compared with Ti(C,O), Ti4Ni2Ox is coarse. It also exhibited a trend of readily forming particles and void assemblies, which are a defect morphology that originates from nonmetallic inclusions and readily act as crack origins of fatigue fractures.

1. Introduction

Ti-Ni alloy is a functional material that exhibits superelasticity and shapes memory properties. These characteristics are utilized in temperature sensors and actuators, such as in household appliances and electronics. Furthermore, Ti-Ni alloy has excellent corrosion resistance and biocompatibility, and thus is used in medical devices, such as guidewires and stents [1,2,3]. There are also many studies about Ti-Ni alloy from various aspects, such as the improvement of corrosion resistance [4] and fretting behavior [5]. In particular, stents are medical devices that expand and hold open narrowed areas of hollow anatomical structures, such as blood vessels, and are used for the treatment of circulatory diseases, which have been growing more prevalent in recent years. Metal stents can be made of stainless steel, Co-Cr alloy, or Ti-Ni alloy. Ti-Ni alloy is flexible and is mainly used for cerebral blood vessels and lower limb blood vessels [6].
Stents placed inside the body experience cyclical deformation loads over a long period of time, such as those due to the pulse. Accordingly, there are concerns over fatigue fractures originating from nonmetallic inclusions [2,3,7,8,9,10,11]. In recent years, the demand has grown for ultrafine wire and thin-walled capillary tubes made of Ti-Ni alloy materials for stents. Stent shapes have become more sophisticated and the areas where they are placed have expanded. This has led to further concern over problems arising from nonmetallic inclusions. For this reason, the ASTM F2063 series, [6] which is a set of standards for Ti-Ni alloys for medical use, specifies the sizes and area ratios of nonmetallic inclusions, such as titanium carbides (TiC) and titanium oxides (Ti4Ni2Ox). It also specifies the concentrations of the light elements, such as oxygen, carbon, and nitrogen, which are related to the generation of these nonmetallic inclusions. The quantities of nonmetallic inclusions are revised with each version of the standard. Toro et al. [3] observed that nonmetallic inclusions are generated even in Ti-Ni alloy with extremely low concentrations of carbon (≤20 ppm) and oxygen (≤50 ppm). Furthermore, Rahim et al. [9] reported the results of rotating bending fatigue testing of Ti-Ni wire with a diameter of 0.75 mm fabricated to contain ≤50 ppm of carbon or oxygen. Although the number of nonmetallic inclusions was extremely reduced by lowering the carbon and oxygen contents, the fatigue strength was not improved and was similar to commercial alloys. This formation of nonmetallic inclusions even at extremely low concentrations of oxygen and carbon indicates that the fabrication of Ti-Ni alloy free of nonmetallic inclusions at a commercial scale is difficult in terms of both the production volume and cost.
Although the two types of nonmetallic inclusions [6] known in Ti-Ni alloy are TiC and Ti4Ni2Ox as described above, there has been little research on the effect of the types and sizes of these phases on fatigue properties. Ito et al. [12] reported that the types of nonmetallic inclusion phases that form depend on the ratio of carbon and oxygen concentrations (C/O ratio) in Ti-Ni alloy. Although this suggests that the types of nonmetallic inclusion phases can be selectively controlled by adjusting the C/O ratio, the details are unclear.
In previous research, the authors found that titanium carbides have a composition where some of the carbon is replaced with oxygen. Titanium carbides were defined as Ti(C,O) and the nonmetallic inclusion phases and fatigue properties were investigated in two types of Ti-Ni alloy fine wire formed from single phases of Ti(C,O) and Ti4Ni2Ox. Further, the crack origins of the fatigue fractures were reported [13].
In this research, the authors fabricated Ti-Ni alloy fine wires containing nonmetallic inclusions of single phases or mixed phases of carbides and oxides by varying the C/O ratio in the Ti-Ni alloy. The effect of the types and sizes on the fatigue properties were further investigated.

2. Experimental Methods

2.1. Fabrication of Ti-Ni Alloy Fine Wire Samples Containing Different Nonmetallic Inclusion Phases

The compositions of the test samples were Ti-51.0 at.% Ni, which is the composition most commonly used as a superelastic alloy in the medical field. Six samples were fabricated with the concentrations of both carbon and oxygen and varied within a maximum of 500 ppm. Ti (99.5%) and Ni (99.9%) were used as the raw materials, and the C/O ratio was adjusted by the addition of TiC powder and TiO2 powder to reach the target composition. In this paper, the C/O ratio is expressed as a mass ratio. These raw materials were prepared in an arc melting furnace. Melting was performed a total of 6 times in order to further homogenize the alloy, and an ingot of approximate 900 g was fabricated. The composition of the ingot was found by measuring the carbon content by the combustion-infrared absorption method and measuring the oxygen and nitrogen content by the inert gas fusion-impulse heating method. Table 1 shows the results of the light element analysis for each of the fabricated samples. Furthermore, the carbon and oxygen concentrations of each sample were used to label the samples.
Each of the ingots was hot forged to a diameter of 9.0 mm at 900 °C. The samples were then wire drawn to a diameter of approximately 160 μm by repeatedly alternating between die wire drawing and air annealing at 700 °C. Finally, the samples were constrained to a linear shape by a load applied and held for 30 s at 500 °C in an argon atmosphere, and were then cooled.
The superelastic properties and fatigue properties are affected by the surface condition [9,10]. In this experiment, the surfaces of the samples were cleaned by electropolishing in order to suppress the effects of the sample surface condition, such as scratches from wire drawing, on the mechanical properties of the samples and thereby, to clarify the effect of nonmetallic inclusions on fatigue fracture. Electropolishing was performed by using a tubular platinum mesh as the counter electrode (cathode) with the wire samples of diameter 160 μm placed in the center. The electrolytic solution was 3M H2SO4/CH3OH and was kept at 0 °C by using an ice bath. The solution was stirred using a stirrer while applying 15 V for 20 s. This reduced the diameter by approximately 10 μm. The sample surface observations by scanning electron microscopy (SEM, ULTRA55, Carl Zeiss, Germany) confirmed that the surfaces of all samples were smooth and free of wire drawing scratches. Thus, the wire samples with a diameter of approximately 150 μm prepared by the above process were used for tensile testing and rotating bending fatigue testing.
The austenite finish temperature Af of each sample (rightmost column, Table 1) was measured in accordance with ASTM F 2082-06 [14] for measuring the dynamic reverse transformation temperature.

2.2. Identification and Particle Analysis of Nonmetallic Inclusions

To confirm the nonmetallic inclusion phases in each sample, electrolytic extraction was performed for 60 min at 4 V by using selective potentiostatic etching by electrolytic dissolution (SPEED). The wire samples of a diameter of approximately 150 μm were immersed in electrolytic solution containing a mixture of 10% acetyl acetone, 1% tetramethylammonium chloride, and methyl alcohol. The solution containing the dissolved samples was suction filtered over a membrane filter, and after separating the nonmetallic inclusions as residue, they were identified by x-ray diffraction (XRD, MiniFlex600, Rigaku, Japan) with Cu Kα radiation.
To study the number and particle size distribution of the nonmetallic inclusion phases in each sample, the wire samples of diameter approximately 150 μm were embedded in resin in the wire drawing direction. They were then polished to a mirror surface by wet polishing using SiC (#320) and 6 μm and 3 μm diamond paste and buff polishing using colloidal silica. The compositions of the nonmetallic inclusions in the fabricated samples were analyzed by SEM with an energy-dispersive x-ray spectroscopy (EDS, X-MaxN, Oxford Instruments, Abingdon, United Kingdom) attachment. Furthermore, EDS analysis was performed on each detected particle by using the particle analysis software INCA Feature (Oxford Instruments, Abingdon, United Kingdom) to separately identify Ti(C,O) and Ti4Ni2Ox and collect information about each particle. The particle analysis conditions were set to count nonmetallic inclusions with a major axis length parallel to the wire drawing direction (hereinafter, the length) of ≥0.2 μm as detected within the surface area of 4 fields of view (5.0 × 104 μm2 in total) at a magnification of 1000 times by SEM.

2.3. Tensile Testing

Tensile testing was performed using the wire samples described in Section 2.1 in a constant temperature bath at 37 °C with a distance between the marks of 40 mm at a strain rate of 0.00017 s−1 by applying and removing loading up to a tensile strain of 6%. The superelastic properties were confirmed, and Young’s modulus was estimated from the gradient in the elastic area.

2.4. Rotating Bending Fatigue Testing

A dual drive rotating bending fatigue tester was used (Figure 1). The strain amplitude εa and maximum bending stress σ applied to the sample were calculated from Equations (1) and (2), respectively, and were controlled by changing the distance between the centerline of the two axles D [15]. The parameters d and E in Equations (1) and (2) are the diameter and Young’s modulus of the samples, respectively.
εa = d/D × 100
σ = E × d/D
The fatigue tests were conducted in a testing environment with the bent part of the sample immersed in a bath of Hanks’ solution (pH = 7.4) kept at 37 °C to simulate the temperature inside the body. The number of fractures was determined by monitoring the voltage between the chucks. The rotation speed was set to 1000 rpm and the maximum number of test revolutions was set to 107.
The fracture surface after the fatigue test was observed by SEM, and the composition of nonmetallic inclusions present at crack origins was analyzed by EDS.

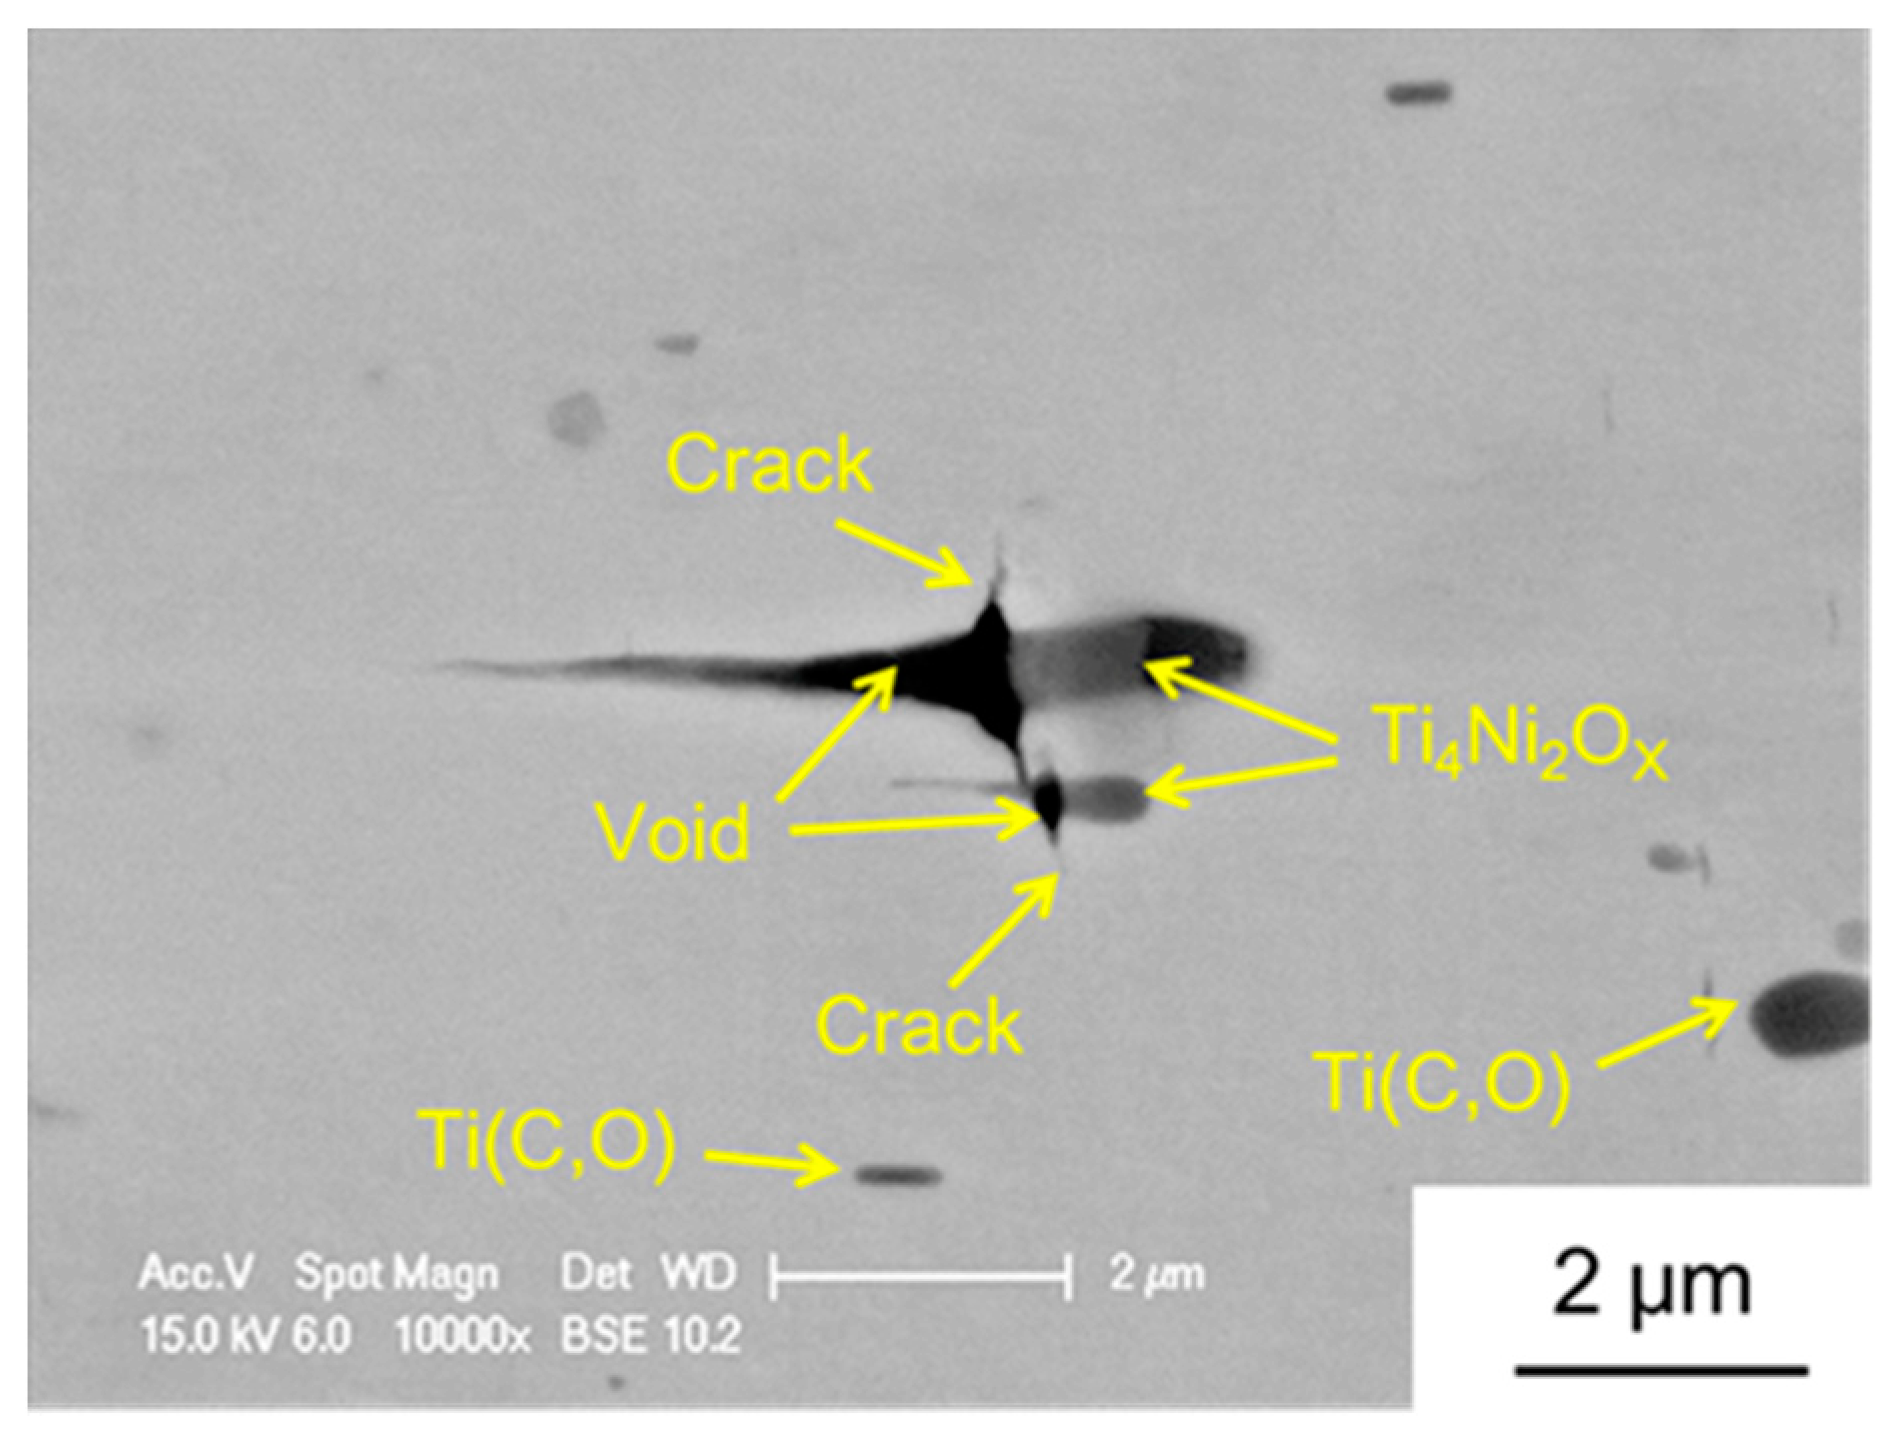
2.5. Measurement of Nonmetallic Inclusions and Surrounding Defects

Furthermore, the lengths of the nonmetallic inclusions observed in the surface of the wire samples electropolished as described in Section 2.1, as well as the particle and void assemblies (PVAs) and the fully embedded (FE) morphology where there are no voids around the nonmetallic inclusions, were measured by SEM.

3. Results and Discussion

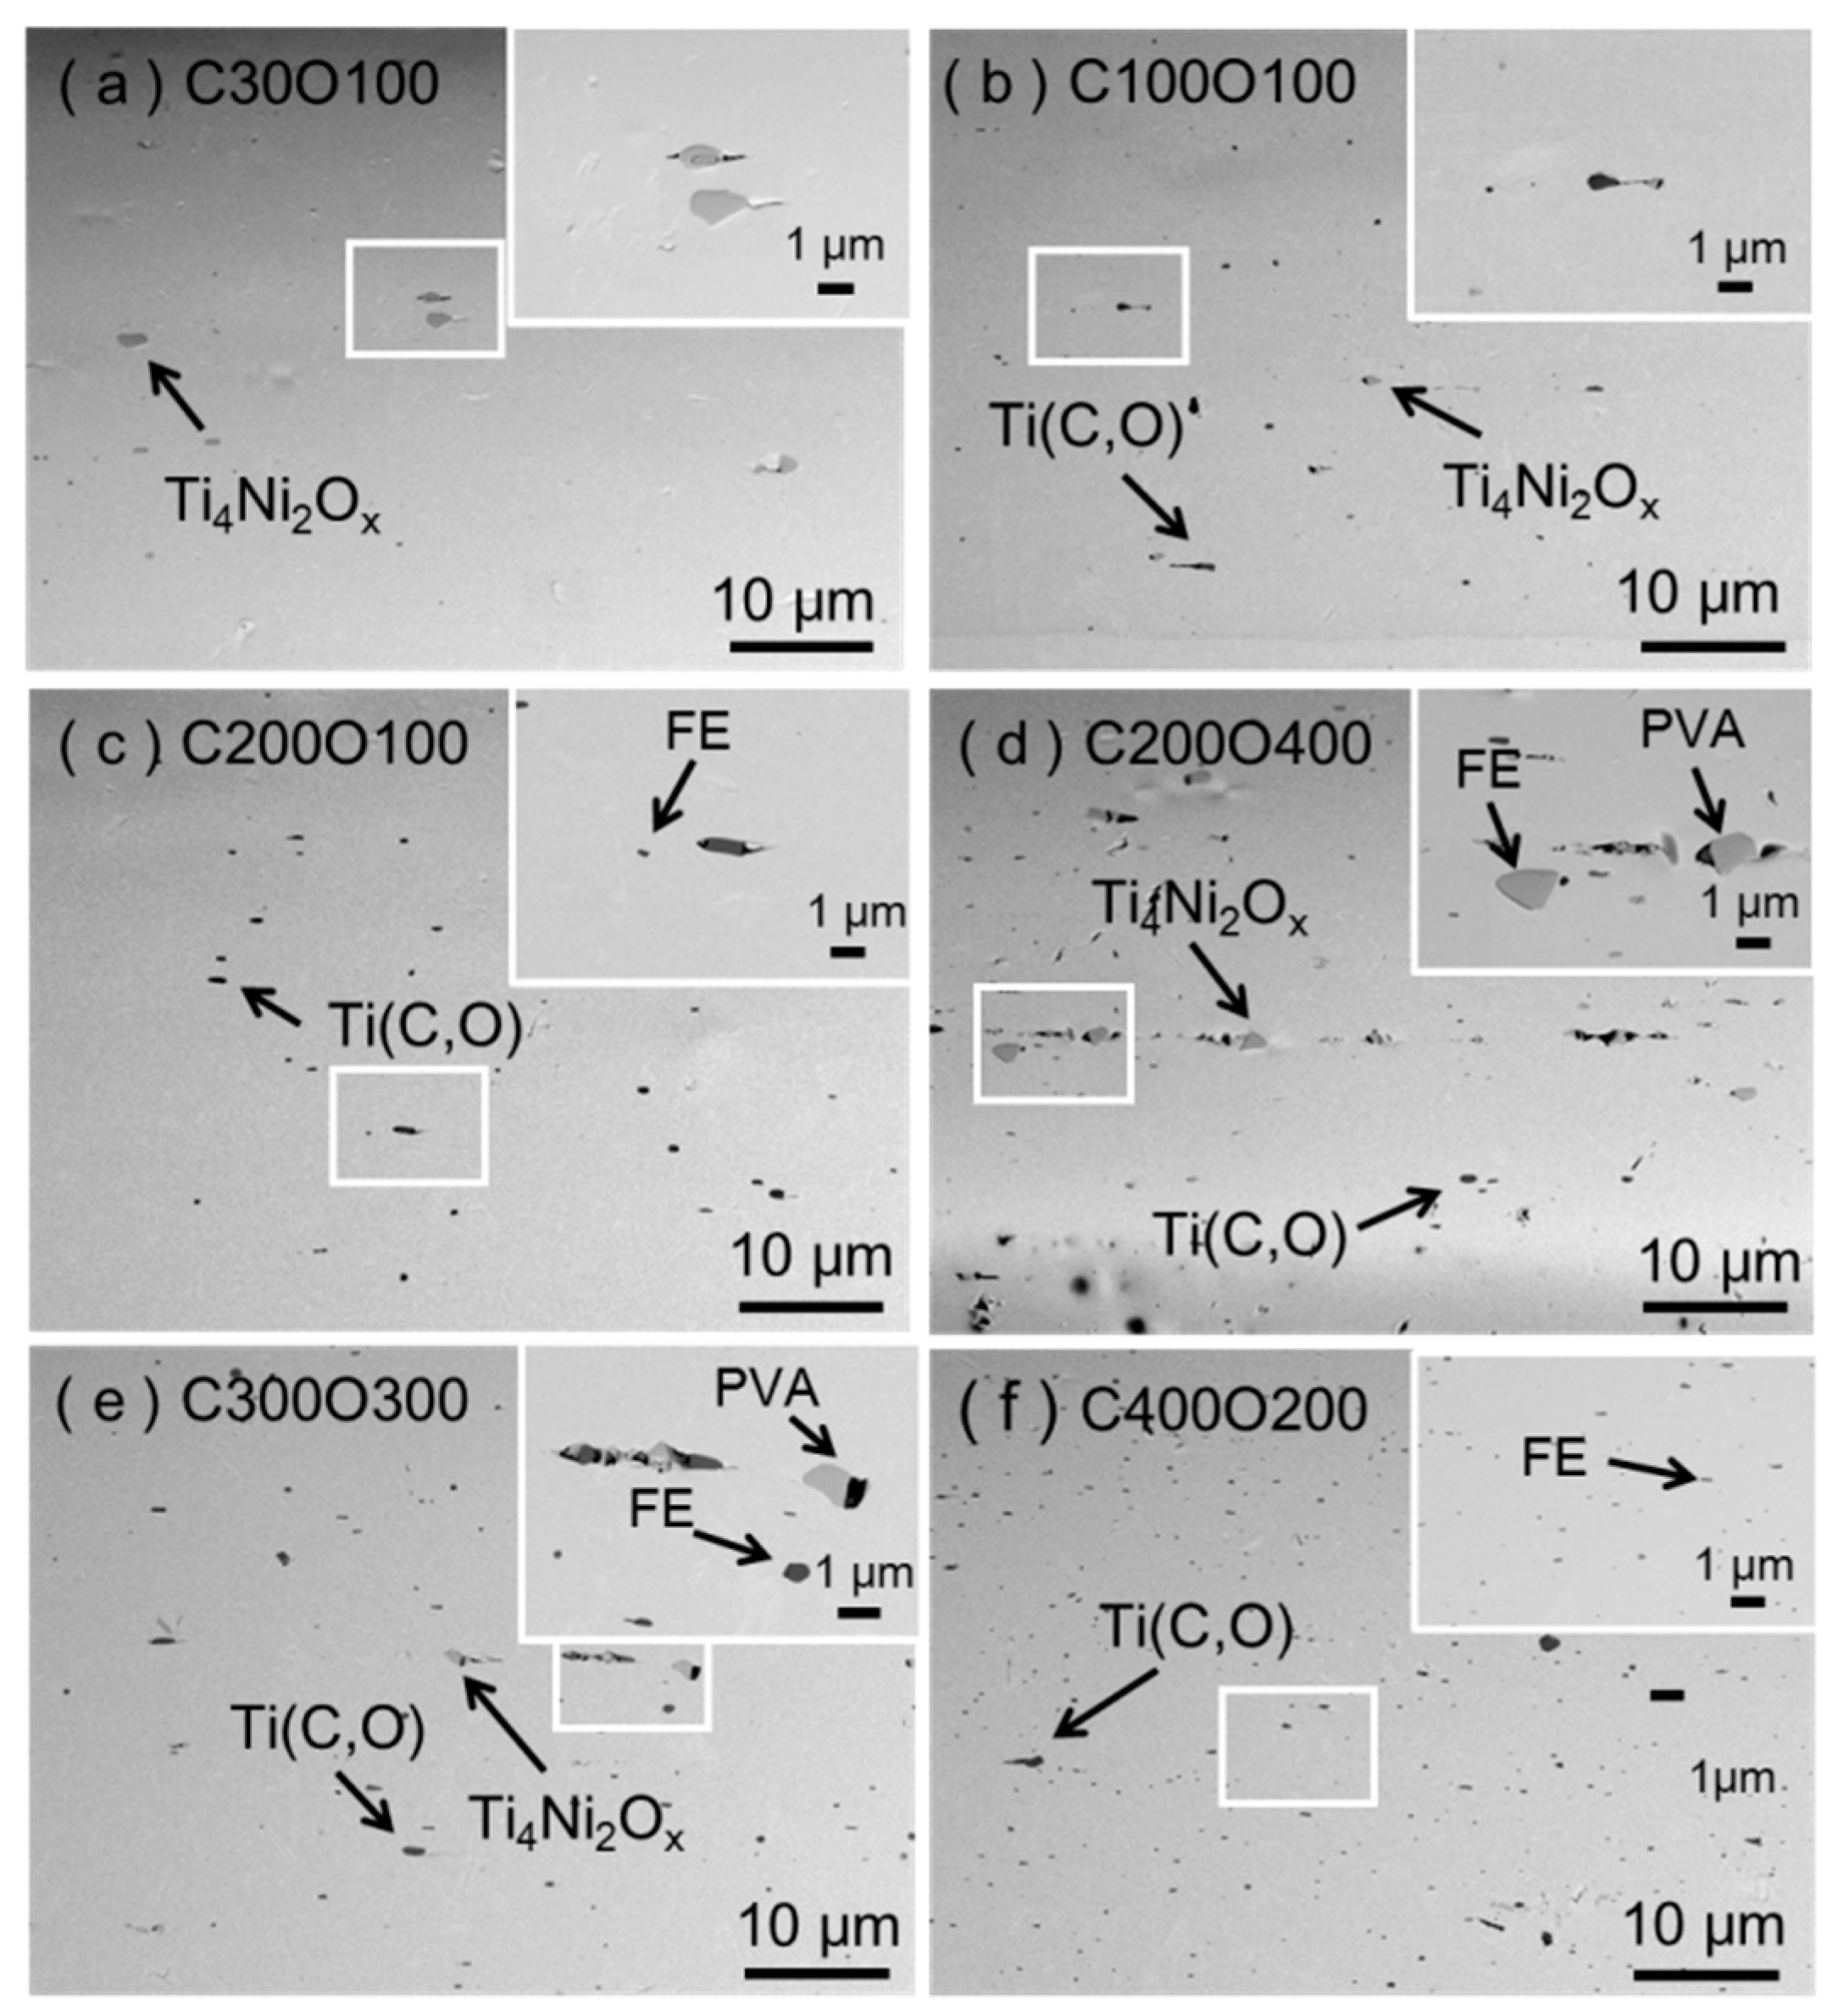
3.1. Nonmetallic Inclusion Phases and Particle Size Distribution in Each Sample

Figure 2 shows the SEM backscattered electron (BSE) images of the side surfaces of each sample. As can be seen from the low-magnification images and high-magnification insets, two types of particles—one characterized by a slightly darker contrast and another by a much darker contrast compared with the Ti-Ni matrix—were observed in all samples. The difference between these contrasts is thought to depend on the concentration of Ni, which has the highest atomic number among the constituent elements. Furthermore, from the results of the EDS analysis and XRD described below, the particles with slightly darker contrast were identified as Ti4Ni2Ox and the ones with much darker contrast were identified as Ti(C,O). A trend was observed where the amount of nonmetallic inclusions generated increased in proportion to the sum of the concentrations of oxygen and carbon as described later. For a given sum, there was a trend for a larger number of coarse Ti4Ni2Ox particles to appear as the oxygen concentration increased (Figure 2d). However, in samples where the carbon concentration was high, the Ti(C,O) was distributed toward finer particles (Figure 2f).
Figure 3 show the results of the phase identification by XRD on nonmetallic inclusions extracted by the SPEED method. When the C/O ratio was low (C/O < 0.5), the single-phase Ti4Ni2Ox was present. When 0.5 < C/O < 1.5, there was a mixture of Ti4Ni2Ox and Ti(C,O) phases with the amount of Ti(C,O) increasing as the C/O ratio increased. At C/O > 1.5, the single-phase Ti(C,O) was present. The above results suggest that the phases of the nonmetallic inclusions can be controlled by adjusting the C/O ratio during dissolution.
It was also found that when C/O > 1.5, the state of the single-phase Ti(C,O) was maintained even after hot forging and wire drawing. Note that the TiC peaks in Figure 3 are slightly shifted to a higher angle compared with the TiC data (00-32-1383) from the International Centre for Diffraction Data. This is because the TiC in the samples has a composition where some of the carbon has been replaced with oxygen, and the lattice constant is slightly smaller than TiC [16,17]. Thus, the titanium carbides are referred to as Ti(C,O) in this paper.
Figure 4a–f shows the results of the particle analysis in each sample. The number of coarse nonmetallic inclusions with a length of ≥2 μm increases as the C/O ratio decreases, and the number of coarse nonmetallic inclusions with a length of ≥2 μm decreases as the C/O ratio increases. Furthermore, nonmetallic inclusions with a length of ≥2 μm were mainly the Ti4Ni2Ox, and Ti(C,O) inclusions with a length of >10 μm which were not observed in any of the samples. These results are consistent with the SEM observations shown in Figure 2. Furthermore, there was a tendency for the number of nonmetallic inclusions to decrease as the sum of the carbon and oxygen concentrations decreased, which is consistent with the results in the literature [3,9].
From the above results, the relationship between the C/O ratio and the nonmetallic inclusion phase in the 6 samples fabricated in this research showed good agreement with a report by Ito et al. [12].

3.2. Effect of Types and Length of Nonmetallic Inclusion Phases on Fatigue Strength

Figure 5 shows the results of the tensile test for each sample. Substantial superelastic properties at 37 °C were found in all cases. Table 2 shows Young’s modulus as estimated from the gradient in the elastic region.
Figure 6 shows the SN curves (stress versus the number of cycles to failure) obtained from the rotating bending fatigue tests. The right-pointing arrows in the figure indicate the samples that had not failed by the maximum number of revolutions (107) used in this experiment. All of the SN curves exhibited a trend with a steep gradient in the low cycle number region. The gradient changed at approximately 104 revolutions, with the rate change decreasing and the curves converging to an almost constant value in the high cycle number region. The stress at this point was taken as the fatigue strength. The samples with a C/O ratio of >1.5 exhibited higher fatigue strength compared to the samples with a C/O ratio of <1.5.
Figure 7 shows the SEM secondary electron (SE) images of a pair of fatigue fracture surfaces from a sample. A nonmetallic inclusion is present on one of the fracture surfaces (Figure 7a) and a void can be seen on the other (Figure 7b). The nonmetallic inclusion in Figure 7a was identified as Ti4Ni2Ox phase from the EDS analysis results in Table 3. When the fracture surfaces were similarly observed, the measurement results for the length of nonmetallic inclusions at the crack origins showed that many were ≥2 μm.
Figure 8 shows the relationship between the number of nonmetallic inclusions with a length of ≥2 μm as estimated from the results of the particle analysis shown in Figure 4 and the fatigue strength. It was found that the fatigue strength decreased as the number of nonmetallic inclusions of a length of ≥2 μm increased. This reflects the tendency for coarse nonmetallic inclusions of a length of ≥2 μm to readily act as crack origins. The SEM observations of fatigue fracture surfaces revealed that nonmetallic inclusions of a length of ≥2 μm acted as crack origins. There were lots of Ti4Ni2Ox particles of a length of ≥2 μm in the C30O100 samples. On the other hand, there were a few Ti(C, O) particles of a length of ≥2 μm in the C200O100 and C400O200 samples. In addition, in the C100O100, C300O300, and C200O400 samples, which had a mixture of Ti(C,O) and Ti4Ni2Ox phases, the Ti4Ni2Ox was coarser than Ti(C,O) and selectively acted as the crack origin of fatigue fractures.

3.3. Relationship between PVAs and Fatigue Strength

Figure 9 shows a surface SEM-BSE image of a sample where failure did not occur after 107 revolutions in the fatigue tests. In the tests, the cracks propagated from the interfaces between Ti4Ni2Ox, which has PVA morphology, and the surrounding void based on Ti4Ni2Ox and Ti(C,O) identified in Figure 2. However, the occurrence of cracks from Ti(C,O), which has an FE morphology, was not observed. Therefore, many of the pairs of fatigue fracture surfaces exhibited the morphology shown in Figure 7. This suggests that the cracks occurred at the interfaces between the nonmetallic inclusions and the voids as indicated by the arrow in Figure 9, leading to failure. Rahim et al. [7] also reported the adverse effect of the PVA morphology comprising of a nonmetallic inclusion and void as shown in Figure 9.
The PVA morphology and FE morphology shown in Figure 2d,e, respectively, were observed in the surface of each sample before fatigue testing where electropolishing was performed. Abundant Ti(C,O) with an FE morphology was observed, particularly in Figure 2c,f where there are many fine nonmetallic inclusions. To examine the effect of the nonmetallic inclusion phase on the formation ratio of PVA morphology to FE morphology, the following were compared after electropolishing: C200O100 and C400O200, which are single-phase Ti(C,O); C30O100, which is single-phase Ti4Ni2Ox, and Ti4Ni2Ox selectively choosing from C200O400, which has Ti4Ni2Ox as the main phase. The number of PVAs and FE inclusions per unit area in each of these samples was measured and calculated from the SEM observation, and the PVA fraction was found using the following equation:
fPVA = NPVA/(NPVA + NFE)
where fPVA is the PVA fraction, NPVA is the number of PVA inclusions in a field of view per mm2, and NFE is the number of FE inclusions in field of view per mm2. The results are shown in Figure 10. A comparison of the samples with single-phase Ti(C,O), the samples with single-phase Ti4Ni2Ox, and the samples with Ti4Ni2Ox as the main phase revealed a trend for Ti4Ni2Ox to have more nonmetallic inclusions with the PVA morphology.
From these results, the Ti4Ni2Ox that forms in superelastic Ti-Ni fine wire exhibits a tendency of not only having coarser size compared with Ti(C,O), but also readily forming PVA. Thus, Ti4Ni2Ox appears to selectively serve as a crack origin due to these synergistic effects and is prone to degradation of fatigue properties.

4. Conclusions

This study examined the effect of nonmetallic inclusions on the fatigue properties of superelastic Ti-Ni fine wire and obtained the following results.
(1)
Nonmetallic inclusions in fine wire as the final product shape can be controlled to single-phase Ti(C,O), single-phase Ti4Ni2Ox, or a mixture of both phases by adjusting the concentrations of carbon and oxygen during dissolution.
(2)
Ti-Ni alloy fine wire samples containing nonmetallic inclusions of only single-phase Ti(C,O) exhibited higher fatigue strength than the samples containing single-phase Ti4Ni2Ox or mixed phases.
(3)
The fatigue strength of Ti-Ni alloy depended on the number of nonmetallic inclusions of a length of ≥2 μm.
(4)
Among the crack origins of fatigue fractures, many were observed to have originated from nonmetallic inclusions with the PVA morphology from the pairs of fatigue fracture surfaces.
(5)
When each of the samples before fatigue testing was observed, there was a tendency for ratios of the PVA morphology to be higher in the Ti4Ni2Ox phase than in the Ti(C,O) phase.

Author Contributions

F.Y., K.U., K.I., T.N. and M.N. conceived and designed the experiments; F.Y., Y.I., and S.K. (Suguru Kato and Sumio Kise) performed the experiments, analyzed the data, wrote original draft preparation; K.U., T.N. and M.N. wrote review and editing.

Funding

This work was partly supported by Grants-in-Aid for Scientific Research (A: No. 19H00829) from the Japanese Society for the Promotion of Science.

Acknowledgments

The authors are deeply grateful to Hisayoshi Yoneyama, Kenji Uruma and Yuji Oizumi of Furukawa Techno Materials for fabrication and testing of the samples.

Conflicts of Interest

The authors declare no conflicts of interest.

References

  1. Shabalovskaya, S.A. On the nature of the biocompatibility and on medical application of NiTi shape memory and superelastic alloys. Bio-Med. Mater. Eng. 1996, 6, 267–289. [Google Scholar]
  2. Morgan, N.B. Medical shape memory alloy applications the market and its products. Mater. Sci. Eng. A 2004, 378, 16–23. [Google Scholar] [CrossRef]
  3. Toro, A.; Zhou, F.; Wu, M.H.; Greertruyden, W.V.; Misiolek, W.Z. Characterization of non-metallic inclusion melting of NiTi shape memory alloys. J. Mater. Eng. Perform. 2009, 18, 448–485. [Google Scholar] [CrossRef]
  4. Dehghanghadikolaei, A.; Ibrahim, H.; Amerinatanzi, A.; Hashemi, M.; Moghaddam, N.S.; Elahinia, M. Improving corrosion resistance of additively manufactured nickel-titanium biomedical devices by micro-arc oxidation process. J. Mater. Sci. 2019, 54, 7333–7355. [Google Scholar] [CrossRef]
  5. Soria, S.R.; Callisaya, G.E.; Soul, H.; Claramonte, S.; Yawny, A. Fetting damage of Ni-rich ultrafine grained NiTi superelastic wires. J. Mech. Behav. Biomed. Mater. 2019, 90, 655–664. [Google Scholar] [CrossRef] [PubMed]
  6. ASTM F2063-12: Standard Specification for Wrought Nickel-Titanium Shape Memory Alloys for Medical Devices and Surgical Implants; ASTM International: West Conshohocken, PA, USA, 2012.
  7. Rahim, M.; Frenzel, J.; Frotscher, M.; Heuwer, B.; Hiebeler, J.; Eggeler, G. Bending rotaion HCF testing of pseudoelastic Ni-Ti shape memory alloys. Materialwissenschaft Werkstofftechnik 2013, 44, 633–640. [Google Scholar] [CrossRef]
  8. Norwich, D.W.; Fasching, A. A study of the effect of diameter on the fatigue properties of NiTi wire. J. Mater. Eng. Perform. 2009, 18, 558–562. [Google Scholar] [CrossRef]
  9. Rahim, M.; Frenzel, J.; Frotscher, M.; Pfetzing-Micklinch, J.; Steeműller, R.; Wohlschlőgel, M.; Mughrabi, H.; Eggeler, G. Impurity levels and fatigue lives of pseudoelastic NiTi shape memory alloys. Acta Mater. 2013, 61, 3667–3686. [Google Scholar] [CrossRef]
  10. Sawaguchi, T.; Kaustrater, G.; Yawny, A.; Wagner, M.; Eggeler, G. Crack initiation and propagation in 50.9 at. pct Ni-Ti pseudoelastic shape-memory wires in bending-rotation fatigue. Matall. Mater. Trans. A 2003, 34A, 2847–2860. [Google Scholar] [CrossRef]
  11. Schaffer, J.E.; Plumley, D.L. Fatigue performance of Nitinol round wire with varying cold work reductions. J. Mater. Eng. Perform. 2009, 18, 563–568. [Google Scholar] [CrossRef]
  12. Ito, D.; Nishiwaki, N.; Ueda, K.; Narushima, T. Effect of Ba deoxidation on oxygen content in NiTi alloys and non-metallic inclusion. J. Mater. Sci. 2013, 48, 359–366. [Google Scholar] [CrossRef]
  13. Hara, K.; Ueda, K.; Narushima, T.; Yamashita, F.; Ishikawa, K. Effect of light elements on fatigue properties of NiTi wires for designing biomedical stents. In Proceedings of the 24th International Conference on Processing and Fabrication of Advanced Materials, Osaka, Japan, 18–20 December 2015. [Google Scholar]
  14. ASTM F2082-06: Standard Test Method for Determination of Transformation Temperature of Nickel-Titanium Shape Memory Alloy by Bend and Free Recovery; ASTM International: West Conshohocken, PA, USA, 2016.
  15. Nurushima, T.; Suzuki, K.; Murakami, T.; Ouchi, C.; Iguchi, Y. Fatigue properties of stainless steel wire ropes for electrodes in functional electrical stimulation system. Mater. Trans. 2005, 46, 2083–2088. [Google Scholar] [CrossRef]
  16. Yamashita, F.; Wakoh, M.; Ishikawa, K.; Shibata, H. In situ observation of nonmetallic inclusion formation in NiTi alloys. Mater. Trans. 2017, 12, 1729–1734. [Google Scholar] [CrossRef]
  17. Jiang, B.; Xiao, J.; Huang, K.; Hou, J.; Jiao, S.; Zhu, H. Experimental and first-principles study of Ti-C-O system interplay of thermodynamic and structural properties. J. Am. Ceram. Soc. 2017, 100, 2253–2265. [Google Scholar] [CrossRef]
Figure 1. Schematic illustration of the rotating bending fatigue test setup.
Metals 09 00999 g001
Figure 2. Scanning electron microscopy (SEM)-Backscattered electron (BSE) images of wire surfaces after electropolishing. (a) C30O100, (b) C100O100, (c) C200O100, (d) C200O400, (e) C300O300 and (f) C400O200. Insets in the upper right show enlarged micrographs taken from the framed area in each low-magnification images.
Metals 09 00999 g002
Figure 3. X-ray diffraction (XRD) patterns of nonmetallic inclusions extracted from six wire samples by selective potentiostatic etching by electrolytic dissolution (SPEED) technique.
Metals 09 00999 g003
Figure 4. Analysis of nonmetallic inclusions by phase and distribution of length parallel to the wire drawing direction. (a) C30O100, (b) C100O100, (c) C200O100, (d) C200O400, (e) C300O300, and (f) C400O200.
Metals 09 00999 g004
Figure 5. Stress-strain curves of Ti-Ni wires at 37 °C.
Metals 09 00999 g005
Figure 6. Fatigue curves of C30O100, C100O100, C200O100, C200O400, C300O300, and C400O200 wires in rotating bending fatigue tests in Hanks’ solution kept at 37 °C. Arrows indicate no failure after 107 cycles in the tests.
Metals 09 00999 g006
Figure 7. SEM-SE images of a pair of fracture surfaces of C300O300 wire after fatigue test. (a) Fracture surface containing Ti4Ni2Ox inclusion acted as crack initiation site. (b) Counter part of fracture surface containing void corresponding to the trace of inclusion in (a).
Metals 09 00999 g007
Figure 8. Relation between the fatigue strength and the number of nonmetallic inclusions of >2 μm in length parallel to the wire drawing direction.
Metals 09 00999 g008
Figure 9. SEM-BSE image of C200O400 wire surface without failure after 107 cycles in the fatigue tests.
Metals 09 00999 g009
Figure 10. The relationship between particle and void assemblies (PVA) fraction and inclusion phase. The plots show the mean of 5 measurements and the error bar.
Metals 09 00999 g010
Table 1. Chemical compositions (mass%) and Af temperature of Ti-Ni alloys.
NotationCONC/OAf, °C
C30O1000.00330.01180.00070.2832.1
C100O1000.01080.01080.00091.0031.9
C200O1000.01890.01160.00131.6329.5
C200O4000.02120.03990.00100.5332.8
C300O3000.02970.02490.00101.1928.5
C400O2000.03910.01870.00162.0929.2
Table 2. Young’s modulus of Ti-Ni wires.
Ti-Ni WireYoung’s Modulus, GPa
C30O10048.27
C100O10049.35
C200O10047.31
C200O40052.30
C300O30050.38
C400O20047.05
Table 3. Energy-dispersive X-ray spectroscopy (EDS) analysis of nonmetallic inclusions at the crack origins in a fatigue fracture surface of C300O300 wire.
ElementContent (at.%)
Ti52.42
Ni27.15
O16.28
C4.15

