Article

Analysis, Validation and Optimization of the Multi-Stage Sequential Wiredrawing Process of EN AW-1370 Aluminium

by
Óscar Rodríguez-Alabanda
*,
Pablo E. Romero
,
Esther Molero
and
Guillermo Guerrero-Vaca
Department of Mechanical Engineering, University of Cordoba, Medina Azahara Avenue 5, 14071 Cordoba, Spain
*
Author to whom correspondence should be addressed.
Metals 2019, 9(9), 1021; https://doi.org/10.3390/met9091021
Submission received: 20 August 2019 / Revised: 16 September 2019 / Accepted: 18 September 2019 / Published: 19 September 2019
(This article belongs to the Special Issue Analysis and Design of Metal-Forming Processes)

Abstract

:
For the wiredrawing of aluminium, the initial wire rod is obtained by continuous inverted casting. The raw geometry is industrially processed in a linear multi-step wiredrawing sequence to obtain a wire that is commonly used for the manufacture of electrical conductors. In the present work a complete study of the material has been made. The experimental procedure consisted in the realization of a sequence of section reduction stages in the laboratory, a sequence designed following the technological criteria recommended by the manufacturer of the drawing machine in which the industrial process will be implemented. From the specimens corresponding to each reduction step, it has been possible to know the evolution of the main mechanical properties when this pure aluminium is processed by wiredrawing. This information has led to establish the hardening law by which it is possible characterize the plastic behaviour of this pure metal when it is transformed by this specific sequential process of cold forming. The strain hardening law has been implemented in a numerical simulation software application and the experimental setup has been simulated for its validation. Finally, the classic analytical solution founded in the “slab method” has been applied for the design of a proposal for the optimization of the industrial wiredrawing process.

Graphical Abstract

1. Introduction

Cunext Group is an Andalusian business group that has been dedicated for years to the transformation of copper of the highest quality and today goes a step further into the aluminum industry. Belonging to this business group, the production plant located in Córdoba (Cunext Copper Industries S.L., Córdoba, Spain) until now has been dedicated, among other products, to the manufacture of copper wire by wiredrawing but is currently immersed in the start-up of a new production line to obtain pure aluminum wire. Their goal: to be a leader in the manufacture of efficient materials for the transmission of electrical energy and data.
Along with copper, aluminium has an electrical conductivity high enough for use as an electrical conductor. Although the conductivity of the EN AW-1370 aluminium alloy [1] is scarcely around 62% annealed copper, it is only one third the weight and can, therefore, conduct twice as much electricity when compared with copper of the same weight. The EN-AW 1XXX series aluminium alloys, defined as controlled unalloyed pure aluminium composition, are commonly used in the electrical, food packaging and chemical industries, among others [2], and one of the main characteristics of these alloys is that they can only be hardened by cold working [3].
In the wiredrawing process, a wire rod obtained by continuous casting [4] is used as a raw material, which has been prepared, cleaned and fastened so that it can be passed through the first die of the multi-step processing sequence. This cold metal forming technique is used to obtain cables, tubes, rods and bars by means of a progressive reduction applied in the area of the section of the processed product. The degree of deformation and how this deformation has been applied will directly affect the mechanical properties of the final product, improving to a greater or lesser extent its efficiency and resistance in service conditions.
The drawing force (Fe) is the pulling force required in the wire, at the exit of the die, to be able to pass through it reducing its diameter and producing the corresponding elongation. This drawing force is mainly a function of [5,6]: die semi-angle (α), calibration length (Lc), reduction rate (r), defined by entrance diameter (d0) and exit diameter (df), yield limit of the metal (σY), and the friction coefficient in the wire-die interface (μ), as a function of the wire-die material, lubrication and velocity.
Cold working describes the process to modify the mechanical characteristics of a metal by changing its shape, without heating it to its recrystallization temperature. The work hardening of the metal involves a substantial increase in value of the yield limit (σY) and of breaking limit (σuts). The determination of this condition is essential to be able to design a multi-stage wiredrawing process optimally, allowing to use analytical and numerical methods for the design of the sequence of stages and for the analysis of the wiredrawing process [7,8].
To foretell the behaviour of a plastically-deformed ductile metal, used the Ludwik–Hollomon law [9] must be, shown in Equation (1). In this expression, C is the coefficient of resistance to plastic deformation and n is the coefficient of hardening by deformation, both constants associated with the metal. This equation allows determining the value of the yield limit of the metal as a function of the accumulated deformation ε, after any of the stages of the multi-stage sequence:
σ Y ( i ) = σ Y ( 0 ) + C × ( ε ( i ) ) n
ε = l n ( A 0 A f )
Among others analytical models, the “slab method” is used to estimate the force (Fe) necessary to produce the deformation [10,11]. This method is based on the analysis of the state of equilibrium in the wire-die system just when the process reaches its stationarity and is easy to apply in axi-symmetric geometries. This analytical method offers good results if the effects of work hardening and wire-die friction are adequately implemented, but it is limited to very specific hypotheses and conditions, like homogeneous deformation and constant friction [12].
On the other hand, the finite element analysis (FEM) allows numerical simulations to be performed in which it is possible to determine the drawing stress not only at the die exit but also in the deformation zone [13,14]. In addition, this type of engineering software allows to see the distribution of strain, both in the final product and in the zone of deformation inside the die, among many other characteristics. In must to be noted that previous works consulted demonstrated the applicability of the FEM, obtaining results agree with experimental data in the prediction of the drawing force and wire breakage, allowing the study of the stress-strain distribution in the drawn material besides facilitating the analysis of the influence of the die geometry in the process [14,15,16,17,18,19,20,21].
In this work, a progressive wiredrawing sequence has been performed to obtain the samples needed to perform the tensile tests, starting from an aluminium rod wire obtained by inverse continuous casting. These samples were used to characterize the work hardening behaviour of the metal object study. From the results obtained, the Ludwik–Hollomon equation form of a strain hardening law has been determined for the EN AW-1370 aluminium processed by wiredrawing. The first objective of this work has been to define the hardening law that faithfully describes the evolution of the yield strength as a function of the degree of deformation applied in the process. This law is very useful for its implementation in the design and analysis of the multi-stage wiredrawing process of this specific material.
The final objective is focused on the implementation of the material behaviour law for the study of the multi-stage drawing of aluminum by means of the numerical method (finite element method) and analytical (slab method) implemented in recent computer applications. The results of the corresponding numerical analysis of the sequence of reductions studied have been presented, using the numerical simulation software Deform [22] and the PullWorks [23] software has been presented as an option for the study of the possibilities of optimization of this specific sequential process.
This research work, performed in collaboration with Cunext Copper (Cunext Copper Industries S.L., Córdoba, Spain) [24,25], provides a method and procedure to define the behaviour law of a ductile metal subjected to the sequential multi-stage wiredrawing process, demonstrating that, through the complete study of the material and the implementation of the numerical method for the analysis of the process, it is possible to analyse and evaluate the technical characteristics of the tooling (dies) and drawing equipment (machine) in order to propose possible improvements in the industrial process.

2. Materials and Methods

2.1. Raw Material Object of Study

To obtain the samples tested in this work, a continuous multi-stage process has been designed, in which the wire-rod is passed through a series of consecutive reduction steps (drawing dies), reducing its diameter until reaching more than 90% in the value of the cumulative section reduction, a value very close to the admissible plastic forming limit of EN AW-1370 aluminium without annealing treatment. The chemical composition of this alloy is shown in Table 1 and was measured by scanning electron microscopy–energy dispersive X-ray spectroscopy (SEM–EDX) equipment (Jeol JSM 7800F, Jeol Ltd., Tokyo, Japan).
Aluminium presents a density around one third that of copper making it one of the lightest industrially and commercially used metals. Aluminium, in comparison with other metals, increases its tensile strength increases with decreasing temperature while retaining its toughness. In addition, the excellent resistance to corrosion at air exposure of this metal is well known. On the other hand, cold working and heat-treating can all be utilised to tailor the properties of pure aluminium.
In the case of multi-stage wiredrawing, the sequence of consecutive stages and geometric design of each drawing die will condition the final mechanical properties of the aluminium wire [8]. The wiredrawing sequence established in this experiment starts from a diameter of 9.43 mm and the raw aluminium rod has been obtained by an upwards vertical casting system. The in-line wiredrawing machine used to process the wire up to its final diameter of 2.70 mm is shown in the Figure 1.
The initial casting aluminium rod-wire has been subjected to the corresponding tensile test and the mechanical properties measured are shown in Table 2.

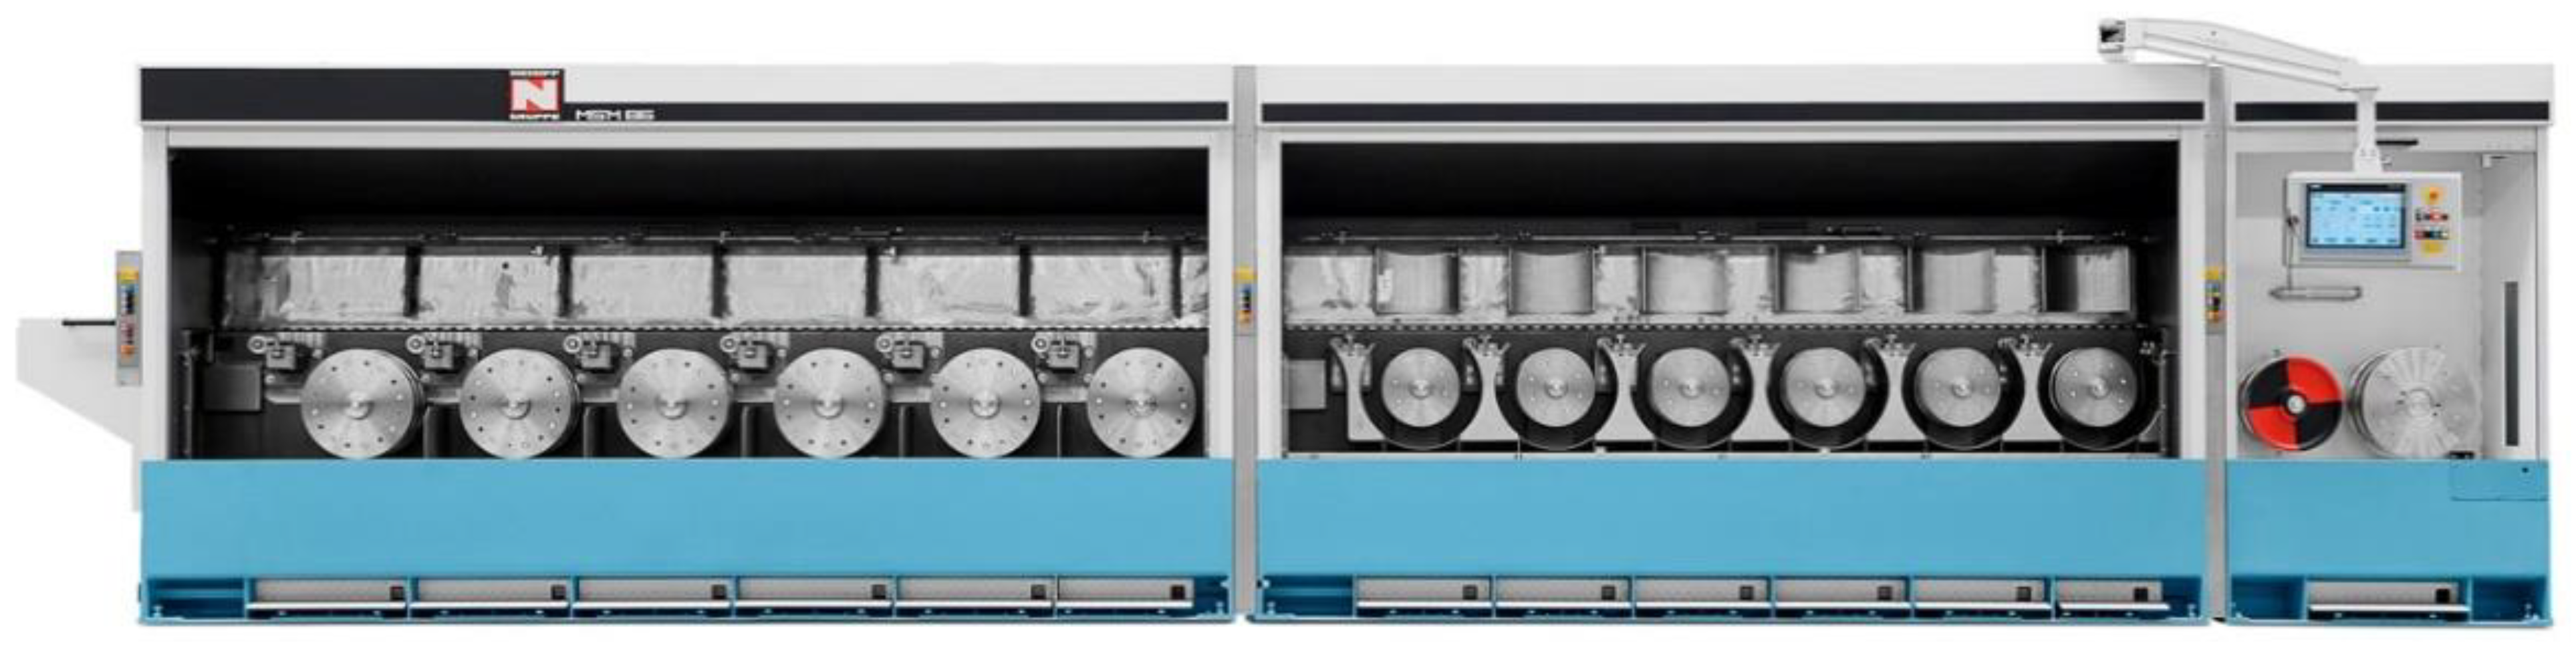
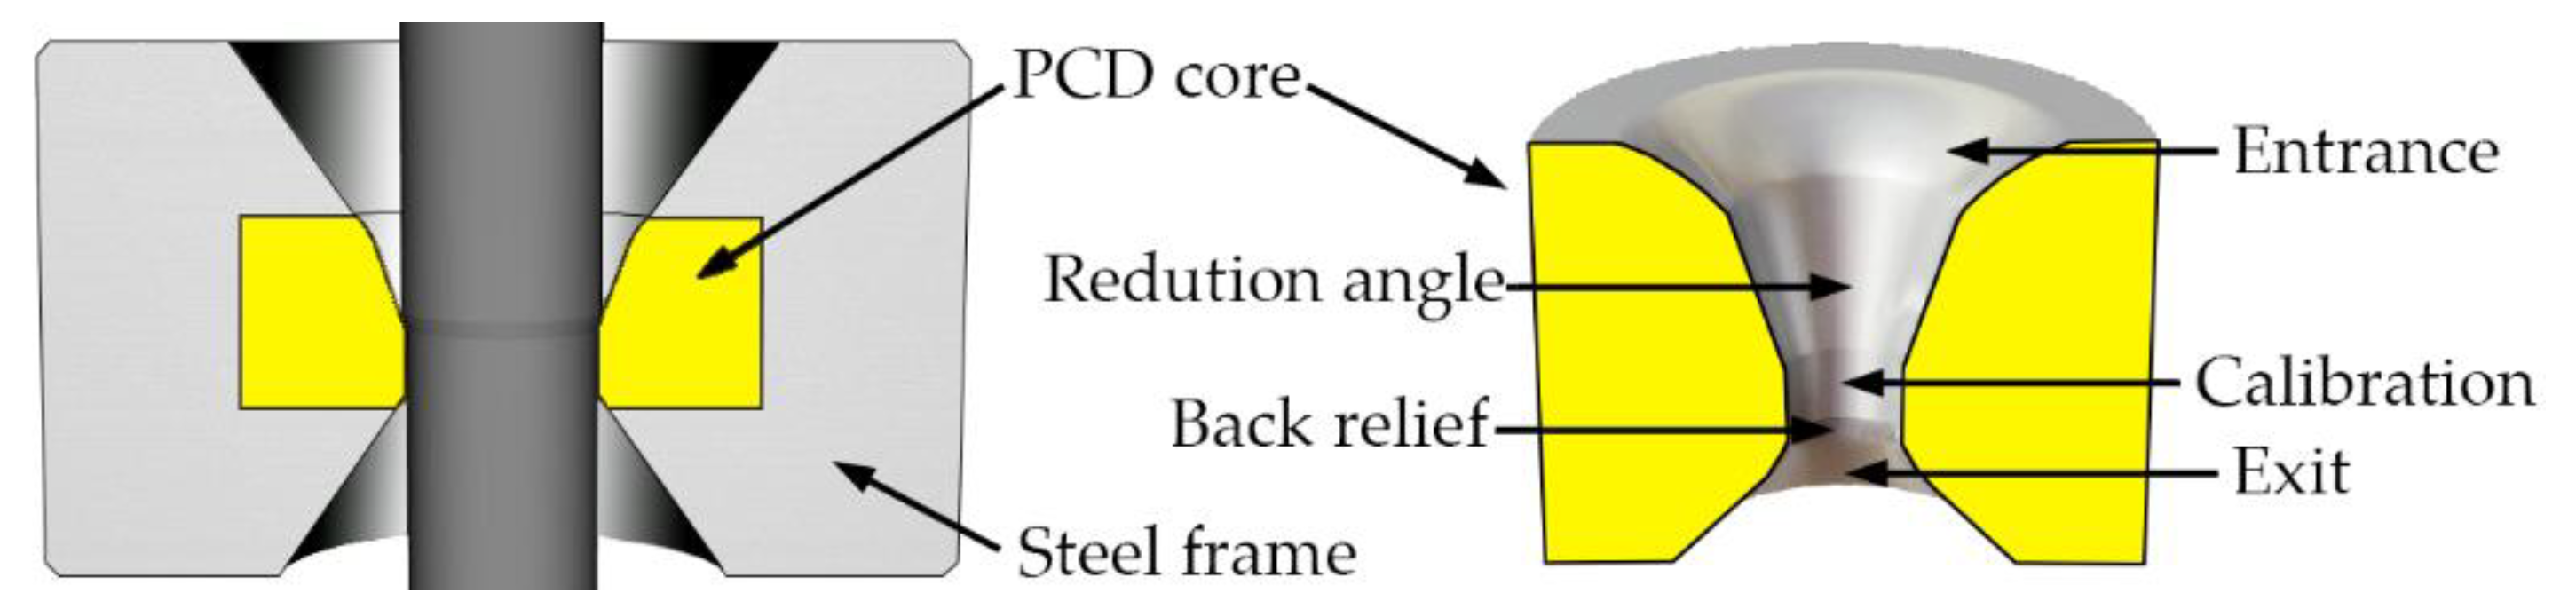
2.2. Equipment, Tooling and Lubrication

A Niehoff MSM-86 multi-stage wiredrawing industrial machine (Niehoff Stranding Technology, Badalona, Spain) has been used to realize the experimental sequence of reductions, mounting each one of the eleven dies for the wiredrawing sequence established for the cold forming of the consecutive samples. The production speed in the industrial process has been set at 21,000 mm∙s−1.
The Niehoff MSM 86 wiredrawing machine works under the principle of “sliding capstans” to avoid instabilities in the wire before each drawing die. This backpull system is perfectly described by Valverg [20]. In this system, basically, the pulling capstan works at a slightly higher speed to that necessary to absorb the elongation of the stretched wire; then the pulled wire undergoes a slow backward sliding movement in relation to the capstan surface. In this way, this effect causes that, in the next step and just after the pulling capstan, a minimum tensile load will maintain the back-pulling effect on the wire ahead of the next die. The backpull effect can be neglected for calculation of the total drawing force. The preliminary calculations made with PullWorks application (in which the analytical method for the calculation of backpull stress is implemented [26]) demonstrated that this component achieves a very small value compared to the drawing force necessary to deform the wire through the die. These calculations have been done for μ = 0.47, friction coefficient between mild steel and aluminium [27]. Definitively, its effect has been dismissed in order to simplify the definition of boundary conditions for the numerical simulations performed in this work.
The dies used are made with steel body and polycrystalline diamond (PCD) core, designed with a die semi-angle α = 18° [28] and a calibration length Lc = 0.30∙df, designed and supplied by Esteves Group (Esteves Group España, Barcelona, Spain) [29]. The geometry of each one of the dies has been verified by the computer application Drawing Die Wizard [30]. All the wiredrawing dies have been designed under the specifications of the specialists of the Esteves Group company and, together with the experience of the company Cunext Copper, allowed to preselect the most appropriate geometrical parameters for the construction of the drawing dies used for this work. It must be noted that Wistreich [20,31,32,33] determined the optimum die semi-angle values between 4–10°, associated to a reduced drawing stress, for copper wiredrawing but, in the aluminium case, the optimum die semi-angle can reach 8–18° in the sequential multi-stage wiredrawing [12,34].
The sequential wiredrawing process setup is shown in the Table 3 and the geometry and construction of the dies used is represented in Figure 2.
This study is focused on the numerical simulation of the industrial wiredrawing process that is currently in production at the Cunext Copper company workshop. We have sought to characterize this specific sequence constituted in 11 dies/stages in a machine that allows a maximum of 12 dies in line. As is shown (Table 3), the sequential wiredrawing process object of this study reaches a total value of 91.93% in area reduction. The industrial sequence works near 20% in every stage, according to the recommendations for this metal shown in diverse documents consulted [1,2,3] and backed by the experience of the manufacturer and the die maker.
The PCD (poly-crystalline diamond) presents its lower coefficient of friction μ for a medium grain [35]. Even so, the process requires a good water-oil emulsion lubrication for its proper operation and for this reason Metalube Lubricool 22G oil-water-based emulsion has been used (Metalube Limited, Manchester, UK) in the process experiment. The water-oil emulsion has been applied in a complete immersion box so that the drawing dies are completely submerged in all the stages.
In the plastic forming process of most metals, the friction between wire-die plays a crucial part. Forces, flow patterns, tool wear and surface finish of the product, as well as the capacity of the technical equipment, are all affected by this factor. A complete analysis of this process considers the coefficient of friction as a variable and a quantitative knowledge of its value acting during processing is essential [36].
As has been noted in various papers consulted, the experimental determination of the coefficient of friction is a complex and laborious task [36,37]. In the present work, FEM simulations have been performed considering μmáx = 0.2 between cast aluminium and PCD [37].
From this experimental setup, a strain hardening law was determined and implemented with the aim of analyse the material behaviour in each one of the drawing stages.
The uniaxial tensile tests were made on a Shimadzu AG-250kN Xplus machine (Shimadzu Europa GmbH, Griesheim, Germany) and the data collected by TrapeziumX software (Shimadzu Europa GmbH, Griesheim, Germany). The samples are 100 mm long and the length between control points (Lo) is defined by Equation (3) as a function of the initial section (So), where k is proportionality coefficient (k = 5.65) [38]:
L 0 = k S 0
Additionally, the material study has been complemented with the analysis of the aspect in the fracture zone present in the samples submitted to the tensile tests and the fracture nature has been shown in the images obtained by scanning electron microscopy performed on Jeol JSM 7800F equipment (Jeol Ltd., Tokyo, Japan).
Consequently, this work concludes with the numerical analysis of the current process to define, by the analytical method, an optimized alternative to this industrial multi-stage process for the manufacturing of aluminium wire, as a roughing semi-finished product in the wiredrawing machine in operation at the facilities of the company Cunext Copper.

2.3. The Finite Element Method Implementation: Deform 2D Software

Once metal hardening law has been defined, each one of the eleven the stages corresponding to the area reductions applied in the experimental setup have been modelled by the Deform 2D (Scientific Forming Technologies Corporation, Columbus, OH, USA) FEM software application with the aim of numerically analysing the material behaviour [22].
The model consists of a geometric design of the wire-die and a definition of the materials, as well as the boundary conditions of the wire-die system in the preprocessor module interface [39]. An axi-symmetric wire-die dynamic system has been considered, establishing an adequate number of calculation steps for each wiredrawing stage, saving results every five steps to speed up the system. In the preprocessor, the 2D wire-die geometries and the nature of each of them have been defined: perfect rigid and plastic, respectively. The finite elements meshing that constitute the wire must be created and the wire material assigned to it. The speed (v) of the wire has been defined as a collinear movement with the axis of revolution of the die (mm∙sec−1), calculated by Equation (4) applied to each drawing step and considering vf = 21,000 mm∙sec−1 (21 m∙sec−1) at the output of the last die in the process. Finally, the process was considered isothermal at 20 °C in the numerical simulations. The influence of the backpull effect has not been implemented in the FEM simulations.
vo × Ao = vf × Af
From the database of the model, the processor has been able to generate the simulations for each stage that constitutes the studied sequence. The Deform 2D postprocessor analyses the evolution of the different variables during the process, allowing knowing the state of the metal in the deformed wires after finishing each stage or reduction step.

2.4. Process Design by the Analytical Method: PullWorks Software

This work culminates with the design and analysis of the multi-stage wiredrawing process through the so-called “slab method”. The PullWorks software application [8] has been applied for this purpose. This computer aided manufacturing (CAM) tool is based in the analytical solution known as “slab method”. This method is founded in the study of the balance of forces involved in the wire-die system (Figure 3), since its mathematical implementation is simple and by virtue of which the results agree with the data from experiments and simulations that have been obtained in consulted works [5,9,40].
For each of the stages in the multi-stage process, the input variables for this analytical procedure are, in addition to the strain hardening law and the properties of the material to be processed, the die semi-angle (α), calibration length (Lc), area reduction defined by the initial (d0) and final diameters (df) and the coefficient of friction (μ) in the die-wire interface. The value and distribution of the strains in the drawn wire section and the drawing force implied in the process (Fdraw) are a consequence of a homogeneous and an inhomogeneous deformation of the material as a function of the geometry of the die considering the friction action in the interface [5,8,13,41].
The PullWorks software tool is easy to use but, nevertheless, it is required that the user has sufficient knowledge about the operation of the process. The user must indicate all the working input conditions in the software interface: the material strain hardening law, the geometric parameters of each of the dies and the tribological parameters involved in the process. In this way, the software allows a minimum value for the shape coefficient Δ in all the process, facilitating the multi-stage wiredrawing sequence design. This shape coefficient is the quotient between the average diameter (dm) and the contact length in the die, defined in the Equation (5) as a function of the input diameter (d0), the output diameter (df) and the die semi-angle (α):
Δ = d m L = d 0 + d f d 0 d f × s i n α
Once the strain hardening law of EN AW-1370 aluminium (processed by wiredrawing) has been experimentally defined and numerically evaluated, the optimum sequence of stages for the industrial roughing wiredrawing process object of this study has been proposed with the aid of the PullWorks software application and considering all the process conditions and main variables [9,40].

3. Results and Discussion

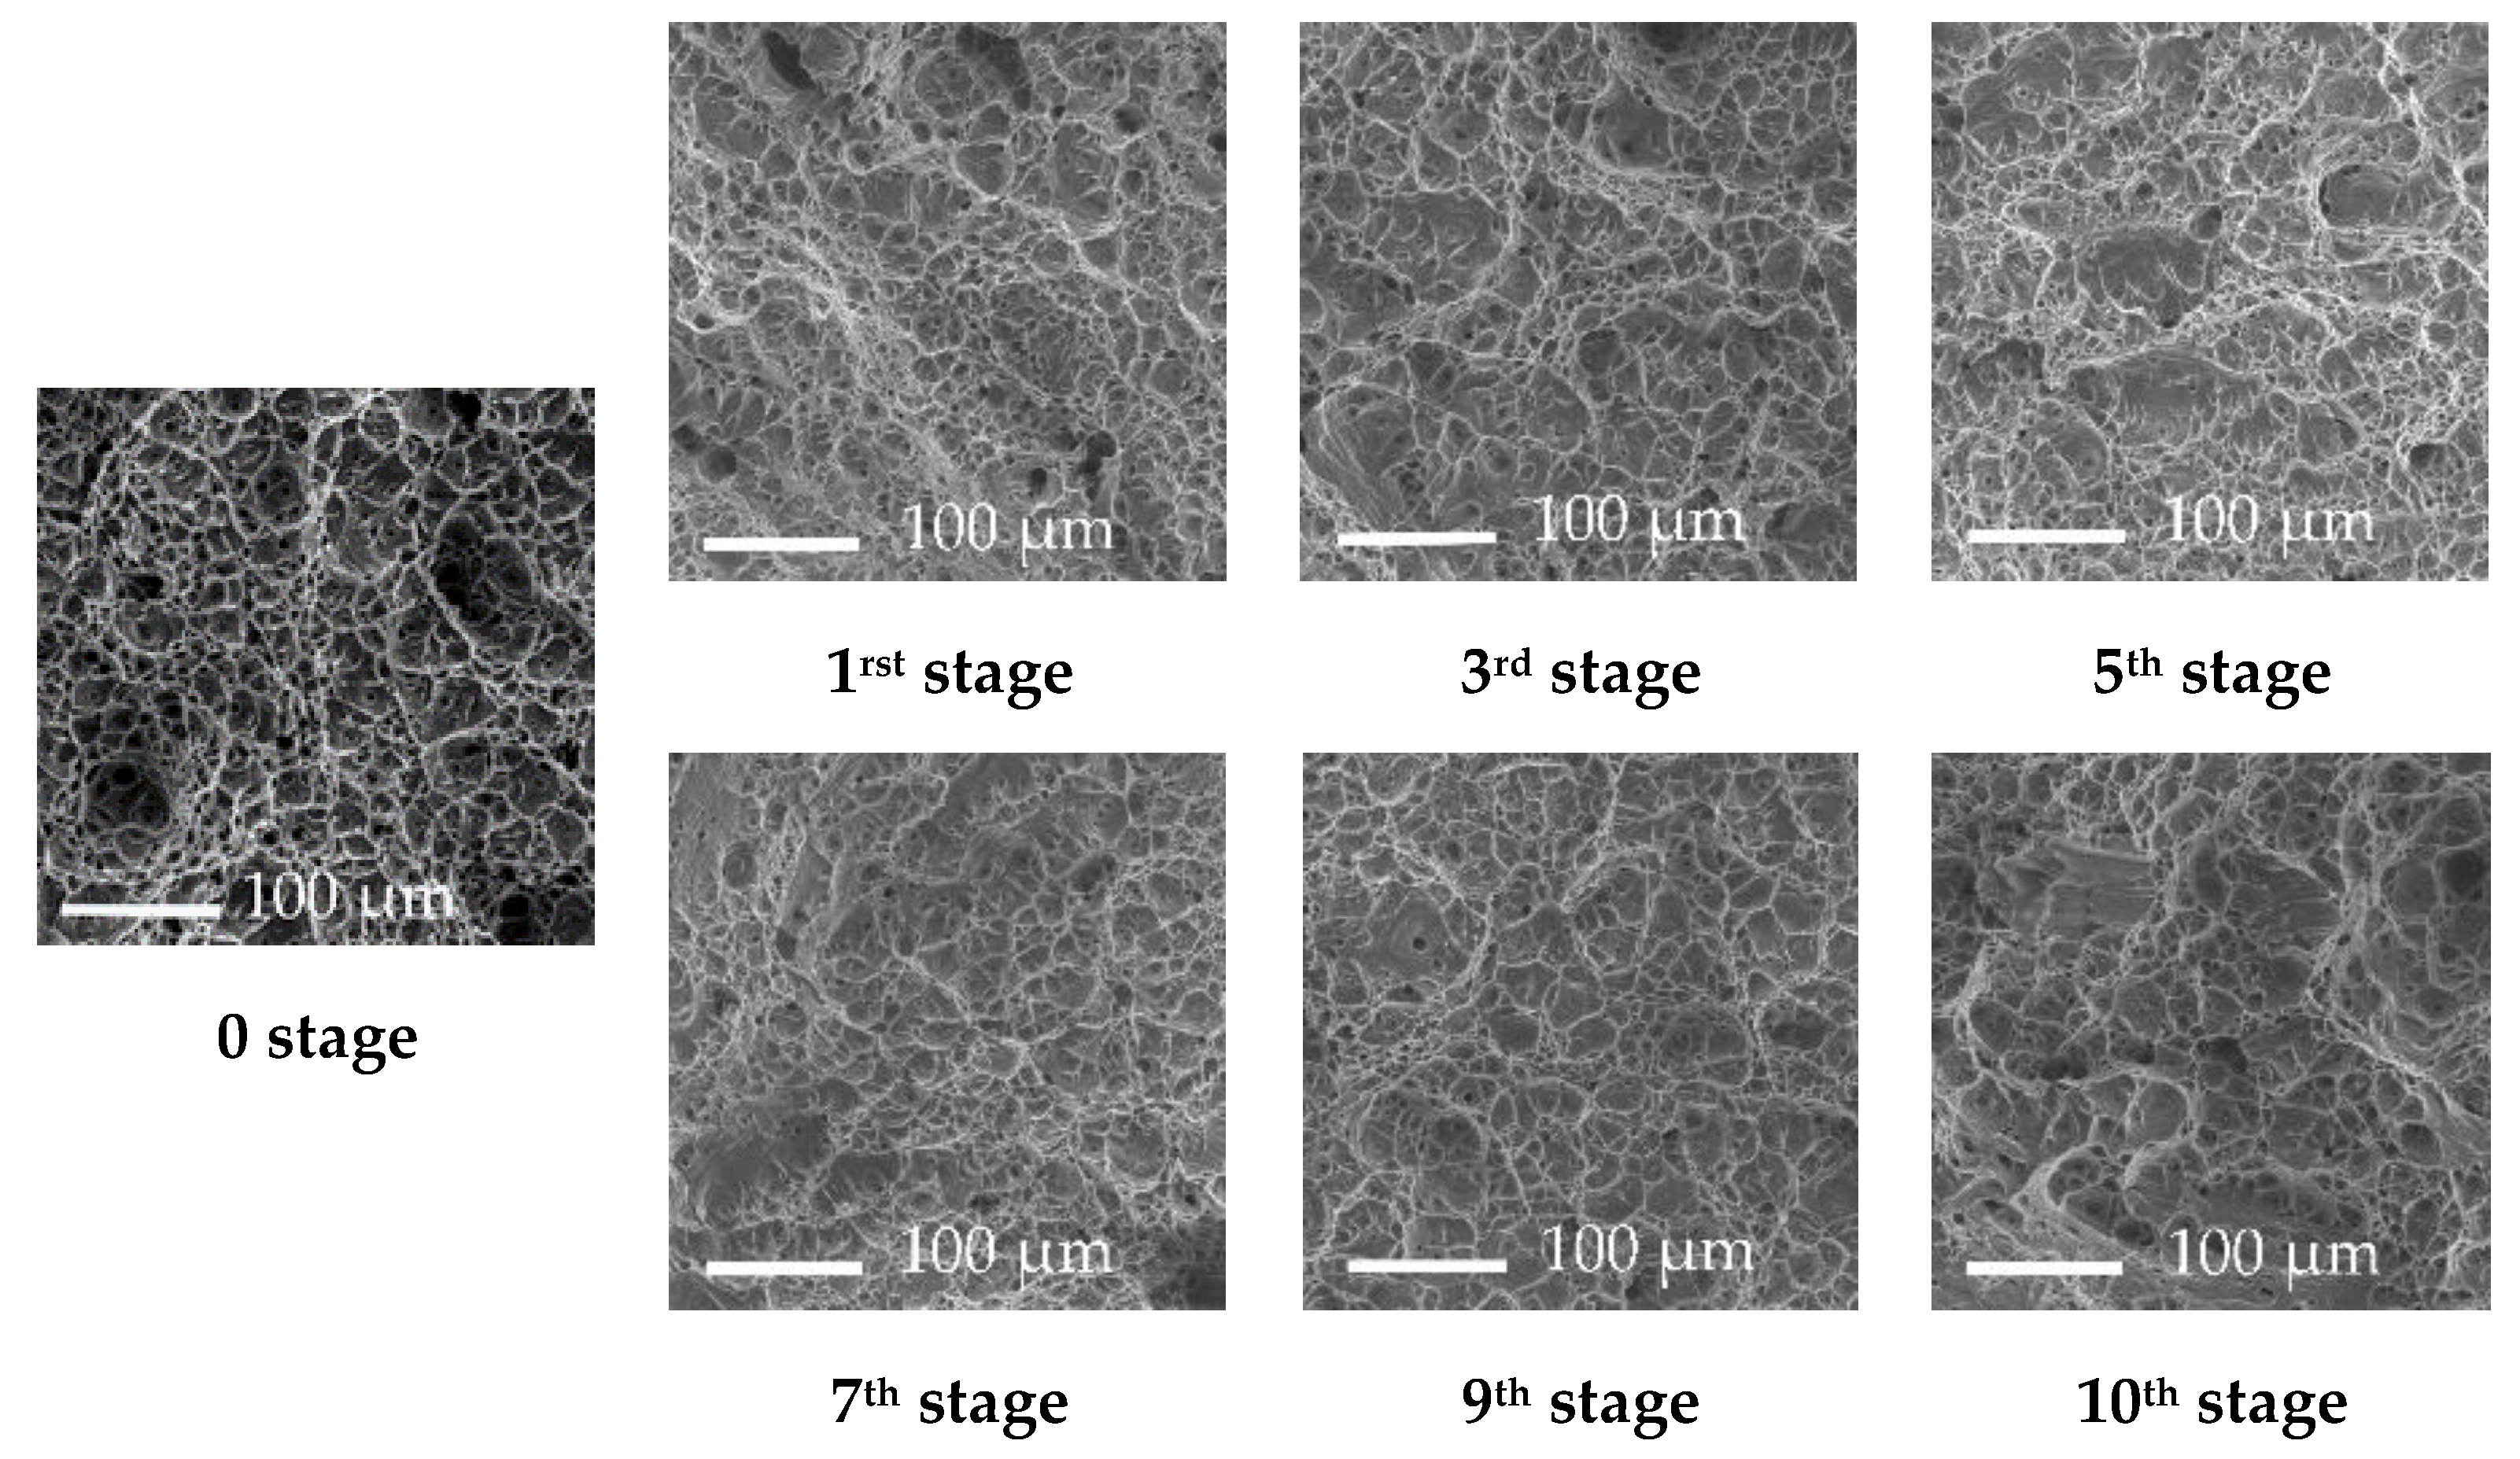
3.1. Strain Hardening Law Definition and Study of the Samples

The multi-stage wiredrawing sequence object of study is constituted in a progressive reduction, from Ø 9.50 to Ø 2.70 mm, and allowed us to obtain the samples used in the tensile tests.
Figure 4 shows the tensile test graph obtained by the TrapeziumX software, used in a Shimadzu AG-250kN Xplus machine. Table 4 shows the calculated process data and the results obtained after the tensile tests.
Consequently, the Ludwik–Hollomon strain hardening law of EN AW-1370 aluminium processed by wiredrawing has been determined by regression. The corresponding curve is graphically shown in the Figure 5, is expressed by the Equation (6) and represents the evolution of the yield point as a function of the degree of deformation applied by cold drawing.
σ Y ( i ) = 74.2 + 59.804 × ( ε ( i ) ) 0.44
The Ludwik–Hollomon type law of hardening by cold deformation allows to predict the values of the yield stress (σY) by its implementation both in the analytical model and in the numerical applied in this case of study. This law faithfully describes the tendency that presents the value of the yield stress (σY) as a function of the unit deformation (ε), in any stage of the sequential wiredrawing process. The values corresponding to the hardening constants are C = 59.804 and n = 0.44 and the yield strength of the EN AW-1370 pure aluminium in its annealed initial state is σY(0) = 74.2 MPa.
Figure 6 shows the aspect of breakage zone in the samples subjected to the tensile tests, corresponding to representative stages in the sequential wiredrawing process.
Figure 7 shows the microscopic aspect in the fracture surface of some representative samples of the multi-stage wiredrawing sequence object of study.
In the SEM images, a moderate ductile fracture characteristic in metals can be observed. An extensive plastic deformation ahead of crack is presented in all the tested samples and the classic “cup” in the fracture shape is presented. In spite of not seeing signs of fragile fracture in the studied sequence, if it has been observed how the edge of the fracture zone evolves in a smooth circular way in the initial wire rod towards a break with a more heterogeneous edge at the end of the process as a consequence of hardening by cold deformation of the material.
The aspect of the surface in the fracture surface presents spherical “dimples” characteristic in the formation of the micro-voids that initiate crack formation in a ductile fracture. Just after the initial crack formation, typically growing at 90° to the applied tensile stress, the crack propagation occurs by shear deformation and the ductile fracture of the metal materializes.

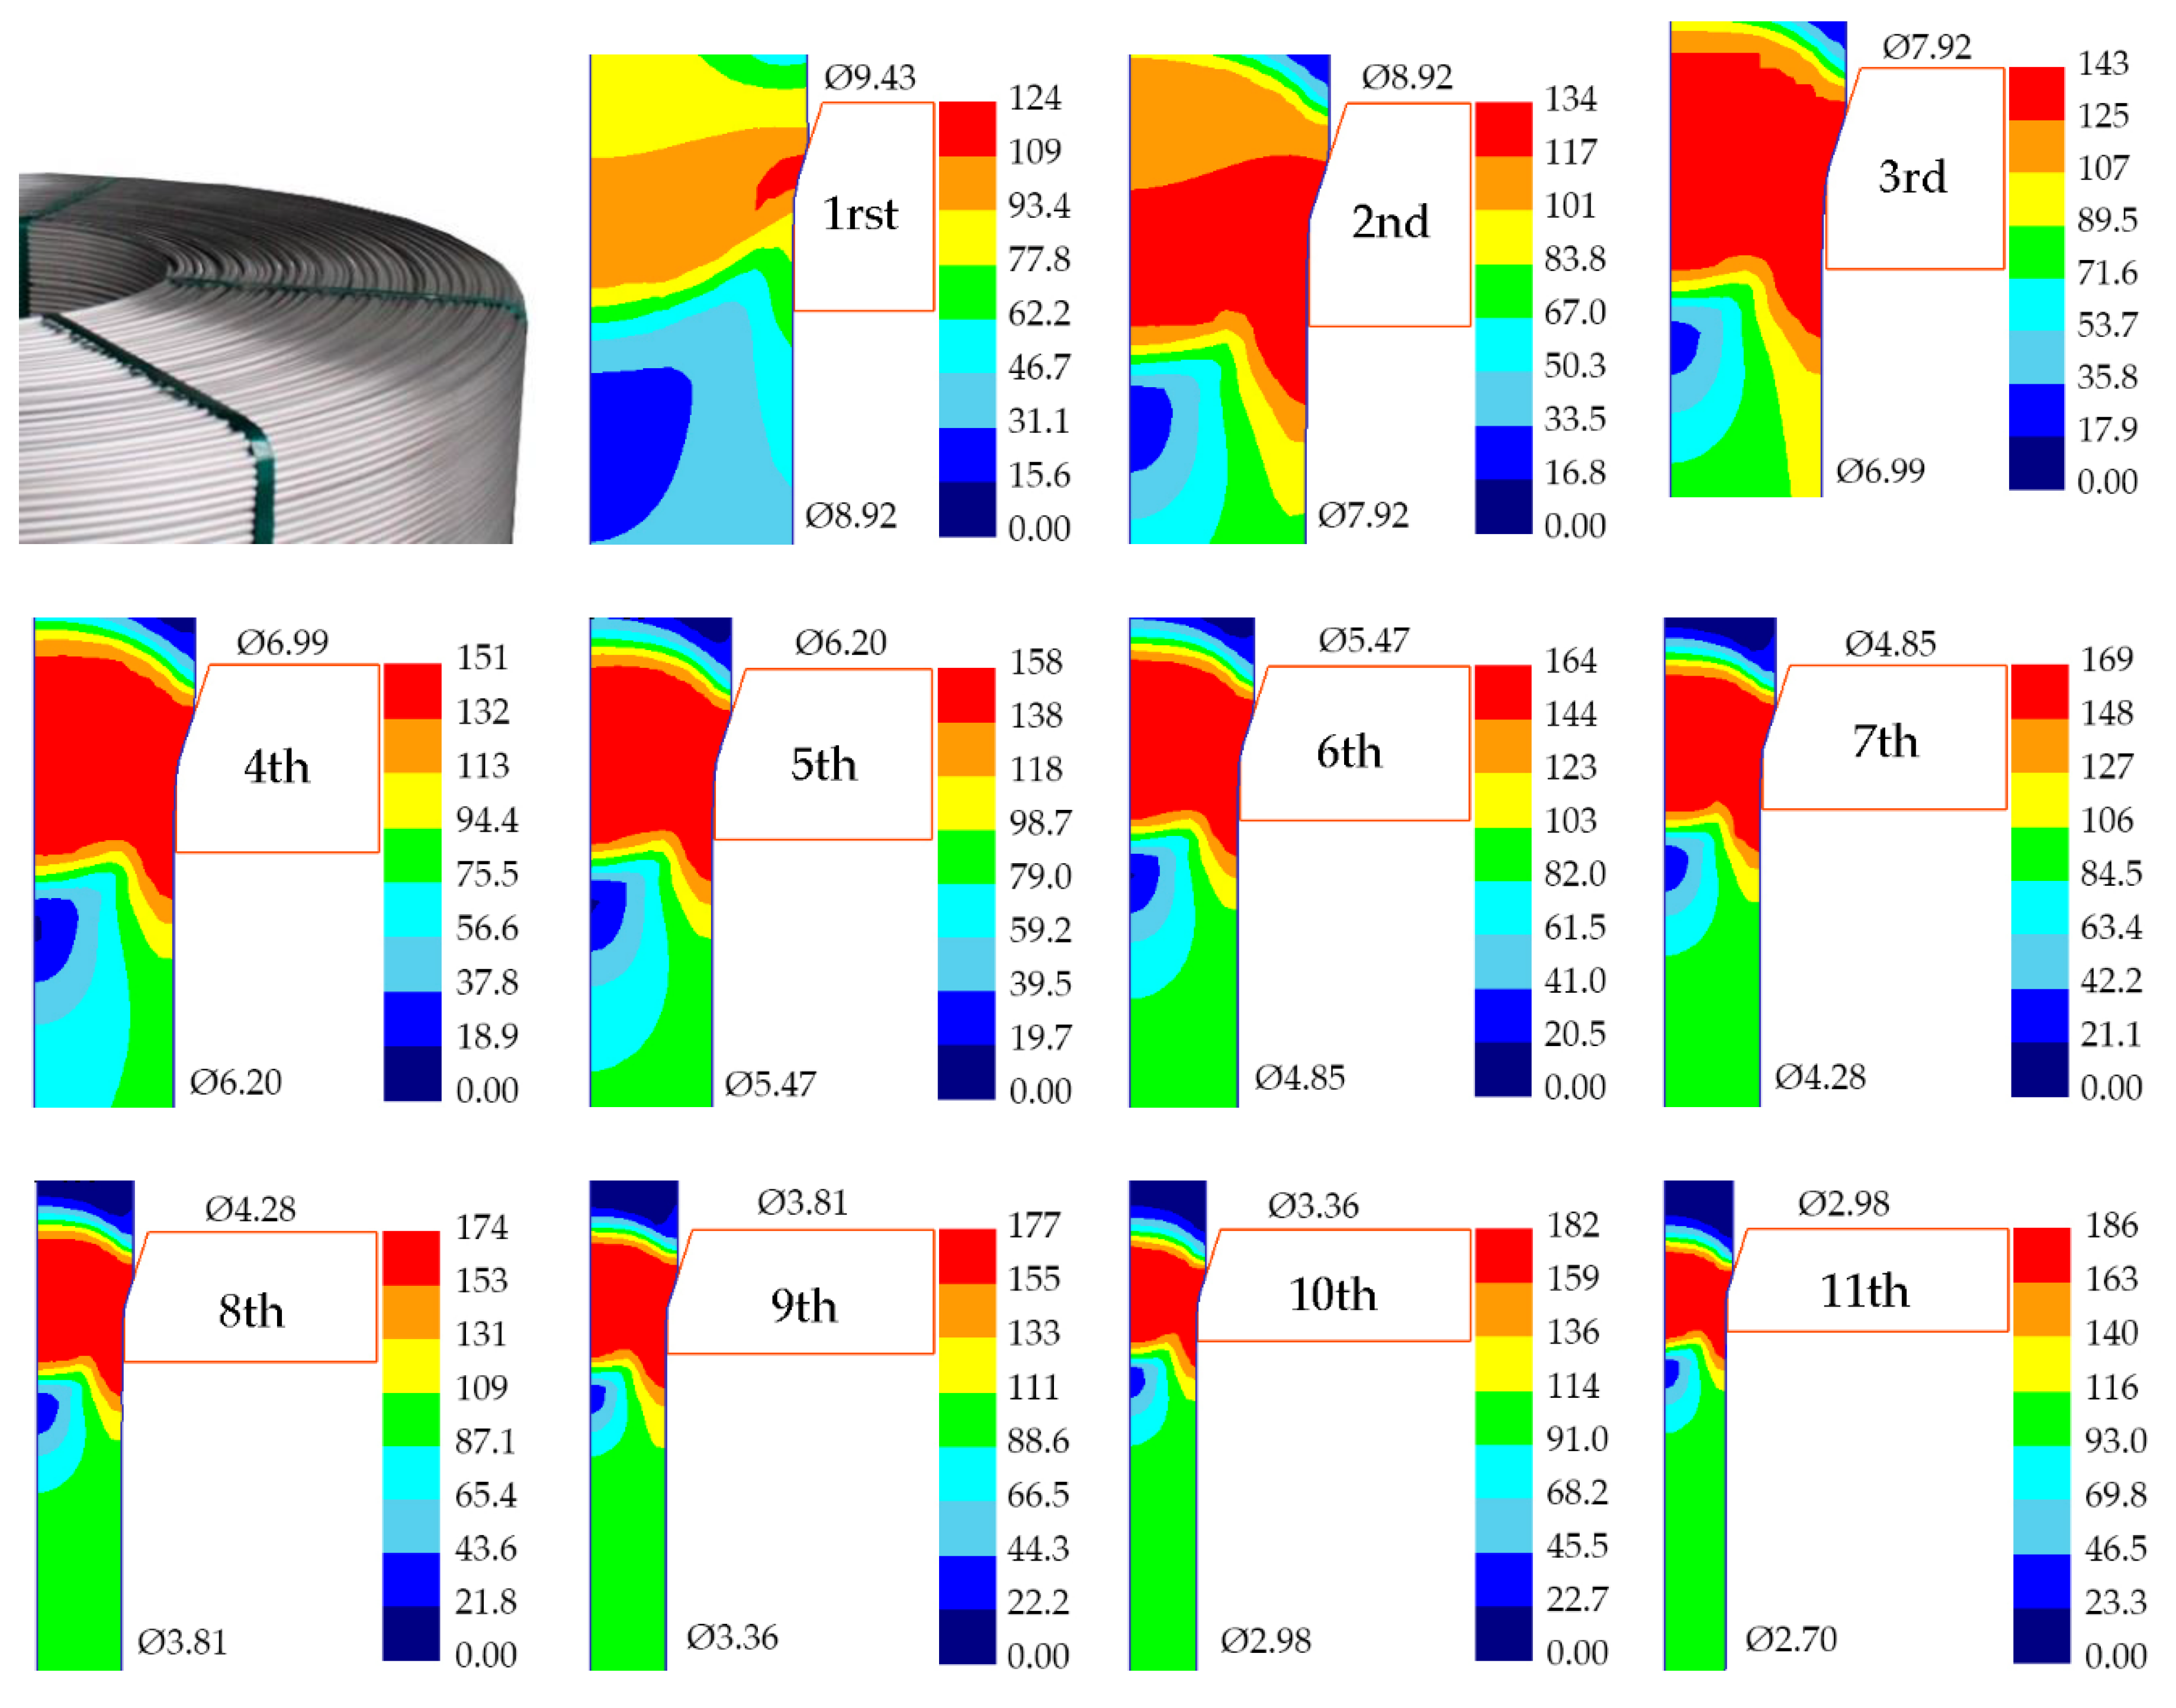
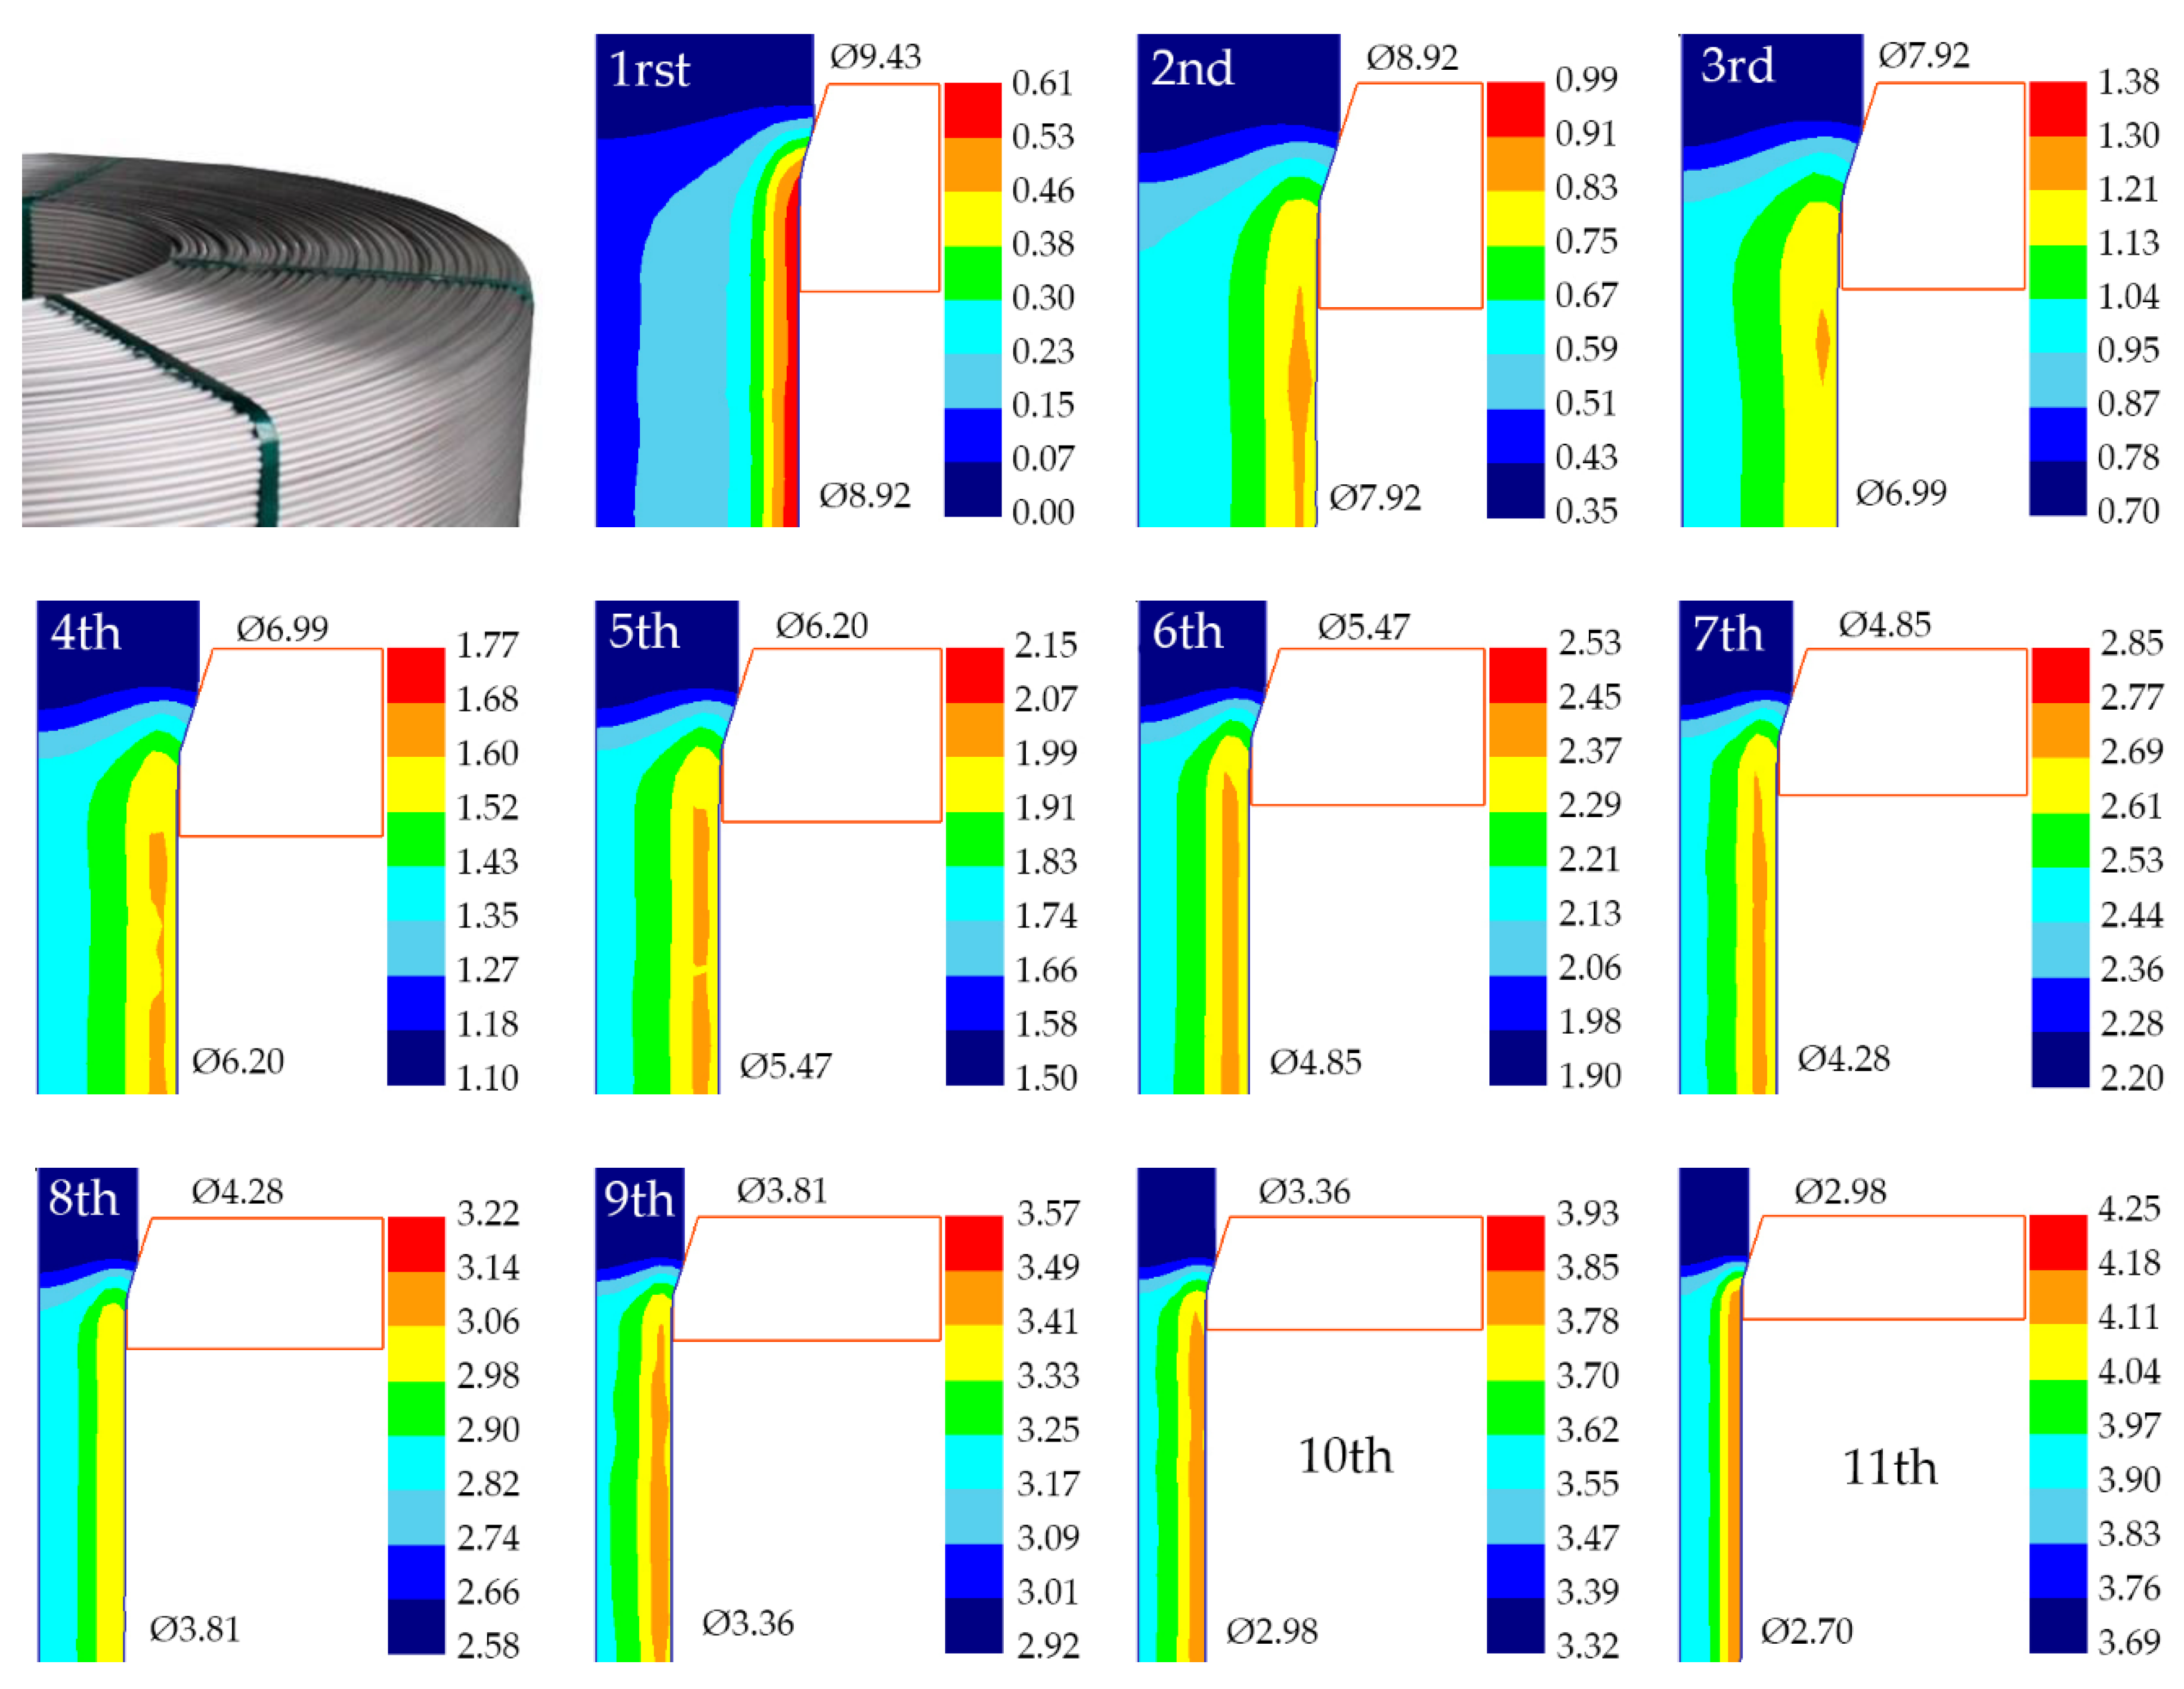
3.2. Simulations by the Finite Element Method

Once the law of hardening by cold deformation has been determined, the FEM modelling of each one of the reduction stages of the sequential wiredrawing process carried out has been done.
Figure 8 shows the distribution of effective stresses in the section of the wire during the forming process, for each of the 11 wiredrawing stages. In this feature, the values of the effective stress reached in the deformation zone inside the die reduction cone, its evolution as it passes through the calibration zone and at the exit in the drawn wire can be recognized.
The deformation zone (inside the die) is characterized where the maximum value of the effective stress occurs (σeff. (max.)) and the highest percentage of deformation occurs in this zone of reduction of the section. The deformed metal is maintained under the action of a constant tractional stress in all its section at the exit of the die, defined as drawing stress (σdraw) that is a consequence of the drawing force (Fe), the tensile force applied at the end of the wire. Into the zone of the reduction cone, a tensional state composed of tensile–compressive components is generated during the forming stationary process, while from the cylindrical calibration zone and towards the outlet of the die a tensile component is implied, as can be seen in the images obtained from the FE simulations.
As can be observed in the results, the value of the drawing stress (σdraw) is kept below the yield point of the deformed metal, in all the reductions of the sequence under study. This feature guarantees no undesired deformation occurred in the drawn wire and a uniform cylindrical section at the exit of the drawing dies.
Equation (7) defines the drawing force (Fe) as the product of the drawing stress (σdraw) and the area of the section of the drawn wire in each of the stages in the multi-stage wiredrawing process. Table 5 presents the results obtained for the drawing force and the main stresses involved in the wiredrawing process and concerning to the complete wiredrawing sequence.
F e = σ x e × S ( i )
The graph in the Figure 9 shows the evolution of the value of the significant stresses of the multi-stage wiredrawing process object of this study. The limit of yield of the metal is exceeded only into the zone of deformation, in the conical section into the die since the plastic deformation takes place during the process just into this zone. In all the simulated stages, the drawing stress (σdraw) always reaches values below this yield limit and this condition allows avoiding unwanted permanent deformation in the wire obtained at the exit of each stage.
The drawing stress (σdraw) has been measured considering the average value of effective stresses measured in different nodes in the area near the exit of the die in the simulations performed by Deform 2D and the drawing force (Fe) was obtained by a specific option in the post-processor.
Figure 10 shows the distribution of accumulated effective strain (εeff.) in each of the 11 wiredrawing stages. The accumulated strain distribution is not homogeneous in the whole section of the final wire, showing the smaller values in the core and greater near the wire surface in all stages.
The graph in the Figure 11 shows the evolution of the effective strain distribution in the complete section of the drawn wire (εeff.) in the multi-stage wiredrawing process, for each of the stages of the sequence object of this study.

3.3. Proposal for the Optimization of the Industrial Wiredrawing Process Sequence Design

At this point a proposal is presented to optimize the current industrial process. The study procedure consisted in the emulation of the current process conditions with the aim of improve the multi-step wiredrawing line by low-scale changes for the implementation in the same facilities in which the process is working.
The values of some of the input variables have been taken from the industrial process in operation, as are the geometrical data in terms of semi-angle of dies (αi) and calibration length (Lc (i)), taking values recommended by die manufacturer. The initial (d0) corresponds to the section of the initial aluminium wire rod and the final diameter (df) is the final product diameter.
All the analogous conditions to those applied in the wiredrawing line object of this improvement are shown in the Table 6.
The shape factor Δ introduced in the optimization procedure has been determined as the minimum value to get the same number of stages like the original sequence, since the Pullworks software system works under the principle of a constant delta value. It should be noted that the value of Δ normally associated with minimum drawing stress is in the range of 2–3 [33]. The emulation of the original roughing line was performed considering Δ = 5.20 and the obtained sequence is shown in the Table 7.
The proposed sequence presents eleven drawing passes, the same than the original process working in manufacturing plant. All the technological data, corresponding to the emulated roughing sequence, have been calculated for a final production velocity vf = 21 m∙sec−1.
As it can be observed in the results, the value of the drawing stress (σdraw) is always under the limit established by the yield limit of the drawn metal (σY). It should be noted that Pullworks sets the average value of the yield stress (σY) of the material as the process limit in each of the stages of the process. This methodology implements a conservative limit condition that guarantees a wiredrawing sequence without breaking the wire inside the die nor at the exit and prevents unwanted deformations in the drawn product. In the graphs of the Figure 12, both the drawing stress (σdraw) and the drawing force Fdraw are shown.
A comparison of the results obtained by the FEM simulations and those obtained with the analytical solution can be seen in the graphic representation. In Figure 12a it is observed that the evolution curve of the drawing stress (σdraw) corresponding to the optimized sequence constituted by the analytical solution has slightly lower values and presents a lower slope than the curve corresponding to the FEM simulations of the real sequence. This feature is due fundamentally to the nature of the different methods, numerical and analytical. It can be observed that the analytical results show a growing trend as well as those obtained by the numerical method.
Some previous works show that, on one hand, numerical methodology offers more accurate results respect to the study of the evolution and influence of the main parameters in the wiredrawing process [5,16,17,42] but, on the other hand, our recent work has demonstrated that the analytical methodology is suitable and simple to define the optimum wiredrawing sequence in a multi-stage process [7,8].
As it can be observed in Figure 12b, the drawing force (Fdraw) curves show an identical trend in the results obtained by all the methods applied and, concretely, the curve of drawing force (Fdraw) shows values slightly lower than those obtained by the numerical method.
The analytical solution implemented in the PullWorks software application constitutes a tool based on a lower limit solution, since it only considers the terms of homogenous deformation and the friction one while FEM also considers the effect of inhomogeneous deformations produced in the process. However, this work demonstrates once again the great potential of these two combined applications for the optimization and analysis of the sequential multistage drawing process.

4. Conclusions

The present work shows a procedure for the analysis and optimization of the multi-stage wiredrawing process that involves the fundamentals and techniques of the theory of plasticity. The methodology followed combines the functionalities of the numerical method with the suitability of the analytical method in the case of this particular cold forming process, combined to achieve the objective of analysis and process design.
FEM software application has offered us results about the material behaviour, while the Pullworks software application fundamentally implements the theoretical foundations that facilitates the calculations of the pass schedule design in a multi-stage wiredrawing process. Certainly, FEM is a method more accurate than the slab method and FEM provides the drawing stresses not only at the die exit but in the deformation zone as well. It should be noted that the analytical method underestimates the drawing stress value, since it only considers homogeneous deformation of the wire and the friction in the die-wire interface.
Of the results obtained, the following conclusions should be highlighted:
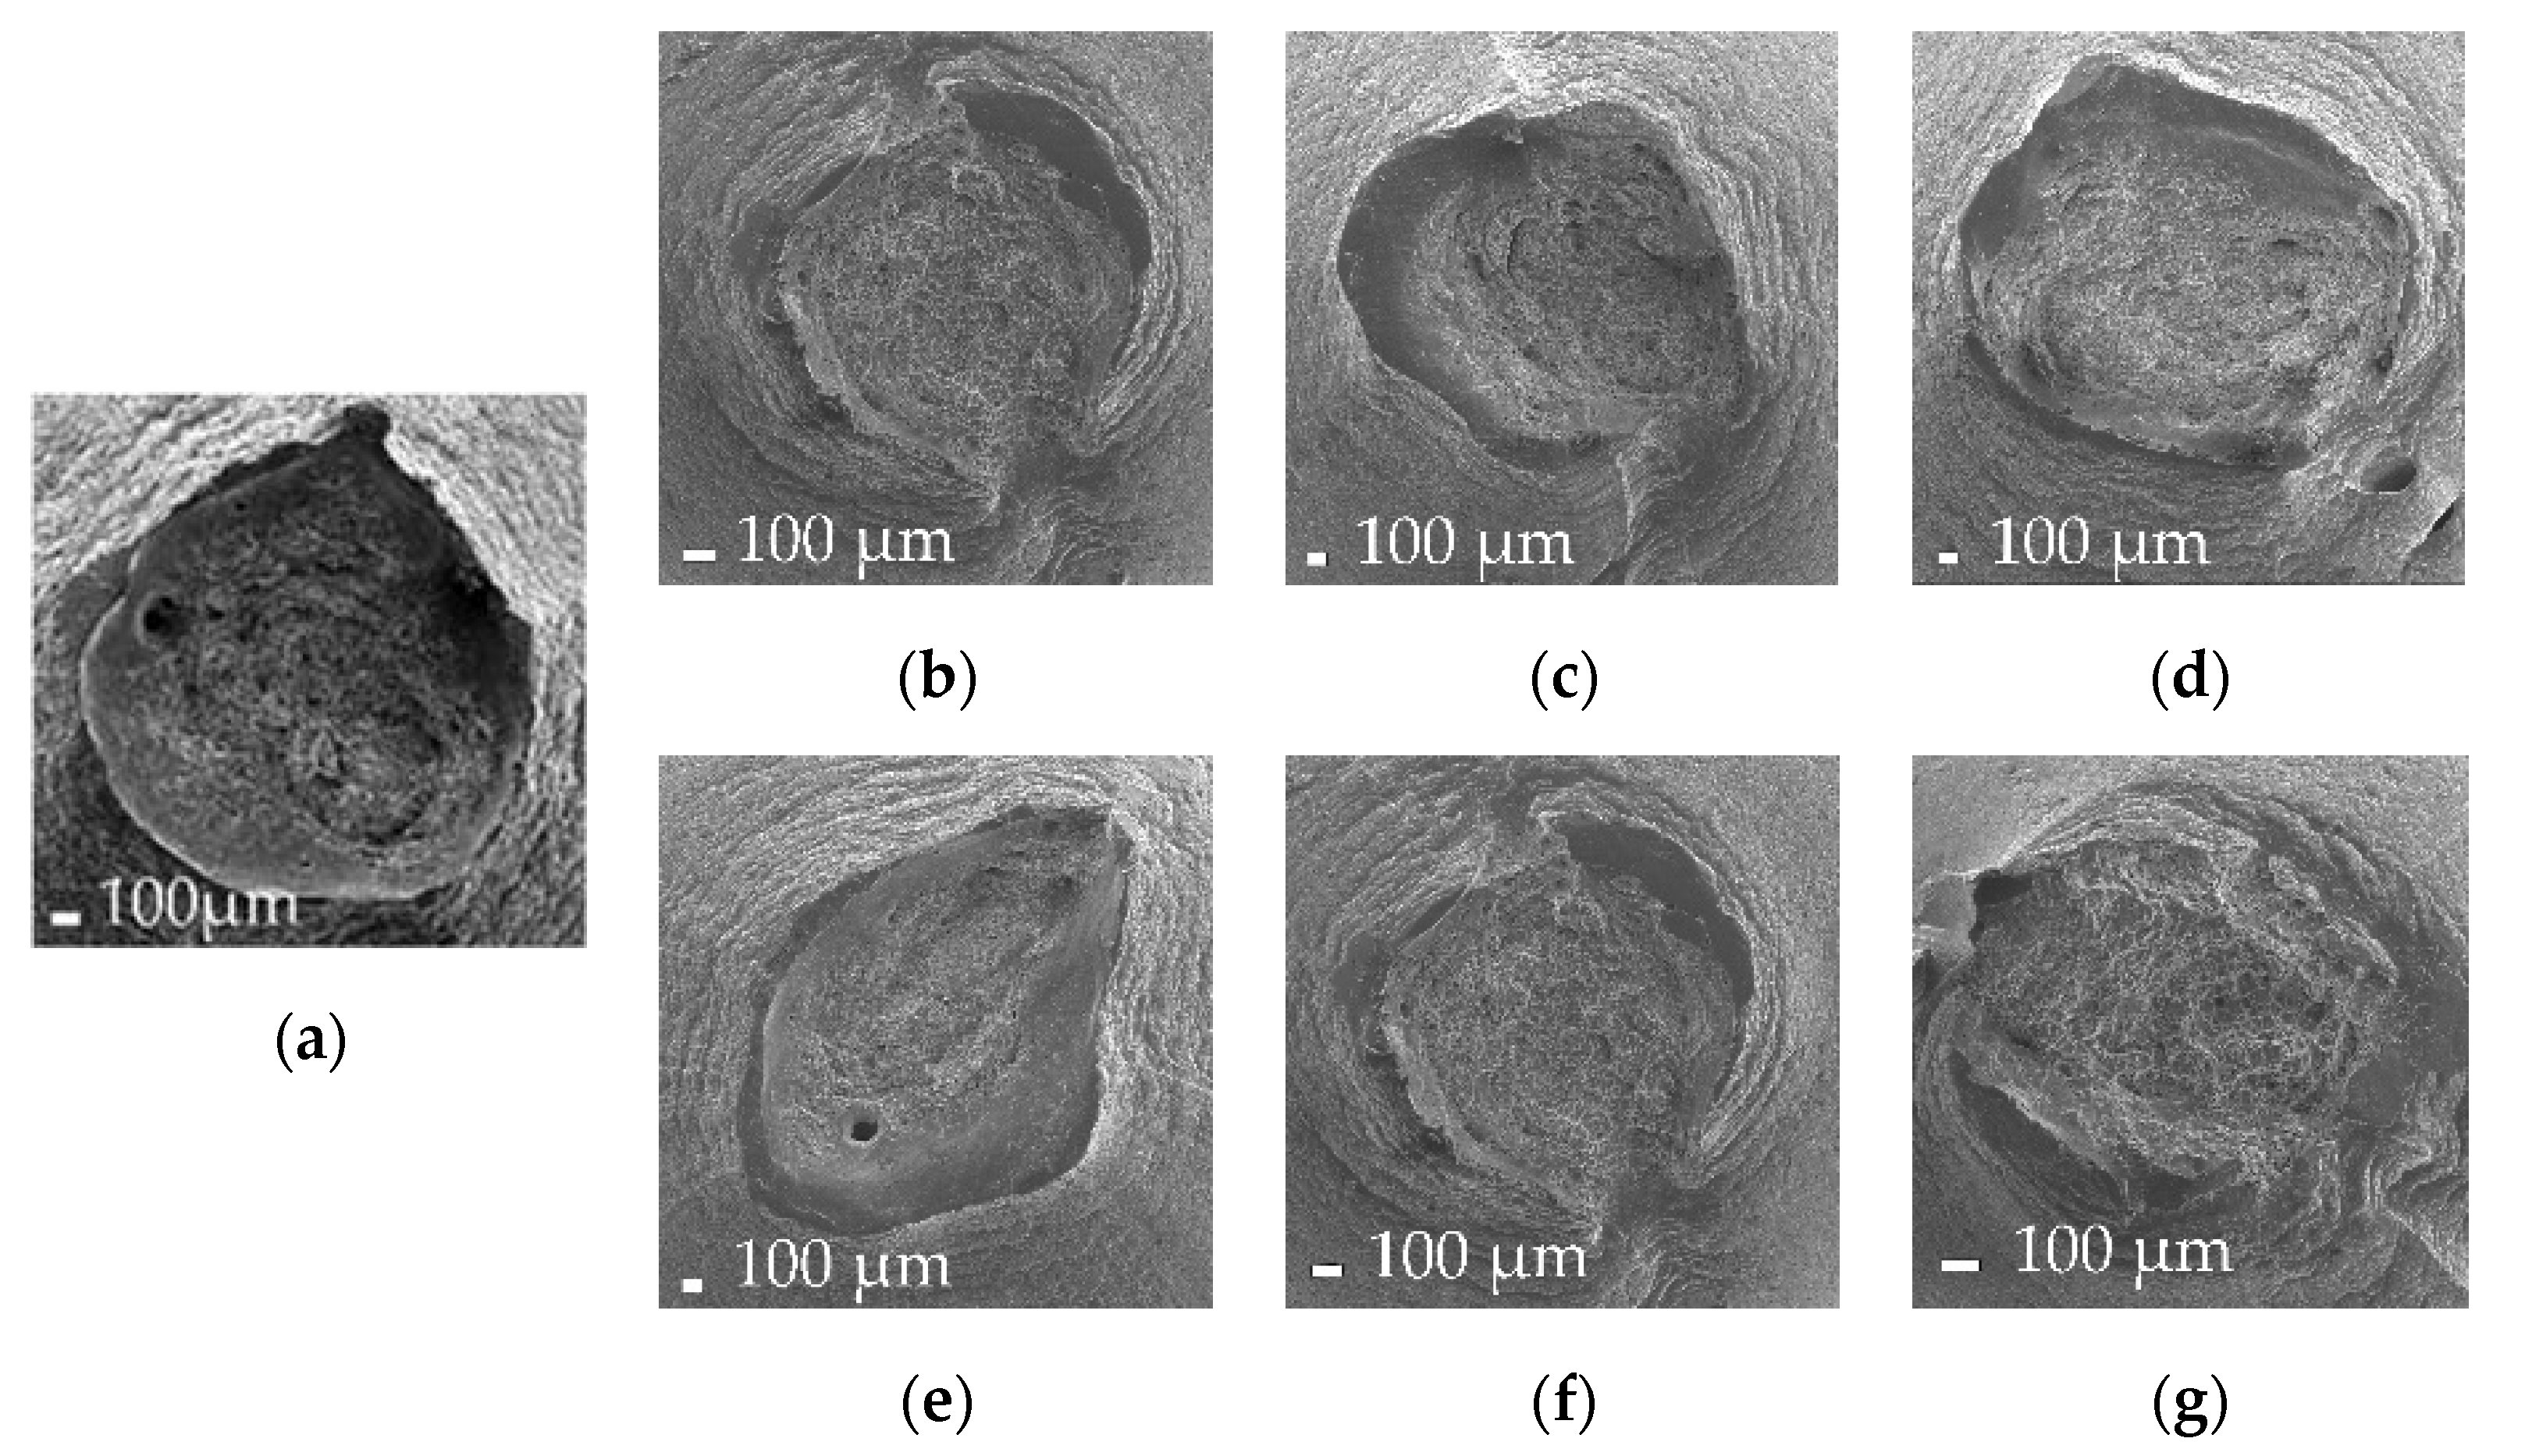
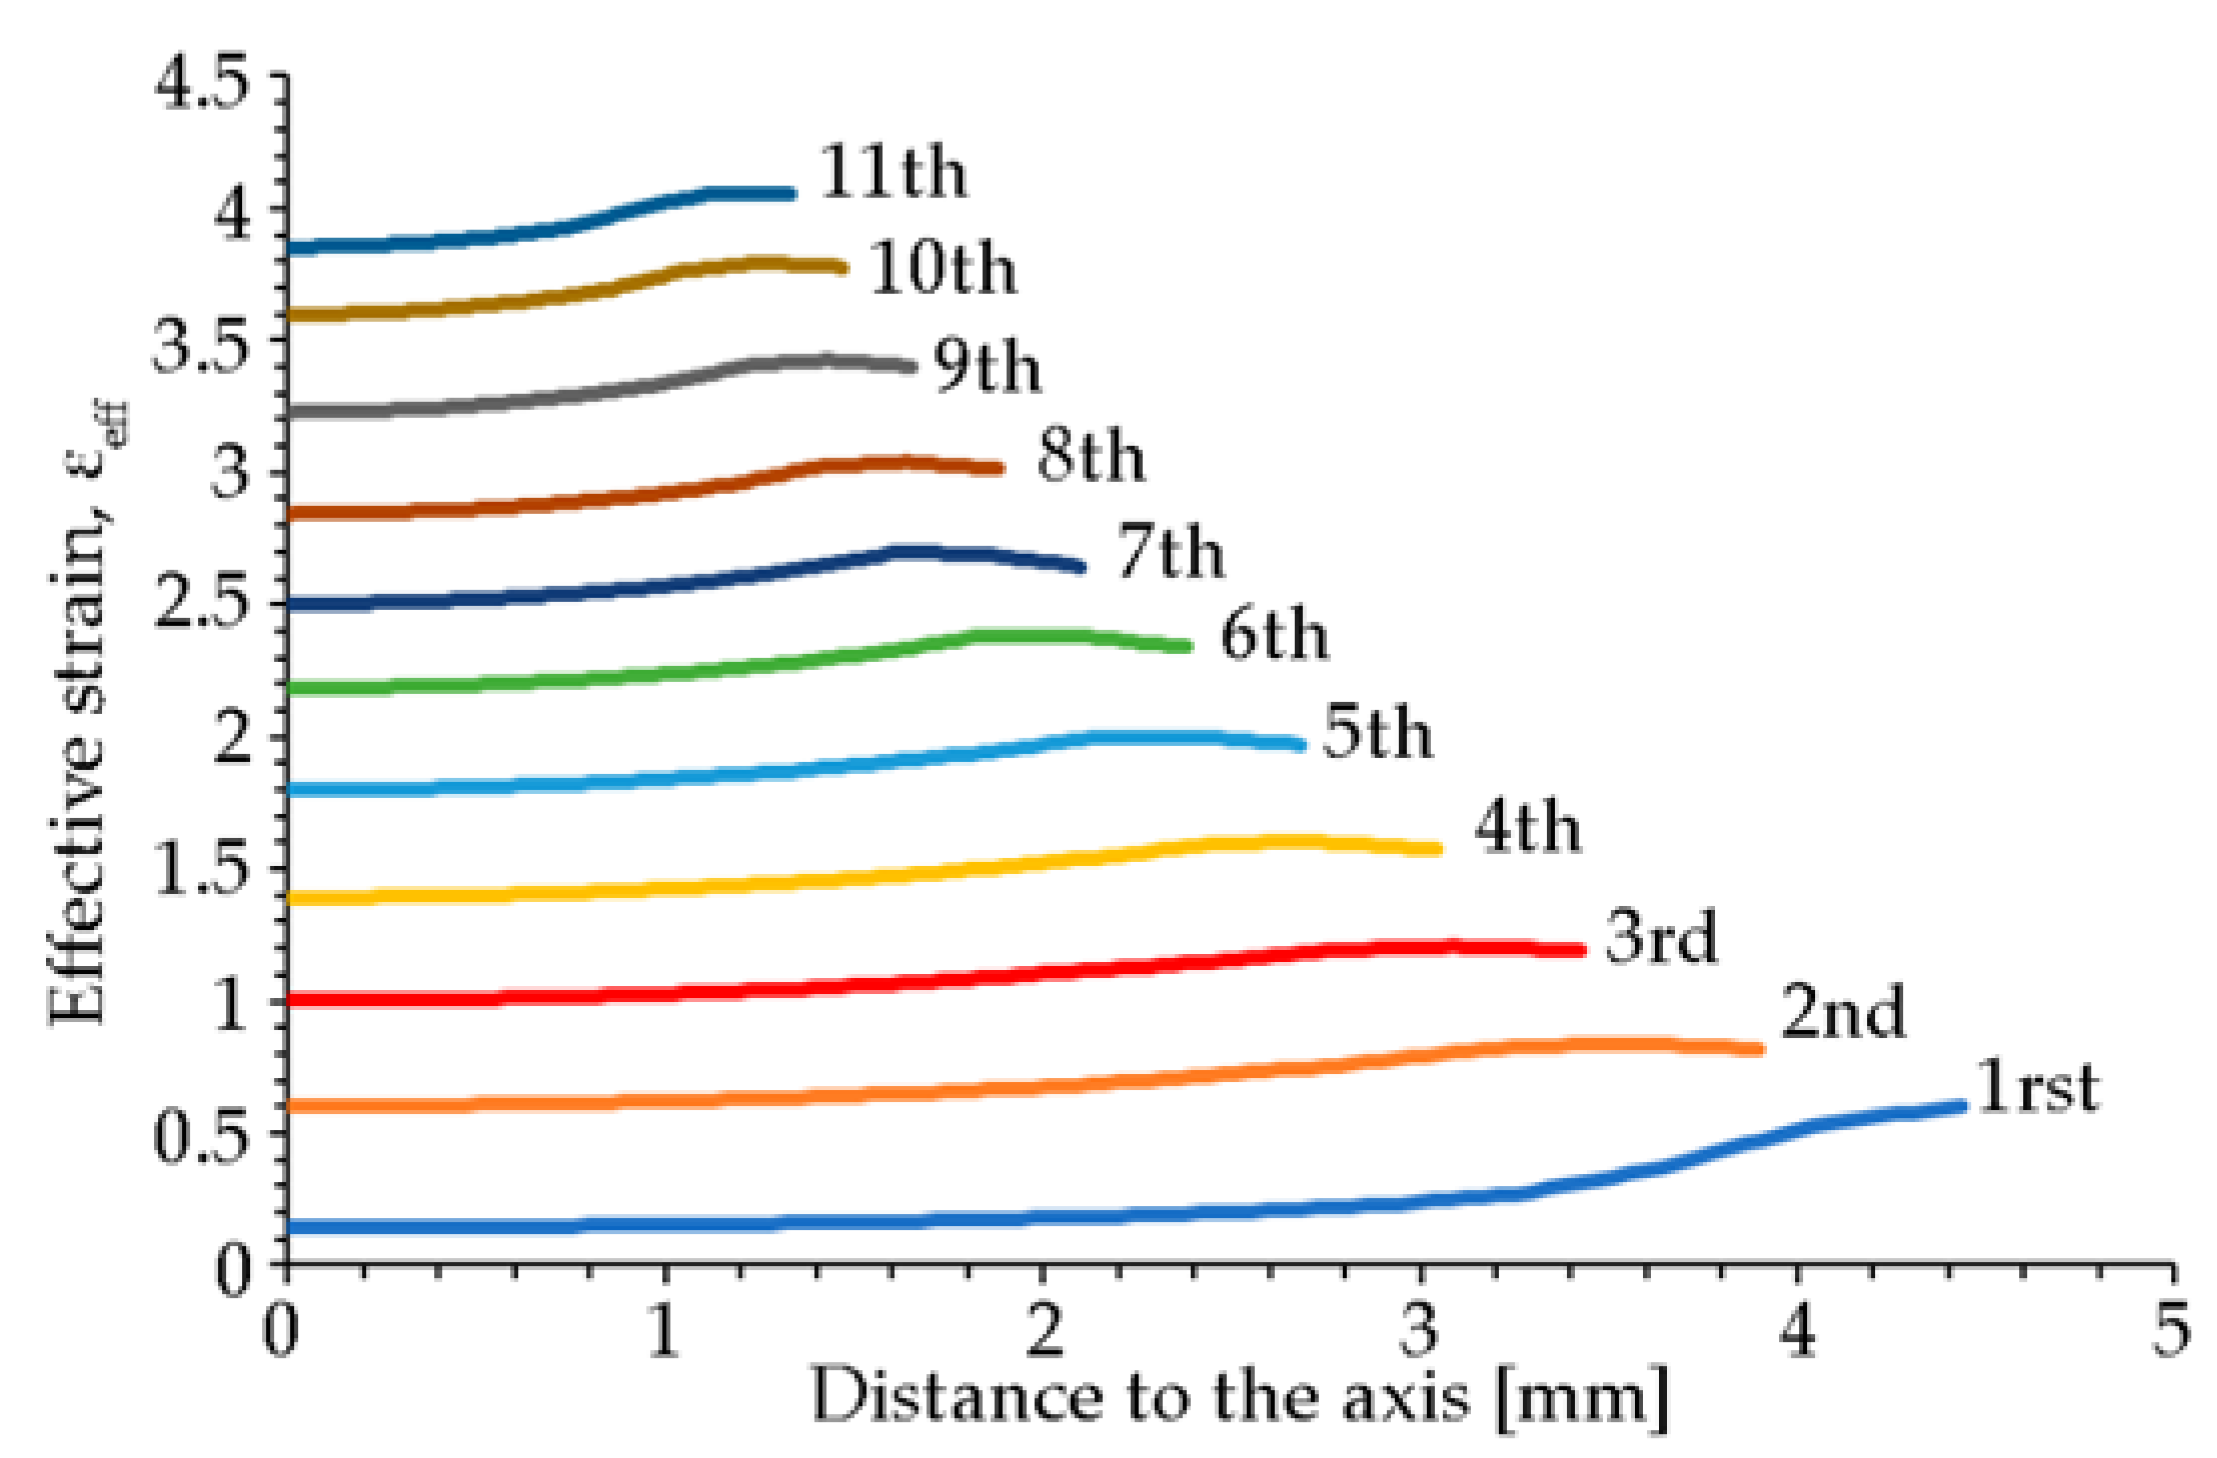
  • The strain distribution observed in the simulations indicates a greater degree of accumulated strain near the surface of the wire in all the stages of the process. This aspect entails a greater degree of surface hardening by cold deformation and a greater involvement of the residual stresses in this zone in the section of the drawn wire.
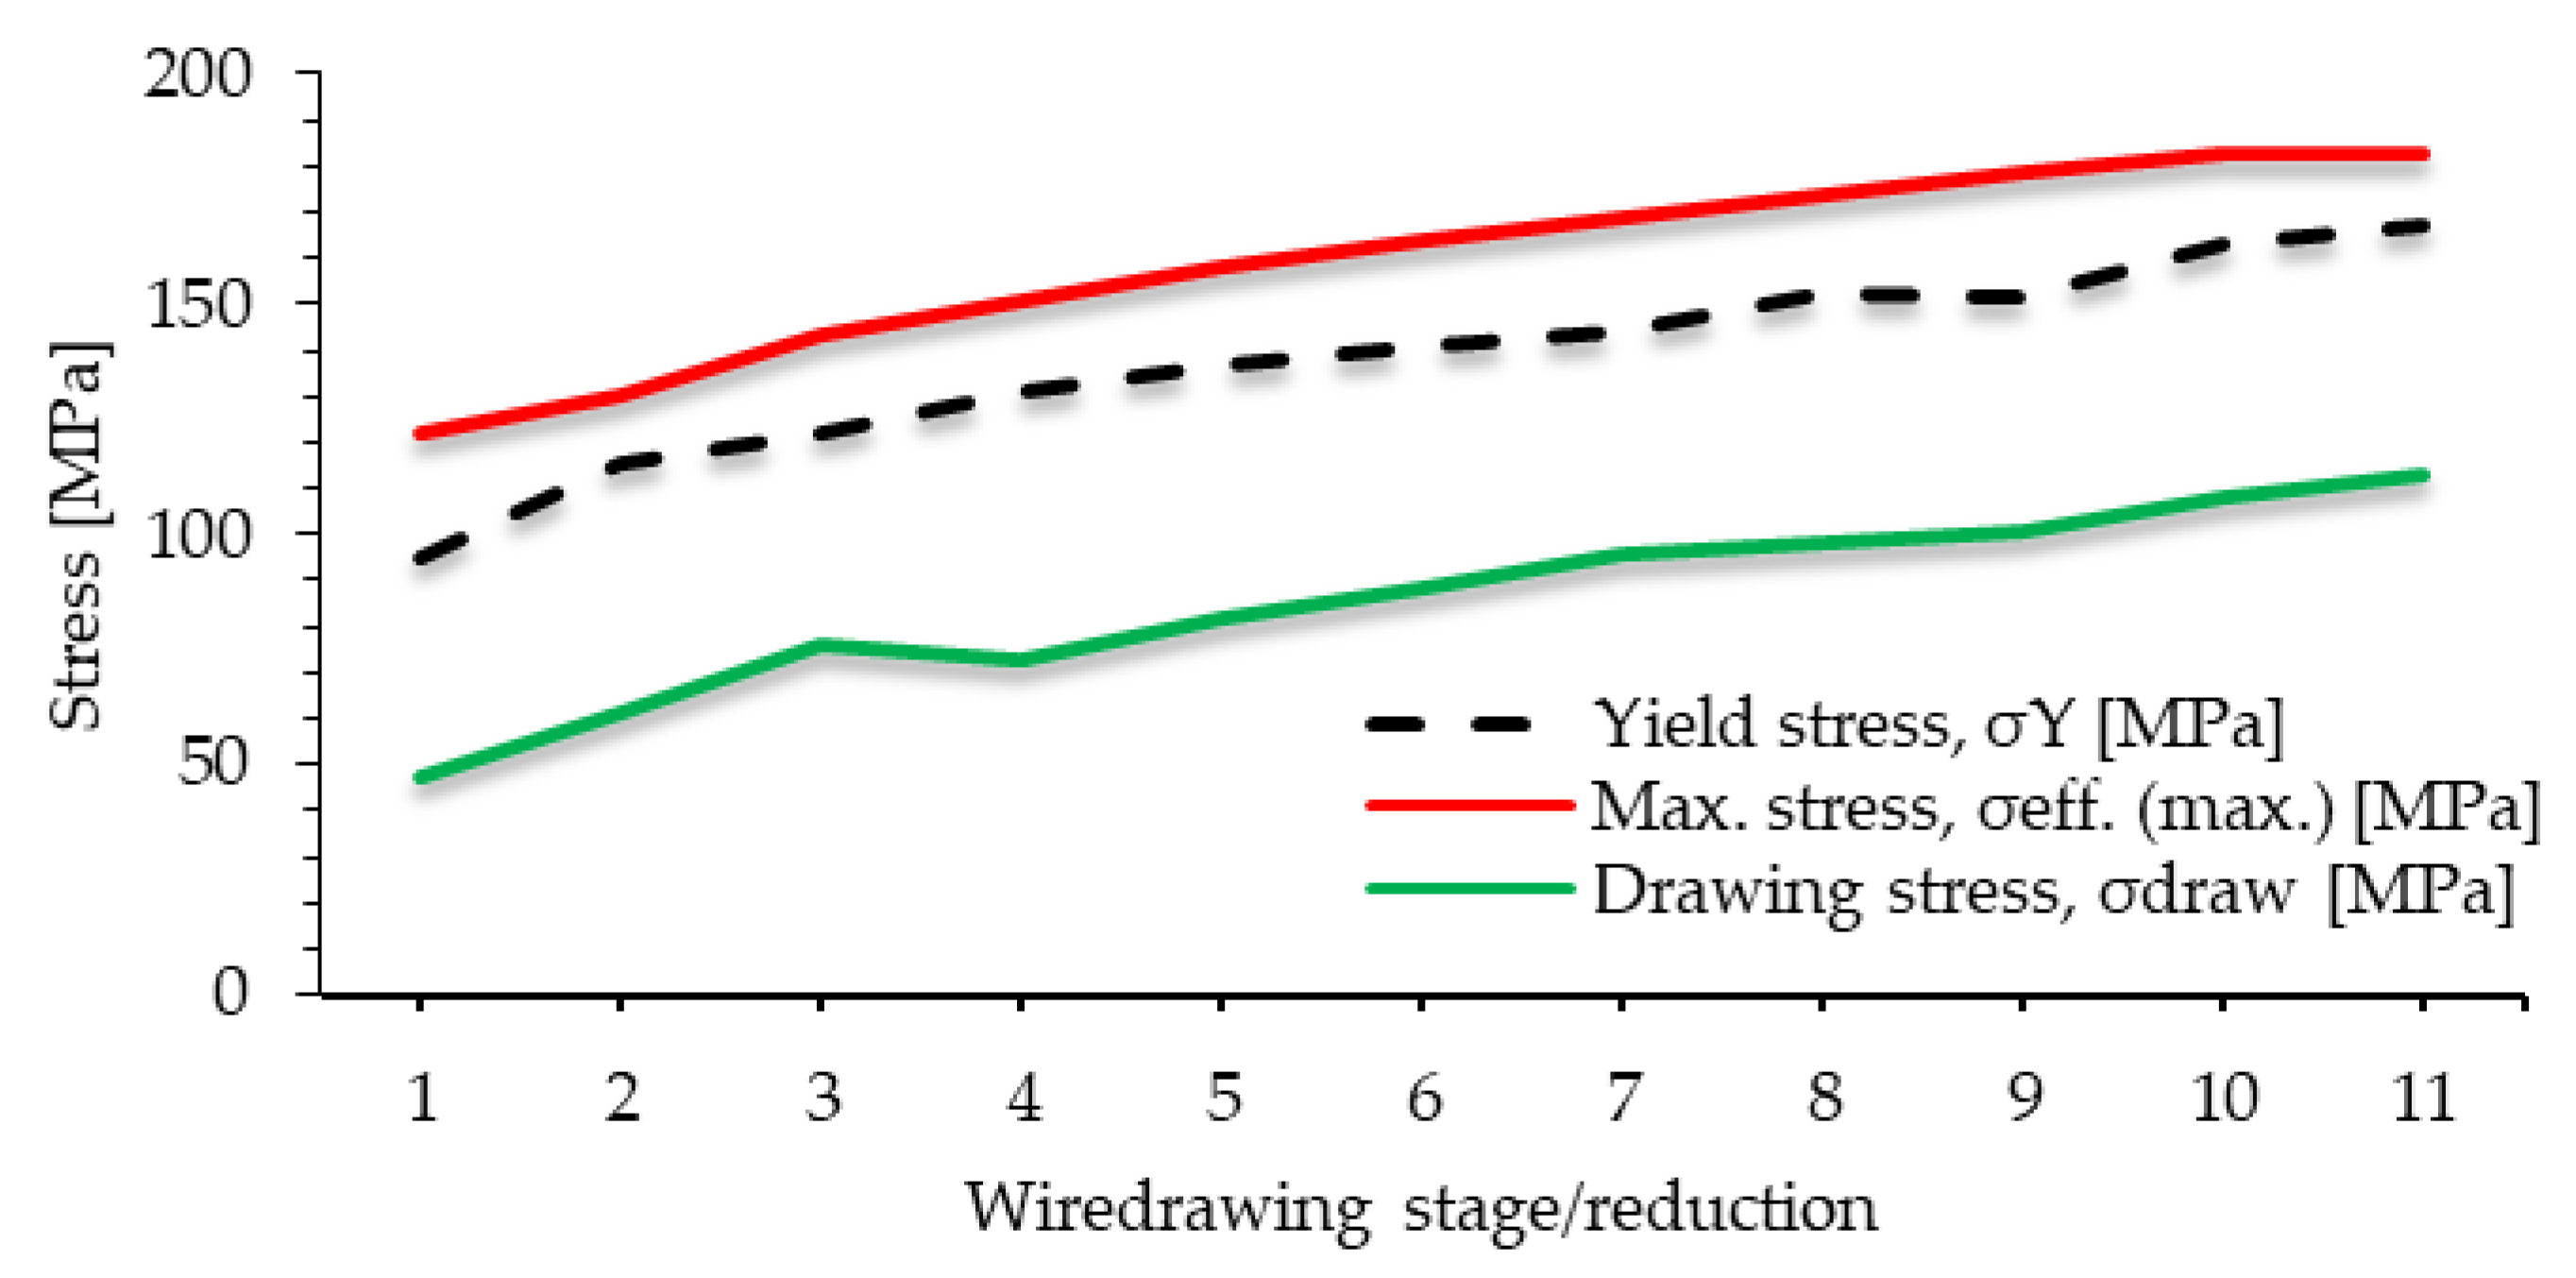
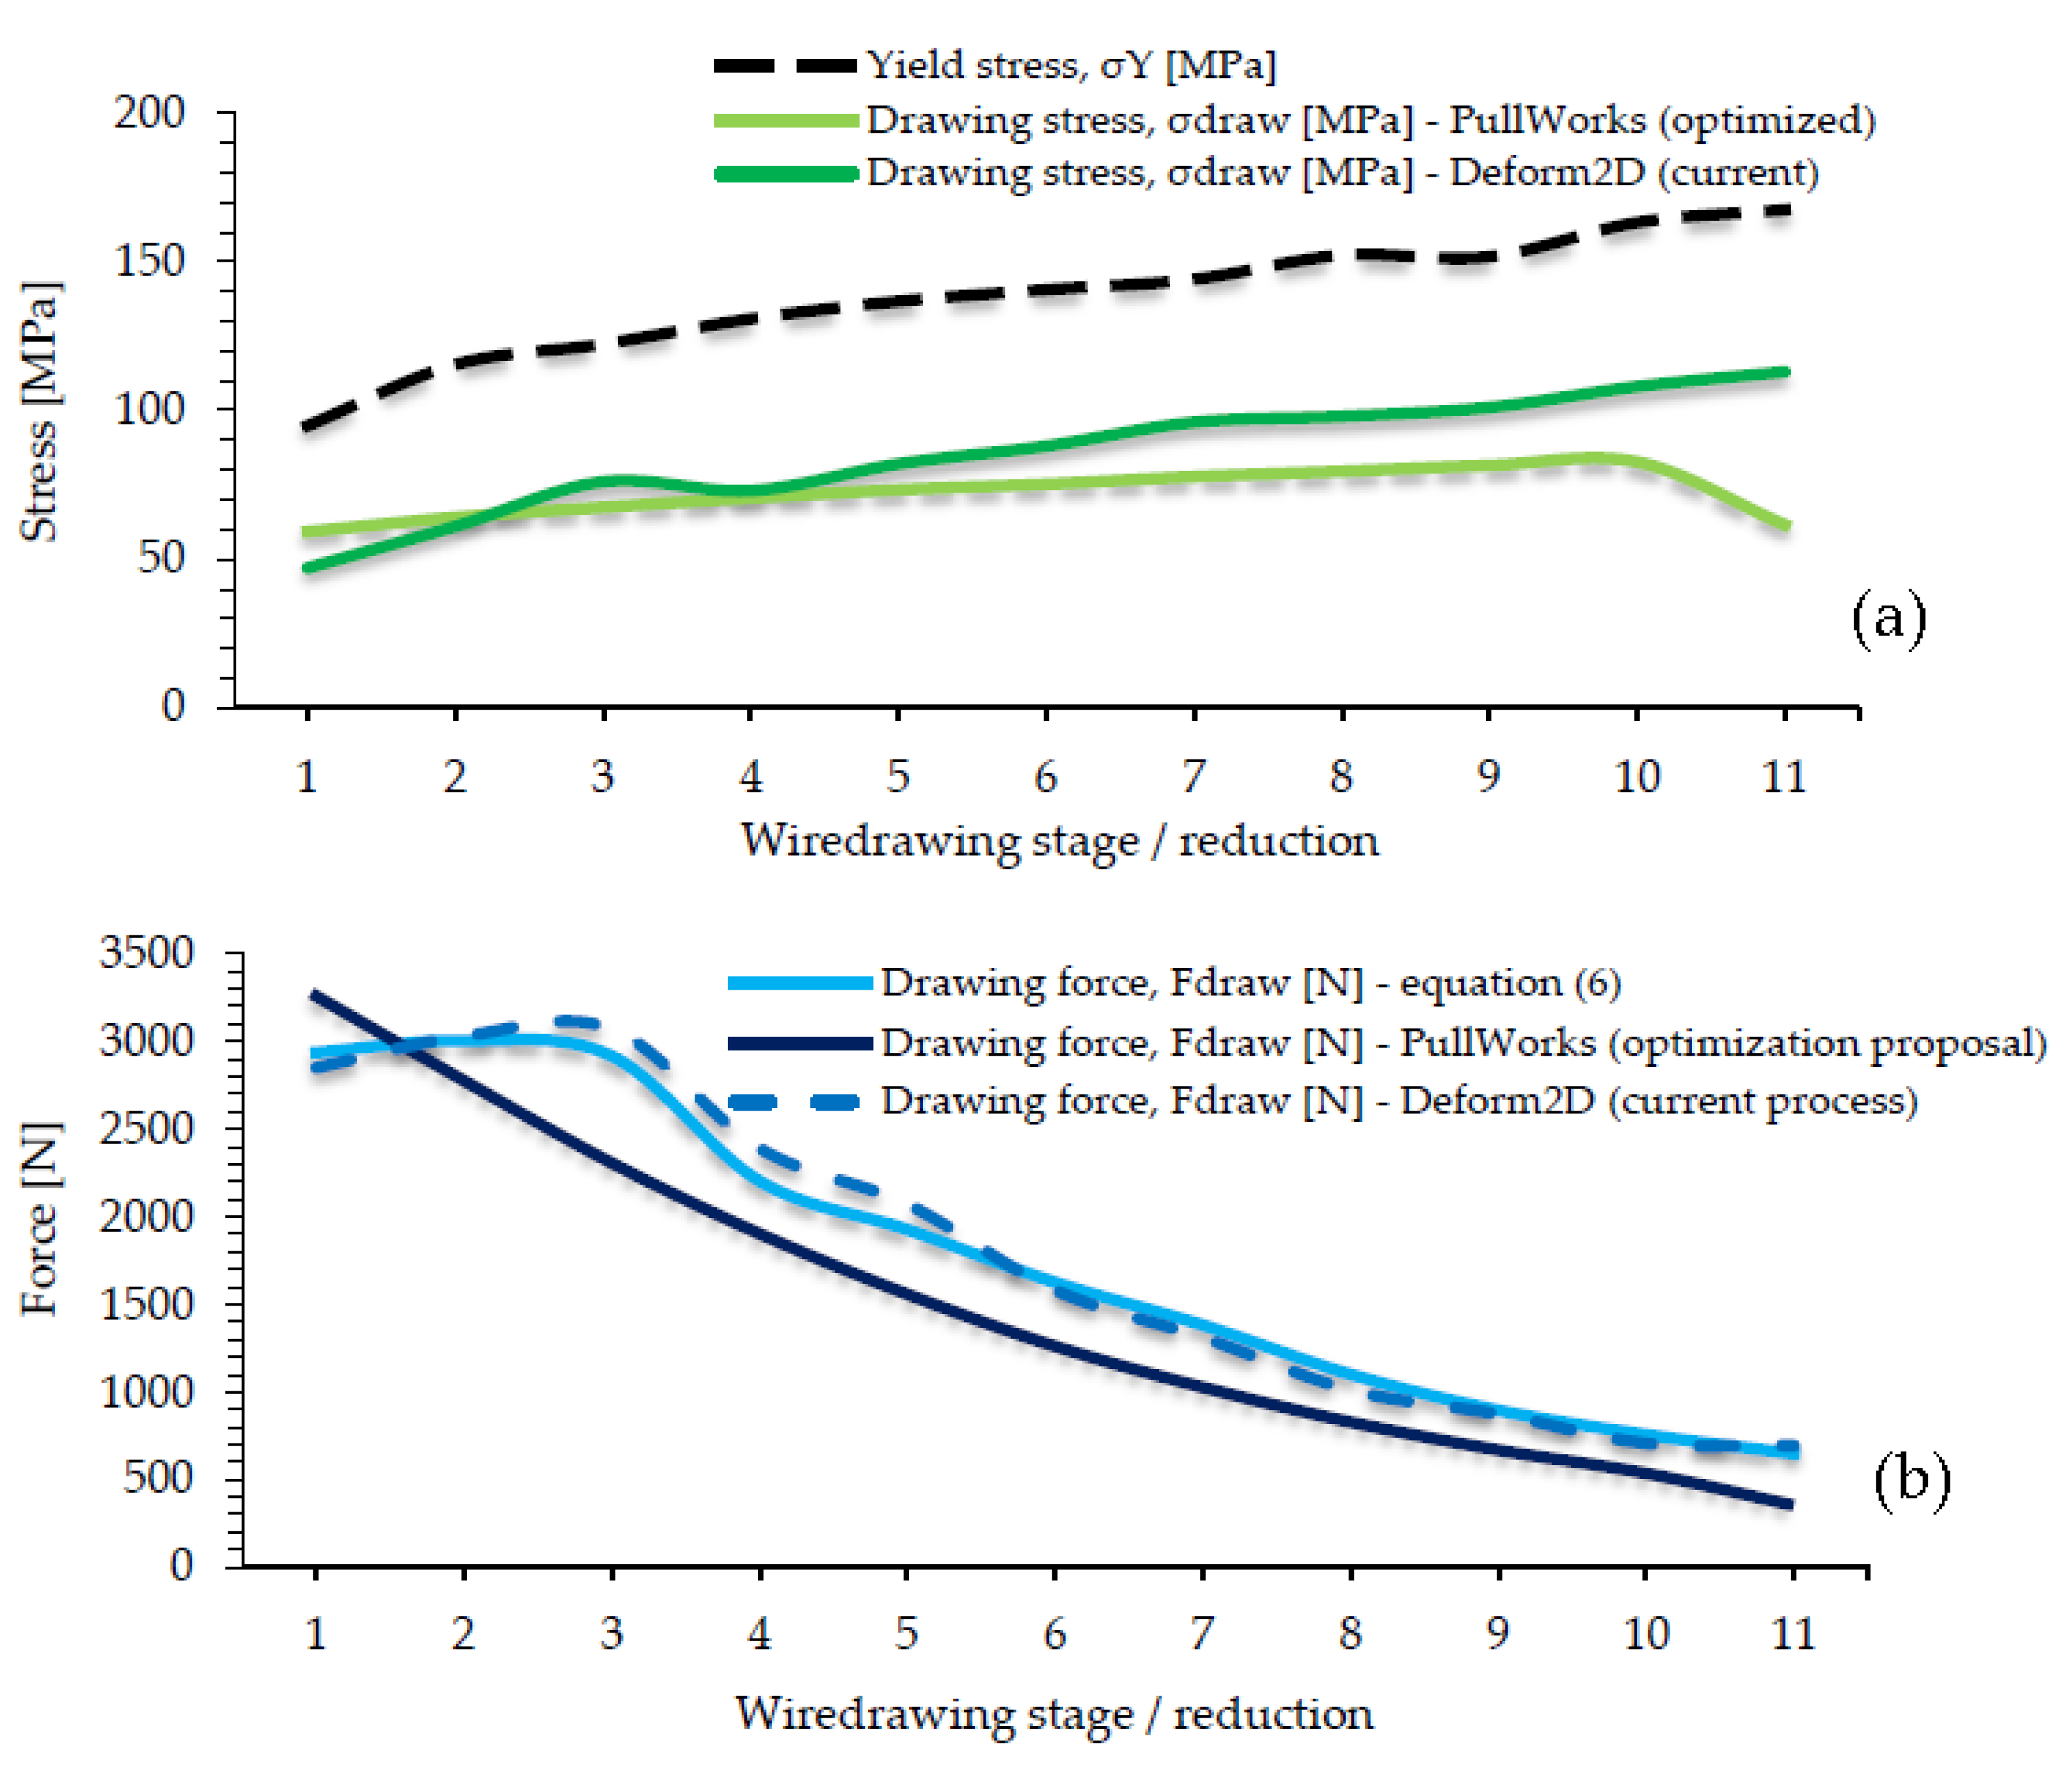
  • The drawing stress (σdraw) never exceeds the value of the yield limit of the deformed metal (σY), so that the drawn wire never undergoes unwanted deformations at its exit from the die. This fact has been confirmed by FEM simulations.
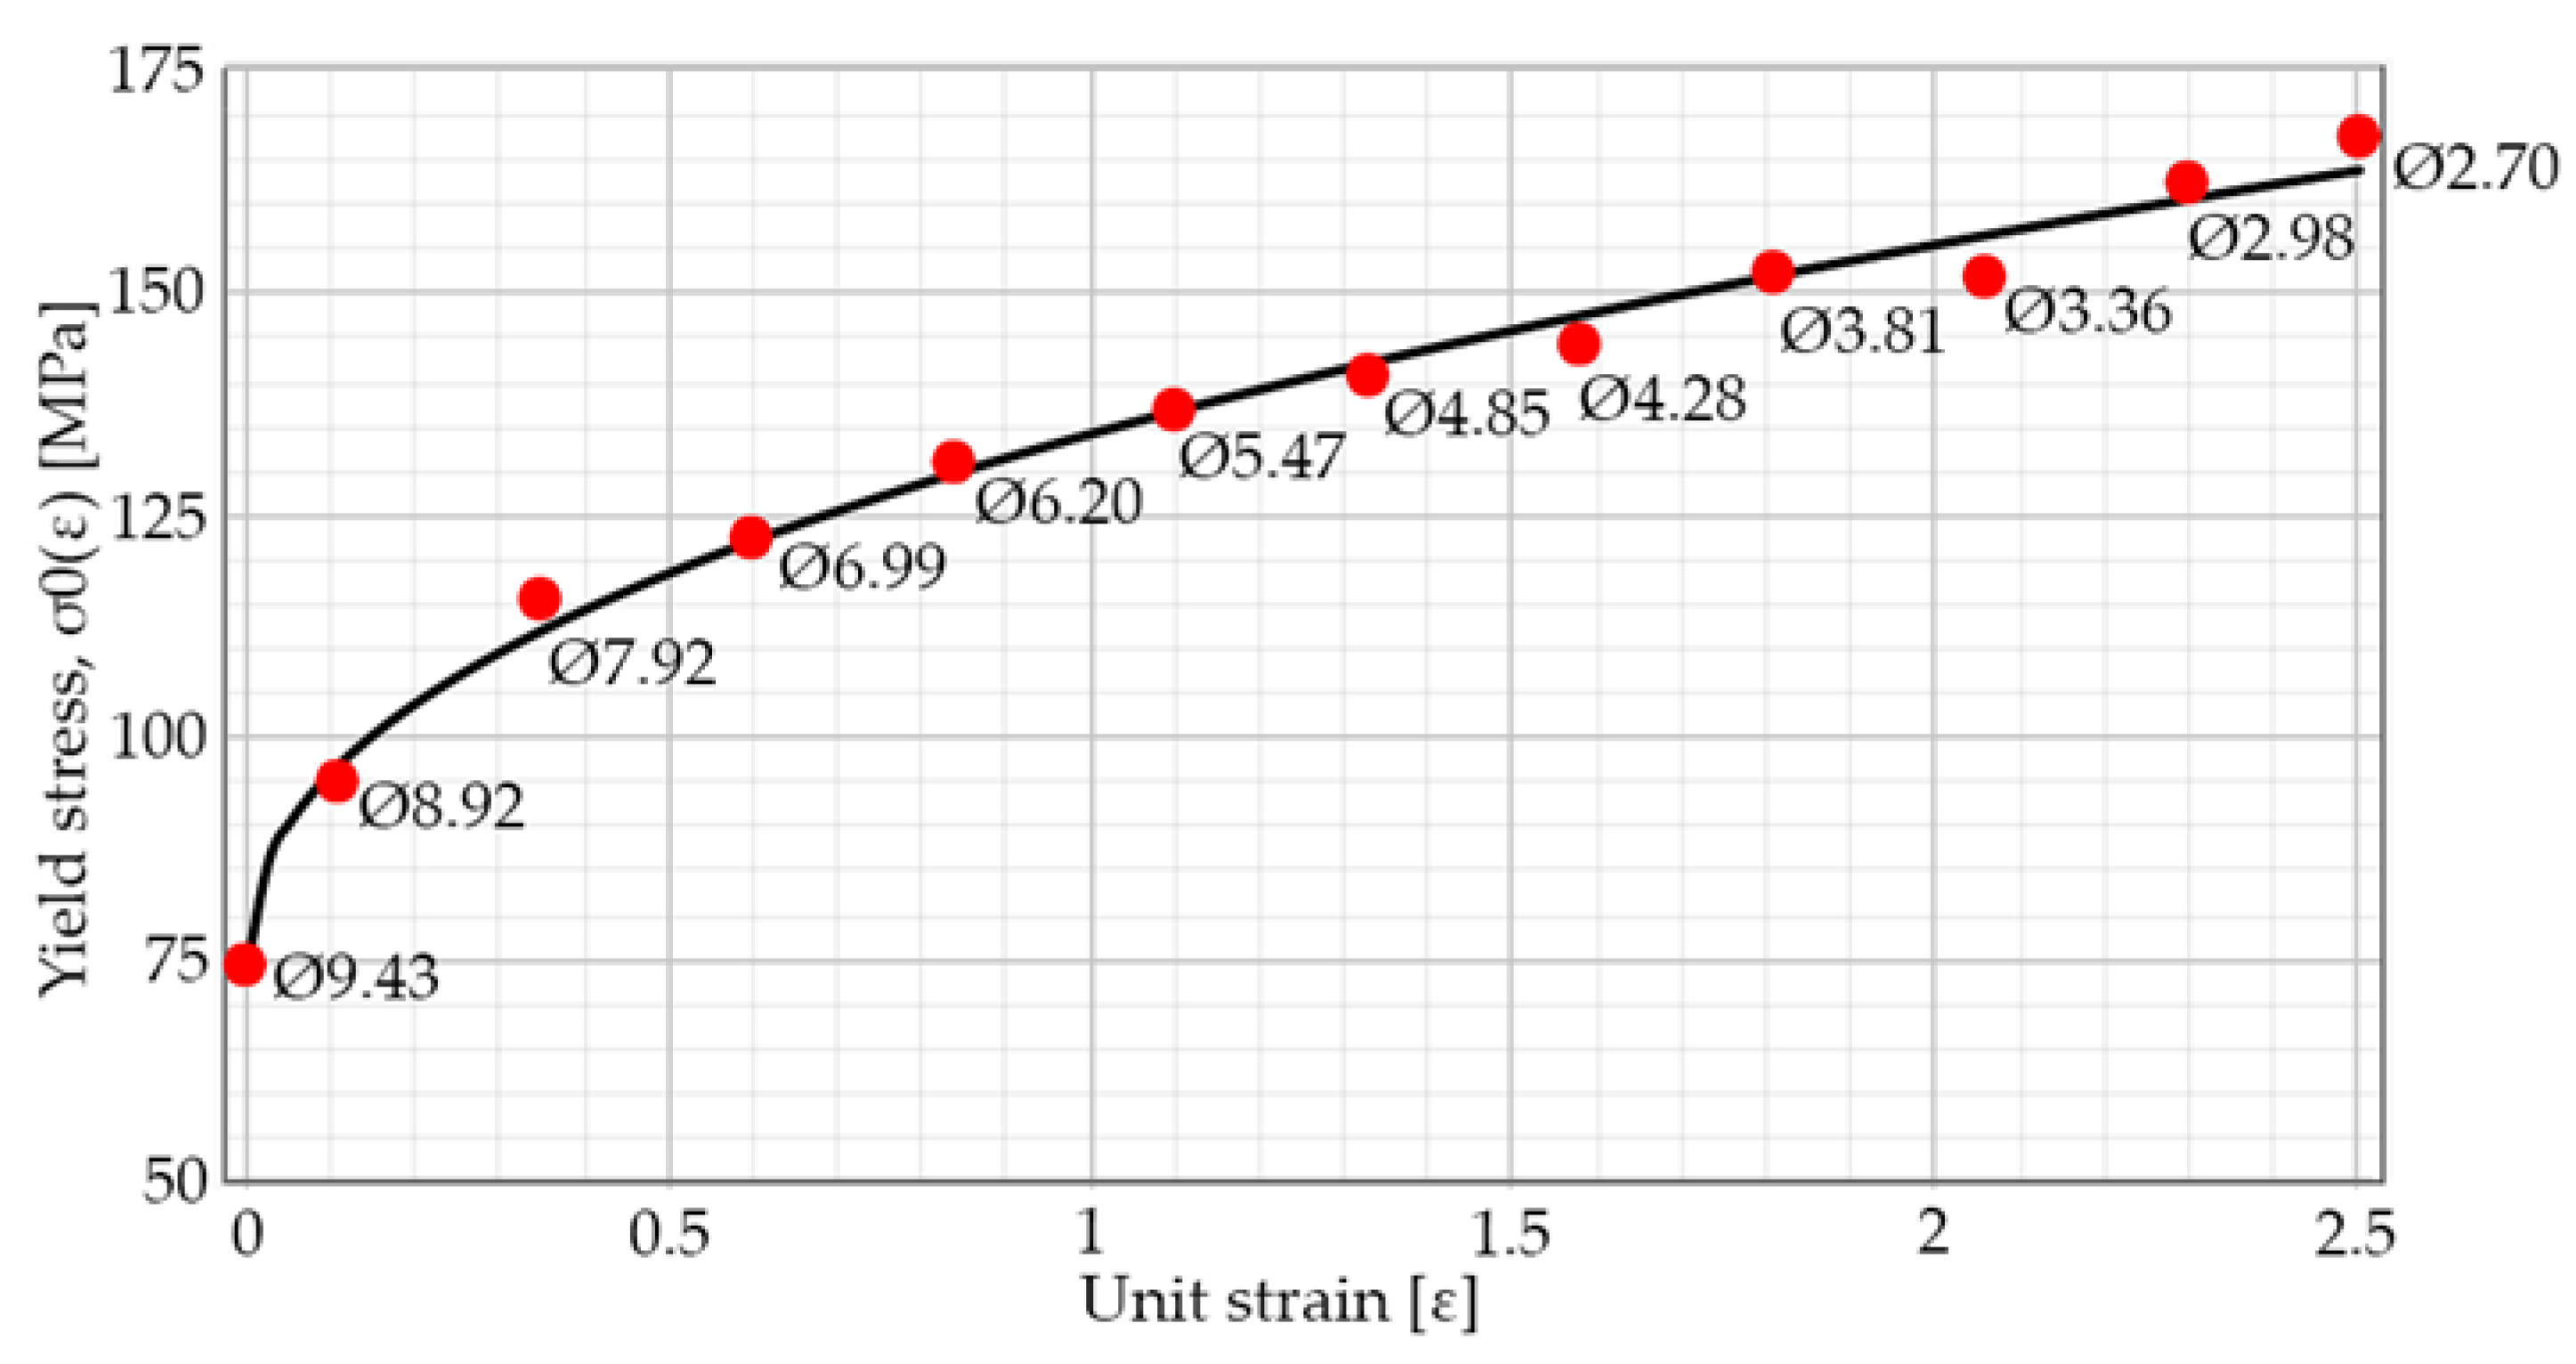
  • The experimentally defined hardening law allows to foresee how the value of the yield limit (σY) of EN AW-1370 pure aluminium increases with the applied deformation by wiredrawing. This law, implemented in Deform 2D FEM software, allows to analyse the strain-stress distribution and their evolution in the multi-stage process.
  • The analytical methodology, implemented in the PullWorks software application, allowed us to design a new optimized sequence with the same number of stages than the original. This software tool offers a proposed solution that leads to a more uniform value in the drawing stress (σdraw) as a consequence of a progressive increase in the reduction ratio (see Figure 12), as a result of applying a constant delta value in each of the 11 wire-drawing stages.
  • It should be noted that both in the application of the numerical method and also in the analytical methodology used to refine the sequence of stages, the possible effect of the temperature variation produced in the deformation zone as a result of the process speed has not been considered. It should be noted that we are in the case of cold forming process conditions.
The results of the present study have been made available to the company to consider the future implementation of these methods to analyse the possible improvements in the current process in the production plant.

Author Contributions

Conceptualization: Ó.R.-A.; methodology: Ó.R.-A.; validation: all authors; investigation: Ó.R.-A.; resources: E.M.; data curation: P.E.R. and Ó.R.-A.; writing—original draft: Ó.R.-A.; writing—review and editing: all authors; visualization: all authors; supervision: P.E.R.; project administration: G.G.-V.

Funding

This research received no external funding.

Acknowledgments

The authors are grateful for the collaboration of Purificación Calvo Arias, quality control technician at Cunext Copper Industries S.L. Partner Company. We also thank Ana María Camacho López, from the School of Engineering of the UNED (Madrid, Spain), who has allowed us to use the Deform software to perform the simulations presented in this paper.

Conflicts of Interest

The authors declare no conflict of interest.

References

  1. UNE-EN 573-3:2014 Aluminio y aleaciones de aluminio. Composición química y Forma de los Productos de forja. Parte 3: Composición química y Forma de los Productos; AENOR: Madrid, Spain, 2014. [Google Scholar]
  2. Cities, T.S.; Stacey, M. Aluminium: Flexible and Light; Cwningen Press: Warszawa, Poland, 2016; ISBN 978-0-9930162-3-3. [Google Scholar]
  3. Davis, J.R. Aluminum and Aluminum Alloys. In Alloying: Understanding the Basics; ASM International: Geauga County, OH, USA, 2001; pp. 351–416. ISBN 978-0-87170-744-4. [Google Scholar]
  4. Knych, T.; Piotr, U.; Marzena, P. The Continuous Casting Technology of the Aluminum Rod Assigned for the Wire for Electrical Purposes. Mater. Sci. Forum. 2011, 690, 87–90. [Google Scholar] [CrossRef] [Green Version]
  5. Kabayama, L.K.; Taguchi, S.P.; São, U.D.; Usp, P.; Industrial, P.U.; Ai-, G.; Box, P.O.; Sp, L. The Influence of Die Geometry on Stress Distribution by Experimental and FEM Simulation on Electrolytic Copper Wiredrawing. Mater. Res. 2009, 12, 281–285. [Google Scholar] [CrossRef]
  6. Vega, G.; Haddi, A.; Imad, A. Investigation of process parameters effect on the copper-wire drawing. Mater. Des. 2009, 30, 3308–3312. [Google Scholar] [CrossRef]
  7. Rodriguez-Alabanda, O. Metodología para el estudio y diseño tecnológico del proceso secuencial de estirado multi-etapa de alambre y barras de sección circular. Ph.D Thesis, University of Malaga, Malaga, Spain, 2017. Available online: https://riuma.uma.es/xmlui/bitstream/handle/10630/14910/TD_RODRIGUEZ_ALABANDA_Oscar Maquetada.pdf?sequence=1&isAllowed=y (accessed on 15 September 2018).
  8. Rodriguez-Alabanda, O.; Romero, P.E.; Guerrero-Vaca, G.; Sevilla, L. Software implementation of a new analytical methodology applied to the multi-stage wire drawing process: the case study of the copper wire manufacturing line optimization. Int. J. Adv. Manuf. Technol. 2018, 96, 2077–2089. [Google Scholar] [CrossRef]
  9. González Rojas, H.A.; Calvet, J.V.; Bubnovich, V.I. A new analytical solution for prediction of forward tension in the drawing process. J. Mater. Process. Technol. 2008, 198, 93–98. [Google Scholar] [CrossRef]
  10. Zhang, G.-L.; Wang, Z.-W.; Zhang, S.-H.; Cheng, M.; Song, H.-W. A fast optimization approach for multipass wire drawing processes based on the analytical model. Proc. Inst. Mech. Eng. Part B J. Eng. Manuf. 2013, 227, 1023–1031. [Google Scholar] [CrossRef]
  11. Hassan, A.; Hashim, A. Three Dimensional Finite Element Analysis of Wire Drawing Process. Univers. J. Mech. Eng. 2015, 3, 71–82. [Google Scholar] [CrossRef]
  12. Ikumapayi, O.M.; Afolalu, S.A. Experimental and Theoretical Investigation of Tensile Stress Distribution During Aluminium Wire Drawing. Eur. Sci. J. 2015, 11, 86–102. [Google Scholar]
  13. Luis, C.J.; León, J.; Luri, R. Comparison between finite element method and analytical methods for studying wire drawing processes. J. Mater. Process. Technol. 2005, 164–165, 1218–1225. [Google Scholar] [CrossRef]
  14. Teja, C.S.N.; Murty, G.; Reddy, P.S. Finite Element Analysis of Wire Drawing Process with different die contours. Int. J. Sci. Eng. Adv. Technol. 2016, 4, 134–143. [Google Scholar]
  15. Rojas, E.L.; Celentano, D.J.; Artigas, A.A.; Monsalve, A.G. Simulación experimental y numérica de un proceso de trefilado húmedo de un alambre de acero al carbono. Ingeniare 2008, 16, 188–194. [Google Scholar] [CrossRef]
  16. Moharana, B.; Kushwaha, B.K.; Polytechnic, B.B.A.G.; Karad, D.P. FEM analysis of stress Predication of Aluminum wire rod in Drawing Operation. Int. Res. J. Eng. Technol. 2017, 4, 982–992. [Google Scholar]
  17. Zottis, J.; Soares Diehl, C.A.T.; Rocha A da, S. Evaluation of experimentally observed asymmetric distributions of hardness, strain and residual stress in cold drawn bars by FEM-simulation. J. Mater. Res. Technol. 2018, 7, 469–478. [Google Scholar] [CrossRef]
  18. Milenin, A.; Kustra, P. Numerical and Experimental Analysis of Wire Drawing for Hardly Deformable Biocompatible Magnesium Alloys/Numeryczna I Doswiadczalna Analiza Ciagnienia Drutu Z Trudno Odkształcalnych Biozgodnych Stopów Magnezu. Arch. Metall. Mater. 2013, 58, 55–62. [Google Scholar] [CrossRef]
  19. Camacho, A.M.; Domingo, R.; Rubio, E.; González, C. Analysis of the influence of back-pull in drawing process by the finite element method. J. Mater. Process. Technol. 2005, 164–165, 1167–1174. [Google Scholar] [CrossRef]
  20. Valverg, H. Applied Metal Forming including FEM Analysis; Cambridge University Press: New York, NY, USA, 2010; ISBN 13 978-0-511-72943-0. [Google Scholar]
  21. Luksza, J.; Majta, J.; Burdek, M.; Ruminski, M. Modelling and measurements of mechanical behaviour in multi-pass drawing process. J. Mater. Process. Technol. 1998, 80–81, 398–405. [Google Scholar] [CrossRef]
  22. Fluhrer, J. Deform2D, Version 8.1; User’s Manual; Scientific Forming Technologies Corporation: Columbus, OH, USA, 2004. [Google Scholar]
  23. Rodriguez-Alabanda, O. PullWorks Software Download Website. Available online: http://www.uco.es/grupos/prinia/oscar-rodriguez-alabanda/ (accessed on 11 July 2018).
  24. Cunext Copper Industries, S.L. Declaración Ambiental (Environmental Statement). 2016. Available online: http://www.cunext.com/wp-content/uploads/2016/01/DM-17-2014-con-sello_espanol_ingles.pdf. (accessed on 24 July 2017).
  25. Cunext Copper Industries, S.L. Productos. Available online: https://www.cunext.com/origen-y-aplicaciones/ (accessed on 1 June 2018).
  26. Attaway, S.W. The Mechanics of Friction in Rope Rescue; International Technical Rescue Symposium: Fort Collins, CO, USA, 1999; pp. 1–16. [Google Scholar]
  27. Nuruzzaman, D.M.; Chowdhury, M.A. Friction Coefficient and Wear Rate of Copper and Aluminum Sliding against Mild Steel. Int. Trans. J. Eng. Manag. Appl. Sci. Technol. 2013, 4, 29–40. [Google Scholar]
  28. Arkles, B. Polytetrafluoroethylene and Fluorinated Ethylene-Propylene Grease Lubricants. Lubr. Eng. 2015, 30, 136–143. [Google Scholar]
  29. Maschinenfabrik Niehoff GmbH MSM 86 Rod Breakdown Machine MSM 86. Available online: https://www.niehoff-gmbh.info/images/downloads/produktprospekte/05a_MSM 86_e.pdf (accessed on 13 September 2019).
  30. Van der Putten, C. Drawing Die Wizard. Available online: http://www.estevesgroup.com/es/services/drawing-die-wizard-software/overview/index.php (accessed on 1 June 2018).
  31. Wistreich, B.J.G.; Eng, M.S.; Member, A. Investigation of the Mechanics of Wire Drawing. Proc. Inst. Mech. Eng. 1955, 169, 654–678. [Google Scholar] [CrossRef]
  32. Wright, R.N. Mechanical analysis and die design. Wire, J. Int. 1979, 12, 60–61. [Google Scholar]
  33. Wright, R.N. Wire Technology: Process Engineering and Metallurgy, 2nd ed.; Elsevier Inc.: Burlington, VT, USA, 2011; ISBN 978-0123820921. [Google Scholar]
  34. Jindal, H.; Jindal, A. Dies Management in Wire Drawing Industry. Available online: http://www.wirecable.in/2015/04/dies-management-in-wire-drawing-industry/ (accessed on 11 September 2019).
  35. Baker, G.; Wright, R.N. Friction Coefficients in Laboratory Simulation of Magnet Wire Drawing. Wire, J. Int. 1992, 25, 67–72. [Google Scholar]
  36. Evans, W.; Avitzur, B. Measurement of Friction in Drawing, Extrusion, and Rolling. J. Lubr. Technol. 1968, 90, 72–80. [Google Scholar] [CrossRef]
  37. Faverjon, P. Influence of Minimum Quantity Lubrication on Friction Coefficient and Work-Material Adhesion During Machining of Cast Aluminum With Various Cutting Tool Substrates Made of Polycrystalline Diamond, High Speed Steel, and Carbides. J. Tribol. 2013, 135, 1–8. [Google Scholar] [CrossRef]
  38. UNE-EN ISO 6892-1:2009 Materiales metálicos. Ensayo de Tracción. Parte 1: Método de Ensayo a Temperatura Ambiente; AENOR: Madrid, Spain, 2010. [Google Scholar]
  39. Scientific Forming Technologies Corporation. Deform Product Brochure. Available online: https://www.deform.com/products/deform-3d/ (accessed on 3 July 2018).
  40. Rubio, E.M.; Camacho, A.M.; Sevilla, L.; Sebastián, M.A. Calculation of the forward tension in drawing processes. J. Mater. Process. Technol. 2005, 162–163, 551–557. [Google Scholar] [CrossRef]
  41. Adamczyk, J.; Suliga, M.; Pilarczyk, J.W.; Burdek, M. The Influence of Die Approach and Bearing Part of Die on Mechanical-Technological Properties of High Carbon Steel Wires. Arch. Metall. Mater. 2012, 57, 12–14. [Google Scholar] [CrossRef]
  42. Salcedo, D.; Luis, C.J.; León, J.; Luri, R.; Puertas, I.; Pérez, I. Analysis of residual stresses in wire drawing processes. In Proceedings of the 14th International Research/Expert Conference “Trends in the Development of Machinery and Associated Technology” TMT 2010, Mediterranean Cruises, 11–18 September 2010; Ekinović, S., Uctug, Y., Vivancos, J., Eds.; University of Zenica: Zenica, Bosnia and Herzegovina, 2010; pp. 69–72. [Google Scholar]
Figure 1. The Niehoff MSM-86 multi-stage wiredrawing industrial machine (Niehoff Stranding Technology, Badalona, Spain) with a maximum of 12 stages used to produce the final wire.
Metals 09 01021 g001
Figure 2. Construction of the dies (Ø 43 x 25 mm steel frame) and geometry of the PCD (polycrystalline diamond) core.
Metals 09 01021 g002
Figure 3. Sliding capstans system and wire-die interface in wiredrawing: input diameter (d0), output diameter (df), semi-angle (α), friction coefficient (μ), bearing length (Lc) and contact length (L).
Metals 09 01021 g003
Figure 4. Force vs. elongation graph obtained in the tensile tests (samples of each of the stages).
Metals 09 01021 g004
Figure 5. Curve-law of hardening by cold deformation of EN AW-1370 wiredrawn aluminium.
Metals 09 01021 g005
Figure 6. Aspect of breakage zone (x 30) in representative samples: (a) Ø 9.43 mm. initial rod wire, (b) 1rst reduction Ø 9.43–8.92 mm, (c) 3rd reduction Ø 7.92–6.99 mm, (d) 5th reduction Ø 6.20–5.47 mm, (e) 7th reduction Ø 4.85–4.28 mm, (f) 9th reduction Ø 3.81–3.36 mm and (g) 10th reduction Ø 3.36–2.98 mm.
Metals 09 01021 g006
Figure 7. Microscopic images of the surface appearance of the representative samples (250×).
Metals 09 01021 g007
Figure 8. Effective stress distribution (σeff) (MPa), in each of the stages of the stationary wiredrawing process.
Metals 09 01021 g008
Figure 9. Evolution of main stresses during the multi-step wiredrawing process (stress mean values measured graphically in the simulations by “tracking point” option, with ±5% error tolerance).
Metals 09 01021 g009
Figure 10. Effective strain (εeff.) distribution in the section of the wire, for each of the wiredrawing stages.
Metals 09 01021 g010
Figure 11. Effective strain distribution curves in the section of the wire, for each of the wiredrawing stages.
Metals 09 01021 g011
Figure 12. (a) Drawing stress evolution (b) Drawing force evolution (values from Deform 2D, ±5% error tolerance).
Metals 09 01021 g012
Table 1. Standard composition of EN AW-1370 aluminium (adapted from [1], with permission from AENOR, 2014) and composition measured by SEM.
EN AW-1370Chemical Composition (%)
SiFeCuMnMgCrNiZnGaV + TiBOtherAl
Standard<0.10<0.25<0.02<0.01<0.02<0.01-<0.04<0.03<0.02<0.02<0.10rest
Measured0.030.240.10---------99.62
Table 2. Mechanical properties of the Ø 9.43 mm EN AW-1370 aluminium rod-wire.
Diameter (mm)Maximum Force Fmáx. (N)Breaking Stress σuts (MPa)Yield Stress σY(0) (MPa)
9.506250.3889.4474.23
Table 3. Process setup and geometrical data for the wiredrawing of EN AW-1370 aluminium.
ParametersWiredrawing Stages
Stage Number (i)01234567891011
Output Diameter, df (mm)9.438.927.926.996.205.474.854.283.813.362.982.70
Reduction Rate, r-0.1180.2110.2210.2130.2210.2130.2210.2070.2220.2130.179
Acum. Reduction, rac.-0.1180.3050.4580.5740.6680.7390.7970.8390.8750.9010.919
Elongation, (%)-13.4326.8528.3827.1128.4727.2028.4126.1928.5827.1321.82
Die Semi-Angle, α (°)-1818181818181818181818
Calibration Length, Lc (mm)-2.672.372.101.861.641.451.281.141.000.890.81
Reduction Zone Contact, (%)-1322211828302832413526
Die Shape Factor, Delta Δ-9.815.204.955.154.945.144.955.314.925.156.26
Table 4. Process data and limit stresses obtained from the tensile tests.
ParametersWiredrawing Stages
Stage Number (i)01234567891011
Drawing Speed (mm.s−1)-91511611490189424353096397750176455820610000
Meas. Diameter, df (mm)9.438.927.926.996.205.474.854.283.813.362.982.70
Output Area, A (mm2)69.8962.5149.2538.3730.1923.4918.4714.3811.408.866.975.72
% Area Reduction-10.5621.2022.1321.2822.0821.2822.3220.7222.1321.2717.76
% Acc. Area Reduction-11.8330.5045.8657.4066.8573.9479.7183.9187.5090.1691.93
Unit Strain, ε-0.110.230.250.240.250.240.250.230.250.240.20
Acc. Unit Strain, εacc-0.110.350.600.841.11.331.581.812.062.302.50
Breaking Force, F (N)62506242583448604119337127262191180614301170998
Breaking Stress, σmáx (MPa)89.499.8118.4126.7136.4143.3147.2152.3158.3161.0167.3173.5
Yield Stress, σY (MPa)74.294.86115.4122.3130.8136.7140.6144.1152.2151.7163.2167.5
The values of the yield were measured graphically by the “tracking point” tool (±2–5% error tolerance).
Table 5. Stresses and drawing force obtained by Deform 2D simulations (±5% error tolerance).
ParametersWiredrawing Stages
Stage Number (i)01234567891011
Output Diameter, df (mm)9.508.927.926.996.205.474.854.283.813.362.982.70
(1) Yield Stress, σY (MPa)74.294.86115.4122.3130.8136.7140.6144.1152.2151.7163.2167.5
(2) Max. Stress, σeff. (max.) (MPa) -122130143151158164169174179183183
(2) Drawing Stress, Draw σ (MPa)-4761767382889698101108113
(2) Drawing Force, Fe (N)-28503030307023902070158013101010872706693
(3) Drawing Force, Fe (N)-29373005291622031926162513811100895756647
Determined by: (1) Equation (5), (2) post-processing options in Deform 2D, (3) Equation (6).
Table 6. Input variables in the multi-stage wiredrawing process.
VariableValue
Input Diameter, d0 (mm)9.43
Output Diameter, df (mm)2.70
Die Semi-Angle, α (°)18
Bearing Length, Lc (mm)0.3∙df
Delta Factor, Δ5.20
Friction Dies-Wire, μ10.20
Initial Yield Limit, σY (MPa)74.20
Initial Breaking Limit, σUTS (MPa)89.43
Strain Hardening Coefficient, n0.44
Deformation Resistance Coefficient, C59.804
Production Velocity, vf (m sec−1)10
Table 7. Optimized multi-stage wiredrawing sequence by PullWorks software application (Δ = 5.20).
Pass nrd0 (mm)df (mm)V0 (m/s)Vf (m/s)σdraw (MPa)σY (MPa)Fdraw (N)P (W)
19.438.371.9342.18559.21106.113257.963391.54
28.377.432.1852.77364.00117.422775.303666.17
37.436.602.7733.51467.40125.852305.803859.91
46.605.863.5144.45870.53132.871902.284038.55
55.865.204.4585.66273.32138.971557.094197.91
65.204.625.6627.17275.20144.331260.454304.45
74.624.107.1729.10777.70149.311025.934449.47
84.103.649.10711.55479.50153.84827.264551.61
93.643.2311.55414.67481.50158.10667.784666.44
103.232.8714.67418.58682.67162.04534.864733.50
112.872.7018.5862161.51165.86352.213522.11

