Article

The Role of Microstructure on the Tensile Plastic Behaviour of Ductile Iron GJS 400 Produced through Different Cooling Rates—Part II: Tensile Modelling

1
National Research Council of Italy (CNR)—Institute of Condensed Matter Chemistry and Technologies for Energy (ICMATE), via R. Cozzi 53, 20125 Milan, Italy
2
Faculty of Foundry Engineering, Department of Cast Alloys and Composites Engineering, AGH University of Science and Technology, 30-059 Krakow, Poland
3
Zanardi Fonderie S.p.A., via Nazionale 3, 37046 Minerbe (VR), Italy
*
Author to whom correspondence should be addressed.
Metals 2019, 9(9), 1019; https://doi.org/10.3390/met9091019
Submission received: 30 August 2019 / Revised: 16 September 2019 / Accepted: 17 September 2019 / Published: 19 September 2019
(This article belongs to the Special Issue Cast Irons: Properties and Applications)

Abstract

:
Tensile testing on ductile iron GJS 400 with different microstructures produced through four different cooling rates was performed in order to investigate the relevance of the microstructure’s parameters on its plastic behaviour. Tensile flow curve modelling was carried out with the Follansbee and Estrin-Kocks-Mecking approach that allowed for an explicit correlation between plastic behaviour and some microstructure parameters. In the model, the ferritic grain size and volume fraction of pearlite and ferrite gathered in the first part of this investigation were used as inputs, while other parameters, like nodule count and interlamellar spacing in pearlite, were neglected. The model matched very well with the experimental flow curves at high strains, while some mismatch was found only at small strains, which was ascribed to the decohesion between the graphite nodules and the ferritic matrix that occurred just after yielding. It can be concluded that the plastic behaviour of GJS 400 depends mainly on the ferritic grain size and pearlitic volume fraction, and other microstructure parameters can be neglected, primarily because of their high nodularity and few defects.

1. Introduction

Ductile Irons (DIs) are cast irons containing graphite of a spherical shape, which gives them an excellent compromise between tensile strength and ductility, toughness, and fatigue resistance [1,2,3,4,5,6]. Thanks to their fine microstructure control, DIs can satisfy a variety of different design requirements for heavy duty components, such as in hydraulic and oleo dynamic applications, as well as bearing adapters. However, in components with complex geometry, the solidification conditions can be quite different, producing different microstructures and, as a consequence, different plastic behaviours. Thus, the relationship between solidification conditions, microstructure, and plastic behaviour have to be known in order to optimise the design of the component’s geometry [7,8,9,10,11]. The strain hardening behaviour and strength of DIs are strongly affected by their microstructures, since the yield stress increases with decreasing ferritic grain size, while in ferritic–pearlitic DIs, the yield stress increases with an increase in pearlite content, which causes a reduction of the strain to fracture [12]. With low nodularity, the DIs become more brittle, with decreasing strains at failure [13,14,15,16]. Empirical relations for the correlations between the mechanical properties and microstructure in DIs were reported in [15,16].
The present paper is focused on investigating the relevance of the microstructure parameters on the plastic behaviour of GJS 400 with different microstructures produced through four different cooling rates. The details of the GJS 400 microstructure investigations are reported elsewhere [17]. The tensile flow curve analysis was carried out with the Follansbee and Estrin-Kocks-Mecking approach, which allows an explicit correlation between the plastic behaviour and the microstructure parameters.

2. Materials and Methods

2.1. Material

The chemical compositions of the GJS 400 produced in Zanardi Fonderie S.p.A. (Minerbe-VR, Italy), with four different moulds, is reported in Table 1.
The GJS 400 was produced using four different cooling rates with a cylindrical Lynchburg (25 mm diameter), and 3 different Y moulds with increasing thicknesses of 25, 50, and 75 mm, thereby complying with the standard ASTM A 536-84. Details of the melt pouring conditions and cooling rates have been reported in [17], where the microstructures of the 24 GJS-400 samples (6 samples from each mould) were investigated. The nodule count, nodularity, average diameter of the graphite nodules, volumetric fractions of graphite, and pearlite were measured by digital image analysis complying with ASTM E2567-16a, and the average ferritic grain size was also found (complying with ASTM E112-13). An example of a typical GJS 400 microstructure produced through a Y 75 mm mould is reported in Figure 1 after etching with Nital 2%, where spheroidal graphite (black) in the ferritic matrix with visible grain boundaries and pearlitic islands (light grey) are visible. The average parameters of the microstructures of the GJS 400 produced with the four moulds are reported in Table 2, while the microstructure parameters from each sample are reported elsewhere [17]. In the Lynchburg samples, there was no significant pearlite, while in the Y moulds where the cooling rates were slower, the pearlite volume fractions spanned from about 3% to 4%. However, the pearlite formation was rationalized in term of the positive micro-segregations of Mn and the negative micro-segregations of Si that were produced during solidification [17,18,19]. The ferritic grain size range was from 37.3 to 48.6 μm, which is consistent with the solidification rates.

2.2. Tensile Tests and Microstructure Plasticity Model

Tensile tests on the considered 24 samples of GJS 400 were carried out on round specimens using a gauge with an initial diameter of d0 = 12.5 mm and a length of l0 = 50 mm, complying with the standard ASTM E8-8M with a strain rate of 10−4 s−1. The true stress–true plastic strains (σ vs. εp) were used, where σ = S∙(1 + e) and εp = εσ/E = ln(1 + e) – σ/E (with S and e as the engineering stress and elongation, respectively) and E is the experimental Young modulus.
The model used to describe the tensile plastic flow curves of the GJS 400 with a detailed correlation with the microstructure’s characteristic lengths was based on the Follansbee approach [20,21], according to which the flow stress σ develops as
σ = σo + σG(εP) = σo + oGbρ1/2,
where σo is the initial stress because of the solid solution or precipitation strengthening, and σG is the component of stress depending on the increase of the dislocation density ρ because of strain εP. M is the Taylor factor (3.01 in BCC materials), αo the dislocation-dislocation interaction strength (0.5) [22], G the elastic shear modulus for ferrite (64 GPa), and b the Burgers vector length of ferrite (0.248 nm). At strain εP = 0, σG was assumed to be nil because of the negligible initial dislocation density of GJS 400 in the cast conditions. The total dislocation-density ρ increases because of straining, according to the mechanistic evolution equation by Kocks-Mecking-Estrin [22,23,24,25,26,27,28]:
d ρ d ε P = M [ ( 1 b Λ + 1 b D + 1 b λ ) D o ρ ] ,
where Do is the dynamic recovery term that describes the softening of materials during straining because of dislocation annihilation and low energy dislocation structure formation. Λ, D, and λ are the microstructure characteristic lengths; Λ is the dislocations mean free path related to the dislocation cells in ferrite with Λ = β/ρ1/2 and a β constant [22], D is the ferritic grain size or pearlitic island size, and λ is the interlamellar spacing in pearlite.
Substituting σG = MαoGbρ1/2 and Λ = β/ρ1/2, and considering that in ferrite the grain boundaries and dislocation cells are the obstacles to dislocation motion (for ferrite Equation (2)), results in
d σ G d ε P = ( K o β + K 1 D σ G ) σ G ε c , F ,
where Ko (= 1.538 × 10⁵ MPa) and K1 (= 7.565 × 10⁶ MPa2∙μm) are constants depending on the BCC ferritic crystal, while β and 1/εc,F are outputs from fitting. The detailed calculations to obtain Equation (3) from Equations (1) and (2) are reported in Appendix A.
In pearlite, the interlamellar spacing λ is nanometric, which is by far smaller than the Λ, the ferritic grain size DFerrite, and the pearlitic colony size, DPearlite. Thus, pearlite Equation (2) results in
d σ G d ε P = K 1 λ σ G σ G ε c , P
where 1/εc,P is the output from the fitting, if λ is known. The detailed calculations to obtain Equation (4) from Equations (1) and (2) are reported in Appendix A. The equation σG vs. εP, resulting from integrating Equation (4), is an exponential decay equation with a saturation stress σS,P that is the maximum stress achieved asymptotically at the condition dσG/dεP = 0, while εc,P is the critical strain that defines the rate at which σS,P is achieved. However, if an average characteristic λ cannot be measured (like in the present investigation of GJS 400 because of the complexity of pearlitic microstructures [17]), Equation (4) can be fitted to the experimental data considering the quantity (K1/λ) as a further output from the fitting. Then, from (K1/λ) and εc,P, the saturation stress σS,P = [(K1/λ)∙εc,P] can be found to test the physical meaning of the fitting results.
GJS 400 are cast irons with different volume fractions of ferrite and pearlite, resulting from the solidification rates, as reported in Table 2. Thus, the total tensile flow stress with strain σ(εP) in GJS 400 produces a mixture rule:
σ(εP) = (1 − XPearlite)·σFerrite(εP) + XPearlite·σPearlite(εP)
where XPearlite is the pearlite volume fraction, and (1 – XPearlite) is the ferrite volume fraction. The rule of mixture that has been usually used for all two phase materials [29] has also been successfully used in Dual Phase (DP) steels [30,31,32] whose microstructures consist of soft ferrite and hard martensite. Equation (5) was used successfully in DP steels for hardness, Yield Stress (YS), and Ultimate Tensile Stress (Rm). In terms of mechanical constituents, DP’s microstructure has similarities with the investigated GJS 400, consisting of soft ferrite and hard pearlite (and graphite nodules), so Equation (5) was used for the present investigation.
The fundamental assumption of this approach is that the graphite should not affect the tensile plastic behaviour of GJS 400, so graphite parameters like nodule count, nodule size, internodular spacing, and nodularity were expected to not be needed in the first approximation to describe the tensile plastic behaviour. This assumption had to be validated.

3. Results

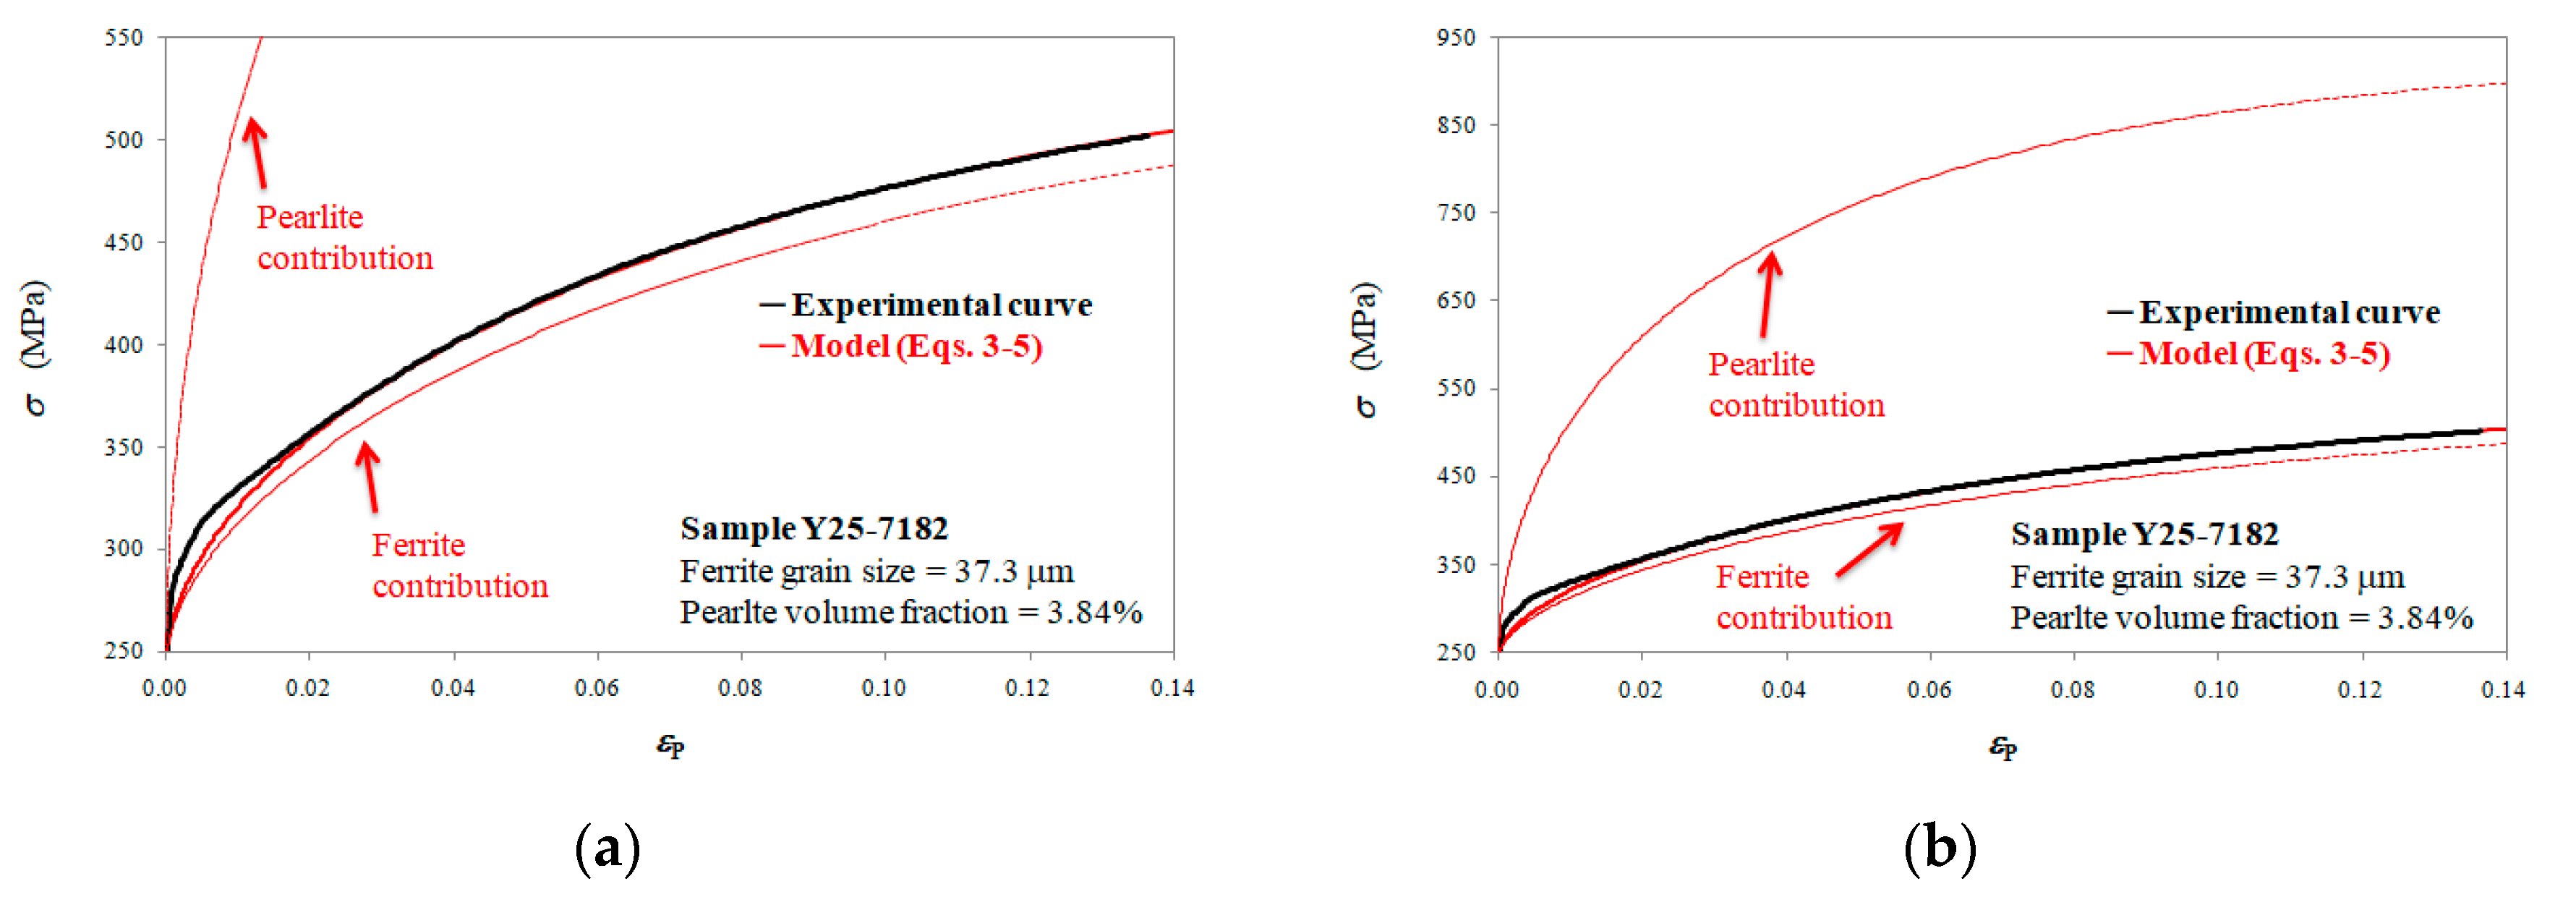
3.1. Model Calibration

The model was calibrated firstly by fitting the tensile flow curves of the GJS 400 from Lynchburg mould samples with Equation (3), where only ferrite was found (see Table 2). In this way, the fitting parameters concerning ferrite were found as outputs from the fitting. The second calibration step was used to fit the tensile data of GJS 400 from Y 25 mm with Equation (5), where the pearlite was also present, in order to work out the flow curve of the pearlite. Thus, after the latter step, the microstructure plasticity model was calibrated, and then the tensile flow curves of the GJS 400 from moulds Y 50 mm and 75 mm could be modelled using only their microstructure parameters reported in Table 2, and then comparing them to the experimental flow curves.
By analysing the six tensile flow curves of the GJS 400 produced with the Lynchburg mould in order to have the best strain hardening fittings at high stresses, an average initial stress σo = 243.1 ± 6.2 MPa (see Equation (1)) was found. Indeed, the plastic flow curves of GJS 400 from different moulds did not change during the early stages of deformations but was significant at high strains, which could be rationalized by the findings that ferrite was the dominant softer constituent that deformed first at yielding, while the smaller volume fractions (<4%) of harder pearlite contributed significantly later at higher strains. Thus, σo = 243.1 MPa was used to model all the flow curves of GJS 400 from the other moulds. The strain hardening data of the tensile flow curves of GJS 400 from the Lynchburg mould with an average ferrite grain size of 37.3 ± 3.2 μm were fitted, yielding the following average values for the equation parameters: 1/εc,F = 6.36 ± 0.25 and β = 119.1 ± 8.7 MPa (see Equation (3)). These values are consistent with the literature, where β has been reported to be between 100 and 200 [22], proving the physical meaning and, in turn, the validity of the model.
In the GJS 400 samples produced in the present investigation, the pearlite was irregular and its shape was rarely lamellar and depended on grain orientation [17], so it was not possible to measure any characteristic average interlamellar spacing λ to input into Equations (4) and (5). Thus, in order to find the pearlitic flow curve σPearlite(εP) vs. εP, Equation (5) was fitted to the GJS 400 Y 25 mm tensile data considering the quantity (K1/λ) and the parameter 1/εc,P as outputs. In the GJS 400 produced with Y 25 mm, the average volume fraction of the pearlite was 3.8% ± 0.4%, and the average grain size was 39.2 ± 2.3 μm (see Table 2). The fitting resulted in a pearlite flow curve with an average saturation stress of σS,P = 1094.4 ± 106.0 MPa and an average critical strain parameter of 1/εc,P = 22.1 ± 3.3. In Figure 2a,b, the fitting results are reported for a typical flow curve of GJS 400 from the Y 25 mm mould sample, detailing the contributions from the ferrite and pearlite. The fit was excellent at high stresses, while at low strains there was some mismatch. Though σS,P was consistent with the results reported in the literature for Isothermed Ductile Irons 1000 with a pearlite volume fraction higher than 80% [27], the 1/εc,P for pearlite was quite low, considering that it should have been just slightly lower than 40. In other words, the pearlite contribution to the flow curve in Figure 2b should have increased faster while keeping the same saturation stress, σPearlite,V. The reasons for this result are not evident and need further investigation.

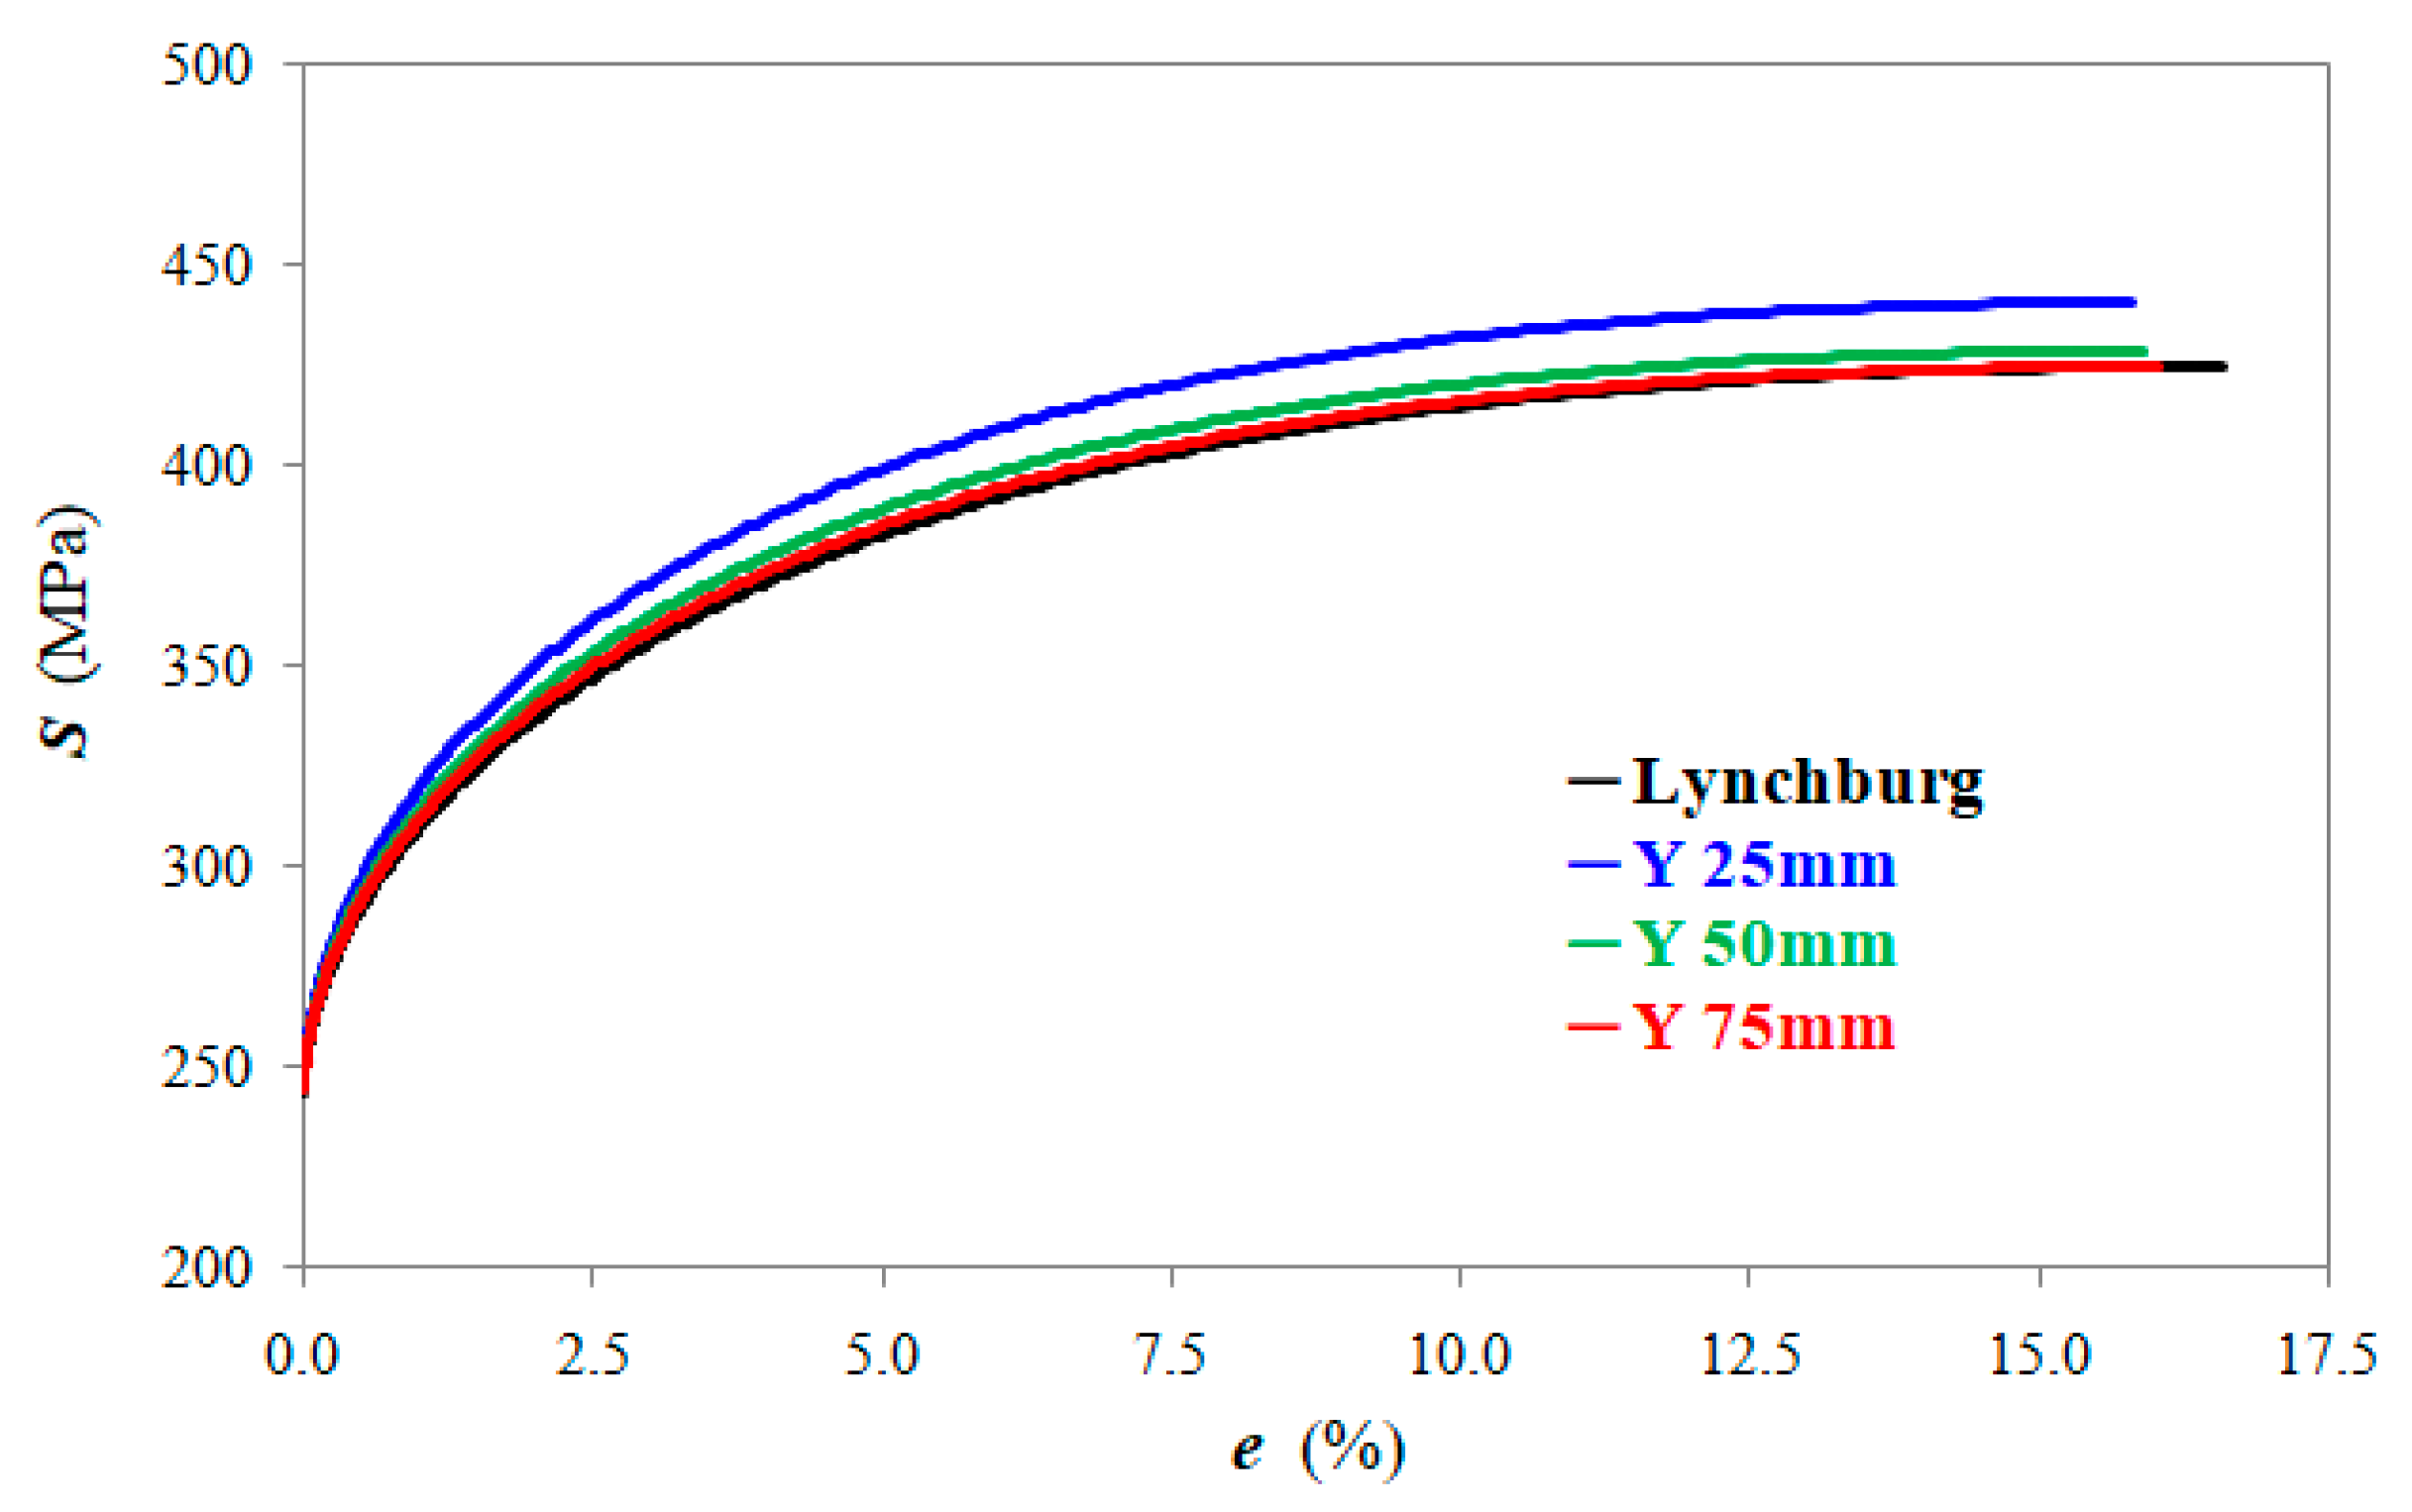
3.2. Model Prediction

After calibration, Equations (3)–(5) were used to predict the tensile flow curves of the GJS 400 produced from the moulds Y 50 mm and Y 75 mm by using only the microstructure parameters for the ferritic grain sizes and pearlite volume fractions, reported in Table 2. Examples of typical model curves are reported in Figure 3a–d for GJS 400 produced from the Y 50 mm and Y 75 mm moulds, respectively, where only the ferritic component contributions are reported. The ferrite grain size and pearlite volume fraction of the individual samples are reported on the plots. Indeed, there is a significant mismatch, even though the model can qualitatively describe the experimental flow curves.

4. Discussion

4.1. Considerations of the Minimum Requirements of Data Statistics Complying with the Standards ASTM E2567-16a and ASTM E112-13

The model flow curves reported in Figure 3 can qualitatively predict the experimental tensile behaviour of GJS 400 produced through different cooling rates (Y 50 mm and Y 75 mm moulds), suggesting that, though the microstructure plasticity model was qualitatively correct, it could be improved. In Figure 3, the individual microstructure parameters of the GJS 400 samples from the Y 50 mm and Y 75 mm moulds were used as inputs in Equations (3)–(5). However, if the average values of the ferrite grain sizes (48.6 μm in the Y 50 mm mould, and 47.7 μm in the Y 75 mm mould) and pearlite volume fractions (4.0% in the Y 50 mm mould, and 3.0% in the Y 75 mm mould) from Table 2 are used, the matches between the model flow curves and the experimental data improve significantly, albeit at small strains. In Figure 4, the same experimental flow curves of Figure 3 were compared to the model flow curves where the average microstructure parameters in Table 2 were used.
Indeed, the local microstructure parameters in Figure 3 changed significantly from the sample Y50-7189 to Y50-7190 (the Y 50 mm mould). The ferritic grain size changed from 41.6 μm to 46.2 μm, and the pearlite volume fraction changes from 3.1% to 5.6%. The same wide change was found for the samples from the Y 75 mm mould. The ferritic grain size changed from 40.8 μm to 50.3 μm, and the pearlite volume fraction changed from 3.2% to 2.1%. These results suggested that the average microstructure parameters became more adherent to the actual microstructures than the single microstructure parameters gathered from each sample.
The rationalization of this finding is that the reason for the mismatch between the experimental curves and the model in Figure 3 was the inaccuracy of the microstructure parameters, although they were carried out according to the minimum requirements of the data statistics, complying with the standard ASTM E112-13 for the grain size measurements reported in [17]. Indeed, the average microstructure parameters calculated for the 6 samples of each mould represented a statistical increase of six times with respect to the minimum required statistics. Thus, the GJS 400 microstructures were significantly more homogeneous than those found through the single sample measurements and were better described by the average microstructure parameters in Table 2. On the other hand, the mechanical tensile tests were indirect characterizations of the microstructures complying with the minimum data statistics that proved to be more reliable than the direct characterizations required by the ASTM E2567-16a and ASTM E112-13 standards. This result means that if wider statistics were gathered beyond the minimum requirements of the standards’ statistics, the accuracy of the microstructure parameters from each sample could be improved.

4.2. Microstructure Parameters Relevant to Describing the Plastic Behaviour of GJS 400

As seen in Figure 4, using the average microstructure parameters (see Table 2) as inputs in the microstructure plasticity model the result excellently described the experimental flow curves of the GJS 400 produced with different cooling rates, even if minor mismatch was present at small strains. Thus, the microstructure plasticity model indicated that the ferritic grains size and pearlite volume fractions were the only microstructural parameters needed to describe the plastic behaviour of GJS 400 produced in the range of the cooling rates tested with the Lynchburg and Y 25–75 mm moulds. The model flow curves in the engineering stress–strain coordinates (up to an ultimate tensile stress Rm) built with the average microstructure parameters for the four different moulds in Table 2 are reported in Figure 5, while the Rm values, the elongations at Rm, en (n after necking), and the yield stress, YS, are reported in Table 3. In fact, the comparison of the model flow curves in engineering stress–strain affords an extended evaluation of the model results, since all flow curves strained beyond necking correspond to the end of uniform elongation and the occurrence of localised deformation. Since the final rupture eR could be affected by local defects in the necking, eR prediction was beyond the aims of the present investigation.
The comparison of the model results and the experimental data reported in Table 3 proves that the plastic behaviour of the GJS 400 produced with different cooling rates (different thicknesses) can be described successfully by using the classical strain hardening model widely used for ductile metallic materials [22,23,24,25,26,27,28]. Since the correlation between the mechanical constituents (ferrite and pearlite), physical parameters, and microstructure was validated, the use of dislocation-related-dislocation density constitutive equations (like the Voce and Estrin equations) for different DI grades reported in previous investigations [27,28] was also validated. Considerations about the other microstructure parameters are reported in Section 4.3.
Indeed, even if the use of the simple rule of mixture is diffused in DP steels [31,32,33] that have constituents (ferrite and martensite) that are similar (from the perspective of hardness) to GJS 400 (ferrite and pearlite), the use of the rule of mixture has not been always successful. Particularly when the volume fractions of the constituents have varied widely [33], some modifications to the rule of mixture have been necessary. Indeed, Equation (5) is consistent with an iso-strain approach, but kinematic hardening should occur at the boundaries between ferrite and pearlite during the early stages of straining, and isotropic hardening because of diffuse dislocation activities in the soft ferrite grains should become significant at large strains. However, in this study, the pearlite volume fraction varied slightly and never excided 4%, so this limited range could explain why the simple rule of mixture (Equation (5)) worked well in the present investigation.
The sensitivity of the model to the microstructure parameters was tested by opportunely changing the average microstructure parameters. Examples of this investigation are reported in Figure 6. In Figure 6a, engineering flow curves from the Lynchburg and the Y 25 mm moulds are shown, while in Figure 6b, the pearlite volume fraction in GJS 400 from the Y 25 mm mould was set to zero (like in the Lynchburg mould), resulting in a flow curve lower than the Lynchburg samples with a smaller ferritic grain size. In Figure 6c, the flow curves from the Lynchburg, Y 50 mm, and Y 75 mm moulds are reported, while in Figure 6d, the average pearlite volume fractions from Y 50 mm and Y 75 mm were set to zero (like in Lynchburg), resulting again in flow curves lower than those from the Lynchburg samples with smaller average grain sizes.
From the results reported in Figure 6, it can be concluded that the GJS 400 from Y 25 mm mould was the strongest (Rm = 440.5 MPa) and the least ductile (elongation at Rm = 15.8%) (in Figure 5) because of the combination of its small ferritic grain size (39.2 ± 2.3 μm) and high pearlite volume fraction (3.8 ± 0.4%), while in the Lynchburg mould, even if the ferritic microstructure was the finest (37.3 ± 3.2 μm) because it had the highest solidification rate, the absence of pearlite produced the softest microstructure with the lowest Rm (424.4 MPa) and the most ductile microstructure with the largest elongation at Rm (16.6%). The significant increases of ferritic grain size in the Y 50 mm (48.6 ± 4.7 μm) and Y 75 mm (47.7 ± 7.0 μm) samples, which should have significantly weakened the GJS 400 microstructures, were, indeed, compensated by the significant presence of pearlite (4.0% ± 1.6% in Y 50 mm and 3.0% ± 0.5% in the Y 75 mm mould). Thus, the engineering flow curves in Figure 6c for the Lynchburg and Y 50 mm and 75 mm moulds were finally comparable. It is noteworthy that the model also correctly described the elongations at Rm, since in the comparable flow curves (the Lynchburg, Y 50 mm, and Y 75 mm moulds), the microstructures with the higher pearlite volume fractions presented shorter elongations to Rm (15.9% in Y 50 mm and 16.0% in the Y 75 mm mould), which is consistent with the fact that the microstructure constituents that strengthen materials reduced their ductility.

4.3. Considerations of Other Microstructural Parameters

The spherical shape of graphite confers high ductility to the cast irons (producing so-called Ductile Irons (DIs)), and different graphite volume fractions and graphite morphologies could the affect tensile properties. Improper graphite shapes can give rise to stress-raisers that firstly affect the ductility, and if the nature and the density of the stress-raisers are particularly severe, they could also affect the plastic behaviours and the tensile flow curves [13,14,15,16]. In this case, the parameters for the graphitic nodules should be taken into account. However, the average nodularity values (ASTM 2567-16a) of the GJS 400 produced with the different moulds were excellent and over the minimum of 80%, thereby complying with the standard (namely 89.8% ± 3.0% for Lynchburg, 91.2% ± 1.6% for Y 25 mm, 87.1% ± 1.4% for Y 50 mm, and 83.2% ± 4.6% for Y 75 mm. The high nodularity and almost constant graphite volume fractions in the investigated GJS 400 samples could explain why there was no need to involve nodule parameters in the plasticity model of Equations (3)–(5).
According to the literature on steels [33,34] and DIs [7,35], the interlamellar spacing λ of pearlite, which depends on the cooling rate at the critical temperature Ac1 when the eutectoid transformation starts, should have effect on mechanical properties. In the present GJS 400 investigation [17], the cooling rates at Ac1 were 2.40 °C/min in the Y 75 mm mould, 3.54 °C/min in the Y 50 mm mould, and 5.47 °C/min in Y 25 mm. In the GJS 400 samples produced with different moulds [17], the pearlite was irregular, and its shape was rarely lamellar. It depended instead on grain orientation in agreement with [7,35], so it was not possible to measure any characteristic interlamellar spacing. However, the results reported in Figure 4, where a single pearlite flow curve was valid for all samples, and the fact that the pearlite volume fraction was the only significant parameter, suggest that the pearlite’s characteristic widths likely did not change significantly in the range of the investigated cooling rates through Ac1. However, the pearlite volume fractions reported in Table 2 varied slightly from 0% to 4% in the different moulds, and this could be another possible reason why a single pearlite flow curve (i.e., a single pearlite characteristic width) could be used successfully.
Thus the microstructure plasticity model allowed to accurately describe the experimental flow curves of the GJS 400 produced with different cooling rates, proving that ferritic grain sizes and pearlite volume fractions mainly affect the plastic flow behaviour of GJS 400 in agreement with the microstructure–mechanical property relations reviewed in [12], demonstrating that the strain hardening behaviour and strength of DIs are strongly affected by their microstructures, since yield stress increases with decreasing ferritic grain size, while in the ferritic–pearlitic Dis, the yield stress increases with an increasing content of pearlite, which causes a reduction of the strain to fracture. Minor mismatching was found at small strains, which could be rationalized in term of the decohesion between the graphite nodules and the ferritic matrix. The void nucleation, caused by graphite-matrix decohesion, followed by void growth and coalescence, can be expected to affect all the tensile flow curves of DJS 400. Detailed investigations [36,37,38] on the plastic behaviour of a ferritic DI reported that the graphite-matrix decohesion did not cause any dramatic decrease in tensile stress, though the damage was significant with a final failure of about 20%. Thus, the tensile flow curves at high stresses were representative of the microstructures, and the graphite nodules decohesion affected the flow curves only at yielding. In order to take into proper consideration the graphite-matrix decohesion to describe yielding in the DIs, interesting results have been reported via numerical simulations on the effects of residual stresses at the graphite–matrix interface and decohesion at the early stages of deformation, with an estimation of increased YS of about 5% [39,40], which is consistent with the mismatch at YS reported in Table 3, with errors of YS between −3.7% (the Y 75 mm mould) and −5.6% (the Lynchburg mould).

5. Conclusions

Different microstructures of GJS 400 were obtained through different cooling rates. The microstructures were characterised in detail elsewhere [17], quantifying the microstructure’s parameters, like nodule count, nodularity, the average diameter of the graphite nodules, volume fractions of the graphite and pearlite (complying with the standard ASTM E2567-16a), and the average ferritic grain size (complying with the standard ASTM E112-96). The tensile flow curves were modelled with the Follansbee and Estrin-Kocks-Mecking approaches, which afforded an explicit correlation between the plastic behaviour and microstructure parameters. The following conclusions were achieved:
  • This model described very well the experimental flow curves at high strains, while at low strains, minor mismatching was present. This mismatching was ascribed to the graphite-matrix decohesion;
  • The plastic behaviour of the GJS 400 with different microstructures depended mainly on the ferritic grain size and pearlitic volume fraction, while the other microstructure parameters were not needed to rationalize the GJS 400’s plastic behaviour;
  • The correlation between the mechanical constituents (ferrite and pearlite), physical parameters, and microstructure was validated, so the use of dislocation-related-dislocation density constitutive equations (like the Voce and Estrin equations) for different DI grades reported in previous investigations was also validated;
  • The results proved that the data gathered while complying with the minimum requirements of the standards’ statistics were not enough to produce accurate microstructural data.

Author Contributions

Conceptualization, G.A.; methodology, G.A.; resources, G.A. and F.Z.; data analysis, G.A., R.D. and D.R.; writing—original draft preparation, G.A.; writing—review and editing, R.D., D.R., and M.G.; supervision, G.A.

Funding

This research received no external funding.

Acknowledgments

Davide Della Torre and Tullio Ranucci are warmly thanked for their experimental support.

Conflicts of Interest

The authors declare no conflict of interest.

Appendix A. Mechanistic Equation of Strain Hardening and Physical Parameters

In the frame of the strain hardening theory by Kocks-Mecking-Estrin [22,23,24,25,26,27,28], the total dislocation-density ρ increases because of straining according to the mechanistic equation
d ρ d ε P = M [ ( 1 b Λ + 1 b D + 1 b λ ) D o ρ ] ,
where Do = dynamic recovery term;
  • Λ = dislocation mean free path related to the dislocation cells in ferrite;
  • D = ferritic grain size or pearlitic island size;
  • λ = interlamellar spacing in pearlite.
According to principle of similitude Λ = β/ρ1/2, with a β constant of the magnitude between 100 and 200 [22], Equation (A1) becomes
d ρ d ε P = M [ ( ρ b β + 1 b D + 1 b λ ) D o ρ ] ,
and
2 d ρ d ε P = M [ ( 1 b β + 1 b D ρ + 1 b λ ρ ) D o ρ ] ,
From Equation (1) in Section 2.2
ρ   =   σ G / ( M α o G b ) ,
so Equation (A3) becomes
2 M α o G b d σ G d ε P = M [ ( 1 b β + M α o G b b D σ G + M α o G b b λ σ G ) D o σ G M α o G b ] ,
and
d σ G d ε P = [ M 2 α o G 2 β + M 3 ( α o G ) 2 b 2 D σ G + M 3 ( α o G ) 2 b 2 λ σ G ] M D o 2 σ G ,
Which, if written in a more compact way, results in
d σ G d ε P = [ K o β + K 1 D σ G + K 1 λ σ G ] σ G ε c ,
where M is the Taylor factor (3.01 in BCC materials), αo the dislocation–dislocation interaction strength (0.5) [22], G the elastic shear modulus for ferrite (64 GPa), and b the Burgers vector length of the ferrite (0.248 nm), which results in
K o = M 2 α o G 2 =   1.538   ×   10 5   MPa ,
and
K 1 = M 3 ( α o G ) 2 b 2 =   7.565   ×   10 6   MPa 2 · μ m ,
as reported in Section 2.2.

References

  1. Gonzaga, R.A.; Carrasquilla, J.F. Influence of an appropriate balance of the alloying elements on microstructure and on mechanical properties of nodular cast iron. J. Mater. Process. Tech. 2005, 162, 293–297. [Google Scholar] [CrossRef]
  2. Gonzaga, R.A. Influence of ferrite and pearlite content on mechanical properties of ductile cast irons. Mater. Sci. Eng. A 2013, 567, 1–8. [Google Scholar] [CrossRef]
  3. Alhussein, A.; Risbet, M.; Bastien, A.; Chobaut, J.P.; Balloy, D.; Favergeon, J. Influence of silicon and addition elements on the mechanical behaviour of ferritic ductile cast iron. Mater. Sci. Eng. A 2014, 605, 222–228. [Google Scholar] [CrossRef]
  4. Bradley, W.L.; Srinivasan, M.N. Fracture and fracture toughness of cast irons. Int. Mater. Rev. 1990, 35, 129–161. [Google Scholar] [CrossRef]
  5. Iacoviello, F.; Di Bartolomeo, O.; Di Cocco, V.; Piacente, V. Damaging micro-mechanisms in ferritic-pearlitic ductile cast irons. Mater. Sci. Eng. A 2008, 478, 181–186. [Google Scholar] [CrossRef]
  6. Di Cocco, V.; Iacoviello, F.; Rossi, A.; Iacoviello, D. Macro and microscopical approach to the damaging mechanisms analysis in a ferritic ductile cast iron. Theor. Appl. Fract. Mech. 2014, 69, 26–33. [Google Scholar] [CrossRef]
  7. Guo, X.; Stefanescu, D.M.; Chuzhoy, L.; Pershing, M.A.; Biltgen, G.L. A Mechanical Properties Model for Ductile Iron. AFS Trans. 1997, 105, 47–54. [Google Scholar]
  8. Donelan, P. Modelling microstructural and mechanical properties of ferritic ductile cast iron. Mater. Sci. Tech. Ser. 2000, 16, 261–269. [Google Scholar] [CrossRef]
  9. Kasvayee, K.A.; Ghassemali, E.; Svensson, I.L.; Olofsson, J.; Jarfors, A.E.W. Characterization and modeling of the mechanical behavior of high silicon ductile iron. Mater. Sci. Eng. A 2017, 708, 159–170. [Google Scholar] [CrossRef]
  10. Svensson, I.L.; Sjögren, T. On modeling and simulation of mechanical properties of cast irons with different morphologies of graphite. Int. J. Met. 2009, 3, 67–77. [Google Scholar] [CrossRef]
  11. Olofsson, J.; Salomonsson, K.; Svensson, I.L. Modelling and simulations of ductile iron solidification induced variations in mechanical behaviour on component and microstructural level. IOP Conf. Ser. Mater. Sci. Eng. 2015, 84, 012026. [Google Scholar] [CrossRef]
  12. Hütter, G.; Zybell, L.; Kuna, M. Micromechanisms of fracture in nodular cast iron: From experimental findings towards modeling strategies—A review. Eng. Fract. Mech. 2015, 144, 118–141. [Google Scholar] [CrossRef]
  13. Goodrich, G.M. Cast iron microstructure anomalies and their causes. AFS Trans. 1997, 105, 669–683. [Google Scholar]
  14. Iwabuchi, Y.; Narita, H.; Tsumura, O. Toughness and Ductility of heavy-walled ferritic spheroidal-graphite iron castings. Res. Rep. Kushiro Natl. Coll. 2003, 37, 1–9. [Google Scholar]
  15. Nilsson, K.F.; Blagoeva, D.; Moretto, P. An experimental and numerical analysis to correlate variation in ductility to defects and microstructure in ductile cast iron components. Eng. Fract. Mech. 2006, 73, 1133–1157. [Google Scholar] [CrossRef]
  16. Nilsson, K.F.; Vokal, V. Analysis of ductile cast iron tensile tests to relate ductility variation to casting defects and material microstructure. Mater. Sci. Eng. A 2009, 502, 54–63. [Google Scholar] [CrossRef]
  17. Angella, G.; Ripamonti, D.; Górny, M.; Masaggia, S.; Zanardi, F. The role of microstructure on tensile plastic behaviour of ductile iron GJS 400 produced through different cooling rates—Part I: Microstructure. Metals 2019, in press. [Google Scholar]
  18. Rivera, G.; Boeri, R.; Sikora, J. Revealing the solidification structure of nodular iron. Int. J. Cast Metal. Res. 1995, 8, 1–5. [Google Scholar] [CrossRef]
  19. Rivera, G.; Boeri, R.; Sikora, J. Revealing and characterizing solidification structure of ductile cast iron. Mater. Sci. Technol. 2002, 18, 691–698. [Google Scholar] [CrossRef]
  20. Follansbee, P.S.; Kocks, U.F. A Constitutive Description of the Deformation of Copper Based on the Use of the Mechanical Threshold Stress as an Internal State Variable. Acta Metall. Mater. 1988, 36, 81–93. [Google Scholar] [CrossRef]
  21. Follansbee, P.S. Structure Evolution in Austenitic Stainless Steels -A State Variable Model Assessment. Mater. Sci. Appl. 2015, 6, 457–463. [Google Scholar] [CrossRef]
  22. Kocks, U.F.; Mecking, H. Physics and phenomenology of strain hardening: The FCC case. Prog. Mater. Sci. 2003, 48, 171–273. [Google Scholar] [CrossRef]
  23. Estrin, Y.; Mecking, H. A unified phenomenological description of work hardening and creep based on one- parameter models. Acta Metall. Mater. 1984, 32, 57–70. [Google Scholar] [CrossRef]
  24. Estrin, Y. Dislocation theory based constitutive modelling: Foundations and applications. J. Mater. Process. Tech. 1998, 80, 33–39. [Google Scholar] [CrossRef]
  25. Angella, G. Strain hardening analysis of an austenitic stainless steel at high temperatures based on the one-parameter model. Mater. Sci. Eng. A 2012, 532, 381–391. [Google Scholar] [CrossRef]
  26. Angella, G.; Donnini, R.; Maldini, M.; Ripamonti, D. Combination between Voce formalism and improved Kocks-Mecking approach to model small strains of flow curves at high temperatures. Mater. Sci. Eng. A 2014, 594, 381–388. [Google Scholar] [CrossRef]
  27. Angella, G.; Zanardi, F.; Donnini, R. On the significance to use dislocation-density-related constitutive equations to correlate strain hardening with microstructure of metallic alloys: The case of conventional and austempered ductile irons. J. Alloy. Compd. 2016, 669, 262–271. [Google Scholar] [CrossRef]
  28. Donnini, R.; Fabrizi, A.; Bonollo, F.; Zanardi, F.; Angella, G. Assessment of the Microstructure Evolution of an Austempered Ductile Iron During Austempering Process Through Strain Hardening Analysis. Met. Mater. Int. 2017, 23, 855–864. [Google Scholar] [CrossRef]
  29. Caballero, F.G.; Garcìa de Andrés, C.; Capdevila, C. Characterization and morphological analysis of pearlite in a eutectoid steel. Mater. Charact. 2000, 45, 111–116. [Google Scholar] [CrossRef] [Green Version]
  30. Dieter, G.E. Mechanical Metallurgy; McGraw-Hill Book Company: New York, NY, USA, 1988; pp. 208–212. [Google Scholar]
  31. Byun, T.S.; Kim, I.S. Tensile properties and inhomogeneous deformation of ferrite-martensite dual phase steels. J. Mater. Sci. 1998, 9, 85–92. [Google Scholar] [CrossRef]
  32. Park, K.; Nishiyama, M.; Nakada, N.; Tsuchiyama, T.; Takaki, S. Effect of the martensite distribution on the strain hardening and ductile fracture behaviours of dual phase steel. Mater. Sci. Eng. A 2014, 604, 135–141. [Google Scholar] [CrossRef]
  33. Alibeyki, M.; Mirzadeh, H.; Najafi, M.; Kalhor, A. Modification of rule of mixtures for estimation of the mechanical properties of dual phase steels. J. Mater. Eng. Perform. 2017, 26, 2683–2688. [Google Scholar] [CrossRef]
  34. Modi, O.P.; Deshmukh, N.; Mondal, D.P.; Jha, A.K.; Yegneswaran, A.H.; Khair, H.K. Effect of interlamellar spacing on the mechanical properties of 0.65% C steel. Mater. Charact. 2001, 46, 347–352. [Google Scholar] [CrossRef]
  35. Benavides-Treviño, J.R.; Perez-Gonzalez, F.A.; Hernandez, M.A.L.; Garcia, E.; Juarez-Hernandez, A. Influence of the cooling rate on the amount of graphite nodules and interlamellar space in pearlite phase in a ductile iron. Indian J. Eng. Mater. Sci. 2018, 25, 330–334. [Google Scholar]
  36. Dong, M.J.; Prioul, C.; Francois, D. Damage effect on the fracture toughness of nodular cast iron: Part I. damage characterization and plastic flow stress modelling. Metall. Mater. Trans. A 1997, 28, 2245–2254. [Google Scholar] [CrossRef]
  37. Guillemer-Neel, C.; Feaugas, X.; Clavel, M. Mechanical behavior and damage kinetics in nodular cast iron: Part I. Damage mechanisms. Metall. Mater. Trans. A 2000, 31, 3063–3074. [Google Scholar] [CrossRef]
  38. Guillemer-Neel, C.; Feaugas, X.; Clavel, M. Mechanical behavior and damage kinetics in nodular cast iron: Part II. Hardening and damage. Metall. Mater. Trans. A 2000, 31, 3075–3086. [Google Scholar] [CrossRef]
  39. Zhang, Y.B.; Andriollo, T.; Fæster, S.; Liu, W.; Hattel, J.; Barabash, R.I. Three-dimensional local residual stress and orientation gradients near graphite nodules in ductile cast iron. Acta Metall. Mater. 2016, 121, 173–180. [Google Scholar] [CrossRef] [Green Version]
  40. Andriollo, T.; Zhang, Y.; Fæster, S.; Thorborg, J.; Hattel, J. Impact of micro-scale residual stress on in-situ tensile testing of ductile cast iron: Digital volume correlation vs. model with fully resolved microstructure vs. periodic unit cell. J. Mech. Phys. Solids 2019, 125, 714–735. [Google Scholar] [CrossRef]
Figure 1. Scanning electron microscopy (SEM) micrograph with secondary electron imaging of GJS 400 produced with the Y 75 mm mould after etching with Nital 2%: nodular graphite (black) in the ferritic matrix with bright grain boundaries and pearlitic islands (light grey).
Metals 09 01019 g001
Figure 2. (a) Example of fitting Equation (5) with a typical tensile flow curve of GJS 400 from the Y 25 mm mould sample; (b) the same fitting in (a) at a different scale to highlight the contributions from the pearlite.
Metals 09 01019 g002
Figure 3. Examples of modelling with Equations (3)–(5) the tensile flow curve of the GJS 400 from different moulds: (a) and (b) from Y 50 mm; (c) and (d) from Y 75 mm.
Metals 09 01019 g003aMetals 09 01019 g003b
Figure 4. Modelling the tensile flow curves of the GJS 400 reported in Figure 3 using the average microstructure values in Table 2: (a) and (b) Y 50 mm with the average ferrite grains size = 48.6 μm, and average pearlite volume fraction = 4.0%; (c) and (d) Y 75 mm with average ferrite grains size = 47.7 μm, and average pearlite volume fraction = 3.0%.
Metals 09 01019 g004
Figure 5. Engineering stress–strain flow curves (up to ultimate tensile stress Rm) built with the average microstructure parameters for the four different moulds reported in Table 2.
Metals 09 01019 g005
Figure 6. Engineering stress–strain curves (up to an ultimate tensile stress of Rm): (a) Lynchburg and Y 25 mm moulds and (b) ferrite contribution to flow curves only; (c) Lynchburg, Y 50 mm and Y 75 mm moulds; (d) ferrite contribution to flow curves only.
Metals 09 01019 g006
Table 1. Chemical composition of GJS 400 in wt %.
CSiMgMnCuNiCrPSFe
3.632.450.0460.1290.1330.01680.0230.0380.0043Bal.
Table 2. Average parameters of the GJS 400 microstructures produced with four different moulds. The errors associated with the measurements are the standard deviations.
MouldNodule Count (mm−2)Nodule Size (μm)Nodularity (%)Pearlite Volume Fraction (%)Ferrite Grain Size (μm)
Lynchburg 25 mm261 ± 1524.3 ± 0.689.8 ± 3.0-37.3 ± 3.2
Y 25 mm242 ± 1124.9 ± 0.591.2 ± 1.63.8 ± 0.439.2 ± 2.3
Y 50 mm116 ± 1431.5 ± 1.087.1 ± 1.44.0 ± 1.648.6 ± 4.7
Y 75 mm105 ± 934.5 ± 0.583.2 ± 4.63.0 ± 0.547.5 ± 7.2
Table 3. Comparison between the predicted (engineering flow curves reported in Figure 5) and experimental (exp) average tensile properties, ultimate tensile strength Rm, yield stress YS, and elongation at necking en.
MouldRm (MPa)Rmexp (MPa)en (%)enexp (%)YS (MPa)YSexp (MPa)
Lynchburg 25 mm424.4424.316.616.7277.2288.3
Y 25 mm440.5440.715.816.0277.9294.2
Y 50 mm428.4429.815.916.2278.7288.8
Y 75 mm424.5426.516.016.0277.287.7

