3.1. Immersion Depth
Immersion depth is defined as the distance between the media surface layer and the point of interest of the component to be treated. In a media-filled trough, the force exerted on the submerged components will increase with increasing depth, due to the increase in gravitational force of the mass of the media [
4]. However, during the vibropeening process, the media moves in a circular pattern due to the unbalanced mass system, and hence it is observed that the force interactions will be different at every media level in the trough.
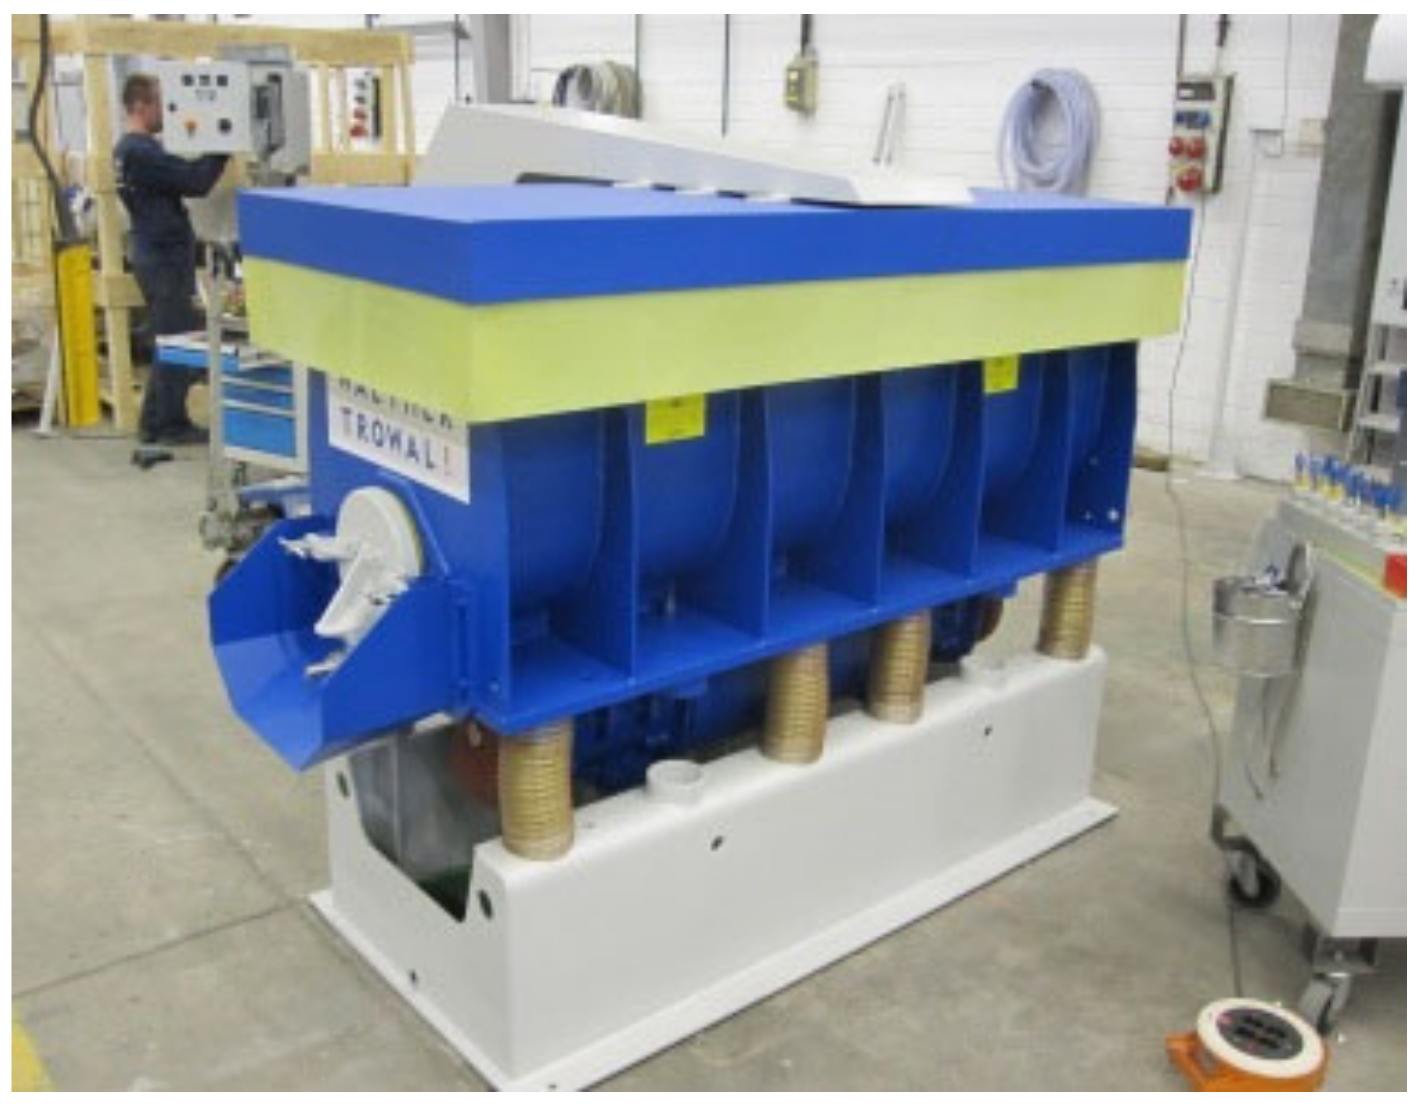
It is essential to identify the locations inside the trough that have maximum peening forces, so that maximum peening intensity can be obtained on any component that is to be treated. In this study, experiments were conducted on Almen strips using a vibratory trough TFM58/32VP, with the parameters as shown in
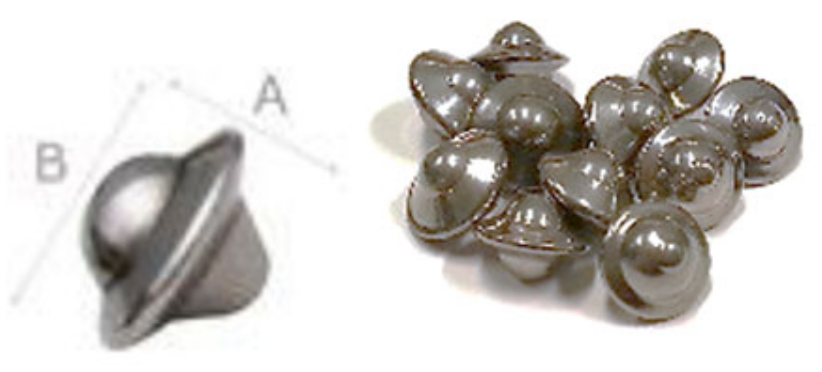
Table 2. The media used in this study is stainless steel satellite 5/7mm media, as shown in
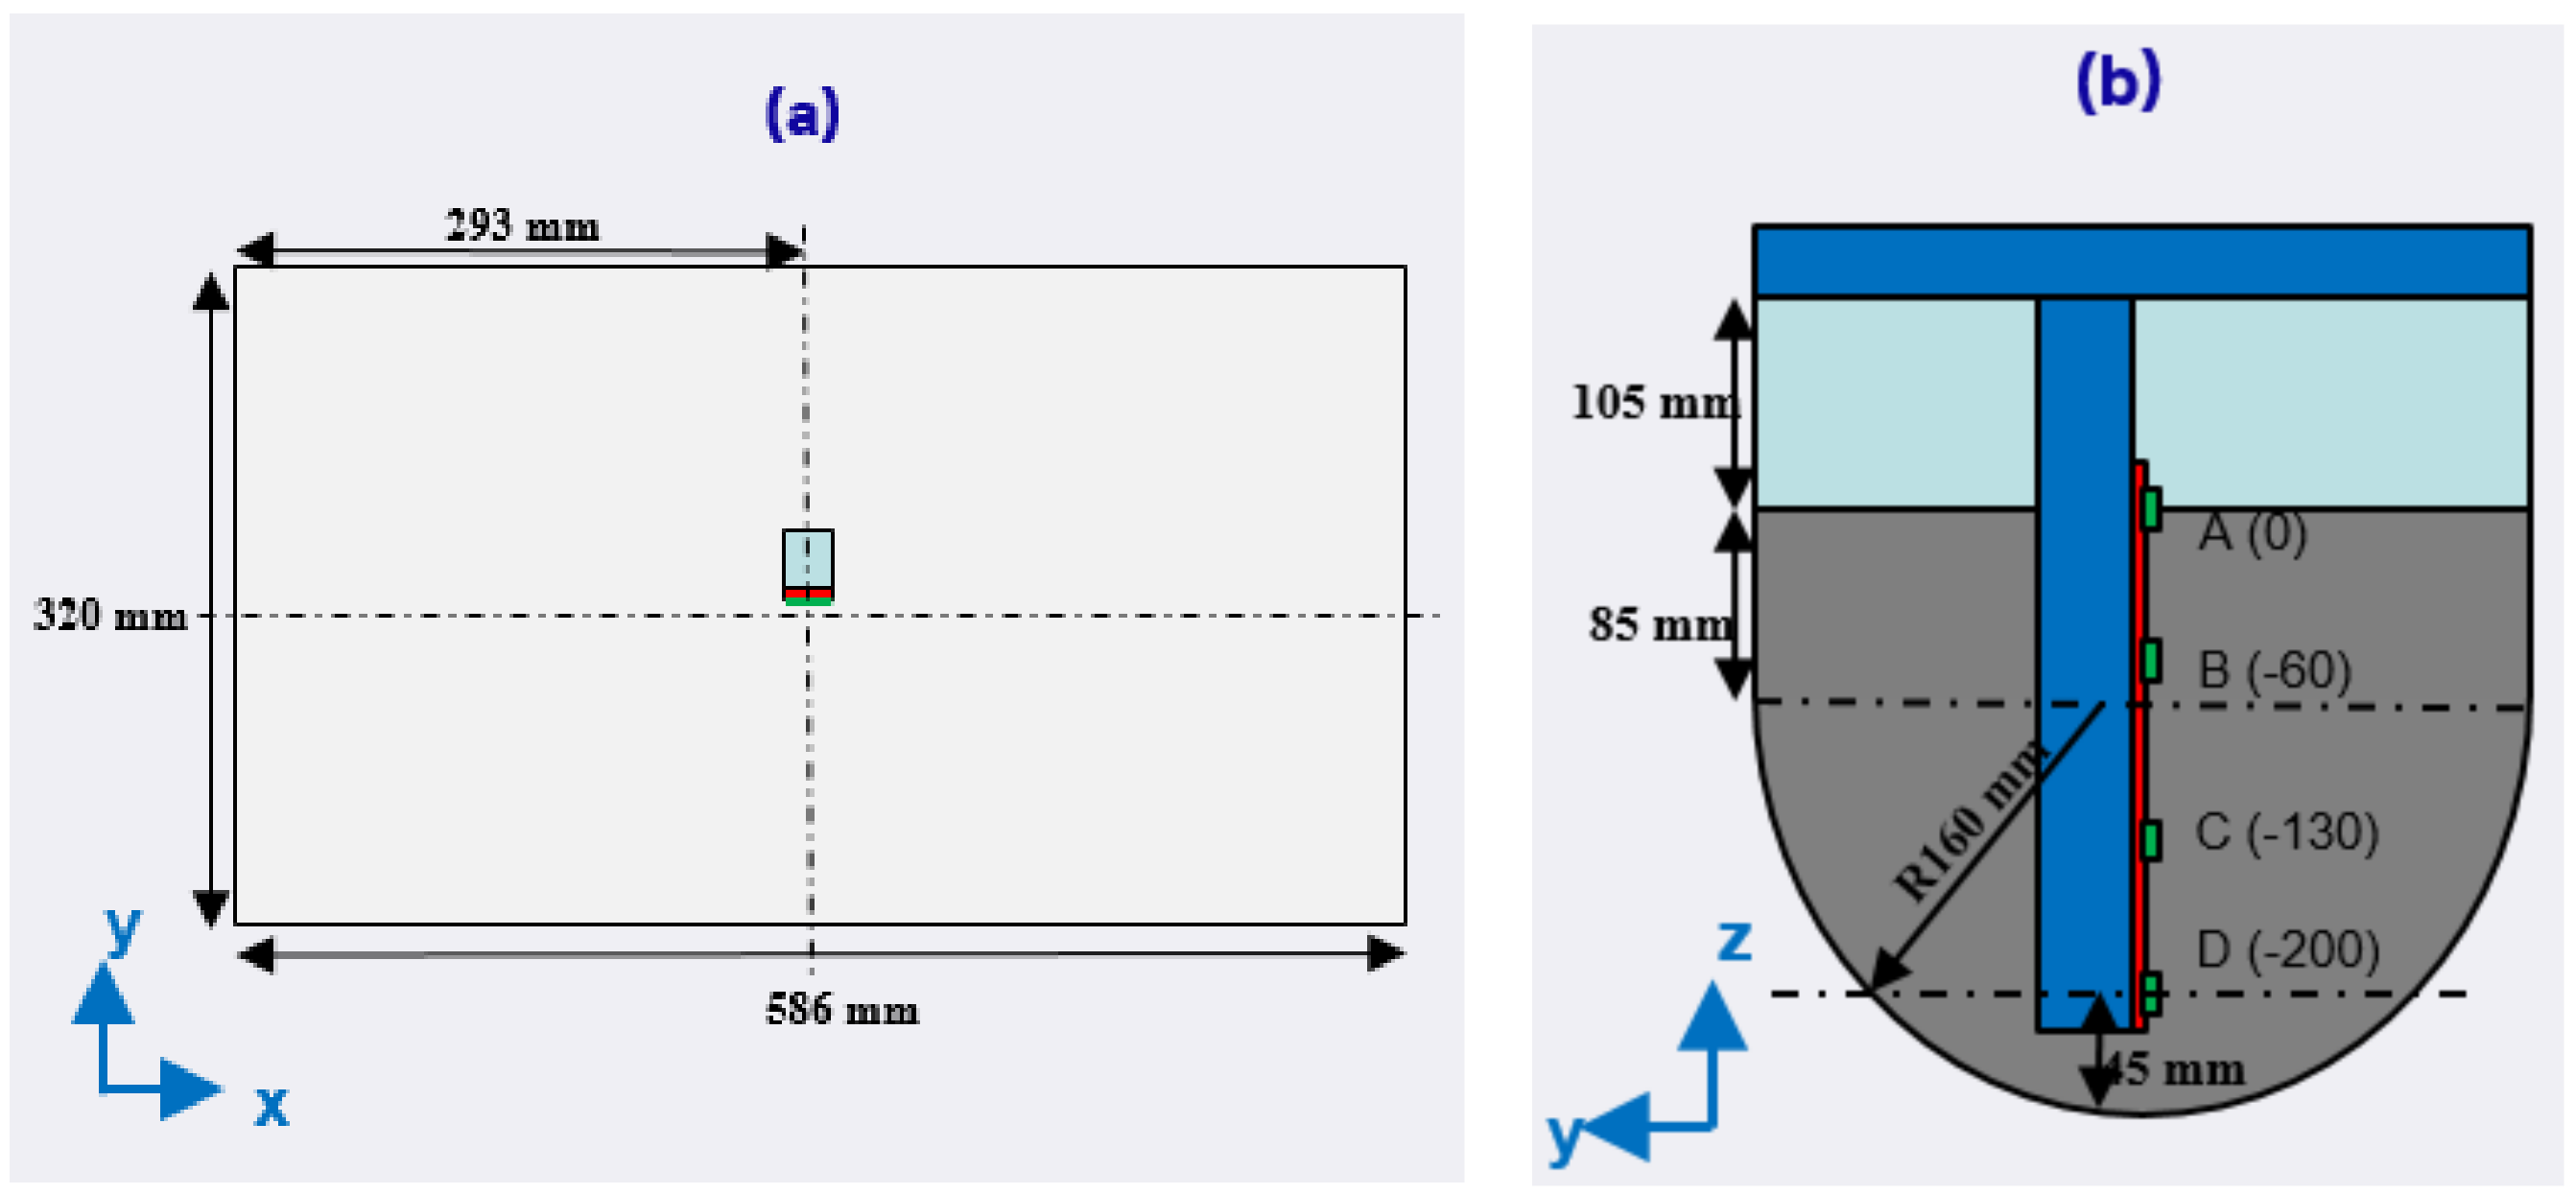
Figure 2 below. The setup configuration is illustrated in
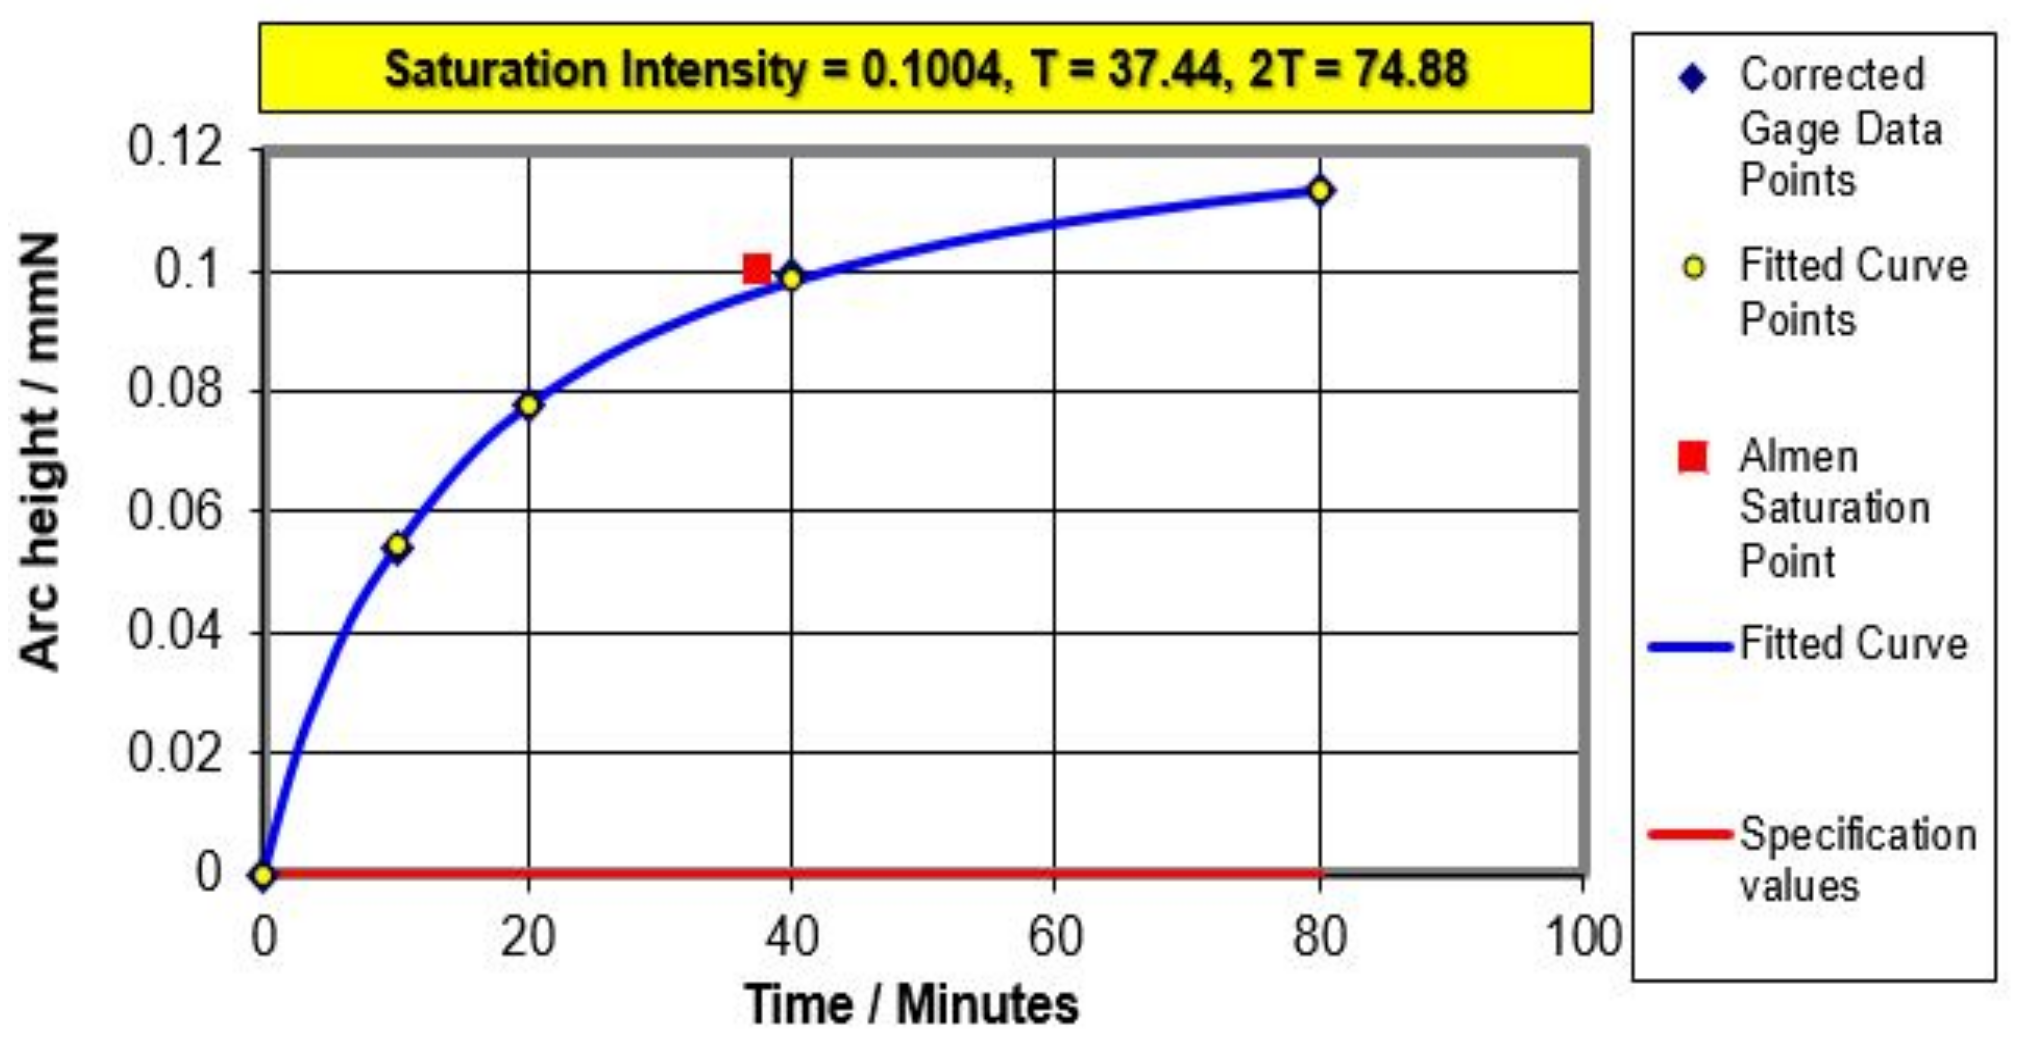
Figure 3, with immersion depths labelled. Almen deflection data were collected at 10, 20, 40, and 80 min to generate a saturation curve at each setting, using a saturation curve solver from Electronics Inc. An example is shown in
Figure 4. The saturation point is defined as the arc height at time
T, where the difference of arc height between
T and 2
T is less than or equal to 10%. The Almen deflection at this time
T is known as the Almen intensity. In conventional peening, the Almen intensity at saturation point often has a correlation with residual stress, hence it is an important parameter to be observed in the surface treatment process [
4].
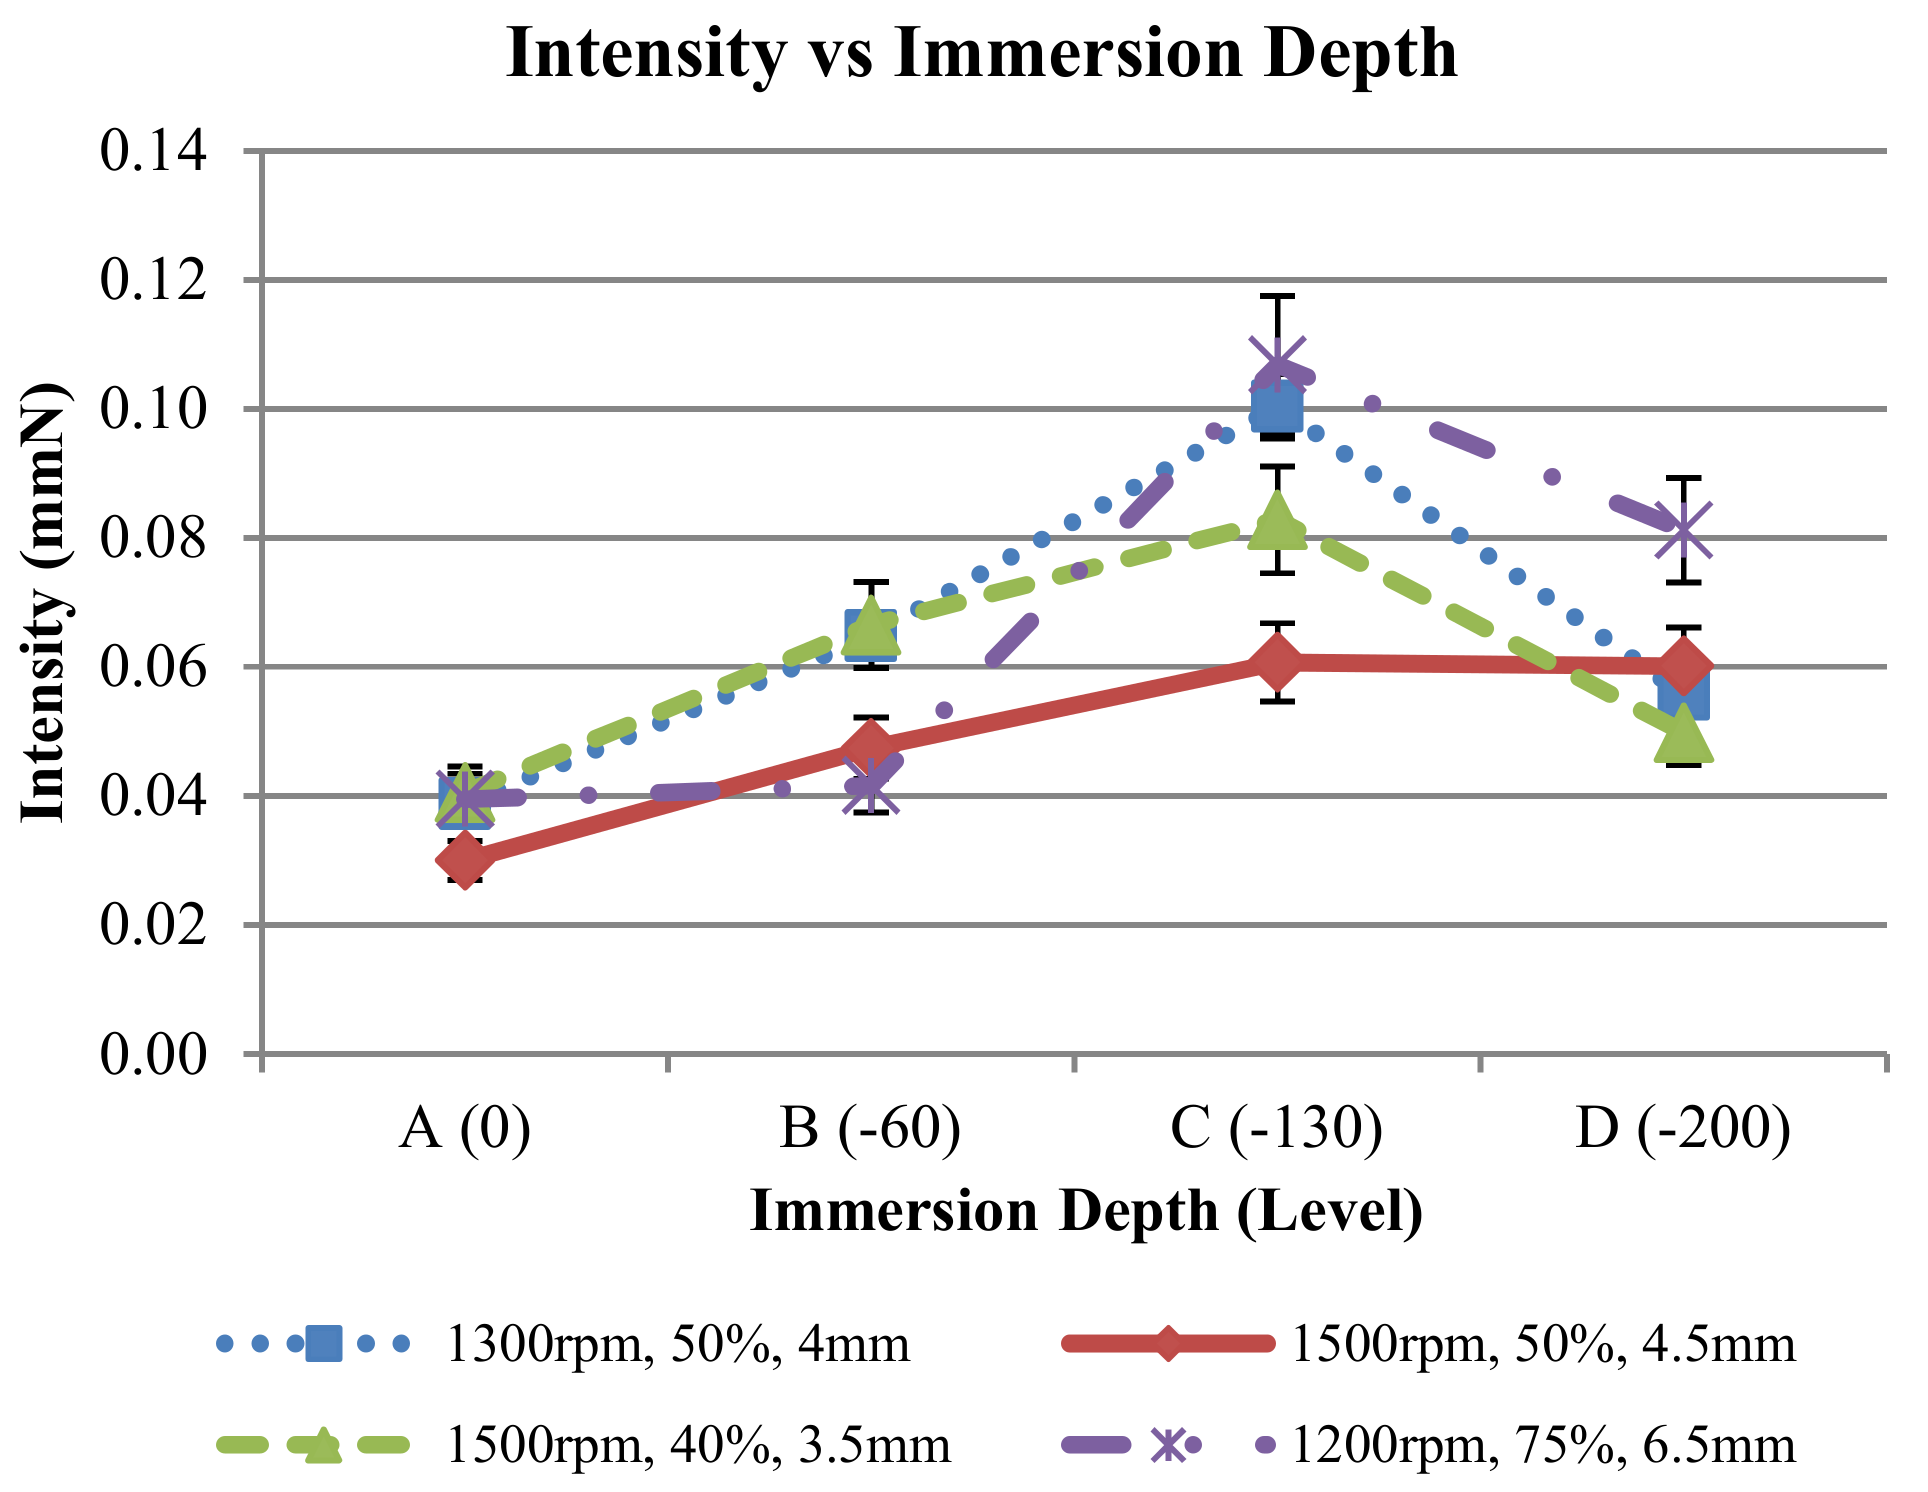
From the results in
Figure 5, the Almen intensity increased when the immersion depth increased from media level 0 mm (point A) up to −130 mm, denoted as point C in
Figure 3b; it then decreased when the immersion depth increased to −200 mm (point D). Maximum peening intensity was obtained at the immersion depth of −130mm, which is near the three-quarter of the depth of the trough. This shows that the peening force is concentrated near the lower center of the media rotation, and the burnishing effect is most likely dominant at the bottom of the trough [
4]. The trend of the change of Almen intensity is similar at all different combinations of frequency and flyweight settings tested as part of this study.
This observation of peening intensity being the best at the middle portion of the trough can be attributed to the interaction of gravitational and vibrational force generated by the media being the most optimal at this position. In an empty trough setup, the main driving force in the trough is the vibrational force generated by the motor and rotating weights beneath the trough, and the trough moving in a circular motion like a rigid body.
A numerical study by Gour et al. proves that the force or acceleration at the top of the trough is dominated in the
z-direction, which is purely oscillating translational movement on the
z-axis. Towards the bottom of the trough, the acceleration is dominated in both the
y- and
z-directions, which consists of the oscillating translational movement on the
y- and
z-axes [
9]. Hence, when the trough is filled with media, the resultant forces in the
y- and
z-directions will drive the media to rotate in circular motion along the
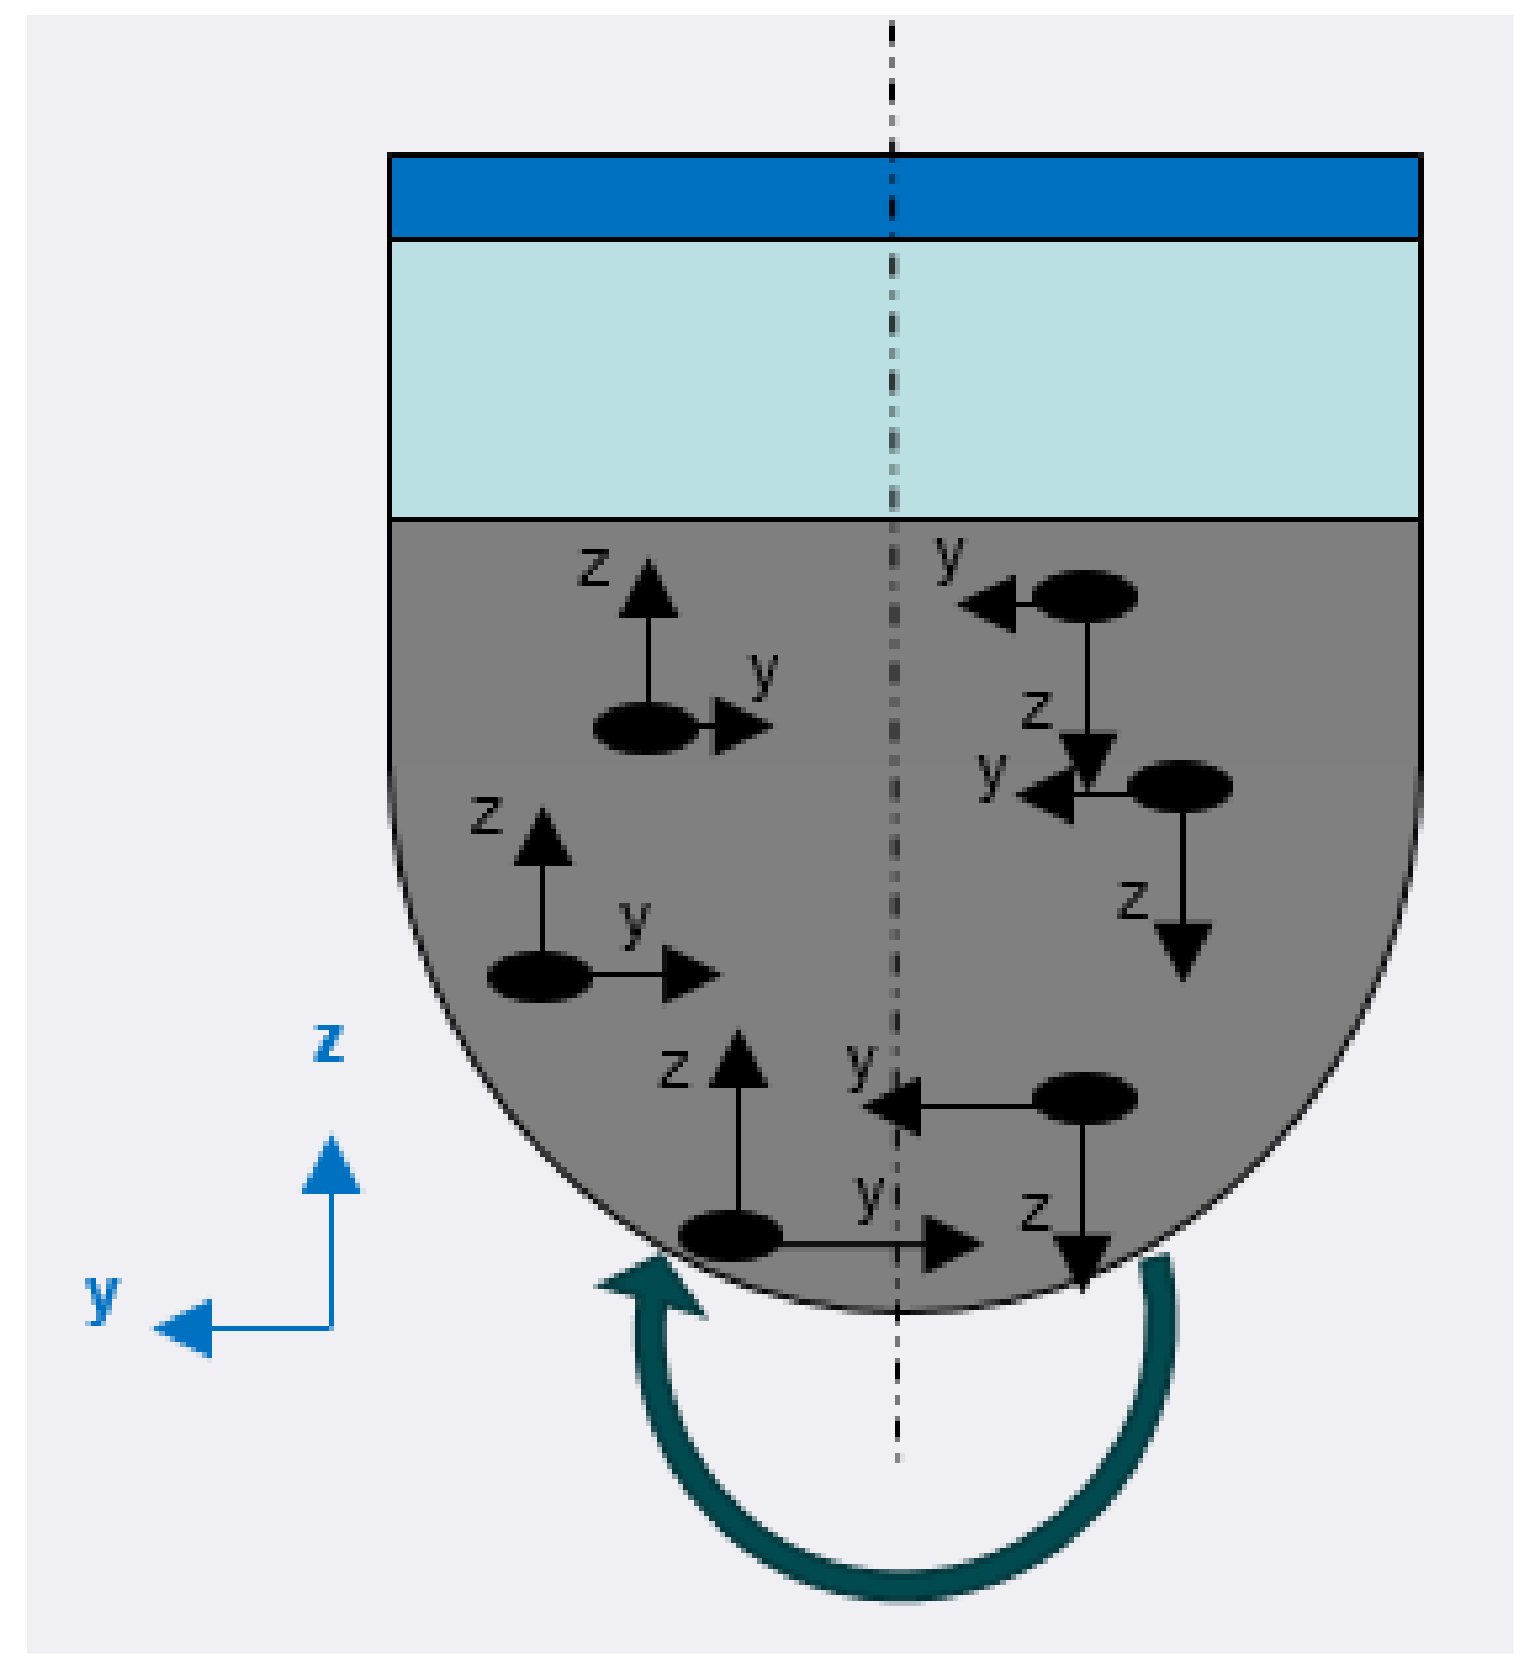
x-axis of the trough. The motion of media is illustrated in
Figure 6 when the media is experiencing vibrational force by the trough only. For easy reference, the trough is divided into left and right portions, with forces in two opposite directions in each axis. The magnitudes of forces in both directions is graphically represented by the length of the arrow. It is worth noting that the magnitude of forces in the
y-direction change with the depth, whereas the magnitude is the same in the
z-direction.
Gravitational force exerted by the mass of media is another driving force in a media-filled trough. Hydrostatic force can be expressed by Equation (1) below, where h is the depth of media or immersion depth, ρ is the density, g is the gravitational acceleration, and A is the contact area between the media and the component surface. Even though hydrostatic force is experienced in liquids, a similar effect will be experienced in the trough at varying immersion depths.
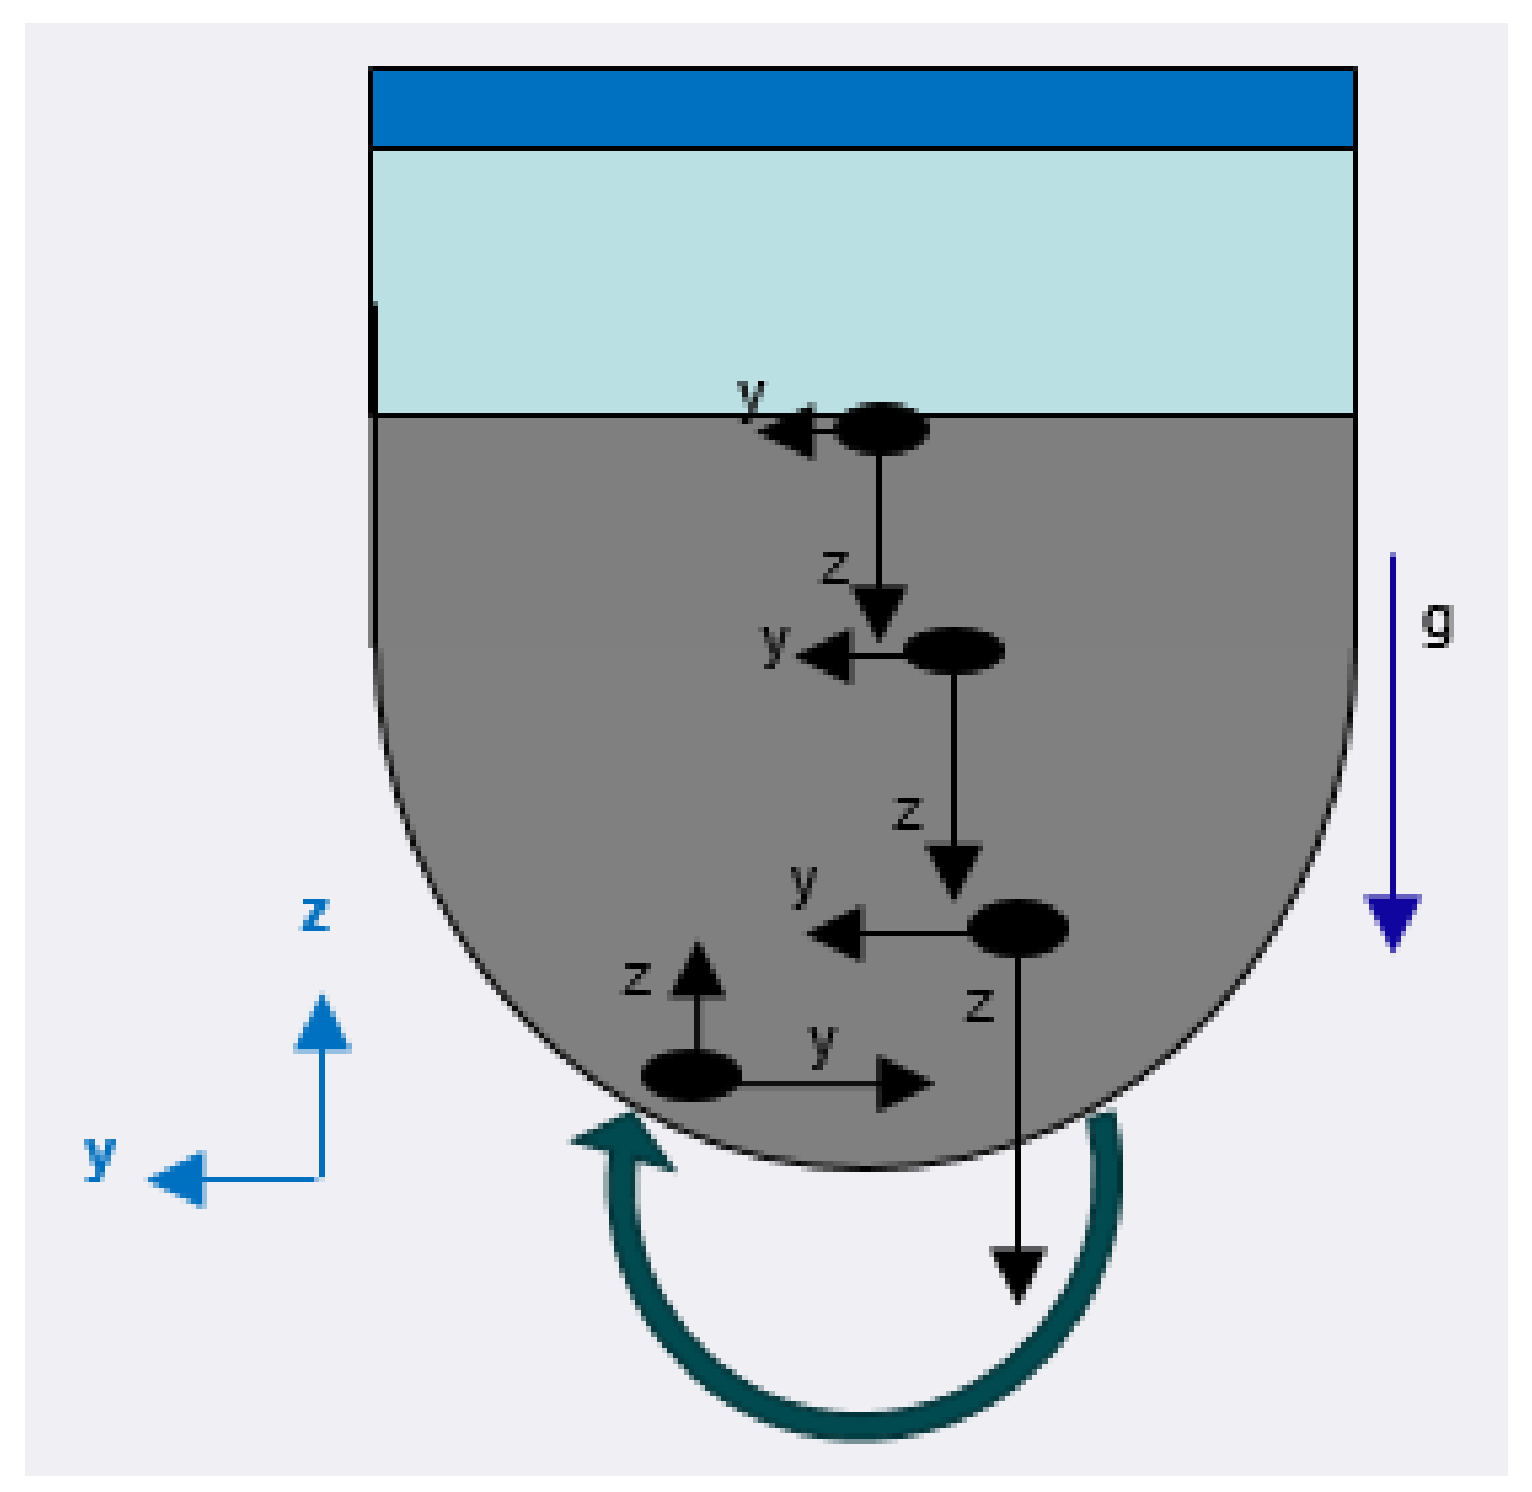
As the immersion depth increases, the force exerted by the media increases. Hence, there is always a downward force component in the
z-direction throughout the media. With the combination of the vibrational forces, the resultant force increases with depth, hence the peening intensity increases as the immersion depth increases. However, at the immersion depth of −200 mm, which is the depth closest to the bottom wall of the trough, the media at the bottom-most layer of the trough is experiencing the highest impulse from the vibration of the motor, just beneath the trough wall in the upwards direction; hence, the resultant force at the bottom layer decreases and produces a lower peening intensity. The changes in resultant force along the depths are illustrated in
Figure 7. There could be a threshold point, where the resultant of all interacted forces is the maximum; however, this exact point could be varied by various parameters, such as media mass, media type, component dimensions, etc. Therefore, the standard immersion depth for most of the test components in the vibropeening trough should be near the lower mid-section region, in order to obtain the maximum peening effect.
3.2. Process Time
The changes in Almen deflection always follow an exponential increment, which increases in value and subsequently reaches a plateau at the saturation point, as shown in
Figure 4. Hence, the change in residual stress with treatment time is assumed to be the same. There is always a question of how much the component needs to be peened in order to achieve the desired residual stress profile. However, this depends on the properties of each material, such as elastic modulus, hardness, and ductility, to name a few. Therefore, it is important to determine the saturation point of the treating material to avoid over-peening, when the residual stress profile will not have any improvement further or will even deteriorate [
5].
The process time or treatment time for the vibropeening process is normally selected based on the saturation time from Almen intensity test. The correspondence relationship between Almen intensity and residual stress has been proven in the shot peening process [
8,
11]. However, for the vibropeening process this is may not be the case, due to different mechanisms of the two processes. Study by Canals et al. proved that the increase of peening time to twice the Almen strips’ saturation time showed increase in compressive residual stress profiles of materials Ti-6Al-4V and E-16NiCrMo13, but no further increment with thrice the saturation time [
7]. Hence, in this study, the saturation time of the vibropeening process with a fixed set of experimental parameters is determined using IN718 flat test coupons. This can provide the suitable range of process time and help to identify the maximum treatment capacity of the vibropeening process. An Almen intensity test has been conducted prior to the flat coupon’s trials, and the time for studies is chosen based on the saturation time from the intensity tests.
The study was conducted using IN718 flat test coupons in a TFM58/32VP trough by Walther Trowal, Germany. The experimental setup and coupon location are illustrated in
Figure 3. The experimental parameters for this study are shown in
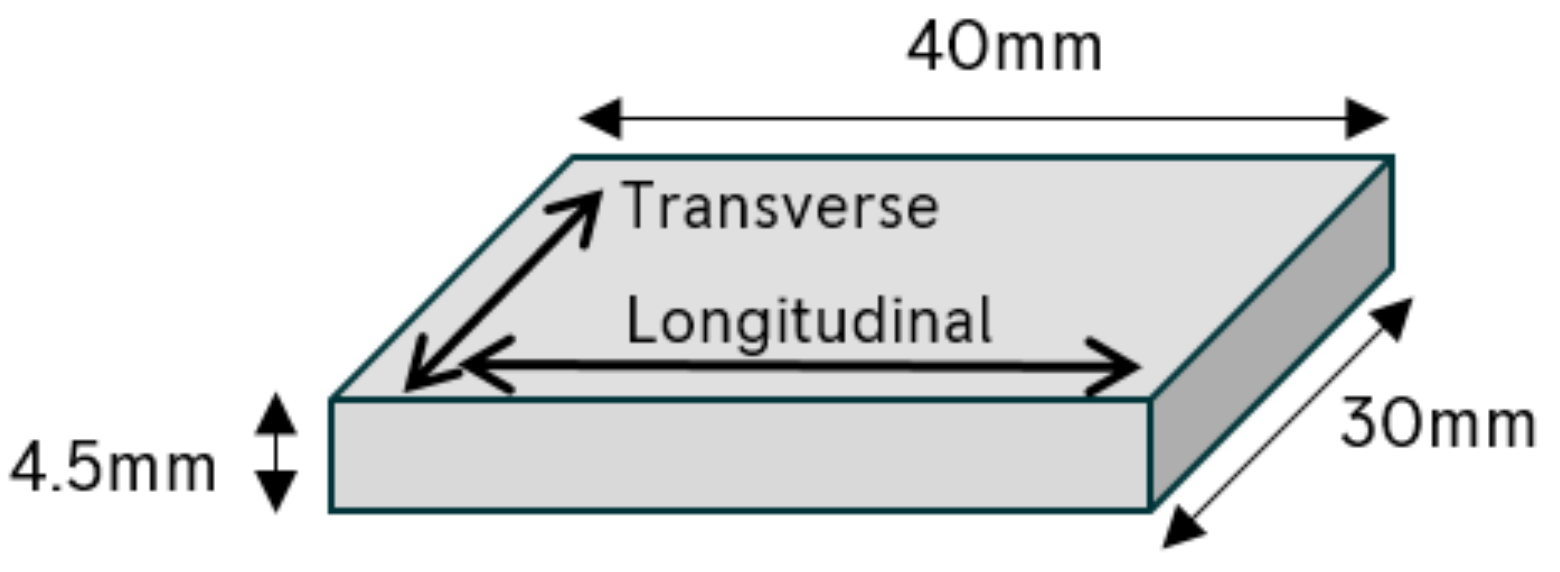
Table 3. The flat coupons are wire-cut from the heat-treated IN718 disc bore. The coupon dimension is 30 mm × 40 mm × 4.5 mm, as shown in
Figure 8.
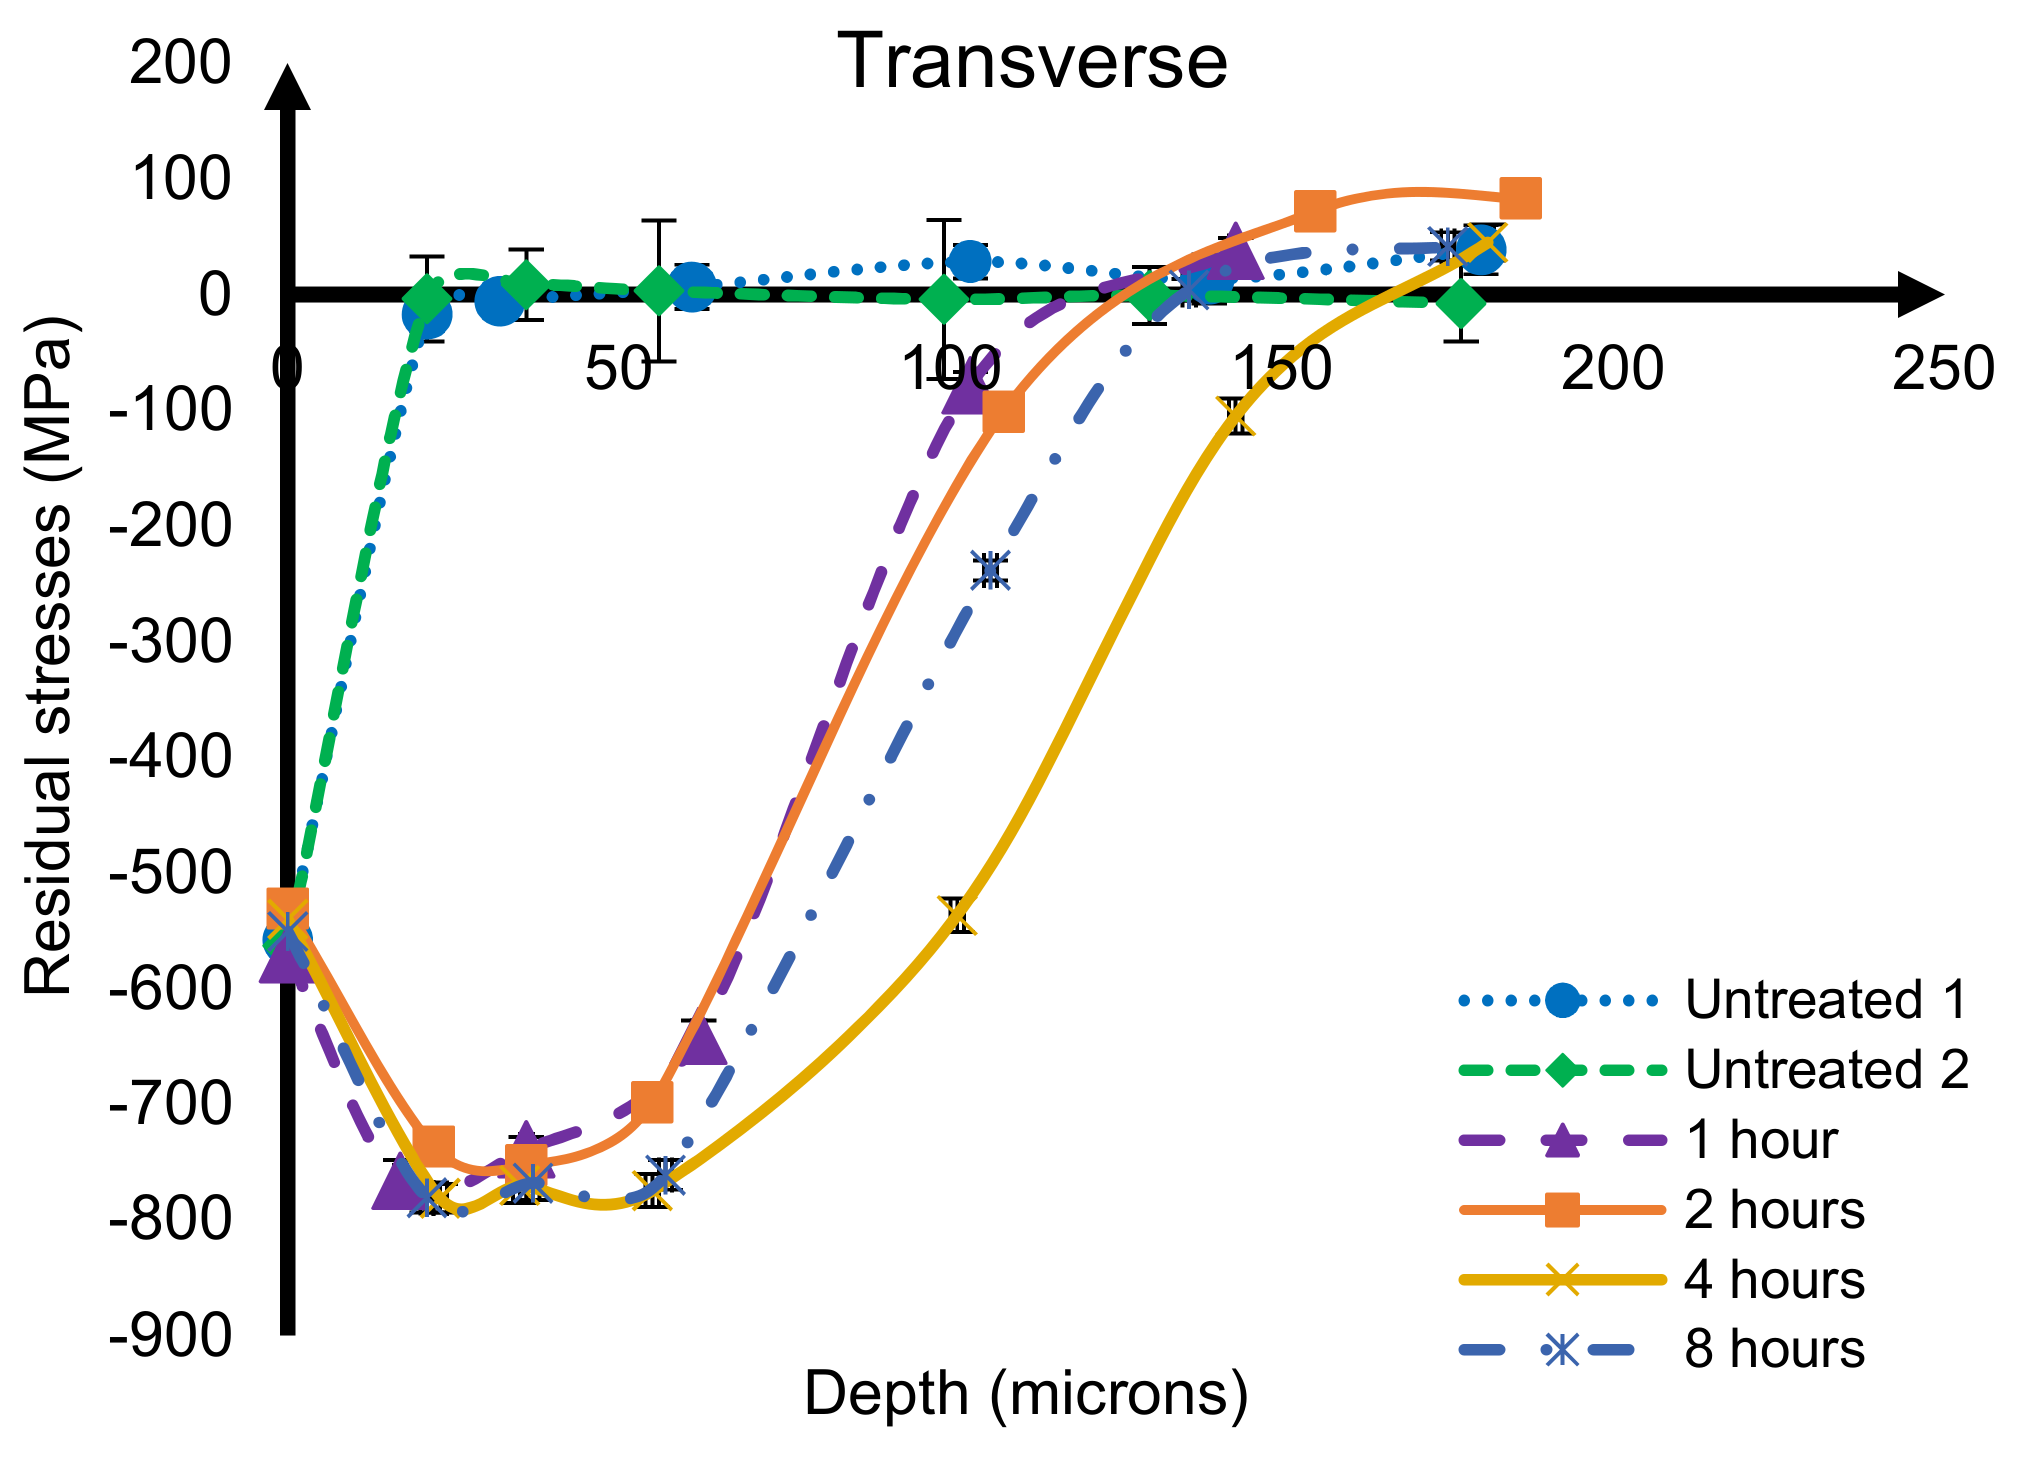
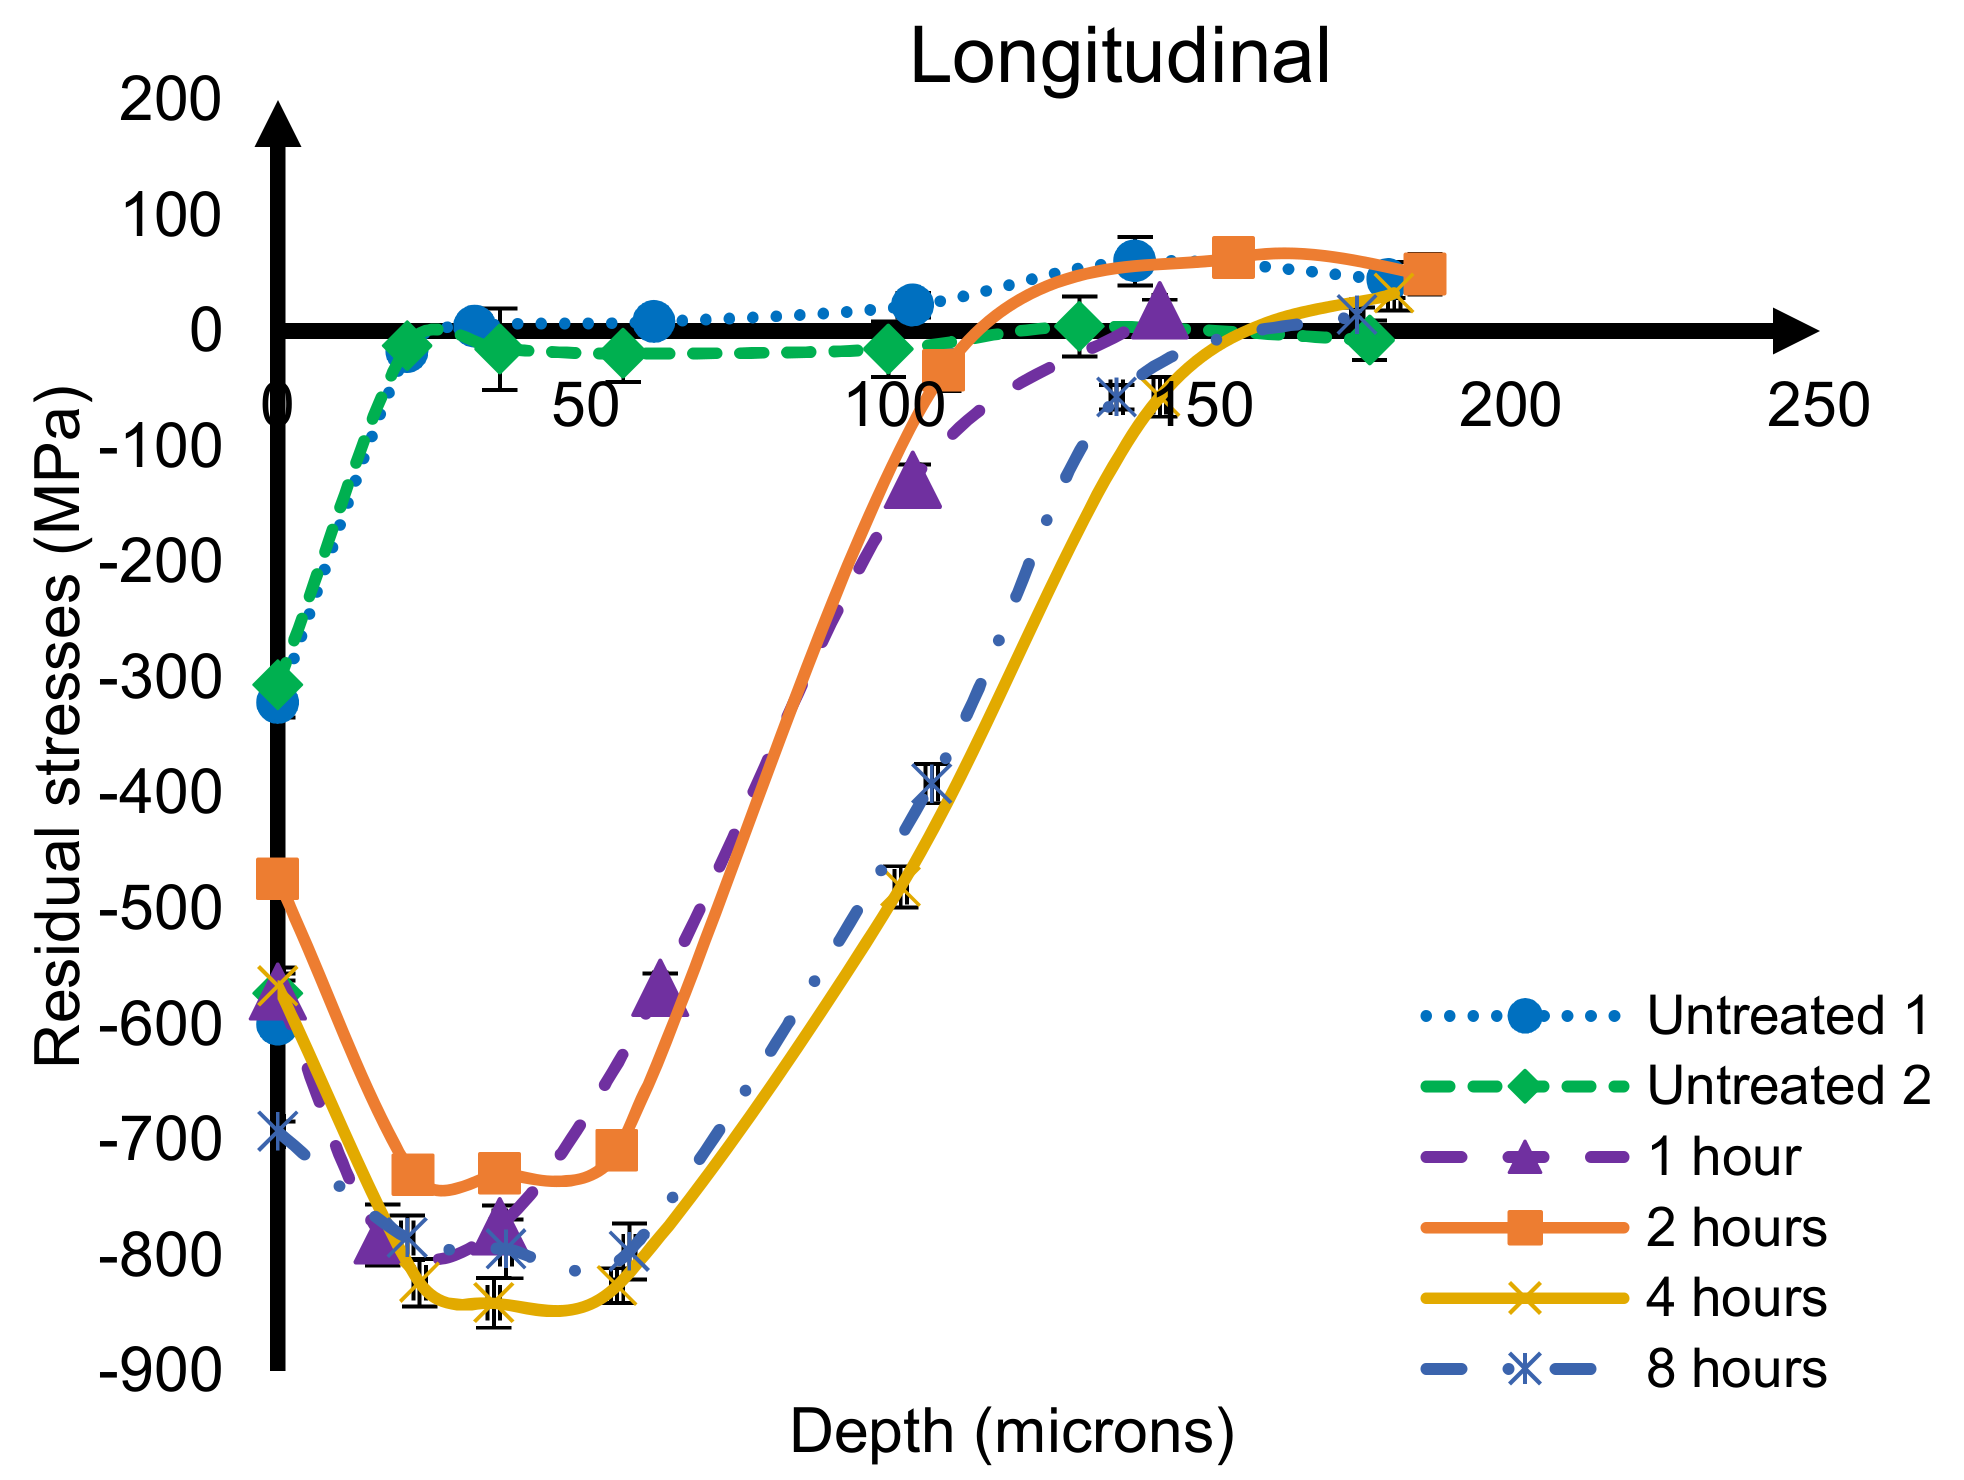
From the observation from part A and the residual stress results, the optimal treatment intensity from vibropeening is at an immersion depth of −130 mm. Hence in this section, the focus of discussion will be on this media level. The residual stress profiles of IN718 test coupons at an immersion depth of −130 mm are shown in
Figure 9 and
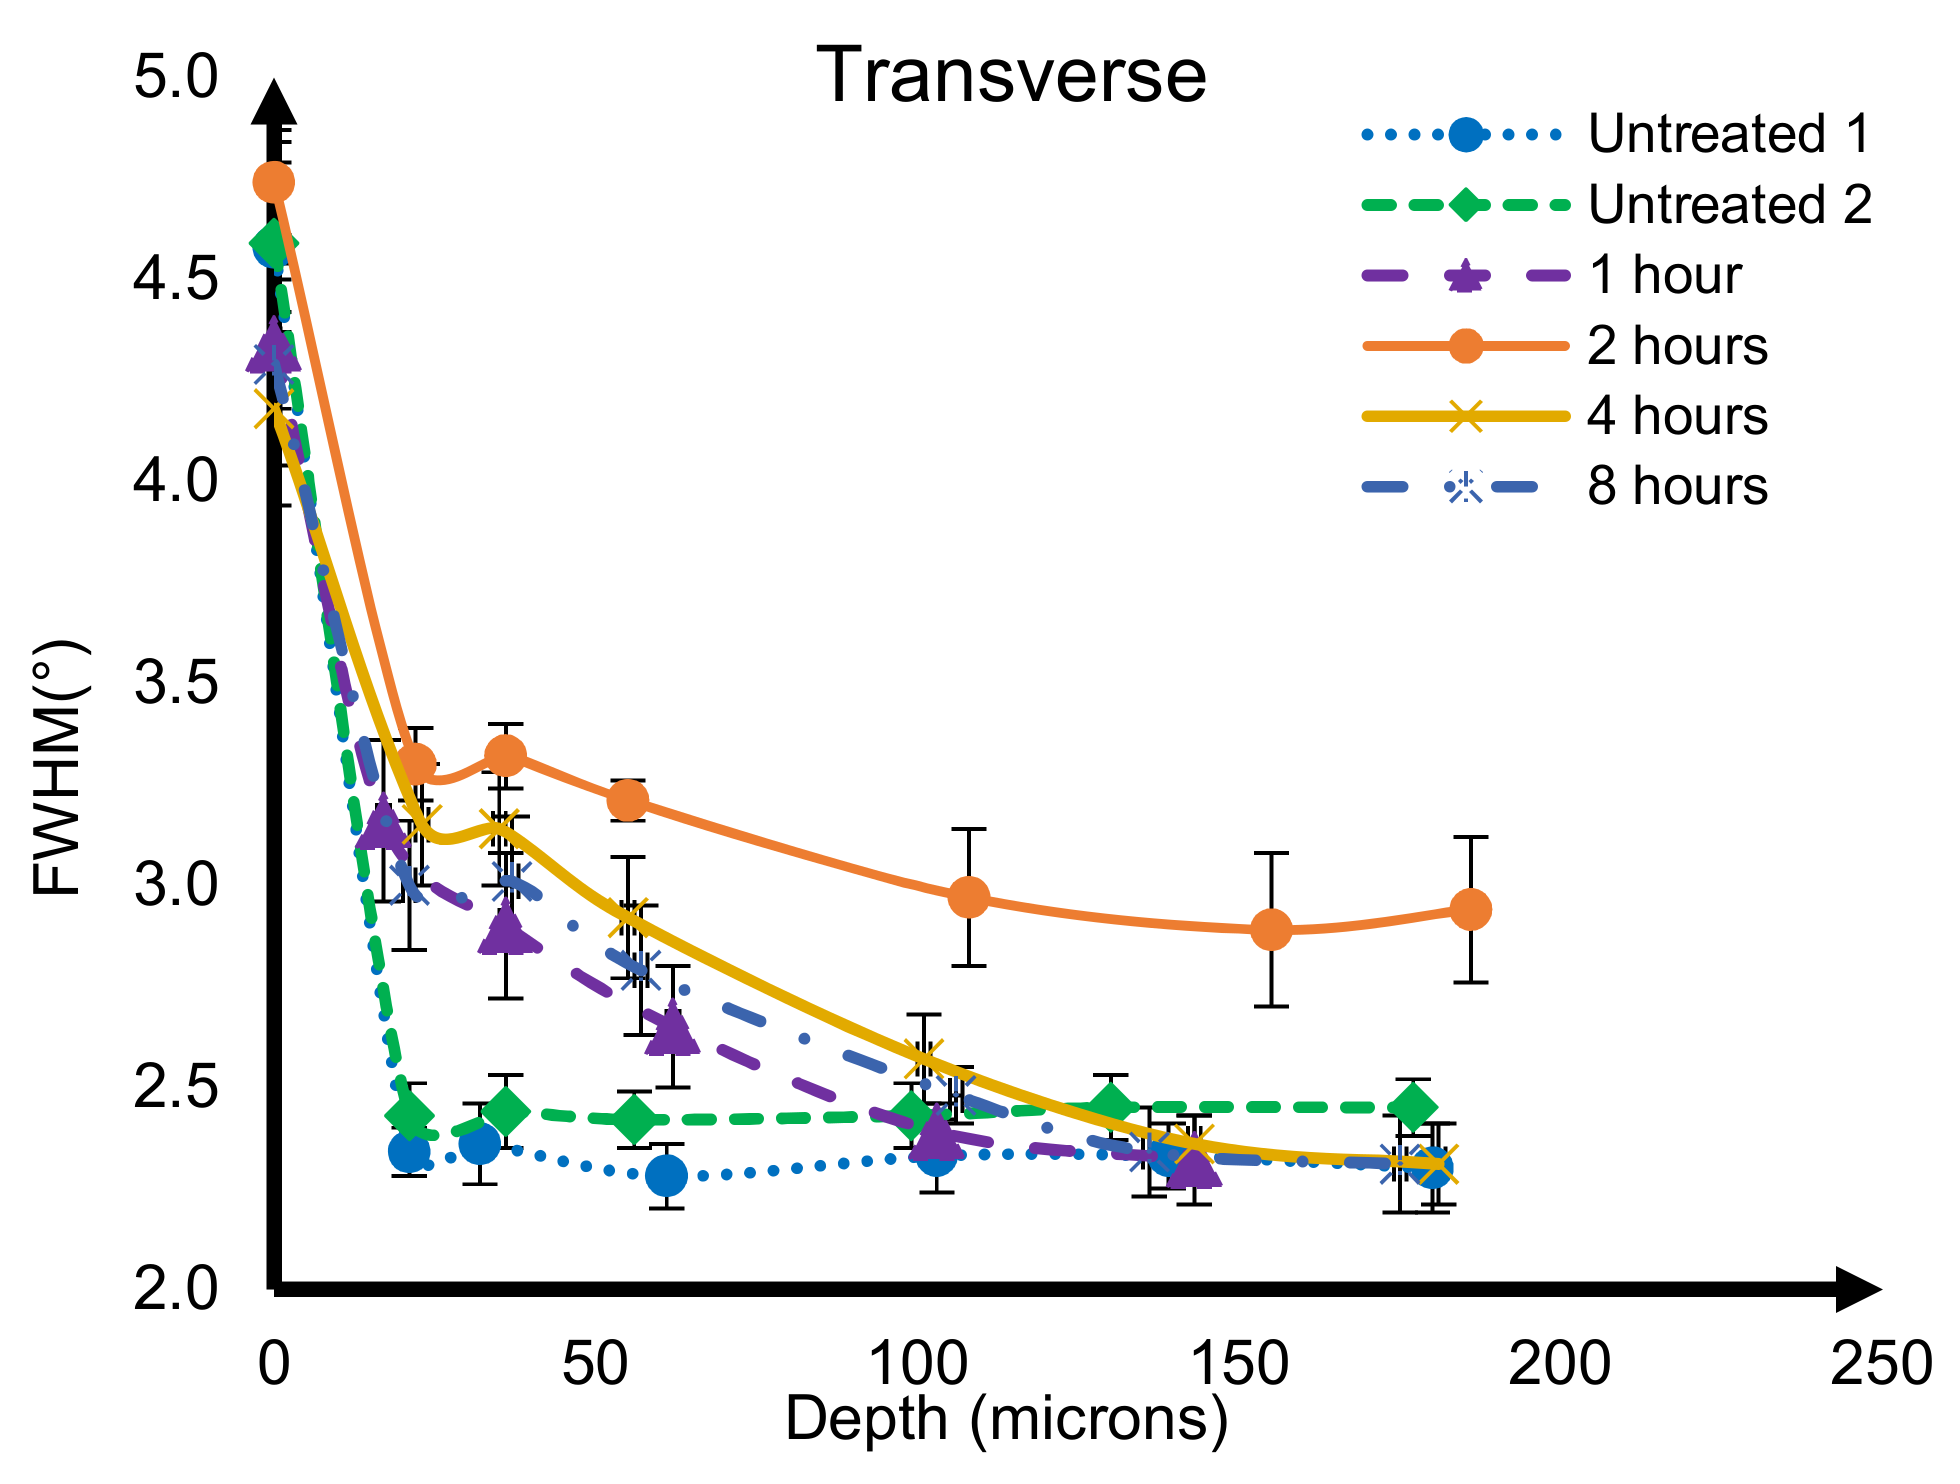
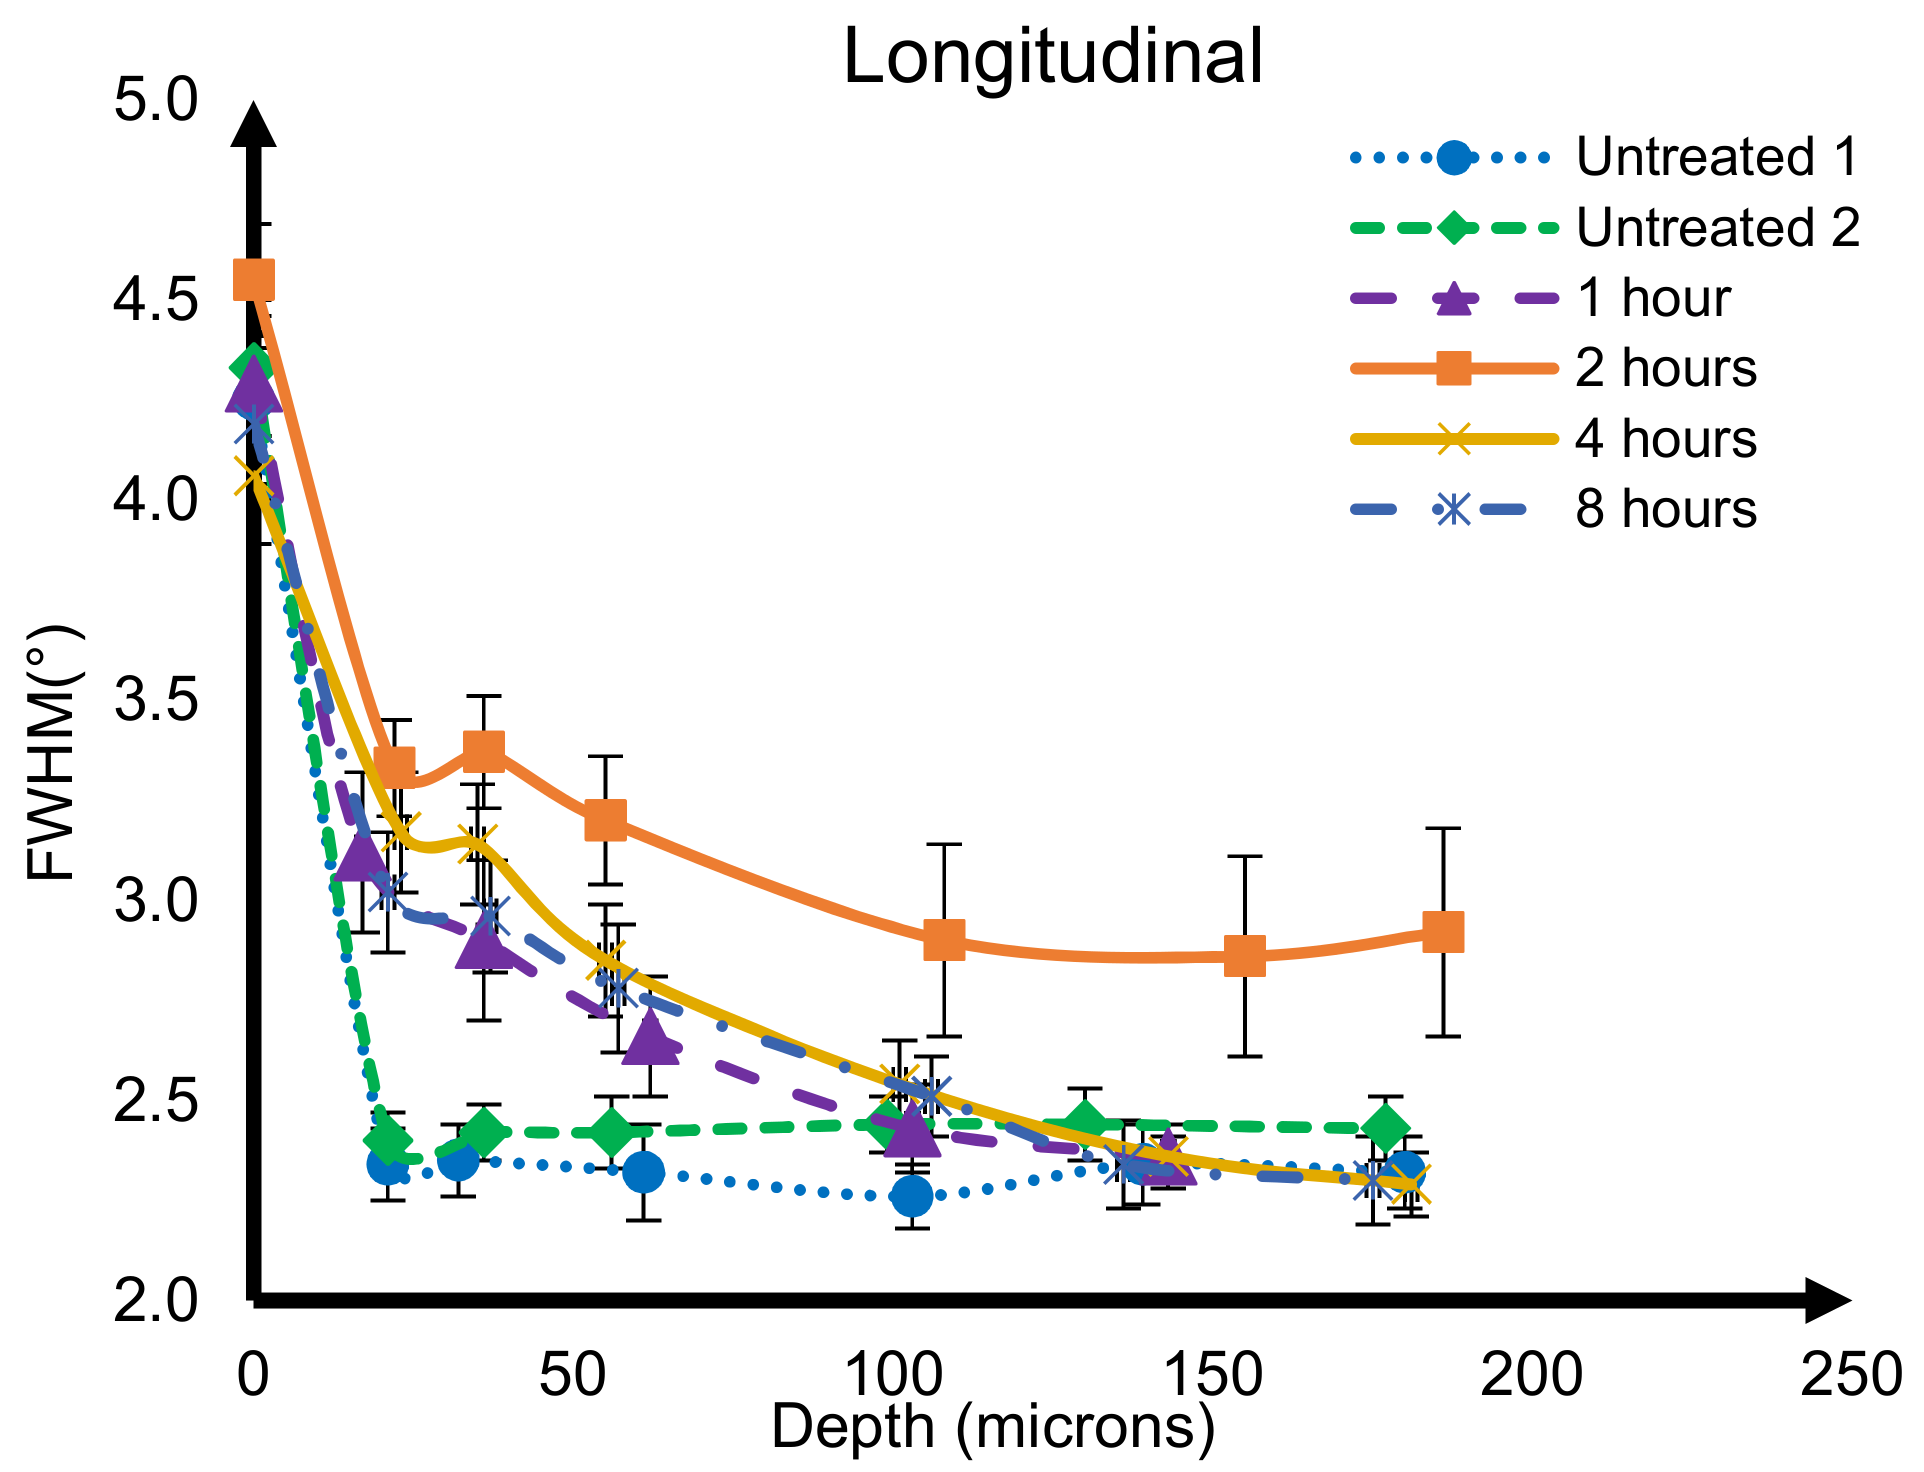
Figure 10. The corresponding full-width at half-maximum (FWHM) distributions also plotted in
Figure 11 and
Figure 12.
From
Figure 9 and
Figure 10, high compressive surface residual stress can be observed on the untreated coupons, which is due to the manufacturing process. However, the high stress state only occurs at near-surface depths. A stress-free state can be observed at depths beyond 20 microns. The flat coupon after a treatment time of 4 h showed higher surface and maximum compressive residual stress, and a greater depth of influence compared to that of 2 h in both the transverse and longitudinal directions. When the treatment time increased from 1 h to 2 h, the residual stress profile becomes better in the transverse direction. This result is aligned with the hypothesis, which is that the residual stress state is better with longer treatment time. In the transverse direction, the surface and maximum compressive residual stress after 8 h treatment time is similar to that of 4 h, but the depth of influence after 8 h is shallower. This indicates that the impact of vibropeening with 8 h treatment time have reduced in intensity or energy, or that the imparted stress has possibly been relaxed after 8 h. On the other hand, in the longitudinal direction, the residual stress profile after 4 h treatment time is better than 8 h, with higher maximum compressive residual stress and a greater depth of influence. This proves that there could be stress relaxation with longer treatment time, which could negate the positive impact of vibropeening on the components [
5]. This is essential to provide an understanding of the optimal process time for vibropeening.
In addition, full-width at half-maximum (FWHM) is obtained from the XRD measurements, and represents the peak broadening under plastic deformation; it could be analogous to plastic strain. It is known that the values of FWHM are closely related to those of percentage cold work introduced by surface enhancement process into a workpiece [
4,
8,
12]. From
Figure 11 and
Figure 12, FWHM distributions show that the plastic deformation on IN718 coupons after 2 h treatment time is higher compared to that after 1, 4, and 8 h in both the transverse and longitudinal directions. This showed that higher plastic strain and dense dislocation network is generated after 2 h, and the recovery of plastic strain and dislocation annihilation occurs after 4 h and 8 h of treatment time. The lower FWHM of the flat coupon after 1 h treatment time showed that the plastic deformation is not saturated yet, and it increased when treatment time increased to 2 h. The plastic deformation at depths beyond 120 microns after 4 and 8 h has been annihilated to be the same as that of the untreated condition. Similar FWHM distributions can be observed in the study by Kumar et al. after thermal relaxation on Udimet 720Li [
12]. This implies that after 2 h of the process, the cold work has been reduced due to stress relaxation. Hence, the optimal process time of vibropeening treatment on IN718 material should be between 2 to 4 h.
With these stress profiles, it is very likely that the fatigue life of treated components can be increased by peening at optimal time. High cycle fatigue (HCF) is linked to the compressive residual stress profiles generated on the material [
1]. Studies by Feldmann et al. demonstrate that high cycle fatigue life can be improved by 35% by the vibropeening process, whereas the shot peening process increased by 61% [
4]. It is unclear about the treatment time in that study, but with the current findings there is a potential that HCF of components can be further optimized at the optimal process time to be similar or better than that of shot peening.


