Article

Microstructure and Mechanical Properties of Nb and V Microalloyed TRIP-Assisted Steels

1
Product Development, SSAB Europe Oy, Harvialantie 420, 13300 Hämeenlinna, Finland
2
Materials Science and Environmental Engineering, Tampere University, Korkeakoulunkatu 6, Tampere University, 33720 Tampere, Finland
3
Tampere Microscopy Center, Tampere University, Korkeakoulunkatu 3, Tampere University, 33014 Tampere, Finland
*
Author to whom correspondence should be addressed.
Metals 2019, 9(8), 887; https://doi.org/10.3390/met9080887
Submission received: 30 June 2019 / Revised: 5 August 2019 / Accepted: 9 August 2019 / Published: 14 August 2019
(This article belongs to the Special Issue TRIP Steels)

Abstract

:
The intercritical annealing and isothermal bainitic processing response was studied for three Nb and V microalloyed Transformation-Induced Plasticity (TRIP)-assisted 980 MPa grade steels. Their mechanical and microstructural properties were compared to industrially produced TRIP 800 steel. Depending on the isothermal holding temperature and microalloying, the experimental steels reached properties comparable to the reference steel. The retained austenite content did not show direct correlation to elongation properties. Niobium was found to be more effective microalloying element than vanadium in increasing the elongation properties, which were investigated by measuring true fracture strain from tensile test specimens.

1. Introduction

Aluminium and silicon alloyed, low-carbon Transformation-Induced Plasticity (TRIP) steels have interested researchers for many decades [1,2,3,4,5,6]. These steels denote two particular characteristics. First, the manufacturing steps lead to final microstructures containing untransformed retained austenite phase in ferritic or ferritic-bainitic steel matrix with varying amounts of martensite [7]. Secondly, during the straining and eventual plastic deformation of the steel, the retained austenite induces the TRIP effect: transformation of austenite into martensite which significantly increases both strength and ductility of steel due to the strain hardening [8].
The early TRIP concepts in the 1960s and 1970s were high-Ni austenitic stainless steels grades with a fully austenitic microstructure in room temperature prior deformation [9,10]. A couple of decades later, the groundwork for low-carbon TRIP steels was made by using the hot-dip galvanised dual-phase steels of that time [11,12,13]. Then, the terms TRIP-assisted and TRIP-aided, which differentiate the dual phase (DP) or multiphase steels (CP) from other TRIP grades, were adapted. Current TRIP-assisted steels typically contain 5–15% retained austenite and other phases and microstructural constituents in varying amounts [14].
The TRIP effect allows high elongations which means that the combination of the ultimate tensile strength (UTS) and total elongation to fracture (TEL) may exceed 25,000 MPa% (UTS × TEL). Especially, in the steels which have an ultimate tensile strength above 980 MPa. Thus, these novel high-strength and increased elongation grades are potential candidates for the next generation Advanced High Strength Steels (AHSS) to be utilized, for example, in automotive crash protection structures of lighter, more energy efficient vehicles [15]. The automotive industry has been one of the main driving forces in the use of AHSS in the last decades and is forecasted to increase its use of these steels over the next decade [16].
The conventional heat treatment of cold-rolled TRIP-assisted steel, which are typically hot-dip galvanised for additional corrosion protection, consists of two steps: intercritical annealing (IA) between Ac1 and Ac3 temperatures at ferrite–austenite dual-phase region, and rapid quenching into isothermal holding temperature at bainitic transformation range (IBT) [17]. This approach leads to multiphase microstructure consisting of martensite and retained austenite within ferritic steel matrix. The carbon content of austenite during annealing is important, yet not itself sufficient to stabilize retained austenite to room temperature, which is why the carbon enrichment during isothermal holding is typically used to promote the formation of carbon enriched austenite [18,19].
In order to stabilize retained austenite into the final microstructure of TRIP-assisted steel at room temperature, a sufficient alloying must be used to inhibit the carbide precipitation, mainly cementite, during the isothermal bainitic transformation. The main alloying elements counteracting cementite precipitation are Si, Al, and P. The alloying addition of Si + Al between 0.5–2.0 wt. % has been the topic of several researches studying the suitable combination of IA and IBT temperatures [1,2,3,4,5,7,11,12,13]. Si is a formidable oxidizing element causing a strong oxide layer on the surface of the hot-rolled steel, which is difficult to remove in pickling and reduces adhesion during the subsequent galvanising process [18,20]. In order to surmount the galvanising problems caused by Si, the studies have steered towards replacing it with Al, because the effect of Al during the isothermal bainitic process is similar to Si. Wang et al. proposed that significant retained austenite content and excellent ductility for TRIP-assisted steel can be promoted using 1.0 wt. % Al alloying in addition to 0.69 wt. % of Si [3]. Similar effects were reported by Krizan et al. [5,21].
The effect of P on counteracting carbide formation is lower than that of Si and Al [22]. On the other hand, P is an effective solid solution hardening element and it does not hinder galvanizing capability of the cold-rolled steel [23]. The downside is, however, the tendency of P to segregate in to grain boundaries which causes deterioration in ductility [24].
Al and Si are also ferrite stabilizers which mean they increase Ac3 temperature during intercritical annealing [25,26]. Other typical alloying elements, such as Mn, Ni, and Cu are austenite stabilizers which lower Ac3 temperature and assist on the stabilization of retained austenite [11,27,28]. In TRIP-assisted steels, Mn has also a role on increasing the stability of austenite by lowering martensite start (Ms) temperature [11]. Carbon content is typically limited to 0.20 wt. % in order not to decrease the weldability of the steel [14]. Because the use of carbon is limited, other elements are introduced for additional strengthening to increase tensile strength from 780 MPa up to 1180 MPa. Strengthening elements, such as Cr and Mo, and microalloying elements Nb and V together with Ti have been successfully used to reach strength levels above 980 MPa [3,21].
The effect of microalloying elements Nb and V is rather complex as they compete for the same interstitial elements leading into interactions between carbides and carbonitrides that are being formed [29]. Simply described, the effect is two-fold. They act as austenite grain size refiners during hot rolling, which subsequently leads to finer grain size during the intercritical annealing step, and they also strengthen the steel by inducing precipitates [30,31,32,33]. The resulting finer grain size during the annealing also affects the Ms temperature of the steel by lowering it during the final quenching step [34] as well as it increases the elongation capacity of the steel [6]. The solubility of V into austenite is considerably higher than other carbide and nitride forming microalloying elements have, which suggest that VC will be completely dissolved even in lower austenitizing temperatures [29].
The standard test method of elongation values, such as the uniform elongation and total elongation, is a uniaxial tensile test. The understanding of the formability requires, however, further examination of the material. In the case where only a limited amount of test material is available, the elongation test data and test pieces can be investigated using advanced methods. Heibel et al. proposed that the measurement of true thickness strain at fracture and true fracture strain allows the estimation of damage tolerance, edge-crack sensitivity, fracture toughness, and bendability of high-strength multiphase steels [35]. True thickness strain at fracture is suitable measure for local formability, whereas true uniform strain depicts the global formability of the material. A combination of these two measures gives a useful characterization on the formability of the material.
This study aims on investigating the effect of microalloying elements, Nb and V, on the properties of 0.20 wt. % carbon containing Si–Al–Mo–Cu alloyed TRIP-assisted steel. Nb microalloying has been studied extensively over recent decades, but V alloying regarding the properties of TRIP-assisted steels research is still sparse. The strengthening effect of the alloying concept and retained austenite stabilizing effect of the heat treatment was studied, and the ductility properties of the investigated steels were evaluated using the true fracture strain measuring methods. The investigated laboratory steels were compared to an industrially produced low-alloy TRIP 800 grade.

2. Materials and Methods

Steel A, the industrial reference steel, was produced as 1.20 mm cold-rolled and hot-dip galvanised steel at SSAB Europe Hämeenlinna Steelworks, Finland. The composition of Steel A is presented in Table 1.
The experimental laboratory Steels B, C, and D were produced as vacuum-cast 40 mm × 40 mm × 120 mm ingots at Swerim, Stockholm, Sweden. Hot and cold rolling of the ingots was performed using laboratory rolling mill at the University of Oulu, Finland. The ingots were first annealed at 1250 °C for 60 min, and then after hot rolled into 3 mm thickness and subsequently cold rolled to the final thickness 1.3–1.5 mm. The compositions of the laboratory steels are presented in Table 2.
The heat treatment and dilatometry experiments were performed using Gleeble 3800 thermomechanical simulator (Dynamic Systems Inc., Poestenkill, NY, USA) available at the University of Oulu. Model 39018 CCT dilatometer within the Gleeble system was used for dilatometry. The dilatometer used was a linear variable differential transducer (LVDT) type, which had quartz contact tips for continuous width measurement during heating, annealing, and the subsequent continuous cooling. Sample was 60 mm × 10 mm, where 10 mm was the width for the dilatometric measurement.
The dilatometry annealing of the Steels B, C, and D was performed by heating the sample at 4 °C/s to 1000 °C, holding it at this temperature for 60 s after which the test proceeded into controlled cooling of 25 °C/s with high pressure argon gas jet in order to investigate the decomposition of austenite. The martensite transformation range was estimated from the dilatometer curve, from which the martensitic starting temperature (Ms) was determined by fitting the dilatometer temperature data (T) to the Koistinen–Marburger (K–M) equation and finding the empirical fitting constant (K). Fitting of the equation on a non-linear regression curve was done using Minitab® software, version 18.1 (Minitab LLC., State College, PA, USA). Volume fraction of martensite (Vm) was calculated from K-M Equation (1) [36]:
Vm = 1 − e −K (Ms − T).
Heat treatment experiments for microstructural and mechanical properties investigations were designed to produce appropriate amount of retained austenite in the final microstructure. The intercritical annealing of Steels B, C, and D was done at approximately 50% ferrite and 50% austenite content, and the industrial heat treatment of Steel A was done approximately at 65% ferrite and 35% austenite. The phase fractions were calculated using JMatPro® software, version 11 (Sente Software Ltd., Guildford, UK). Steel A was not heat treated using holding period at intercritical bainitic transformation, although the industrial practice of the galvanising process allows 10 s at 460 °C which is the galvanising temperature. Steels B, C, and D were held for 100 s at various IBT temperatures. The temperatures were designed to be above the Ms temperatures which were estimated using dilatometry. The heat treatment parameters are presented in Table 3.
After the heat treatment, samples from Steels B, C, and D for microstructural analysis were cut in half from the point of the thermocouple. This meant that there were two samples with a size of 5 mm × 10 mm for the XRD measurements and microstructural investigations. The temperature gradient within the experimental samples using the same equipment was investigated in a previous study [37], where it was found that the temperature gradient within the distance 3–6 mm from the thermocouple remains below 3–5 °C at all stages of the heat treatment. The galvanised coating from Steel A was removed and 5 mm × 10 mm sample was prepared for microstructural analysis and XRD measurements.
The duplicate mechanical test samples, 20 mm × 120 mm, for uniaxial tensile testing were produced from Steels B, C, and D using the same heat treatment parameters as in the microstructural sample preparation. A non-standardized tensile specimen geometry was used: total length (Lt) 120 mm, original gauge length (L0) 30 mm, and original gauge width (Lw) 5 mm. Tensile specimens were tested using material testing system MTS 810 (ZwickRoell GmbH, DE) to define yield strength at 0.2% elongation (YS) and ultimate tensile strength at maximum force value (UTS). Similar tensile test specimen was also prepared from Steel A.
Mechanical test data from the investigated steels was further processed to calculate true stress (σ, MPa), true strain (ε, mm/mm) values, and the strain hardening coefficient n. True uniform strain εu, which is the strain at maximum load, was also determined from the tensile test curves for each sample. This was combined to the examination of the fracture surface cross-sections of the tensile test pieces. Together they were utilized to evaluate the formability of the specimen. In the evaluation, the reduction of area (Af), true fracture strain (TFS), and the true thickness strain at fracture (ε3f) were the main parameters of interest. These parameters are defined according to ASTM E8 as follows [38]:
ε3f = ln (t0/tf),
where t0 is the initial sheet thickness and tf the minimum sheet thickness at fracture, and
TFS = ln (A0/Af),
where A0 is the initial cross-sectional area of the tensile specimen, and Af is an estimation of the area at fracture, which is calculated by
Af = Wf × 1/6 × (t1 + 4 × t2 + t3),
where Wf is the specimen width at fracture, which is projected to the plane perpendicular to the test direction, t2 is the minimum thickness of the fracture surface, and t1 and t3 are maximum thicknesses of the fracture surface. Typically, the thinner thickness, t2 can be found from the centre of the sample, while the thicker parts t1 and t3 are found at the border of the specimen, where the sample has thinned less. In the present study, the same thickness value for tf and t2 was used.
The samples for X-ray diffraction studies were prepared by applying electrolytical polishing to the sample surface. As a first preparation step, thickness of 0.2 mm was ground from the specimen surface using roughness P800 SiC grinding paper. After this, the specimens were ground with progressively finer papers, ending with the roughness P2000. Finally, the specimens were surface finished with the roughness P2000 and electrolytically polished for 12 s at 40 V using the Lectropol-5 polisher with the A2 electrolyte. After the preparation, samples were subjected to X-ray diffraction studies in order to quantify the retained austenite volume fraction and to calculate carbon content of retained austenite in room temperature. The XRD study was performed using Panalytical Empyrean X-Ray Diffractometer (Malvern Panalytical Ltd., UK) instrument with a cobalt cathode (40° < 2θ < 130°, 40 kV, 45 mA) with 0.013° step size at 80 s measurement time per step. The peaks analysed for ferrite peaks analysed were (110), (200), (211), and (220), whereas the austenite peaks used were (111), (200), (220), and (311). The amount of retained austenite (in volume percentage) was calculated using the four peak method described in the standard SP-453 [39]. The average room temperature carbon content of retained austenite Cγ (in weight percentage) was calculated using the equation 5 proposed by Dyson and Holmes [40]:
Cγ = (αγ − (3.578 + 0.00095 × Mnγ + 0.0028 × Alγ))/0.033,
where αγ is the lattice parameter of retained austenite in Å, and Mnγ and Alγ are the solute contents of Mn and Al in retained austenite which were assumed to be equivalent to added contents.
In addition to X-ray diffraction studies of retained austenite, the electrolytically polished samples were subjected to back-scatter diffraction studies using field emission scanning electron microscope (FESEM). The electron back-scatter diffraction (EBSD) instrument used in the investigation was Bruker eFlash FS which includes ARGUS forward-scatter detector (FSE) imaging system. Acceleration voltage used in EBSD measurements was 20 kV and the other parameters were: step size 59–180 nm, working distance 15 mm and detector distance 16 mm. The EBSD system was fitted into JEOL-7200F high-resolution FESEM.
EBSD studies were also performed for mechanically cut and ion-polished cross-sections of selected tensile test specimens. These specimens were first cut longitudinal to the tensile test direction after which the cross-sections were subjected to ion-milling with JEOL IB-19530 Cross Section Polisher. Ion beam accelerating voltage was 6.0 kV and polishing time 3 h with additional 45 min of fine-polishing using 3.0 kV for a deformation-free surface.
JEOL JEM-F200 transmission electron microscope (TEM) was used to study the precipitation state of microalloying elements in the laboratory steels. Carbon extraction replicas were prepared to analyse the distributions and positions of the precipitated microalloying elements, while qualitative analysis was performed using energy dispersive spectrometer (EDS). TEM carbon extraction replicas were prepared by first coating pre-polished and Nital (4%) etched samples with carbon. Carbon coating was then cut into 1 mm × 1 mm sections and removed with Nital for precipitate analysis.

3. Results

3.1. Dilatometry

Table 4 presents Ms temperatures of the investigated steels from the dilatometer data, JMatPro® calculated results for Ms temperatures and the austenite carbon contents at IA temperatures. Steel A was studied in dilatometry tests in an earlier study by Nyyssönen et al. [37], but the JMatPro® calculations were repeated for the present study.
It was observed that the laboratory experimental steel C had significantly lower Ms temperature compared to B and D, which indicates that there were differences in the initial starting microstructures of the steels. The hot-rolled microstructure of Steel C had a smaller grain size than B or D. The smaller grain size may have lowered the Ms temperature in the quenching subsequent to the dilatometry annealing by decreasing the free-energy during phase transformation to martensite. Steel A also had a considerably lower Ms temperature when the dilatometry annealing was done at 850 °C in ferrite–austenite dual-phase region. Reflecting the result of Steel A to Steel C, it could be postulated that steel C was not fully austenitized during the dilatometry annealing. The delayed austenitization also suggests that the carbon content of austenite during intercritical annealing was higher in steels A and C compared to B and D at the same temperature. JMatPro® calculations at the dual-phase region intercritical annealing for Steel A at 810 °C and for Steel C at 830 °C, using an austenite carbon content of 0.70 wt. % instead of the steel carbon content, showed that the Ms temperature was approximately 200 °C. These results indicate that the Ms temperature is considerably lower when the steel is heated at the dual-phase region between Ac1 and Ac3 than at 1000 °C.
Considering the experimental IBT temperatures and the heat treatment schedule, the lowest holding temperature, IBT 420 °C, was indeed above Ms in steels B, C, and D as planned. JMatPro® calculated Ms temperature values were in line with dilatometry results, when the dilatometer annealing was done at the fully austenitized state.

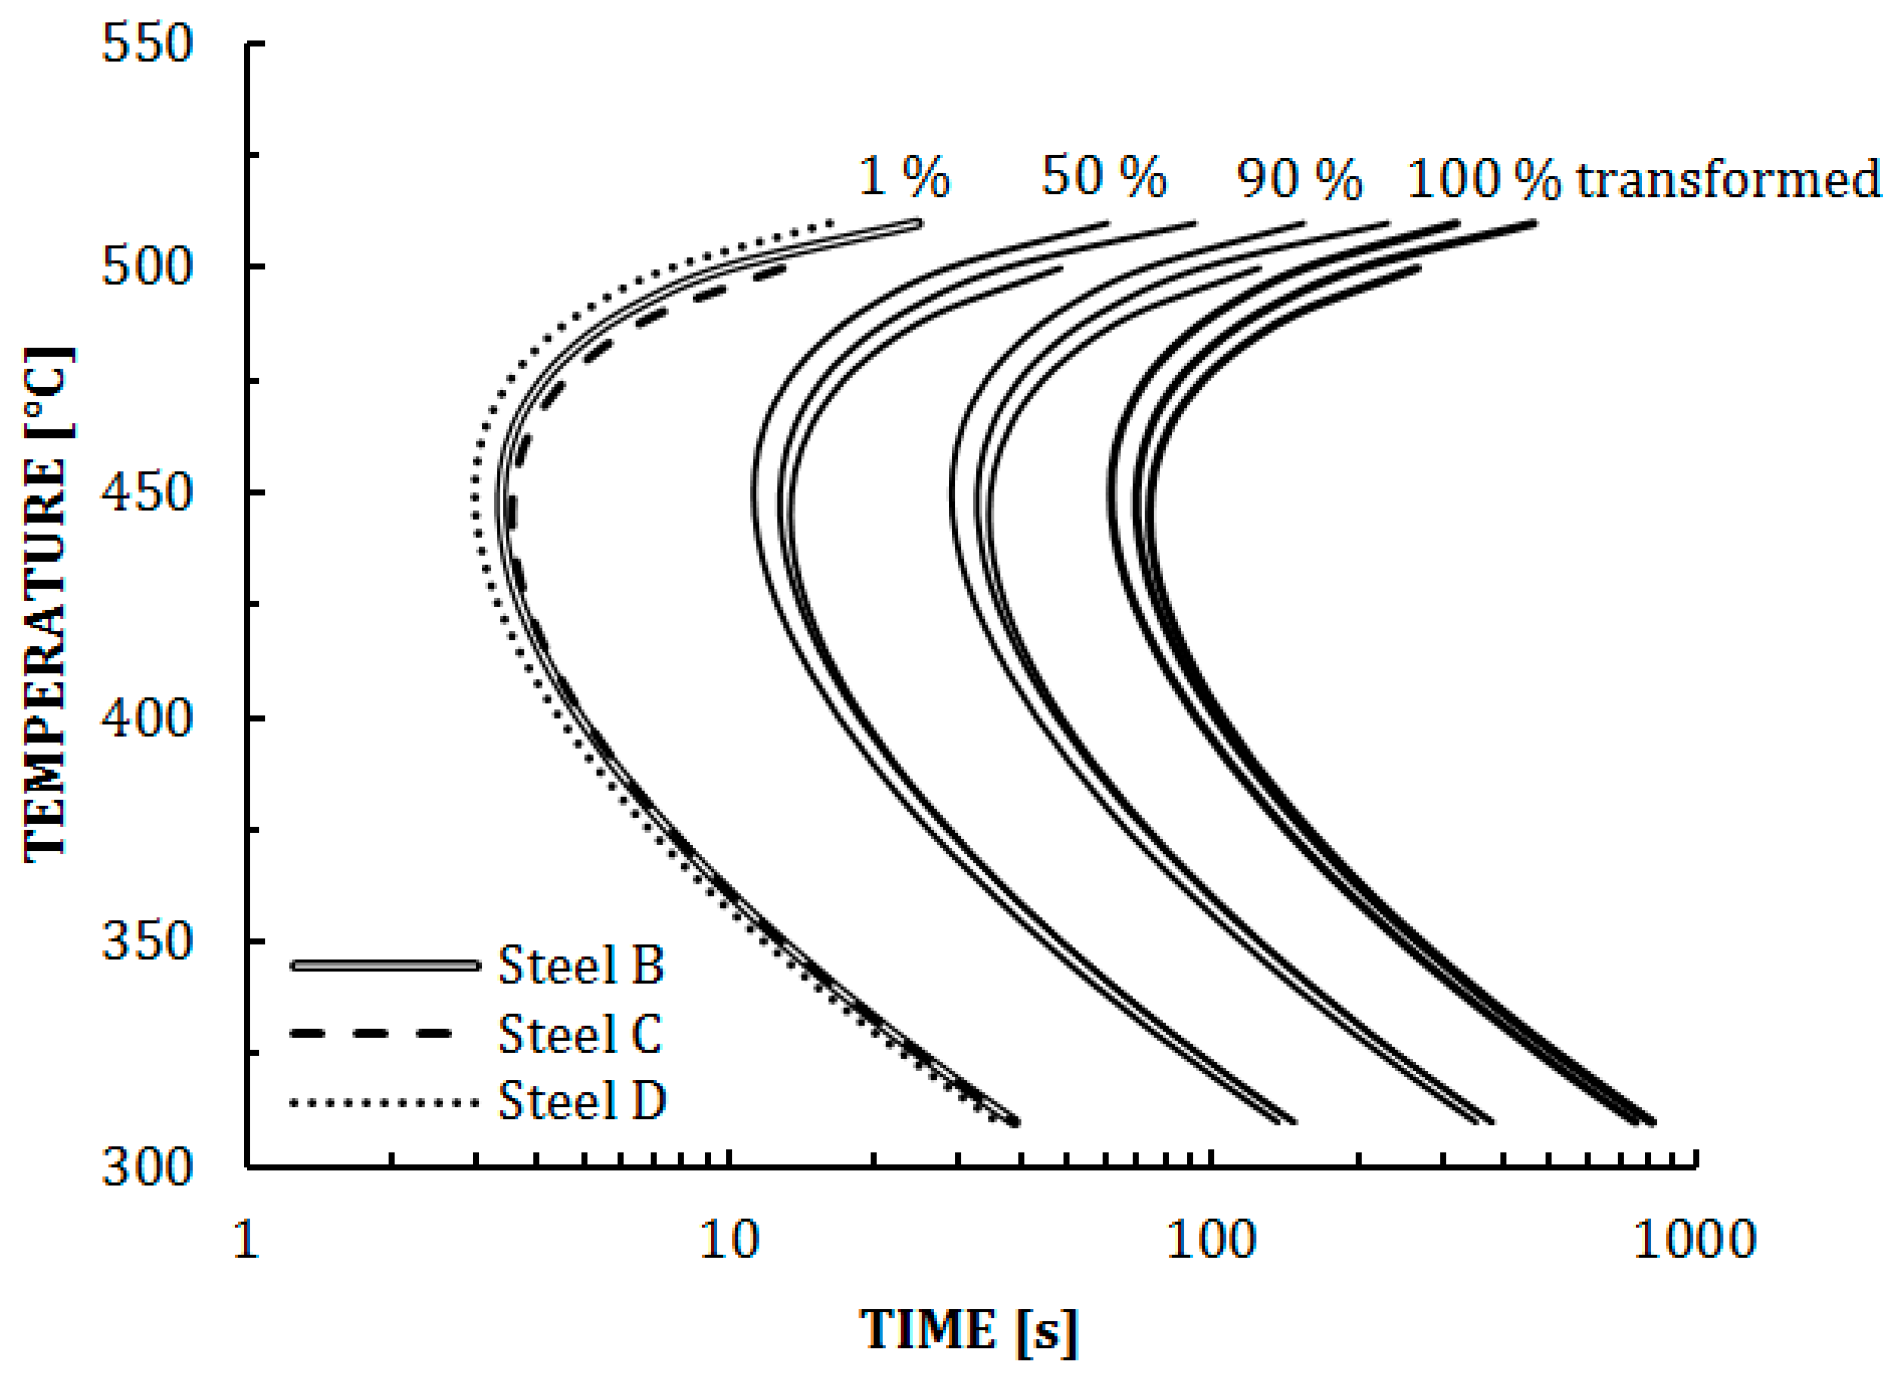
3.2. Isothermal Bainitic Transformation

Time–temperature transformation diagrams (TTT) were calculated for Steels B, C, and D. TTT curves for isothermal bainitic transformation reflected the period of time it takes to reach full transformation. Figure 1 presents partial TTT curves calculated with JMatPro® for Steels B, C, and D showing starting lines of bainitic transformation and various steps before reaching completion.
A temperature of 830 °C was used as the annealing temperature in calculations which means that the model assumed that the starting point of cooling is the ferrite–austenite dual-phase region with approximately 50% austenite and 50% ferrite. After this annealing, the Ms temperatures for Steels B, C, and D were approximately 300 °C. The rapid bainitic transformation region according to these calculations was approximately at 450 °C. Rapid transformation, in this case, means that the complete transformation was moved to the 100 s point.

3.3. Mechanical Properties

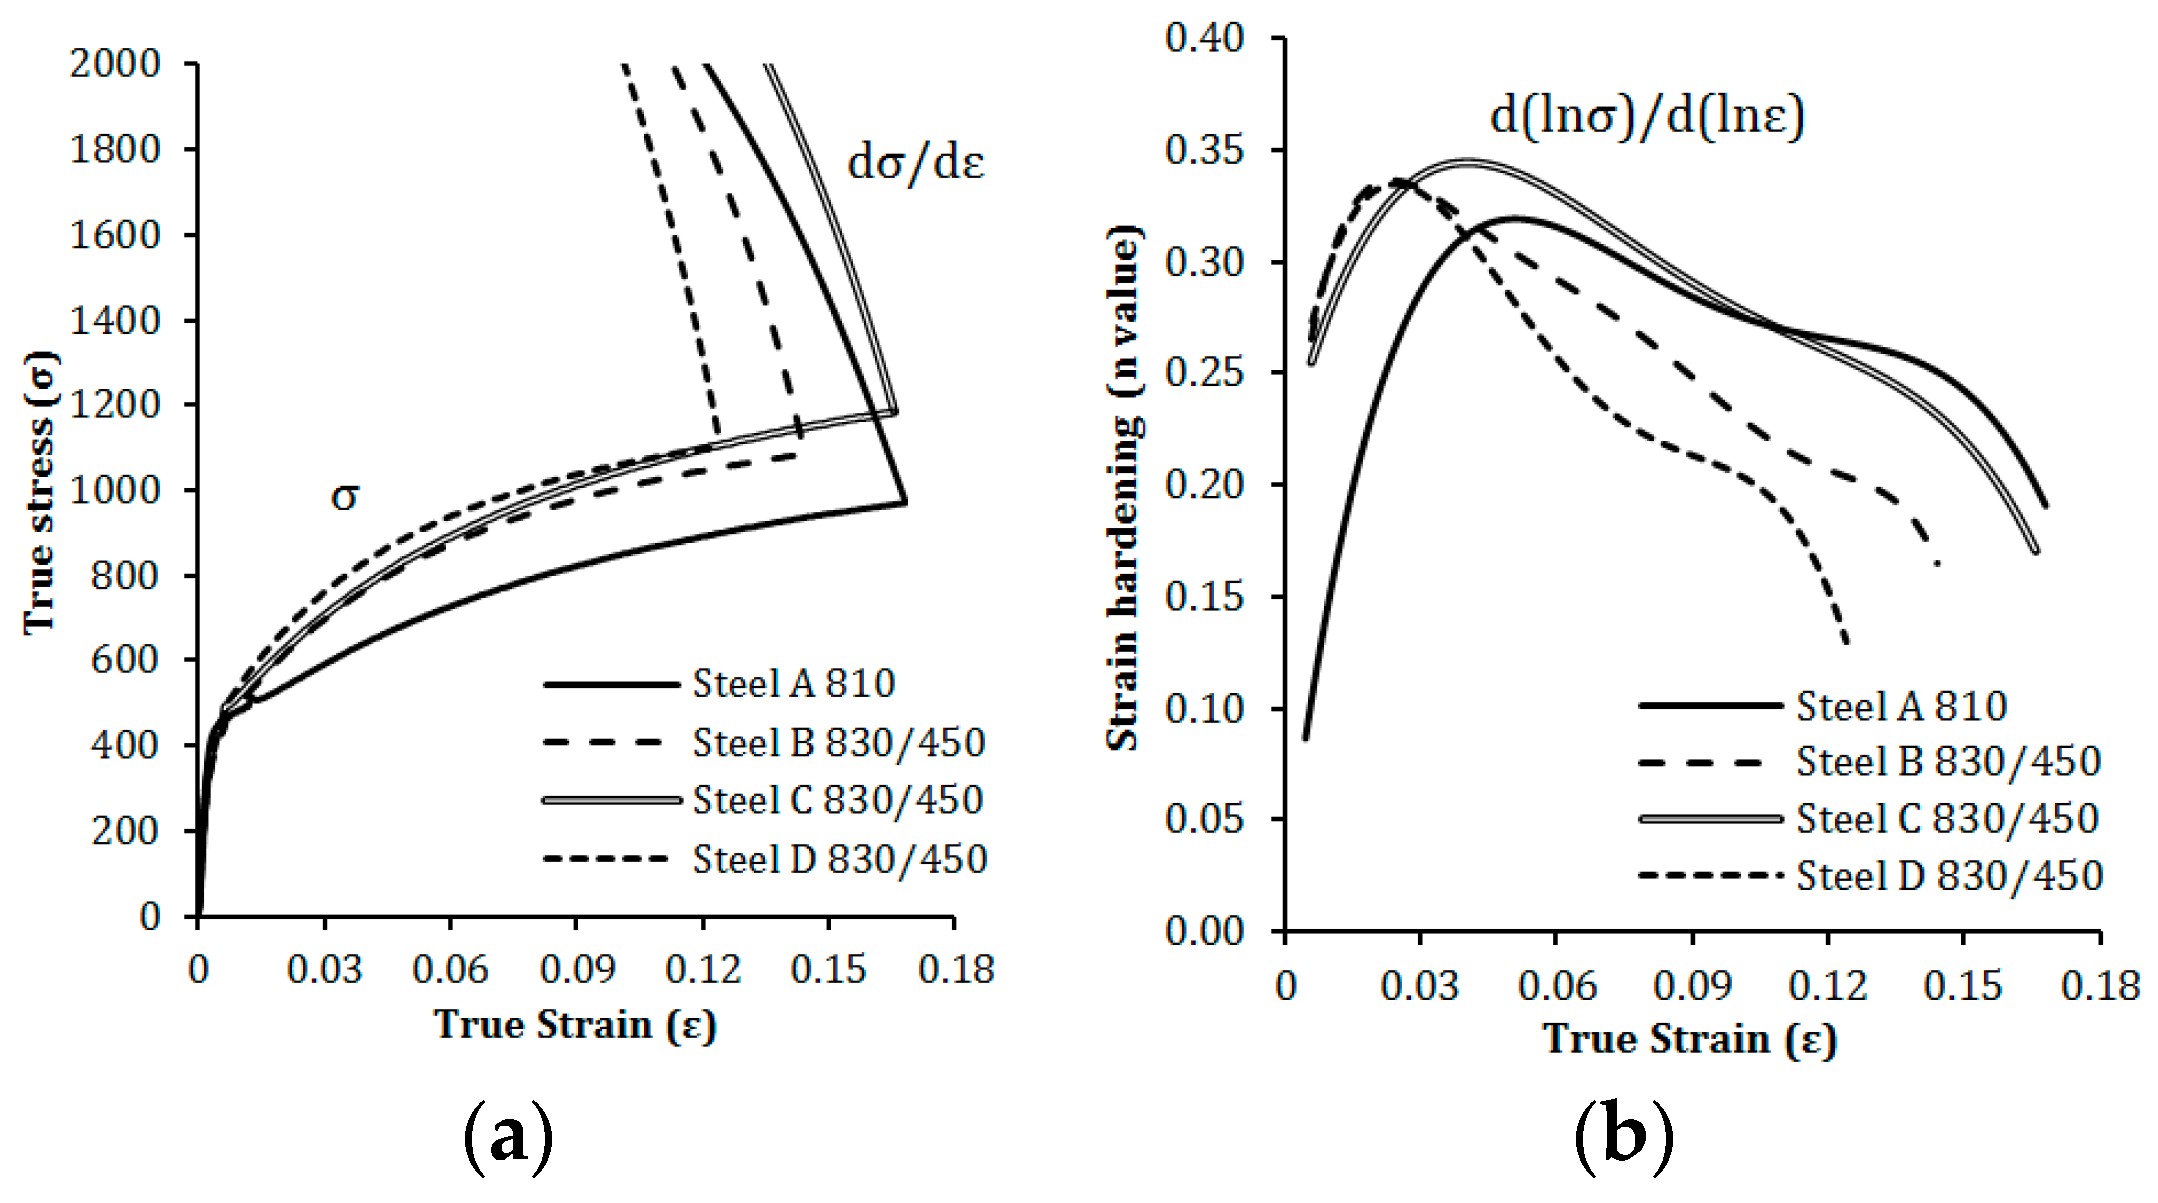
3.3.1. Tensile Tests

The measured strength and elongation values from mechanical tests are presented in Table 5. The rapid bainite transformation range correlated with the elongation values of Steels B, C, and D. The highest uniform and total elongations were found from IBT 450 samples and the lowest from IBT 420 or IBT 480. The tensile strength of Steel A was at 800 MPa level, whereas all the other test samples, with the exception of Steel B IBT 420, had ultimate tensile strengths above 900 MPa. The highest UTS × TEL value, which almost reached 25,000 MPa%, was found from Steel C.
Figure 2 presents the true stress–true strain curve comparison between Steel A and the IBT 450 samples of Steels B, C, and D. In order to visualize the elongation capacity of the investigated steels, dσ/dε curves (Figure 2a) and incremental strain hardening n value (Figure 2b) were plotted. The results indicated that the necking onset for Steel A was at 0.168 true strain while experimental Steels B, C, and D begun necking at 0.144, 0.166, and 0.124, respectively. A similar trend was found when n value curves were compared: Steel A persisted necking the most and had the highest consistent n value after true strain 0.06 point. However, Steel C was not far behind.

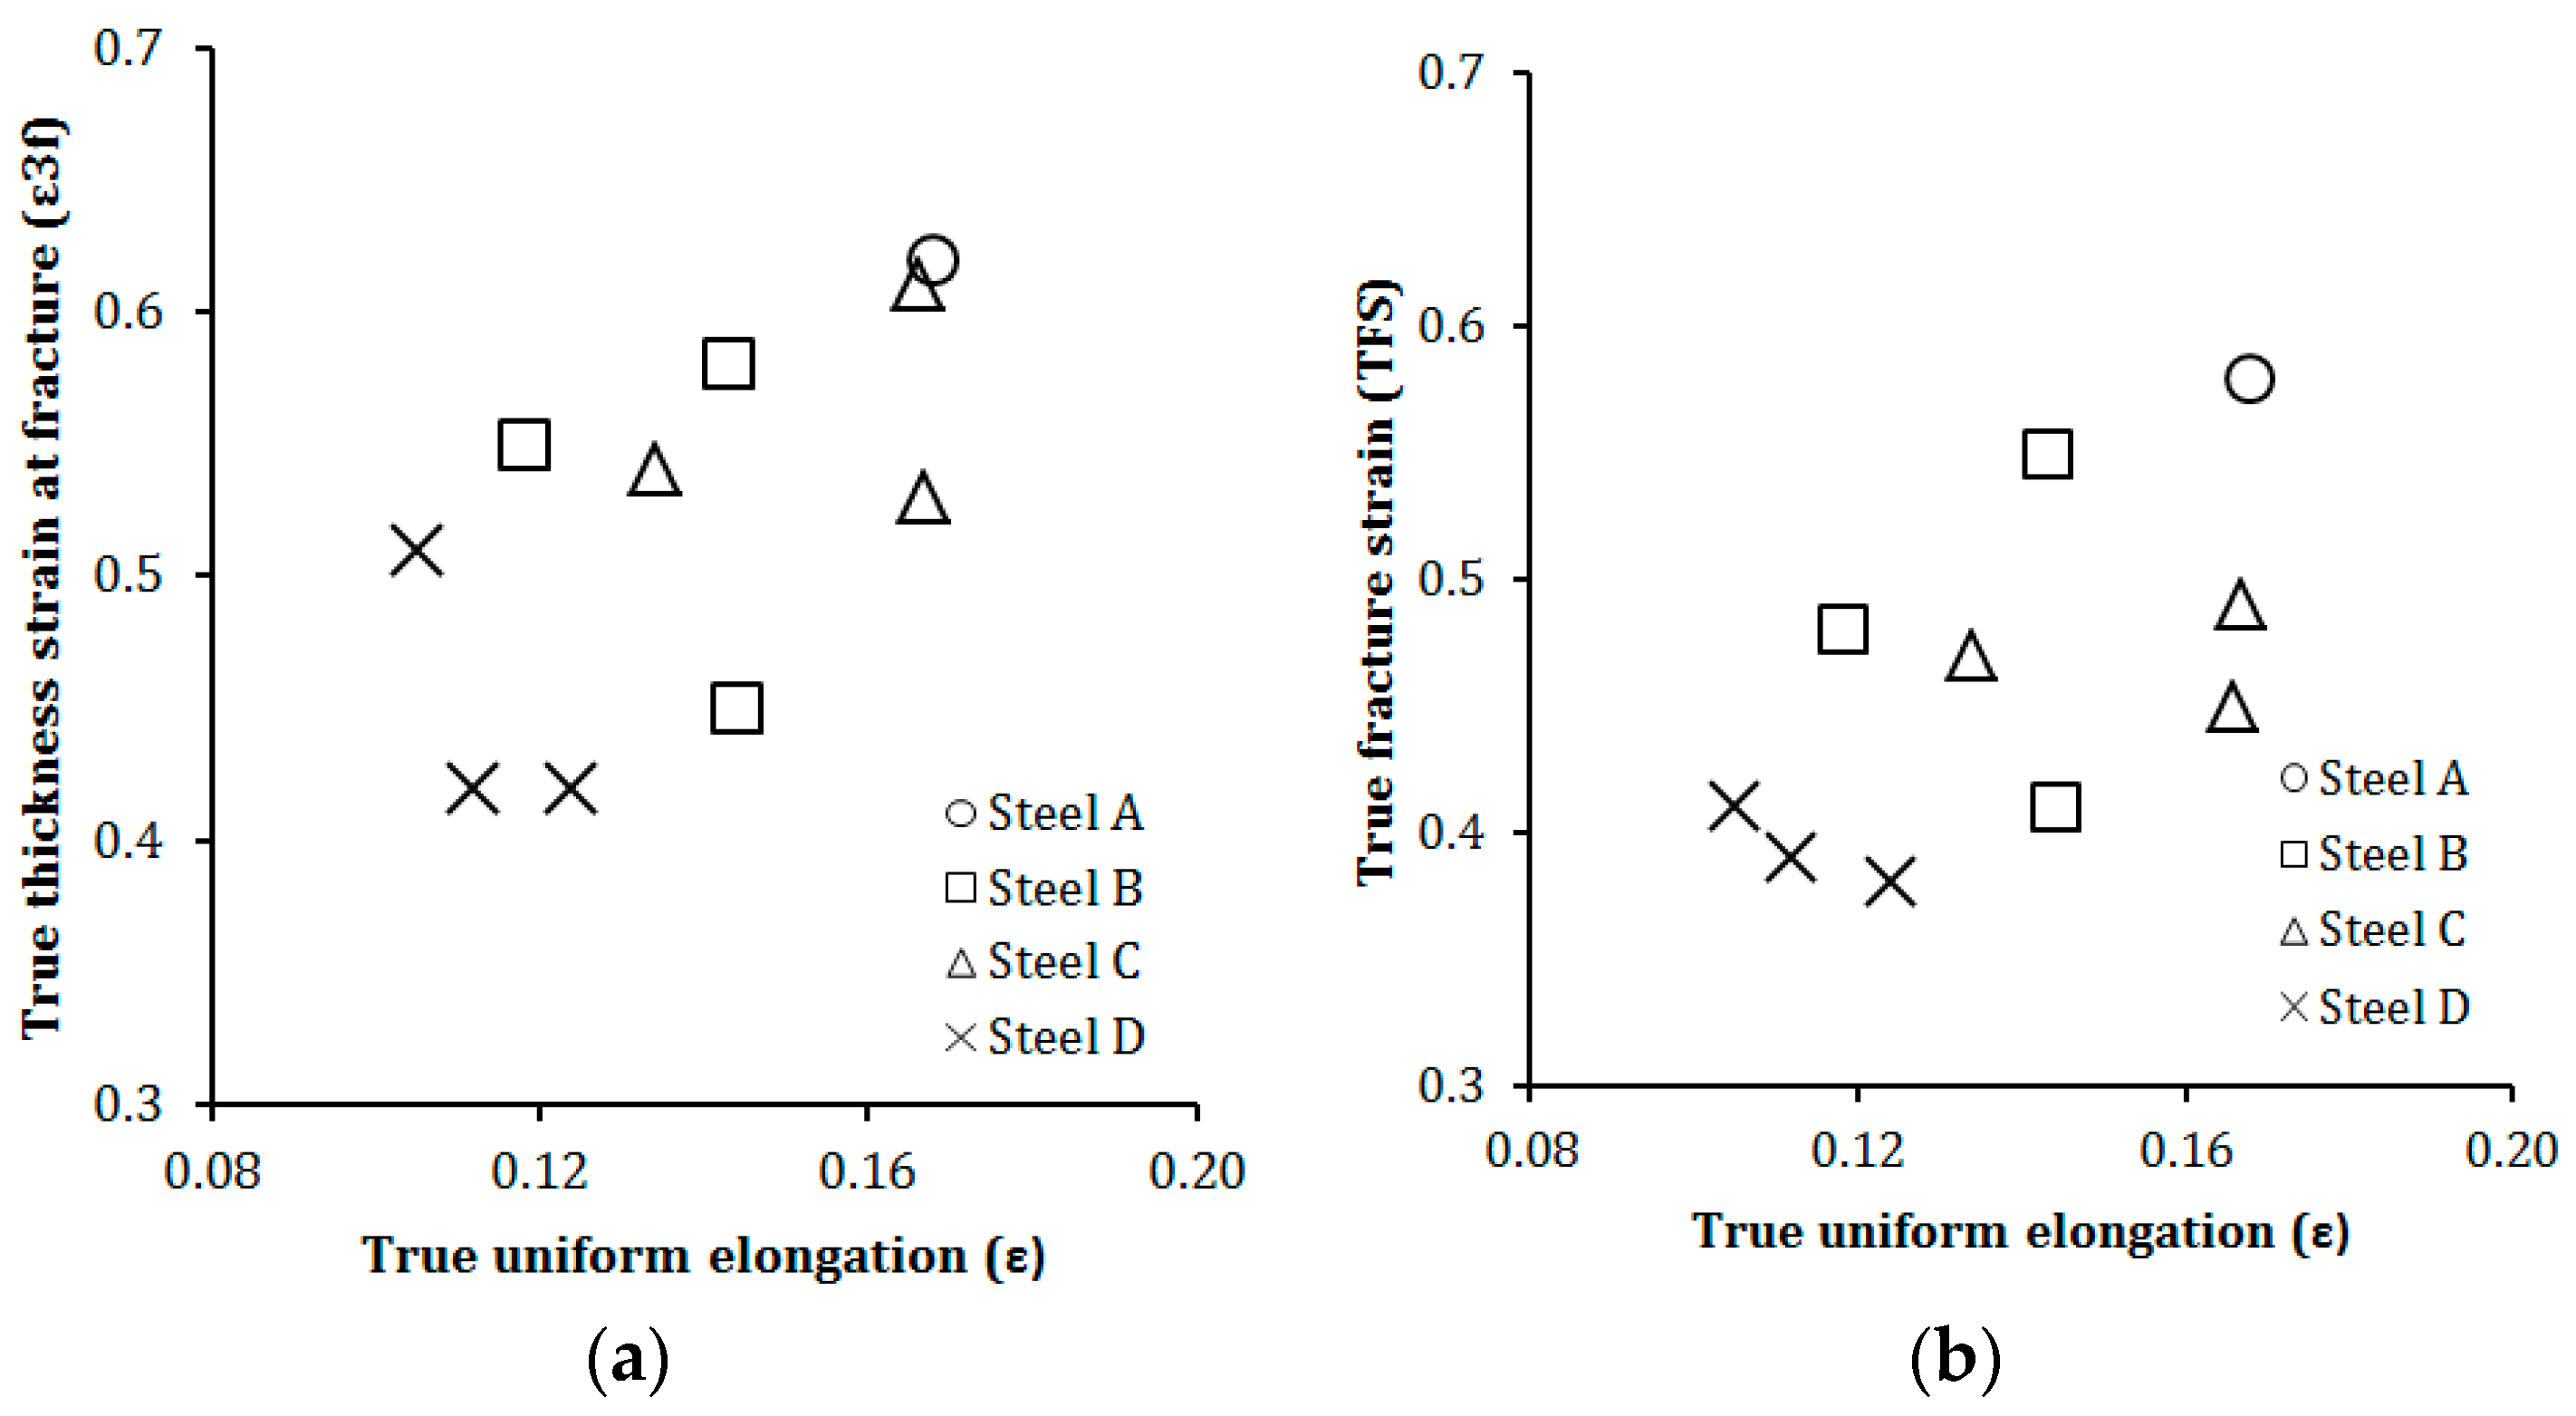
3.3.2. True Fracture Strain

Table 6 presents the true thickness strain at fracture (ε3f) and true fracture strain (TFS) values measured from the tensile test samples. These values are an average of two measurements. The comparison value, true uniform elongation, was found from the intersection of true stress–true strain and dσ/dε curves.
The measurements were plotted on separate graphs presented in Figure 3. Both ε3f (Figure 3a) and TFS (Figure 3b) plots show similar trends which can be used to evaluate the elongation and thinning capacity of the steels. Generally, the target is to reach the upper right corner of the plot which indicates the best elongation compared to highest possible thickness decrease of the sample before necking and the subsequent fracture occurs. Steel A had the best compared values and Steel C IBT 420 reached the point closest to the reference sample in ε3f measurement. TFS presented similar trend, but the gap between Steel A and Steel C was larger.

3.4. Retained Austenite

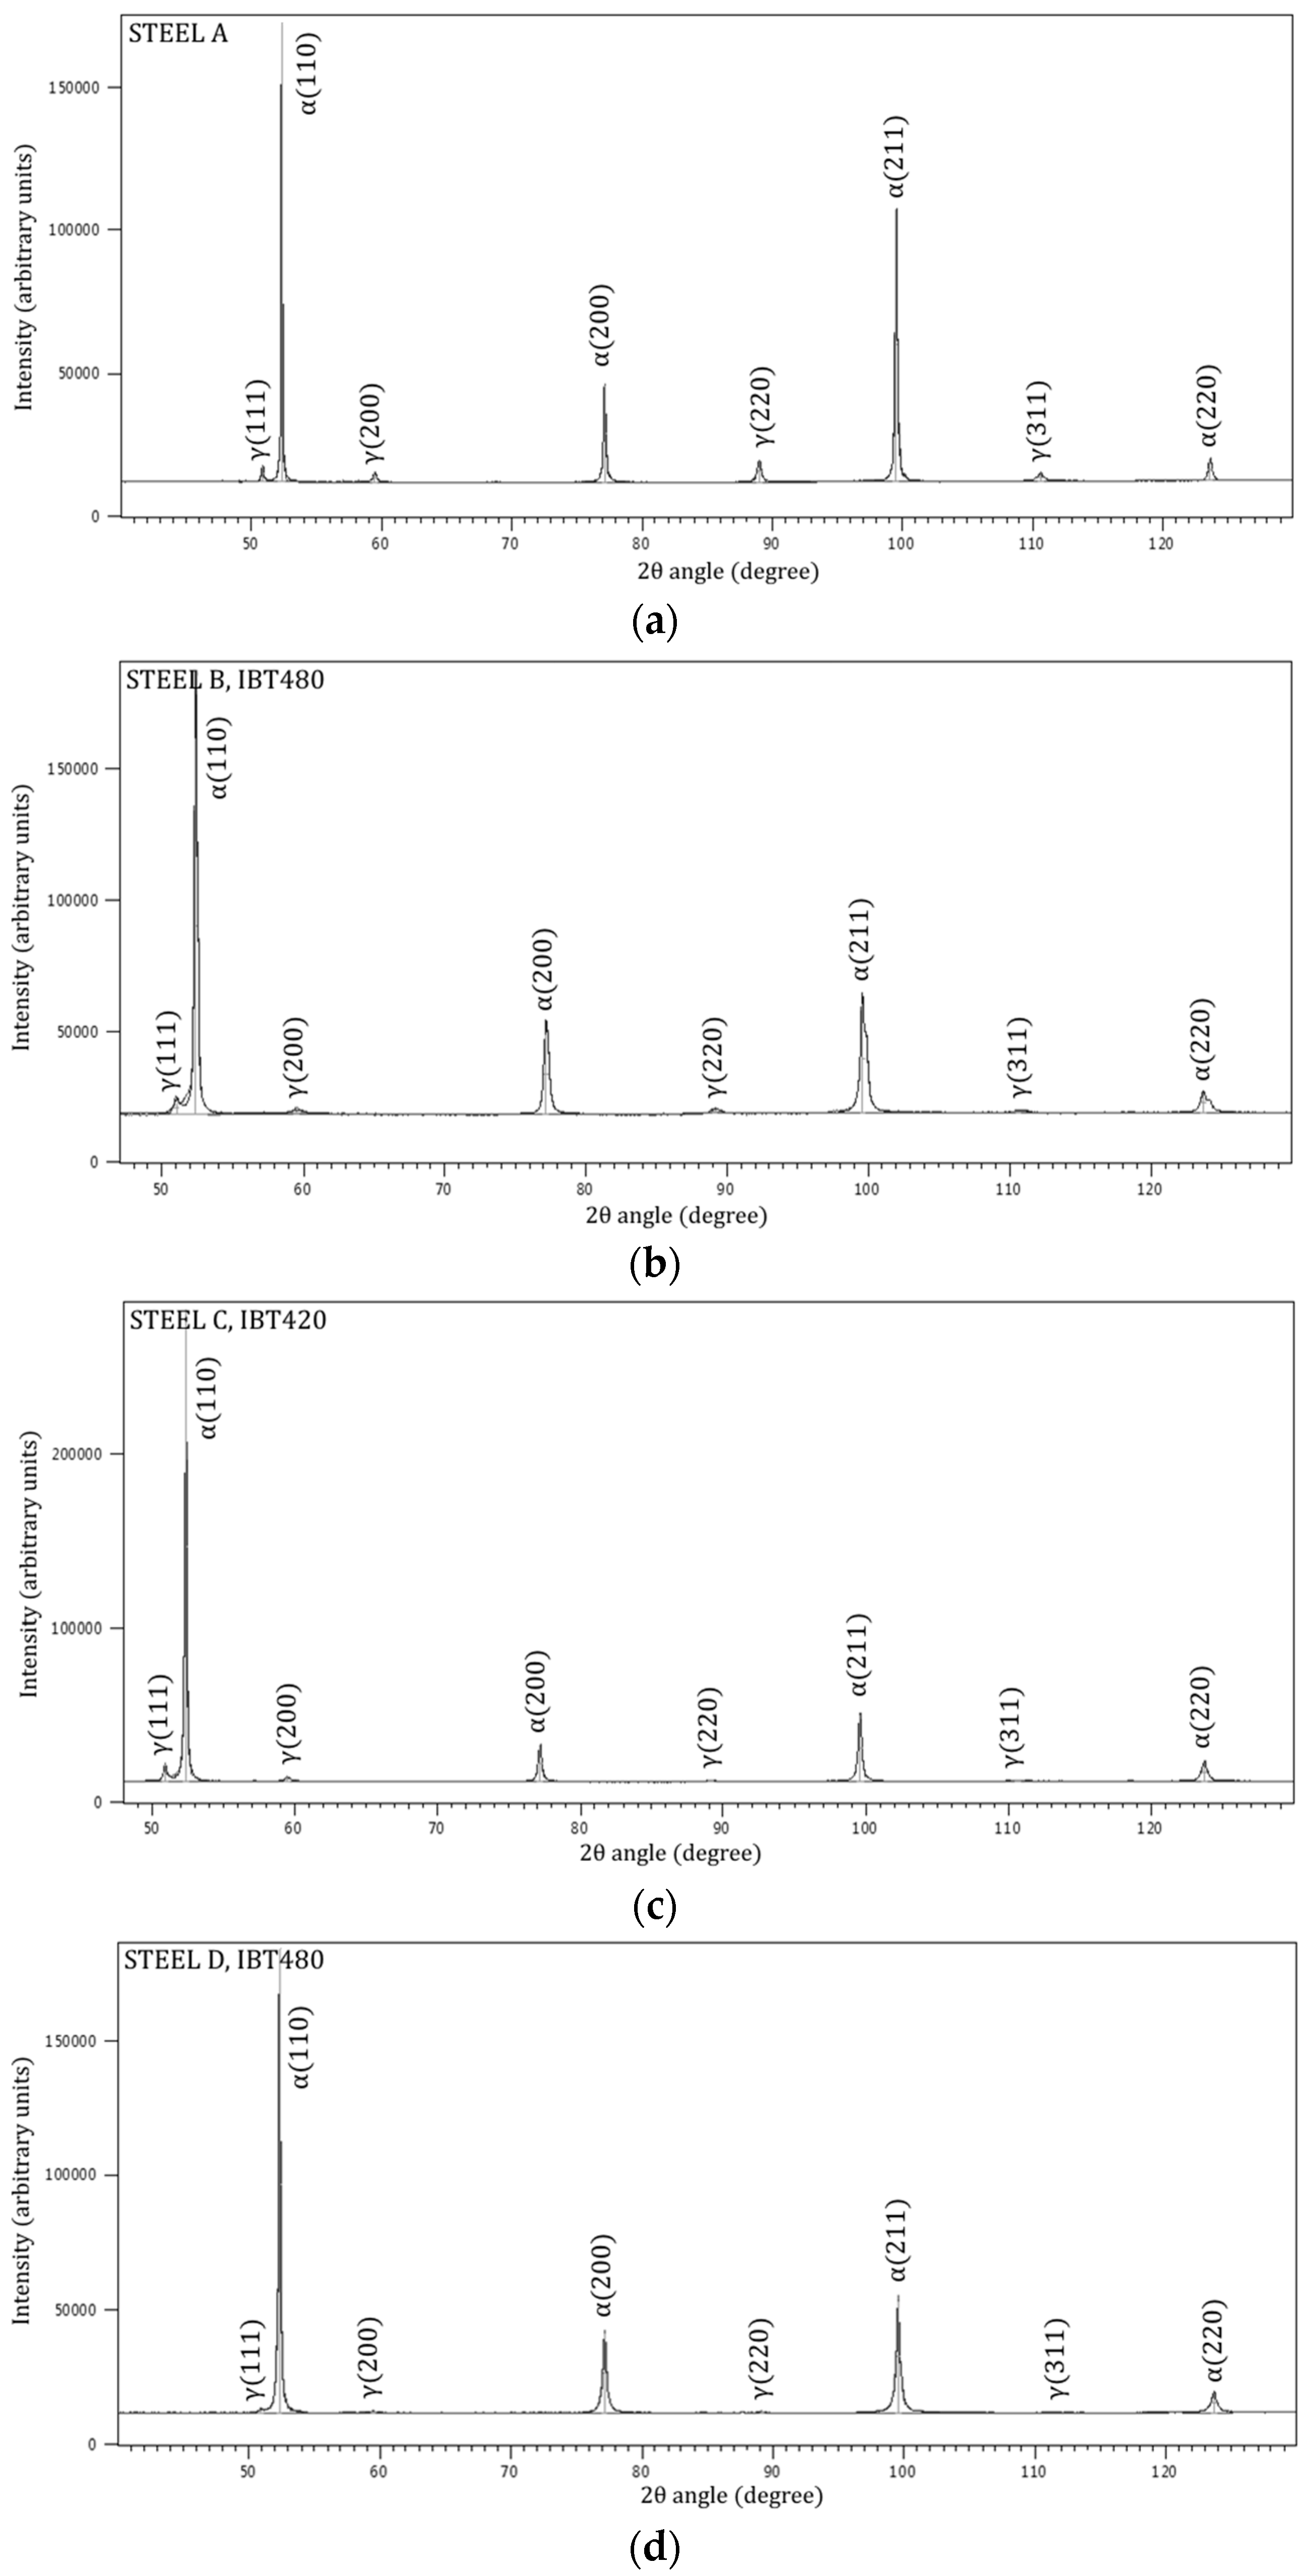
3.4.1. XRD Measurements

Figure 4 shows examples of the obtained XRD spectra for Steel A and selected specimen from Steels B, C, and D. The amount of retained austenite was appreciable in Steels A, B, and D. Steel D showed the lowest intensity of the corresponding austenite peaks (111), (200), (220), and (311). The integrated intensity of austenite (311) peak in the XRD spectra of Steel D IBT 480 (Figure 4d) was 0.
Table 7 presents the retained austenite content (in volume percentage) and the calculated retained austenite carbon content (in weight percentage) of the investigated steels. The highest retained austenite content was measured from Steel A and the second highest from Steel B IBT450.
Steels C and D had the lowest retained austenite volume fractions, although Steel C IBT 420 reached level similar to Steel B IBT 480. Calculations after Dyson and Holmes [40] indicated that the retained austenite carbon content was at level 0.6–0.8 wt. % with the exception of Steel D IBT420 in which the retained austenite volume fraction was the lowest. The retained austenite volume percentage below 1.0% should be considered negligible.

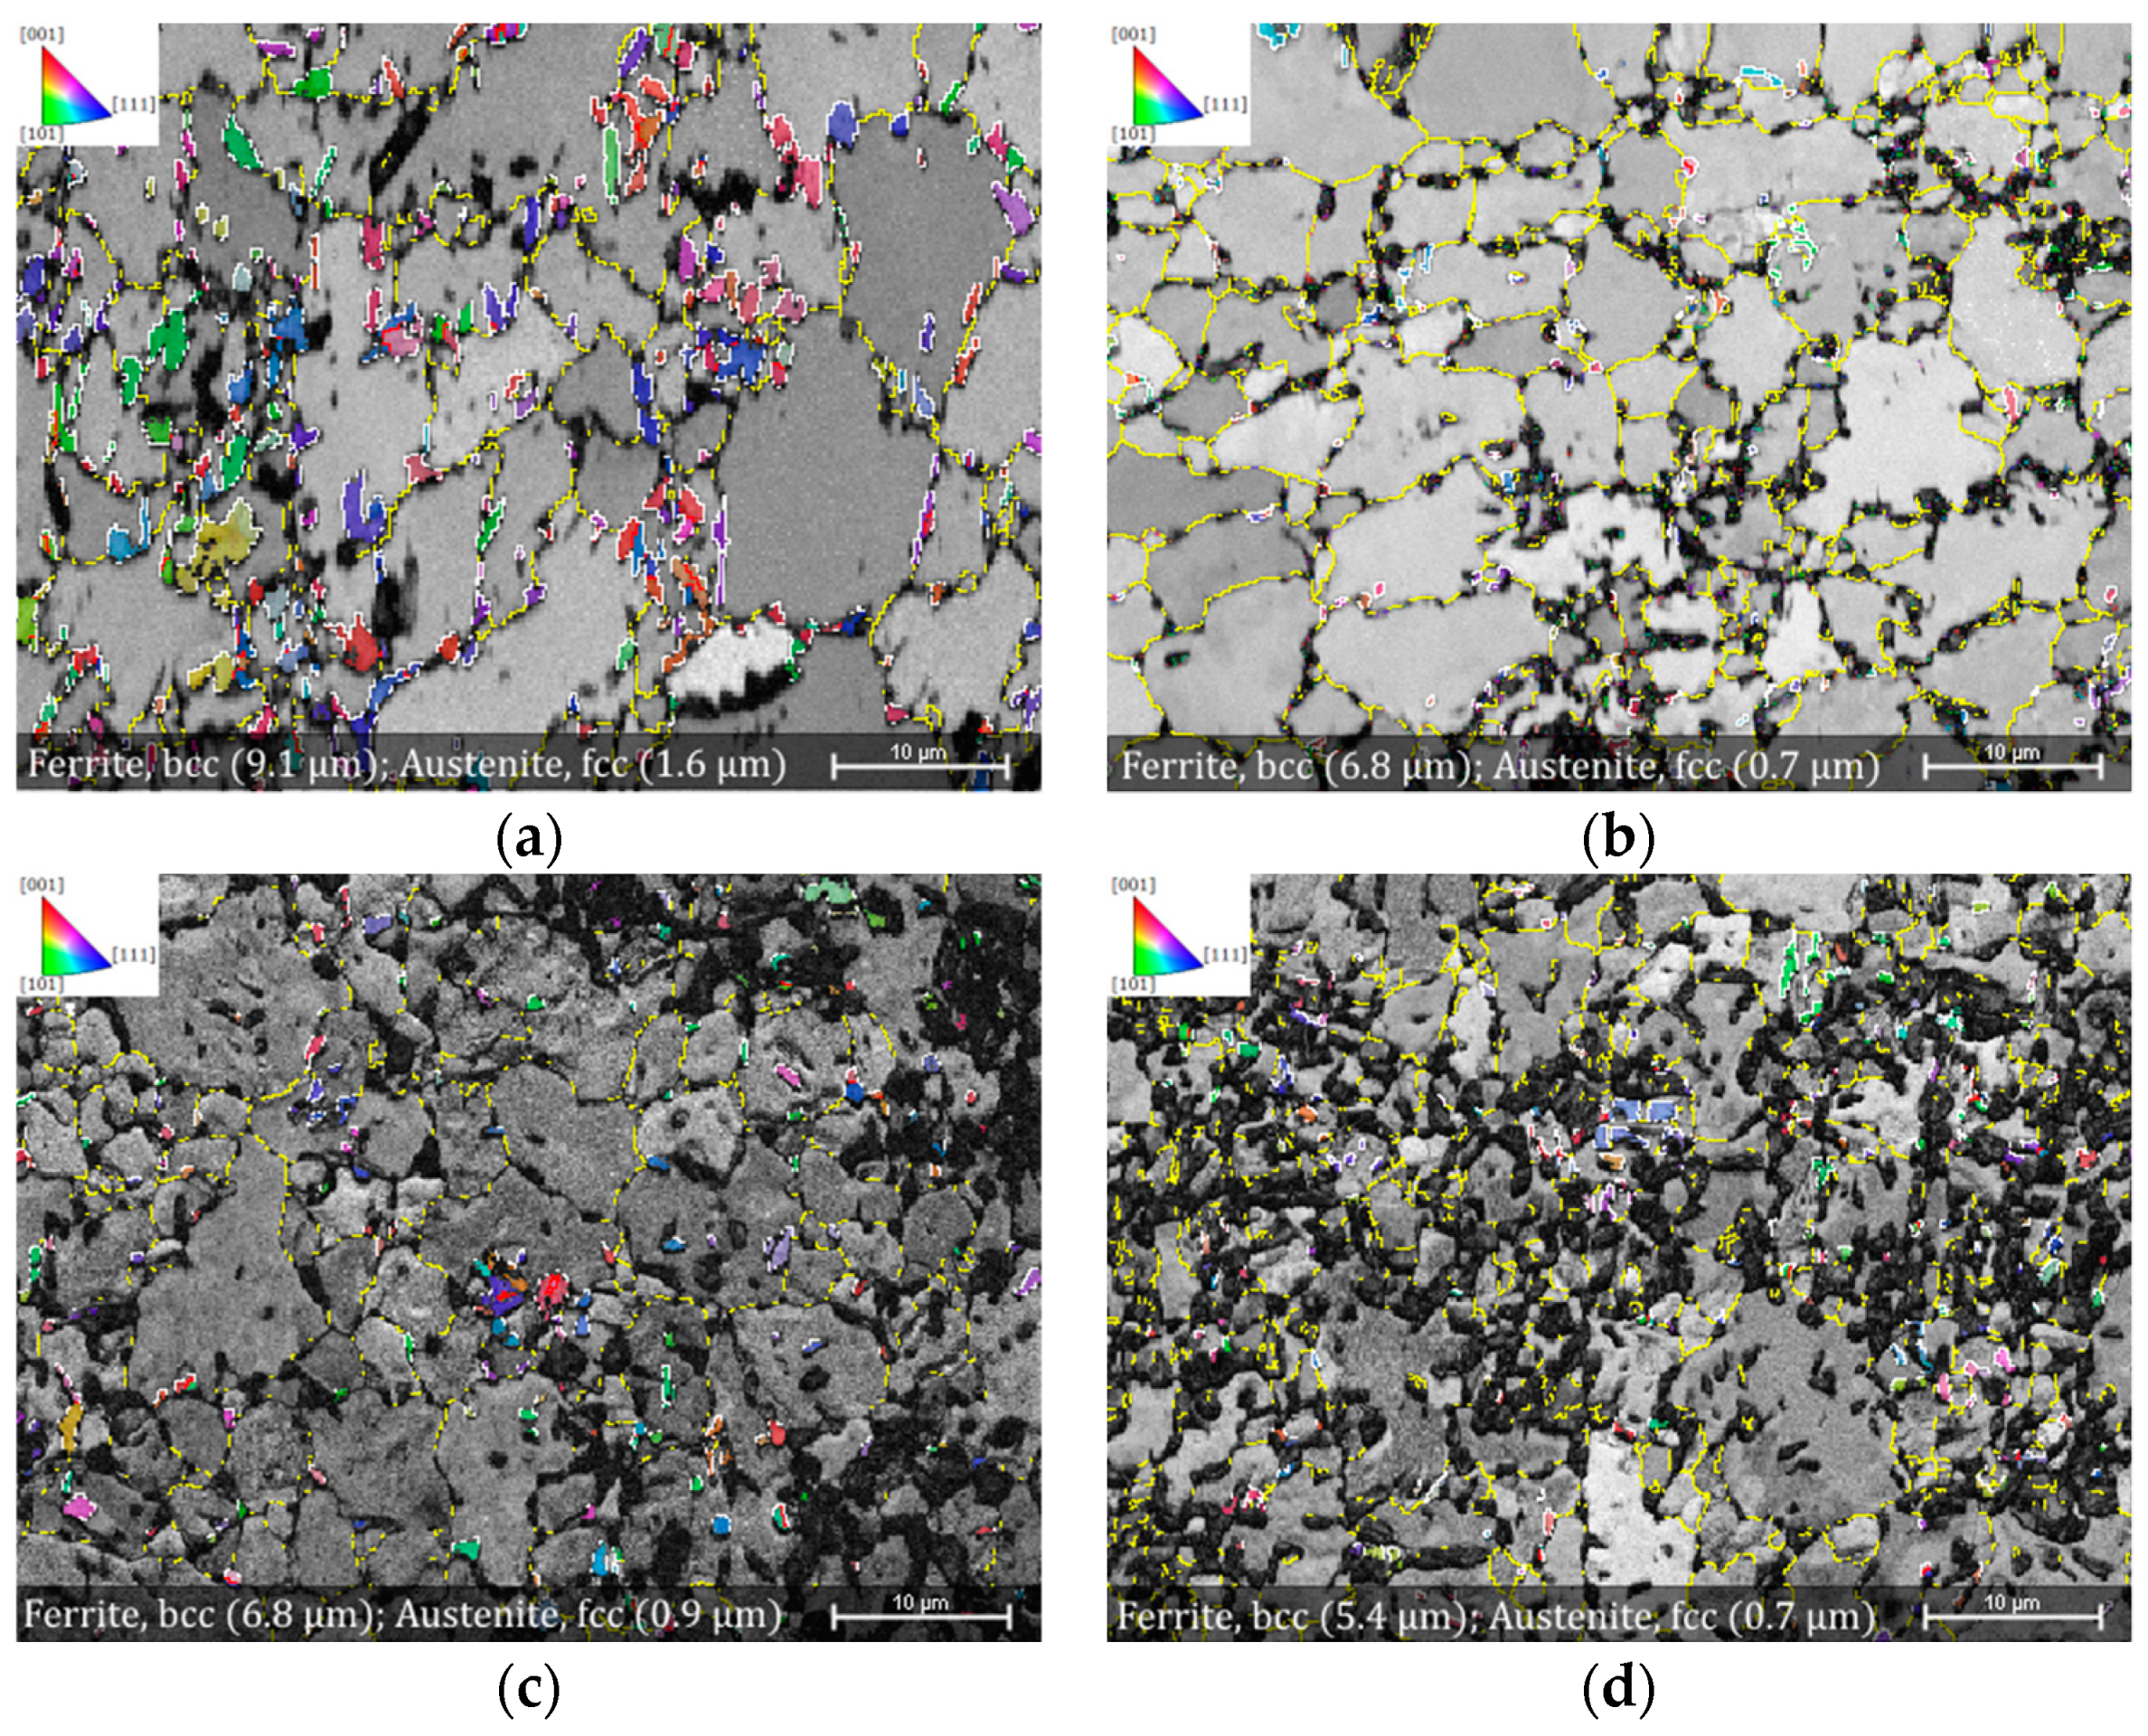
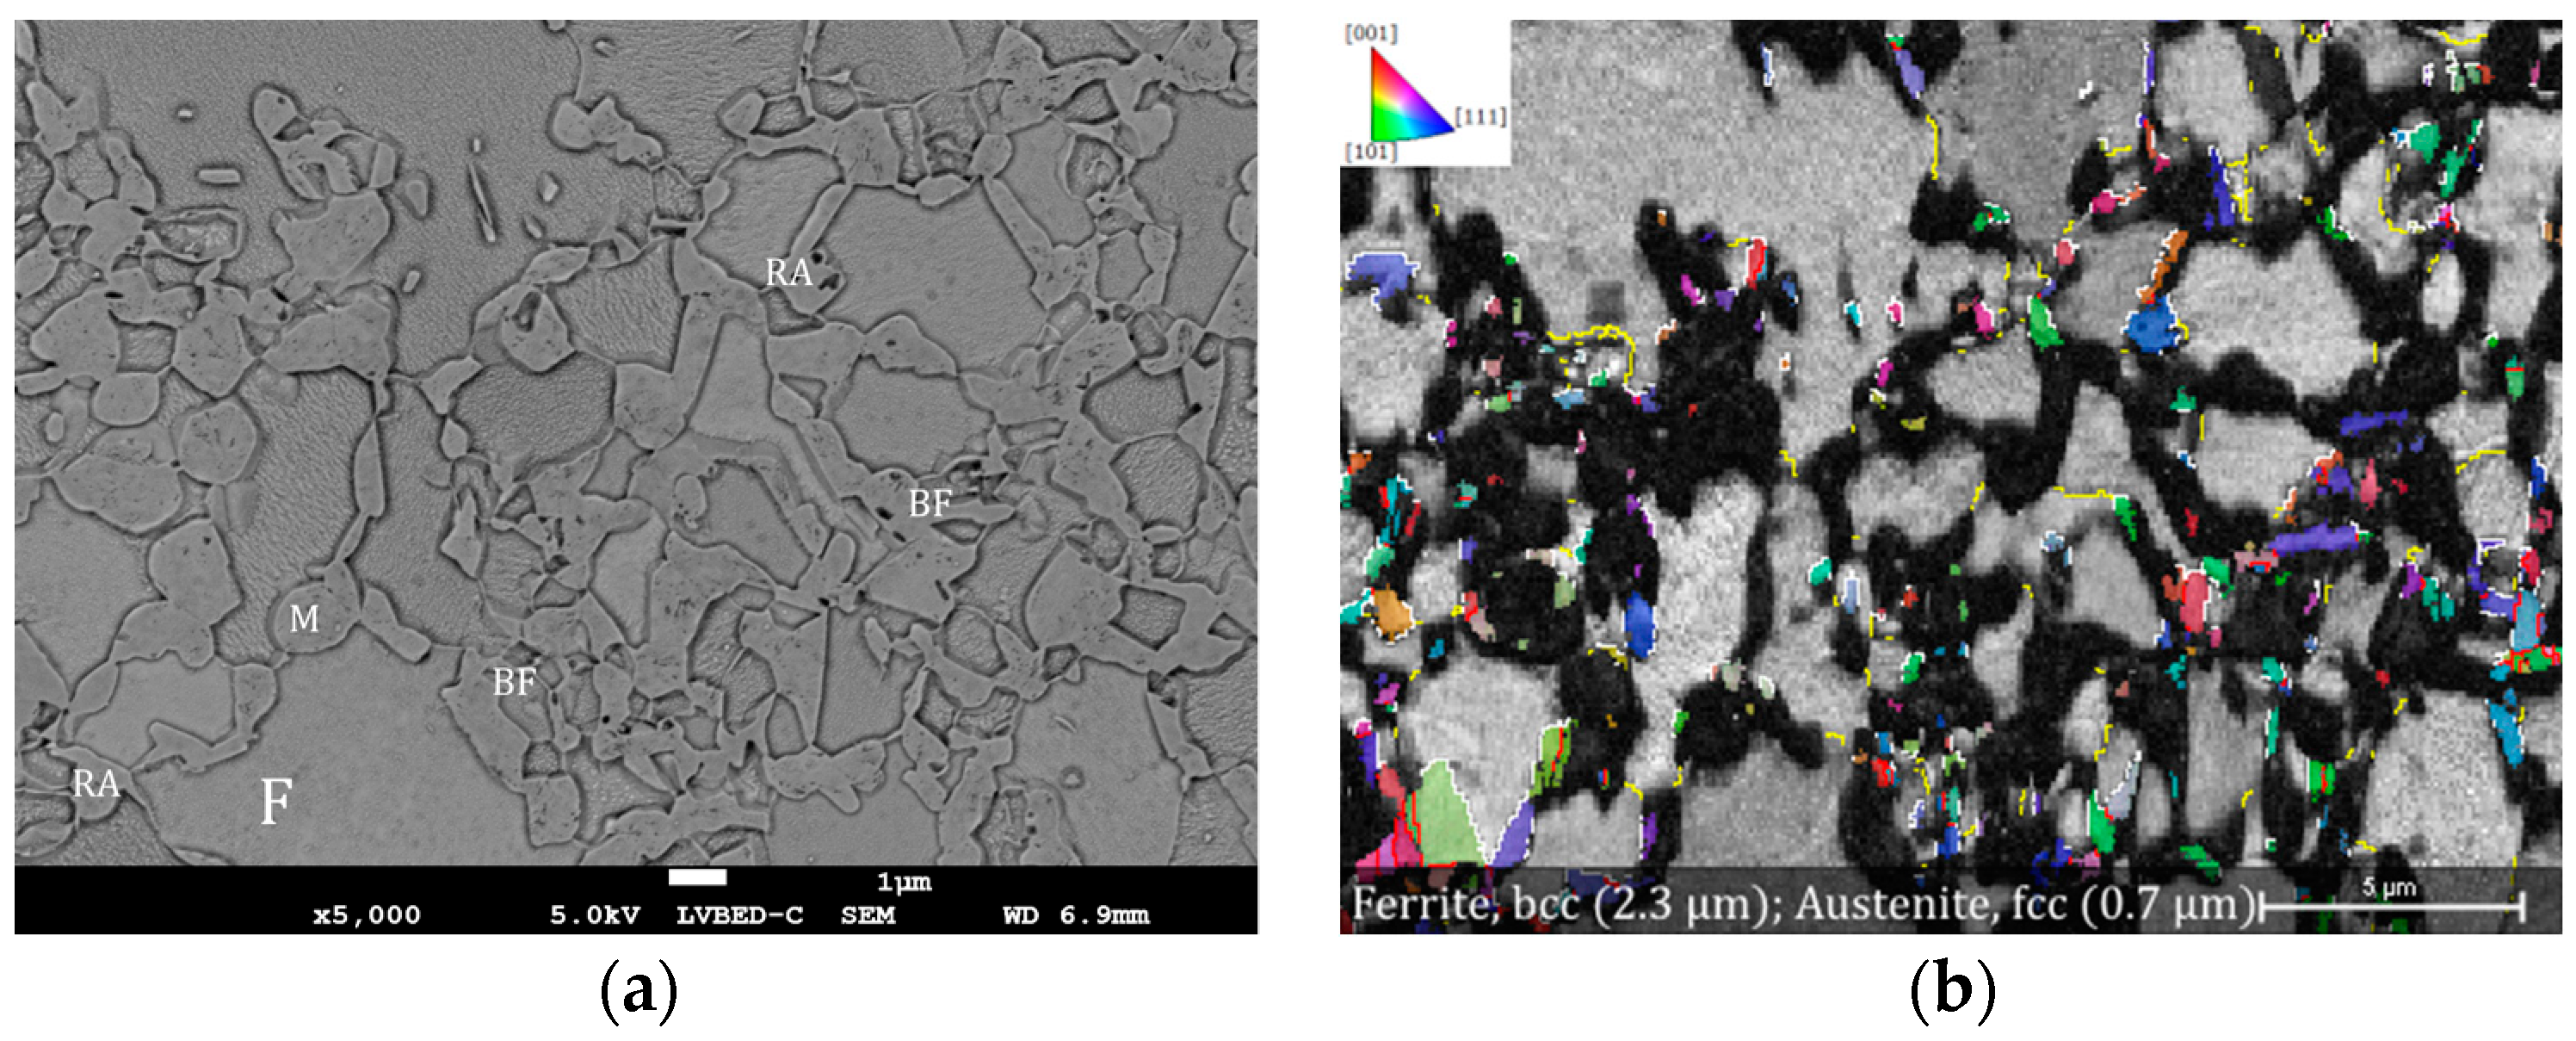
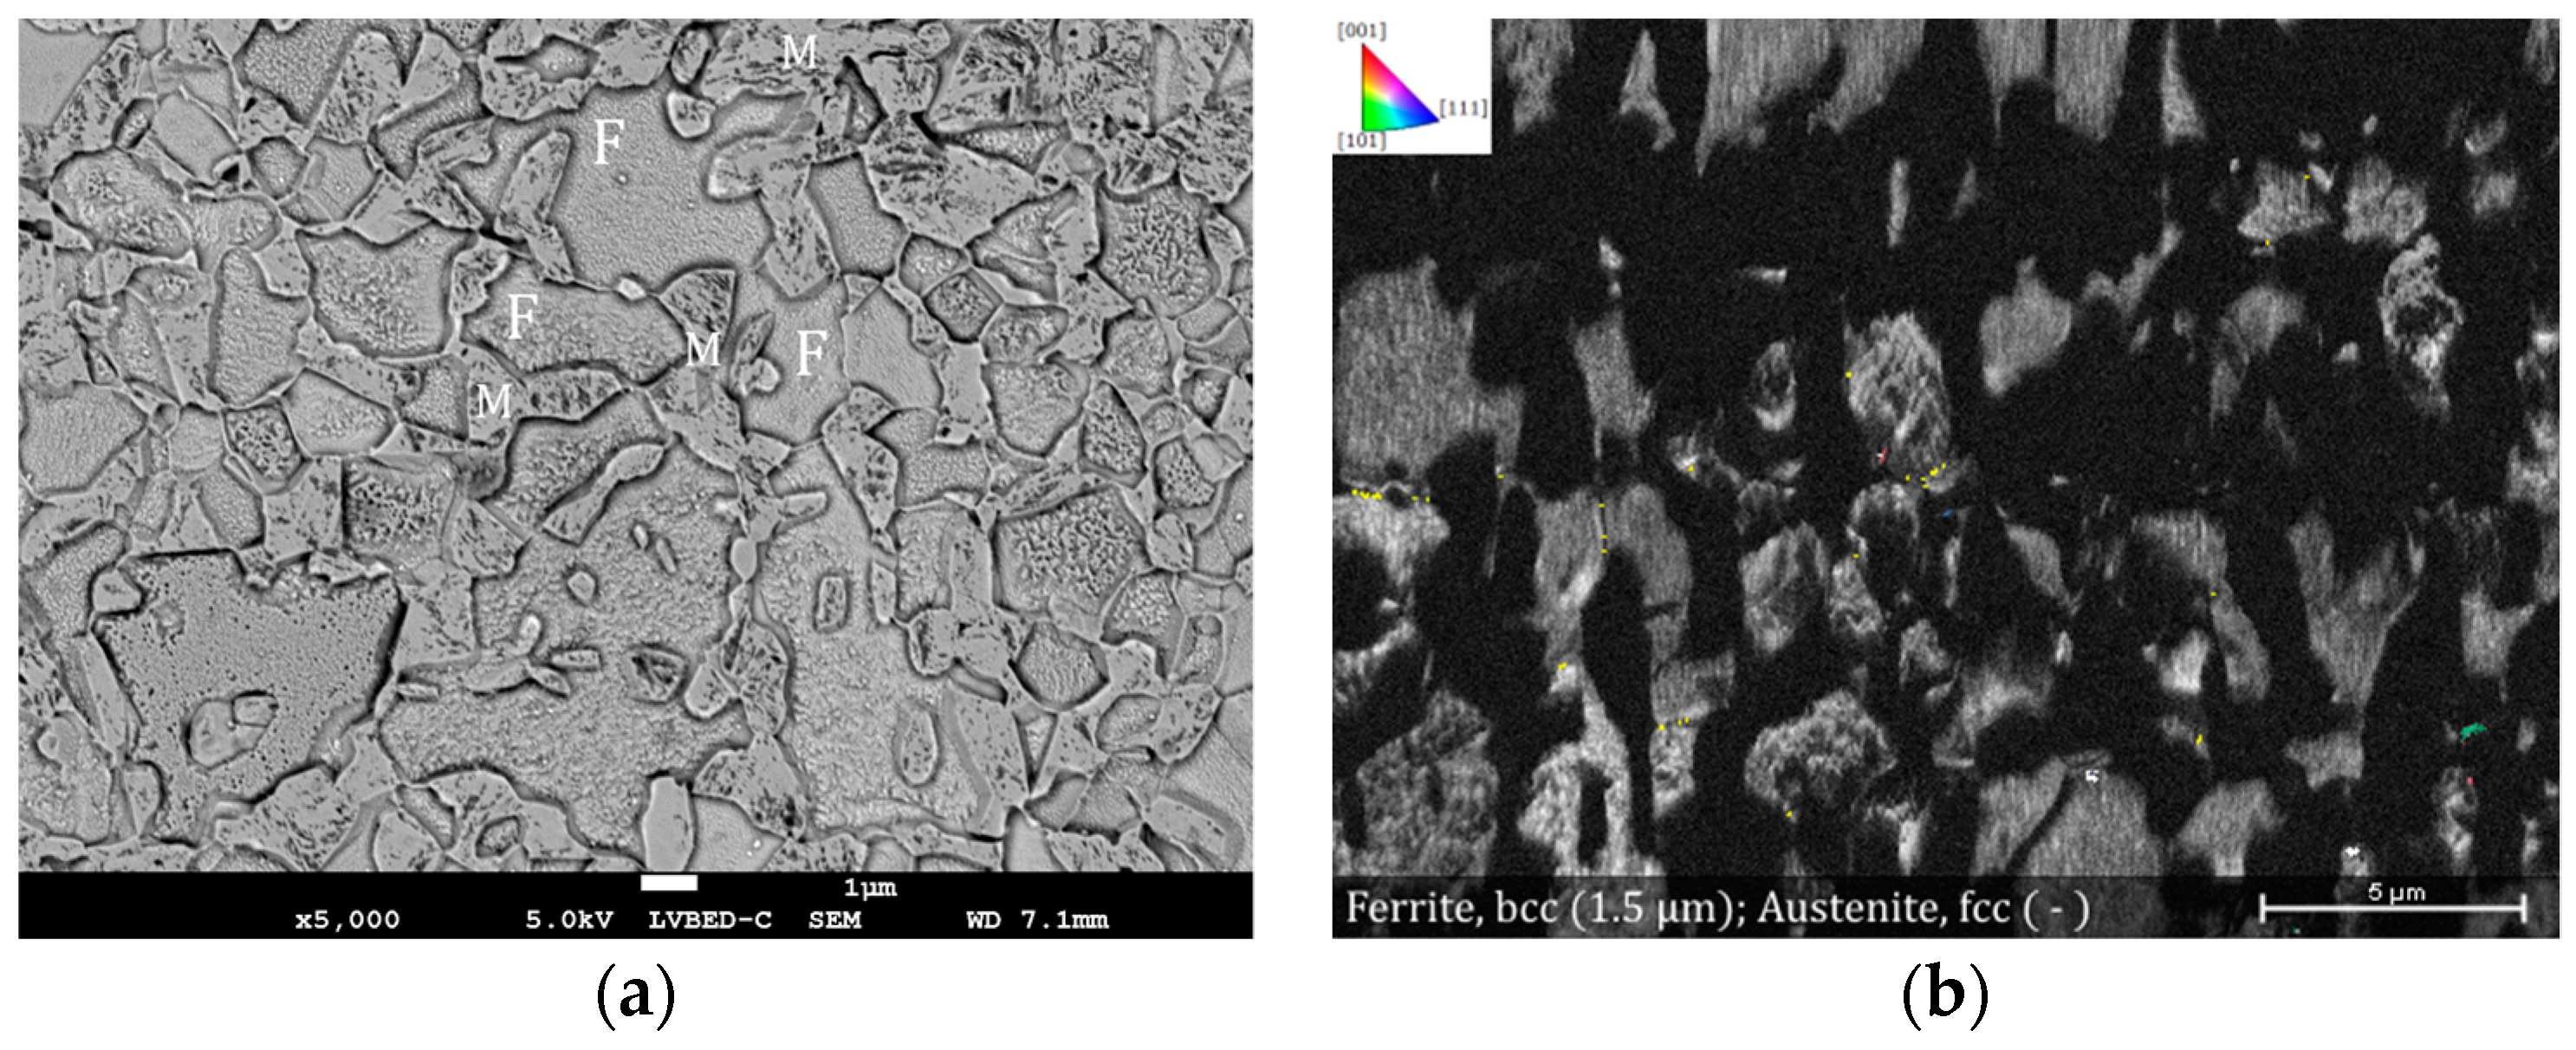
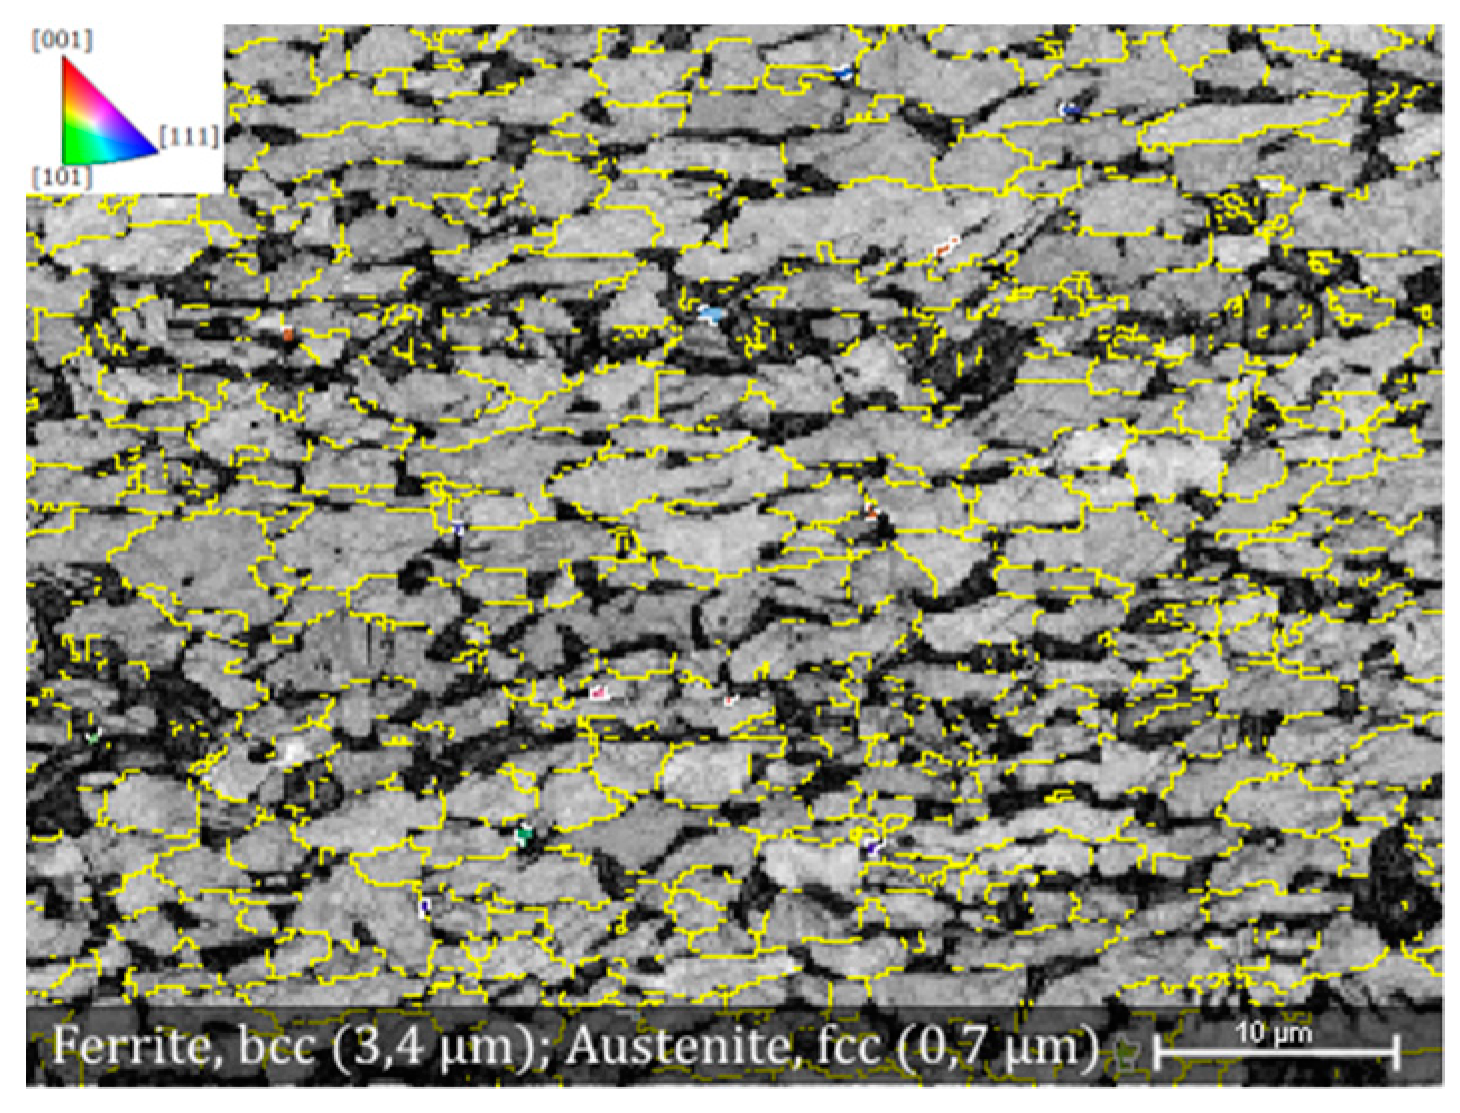
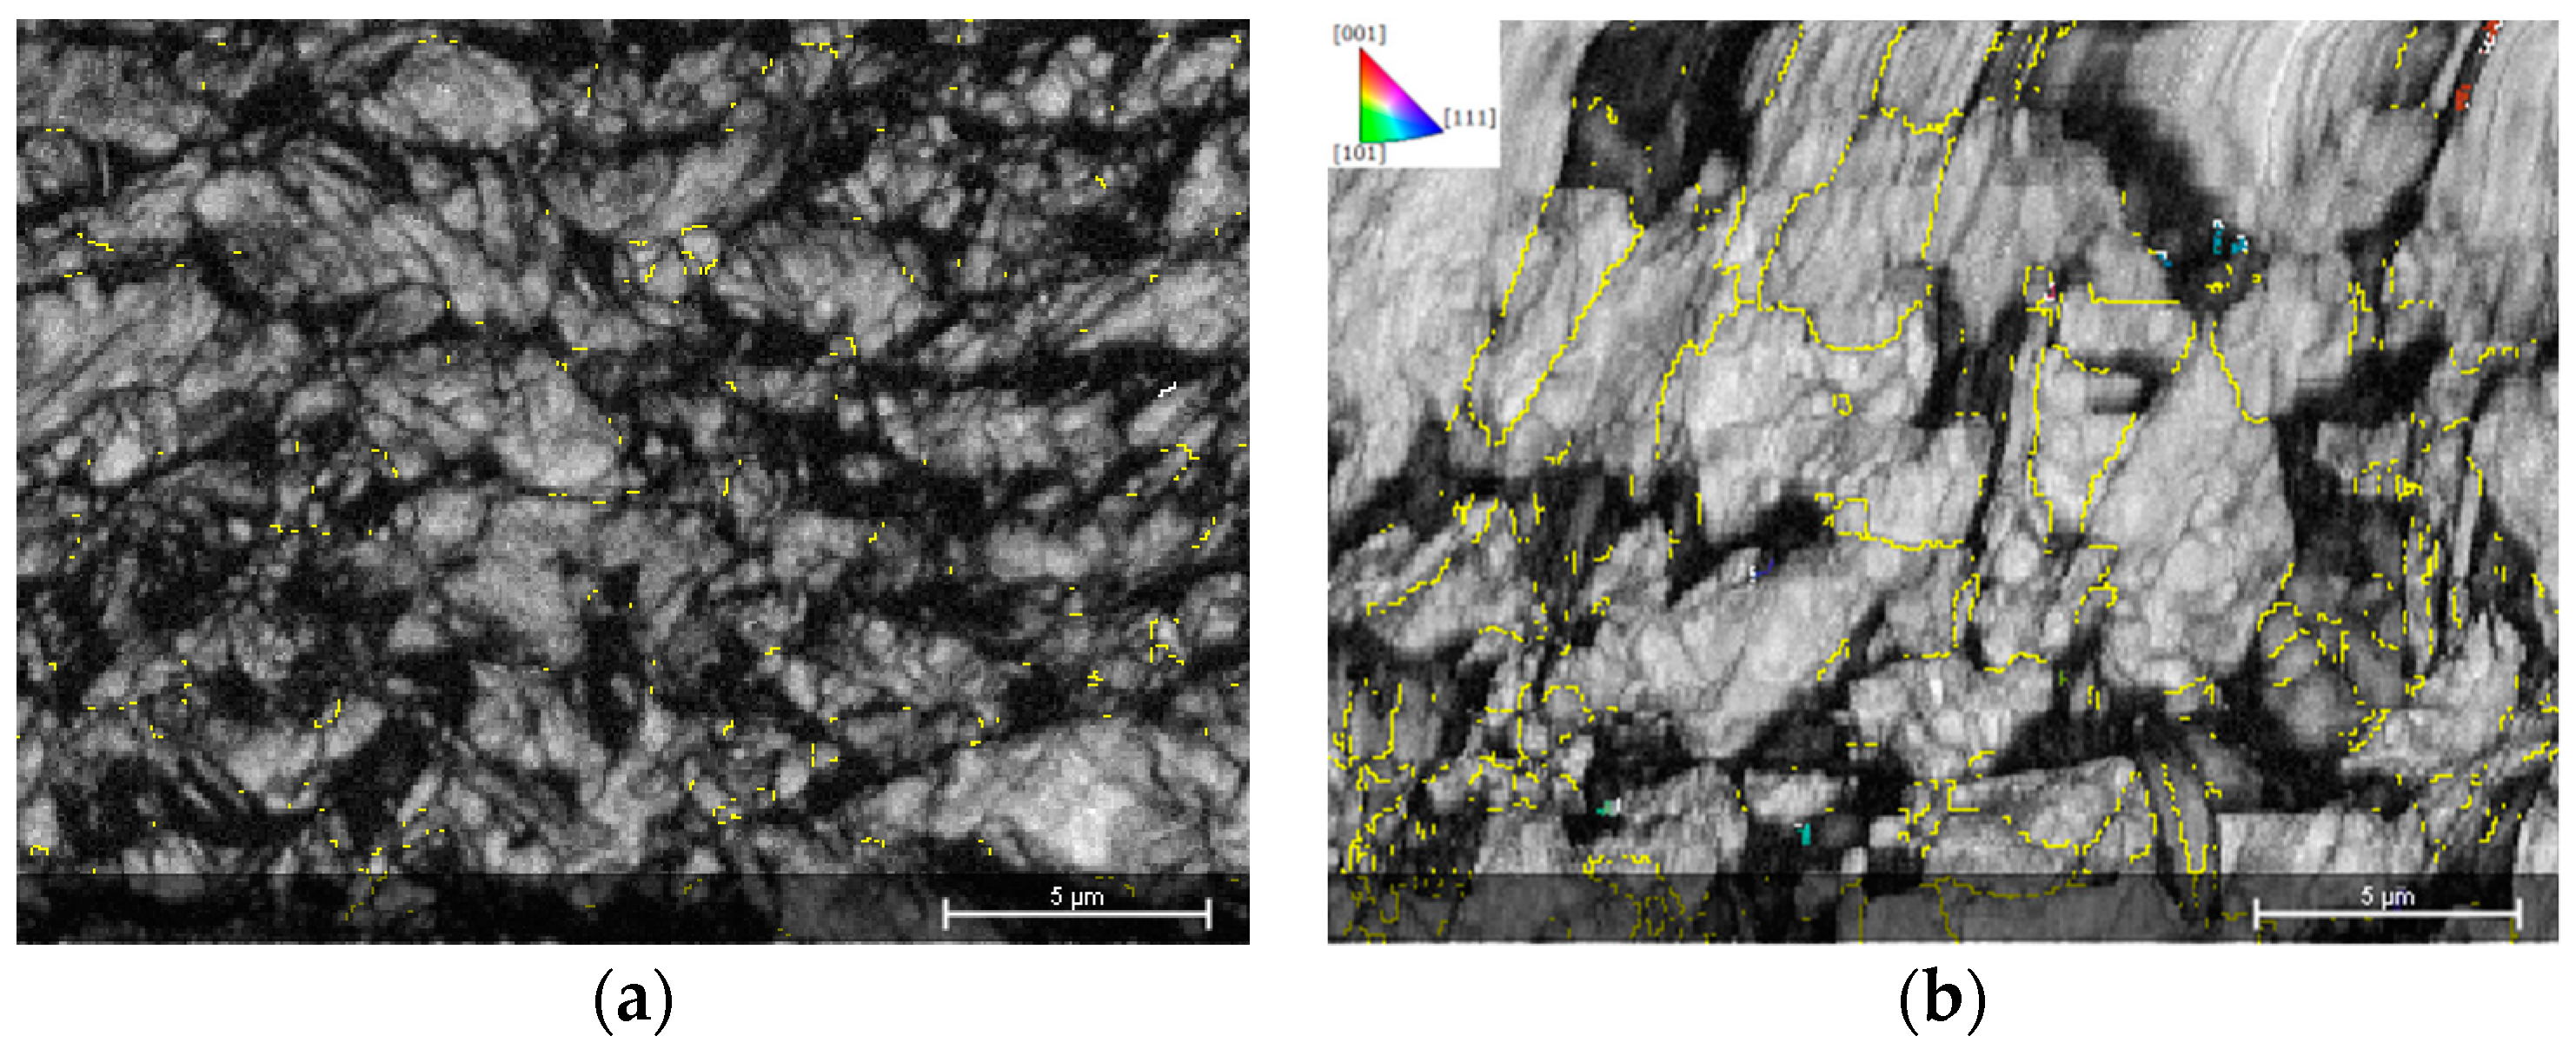
3.4.2. Microstructure and EBSD Investigations

Microstructural observations and EBSD phase measurements revealed that all the samples contained some amount of retained austenite, even though Steel D had considerably lower contents almost beyond the limit of detection. The microstructural observations were supported by the XRD measurements that there were significant differences in retained austenite volume fractions. However, the phase contents with EBSD can only be taken as indicative, because the relative magnification and location of the measurement have strong effect on the phase content.
EBSD data is presented using pattern quality maps (PQM) in which the austenite phase is displayed with inverse pole figure (IPF) orientation colouring. PQM is a typical EBSD data presentation mode, which depicts microstructural features, such as grain boundaries. Pattern quality parameter of each pixel is calculated using the information contained in the corresponding Kikuchi pattern, after which the information is formatted to grayscale image where the contrast varies between pixels. The largest differences in gray levels are given for different phases, for example, ferrite and austenite in this case. Blurred patterns, which are difficult to index using standard methods, are structures containing large amount of dislocations. In this investigation, that was mostly martensite which was not indexed. IPF colouring is displayed as orientation difference on macroscopic x axis. For example, grains oriented parallel to <111> axis will appear blue in the IPF X colouring. In the post-processing of the EBSD data using Esprit 2 microanalysis software (Bruker Nano GmbH, DE), the ferrite grain boundaries were coloured yellow, austenite-ferrite boundaries white, and austenite-austenite boundaries red. Figure 5 presents EBSD phase maps of austenite overlaid on PQM, and a comparison between the microstructures of Steel A (Figure 5a) and Steel B after the three different IBT temperatures. In addition to the phase maps, the average grain sizes (in µm) of ferrite (body-centered cubic, bcc) and austenite (face-centered cubic, fcc), which were calculated during post-processing of EBSD data, are overlaid on the micrographs.
The similarity of the microstructure in Steel A (Figure 5a) and Steel B was the strongest between IBT 420 (Figure 5b) or IBT 450 sample (Figure 5c), even though the retained austenite content of Steel A was higher. EBSD phase measurement yielded retained austenite content of 12% in Steel A, 4% in Steel B IBT 420, and 8% in Steel B IBT 450. The IBT temperature 480 °C of Steel B led to the highest amount of unindexed patterns, which indicated the presence of martensite and possible bainitic–ferrite (Figure 5d). This sample had 7% of retained austenite according to the EBSD phase mapping. The amount of bainitic–ferrite was not quantified.
EBSD analysis was used to investigate the location of the retained austenite grains in relation to other phases. Figure 6 presents an example of Steel C IBT 480 microstructure which reflects the appearance of retained austenite within the hard second phases, martensite and bainitic–ferrite. The latter is difficult to distinguish from the ferritic matrix and was most probably indexed as ferrite in the phase mapping. The martensite inside bainitic–ferrite grains was also unindexed, but retained austenite grains were indexed as austenite (fcc). However, the individual bainitic–ferrite grains could be identified from their sub-structure in SEM micrographs (Figure 6a) which contains retained austenite, martensite, and ferrite. Bainitic–ferrite appeared as similar sized grains compared to polygonal ferrite and was cementite free due to the carbide precipitation inhibiting alloying. Retained austenite appeared as individual and isolated grains lying on ferrite grain boundaries, thin grains adjacent to martensite islands, or laths inside bainitic–ferrite grains. Generally, austenite phase was found in adjacent to the secondary phases, but isolated grains also appeared. Smaller ferrite grain size compared to Steel A and B was detected from Steel C.
EBSD phase mapping of Steel D IBT 480 revealed that the steel contained approximately 30% ferrite and the rest were hard secondary phases and martensite. Low amount of retained austenite, below 1%, was found. Figure 7 presents the back-scatter electron micrograph and EBSD PQM map overlaid with austenite. Austenite content was negligible, and the microstructure contained mostly martensite islands on the grain boundaries of polygonal ferrite. In contrast to Steel C, bainitic–ferrite grains were not indentified from SEM micrograph (Figure 7a). The ferrite grain size was smallest of the investigated steels which indicates the highest austenitization during the intercritical annealing.
Retained austenite stability was evaluated from selected specimen. Steel A and Steel C IBT 450 tensile test samples were prepared using ion-milling after which the cross-sections were mapped with EBSD. Figure 8 presents the EBSD PQM map of the undeformed microstructure at 9 mm from the tensile test specimen fracture tip of Steel C IBT 450 specimen. Austenite (fcc) content according to EBSD phase mapping of the microstructure was 3%.
Figure 9 presents the EBSD PQM phase maps of Steel A and Steel C IBT 450 at the fracture tip of the tensile test specimen. The retained austenite in Steel A had completely transformed into martensite as 0% of austenite (fcc) was detected (Figure 9a). In Steel C IBT 450, however, minuscule amount (0.2%) of smaller retained austenite grains were left untransformed (Figure 9b).

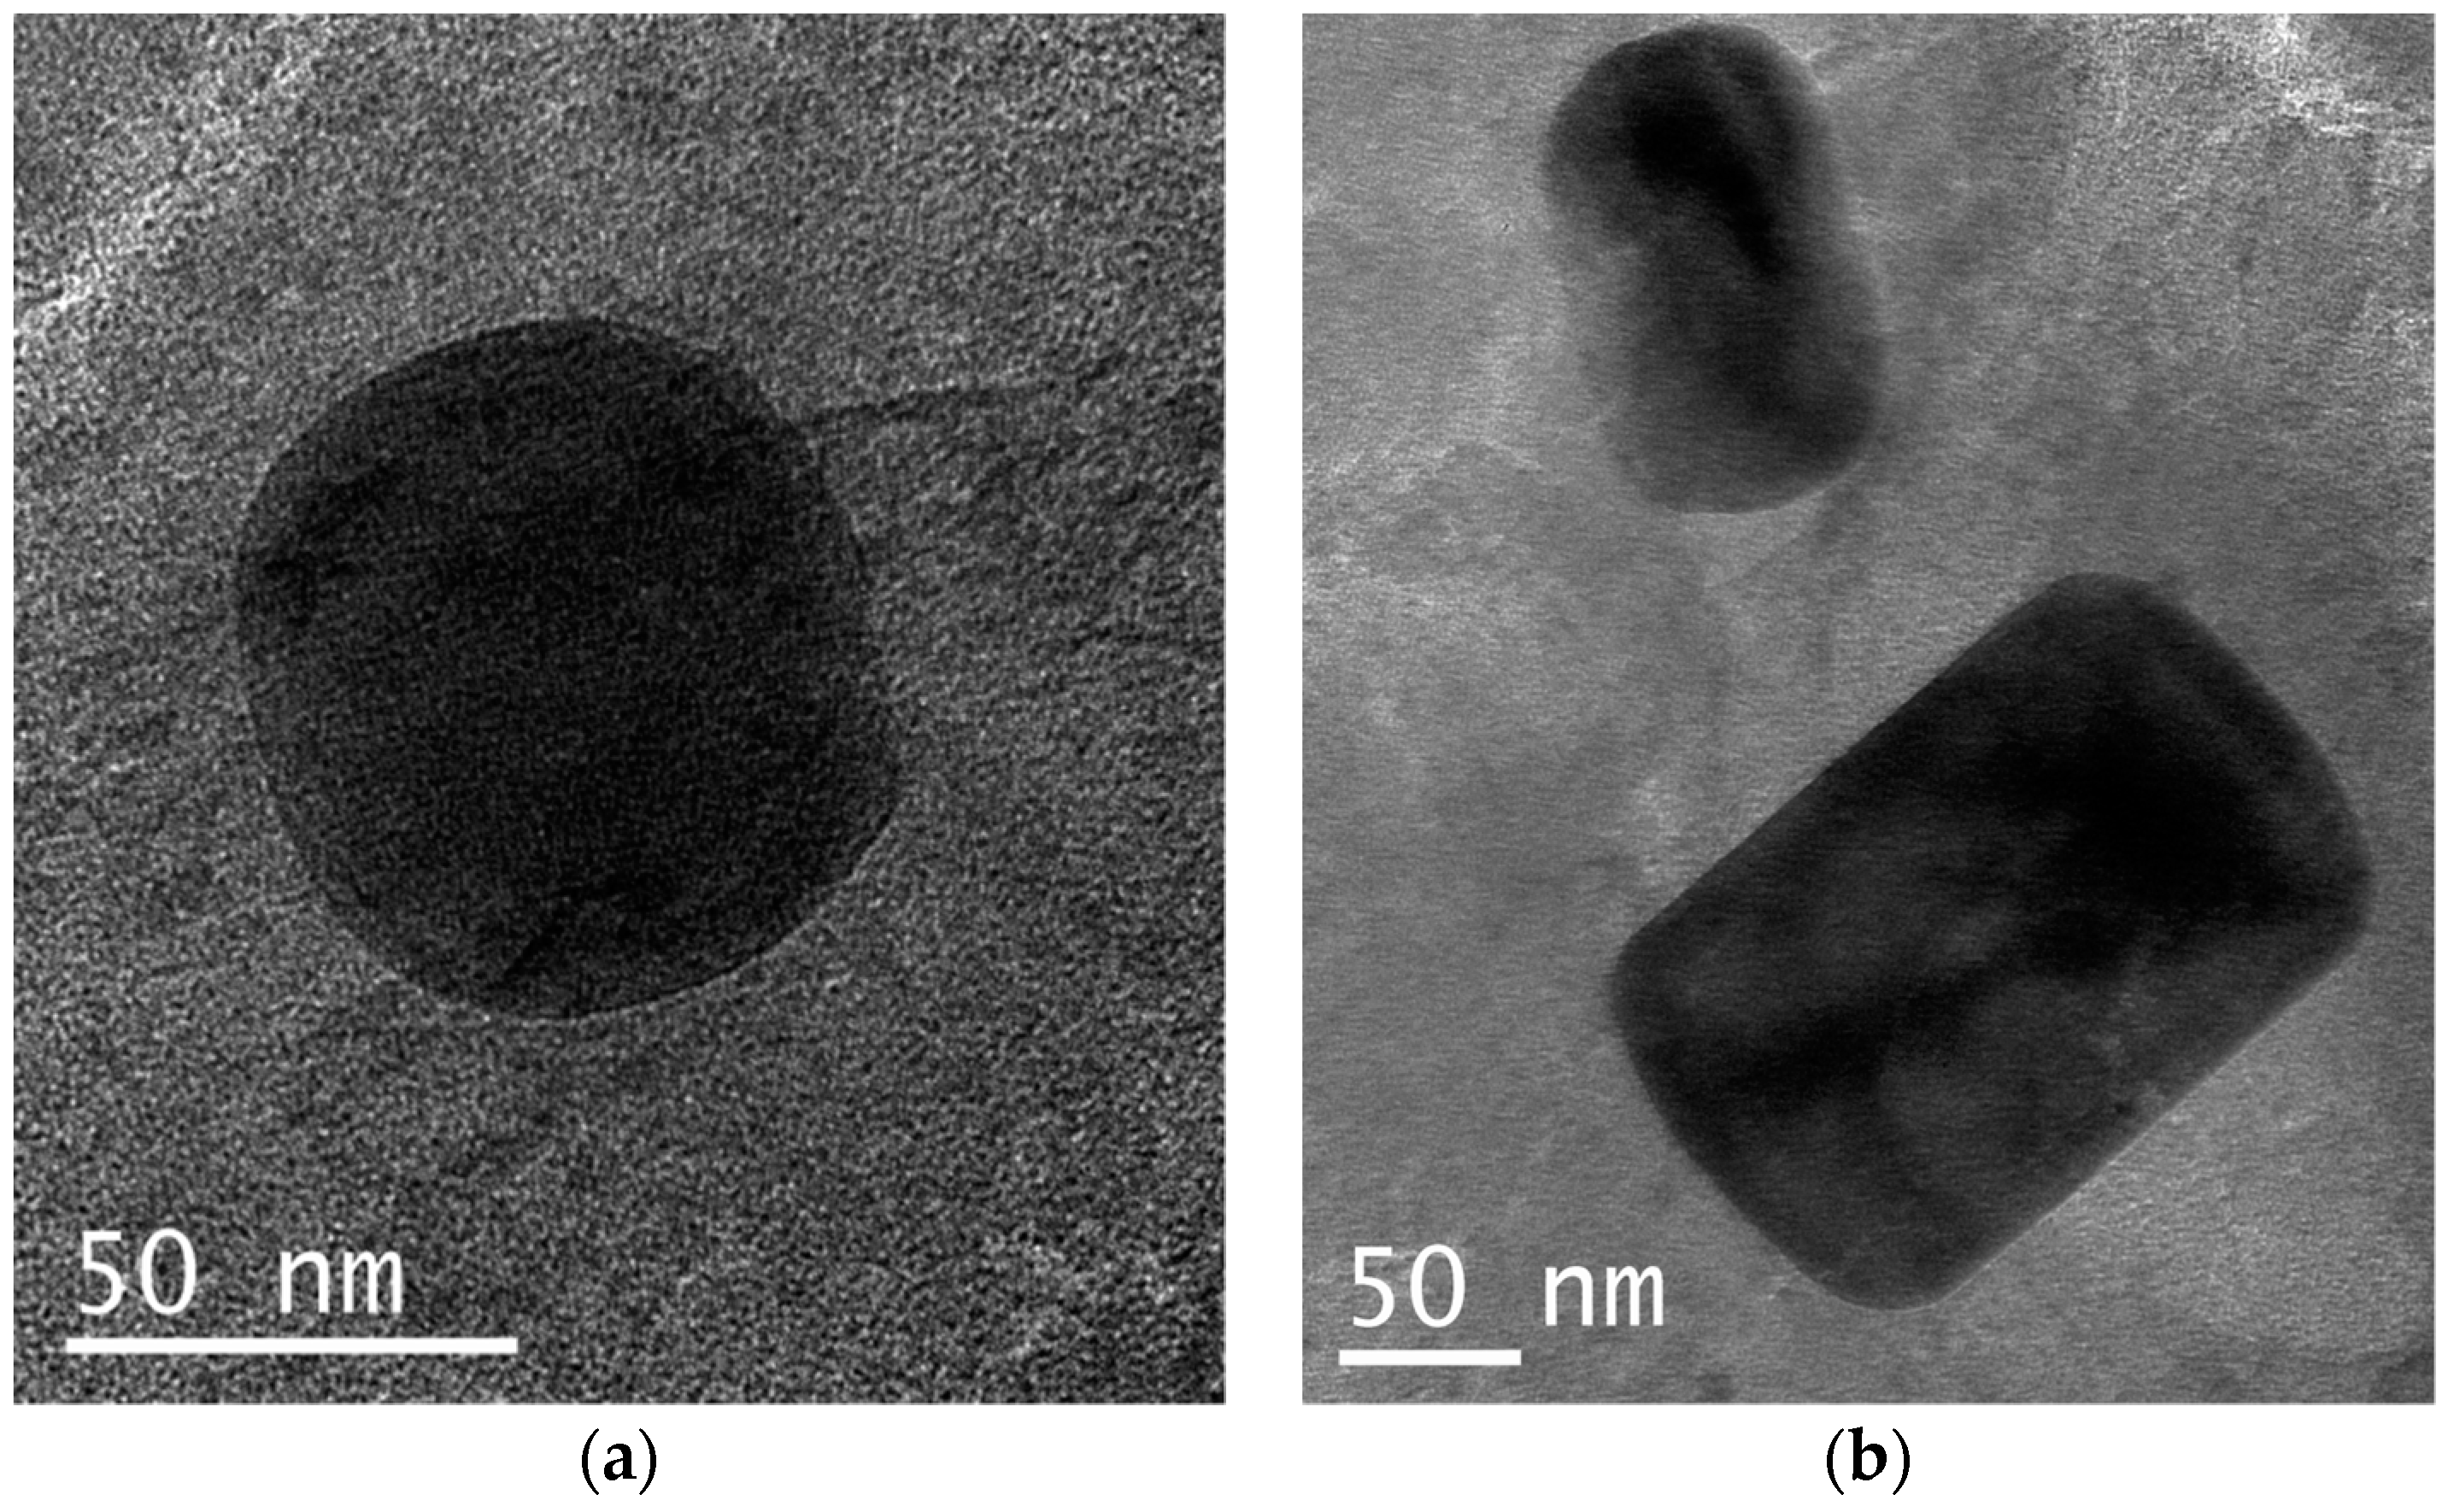
3.5. Precipitation of Microalloying Elements

Carbon replica samples prepared from Steels B, C, and D were studied using TEM and the precipitates in these samples were analysed using EDS. EDS analysis indicated the presence of Ti(Nb,Mo)C and Ti(Nb)N in Steel B, which was the Ti microalloyed steel without Nb or V. The presence of Nb in the precipitates illustrates the powerful precipitation tendency of Nb even in low concentrations. Figure 10a presents a carbon replica TEM micrograph of this type of precipitate which had spherical morphology.
EDS analysis of the precipitates in Steels C and D indicated that they were complex carbide and carbonitride precipitates of Ti(Nb)N, Nb(Ti,V,Mo)C, and V(Ti,Nb,Mo)C. For example, Nb microalloyed Steel C contained 100 nm Ti(Nb)N and 50 nm Nb(Mo)C. TEM micrograph of the carbon replica sample is presented in Figure 10b.
Steel D contained 50–100 nm Ti(Nb)N precipitates identified using EDS similarly to Steels B and C. Steel D also contained VC particles. Compared to NbC, the spherical VC precipitates were smaller with their approximate size below 30 nm. It is possible that NbC particles were formed during hot rolling process, while VC, due to their higher solubility, were secondary precipitates formed during intercritical annealing.

4. Discussion

4.1. The Effect of Retained Austenite on Mechanical Properties

Mechanical test results displayed the possibility to produce 980 MPa strength level retained austenite containing TRIP-assisted steel which has comparable elongation properties with industrially produced TRIP 800 steel. By examining the retained austenite properties, the mechanical properties can be projected to the individual heat treatments of the experimental samples. The industrial reference steel, Steel A, demonstrated behaviour typical to TRIP-assisted DP steel [8] in which strain hardening was increased by the retained austenite, but its stability not enough to distribute the phase transformation across the entire stress–strain curve. Much like in DP steels, the initial strain hardening was comparatively high (Figure 2b), but it gradually decreased with the increasing strain. Also, the yield ratio was at a rather low level, because of the considerable amount of ferrite in the steel matrix effectively lowered yield strength, while strain hardening increased both the elongation and ultimate tensile strength. This behaviour can be seen as an effect of fast cooling from the intercritical annealing temperature to room temperature.
In contrast, the experimental Steels B, C, and D, which were isothermally transformed at the holding temperature, possessed increased stability of retained austenite leading to enhanced elongation behaviour at their higher strength. Especially Steel C presented a beneficial combination of strain hardening and elongation capacity even though it had lower retained austenite content compared to A and B. Because the retained austenite carbon content of Steel C was slightly lower compared to Steel A or B, the stability of retained austenite during straining probably emanates more from mechanical stability rather chemical stability. The first mentioned is the effect of grain morphology, while the latter is the effect of carbon content. Retained austenite carbon contents were calculated according to equation by Holmes and Dyson [40], which takes to an account the effect of aluminium alloying on the austenite lattice. The results were in line with the findings of Krizan et al. on TRIP 980 steel, but lower than in Mo and Nb microalloyed steels the investigation by Wang et al. [3,5]. The difference between the retained austenite contents of the present study and earlier reports is possibly due to the difference in isothermal bainitic transformation times, which were longer, 360 s and 180 s, respectively, in contrast to 100 s in the present study. The diffusion controlled enrichment of carbon into to the adjacent austenite might have had insufficient time leading to lower carbon content [19].
Strain hardening behaviour of traditional Al-alloyed TRIP steel [18] was not observed in Steels B, C, and D either. All the test samples had a pronounced strain hardening capacity: the lower n values (at strain 4–6%) were higher than the upper n values (at strain 10–20%/Ag). Thus, the strain hardening effect of retained austenite transformation to martensite, if there were retained austenite present, was almost depleted in the beginning of tensile test and less was available to increase the necking on-set and uniform elongation. The traditional TRIP behaviour would be detected as uniformly distributed strain hardening when the progressive transformation of retained austenite takes place. This means the gradual generation of dislocations during strain hardening which leads to sustaining the strain hardening across the stress–strain curve [4].
Retained austenite measurements of experimental Steel B indicated the similar phenomenon which was reported by Wang et al. [3]. The highest retained austenite contents, which also had the highest retained austenite carbon content, were found at 450 °C IBT temperature. Higher IBT, 480 °C in the present study, led to smaller retained austenite content and lower uniform elongations. In addition to this analogy, Steel C had the desired strength–elongation combination also at lower retained austenite content reflecting the strain hardening capacity of retained austenite due to its enhanced stability.
Steel D did not contain any significant amount of retained austenite according to the XRD measurements and microstructural investigations. These observations were supported by the mechanical test results which yielded lower elongations values compared to the other investigated steels. The ductility increasing effect of retained austenite was not observed in the mechanical testing. This observation of negligible amount of retained austenite, however, contradicts the finding by Krizan et al. who reported a considerable amount (15.2 vol. %) of retained austenite in a similar type of steel [5]. They used higher Mn content (2.26 wt. %) which might have supported austenite stabilization in contrast to the present study. On the other hand, the average mechanical properties of Steel D were similar to Nb and V microalloyed TRIP 980 steel in the study by Krizan et al. where uniform elongation of 12.4% and tensile strength 1004 MPa were reported [5].
Microstructural investigation using FESEM-EBSD revealed that IBT 420 °C had finer grained structure, whereas the highest temperature, IBT 480 °C, produced even finer retained austenite scattered inside martensite islands. EBSD phase mapping showed also increased amount of martensite in the case of IBT 480. The latter, not being the desirable microstructure in these steels, led into undesirable mechanical properties. Krizan et al. postulated that retained austenite thin-films existing along martensite or bainite lath boundary, and blocky-type retained austenite inside secondary phases, would create higher hydrostatic pressure from the surrounding microstructure leading into constraints of volume expansion and shear deformation accompanied with strain-induced martensite transformation [21]. EBSD phase mappings of the tensile test specimen presented indications that the stability of the smaller austenite grains in Steel C was higher compared to Steel A (Figure 9). Steel A contained 0% austenite, whereas Steel C IBT 450 contained 0.2% austenite after tensile test. The result, however, was from individual tensile test specimen which means that retained austenite stability was not thoroughly investigated in the present study. Additional investigations of retained austenite morphology and stability will be useful.
The highest IBT temperature led to the highest amount of secondary hard phases, martensite and bainitic–ferrite, in the final microstructure. When aspiring to the best possible strength–elongation combination, this clearly was not the desired temperature. Compared to the earlier studies [3], this temperature region did not produce the suitable combination of phases and microstructural constituents. One might argue that the upper part of bainitic transformation region produces more of complex phase type of microstructure rather than the TRIP-assisted type.

4.2. Effect of Microalloying Elements on Mechanical Properties

Microalloying additions presented a noticeable effect on the microstructure and properties of the investigated steels. Similar alloying effects of Nb were previously reported [5] and concluded to have a beneficial effect on the mechanical properties. The same trend was found in the present study when Steels A and B were compared to Steel C. Based on the microstructural investigations, the effect was largely due to the grain size growth inhibiting effect of Nb with only a minor effect of precipitation hardening. This conclusion was made from investigations using electron microscopy. EBSD investigations revealed that the average ferrite grain size of Steel C was below 4 µm, while Steel B had an average ferrite grain size of 7 µm. Average retained austenite grain size was 1.0 µm in both Steel B and Steel C, while Steel A had average retained austenite grain size 1.6 µm. Microalloying carbides effectively pin the ferrite and austenite grain boundaries during the intercritical annealing, thus inhibiting the grain coarsening. When the ferrite grains are refined, also the secondary phases, martensite and retained austenite are refined.
TEM-EDS investigations showed that precipitates were mostly fine and dispersive Ti(Nb,Mo)C complex carbides. The strong precipitation tendency of Nb, and the so-called coring effect [29] was observed in Steel B (Figure 10a). This steel had Ti microalloying and only residual Nb and V, yet the precipitates contained Nb, which demonstrated the effective precipitation tendency of Nb. The typical precipitates had TiN core and Nb outer layer which suggests that the primary nitride had acted as a nucleation centre for the secondary precipitate.
In Steel C, it is probable that NbC particles were primary precipitates inherited from the hot rolling process and not formed during annealing due to their higher dissolving temperature. VC precipitates in Steel D were most probably already in solution at lower temperature, because of the higher solubility of vanadium. This conclusion was supported by the observation of the particle sizes and qualitative analysis using EDS, because Steel D contained relatively large 50–100 nm Ti and Nb containing precipitates, while VC precipitates were smaller with their approximate size below 30 nm. Similar findings were reported earlier [41]. The precipitation amount, however, were not quantified or statistical analysis performed in the present study, so further TEM investigations will be useful.
Mechanical test results indicated that the effect of V microalloying might not been utilized to its fullest in the case of Steel D. As reported earlier [29], the strengthening potential of V may be used at higher N contents, above 0.010 wt. %, in the steel, whereas 0.0045 wt. % in the present study would not have been sufficient. The tensile strength properties of Nb and V microalloyed experimental steels, Steels C and D, were approximately at the same level, but the strengthening in V microalloyed steel had happened on the cost of elongation properties. Microalloying by V also led to lower retained austenite contents. The microalloying carbides, especially VC, might have depleted free carbon which would otherwise have been stabilizing the retained austenite.
The grain refinement effect of V was, however, observed similar to Steel B. The slightly higher yield ratio of the V microalloyed steel could be the result of precipitation hardening effect of the nano-sized particles inside ferrite grains. Effect similar to this was recently reported in the investigation of V microalloyed DP steels [42]. However, tensile test results were only a result of individual samples, so further studies would aid on more reliable conclusions on the subject.

4.3. Formability

The effect of IBT temperature on the local and global formability was evaluated using true thickness strain at fracture diagram, which was earlier reported to be suitable classification type for high-strength multiphase steels [35]. Figure 11 presents an evaluation of the formability types of the investigated steels, where Steel A and Steel C IBT 450 demonstrated the best balanced local/global formability. These balanced properties can be seen as a combination of bendability and hole expansion capacity. The general trend was that the highest IBT temperature, 480 °C, steered the properties towards CP type of steel and local formability, while the intermediate temperature, 450 °C, produced more of DP type of steel and global formability. Exceptions in this trend were Steel C IBT 450 and Steel D IBT 450. The aim for the balanced properties, according to these results, would be IBT 420 or 450 °C.
The formability evaluation using the true thickness strain at fracture and true uniform elongation values should be considered in the context of the investigated steels in this study. Wagner et al. reported that sample size and geometry have a noticeable effect on the results [38]. Especially, it is advisable that width-to-thickness ratio of the sample is large enough to produce a shear fracture across the specimen width. Investigated steels, in the present study, all had fracture surfaces similar to CP1200 steel in the study by Wagner et al. This would propose that fracture measurements in the present study were comparable with each other even though universal comparison to other reports might not be feasible.
In addition to the formability evaluation, the difference of elongation between the steel types of local and global formability is typically larger than the values measured in this investigation. Heibel et al. reported that there was a difference of 0.04 in ε3f and 0.10 in true uniform elongation between high-formability dual-phase 800 MPa strength grade and 1000 MPa grade CP steels [35]. As it was observed from the microstructures, all the steels in the present study were more or less dual-phase type steel with varying amounts of retained austenite and hard phases in the ferritic steel matrix. This would lead to propose that all of them have DP steel type of fracture mechanism and global-type of formability. However, the differences between samples were clear enough to propose the ranking between them, and to consider differences between the thermal cycles used. Clearly, the samples, which had the lowest retained austenite content and contained the most amount of high-strength microstructure, differed from the other two groups. The outlier, however, was the Steel C IBT 450 sample, which had comparable elongation properties to Steel A, even though its retained austenite content was considerably lower.
It was evident that retained austenite grain size influenced the elongation properties of the steels. Steel A had larger block-like retained austenite, while steels B and C contained thinner and smaller austenite grains. Even though Steels B and C did not surpass the properties of Steel A, their balanced local/global formability was near to the lower strength reference steel. It was concluded that the effective phenomenon was grain refinement which increases local formability with the simultaneous strengthening [35].

5. Conclusions

The intercritical annealing response of four TRIP-assisted Si + Al alloyed steels was investigated in this study. Three of them were microalloyed laboratory experimental steels subjected to additional isothermal bainitic transformation holding steps in various temperatures. Industrially produced hot-dip galvanised TRIP 800 steel was studied as a reference material. The following conclusions were drawn from the findings:
  • The grain size controlling effect of Nb was stronger than the effect of V. Smaller grain size led into increased elongation and ductility values.
  • The effect of microalloying elements was seen mainly as grain size controlling effect. However, the results also suggested that V microalloying may have contributed as a precipitation hardening element.
  • Isothermal bainitic holding at 450 °C led to the highest UTS × TEL values.
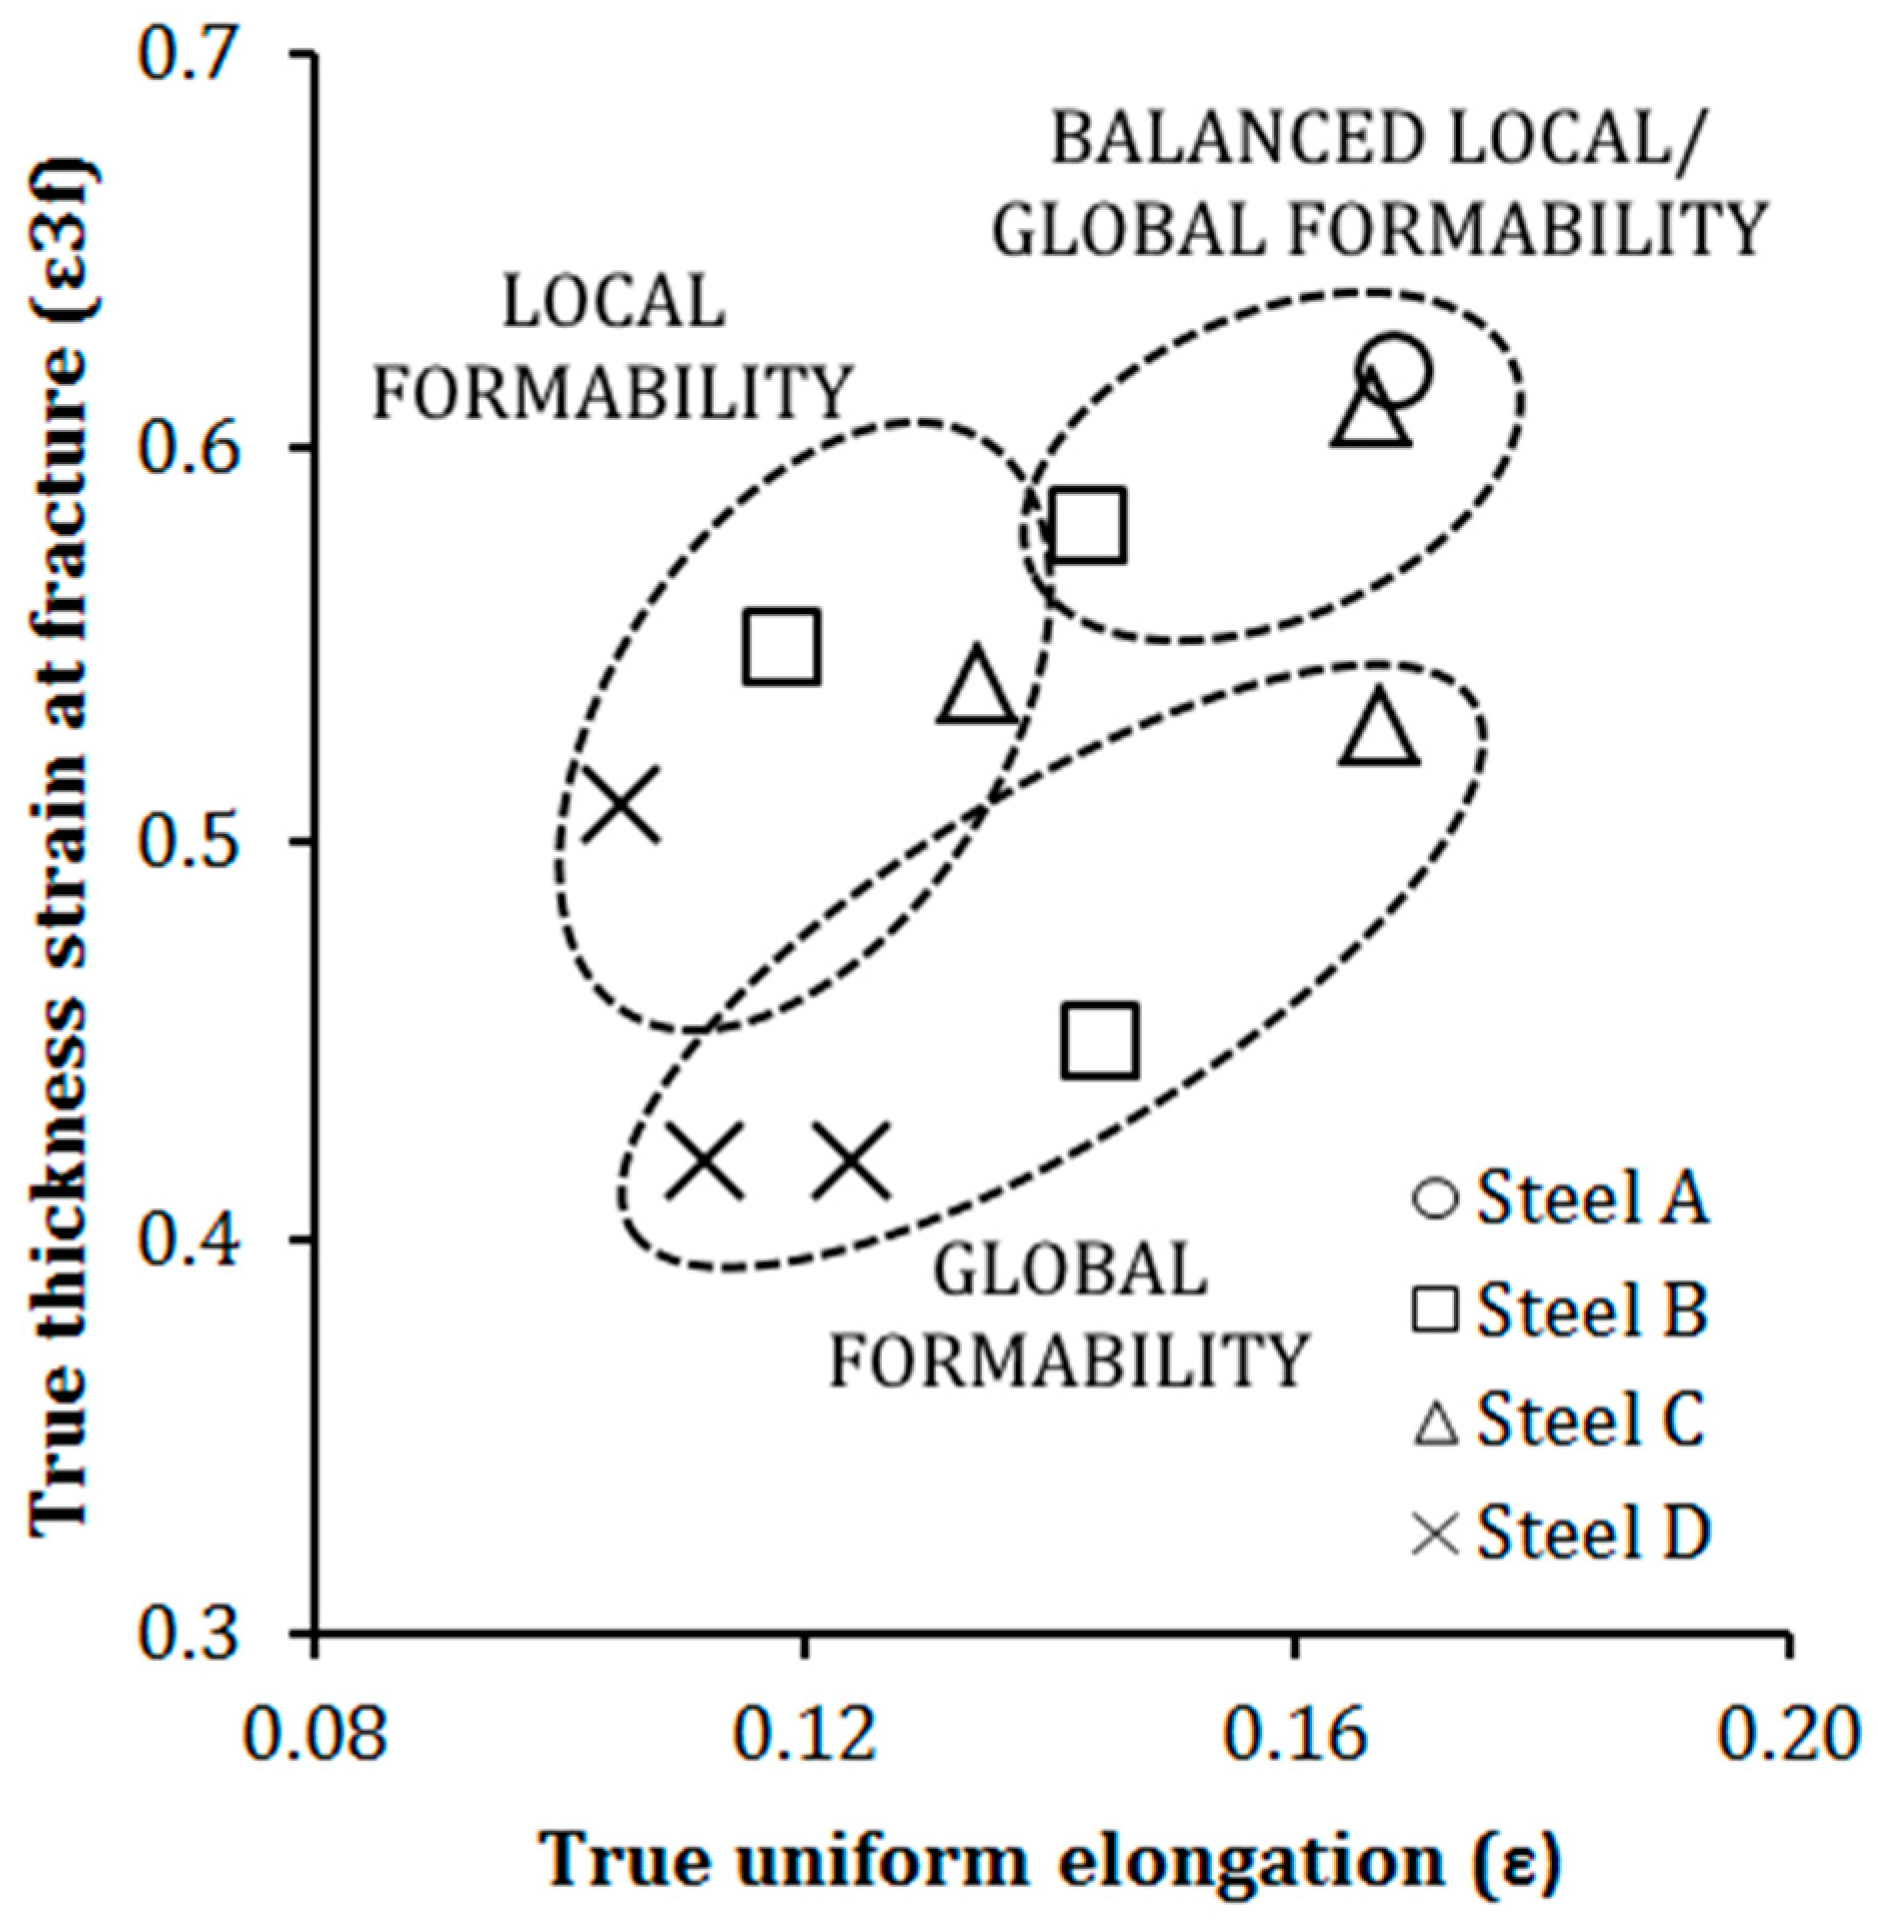
  • True fracture strain values, which were used to evaluate the formability of the investigated steels, had the preferable values after an IBT temperature of 420 or 450 °C. These values were at the balanced local/global formability region of the diagram.
  • The use of microalloying elements Nb and V lowered the retained austenite content of the steels. The highest retained austenite volume was found from Steel A and the second highest from Steel B after an IBT temperature of 450 °C.
  • By implementing the IBT and adding microalloying elements, the relative formability properties of 980 MPa grade steel can be raised on the similar level compared to TRIP 800 steel.

Author Contributions

Conceptualization, O.O., P.P., and M.J.; methodology, O.O.; software, O.O.; validation, O.O., P.P., A.S., and M.P.; data curation, O.O., A.S., M.P., and M.H.; writing—original draft preparation, O.O.; writing—review and editing, O.O., A.S, M.P., M.H., P.P., and M.J.; visualization, O.O.; supervision, P.P.; project administration, O.O., M.J.; funding acquisition, O.O., P.P., and M.J.

Funding

This research was supported by Business Finland (Intelligent Steel Applications).

Acknowledgments

This work utilized the Tampere Microscopy Center facilities at Tampere University (Finland). Authors wish to acknowledge the expertise of the personnel in the University of Oulu and Swerim, which made the investigation possible.

Conflicts of Interest

The authors declare no conflict of interest.

References

  1. Jacques, P.J.; Girault, E.; Mertens, A.; Verlinden, B.; Van Humbeeck, J.; Delannay, F. The developments of cold-rolled TRIP-assisted multiphase steels. Al-alloyed TRIP-assisted multiphase steels. ISIJ Int. 2001, 41, 1068–1074. [Google Scholar] [CrossRef]
  2. Matsumura, O.; Sakuma, Y.; Takechi, H. Enhancement of elongation by retained austenite in intercritical annealed 0.4C-1.5Si-0.8Mn steel. Trans. Iron Steel Inst. Jpn. 1987, 27, 570–579. [Google Scholar] [CrossRef]
  3. Wang, C.; Ding, H.; Tang, Z.Y.; Zhang, J. Effect of isothermal bainitic processing on microstructures and mechanical properties of novel Mo and Nb microalloyed TRIP steel. Ironmak. Steelmak. 2015, 42, 9–16. [Google Scholar] [CrossRef]
  4. Girault, E.; Mertens, A.; Jacques, P.; Houbaert, Y.; Verlinden, B.; Van Humbeeck, J. Comparison of the effects of silicon and aluminium on the tensile behaviour of multiphase TRIP-assisted steels. Scr. Mater. 2001, 44, 885–892. [Google Scholar] [CrossRef]
  5. Krizan, D.; Spiradek-Hahn, K.; Pichler, A. Relationship between microstructure and mechanical properties in Nb-V microalloyed TRIP steel. Mater. Sci. Technol. 2015, 31, 661–668. [Google Scholar] [CrossRef]
  6. Bhattacharyya, T.; Singh, S.B.; Das, S.; Haldar, A.; Bhattacharjee, D. Development and characterisation of C–Mn–Al–Si–Nb TRIP aided steel. Mater. Sci. Eng. A 2011, 528, 2394–2400. [Google Scholar] [CrossRef]
  7. Zhu, R.; Li, S.; Song, M.; Karaman, I.; Arroyave, R. Phase constitution effect on the ductility of low alloy multiphase transformation induced plasticity steels. Mater. Sci. Eng. A 2013, 569, 137–143. [Google Scholar] [CrossRef]
  8. Haidemenopoulos, G.N.; Kermanidis, A.T.; Malliaros, C.; Dickert, H.H.; Kucharzyk, P.; Bleck, W. On the effect of austenite stability on high cycle fatigue of TRIP 700 steel. Mater. Sci. Eng. A 2013, 573, 7–11. [Google Scholar] [CrossRef]
  9. Zackay, V.F.; Parker, E.R.; Fahr, D.; Busch, R. The enhancement of ductility in high-strength steels. ASM Trans Quart 1967, 60, 252. [Google Scholar]
  10. Bhandarkar, D.; Zackay, V.F.; Parker, E.R. Stability and mechanical properties of some metastable austenitic steels. Metall. Trans. B 1972, 3, 2619. [Google Scholar] [CrossRef]
  11. Sugimoto, K.; Usui, N.; Kobayashi, M.; Hashimoto, S. Effects of Volume Fraction and Stability of Retained Austenite on Ductility of TRIP-aided Dual-phase Steels. ISIJ Int. 1992, 32, 1311. [Google Scholar] [CrossRef]
  12. Sakuma, Y.; Matsumura, O.; Takechi, H. Mechanical properties and retained austenite in intercritically heat-treated bainite-transformed steel and their variation with Si and Mn additions. Metall. Trans. A 1991, 22, 489–498. [Google Scholar] [CrossRef]
  13. Matsumura, O.; Sakuma, Y.; Ishii, Y.; Zhao, J. Effect of retained austenite on formability of high strength sheet steels. ISIJ Int. 1992, 32, 1110–1116. [Google Scholar] [CrossRef]
  14. Bleck, W.; Guo, X.; Ma, Y. The TRIP Effect and Its Application in Cold Formable Sheet Steels. Steel Res. Int. 2017, 88, 1700218. [Google Scholar] [CrossRef]
  15. Zuidema, B.K. Bridging the Design–Manufacturing–Materials Data Gap: Material Properties for Optimum Design and Manufacturing Performance in Light Vehicle Steel-Intensive Body Structures. JOM 2012, 64, 1039–1047. [Google Scholar] [CrossRef]
  16. Keeler, S.; Kimchi, M.; Mooney, P.J. Advanced High-Strength Steels Application Guidelines; Version 6.0.; WorldAutoSteel: Middletown, OH, USA, 2017. [Google Scholar]
  17. De Cooman, B.C. Structure-properties relationship in TRIP steels containing carbide-free bainite. Curr. Opin. Solid State Mater. Sci. 2004, 8, 285–303. [Google Scholar] [CrossRef]
  18. De Meyer, M.; Vanderschueren, D.; De Cooman, B.C. The Influence of the Substitution of Si by Al on the Properties of Cold Rolled C-Mn-Si TRIP Steels. ISIJ Int. 1999, 39, 813. [Google Scholar] [CrossRef]
  19. Jacques, P.; Girault, E.; Catlin, T.; Geerlofs, N.; Kop, T.; van der Zwaag, S.; Delannay, F. Bainite transformation of low carbon Mn–Si TRIP-assisted multiphase steels: Influence of silicon content on cementite precipitation and austenite retention. Mater. Sci. Eng. A 1999, 273–275, 475–479. [Google Scholar] [CrossRef]
  20. Hori, M.; Nakamori, T.; Usuki, N.; Toki, T.; Arai, M. Effect of Si in Steel on Hot-dip Galvanizing and Galvannealing. In Proceedings of the 4th International Conference on Zinc and Zinc Alloy Coated Steel Sheet: GALVATECH, Makuhari, Chiba, Japan, 20–23 September 1998; p. 221. [Google Scholar]
  21. Krizan, D.; De Cooman, B.C. Mechanical properties of TRIP steel microalloyed with Ti. Metall. Mater. Trans. A 2014, 45, 3481–3492. [Google Scholar] [CrossRef]
  22. Mahieu, J.; Van Dooren, D.; Barbé, L.; De Cooman, B.C. Influence of Al, Si and P on the kinetics of intercritical annealing of TRIP-aided steels: Thermodynamical prediction and experimental verification. Steel Res. Int. 2002, 73, 267–273. [Google Scholar] [CrossRef]
  23. Mintz, B. Hot dip galvanising of transformation induced plasticity and other intercritically annealed steels. Int. Mater. Rev. 2001, 46, 169–197. [Google Scholar] [CrossRef]
  24. Chen, H.C.; Era, H.; Shimizu, M. Effect of phosphorus on the formation of retained austenite and mechanical properties in Si-containing low-carbon steel sheet. Metall. Trans. A 1989, 20, 437–445. [Google Scholar] [CrossRef]
  25. Cai, M.; Ding, H.; Lee, Y.; Tang, Z.; Zhang, J. Effects of Si on microstructural evolution and mechanical properties of hot-rolled ferrite and bainite dual-phase steels. ISIJ Int. 2011, 51, 476–481. [Google Scholar] [CrossRef]
  26. Mahieu, J.; Maki, J.; De Cooman, B.C.; Claessens, S. Phase transformation and mechanical properties of Si-free CMnAl transformation-induced plasticity-aided steel. Metall. Trans. A Phys. Metall. Mater. Sci. 2002, 33, 2573–2580. [Google Scholar] [CrossRef]
  27. Kimura, Y.; Takaki, S. Phase transformation mechanism of Fe-Cu alloys. ISIJ Int. 1997, 37, 290–295. [Google Scholar] [CrossRef]
  28. Kim, S.-J.; Lee, C.G.; Lee, T.-H.; Oh, C.-S. Effect of Cu, Cr and Ni on mechanical properties of 0.15 wt.% C TRIP-aided cold rolled steels. Scr. Mater. 2003, 48, 539–544. [Google Scholar] [CrossRef]
  29. Lagneborg, R.; Siwecki, T.; Zajac, S.; Hutchinson, B. The Role of Vanadium in Microalloyed Steels. Scand. J. Metall. 1999. [Google Scholar]
  30. Pereloma, E.V.; Timokhina, I.B.; Russell, K.F.; Miller, M.K. Characterization of clusters and ultrafine precipitates in Nb-containing C–Mn–Si steels. Scr. Mater. 2006, 54, 471–476. [Google Scholar] [CrossRef]
  31. Krizan, D.; De Cooman, B.C.; Antonissen, J. Retained Austenite Stability in the Cold Rolled CMnAlSiP Micro-alloyed TRIP steels. AHSSS Proc. 2004, 205–216. [Google Scholar]
  32. Nagayama, K.; Terasaki, T.; Tanaka, K.; Fischer, F.D.; Antretter, T.; Cailletaud, G.; Azzouz, F. Mechanical properties of a Cr–Ni–Mo–Al–Ti maraging steel in the process of martensitic transformation. Mater. Sci. Eng. A 2001, 308, 25–37. [Google Scholar] [CrossRef]
  33. Scott, C.; Maugis, P.; Barges, P.; Gouné, M. Microalloying with vanadium in TRIP steels. In Proceedings of the International Conference on Advanced High Strength Sheet Steels for Automotive Applications, Winter Park, CO, USA, 6–9 June 2004; pp. 181–193. [Google Scholar]
  34. Bleck, W.; Frehn, A.; Ohlert, J. Niobium in dual phase and trip steels. In Proceedings of the International Symposium Niobium 2001, Orlando, FL, USA, 2–5 December 2001. [Google Scholar]
  35. Heibel, S.; Dettinger, T.; Nester, W.; Clausmeyer, T.; Erman Tekkaya, A. Damage Mechanisms and Mechanical Properties of High-Strength Multiphase Steels. Materials 2018, 11, 761. [Google Scholar] [CrossRef] [PubMed]
  36. Koistinen, D.P.; Marburger, R.E. A general equation prescribing the extent of the austenite-martensite transformation in pure iron-carbon alloys and plain carbon steels. Acta Metall. 1959, 7, 59–60. [Google Scholar] [CrossRef]
  37. Nyyssonen, T.; Oja, O.; Jussila, P.; Saastamoinen, A.; Somani, M.; Peura, P. Quenching and Partitioning of Multiphase Aluminum-Added Steels. Metals 2019, 9, 373. [Google Scholar] [CrossRef]
  38. Wagner, L.; Larour, P. Influence of specimen geometry on measures of local fracture strain obtained from uniaxial tensile tests of AHSS sheets. In Proceedings of the International Deep Drawing Research Group 37th Annual Conference, Waterloo, ON, Canada, 3–7 June 2018. [Google Scholar]
  39. Jatczak, C.F.; Larsen, J.A.; Shin, S.W. Retained Austenite and Its Measurements by X-Ray Diffraction. Soc. Automot. Eng. 1980. [Google Scholar]
  40. Dyson, D.J.; Holmes, B. Effect of alloying additions on the lattice parameter of austenite. J. Iron Steel Inst. 1970, 208, 469–474. [Google Scholar]
  41. Perrard, F.; Scott, C. Vanadium Precipitation During Intercritical Annealing in Cold Rolled TRIP Steels. ISIJ Int. 2007, 47, 1168–1177. [Google Scholar] [CrossRef] [Green Version]
  42. Scott, C.P.; Fazeli, F.; Shalchi Amirkhiz, B.; Pushkareva, I.; Allain, S.Y.P. Structure-properties relationship of ultra-fine grained V-microalloyed dual phase steels. Mater. Sci. Eng. A 2017, 703, 293–303. [Google Scholar] [CrossRef]
Figure 1. Time–temperature transformation (TTT) curves for the bainitic transformation of experimental steels.
Metals 09 00887 g001
Figure 2. True stress-true strain and dσ/dε curves (a) and incremental strain hardening n values (b).
Metals 09 00887 g002
Figure 3. True thickness strain at fracture (a) and true fracture strain (b) of the investigated steels.
Metals 09 00887 g003
Figure 4. The observed XRD spectra for (a) Steel A, (b) Steel B IBT480, (c) Steel C IBT420, and (d) Steel D IBT480.
Metals 09 00887 g004
Figure 5. Electron back-scatter diffraction (EBSD) pattern quality maps (PQM) phase maps of austenite (fcc) in inverse pole figure (IPF) X colouring and ferrite (bcc) and austenite (fcc) grain sizes. (a) Steel A 810; (b) Steel B IBT 420; (c) Steel B IBT 450; and (d) Steel B IBT 480.
Metals 09 00887 g005
Figure 6. (a) Back-scatter electron detector micrograph Steel C IBT 480 (a) with annotations of phases: F = ferrite, BF = bainitic–ferrite, M = martensite, and RA = retained austenite. (b) EBSD PQM phase map of austenite (fcc) in IPF X colouring and grain size measurements of the same location of Steel C IBT 480 microstructure.
Metals 09 00887 g006
Figure 7. (a) Back-scatter electron detector micrograph of Steel D IBT 480 with annotations of phases: F = ferrite, M = martensite. (b) EBSD PQM of austenite (fcc) in IPF X colouring phase map and ferrite grain size measurement of the same location of Steel D 480 microstructure.
Metals 09 00887 g007
Figure 8. EBSD PQM phase map of Steel C IBT 450 tensile test sample where austenite (fcc) is presented in IPF X colouring with ferrite (bcc) and austenite (fcc) grain sizes overlaid.
Metals 09 00887 g008
Figure 9. (a) EBSD PQM phase map of Steel A microstructure at the tensile test specimen crack tip where no austenite (fcc) was detected. (b) EBSD PQM map of Steel C IBT 450 microstructure at tensile test specimen crack tip where the minuscule amount of austenite (fcc) is presented in IPF X colouring.
Metals 09 00887 g009
Figure 10. (a) Spherical Ti(Nb)N precipitate in Steel B. (b) 100 nm Ti(Nb)N and 50 nm Nb(Mo)C precipitates in Steel C.
Metals 09 00887 g010
Figure 11. Evaluation of formability properties of the investigated steels.
Metals 09 00887 g011
Table 1. Elemental composition in weight percentage of the industrial reference steel.
wt. %CMnSi + AlCr + Mo + CuBalance
Steel A0.191.641.650.040Fe and traces of P, S, N
Table 2. Elemental compositions in weight percentage of the experimental laboratory steels.
wt. %CMnSiAlCrMoCuTiNbVNBalance
Steel B0.211.510.710.970.0210.210.500.0240.0010.0020.0025Fe and traces of P, S
Steel C0.201.540.721.000.0180.210.500.0230.0430.0020.0010Fe and traces of P, S
Steel D0.211.500.690.920.0220.210.490.0230.0020.0970.0045Fe and traces of P, S
Table 3. Intercritical annealing temperature (IA), annealing time tIA, isothermal bainitic transformation temperature (IBT), and holding time tIBT for the specimens.
MaterialIA,
[°C]
tIA,
[s]
IBT,
[°C]
tIBT,
[s]
Steel A8106046010
Steel B83070420100
---450-
---480-
Steel C83070420100
---450-
---480-
Steel D83070420100
---450-
---480-
Table 4. Experimentally determined and calculated Ms temperatures. AT = dilatometry annealing temperature.
MaterialIA,
[°C]
AT,
[°C]
Dilatometry
Ms, [°C]
JMatPro
Ms, [°C]
Austenite Carbon Content at IA [wt. %]
Steel A 18108501163800.70
Steel B83010003843850.38
Steel C83010001933800.70
Steel D83010003893950.36
1 Dilatometry annealing of Steel A was done at 850 °C and calculation after 1000 °C.
Table 5. Tensile test results of the investigated steels.
MaterialIA,
[°C]
IBT,
[°C]
YS, [MPa]UTS [MPa]YS/UTSUEL, Uniform Elongation [%]TEL, Total Elongation [%]n
[4,5,6]
n [10–20/Ag]UTS × TEL
[MPa%]
Steel A8104604458220.5419.30270.3050.26019 048
Steel B8304204018870.4515.50220.3080.21119 071
--4504229390.4515.70240.3030.17722 724
--4804489500.4712.70170.3010.20315 770
Steel C8304204179370.4518.40190.3500.23717 522
--4504519990.4518.50250.3460.20324 875
--48050310500.4814.60190.3090.17020 160
Steel D8304204569560.4811.80180.2800.12317 399
--4504939750.5113.10200.2750.16819 403
--48053810350.5211.10150.2410.11815 836
Table 6. True thickness strain at fracture, true fracture strain, and true uniform elongation values of the investigated steels.
MaterialIA,
[°C]
IBT,
[°C]
True Thickness
Strain at Fracture (ε3f)
True Fracture Strain (TFS)True Uniform
Elongation (σ = dσ/dε)
Steel A8104600.620.580.17
Steel B8304200.580.550.14
--4500.450.410.14
--4800.550.480.12
Steel C8304200.530.490.17
--4500.610.450.17
--4800.540.470.13
Steel D8304200.420.390.11
--4500.420.38012
--4800.510.410.11
Table 7. Retained austenite content (in volume percentage) and carbon content (in weight percentage).
MaterialIA,
[°C]
IBT,
[°C]
RA,
[vol. %]
RA Carbon
Content [wt. %]
Steel A81046013.70.75
Steel B8304205.40.71
--45012.00.82
--4808.90.66
Steel C8304208.50.72
--4504.60.73
--4801.20.72
Steel D8304200.31.19
--4501.10.70
--4801.20.73

