Article

Optimization of the Continuous Galvanizing Heat Treatment Process in Ultra-High Strength Dual Phase Steels Using a Multivariate Model

by
Patricia Costa
1,*,
Gerardo Altamirano
2,
Armando Salinas
1,
David S. González-González
3 and
Frank Goodwin
4
1
Centro de Investigación y de Estudios Avanzados del Instituto Politécnico Nacional (CINVESTAV), Unidad Saltillo, Zona Industrial, Ramos Arizpe C.P. 25903, Mexico
2
Instituto Tecnológico de Saltillo. Blvd, Venustiano Carranza #2400, Col. Tecnológico, Saltillo C.P. 25280, Mexico
3
Facultad de Sistemas, Universidad Autónoma de Coahuila, Ciudad Universitaria, Carretera a México Km 13, Arteaga, Coahuila, Mexico
4
International Zinc Association, 2530 Meridian Parkway, Durham, NC 27713, USA
*
Author to whom correspondence should be addressed.
Metals 2019, 9(6), 703; https://doi.org/10.3390/met9060703
Submission received: 26 April 2019 / Accepted: 4 May 2019 / Published: 21 June 2019
(This article belongs to the Special Issue Numerical Modelling and Simulation of Metal Processing)

Abstract

:
The main process variables to produce galvanized dual phase (DP) steel sheets in continuous galvanizing lines are time and temperature of intercritical austenitizing (tIA and TIA), cooling rate (CR1) after intercritical austenitizing, holding time at the galvanizing temperature (tG) and finally the cooling rate (CR2) to room temperature. In this research work, the effects of CR1, tG and CR2 on the ultimate tensile strength (UTS), yield strength (YS), and elongation (EL) of cold rolled low carbon steel were investigated by applying an experimental central composite design and a multivariate regression model. A multi-objective optimization and the Pareto Front were used for the optimization of the continuous galvanizing heat treatments. Typical thermal cycles applied for the production of continuous galvanized AHSS-DP strips were simulated in a quenching dilatometer using miniature tensile specimens. The experimental results of UTS, YS and EL were used to fit the multivariate regression model for the prediction of these mechanical properties from the processing parameters (CR1, tG and CR2). In general, the results show that the proposed multivariate model correctly predicts the mechanical properties of UTS, YS and %EL for DP steels processed under continuous galvanizing conditions. Furthermore, it is demonstrated that the phase transformations that take place during the optimized tG (galvanizing time) play a dominant role in determining the values of the mechanical properties of the DP steel. The production of hot-dip galvanized DP steels with a minimum tensile strength of 1100 MPa is possible by applying the proposed methodology. The results provide important scientific and technological knowledge about the annealing/galvanizing thermal cycle effects on the microstructure and mechanical properties of DP steels.

1. Introduction

The thinner gauge advanced high-strength steels (AHSS) are used in the automotive industry for the manufacture of structural components for the car body. The objective of using these materials is a reduction of weight, increase passenger safety and reducing fuel consumption and emission of greenhouse effect gases [1].
AHSS dual phase (DP) steels, with a microstructure consisting of a ferrite matrix, responsible for their good ductility, and martensite and/or bainite islands, which provide high tensile strength, exhibit the greatest rate of production [1]. In addition to mechanical strength and formability, DP steel for automotive and other applications require high corrosion resistance. Therefore, they are usually galvanized to increase the useful life of the components and galvannealed to improved their weldability [2].
Galvanized DP steel strips can be produced from cold rolled sheets using available continuous hot dip galvanizing lines (CGL). However, careful selection and control of processing parameters to generate the dual phase microstructures (ferrite + martensite) are needed to achieve the desired mechanical properties. Basically, a CGL processing line can be divided into five sections as illustrated schematically in Figure 1:
Heating section, where the strip is heated rapidly to temperatures appropriate to produce the microstructures required for further processing of the strip.
Soaking section, where typical processing times can be as long as 60 s.
Primary cooling section, where the strip is rapidly cooled to a temperature as close as possible to the temperature of the galvanizing bath.
Galvanizing section, where the Zn coating is formed by an initial reaction between the steel and the liquid zinc and rapid solidification of a liquid zinc film as the strip leaves the zinc pot and passes through air-knives.
Secondary cooling section, where the strip is cooled to room temperature for further processing.
It should be evident that heating and cooling rates, as well as the time of interruption of cooling at the galvanizing temperature all depend on the size (length) characteristics of each section, the heating and cooling capacities of each section, the line speed and the thickness and width of the strip.
In contrast to the processing parameters used in the fabrication of other types of galvanized products, for example formable steel strips, manufacture of DP-galvanized strips requires the cold worked strip to be heated to temperatures (TIA) within the intercritical (ferrite + austenite) range (i.e., between Ac1 and Ac3). The initial heating rate (HR1), TIA and (t1 + t2) allow conditioning of the intercritical austenite and ferrite (initial microstructure).
Metallurgically, the most important characteristics of the intercritical austenite are its volume fraction and hardenability which depend on: (a) TIA, (t1 + t2), (b) grain size, and (c) chemical composition. Also, the metallurgical state of the intercritical ferrite is important (degree of recrystallization, solute content (C, N) and second particle precipitate size and distribution).
The hardenability of the intercritical austenite is the most important metallurgical property in the cooling and galvanizing sections of the process. If the intercritical austenite can be maintained in the metastable form at T < TG and the secondary cooling rate (CR2) is fast enough, the intercritical austenite will transform to martensite in this section and a galvanized dual phase steel strip will be produced. It is noteworthy that, in this case, the Zn coating will be formed on an (α + γ) microstructure. The effect of the volume change associated with the martensite transformation on the adherence of the Zn coating has never been investigated. On the other hand, if the metastable intercritical austenite transforms to non-martensite products (pro-eutectoid ferrite, perlite or bainite) at T > TG, due to slow CR1 cooling rates, the Zn coating will be formed on a complex microstructure consisting of intercritical ferrite, pro-eutectoid ferrite, perlite, bainite and residual metastable austenite. This residual austenite may transform to martensite on further cooling to T < Ms or remain in a metastable form at room temperature. Of course, this will depend on the dynamic changes in hardenability that take place during continuous cooling and the interrupted cooling of the strip at TG.
It is evident from the above discussion that process and product development in CGL’s to produce galvanized DP-AHSS strips appears quite a complex task. In general, the chemical compositions of the DP-steels are adjusted to increase their hardenability by adding alloy elements, such as Cr, Mo, Si, B etc. However, the hardenability of intercritical and residual austenite changes dynamically during the cooling stages of the process and makes very difficult to predict their transformation behavior under actual industrial processing conditions.
Several authors have investigated the behavior of dual phase steels during processing in continuous annealing and galvanizing lines [3,4,5,6,7,8,9,10]. For example, Calcagnotto et al. [3] studied the effect of temperature and time of intercritical austenitization on the microstructure and properties produced in dual phase C-Mn steels with an ultra-fine initial microstructure composed of ferrite and perlite. The results showed that the amount of martensite and the ferritic grain size increase when the intercritical austenitization time and temperature are both increased. Also, they reported that the heating rate does not have a significant influence on the phase transformation kinetics of intercritical austenite.
Recent studies [11] indicate that the interruption of cooling at the temperature of the zinc bath (450–460 °C) can cause the formation of bainite or stabilize the austenite. In both cases the result is an undesirable microstructure with limited mechanical properties.
Due the importance of the mechanical properties control in these kind of advanced steels, in the scientific literature have been reported several works to predict the mechanical properties of DP steels using numerical methods based on microstructural characteristics, such as the morphology, phases ratio and diffusion equations for dual phase steel with maximum tensile strength of 1000 MPa [12,13,14,15,16,17,18,19,20]. In this context, Pernach et al. [18] used numerical methods to model the decomposition of austenite in DP600 steel based on the equations that govern the kinetics and diffusion in steels. Bzowski et al. [19] also used numerical methods to predict the morphology and carbon distribution in austenite. Kim et al. [20] used an orthogonal statistic design to predict the UTS and %EL in DP-50Kg-grade employing as input variables the annealing and galvanizing temperature.
Van et al. [21], studied the effect of the process parameters on the mechanical properties in TRIP Steels using univariate statistical analysis. However, it is not common to find in the literature the direct relationship of mechanical properties with processing parameters of DP steels using multivariate statistical modelling and optimization.
According to Ray et al. [22] process modelling and optimization are tools for obtaining the best combination of process parameters to maximize or minimize a given product property. There are several ways to model and optimize processes. Some researchers choose to perform experiments and statistical analysis through graphs and thus decide the best parameters for a given process. For example, Lombardi et al. [23] optimized the heat treatment of an aluminum alloy by correlating its mechanical properties with results of metallographic analysis and statistical analysis of the data.
Other authors prefer to use empirical mathematical models based on statistical analysis methods, such as response surface methodology (RSM) and the Taguchi method, as well as advanced analysis methods, such as neural networks, genetic algorithms and finite element modeling. Cavaliere et al. [24] optimized different parameters of the nitriding of a steel by combining RSM with a genetic algorithm. Their models can predict the mechanical properties, the microstructural evolution and the phase transformations as a function of the chemical composition of the steel and the parameters of the nitriding process. Chaouch et al. [25] studied the effect of heat treatment on the mechanical properties of an AISI 4140 steel. Among all the mentioned techniques, RSM is frequently used to model and optimize processes, due to its low computational time and its high level of precision in optimization [26,27,28].
This methodology is frequently used in the manufacturing process area [26], such as welding processes [29], but can be used for other processes where the response variable is influenced by different input variables [30]. Reisgen et al. [31] developed a statistical model for predicting the heat input and weld bead geometry in laser welding. Cruz et al. [32] obtained the GTAW welding parameters to produce quality joints on Ti6Al4V plates. With these results, the adequate amperage, voltage and advance speed are selected so that the union had the maximum toughness. Miguel et al. [33] also used this methodology to optimize the weld bead geometry using the GMAW welding process for aluminum alloy plates (AA 6063-T5). Singla et al. [26] used the factorial design for investigating the effect of cerium oxide addition on the dry sliding adhesive wear behavior of hardfaced Fe-18Cr-1.1Nb-2.1C alloy and a regression equation of the model was developed and validated with experimental tests. García Nieto et al. [34] used multivariate regression to predict the segregation in continuous cast steel slabs and the results allowed to determinate the most important variables that impact in the industrial process directly.
In the stage of isothermal holding for the galvanizing process, the chemical composition of the residual austenite changes dynamically and consequently the microstructure and mechanical properties of the steel. Due to these dynamic changes in the austenite it is difficult to obtain a general mathematical model that adequately describes this behavior, making necessary the determination of empirical models. There are several studies on the influence of the temperature of intercritical austenitizing on the mechanical properties [2,35,36,37]. However, the impact of interrupted cooling time at galvanizing temperature and the effects of the cooling rates prior and after galvanizing on the microstructure and mechanical properties of dual phase steel strips processed in CGL’s have not been investigated previously. In addition, multivariate modeling in conjunction with multi-objective optimization using genetic algorithms is not habitually applied in the area of heat treatments to model thermal processes, since when the response variables are correlated the statistical analysis becomes more complex.
Therefore, the aim of this work is to optimize the continuous galvanizing cycle to produce DP steels with a minimum ultimate tensile strength of 1100 MPa, yield strength between 550–750 MPa and a minimum elongation of 10% from an advanced cold rolled steel.

2. Materials and Methods

2.1. Theoretical Aspects of Multivariate Model

In this work the response variables to be optimized are the ultimate tensile strength (UTS), the yield strength (YS) and the elongation (EL). From a metallurgical point of view, these mechanical properties are correlated with each other. Therefore, the type of analysis indicated for this case is the multivariate analysis which is appropriate when several measurements are obtained from each experimental sample subjected to an experiment with several input variables [38]. With the use of the statistical modeling it is possible to jointly establish the correlation of the galvanizing thermal cycle parameters (CR1, tG and CR2) with the response variables (UTS, YS and EL). In the regression model of Equation (1) each response variable y in a sample of n observations is represented as a linear function of the process variables x plus a random error ε.
y 1 = β 0 + β 1 x 11 + β 2 x 12 + + β q x 1 q + ε 1 y n = β 0 + β 1 x n 1 + β 2 x n 2 + + β q x n q + ε n
In this equation the β i coefficients represent the “weights” that the magnitudes of the input variables ( x ), by themselves or due to their interactions, have on the magnitude of the output variables ( y ). In other words, they represent the magnitude of the influence of the values of the process variables (CR1, tG and CR2) on the ultimate tensile strength (UTS), yield strength (YS) and elongation (EL) of the material. It is noteworthy that, although the UTS and other mechanical properties depend on the final microstructure of the steel and the final microstructure depends strongly on the evolution of microstructure from TIA to room temperature. Therefore, the final mechanical properties depend on the phase transformation behavior of the intercritical austenite during the cooling cycle.
Thereby, the multivariate model is constructed as follows [39]:
a)
Selection of the input variables according to the objective of the investigation;
b)
Selection of experimental design and generation of the experimental matrix;
c)
Perform the experiments according to the experimental matrix designed;
d)
Statistical analysis of the experimental data to obtain the fit of the polynomial function; i.e., obtain the β i coefficients in Equation (1).
e)
Statistical evaluation of the fitted model using multivariate variance analysis (MANOVA) and analysis of determination coefficients (R2);
Once it is ensured that the model meets with the statistical assumptions and presents good prediction, the regression equations are used as functions in the optimization stage. In this investigation the multivariate model is developed using three dependent variables (UTS, YS and EL) and three independent variables (CR1, tG and CR2). The multivariate model can be written in its general form as follows [38]:
Y = X B + E .
Therefore, the coefficients B can be estimated by the following equation [38]:
B ^ = ( X X ) 1 X Y .
When the process variables have an influence on the response variable, hypothesis tests for the analysis of variance should be performed. The hypothesis test is used to determine which hypothesis is best supported by the data. There are two hypotheses: The null hypothesis (H0) and the alternative hypothesis (H1). In this investigation the test of Wilks (Λ) was used to determine if the process variables have a significant influence on the response variables. This test is based on the calculation of Λ:
Λ = | Y Y B ^ X Y | | Y Y n y ¯ y ¯ | .
The null hypothesis is H0: B1 = 0, where B1 is the matrix X without the first column. The null hypothesis is rejected if Λ ≤ table value and it means that the response variables are influenced by the process variables.
The performance of a model can be expressed by the goodness coefficient or determination coefficient R2. For multivariate modeling there are several measurements of association between the y’s and the x’s. One of these measurements is based on Wilks test:
R 2 = 1 Λ .
In the present investigation a composite central design with three center points is used for obtaining the experimental matrix. The experimental data obtained are then used to evaluate the feasibility of manufacturing cold-rolled galvanizing dual phase (ferrite + martensite) steel strip with a UTS > 1100 MPa, YS between 550–750 MPa and a minimum elongation of 10% in an idealized continuous galvanizing line where the thermal profile to which the strip is subjected is, as shown in Figure 1. In practice, the heating and cooling rates in each step are defined by the speed and the actual temperature of the strip along the processing line. It is noteworthy that the galvanizing stage effectively represents an interruption of cooling at temperatures between 450 and 460 °C. Therefore, phase transformations that take place on the cooling of the strip may be affected significantly.
The mechanical properties investigated are important in advanced steels because they determine the potential of weight savings of the components used in the automotive industry [1]. The goal in this work is to evaluate the effect of CR1, tG and CR2 on the mechanical properties of the steel with chemical composition listed in Table 1.
The experimental region of the process variables (CR1, tG and CR2) is presented in Table 2 and the 17 conditions produced by the experimental design are shown in Table 3. The experimental matrix represents a composite center design with 3 central points for investigating the relationship of the mechanical properties with the process variables.
The models obtained after going through the inferential statistical analysis can be used as objective functions to perform the optimization of input parameters (CR1, tG and CR2) looking for the results of optimal mechanical properties for the manufacture of a DP steel with the desired properties. For this a genetic algorithm NSGAII (Non-Dominated Sorting Genetic Algorithm) was used, it allows to optimize several responses at the same time, that is, a multi-objective optimization.
The use of the genetic algorithm NSGAII is based on the mechanisms of genetics and natural selection, combining the survival of the fittest in the form of structured representations of solutions to the problem, called individuals, with mechanisms of information exchange for the generation of new solutions. The search is based on the information obtained from the problem and as the space of possible solutions is traversed, the search is directed towards the best values [40]. Thereby, to optimize the parameters of the thermal cycle presented in Figure 1, a solution is searched that maximizes the UTS, as well as elongation and minimizes the yield strength (YS) in order to obtain a DP steel with minimum UTS of 1100 MPa, yield strength between 550 and 750 MPa and a minimum elongation of 10%. Five solutions obtained from optimization were selected to perform experimental tests. Furthermore, the hypothesis of a normal distribution of the data was verified.

2.2. Experimental Methods

Figure 2 illustrates the time-temperature-transformation (TTT) and continuous cooling transformation (CCT) diagrams calculated using JMatPro (Java-based Materials Properties, 9.0 version, Sente Software Ltd., Guildford, UK) for the steel investigated. The calculation was performed assuming TIA = 800 °C. Under these conditions of intercritical austenitizing, the software predicts an initial microstructure consisting of 11.3% ferrite and 88.7% austenite, an intercritical austenite grain size of 8.5 µm and an Ms of 365.6 °C.
As can be appreciated in the CCT diagram, cooling rates faster than 100 °C/s are needed to produce ferrite + martensite microstructures while cooling rates between 30 and 100 °C/s result in ferrite + bainite + martensite microstructures. Cooling rates slower than 1 °C/s produce microstructures consisting of ferrite+pearlite and martensite can not be formed under these cooling conditions. It is noteworthy that, according to the TTT diagram, any isothermal holding at temperatures between 450 and 460 °C will produce a transformation of any metastable residual austenite to bainite. Another important observation is that, for cooling rate slower than 10 °C/s, the ferrite volume fraction in the final microstructure has contributions from the intercritical ferrite present at the beginning of cooling and the pro-eutectoid ferrite formed on cooling. Ferrite + perlite + bainite microstructures are produced when the cooling rates are slower than 30 °C/s. It is therefore evident that, with the chemical composition of the steel and using a TIA = 800 °C, a wide variety of microstructures, and consequently of properties can be produced depending on the actual cooling conditions during processing. In this work, the effect of introducing an interrupted cooling stage (isothermal holding) at 460 °C to simulate the thermal effects of galvanizing on the microstructure and mechanical properties after final cooling to room temperature is investigated.
The thermal cycles (Figure 1) were simulated using a quenching dilatometer Linseis model L78 RITA (Selb, Germany). The experiments were carried out in both miniature tension test samples with dimensions presented in Figure 3, and standard test samples of 5 mm × 11 mm × 1.1 mm for microstructure and microhardness analysis. The tensile tests were performed using a miniature extensometer (MTS System Corporation, Eden Prairie, MN, USA) MTS model 632.29 with a 5 mm calibrated gauge length. This extensometer has a strain measuring the range of −10% to 30%, which is perfectly adequate for the tensile test specimens designed for dilatometry. The tensile tests carried out using an electromechanical universal testing system MTS model QTEST/100 (MTS System Corporation, Eden Prairie, MN, USA) at a crosshead speed as 1.5 mm/min. Experimental data were obtained to provide ultimate tensile strength (UTS), yield strength (0.2% proof stress) and elongation to fracture (EL). Al experiments were performed by duplicate.
For metallographic analysis, the samples were cut in the longitudinal section, prepared using conventional metallographic techniques and analyzed by scanning electron microscopy (SEM) model JSM-7800F (JEOL Ltd., Akishima, Japan). Microhardness tests were carried out using a Vickers Tukon 300-FM/10kg microdurometer (Wilson Instruments®, Binghamton, NY, USA) with a 500 gf load applied during 12 s. The actual initial microstructure of the steel at 800 °C for all dilatometry experiments consists of 35% intercritical ferrite and 65% intercritical austenite with an average intercritical austenite grain size of 2.8 µm. This later value is about 3 times smaller than the one predicted by JMatPro. CR1 and CR2 are varied between 10–110 °C/s, while TG, the galvanizing temperature, is kept constant at 460 °C. Finally, the interrupted cooling time (tG) is varied from 3 to 20 s.

3. Results and Discussion

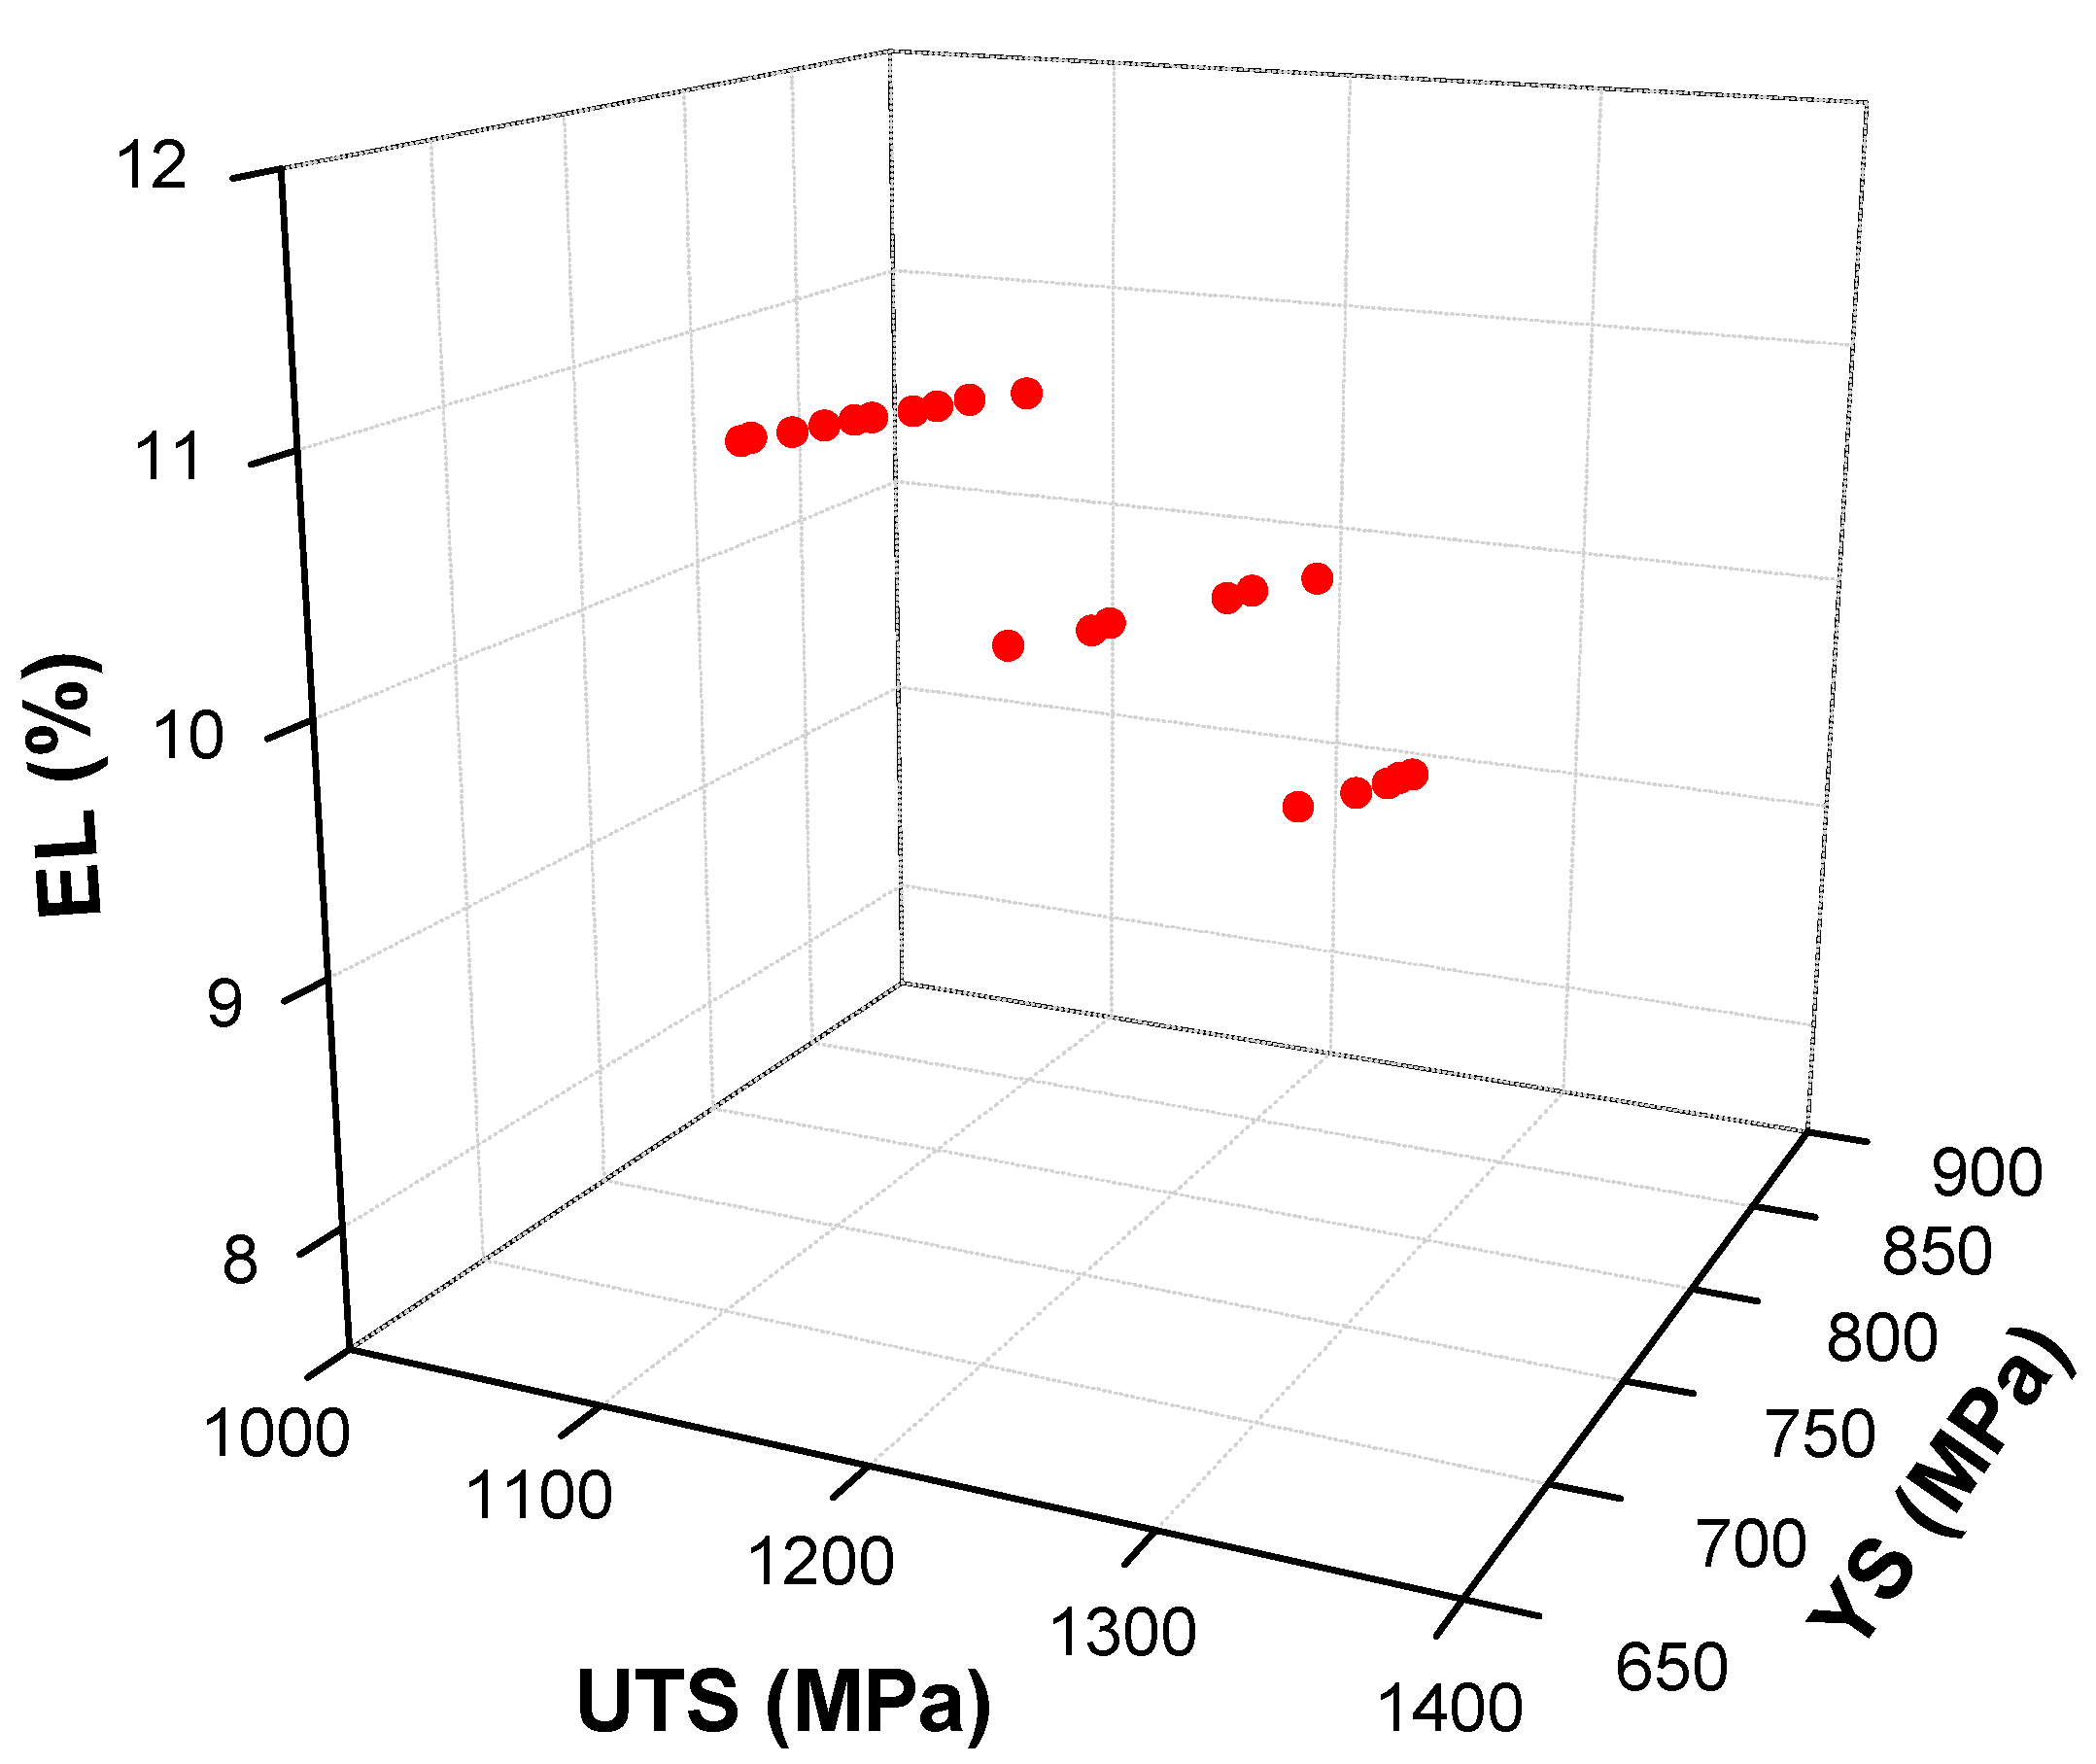
3.1. Effect of Thermal Cycle on Mechanical Properties

The mechanical properties resulting from the 17 experiments performed (different thermal cycles) included in the experimental design matrix (Table 3) are listed in Table 4. With these results, the model coefficients ( β ) of Equation (1) were determined using the least squares method described by Rencher [38]. The multivariate variance analysis (MANOVA) was used to evaluate the fit of the model and identifying which factors and interactions among them were more significant.

3.2. Development of Statistical Model

Before making the estimation of the parameters of the model, it is important to determine if the response variables are correlated. The answer to this question allows to select the method that should be employed to estimate the β parameters, that is, whether the calculations should be done using univariate or multivariate methods. To this end, the Pearson correlation test was used. This test calculates the correlation coefficient between the response variables considered. If one variable tends to increase while the others decrease, the correlation coefficient is negative. On the other hand, if the two variables tend to increase at the same time, the correlation coefficient is positive. The hypothesis test performed is as follows [41], H0: r = 0 versus H1: r ≠ 0 where r is the correlation between a pair of variables.
The null hypothesis H0 indicates that there is no correlation between the variables analyzed. Thus, the p-value is used to reject or not the null hypothesis, that is, if the p-value is less than the value of alpha (α = 0.05) the null hypothesis is rejected and therefore the variables could be correlated. The level of alpha often used is 0.05 which means that the possibility of finding an effect that does not really exist is only 5%. Then, when the alpha value is equal to 0.05, the results can be accepted with 95% confidence [41].
Table 5 presents the results of the Pearson correlation test applied to the y responses showed a Table 4. As can be seen at Table 5, all the p-values are less than 0.05 (α = 0.05), which means that, with 95% confidence, the responses variables (UTS, YS and EL) are correlated with each other.
Pearson correlation values demonstrate that the correlation between UTS and YS is positive, that is, when the UTS increases the YS tends to increase. However, when these two variables increase the elongation decreases since the EL presents a negative correlation with YS and UTS. From physical metallurgy point of view, these results are completely coherent. Since the response variables are correlated and several input variables ( x ’s) are considered, the linear regression model must be calculated using the equations for multivariate modeling (Equations (3) and (4)). The resulting models are:
U T S   ( M P a ) = 1241.7 + 0.6368 C R 1 9.0971 t G + 0.3278 C R 2
Y S   ( M P a ) = 868.05 + 1.0918 C R 1 12.836 t G + 0.4549 C R 2
E   ( % ) = 9.772 0.0204 C R 1 + 0.1099 t G + 0.001639 C R 2
Analyzing the values of the β coefficients of the model for UTS (Equation (6)), it becomes evident that cooling rates CR1 and CR2 have a positive linear relationship with the UTS. In contrast, the cooling interruption time (tG) at 460 °C has a negative linear relationship with the UTS. The variable that has the greatest impact on UTS is tG at 460 °C, where increasing tG causes a decrease in UTS. The same behavior is noted for YS, but for EL the cooling rate CR1 and the time tG have opposite effects than those presented by UTS and YS.
As can be seen in the calculated TTT or CCT diagrams of Figure 2, interruption of cooling at 460 °C causes an isothermal transformation of metastable austenite to bainite. Therefore, the UTS and YS at room temperature of the steel will decrease with increasing tG since smaller amounts of martensite would be present at room temperature after the final cooling.
The multivariate determination coefficient (R2) was calculated according to Equation (5): R2 = 91%. This result indicates that the model has a good fit since the coefficient of determination is greater than 80% [41]. It can be that 91% of the variability of the process is explained. The models in Equations (6)–(8) allow optimizing the heat treatment process using the optimization algorithm NSGA II and helps to predict the behavior of the process considering input variables changes.
After estimating the coefficients, it is important to verify if the data satisfy some assumptions, which according to Montgomery [41] are:
a)
The variance of the errors (residuals) must be homogeneous;
b)
Errors must be independent;
c)
Errors must have a normal distribution.
Using the Henze-Zirkler multivariate normality test [42], the normality of the data can be verified. The p-value of the Henze-Zirkler test for the calculated models was 0.0829 indicating that the data follows a normal distribution and therefore comply with part of the assumptions for multivariate variance analysis. To verify the homogeneity of the variance, another statistical test is performed called the Breusch-Pagan test. The null hypothesis of this test is that the variance is homogeneous over the residuals of the model. If this is not the case (rejection of H0), the model can lose its efficiency and makes erroneous predictions [43]. The variance of the models (Equations (6)–(8)) is homogeneous since the p-values of the tests were greater than α = 0.05 according to the results in Table 6.
Once the model data satisfies the assumptions for statistical analysis, the next step is to verify the effect of the input variables and their interactions over the UTS, YS, and EL. Thus, the multivariate variance analysis (MANOVA) was carried out using the Wilks test. The results of the p-values for each input variable and the first order interactions between them are presented in Table 7.
In this case, the null hypothesis (H0) is that the variable under analysis is not significant. According to the results in Table 7, the interactions between the input variables are not significant (p-value > α = 0.05). The results also show that CR2 is not significant. However, it was assumed that this variable is significant considering that, from physical metallurgy point of view, CR2 does play an important role in the transformation to martensite of any residual austenite at the end of the interruption of cooling at 460 °C. Of course, this is important when considering the thermal cycles involved in continuous galvanizing.
The hypothesis tests carried out as part of the inferential analysis indicated that the models obtained have a good performance (R2 = 91%). Thus, Equations 6-8 were used as objective functions in the optimization of input variables, as will be shown in the next sections.

3.3. Optimization

Process optimization techniques allow the selecting of the best parameters combination from a set of available alternatives. The problem to be optimized is defined by an objective function that returns as a result a real value or a vector of real values. Multi-objective optimization is used when it is necessary to optimize more than one objective function simultaneously, where the solution is composed of a set of optimal elements and, generally, it needs a decision maker to select one of them [40].
In this research it is sought to minimize the resistance to yield (YS) and to maximize both the ultimate tensile strength (UTS) and elongation (EL). The objective functions used in the optimization process are the statistical models presented in Equations (6)–(8).
The results of the optimization are presented in the form of a Pareto Front graph, as illustrated in Figure 4. The graph presents the set of optimal solutions in the target space where all the objectives in play are considered. All the options presented in the Pareto Front are equally valid [40]. The next step is to perform experimental tests with solutions presented in the Pareto Front.
Of the 21 optimal solutions presented in Figure 4, five conditions were selected to corroborate de optimization experimentally and the mechanical properties results are presented in Table 8. The criterion for selecting the conditions for the experimental test was that they should comply with a minimum UTS of 1100 MPa, YS between 550 and 750 MPa and a minimum elongation of 10%.
The five conditions selected were run experimentally using the miniature tensile test specimens designed to perform dilatometry thermal cycles. The mechanical properties were measured, and their results compared with those calculated by the model (Figure 5). The error in the prediction of the UTS is less than 3.4%, in the YS it is less than 7.7% and that of the elongation to fracture is less than 7.6%. These results indicate that the models obtained have a very good predictive capacity since they present errors of less than 10% [31].
In addition, the thermal TVF-3 presented in Table 8 can be used to produce dual phase steel (DP1100) that is desired in this investigation. It is worth mentioning that this condition results in a YS/UTS ratio of 0.66. This value is important because dual phase steels must have very good formability for the manufacture of components for the automotive industry, so it is important to minimize the YS/UTS ratio. Figure 6 presents the microstructure of this condition where the thermal cycle is optimized. the microstructure was quantified by metallography and is formed by 13% martensite (α’), 32% bainite (B) and 55% ferrite (α).

3.4. Effects of Process Parameters

In the manufacturing of galvanizing DP-AHSS steels, the cooling rate (CR1) must be fast enough to avoid the formation of perlite or bainite and retain carbon in solution in the metastable austenite until the transformation to martensite takes place at T < Ms. With the statistical models developed in this work (Equations (6)–(8)) it is possible to predict the effect of CR1 over the mechanical properties to DP steel, as shown in Figure 7. To plot this graph, the secondary cooling rate (CR2) was kept constant at 25°C/s and tG at 13 s. As can be seen, both the UTS and YS tend to decrease with slower initial cooling rates (CR1).
According to these results, a galvanizing DP steel with a minimum UTS of 1100 MPa, YS between 550 and 750 MPa and a minimum elongation to fracture of 10% can be produced using values of CR1 between 10 °C/s and 30 °C/s with the other parameters constants at: HR1 = 35 °C/s; TIA = 800 °C, t2 = 60 s; tG = 13s, TG = 460 °C and CR2 = 25 °C/s.
During the time of interruption of cooling at 460 °C, a certain amount of metastable residual austenite is available which, during the isothermal holding transforms to bainite as can be seen in both the TTT and CTT diagrams presented in Figure 2. These transformations have a significant impact on the mechanical properties of a galvanizing DP steel, as can be seen in Figure 8. With the increase of tG at 460 °C the UTS and the YS decreases, and the elongation increases. Thus, in order to ensure the desired mechanical properties (UTS > 1100 MPa, YS between 550 and 750 MPa and elongation to fracture greater than 10%), the time of interruption of cooling must be between 13 and 17 s when the other process variables are set to: HR1 = 35 °C/s; TIA = 800 °C, t2 = 60 s; CR1 = 13 °C/s, TG = 460 °C and CR2 = 25 °C/s.
Figure 8 shows that as tG increases, the UTS decreases and this behavior is associated with the formation of lower strength microstructures. The formation of bainite and consequently the decrease in the fraction of martensite in the microstructure causes the observed decrease in tensile strength. According to the TTT and CCT diagrams (Figure 2), the transformation of metastable austenite to bainite occurs during the interruption of cooling. Fonstein [1] reported that there is little information about the effect of the presence of bainite in DP steels. However, some data indicate that the hardening generated by bainite in DP steels is weaker than that generated by the presence of martensite. Also, Fonstein et.al [44] report that a 10% replacement of martensite by bainite decreases the UTS in 40 MPa.
The transformation of austenite during the interruption of cooling at 460 °C can be of vital importance since, in general, the martensite start-temperature (Ms) of most industrial DP-steel grades are lower than 450 °C. Therefore, the formation of bainite in processes that involve interruption of cooling, such continuous galvanizing, can inhibit the formation of martensite and, consequently, the desired strength in the steel will not be obtained.
It can be seen in Figure 9 that the final cooling rate (CR2) does not significantly influence the final mechanical properties. This result is similar to that reported by other researchers [1], who suggest that this final cooling rate (CR2) does not have a significant influence on the strength of the steel. The reason for this suggestion is that the amount of martensite generated is determined by the initial cooling rate in thermal cycles to obtain DP-steels without interrupted cooling at 460 °C. However, in this work, the isothermal holding at 460 °C prior to the final cooling produces residual metastable austenite with more carbon compared to the intercritical austenite and then the final rate for the transformation of the residual austenite has a significant effect in the UTS. Furthermore, using HR1 = 35 °C/s; TIA = 800 °C, t2 = 60 s; CR1 = 13 °C/s, TG = 460 °C and tG = 13 s, it is possible to obtain a galvanizing DP steel with minimum UTS of 1100 MPa, YS between 550 and 750 MPa and a minimum elongation of 10% with the final cooling rate (CR2) between 10 and 70 °C/s.
Analysis of the effect of the process variables of the thermal cycle presented in Figure 1 on the mechanical properties of the steel using and the statistical models developed, allow defining a process window in which the process parameters can be combined, so that the DP1100 steel can be produced. Of course, the applicability of the models developed is limited to the specific chemical composition and amount of deformation by cold rolling of the steel for which they were developed. In the present case, processing with HR1 = 35 °C/s; TIA = 800 °C, t2 = 60 s; CR1 = 12–30 °C/s, TG = 460 °C, tG = 13–17 s and CR2 = 15–30 °C/s, allow to obtain galvanizing DP steel with a minimum UTS of 1100 MPa, a maximum YS of 750 MPa and a minimum elongation to fracture of 10%.
It is important to emphasize that, from the results of the present investigation, it is clear that the holding time at 460 °C has the greatest influence on the resulting mechanical properties. The decrease in UTS when tG is increased is related to the lower amount of martensite produced as a result of the final cooling, due to the formation of bainite during the holding period at 460 °C. These results are in accordance with those reported by Bellhouse [2] that studied the effect of the holding time at 465 °C on the mechanical properties and microstructure of TRIP steels using a thermal cycle very similar to the one used in this work.

4. Conclusions

The models developed using the multivariate analysis combined with multi-objective optimization shown good prediction capabilities for the mechanical properties of DP steels processed under continuous galvanizing conditions with a prediction error less than 10%. With this model it is possible to design, from very specific chemical composition, different grades of galvanized DP steels with UTS higher than 1100 MPa.
It is possible to obtain dual phase microstructures with the steel chemistry selected in this investigation and the intercritical austenitization temperature of 800 °C. For this, an initial cooling rate to 460 °C of 13 °C/s, an interruption of cooling of 13 s at 460 °C and a final cooling rate of 25 °C/s seem to be most appropriate.
In relation to the effect of the heat treatment parameters, the results show that the holding time at the temperature of the zinc bath (460 °C) is the most significant variable for the processing of galvanized DP steels. The evolution of the microstructure and the final mechanical properties of these steel grades are directly controlled by this process parameter. The tG has a strong impact on the UTS, due to the transformation of the metastable austenite to bainite that causes that the UTS and YS decrease as the time of interruption increases.
Furthermore, the multivariate model results are agreed with the metallurgist knowledge about the phenomenon discussed in this study and the methodology applied can be used to another dataset like the variables used in this investigation, but it is important to consider the specific characteristics of each industrial process.

Author Contributions

P.C. performed the experiments, characterization and analysis of the data as part of her PhD. activities; G.A support in the metallurgical analysis and characterization; A.S. and F.G. conceived and design the experiments; G.A. and P.C. coordinated and planned the activities proposed in the methodology; A.S. and F.G. provided the materials, computer programs and other analysis tools; A.S. supervised the development of the methodology; P.C. and G.A. discussed the results and wrote the first draft of the manuscript; D.S.G.-G. support in the statistical analysis; All authors revised and approved the final version of the manuscript.

Funding

This research was funded by Consejo Nacional de Ciencia y Tecnología (CONACYT), grant number 379955.

Acknowledgments

The authors gratefully acknowledge the support and guidance provided by the International Zinc Association (IZA). A.S. and P.C. are indebted to CONACYT for support in the form at a graduate studies fellowship.

Conflicts of Interest

The authors declare no conflict of interest.

References

  1. Fonstein, N. Advanced High Strength Sheet Steels; Springer International: Chicago, IN, USA, 2015. [Google Scholar] [CrossRef]
  2. Bellhouse, E.M.; McDermid, J.R. Effect of continuous galvanizing heat treatments on the microstructure and mechanical properties of high Al-low Si transformation induced plasticity steels. Metall. Mater. Trans. A 2010, 41, 1460–1473. [Google Scholar] [CrossRef]
  3. Calcagnotto, M.; Ponge, D.; Raabe, D. Microstructure control during fabrication of ultrafine grained dual-phase steel: Characterization and effect of intercritical annealing parameters. ISIJ Int. 2012, 52, 874–883. [Google Scholar] [CrossRef]
  4. Park, I.J.; Kim, S.T.; Lee, I.S.; Park, Y.S.; Moon, M.B. A Study on Corrosion Behavior of DP-Type and TRIP-Type Cold Rolled Steel Sheet. Mater. Trans. 2009, 50, 1440–1447. [Google Scholar] [CrossRef] [Green Version]
  5. Sodjit, S.; Uthaisangsuk, V. Microstructure based prediction of strain hardening behavior of dual phase steels. Mater. Des. 2012, 41, 370–379. [Google Scholar] [CrossRef]
  6. Aslam, I.; Li, B.; Martens, R.L.; Goodwin, J.R.; Rhee, H.J.; Goodwin, F. Transmission electron microscopy characterization of the interfacial structure of a galvanized dual-phase steel. Mater. Charact. 2016, 120, 63–68. [Google Scholar] [CrossRef] [Green Version]
  7. Ebrahimian, A.; Banadkouki, S.G. Effect of alloying element partitioning on ferrite hardening in a low alloy ferrite-martensite dual phase steel. Mater. Sci. Eng. A 2016, 677, 281–289. [Google Scholar] [CrossRef]
  8. Tasan, C.C.; Diehl, M.; Yan, D.; Bechtold, M.; Roters, F.; Schemmann, L.; Zheng, C.; Peranio, N.; Ponge, D.; Koyama, M.; et al. An Overview of Dual-Phase Steels: Advances in Microstructure-Oriented Processing and Micromechanically Guided Design. Annu. Rev. Mater. Res. 2014, 45, 391–431. [Google Scholar] [CrossRef]
  9. Garcia, C.I.; Hua, M.; Cho, K.; Redkin, K.; DeArdo, A.J. Metallurgy and continuous galvanizing line processing of high-strength dual-phase steels microalloyed with Niobium and Vanadium. Metall. Ital. 2012, 104, 3–8. [Google Scholar]
  10. Niakan, H.; Najafizadeh, A. Effect of niobium and rolling parameters on the mechanical properties and microstructure of dual phase steels. Mater. Sci. Eng. A. 2010, 527, 5410–5414. [Google Scholar] [CrossRef]
  11. Wu, R.; Wang, L.; Jin, X. Thermal Stability of Austenite and Properties of Quenching & Partitioning (Q&P) Treated AHSS. Phys. Procedia 2013, 50, 8–12. [Google Scholar] [CrossRef] [Green Version]
  12. Ramazani, A.; Pinard, P.; Richter, S.; Schwedt, A.; Prahl, U. Characterisation of microstructure and modelling of flow behaviour of bainite-aided dual-phase steel. Comput. Mater. Sci. 2013, 80, 134–141. [Google Scholar] [CrossRef]
  13. Ramazani, A.; Mukherjee, K.; Quade, H.; Prahl, U.; Bleck, W. Correlation between 2D and 3D flow curve modelling of DP steels using a microstructure-based RVE approach. Mater. Sci. Eng. A 2013, 560, 129–139. [Google Scholar] [CrossRef]
  14. Ramazani, A.; Mukherjee, K.; Prahl, U.; Bleck, W. Modelling the effect of microstructural banding on the flow curve behaviour of dual-phase (DP) steels. Comput. Mater. Sci. 2012, 52, 46–54. [Google Scholar] [CrossRef]
  15. Ramazani, A.; Mukherjee, K.; Prahl, U.; Bleck, W. Transformation-Induced, Geometrically Necessary, Dislocation-Based Flow Curve Modeling of Dual-Phase Steels: Effect of Grain Size. Met. Mater. Trans. A 2012, 43, 3850–3869. [Google Scholar] [CrossRef]
  16. Schoof, E.; Schneider, D.; Streichhan, N.; Mittnacht, T.; Selzer, M.; Nestler, B. Multiphase-field modeling of martensitic phase transformation in a dual-phase microstructure. Int. J. Solids Struct. 2017, 134, 181–194. [Google Scholar] [CrossRef]
  17. Wei, X.; Asgari, S.; Wang, J.; Rolfe, B.; Zhu, H.; Hodgson, P. Micromechanical modelling of bending under tension forming behaviour of dual phase steel 600. Comput. Mater. Sci. 2015, 108, 72–79. [Google Scholar] [CrossRef]
  18. Pernach, M.; Bzowski, K.; Pietrzyk, M. Numerical modeling of phase transformation in dual phase (DP) steel after hot rolling and laminar cooling. Int. J. Multiscale Comput. Eng. 2014, 12, 397–410. [Google Scholar] [CrossRef]
  19. Bzowski, K.; Rauch, L.; Pietrzyk, M. Application of statistical representation of the microstructure to modeling of phase transformations in DP steels by solution of the diffusion equation. Procedia Manuf. 2018, 15, 1847–1855. [Google Scholar] [CrossRef]
  20. Kim, S.-J.; Cho, Y.-G.; Oh, C.-S.; Kim, D.E.; Moon, M.B.; Han, H.N. Development of a dual phase steel using orthogonal design method. Mater. Des. 2009, 30, 1251–1257. [Google Scholar] [CrossRef]
  21. Van, H.D.; Van, C.N.; Ngoc, T.T.; Manh, T.S. Influence of heat treatment on microstructure and mechanical properties of a CMnSi TRIP steel using design of experiment. Mater. Today Proc. 2018, 5, 24664–24674. [Google Scholar] [CrossRef]
  22. Ray, P.; Ganguly, R.; Panda, A. Optimization of mechanical properties of an HSLA-100 steel through control of heat treatment variables. Mater. Sci. Eng. A 2003, 346, 122–131. [Google Scholar] [CrossRef]
  23. Lombardi, A.; Ravindran, C.; Mackay, R. Optimization of the solution heat treatment process to improve mechanical properties of 319 Al alloy engine blocks using the billet casting method. Mater. Sci. Eng. A 2015, 633, 125–135. [Google Scholar] [CrossRef]
  24. Cavaliere, P.; Perrone, A.; Silvello, A. Multi-objective optimization of steel nitriding. Eng. Sci. Technol. Int. J. 2016, 19, 292–312. [Google Scholar] [CrossRef] [Green Version]
  25. Chaouch, D.; Guessasma, S.; Sadok, A. Finite Element simulation coupled to optimisation stochastic process to assess the effect of heat treatment on the mechanical properties of 42CrMo4 steel. Mater. Des. 2012, 34, 679–684. [Google Scholar] [CrossRef]
  26. Cartuyvels, R.; Booth, R.; Dupas, L.; De Meyer, K. Process technology optimization using an integrated process and device simulation sequencing system. Microelectron. Eng. 1992, 19, 507–510. [Google Scholar] [CrossRef]
  27. Singla, Y.K.; Arora, N.; Dwivedi, D. Dry sliding adhesive wear characteristics of Fe-based hardfacing alloys with different CeO2 additives—A statistical analysis. Tribol. Int. 2017, 105, 229–240. [Google Scholar] [CrossRef]
  28. Correia, D.S.; Gonçalves, C.V.; Da Cunha, S.S.; Ferraresi, V.A.; da Cunha, S.S., Jr. Comparison between genetic algorithms and response surface methodology in GMAW welding optimization. J. Mater. Process. Technol. 2005, 160, 70–76. [Google Scholar] [CrossRef]
  29. Benyounis, K.; Olabi, A. Optimization of different welding processes using statistical and numerical approaches—A reference guide. Adv. Eng. Softw. 2008, 39, 483–496. [Google Scholar] [CrossRef]
  30. Šumić, Z.; Vakula, A.; Tepić, A.; Čakarević, J.; Vitas, J.; Pavlić, B. Modeling and optimization of red currants vacuum drying process by response surface methodology (RSM). Food Chem. 2016, 203, 465–475. [Google Scholar] [CrossRef]
  31. Reisgen, U.; Schleser, M.; Mokrov, O.; Ahmed, E. Statistical modeling of laser welding of DP/TRIP steel sheets. Opt. Laser Technol. 2012, 44, 92–101. [Google Scholar] [CrossRef]
  32. Cruz, C.; Hiyane, G.; Mosquera-Artamonov, J.D.; L, J.M.S. Optimización del proceso de soldadura GTAW en placas de Ti6Al4V. Soldag. Insp. 2014, 19, 2–9. [Google Scholar] [CrossRef]
  33. Miguel, V.; Martínez-Conesa, E.J.; Segura, F.; Manjabacas, M.C.; Abellan, E. Optimización del proceso de soldadura GMAW de uniones a tope de la aleación AA 6063-T5 basada en la metodología de superficie de respuesta y en la geometría del cordón de soldadura. Rev. Met. 2012, 48, 333–350. [Google Scholar] [CrossRef]
  34. Nieto, P.J.G.; Suárez, V.M.G.; Antón, J.C.A.; Bayón, R.M.; Blanco, J.A.S.; María, A.; Fernández, A. A New Predictive Model of Centerline Segregation in Continuous Cast Steel Slabs by Using Multivariate Adaptive Regression Splines Approach. Materials 2015, 8, 3562–3583. [Google Scholar] [CrossRef] [Green Version]
  35. Chang, L.; Chen, T.R.; Pan, Y.T.; Yang, K.C. Practical method for producing galvanised Dual Phase steels with superior strength-ductility combination. Mater. Sci. Technol. 2009, 25, 1265–1270. [Google Scholar] [CrossRef]
  36. Colla, V.; DeSanctis, M.; DiMatteo, A.; Lovicu, G.; Valentini, R. Prediction of Continuous Cooling Transformation Diagrams for Dual-Phase Steels from the Intercritical Region. Met. Mater. Trans. A 2011, 42, 2781–2793. [Google Scholar] [CrossRef]
  37. Ding, W.; Hedström, P.; Li, Y. Heat treatment, microstructure and mechanical properties of a C–Mn–Al–P hot dip galvanizing TRIP steel. Mater. Sci. Eng. A 2016, 674, 151–157. [Google Scholar] [CrossRef]
  38. Rencher, A.C. Methods of Multivariate Analysis, 2nd ed.; John Wiley & Sons Inc.: Danvers, MA, USA, 2002. [Google Scholar] [CrossRef]
  39. Bezerra, M.A.; Santelli, R.E.; Oliveira, E.P.; Villar, L.S.; Escaleira, L.A. Response surface methodology (RSM) as a tool for optimization in analytical chemistry. Talanta 2008, 76, 965–977. [Google Scholar] [CrossRef]
  40. López, J. Optimización Multi-objetivo: Aplicaciones a problemas del mundo real, 1st ed.; Editorial de la Universidad Nacional de La Plata: Buenos Aires, Argentina, 2014. [Google Scholar] [CrossRef]
  41. Montgomery, D.C. Diseño y análisis de experimentos, 2nd ed.; Editorial Limusa, S.A. de C.V.: Distrito Federal, Mexico, 2004. [Google Scholar]
  42. Delgado, S.C.; Palacio, S.R.; Barajas, F.H. Comparación de Pruebas de Normalidad Multivariada. In Proceedings of the XXVI Simposio Internacional de Estadística, Sincelejo, Sucre, Colombia, 8–12 August 2016; pp. 1–4. [Google Scholar]
  43. Breusch, T.S.; Pagan, A.R. A Simple Test for Heteroscedasticity and Random Coefficient Variation. Econometrica 1979, 47, 1287–1294. [Google Scholar] [CrossRef]
  44. Fonstein, N.; Jun, H.; Huang, G.; Sadagopan, S.; Yan, B. Effect of Bainite on Mechanical Properties of Multiphase Ferrite-Bainite-Martensite Steels. Mater. Sci. Technol. 2011, 1, 634–641. [Google Scholar]
Figure 1. Schematic representation of an idealized continuous galvanizing cycle for the production of galvanized AHSS- dual phase steel strips.
Metals 09 00703 g001
Figure 2. Calculated TTT (a) and CCT (b) diagrams for the steel investigated. The calculation was performed assuming a TIA = 800 °C.
Metals 09 00703 g002
Figure 3. Dimensions of miniature tensile test specimens used in dilatometry experiments.
Metals 09 00703 g003
Figure 4. Pareto front for the results of multi-objective optimization.
Metals 09 00703 g004
Figure 5. Results of mechanical properties for the experimental tests with optimization results.
Metals 09 00703 g005
Figure 6. Microstructure of TVF-3 heat treated sample: (a) 2500× and (b) 10,000×; B: Cainite; α: Ferrite and α’: Martensite.
Metals 09 00703 g006
Figure 7. Effect of CR1 on mechanical properties of dual phase (DP) steel. Calculations with statistical models.
Metals 09 00703 g007
Figure 8. Effect of interruption of cooling (tG) on the mechanical properties of DP steel. Calculations with statistical models.
Metals 09 00703 g008
Figure 9. Effect of CR2 on UTS mechanical properties in DP steel. Calculations with statistical models.
Metals 09 00703 g009
Table 1. Chemical composition of the experimental steel.
ElementCSiMnPSCrMoNiB
wt. %0.1540.2601.9060.0130.00090.4130.1080.0480.0010
ElementAlCuNbTiVCaNFe + Impurities
wt. %0.0360.0180.0040.0440.0080.0010.0036Balance
Table 2. Independent process variables and experimental design levels.
NotationProcess Variable UnitLevel
Low
−1
High
+1
x1Cooling rate (CR1)°C/s10110
x2Hold time (tG)s320
x3Cooling rate (CR2)°C/s10110
Table 3. Design matrix with independent process variables.
RunProcess Variables
CR1tGCR2
°C/ss°C/s
1301790
2101160
31101160
4601160
590630
6601110
7301730
830690
930630
1090690
11602060
12601160
136011110
14901790
15601160
16901730
1760360
Table 4. Mechanical properties for each of the experimental combination (standard deviation in brackets).
RunResponse VariablesRunResponse Variables
UTSYSELUTSYSEL
MPaMPa%MPaMPa%
11142 (3)729 (13)11.3 (3.3)101274 (13)959 (30)8.6 (0.6)
21174 (34)754 (21)12.1 (3.1)111123 (4)730 (28)9.9 (1.2)
31237 (1)829 (7)10.3 (0.5)121187 (9)828 (17)10.5 (1.8)
41245 (4)853 (9)10.8 (0.6)131203 (20)781 (13)10.7 (0.3)
51264 (6)890 (19)8.3 (0.7)141145 (13)779 (24)9.4 (1.6)
61141 (18)745 (31)9.9 (1.6)151199 (8)844 (33)9.5 (1.1)
71131 (32)725 (18)10.7 (0.9)161166 (12)777 (16)10.1 (0.8)
81226 (3)841 (20)8.6 (1.3)171294 (31)1015 (11)8.0 (0.6)
91196 (8)791 (11)9.8 (0.8)----
Table 5. Pearson correlation test between the response variables.
VariableUTSYS
YS0.926
0.000
-
EL−0.570
0.017
−0.717
0.001
Contents of the cell: Pearson Correlation
p-value
Table 6. Breusch-Pagan test for verification of the homogeneity of the variance of the residuals for each response variable.
Studentized Breusch-Pagan Test
Model p-Value
(UTS ~ V1 + t2 + V2)0.71
(YS ~ V1 + t2 + V2)0.2588
(EL ~ V1 + t2 + V2)0.6142
Table 7. p-Values for multivariate analysis of variance (MANOVA).
TermsValor–P
V10.0432031
t20.0003479
V20.5830329
V1t20.7387451
t2V20.8638424
V1V20.6460354
Table 8. Results of the multi-objective optimization using the models.
TestCR1
(°C/s)
tG
(s)
CR2
(°C/s)
Model ResultsExperimental Results
UTS
(MPa)
YS
(MPa)
EL
(%)
UTS
(MPa)
YS
(MPa)
EL
(%)
TVF-1101526112069811.3114074910.5
TVF-2101513111669211.2110968310.7
TVF-3131325114473210.9111673411.3
TVF-4171415112670811.0112976711.6
TVF-5151524112370411.1116275710.6

