Article

Corrosion Behavior of Fe-Ni-Al Alloy Inert Anode in Cryolite Melts

1
School of Metallurgy, Northeastern University, Shenyang 110004, China
2
Key Laboratory for Ecological Metallurgy of Multimetallic Mineral (Ministry of Education), Shenyang 110004, China
*
Author to whom correspondence should be addressed.
Metals 2019, 9(4), 399; https://doi.org/10.3390/met9040399
Submission received: 14 January 2019 / Revised: 26 March 2019 / Accepted: 29 March 2019 / Published: 1 April 2019
(This article belongs to the Special Issue High-Temperature Corrosion and Oxidation of Metals)

Abstract

:
Fe-Ni-based alloys are promising materials of inert anodes for use in aluminum electrolysis and adding Al can further improve the corrosion resistance. Fe-Ni-Al alloys with 1.4–8.6 wt.% Al were prepared by vacuum melting, and their corrosion as anodes during the production of pure Al (98.14–99.68%) by electrolysis was studied in a melt of NaF-AlF3-NaCl-CaF2-Al2O3 at 850 °C. The corrosion layer on the anode contains fluorine salt that corrodes the oxide film, and the inner layer is Ni-enriched while the outer layer is enriched with Fe and O due to the preferential oxidation of Fe. The electrolytically deposited oxide films on Fe-Ni-Al alloys with different compositions contains Fe2O3, Fe3O4, NiO, Al2O3, FeAl2O4, NiFe2O4, and other protective oxides, making the alloys very corrosion-resistant. The linear voltammetric curves can be divided into three parts: active dissolution, passivation transition, and over-passivation zones. The alloy with 3.9 wt.% Al (57.9Fe-38.2Ni-3.9Al) has a relatively negative passivation potential, and therefore, is easier to become passivated. According to the Tafel curve, this alloy shows a relatively positive corrosion potential as anode (1.20 V vs. Al/AlF3), and thus can form a protective film.

1. Introduction

Carbon anodes used in the primary aluminum industry lead to high energy consumption, serious pollution, and other issues. The adoption of inert anodes may significantly improve this situation, by avoiding the production of greenhouse gases of CO2, CF4, and C2F6 as well as other harmful gases [1], and avoiding the high cost of making carbon anodes [2]. However, at present, inert anodes are not applied industrially, mainly due to the lack of suitable materials with excellent resistance against oxidation and corrosion and good thermal and electrical conductivities under the conditions of cryolite-alumina molten salt electrolysis. The total reaction formula on the inert anode in aluminum electrolysis is Al2O3 → 2Al + 3/2O2, and the generated gas is not CO2 but O2. Therefore, the inert anodes reduce greenhouse gas emissions, increase current efficiency of the cell, and are economically advantageous [3].
The proposed inert anodes mainly fall into three categories: ceramic anodes, cermet anodes, and metal anodes. Ceramic anodes have excellent oxidation resistance and relatively good corrosion resistance, albeit with poor conductivity and bad machinability. Due to defects in the ceramic, the addition of metal to form a ceramic metal anode improves the performance. For example, our research group tested Fe-Ni-Al2O3 materials as inert anode, but found that they are difficult to use under the harsh conditions of Al electrolysis [4]. Alcoa has conducted industrial tests of Cu-FeNi2O4 anodes, but those anodes still have the characteristics of ceramics and cannot be used industrially. In contrast, metal anodes are considered the best candidates and studied the most, because of their good conductivity, easy processing, etc. Nevertheless, their poor oxidation resistance needs to be overcome. Previous studies indicate that anodes based on the NiFe2O4 oxide layer are very promising [5,6]. Hence, many scholars have studied Fe-Ni based inert anodes [7,8,9,10,11,12,13]. Our group’s exploration of Cu-Ni-Fe and Cu-Ni-Al alloy materials showed that the Cu-Ni-Al anodes possess excellent corrosion resistance, but the electrolysis process is affected by alumina concentrations in the molten salt [14]. The ideal metal anode must satisfy the rigorous requirement for the formation of oxide film [7]. In the process of electrolysis, an oxide film can be formed in situ on the surface of the alloy [15], and its formation and dissolution rates need to reach a dynamic balance [16]. A dense, conductive, and moderately thick metal oxide film that does not affect the electrolysis is necessary, to protect the alloy matrix in the anode from erosion in the high-temperature and highly corrosive molten salt.
Another study of the Fe-Ni binary alloy anode showed that pre-oxidation can improve the corrosion resistance of these anodes by forming a stable and impermeable NiFe2O4 film. However, the film growth is disordered and uneven during the subsequent electrolysis, the surface adhesion is poor, and the contact between the molten salt and metal can be isolated by forming a reaction layer [7]. Furthermore, the study of Cu-Ni-Fe-based anodes shows that the surface of these alloys can form a protective NiFe2O4 layer with strong self-repairing ability. However, the porous Cu-depleted region formed in the film facilitates electrolyte penetration and affects the long-term performance of the alloy, and there is also Cu contamination in the product aluminum [17,18,19,20].
In this study, Fe-Ni-Al alloys were prepared and tested as inert anodes. On one hand, these alloys share the high melting point of Fe-Ni alloy and slower corrosion of the surface oxide film. On the other hand, the addition of Al as an alloying element does not affect the purity of the Al product, and so here we added it into Fe-Ni alloy to improve its microstructure. As reported in the literature the Fe-Ni-Al alloy contains primary dendrites of an ordered B2 phase and the precipitated phase. The new microstructure of the alloy was believed to help improve its performance in high-temperature applications [21]. Therefore, the main aim of this study is to evaluate how the content of Al in alloy improves the performance of anodic corrosion resistance.

2. Materials and Methods

2.1. Preparation of Anodes

The Fe-Ni-Al alloy samples were prepared by a vacuum smelting process with a medium-frequency induction furnace (ZGL-1, Jinzhou Hangxing Vacuum Equipment Co., LTD, Jinzhou, China) at 1600 °C. The raw materials of iron shot (99.9%) and aluminum shot (99.9%) were obtained from Alfa Aesar, while the nickel shot (99.9%) was obtained from Jinchuan Group Co., LTD (Jinchang, China). All materials were used as purchased. Our previous research [22] showed that when the mass ratio of Fe to Ni in the alloy is 1.42, the sample has good corrosion resistance. Therefore, here the mass ratio of Fe to Ni was fixed at this value, while the amount of aluminum in the alloy was varied at 1.4–8.6 wt.%.

2.2. Galvanostatic Electrolysis

Electrolysis tests were performed at 850 °C for 5 h with a direct-current regulated power supply (S0-30A3-30V/15ab, Shenyang Rectifier Factory, Shenyang, China) in a molten salt (39.3NaF-43.7AlF3-8NaCl-5CaF2-4Al2O3) consisting of 39.3 wt.% NaF, 43.7 wt.% AlF3, 8 wt.% NaCl, 5 wt.% CaF2 and 4 wt.% Al2O3. The Fe-Ni-Al alloy samples were processed into cylindrical anodes with a height of 30 mm and a diameter of 20 mm. A graphite crucible was used as the cathode. The anodic current density was 0.75 A·cm−2, and the interpolar distance was kept at 4.0 cm. Pre-oxidation treatment is believed to help enhance corrosion resistance of the alloy [23,24]. So, prior to electrolysis the anode was suspended above the electrolyte and pre-oxidized for 30 min to produce a protective oxide layer on its surface. During the electrolysis experiment, alumina was added every 30 min to ensure a sufficient concentration, and the operation was carried out in air without gas protection. After electrolysis, the surface of the anode samples was characterized by X-ray diffraction (XRD) (X’Pert Pro; PANalyti-cal B.V., Almelo, The Netherlands), while their cross-section was characterized by scanning electron microscopy (SEM, Carl Zeiss AG, Oberkochen, Germany) and energy dispersive spectroscopy (EDS) (Carl Zeiss AG, Oberkochen, Germany) to investigate the chemical species, morphology, and elemental composition.

2.3. Electrochemistry Tests

Linear voltammetry curves of the alloys were measured with an electrochemical workstation (Autolab, The Netherlands) using a three-electrode system. For the working electrode, the Fe-Ni-Al alloy sample was cut to 4 mm × 8 mm × 20 mm, and a hole with diameter of 2 mm was drilled in the upper part for suspension. The reference electrode was Al/AlF3, which was prepared by placing 0.5 g high-purity aluminum in a high-purity corundum tube with an inner diameter of 6 mm that was sealed at one end, and a small hole with a diameter of 1 mm was opened at 1 cm from the bottom of the corundum tube. The counter electrode was the graphite crucible with an outer diameter of 90 mm, inner diameter of 70 mm, height of 100 mm, and bottom thickness of 15 mm. After the electrolyte was melted, the working and the reference electrodes were immersed in the electrolyte for 5 min for pre-polarization to remove any possible oxide film on the surface of the electrode. After the open circuit potential was stabilized, the linear volt-ampere curves of the alloys were measured at the scan rate of 0.005 V·s−1, and the scan range is from the open potential (1.19 V) to 3.5 V. The Tafel polarization curves were recorded at the scan rate of 0.01 V·s−1, and the scan range is from 0.5 to 2.0 V.

3. Results and Discussion

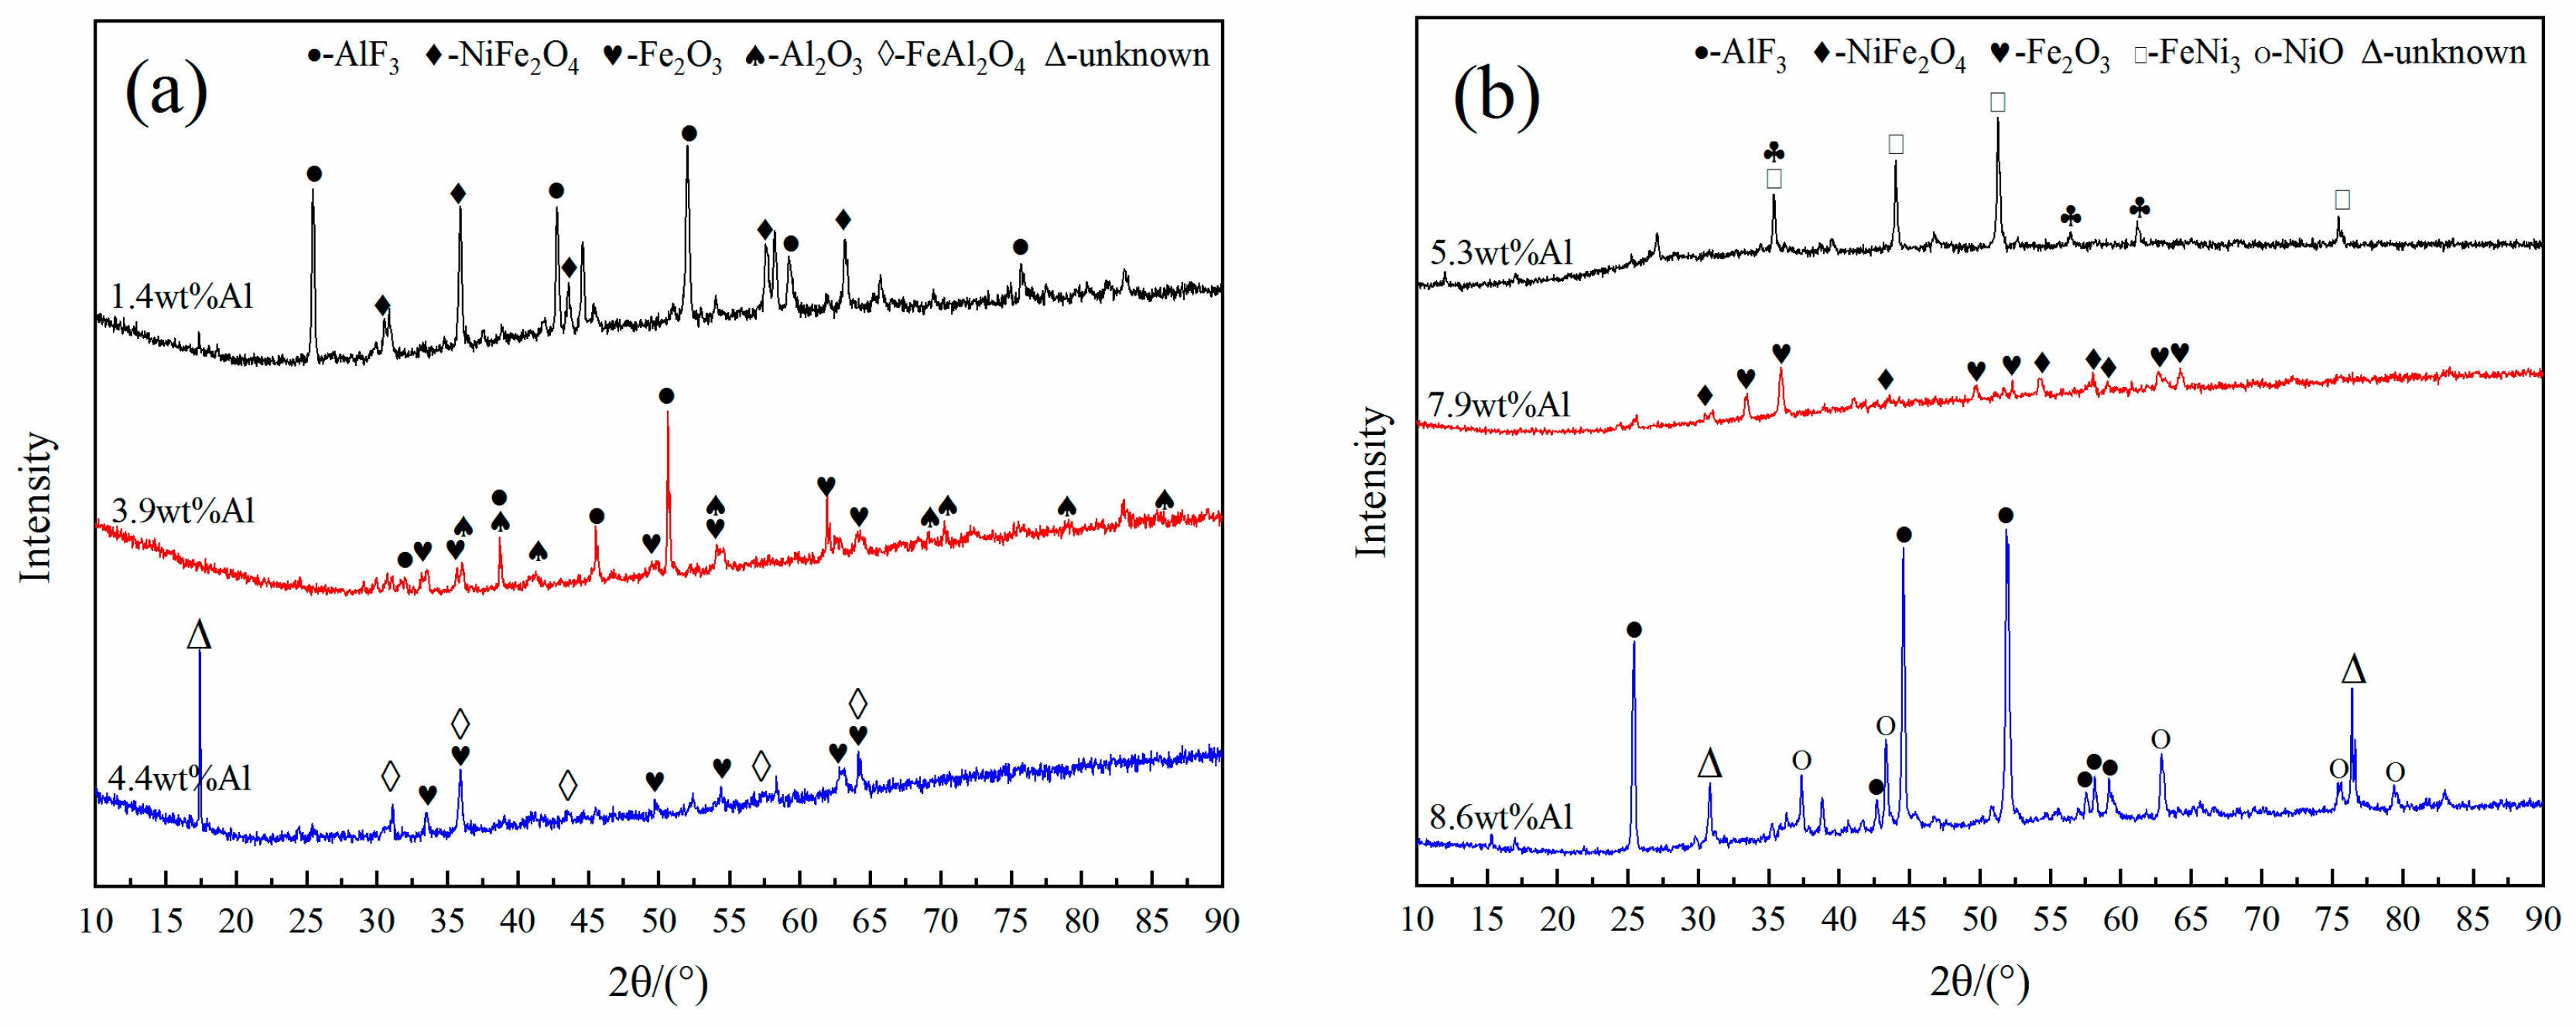
3.1. Material Characterization of Fe-Ni-Al Inert Anodes

The chemical compositions of the alloys were analyzed by inductively coupled plasma-mass spectrometry (ICP-MS) (Optima 4300DV, DuPont, Wilmington, DE., USA). The mass fractions of aluminum in the alloys were 1.4–8.6 wt.%, and the alloys were denoted accordingly as 58.2Fe-40.4Ni-1.4Al, 57.9Fe-38.2Ni-3.9Al, 56.1Fe-39.5Ni-4.4Al, 56.8Fe-37.9Ni-5.3Al, 52.9Fe-39.2Ni-7.9Al, and 54.1Fe-37.3Ni-8.6Al. The cross-section of the alloy samples was characterized by SEM. The distribution of iron, nickel, and aluminum elements was uniform in all these alloys. As the SEM/EDS images are very similar, here we only show results of 54.1Fe-37.3Ni-8.6Alalloy as an example. From the Fe-Ni, Fe-Al, and Ni-Al [25] binary phase diagrams, Fe and Ni are infinitely mutually soluble at high temperatures, and Al is solid soluble in Fe and Ni at the same time. When the amount of aluminum is 1.4–7.9 wt.%, the element distribution of Fe, Ni, and Al is uniform. When the amount of Al increases to 8.6 wt.%, as shown in Figure 1 specially, its distribution exhibits a grid-like local enrichment phenomenon, while the distribution of the three elements is still uniform.

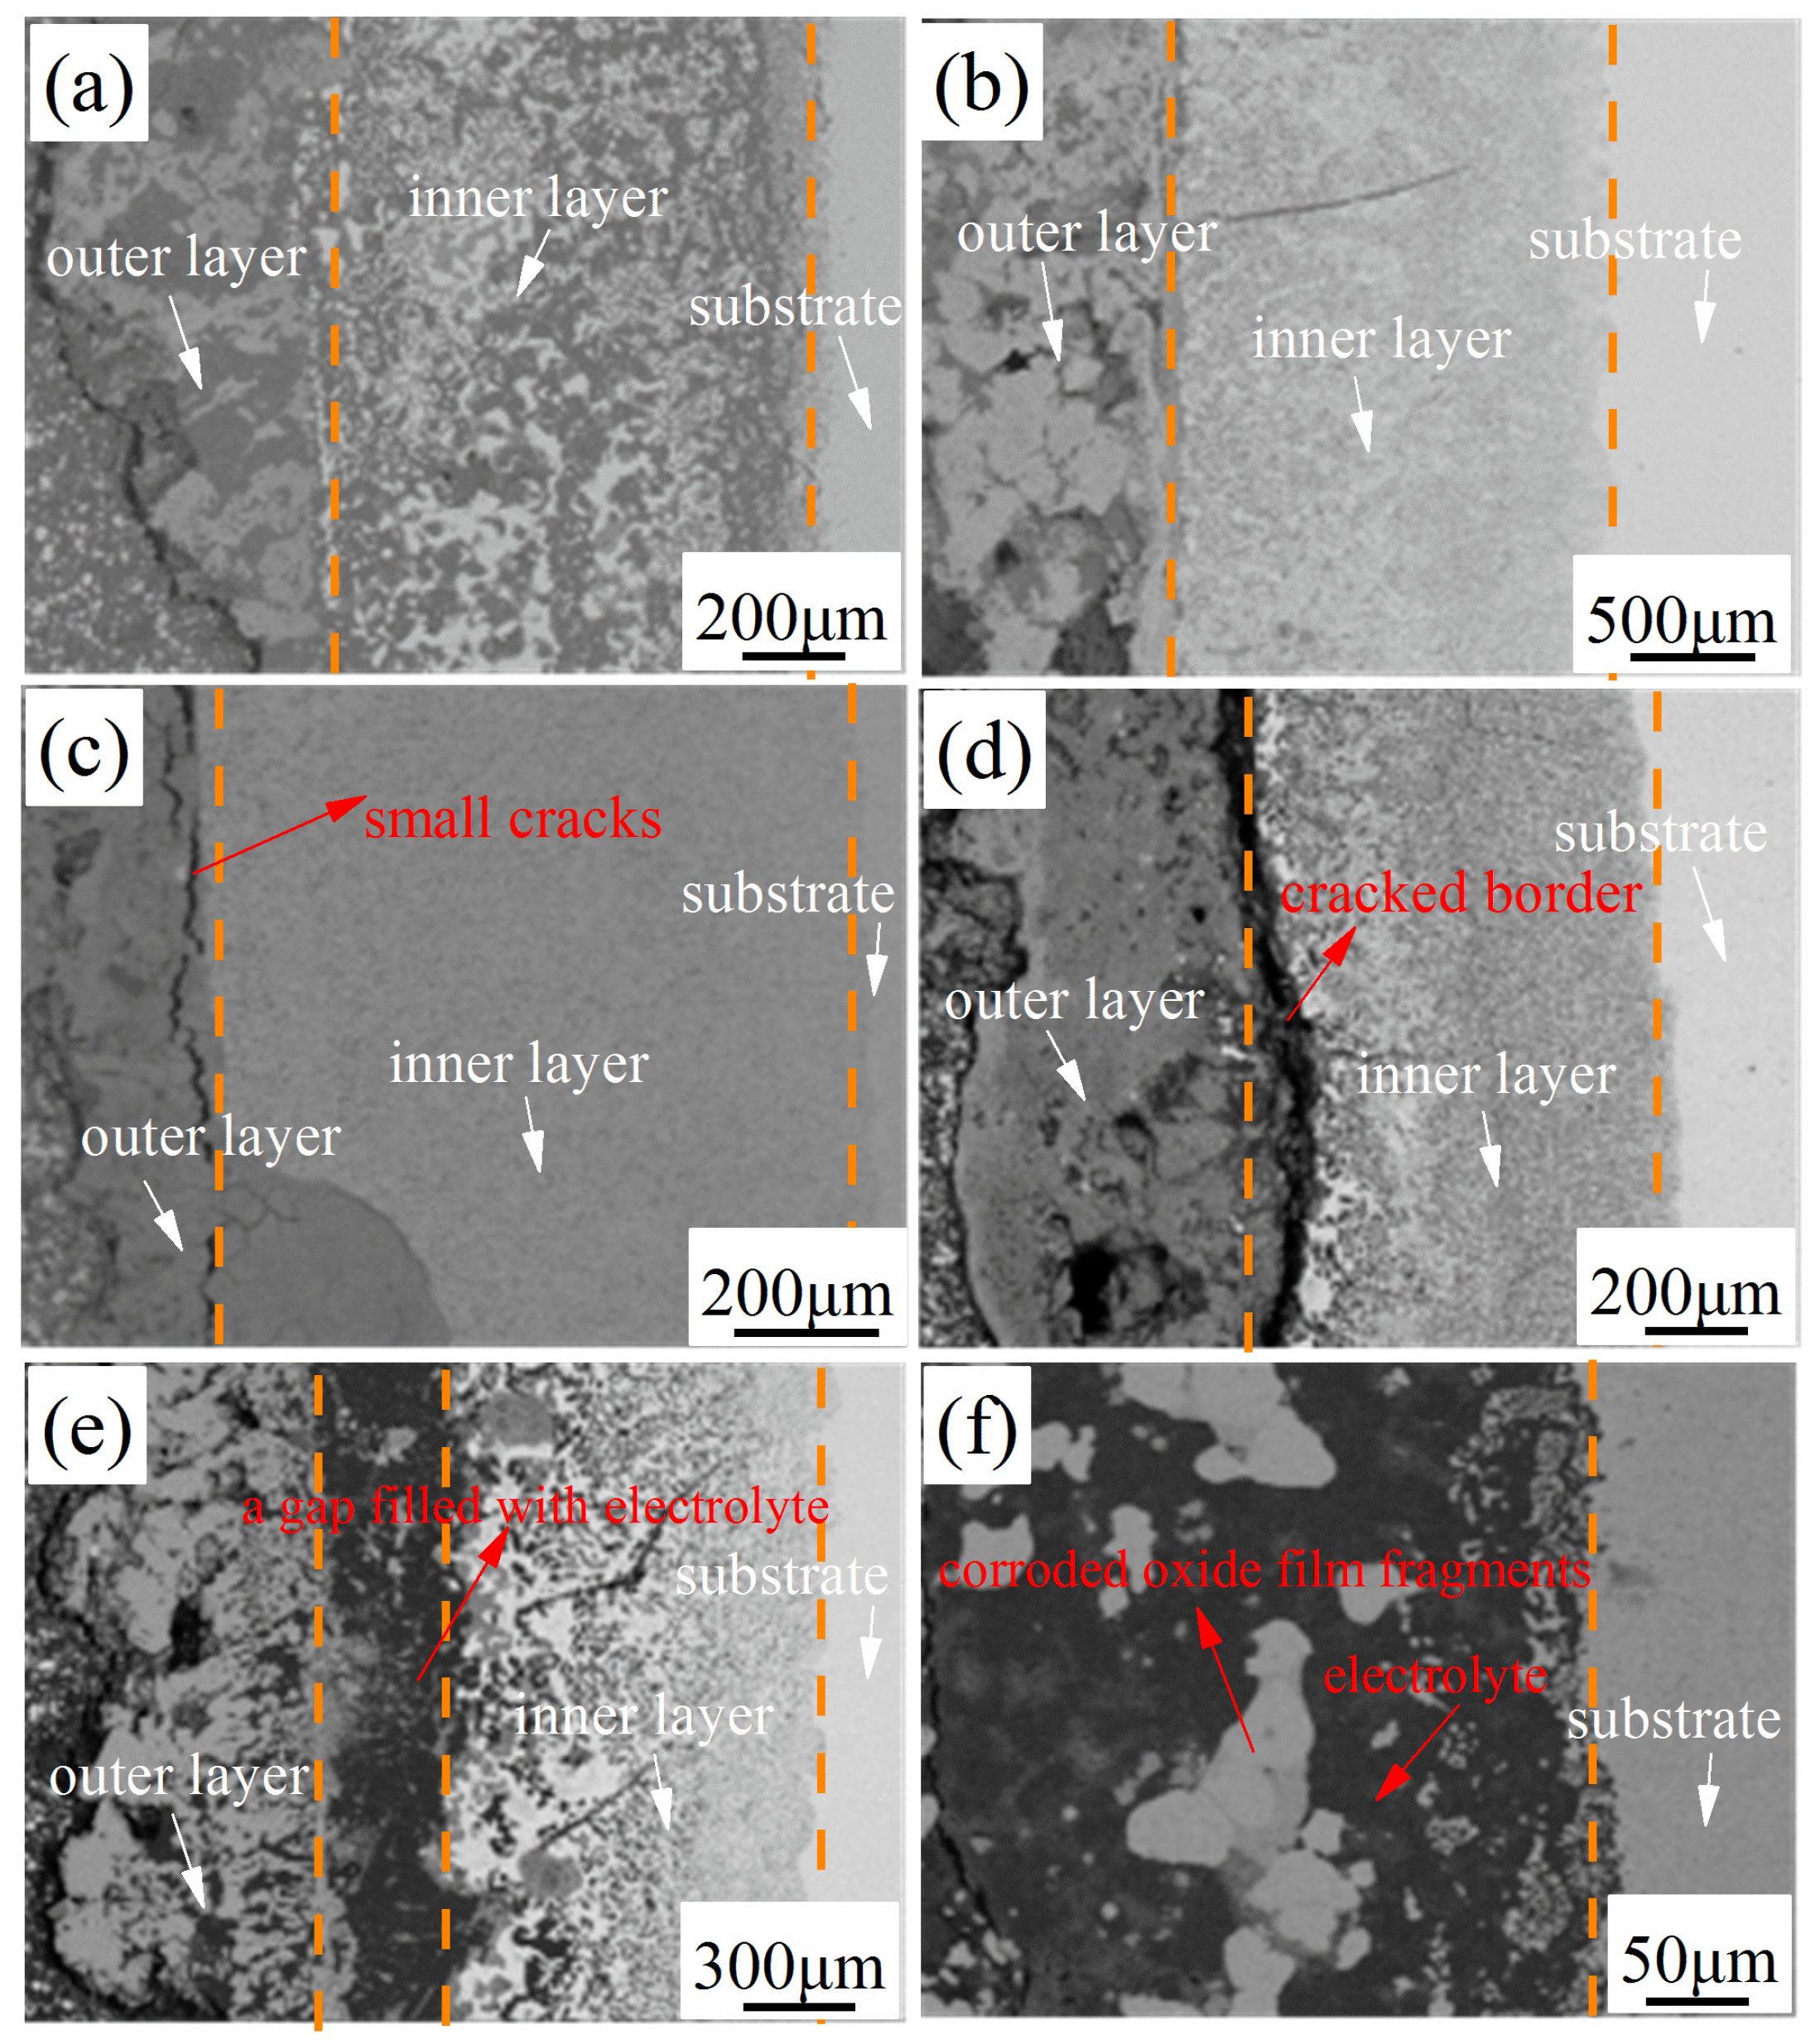
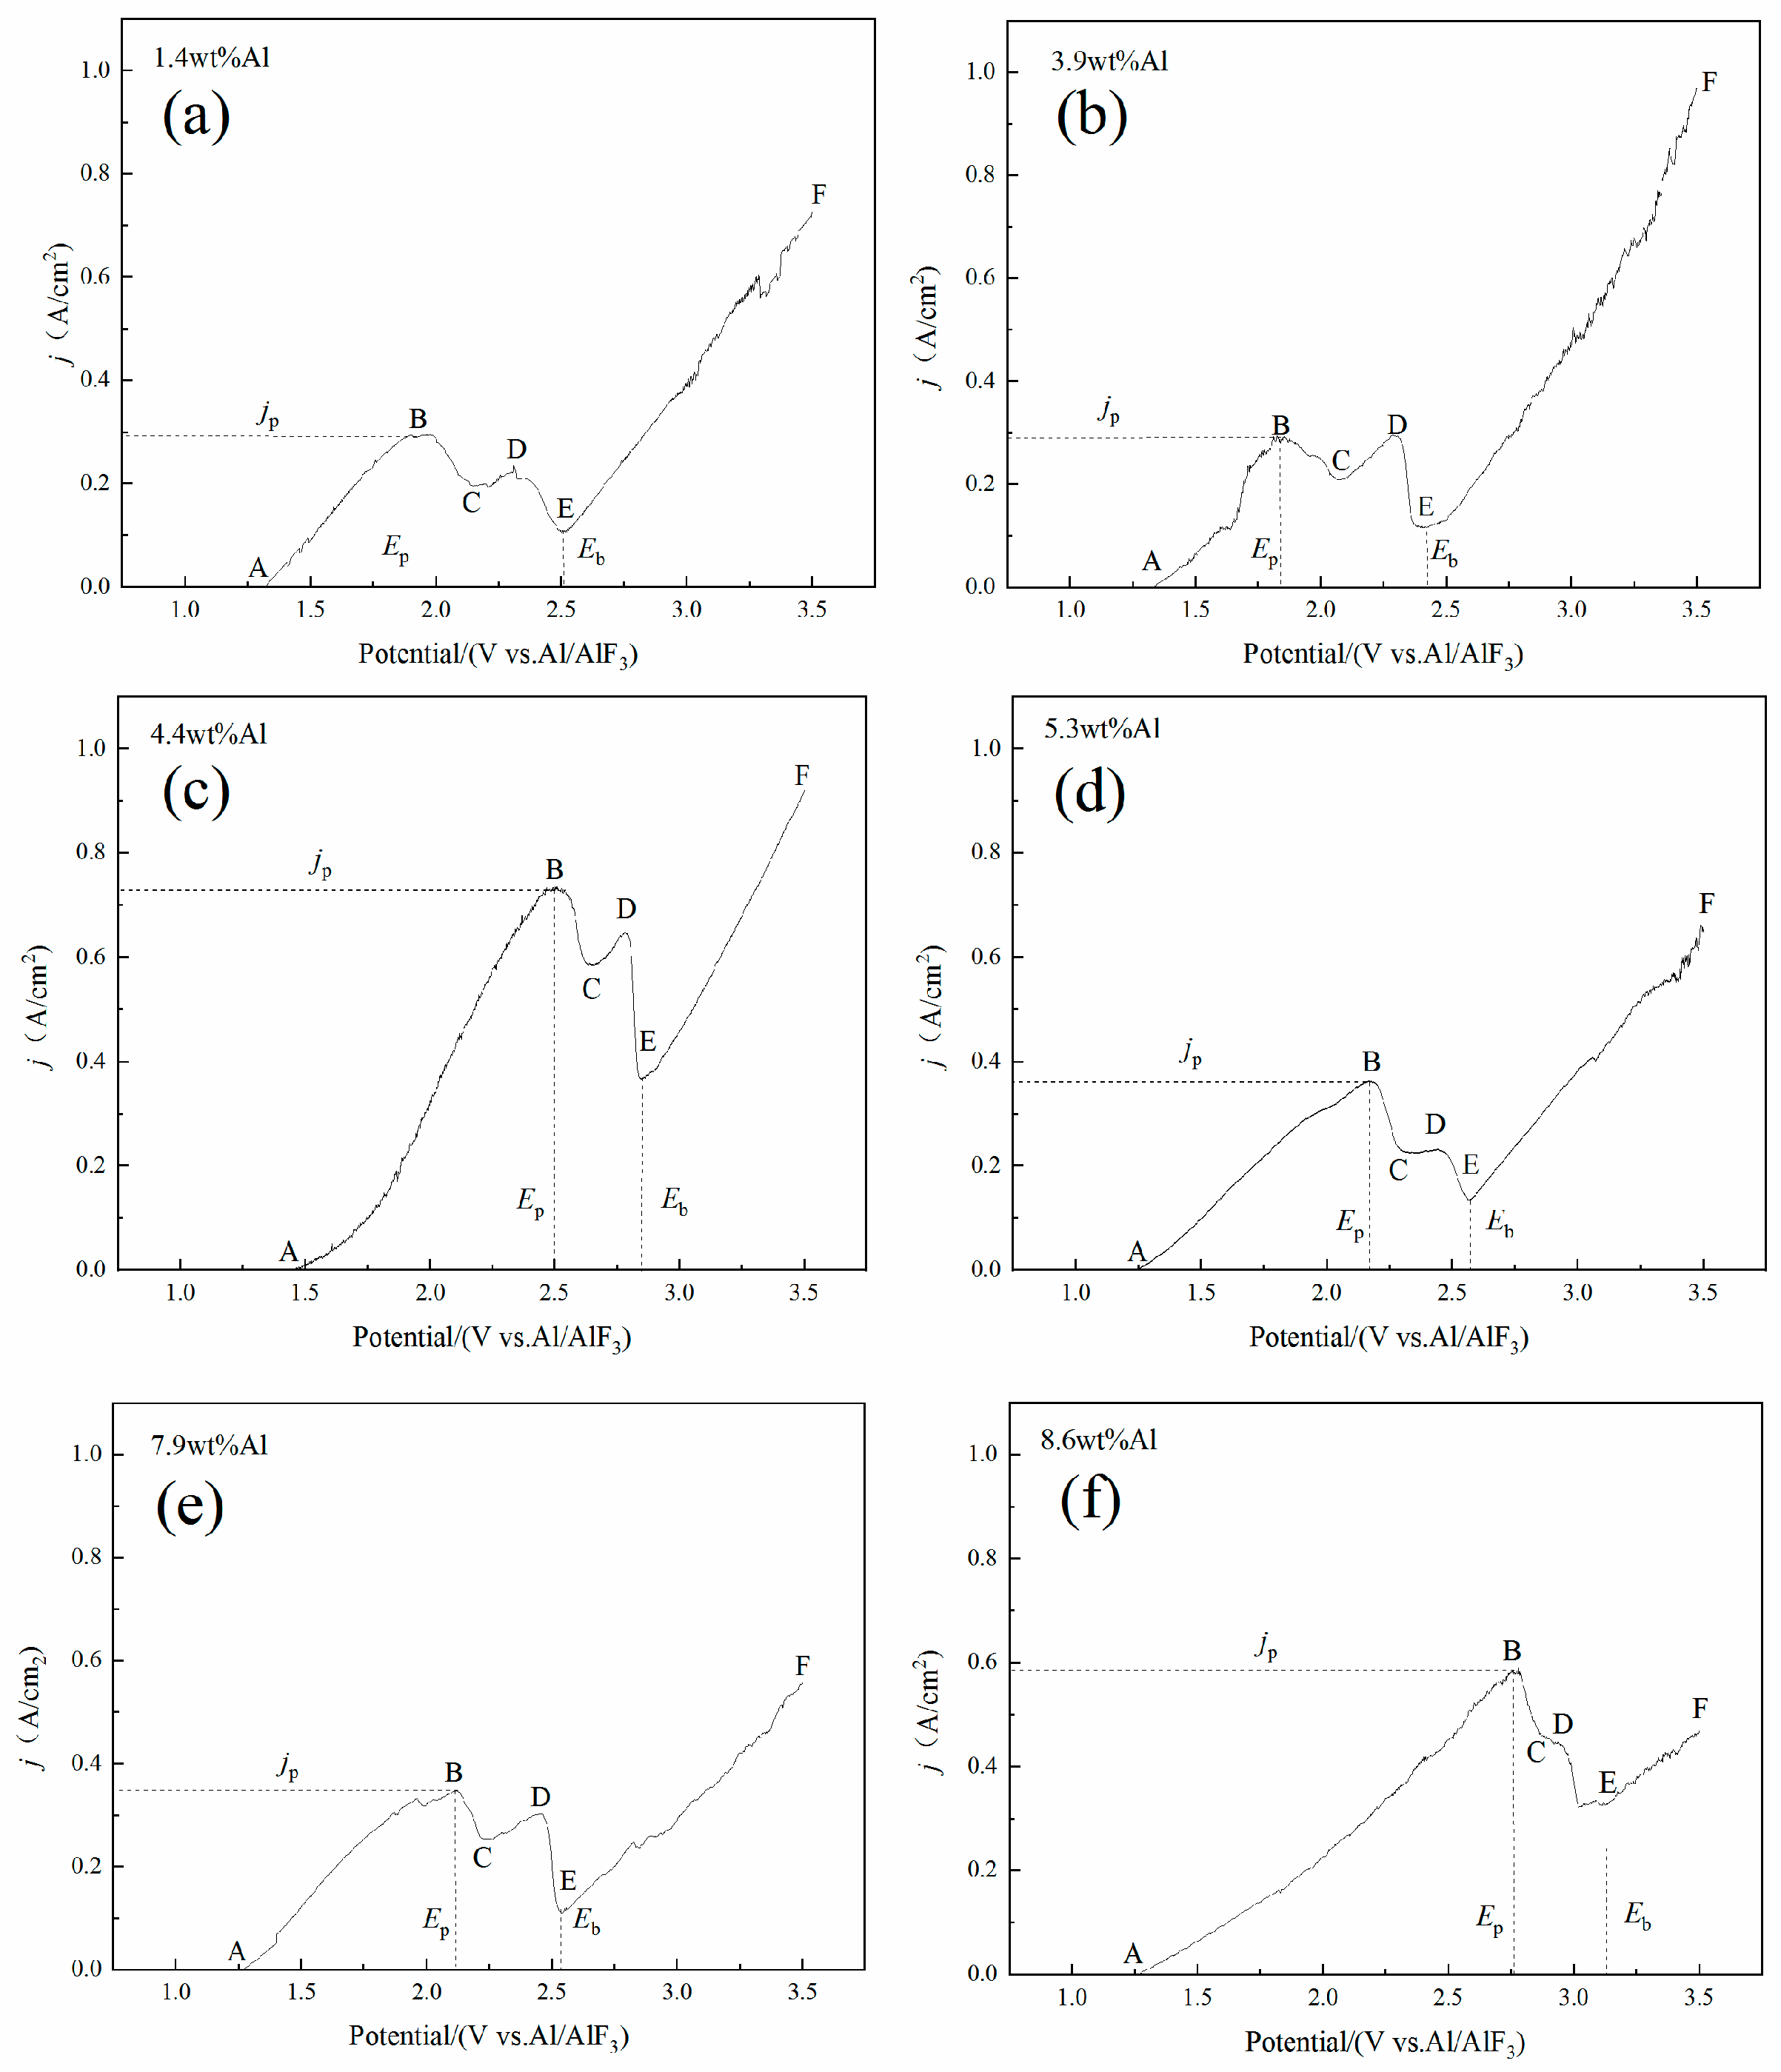
3.2. Corrosion Behavior of Fe-Ni-Al Inert Anodes in Al Electrolysis Process

During the electrolysis, a large number of bubbles were generated at the anode-electrolyte interface, and small bubbles crowded together to form a rolling bubble layer. The gas was oxygen generated by the decomposition of alumina during electrolysis:
2Al2O3 → 4Al + 3O2
The surface of Fe-Ni-Al alloy anodes appeared black with a brick red oxide film. We can see a very thick corrosion layer from the cross section. The aluminum obtained by electrolysis was remelted in 47.5 wt.% NaCl-47.5 wt.% KCl-5 wt.% Na3AlF5 at 700 °C for 1 h to obtain aluminum beads, which were silvery white and have metallic luster. As shown in Table 1, the purity of the aluminum beads measured by ICP-MS ranges from 98.14% to 99.68%. The main impurities are Fe and Ni, which are derived from the corroded anode and entered the molten salt to finally deposit in the aluminum liquid on the cathode. From Table 1, the cathode contained significantly more Fe impurity than Ni, indicating that the corrosion of Fe was relatively easier.
From the XRD results in Figure 2, the surface of Fe-Ni-Al alloy anodes after electrolytic corrosion contains oxide and spinel phases. When the aluminum content is 1.4 wt.%, the phase composition is AlF3 and NiFe2O4; at 3.9 wt.% Al the phase composition is Al2O3, Fe2O3, and AlF3; at 4.4 wt.% it is Fe2O3 and FeAl2O4; at 5.3 wt.% it is FeNi3 and Fe3O4; at 7.9 wt.% it is Fe2O3 and NiFe2O4, and at 8.6 wt.% it is NiO and AlF3. Therefore, after electrolytic corrosion, a Fe2O3 oxide film was formed on the surface of 57.9Fe-38.2Ni-3.9Al, 56.1Fe-39.5Ni-4.4Al, and 52.9Fe-39.2Ni-7.9Al alloys; an iron-nickel spinel oxide film was formed on the 58.2Fe-40.4Ni-1.4Al and 52.9Fe-39.2Ni-7.9Al alloys; and an iron-aluminum spinel oxide film was formed on the 56.1Fe-39.5Ni-4.4Al alloy. In particular, Al2O3 was formed on the surface of 57.9Fe-38.2Ni-3.9Al. Shi had found the formation of Al2O3 on the surface of Cu-Ni-Al inert anode during a previous study, and Al2O3 was considered good for improving the corrosion resistance [14].
After electrolysis, a corrosion layer formed on the surface of the anodes. The thickness of the corrosion layer is 1000–2000 µm, and its quality varies for different alloys as shown in Figure 3. When the amount of added aluminum is small (58.2Fe-40.4Ni-1.4Al and 57.9Fe-38.2Ni-3.9Al), there is a relatively dense oxide-containing corrosion layer with a good connection to the metal substrate (alloys 58.2Fe-40.4Ni-1.4Al and 57.9Fe-38.2Ni-3.9Al). When the aluminum content is too high, the oxide layer contains more alumina which easily dissolves due to a higher Al2O3 solubility (about 10%) in the cryolite-based molten salt [26], and so the corrosion layer is deteriorated. For example, there are many small cracks between the inner and the outer corrosion layers of alloy 56.1Fe-39.5Ni-4.4Al, while the boundary between these two corrosion layers is completely cracked for 56.8Fe-37.9Ni-5.3Al. Further, the outer corrosion layer of alloy 52.9Fe-39.2Ni-7.9Al tends to break away from the metal substrate, and the gap between the two corrosion layers is filled with electrolyte. Finally, when the amount of added aluminum is 8.6 wt.%, the alloy anode undergoes catastrophic corrosion, the oxide layer is corroded into fragments, the corrosion layer is destroyed, and the electrolyte directly contacts the metal substrate.
In comparison, the alloys 58.2Fe-40.4Ni-1.4Al and 57.9Fe-38.2Ni-3.9Al form better corrosion layers. The cross-sectional morphology and EDS mapping of these layers formed after 5 h of electrolytic corrosion are shown in Figure 4 and Figure 5. There two cases are somewhat similar but with differences. On the one hand, the surface oxide layer has an obvious boundary and can be clearly divided into outer corrosion layer, inner corrosion layer, and the metal substrate. The inner corrosion layer and outer corrosion layer are dense and have good adhesion to the metal substrate. In the outer corrosion layer, the content of Ni is very low while Fe, O, Al, and F are enriched, indicating that this layer is composed of Fe2O3 and AlF3. In the inner corrosion layer, the contents of Al and Ni are higher than those in the substrate, while the content of Fe is almost zero. The fluoride ion has a corrosive effect on the oxide film, which is similar to [6]:
2Fe2O3 + 12F → 4FeF3 + 3O2 + 12e
On the other hand, there are some holes in the element distribution of alloy 58.2Fe-40.4Ni-1.4Al, indicating that this corrosion layer is loose. Moreover, alloy 57.9Fe-38.2Ni-3.9Al can form a thicker and denser oxide layer that could provide better corrosion protection than the other alloys.
The morphology of the inner corrosion layer under high magnification is shown in Figure 6a. It contains a white phase, a grey phase, and a black phase distributed like islands. From the matrix to the outside, the white phase is gradually eroded, while the grey phase increases. In Figure 6a, the L-shaped grey phase outlined by the rectangle contains Ni and O while other elements are depleted. So, NiO should be present here, and the NiO film has good corrosion resistance. EDS point analysis was conducted for different phases, and the results are given in Table 2: Ni is extremely enriched in the white area, the black area contains F and Al elements, while in the grey phase O is enriched and Fe is depleted. The corrosion layer contains a large amount of F, confirming that fluorine salt in the electrolyte has a serious corrosive effect on the alloy. The inner corrosion layer is depleted of Fe and enriched with Ni, because the electronegativity order of these elements is Al > Fe > Ni. As a result, the Al and Fe inside the alloy are more likely to diffuse outwards and combine with O2−, forming Al2O3 and Fe2O3 on the interface between the oxide film and the electrolyte. At the same time, F and O2− diffuse inwardly and react with the remaining Ni and a small amount of Al, forming an inner oxide layer containing NiO and AlF3. In the outer oxide layer, since the solubility of Al2O3 is much higher than that of Fe2O3 in the cryolite molten salt (about 500 times), the Al2O3 film on the outer surface is decomposed to form AlF3, leaving only Fe2O3. In conclusion, the outer corrosion layer is mainly iron oxides and aluminum fluoride which are relatively loose in structure, while the inner corrosion layer is denser and firmly combined with the metal matrix. Considering the XRD results and the distribution characteristics of Al in the alloy matrix, the Al element exhibited grid-like local enrichment. Al was oxidized to Al2O3 after electrolysis, and played a good role of pinning between the matrix metal and the film to stabilize the alloy anode.
Figure 7 is a supplementary illustration of these steps. During aluminum electrolysis, the electric field on the electrode surface drives the transport of both electrons and ions in the oxide film, which can further promote the formation of the oxide film. Therefore, the corrosion rate under electrochemical conditions is higher than that under high-temperature oxidation. Similarly, if the lattice structure of oxides has a lower metal-to-oxygen ratio than the stoichiometric formula, there will be vacancies of metal ions in the lattice, i.e. cationic vacancies. An increase of these cationic vacancies will accelerate metal migration through the oxide film and the oxidation rate of the alloy anode.
When the anode is first inserted into the electrolyte, high-temperature oxidation occurs on the surface to form an oxide film. After the immersed anode is electrified, the aluminum-oxygen-fluoride complex ion [Al2O2F4]2− in the molten salt migrates to the oxide surface on the anode, and the oxygen anion O2− loses electrons to become adsorbed oxygen atoms. The fluoride complex anion AlF4 is released and can dissociate into AlF3 and F. The formed oxygen atoms can oxidize metal on the anode surface or combine into O2, while F can migrate to the oxide layer and expand to the interface of molten salts, forming AlF3 in the oxide film with Al3+ ions. After electrolysis, there is a large amount of AlF3 phase in the outer and inner oxide films on the cross section of the anode. At the same time, metal atoms and ions such as Al3+/Fe3+ in the anodic oxide film migrate outward to form FeAl2O4 or Fe2O3 films at the interface of molten salt. These oxides are in a dynamic equilibrium between dissolution and formation in the highly corrosive Na3AlF6-based molten salt, as shown in Formula (3). The oxygen atom and cationic cavity on the anode surface can diffuse to the metal matrix, and form obvious oxide layers containing NiFe2O4 and NiO phases by internal oxidation. When enough oxide film is formed on the surface of the anode, the diffusion of oxygen atoms to the metal matrix is limited, and the Fe-Ni-Al metal no longer diffuses into the molten salts or dissolves, making the anode inert against corrosion. At this time, oxygen atoms adsorbed on anode surface combine into O2 as shown in Formula (4).
MexOy + Na3AlF6 → MexF2y + Al2O3 + 2yNaF (Me = Al, Fe, Ni),
[Al2O2F4]2− + 2F → 2AlF3 + O2 + 4e.

3.3. Corrosion Mechanism of the Fe-Ni-Al Inert Anode

Figure 8 shows linear voltammetric curves of the Fe-Ni-Al alloys in the molten salt at 850 °C. As the curves of different alloys are similar, we take 58.2Fe-40.4Ni-1.4Al alloy as an example here. The scan range is from the open potential (1.19 V) to 3.5 V, and the scan rate is 0.005 V·s−1. The electrochemical linear voltammetry curve of this alloy can be divided into four stages. The AB stage corresponds to the active dissolution of the alloy. In this region, the current density increases with a positive shift of the potential, indicating that the alloy is dissolved and reacts with the molten salt to generate metal fluorides according to Reactions (5)–(7). The BC and DE stages represent the passivation transition zone, while the CD stage is the passivation zone of the alloy. In the passivation transition zone, an oxide protective layer is gradually formed on the anode surface, and the metal starts converting from the activated state to the passivated state, which results in the decrease of current density. When the metal surface enters the passivated state, there already exists a dense oxide film on the electrode surface, which prevents molten salt from entering the alloy matrix and thus delays further corrosion. Finally, the EF segment is the transpassivation zone starting from Eb (breakdown potential) and the current density increases with increasing potential, indicating that a new anode reaction (oxygen evolution) has occurred.
Fe – 2e → Fe2+,
Ni – 2e → Ni2+,
Al – 3e → Al3+.
On the other hand, the linear voltammetric curves give several characteristic potentials and currents important for evaluating the passivation behavior of alloys in molten salt. The more negative the passivation potential Ep, the more easily the metal enters the passivation state. The characteristic parameters of different Fe-Ni-Al alloys are shown in Table 3. The Ep values of alloys 58.2Fe-40.4Ni-1.4Al and 57.9Fe-38.2Ni-3.9A are more negative, indicating that it becomes easier for these alloys to enter the passivation state.
Figure 9 shows the Tafel curves of the Fe-Ni-Al alloys in the melt at 850 °C, recorded at the scan rate of 0.01 V·s−1 and the scan range of 0.5–2.0 V. The corrosion current density (Icorr) and the corrosion potential (Ecorr) can be obtained by using the Tafel curve extrapolation method, and the obtained values are shown in Table 4. Ecorr is a thermodynamic parameter while Icorr is a kinetic parameter. A negative Ecorr means that the metal is easily corroded, and a smaller Icorr means slower corrosion.
As we can see in Table 4, 57.9Fe-38.2Ni-3.9Al has the most positive corrosive potential (1.20 V) which means that it does not corrode, easily, followed by 58.2Fe-40.4Ni-1.4Al (1.18 V) and 56.8Fe-37.9Ni-5.3Al (1.18 V). The 56.8Fe-37.9Ni-5.3Al sample has the smallest corrosion current density (1.73 × 10⁻³ A·cm−2), indicating the slowest corrosion rate. No direct correlation between composition of alloys and potential corrosion, or between composition and corrosion rates has been observed.
Combined with the results of electrolysis experiments, alloys 58.2Fe-40.4Ni-1.4Al and 57.9Fe-38.2Ni-3.9Al form dense corrosion layers that are not easily broken and adhere well to the metal substrate. Especially, 57.9Fe-38.2Ni-3.9Al can form a thicker and denser protective oxide layer, and at the same time this alloy more easily enters the passivation state as mentioned before. These results indicate that 57.9Fe-38.2Ni-3.9Al possesses good corrosion resistance to the molten salts.

4. Conclusions

Inert anodes were prepared with Fe-Ni-Al alloys, and their oxidation and corrosion behavior in aluminum electrolysis were studied. The experimental results show that the corrosion layer has two sublayers and contains Fe2O3, Fe3O4, NiO, Al2O3, FeAl2O4 and NiFe2O4. The fluorine salt has a corrosive effect on the oxide film. The added Al is more active than Fe and Ni, and it is preferentially oxidized and serves as a pinning connection between the metal and the oxide film to improve adhesion on the latter. The formed spinel FeNi2O4 also contributes to the corrosion resistance of the alloy. Combining the results of electrolysis experiments and electrochemical tests, it is concluded that the addition of a small amount of aluminum helps to enhance the corrosion resistance of the alloy, and the 57.9Fe-38.2Ni-3.9Al alloy possesses corrosion resistance against the molten salts.

Author Contributions

Conceptualization, P.G. and Z.S.; methodology, P.G. and Z.S.; formal analysis, P.G.; resources, Z.S., X.H. and Z.W.; writing—original draft preparation, P.G.; writing—review and editing, A.L.; validation P.G.; project administration, Z.S.

Funding

This research was funded by the National Key R&D Program of China (grant number 2017YFC0805100), Innovation-Driven Development Project of Guangxi Province (Grant Number AA18118030) and the Fundamental Research Funds for the Central Universities (grant number N172502003). The APC was funded by N172502003.

Acknowledgments

The authors thank the National Key R&D Program of China (2017YFC0805100), Innovation-Driven Development Project of Guangxi Province (AA18118030) and the Fundamental Research Funds for the Central Universities (N172502003) for supporting this work.

Conflicts of Interest

The authors declare no conflict of interest.

References

  1. Marks, J. Methods for calculating PFC emissions from primary aluminum production. Light Met. 2006, 2006, 185–188. [Google Scholar]
  2. Welch, B.J.; Hyland, M.M.; James, B.J. Future materials requirements for the high-energy-intensity production of aluminum. JOM 2001, 53, 13–18. [Google Scholar] [CrossRef]
  3. Padamata, S.K.; Yasinskiy, A.S.; Polyakov, P.V. Progress of inert anodes in aluminum industry: Review. J. Siberian Fed. Univ. Chem. 2018, 1, 18–30. [Google Scholar]
  4. Shi, Z.; Junli, J.; Gao, B.; Hu, X.; Wang, Z. Aluminum electrolysis with Fe-Ni-Al2O3 inert anodes at 850 °C. High Temp. Mater. Proc. 2011, 30, 247–251. [Google Scholar] [CrossRef]
  5. Sadoway, D.R. Inert anodes for the Hall-Heroult cell: The ultimate materials challenge. JOM 2011, 53, 34–35. [Google Scholar] [CrossRef]
  6. Kovrov, V.; Khramov, A.; Redkin, A.A.; Zaikov, Y. Oxygen evolving anodes for aluminum electrolysis. ECS Trans. 2009, 16, 7–17. [Google Scholar]
  7. Chapman, V.; Welch, B.J.; Skyllas-Kazacos, M. Anodic behavior of oxidised Ni-Fe alloys in cryolite-alumina melts. Electrochim. Acta 2011, 56, 1227–1238. [Google Scholar] [CrossRef]
  8. Chapman, V.; Welch, B.J.; Skyllas-Kazacos, M. High temperature oxidation behavior of Ni-Fe-Co anodes for aluminum electrolysis. Corros. Sci. 2011, 53, 2815–2825. [Google Scholar] [CrossRef]
  9. Gallino, I.; Kassner, M.E.; Busch, R. Oxidation and corrosion of highly alloyed Cu-Fe-Ni as inert anode material for aluminum electrowinning in as-cast and homogenized conditions. Corros. Sci. 2012, 63, 293–303. [Google Scholar] [CrossRef]
  10. Sekhar, J.A.; Deng, H.; Liu, J.; Sum, E.; Duruz, J.J.; De, N.V. Micropyretically synthesized porous non-consumable anodes in the Ni-Al-Cu-Fe-X system. Light Met. 1997, 347–354. [Google Scholar]
  11. Sekhar, J.A.; Liu, J.; Deng, H.; Duruz, J.J.; De, N.V. Graded non-consumable anode materials. Light Met. 1998, 597–604. [Google Scholar]
  12. Kargin, Y.F.; Samoilov, E.N.; Makarenkov, V.I.; Lysenkov, A.S. Metal-ceramic composites based on iron oxide for low-consumption anode during electrolytic extraction of aluminum. Inorg. Mater. Appl. Res. 2018, 9, 52–56. [Google Scholar] [CrossRef]
  13. Meyer, P.; Gibilaro, M.; Massot, L.; Pasquet, I.; Tailhades, P.; Bouvet, S.; Chamelot, P. Comparative study on the chemical stability of Fe3O4 and NiFe2O4 in molten salts. Mater. Sci. Eng. B 2018, 228, 117–122. [Google Scholar] [CrossRef]
  14. Shi, Z.; Xu, J.; Qiu, Z.; Wang, Z.; Gao, B. Copper-nickel superalloys as inert alloy anodes for aluminum electrolysis. JOM 2003, 55, 63–65. [Google Scholar] [CrossRef]
  15. Cassayre, L.; Chamelot, P.; Aruraul, L.; Massot, L.; Palau, P.; Taxil, P. Electrochemical oxidation of binary copper-nickel alloys in cryolite melts. Corros. Sci. 2007, 49, 3610–3625. [Google Scholar] [CrossRef]
  16. Sadoway, D.R. A materials systems approach to selection and testing of nonconsumable anodes for the Hall cell. Light Met. 1990, 403–407. [Google Scholar]
  17. Goupil, G.; Helle, S.; Davis, B.; Guay, D.; Roué, L. Anodic behavior of mechanically alloyed Cu-Ni-Fe and Cu-Ni-Fe-O electrodes for aluminum electrolysis in low-temperature KF-AlF3 electrolyte. Electrochim. Acta 2013, 112, 176–182. [Google Scholar] [CrossRef]
  18. Helle, S.; Pedron, M.; Assouli, B.; Davis, B.; Guay, D.; Roué, L. Structure and high-temperature oxidation behavior of Cu-Ni-Fe alloys prepared by high-energy ball milling for application as inert anodes in aluminum electrolysis. Corros. Sci. 2010, 52, 3348–3355. [Google Scholar] [CrossRef]
  19. Helle, S.; Tresse, M.; Davis, B.; Guay, D.; Roué, L. Mechanically alloyed Cu-Ni-Fe-O based materials as oxygen-evolving anodes for aluminum electrolysis. J. Electrochem. Soc. 2012, 159, E62–E68. [Google Scholar] [CrossRef]
  20. Helle, S.; Davis, B.; Guay, D.; Roué, L. Ball-Milled Cu-Ni-Fe-O materials as inert anodes for aluminum electrolysis in low-temperature KF-AlF3 electrolyte. Light Met. 2012, 1377–1380. [Google Scholar]
  21. Muñoz-Morris, M.; Morris, D. Microstructure and mechanical behavior of a Fe-Ni-Al alloy. Mater. Sci. Eng. A 2007, 444, 236–241. [Google Scholar] [CrossRef]
  22. Shi, Z.; Shi, D.; Gao, B.; Xu, J.; Hu, X.; Wang, Z. Oxidation of Fe-Ni alloys in air at 700 °C, 800 °C and 950 °C. High Temp. Mater. Process. 2012, 31, 89–96. [Google Scholar] [CrossRef]
  23. Alzamani, M.; Jafarzadeh, K. The effect of pre-oxidation treatment on corrosion behavior of Ni-Cu-Fe-Al anode in molten CaCl2 salt. Oxid. Met. 2018, 89, 623–640. [Google Scholar] [CrossRef]
  24. Cheng, X.; Yin, H.; Wang, D. Rearrangement of oxide scale on Ni-11Fe-10Cu alloy under anodic polarization in molten Na2CO3-K2CO3. Corros. Sci. 2018, 141, 168–174. [Google Scholar] [CrossRef]
  25. Swartzendruber, L.J.; Itkin, V.P.; Alcock, C.B. Binary Alloy Phase Diagrams; ASM International: Metals Park, OH, USA, 1991. [Google Scholar]
  26. Dewing, E.; Thonstad, J. Activities in the system cryolite-alumina. Metall. Mater. Trans. B 1997, 28, 1089–1093. [Google Scholar] [CrossRef]
Figure 1. The scanning electron microscopy (SEM) micrograph (a) and energy dispersive spectroscopy (EDS) mapping of 54.1Fe-37.3Ni-8.6Al alloy sample; (b) microscopic morphology of the alloy at higher magnification.
Metals 09 00399 g001
Figure 2. X-Ray diffraction patterns with respect to 1.4–4.4 wt.% Al (a) and 5.3–8.6 wt.% Al (b) of Fe-Ni-Al anodes after electrolysis.
Metals 09 00399 g002
Figure 3. The SEM cross-section micrograph of 58.2Fe-40.4Ni-1.4Al (a), 57.9Fe-38.2Ni-3.9Al (b), 56.1Fe-39.5Ni-4.4Al (c), 56.8Fe-37.9Ni-5.3Al (d), 52.9Fe-39.2Ni-7.9Al (e), and 54.1Fe-37.3Ni-8.6Al (f) alloys after electrolytic corrosion in 39.3NaF-43.7AlF3-8NaCl-5CaF2-4Al2O3 at 850 °C for 5 h.
Metals 09 00399 g003
Figure 4. The SEM cross-section micrograph (a) and EDS mapping with respect to F (b), Fe (c), Ni (d), Al (e), and O (f) of 58.2Fe-40.4Ni-1.4Al alloy after electrolytic corrosion in 39.3NaF-43.7AlF3-8NaCl-5CaF2-4Al2O3 at 850 °C for 5 h.
Metals 09 00399 g004
Figure 5. The SEM cross-section micrograph (a) and EDS mapping with respect to F (b), Fe (c), Ni (d), Al (e), and O (f) of 57.9Fe-38.2Ni-3.9Al alloy after electrolytic corrosion in 39.3NaF-43.7AlF3-8NaCl-5CaF2-4Al2O3 at 850 °C for 5 h.
Metals 09 00399 g005
Figure 6. The SEM micrograph (a) and EDS mapping with respect to F (b), Ni (c), Fe (d), Al (e), and O (f) of inner corrosion layer in Figure 3a at higher magnification of 57.9Fe-38.2Ni-3.9Al alloy after electrolytic corrosion in 39.3NaF-43.7AlF3-8NaCl-5CaF2-4Al2O3 at 850 °C for 5 h.
Metals 09 00399 g006
Figure 7. The mechanism of Fe-Ni-Al anodic electrolytic corrosion.
Metals 09 00399 g007
Figure 8. Anodic polarization curves of 58.2Fe-40.4Ni-1.4Al (a), 57.9Fe-38.2Ni-3.9Al (b), 56.1Fe-39.5Ni-4.4Al (c), 56.8Fe-37.9Ni-5.3Al (d), 52.9Fe-39.2Ni-7.9Al (e) and 54.1Fe-37.3Ni-8.6Al (f) alloys measured in 39.3NaF-43.7AlF3-8NaCl-5CaF2-4Al2O3 melts at 850 °C (scan rates 0.005 V·s−1; vs. Al/AlF3).
Metals 09 00399 g008
Figure 9. Tafel polarization curves of 58.2Fe-40.4Ni-1.4Al (a), 57.9Fe-38.2Ni-3.9Al (b), 56.1Fe-39.5Ni-4.4Al (c), 56.8Fe-37.9Ni-5.3Al (d), 52.9Fe-39.2Ni-7.9Al (e), and 54.1Fe-37.3Ni-8.6Al (f) alloys measured in 39.3NaF-43.7AlF3-8NaCl-5CaF2-4Al2O3 melts at 850 °C (scan rates 0.01 V·s−1; vs. Al/AlF3).
Metals 09 00399 g009
Table 1. The purity of aluminum obtained by inert anode electrolysis at 850 °C.
Anode SamplesElemental Mass Fraction/wt.%
AlFeNi
58.2Fe-40.4Ni-1.4Al99.680.280.04
57.9Fe-38.2Ni-3.9Al98.871.060.07
56.1Fe-39.5Ni-4.4Al99.620.360.02
56.8Fe-37.9Ni-5.3Al99.610.340.05
52.9Fe-39.2Ni-7.9Al98.141.530.33
54.1Fe-37.3Ni-8.6Al99.600.380.02
Table 2. Elements compositions of the cross-section of 57.9Fe-38.2Ni-3.9Al alloy analyzed by EDS.
Spectral PositionElement Atomic Percentage/Mass Percentage
FeNiAlOF
A21.5/21.374.0/77.20.3/0.11.8/0.52.2/0.7
B36.9/62.21.3/2.30.4/0.3-61.3/35.1
C40.6/66.92.3/4.06.5/5.150.5/23.8-
D0.3/0.90.5/1.527.6/34.60.4/0.371.0/62.6
E40.5/67.01.7/2.97.5/6.049.0/23.21.1/0.6
Table 3. Details of polarization curves for Fe-Ni-Al alloy anodes measured in 39.3NaF-43.7AlF3-8NaCl-5CaF2-4Al2O3 melts at 850 °C.
No.Alloy Anodesjp (A/cm2)Ep (V)Eb (V)
(a)58.2Fe-40.4Ni-1.4Al0.291.902.52
(b)57.9Fe-38.2Ni-3.9Al0.291.832.42
(c)56.1Fe-39.5Ni-4.4Al0.732.502.85
(d)56.8Fe-37.9Ni-5.3Al0.362.172.57
(e)52.9Fe-39.2Ni-7.9Al0.352.122.54
(f)54.1Fe-37.3Ni-8.6Al0.592.763.13
* The above values were derived from Figure 8.
Table 4. Corrosion parameters of Fe-Ni-Al alloy anodes measured in 39.3NaF-43.7AlF3-8 NaCl-5CaF2-4Al2O3 melts at 850 °C.
No.Alloy AnodesEcorr (V)Icorr (A/cm2) × 10−3
(a)58.2Fe-40.4Ni-1.4Al1.183.58
(b)57.9Fe-38.2Ni-3.9Al1.205.18
(c)56.1Fe-39.5Ni-4.4Al1.032.65
(d)56.8Fe-37.9Ni-5.3Al1.181.73
(e)52.9Fe-39.2Ni-7.9Al1.001.82
(f)54.1Fe-37.3Ni-8.6Al0.942.00
* The above values were derived from Figure 9.

