Analysis of Powder Binder Separation through Multiscale Computed Tomography


Abstract
:
1. Introduction
2. Experimental Procedure
3. Results and Discussion
4. Conclusions
Author Contributions
Funding
Acknowledgments
Conflicts of Interest
References
- Enneti, R.K.; Shivashankar, T.S.; Park, S.J.; German, R.M.; Atre, S.V. Master debinding curves for solvent extraction of binders in powder injection molding. Powder Technol. 2012, 228, 14–17. [Google Scholar] [CrossRef]
- Liu, D.M. Influence of solid loading and particle size distribution on the porosity development of green alumina ceramic moldings. Ceram. Int. 1997, 23, 513–520. [Google Scholar] [CrossRef]
- German, R.M. Powder Injection Molding; Metal Powder Industries Federation: Princetion, NJ, USA, 1990. [Google Scholar]
- Li, Y.M.; Li, L.J.; Khalil, K.A. Effect of powder loading on metal injection molding stainless steels. J. Mater. Process. Technol. 2007, 183, 432–439. [Google Scholar] [CrossRef]
- Gelin, J.C.; Barriere, T.; Song, J. Processing defects and resulting mechanical properties after metal injection molding. J. Eng. Mater. Technol. 2010, 132, 0110171–0110179. [Google Scholar] [CrossRef]
- Heldele, R.; Rath, S.; Merz, L.; Butzbach, R.; Hagelstein, M.; Hauβlt, J. X-ray tomography of powder injection molded micro parts using synchrotron radiation. Nucl. Instrum. Methods Phys. Res. Sect. B Beam Interact. Mater. Atoms 2006, 246, 211–216. [Google Scholar] [CrossRef]
- Demers, V.; Fareh, F.; Turenne, S.; Demarquette, N.R.; Scalzo, O. Experimental study on moldability and segregation of Inconel 718 feedstocks used in low-pressure powder injection molding. Adv. Powder Technol. 2018, 29, 180–190. [Google Scholar] [CrossRef]
- Thornagel, M.; Schwittay, V.; Hartmann, G. Powder-binder segregation: PIM-simulation at breakthrough. In Proceedings of the Euro PM 2014 International Conference and Exhibition, Salzburg, Austria, 21–24 September 2014; European Powder Metallurgy Association: Salzburg, Austria, 2014. [Google Scholar]
- Tammas-Williams, S.; Withers, P.J.; Todd, I.; Prangnell, P.B. Porosity regrowth during heat treatment of hot isostatically pressed additively manufactured titanium components. Scr. Mater. 2016, 122, 72–76. [Google Scholar] [CrossRef] [Green Version]
- Kurumlu, D.; Payton, E.J.; Young, M.L.; Schöbel, M.; Requena, G.; Eggeler, G. High-temperature strength and damage evolution in short fiber reinforced aluminum alloys studied by miniature creep testing and synchrotron microtomography. Acta Mater. 2012, 60, 67–78. [Google Scholar] [CrossRef]
- Scheck, C.; Zupan, M. Ductile fracture evaluated through micro-computed X-ray tomography. Scr. Mater. 2011, 65, 1041–1044. [Google Scholar] [CrossRef]
- Mannschatz, A.; Höhn, S.; Moritz, T. Powder-binder separation in injection moulded green parts. J. Eur. Ceram. Soc. 2010, 30, 2827–2832. [Google Scholar] [CrossRef]
- Weber, O.; Rack, A.; Redenbach, C.; Schulz, M.; Wirjadi, O. Micropowder injection molding: Investigation of powder-binder separation using synchrotron-based microtomography and 3D image analysis. J. Mater. Sci. 2011, 46, 3568–3573. [Google Scholar] [CrossRef]
- Yang, S.D.; Zhang, R.J.; Qu, X.H. X-ray tomographic analysis of powder-binder separation in SiC green body. J. Eur. Ceram. Soc. 2013, 33, 2935–2941. [Google Scholar] [CrossRef]
- Yang, S.D.; Zhang, R.J.; Qu, X.H. X-ray analysis of powder-binder separation during SiC injection process in L-shaped mould. J. Eur. Ceram. Soc. 2015, 35, 61–67. [Google Scholar] [CrossRef]
- Guo, S.B.; Qu, X.H.; He, X.B.; Zhou, T.; Duan, B.H. Powder injection molding of Ti–6Al–4V alloy. J. Mater. Process. Technol. 2006, 173, 310–314. [Google Scholar]
- Obasi, G.C.; Ferri, O.M.; Ebel, T.; Bormann, R. Influence of processing parameters on mechanical properties of Ti–6Al–4V alloy fabricated by MIM. Mater. Sci. Eng. A 2010, 527, 3929–3935. [Google Scholar] [CrossRef] [Green Version]
- Holm, M.; Ebel, T.; Dahms, M. Investigations on Ti–6Al–4V with gadolinium addition fabricated by metal injection moulding. Mater. Des. 2013, 51, 943–948. [Google Scholar] [CrossRef] [Green Version]
- Liu, C.C.; Lu, X.; Yang, F.; Xu, W.; Wang, Z.; Qu, X.H. Metal Injection Moulding of High Nb-Containing TiAl Alloy and Its Oxidation Behaviour at 900 °C. Metals 2018, 8, 163. [Google Scholar] [CrossRef]


| Method | Description | Advantages | Limitations |
|---|---|---|---|
| Optical Microscope | observing phases distribution in the surface | visible and direct | only surface information; introducing artifacts after sample preparation |
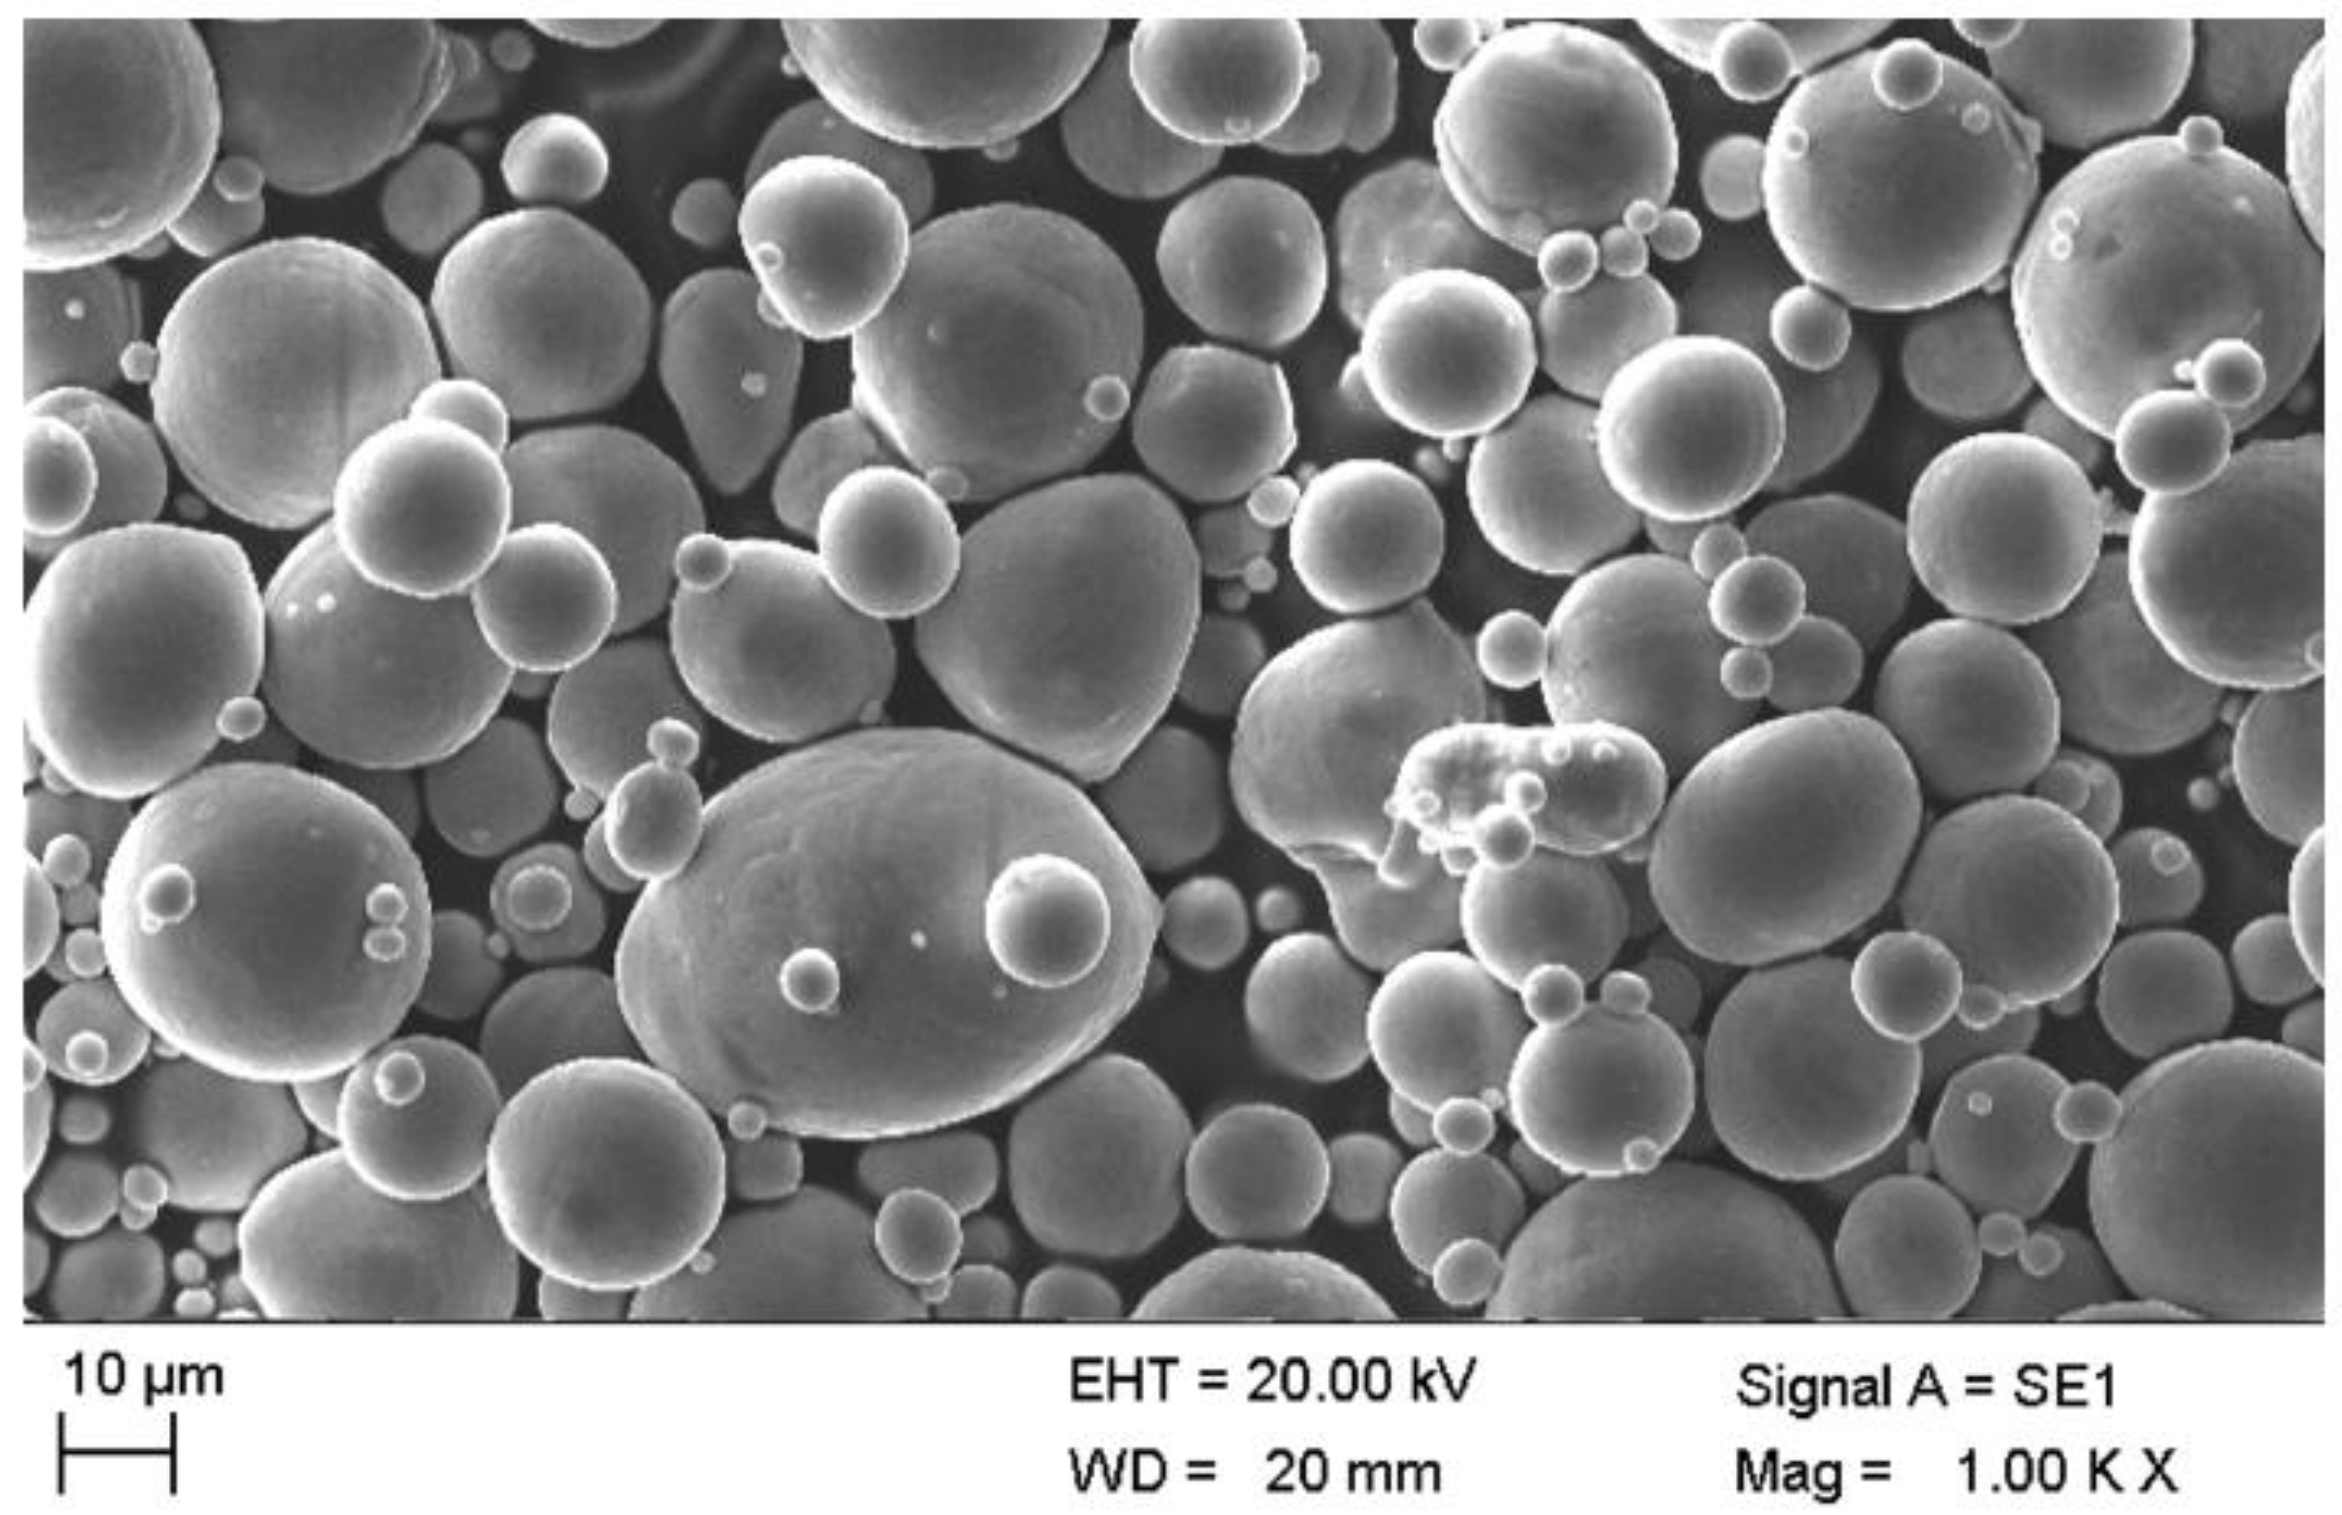
| SEM | observing phases distribution in the surface | visible and direct | only surface information |
| Density Test | sample is broken into many parts and density distribution is obtained | high reality | introducing artifacts after sample preparation destructive tests; time consuming |
| Hardness Test | sample is broken into many parts and hardness distribution is obtained | high reality | destructive tests; time consuming |
| Elements | Ti | Al | V | Fe | C | O | N |
|---|---|---|---|---|---|---|---|
| Weight (wt %) | Balance | 6.14 | 4.13 | 0.09 | 0.011 | 0.092 | 0.0004 |
| Constituent | PW | LDPE | PP | SA | LPW | PEG-10,000 | Naphthalene |
|---|---|---|---|---|---|---|---|
| Melting Point (°C) Binder Weight (wt %) | 58 Balance | 125 5–10 | 4 12 | 66 5 | −24 5–9 | 65 3 | 80.5 6–10 |
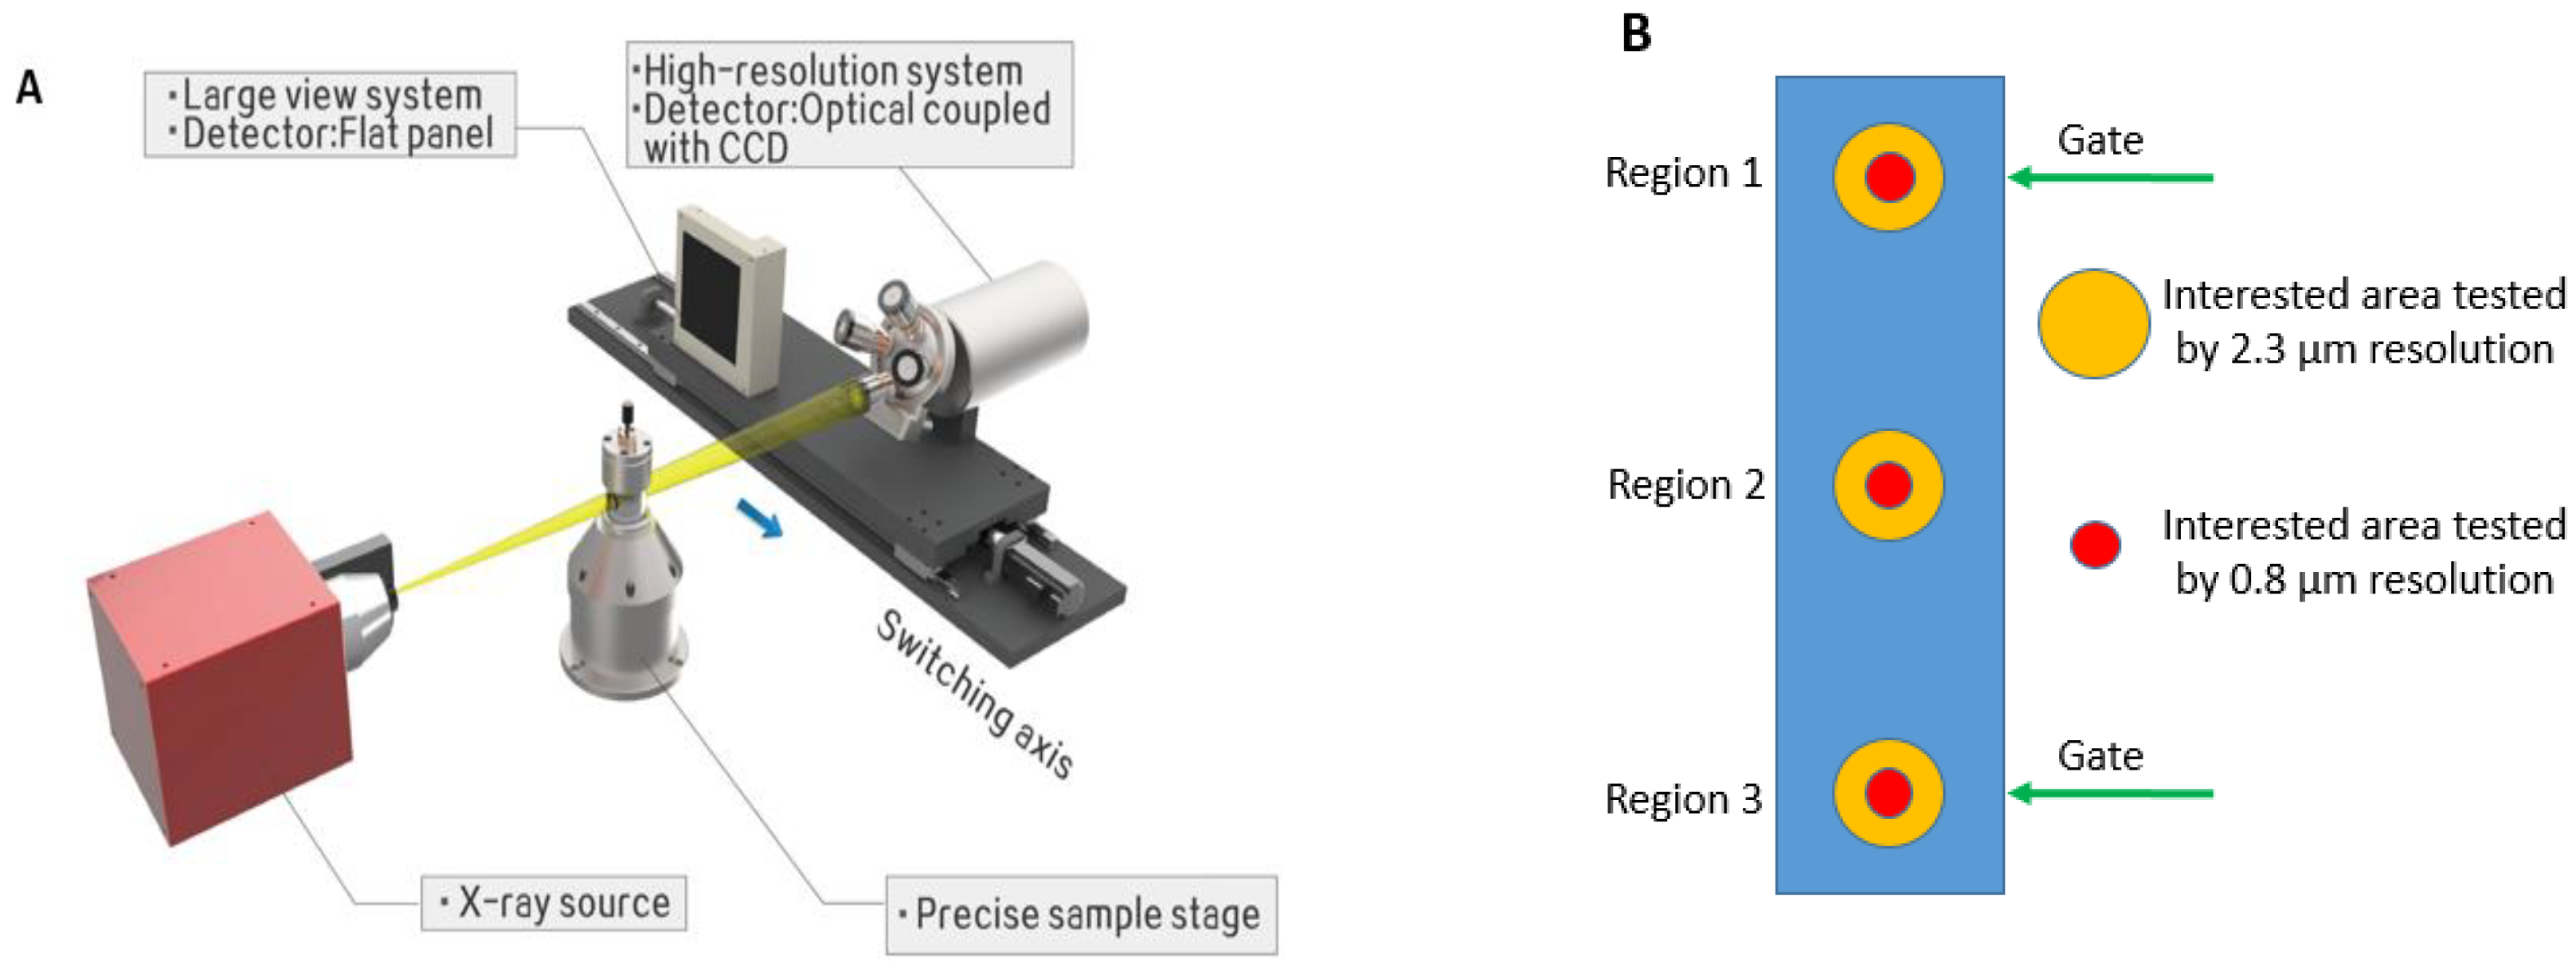
| Resolution (µm) | Voltage (kV) | Frames | Detector System |
|---|---|---|---|
| 36 2.3 0.8 | 120 120 120 | 1440 1800 1800 | Flat panel Optical coupled with CCD-4×lens Optical coupled with CCD-10×lens |
| Sample Number | Porosity Tested by Archimedes’ Principle (%) | Porosity Tested by CT Data (%) |
|---|---|---|
| 1 2 3 4 5 6 | 43.5 49.4 54.8 58.2 62.8 66.9 | 44.3 50.5 54.7 58.8 63.4 67.4 |
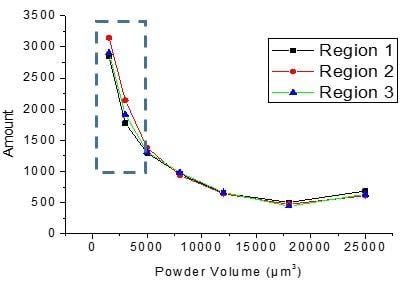
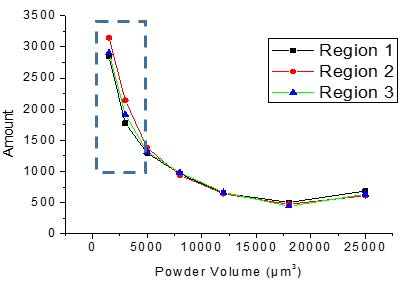
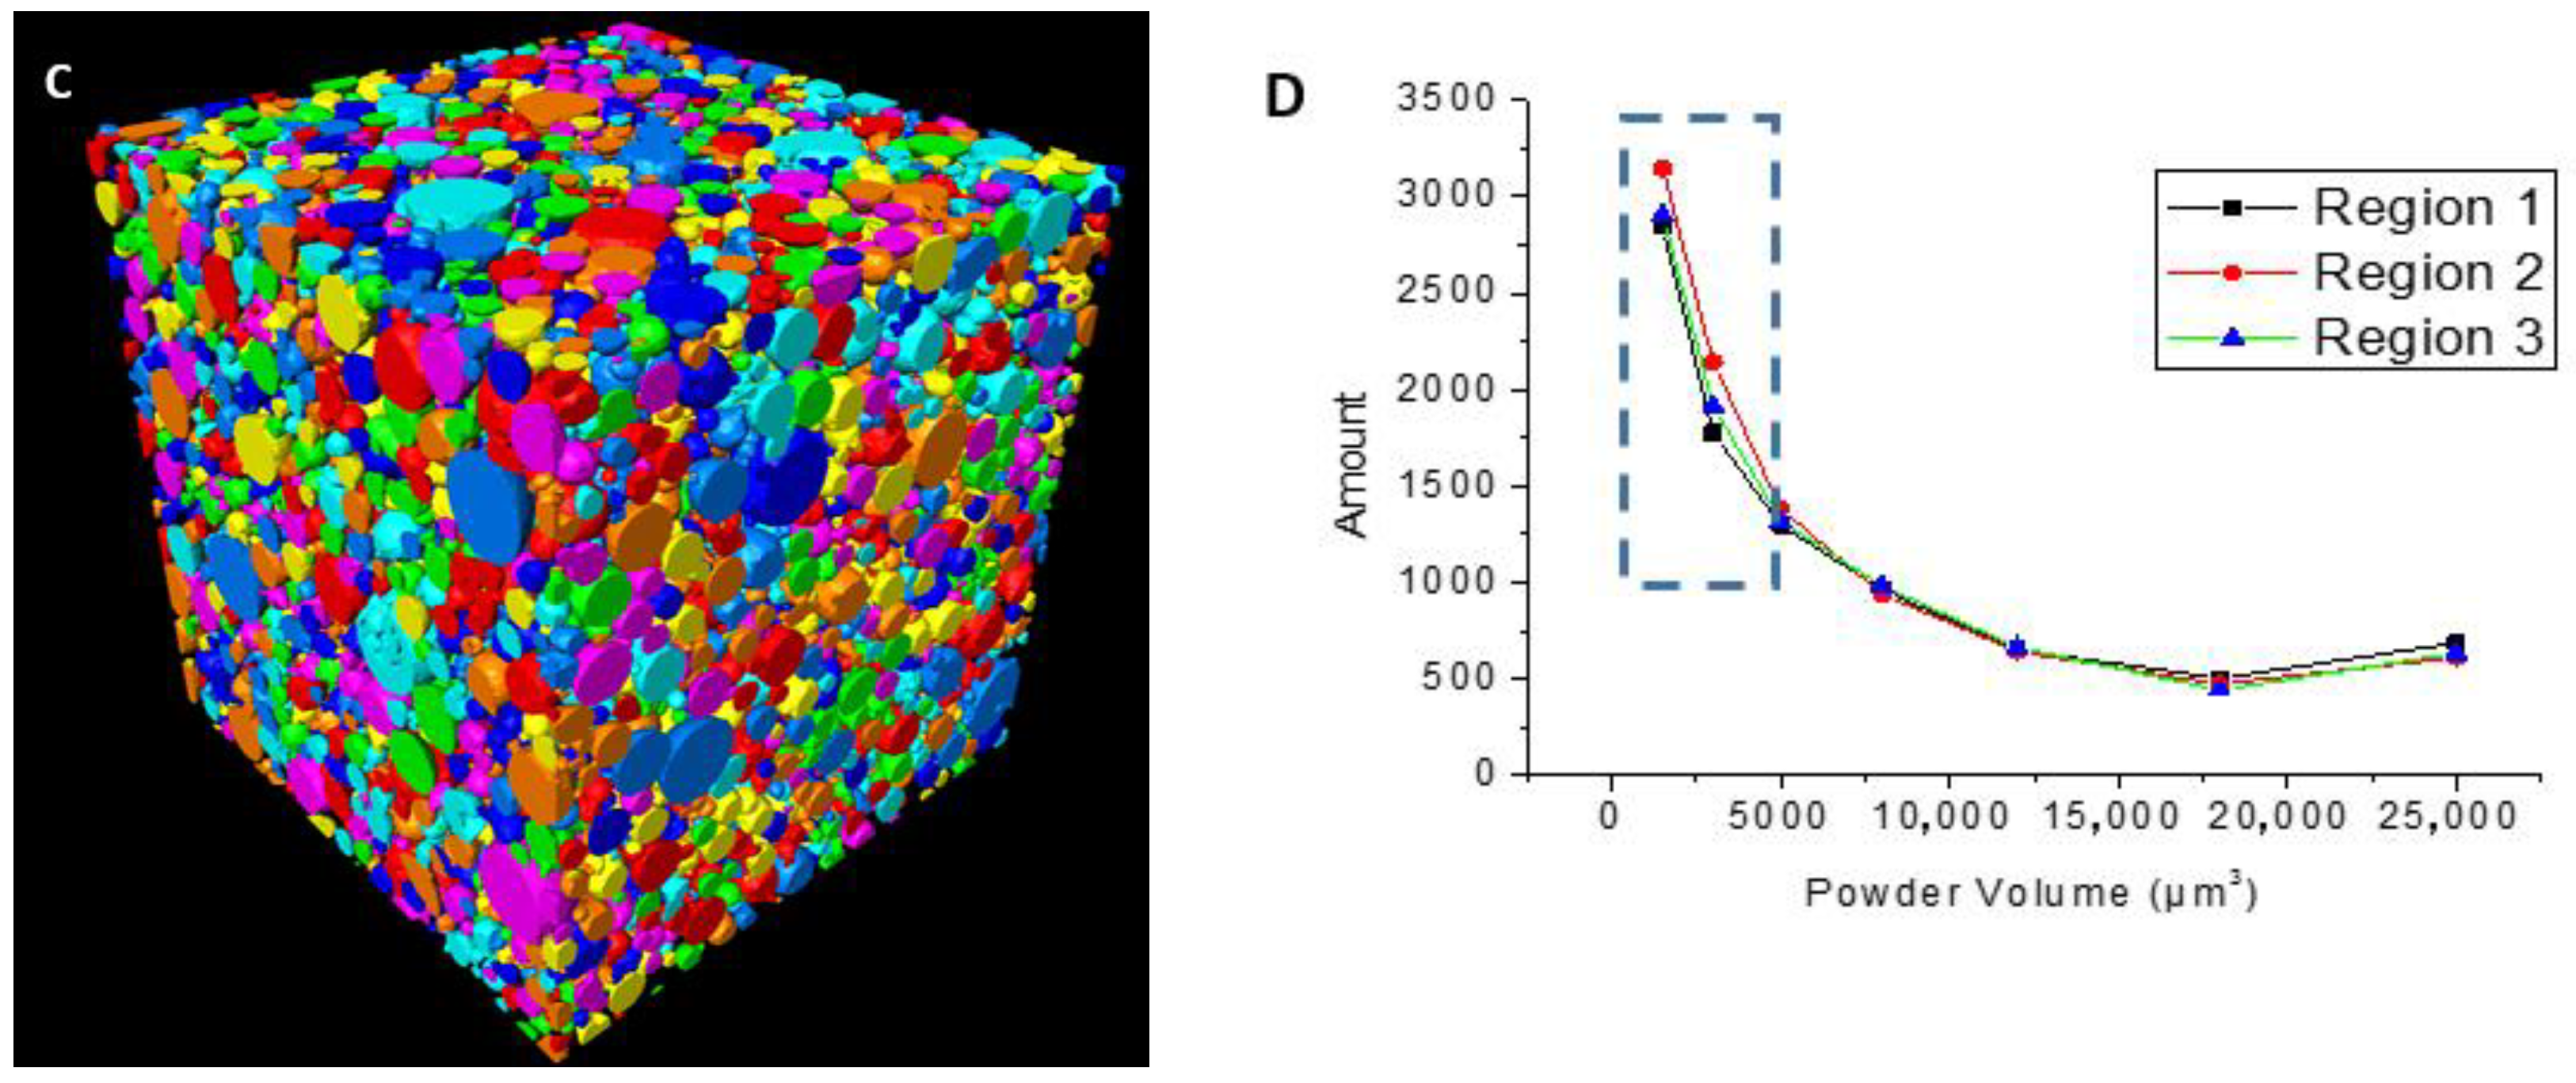
| Area | Amount | Vol. | Sphericity | ||
|---|---|---|---|---|---|
| Average Volume/μm3 | Standard Deviations | Average Value | Standard Deviations | ||
| Region 1 | 6821 | 8008 | 13143 | 0.801 | 0.167 |
| Region 2 | 7743 | 7749 | 17479 | 0.854 | 0.151 |
| Region 3 | 7064 | 7942 | 14633 | 0.81 | 0.161 |
© 2019 by the authors. Licensee MDPI, Basel, Switzerland. This article is an open access article distributed under the terms and conditions of the Creative Commons Attribution (CC BY) license (http://creativecommons.org/licenses/by/4.0/).
Share and Cite
Yang, S.; Xu, Q.; Liu, C.; Lu, X.; Qu, X.; Xu, Y. Analysis of Powder Binder Separation through Multiscale Computed Tomography. Metals 2019, 9, 329. https://doi.org/10.3390/met9030329
Yang S, Xu Q, Liu C, Lu X, Qu X, Xu Y. Analysis of Powder Binder Separation through Multiscale Computed Tomography. Metals. 2019; 9(3):329. https://doi.org/10.3390/met9030329
Chicago/Turabian StyleYang, Shidi, Qiaoli Xu, Chengcheng Liu, Xin Lu, Xuanhui Qu, and Ying Xu. 2019. "Analysis of Powder Binder Separation through Multiscale Computed Tomography" Metals 9, no. 3: 329. https://doi.org/10.3390/met9030329