Article

Porosity and Microstructure Iron-Based Graded Materials Sintered by Spark Plasma Sintering and the Conventional Method

by
Krzysztof Zarębski
1,
Piotr Putyra
2 and
Dariusz Mierzwiński
1,*
1
Institute of Materials Engineering, Cracow University of Technology, Al. Jana Pawła II 37, 31-864 Kraków, Poland
2
Institute of Advanced Manufacturing, Centre for Materials Research and Sintering Technology, Technologies, ul. Wrocławska 37, 30-011 Kraków, Poland
*
Author to whom correspondence should be addressed.
Metals 2019, 9(2), 264; https://doi.org/10.3390/met9020264
Submission received: 27 January 2019 / Revised: 16 February 2019 / Accepted: 20 February 2019 / Published: 23 February 2019

Abstract

:
Using PNC-60 powder with the addition of graphite, cylindrical products characterized by different compositions of core and outer layers were made. Some compacts were sintered via the conventional process, while others were subjected to the spark plasma sintering method (SPS) at different times and temperatures. The gradient microstructure was obtained in the transition zone by mixing powders during die filling, followed by pressing and diffusion during sintering. The effect of sintering parameters on the nature of the gradient zone and the morphology of the pores was shown. After conventional sintering, the gradient zone was wider than it was after SPS. Via SPS, the short sintering time confined the diffusion to a local range, making its influence on the gradient structure negligible. Differences in the microstructure were confirmed by functional description.

1. Introduction

Gradient zones in products characterized by different thermomechanical properties should be protected from the occurrence of dangerous internal stresses during manufacturing processes and subsequent use. In most technologies involving the manufacture of powder-based functionally graded materials (FGMs), these materials are used either in bulk form or in the form of specially formulated slurries. Layer materials are made by filling and pre-pressing the subsequent product layers. An interesting method for the manufacture of cylindrical products that was introduced by Kamdem et al. consists of filling the die by suction of the powder mixture placed in a special container [1]. Simoneti et al. [2] described a sedimentation method for the manufacture of composite cathodes from a specially prepared slurry using gravity. Watanabe and Sato [3] described methods using centrifugal force to produce a gradient microstructure. To avoid the presence of thermal stresses causing the deformation of cutting tools, Gasik et al. [4] applied a variation of the sedimentation method using the movement of the charged particles and electrophoretic force.
In spite of various publications presenting an overview of methods to produce FGMs, no studies have described the effect of various sintering methods on the microstructure and properties of graded products. An attempt to clarify this problem was made by Zarebski and Putyra [5], where the physical properties, the morphology of porosity, and the microstructure of graded products made from Distaloy SE powder by conventional sintering and spark plasma sintering (SPS) were compared.
Pulsed current-activated sintering has been known and studied for several decades, but the mechanism itself and the nature of the phenomena that occur during the sintering of various materials have not yet been fully explained. In numerous studies, this method is referred to as plasma sintering, but Hulbert et al. [6] doubted the existence of plasma during heating, and claimed that many of the mechanisms indicated by researchers as a source of the formation of plasma between particles are hypothetical. This does not change the fact that SPS is one of the most promising and commonly used pressure-assisted sintering techniques (Saheb et al. [7]; Guillon et al. [8]). The direct heating of material particles determines that, compared to sintering by other pressure-assisted methods (e.g., Hot Pressing (HP)), the time necessary to achieve the full density of products is shorter, and the sintering temperature is lower (Schmidt at al. [9]). Undoubtedly, the most important feature of SPS is the ability to produce materials that are difficult or impossible to consolidate by traditional methods. Many details of the sintering process of these materials have been given by Omori, among others [10].
The control of the gradient of composition to obtain the most favorable changes in structure is important in the technology of FGM fabrication. In materials differing in particle size and thermomechanical characteristics, the risk of the formation of stresses and discontinuities is greatest during sintering and additional heat treatment. Contrary to the conventional process of sintering, the rate at which the product sintered by SPS is heated is very high. In both methods, the risk of occurrence of dangerous local internal stresses can be effectively reduced by compressive stresses and the presence of the liquid phase. The run of the SPS sintering process depends on many technological parameters and powder properties. Diouf and Molinari [11] studied the effect of particle size, temperature, and pressure during sintering by SPS on the compaction mechanism of copper products. Kieback et al. [12] touched upon the problem of the effect of particle size on the local increase in stress during sintering to a value that might result in crack formation, discussing also the temperature distribution that occurs during sintering by SPS. It should be remembered that it is the temperature distribution during the heating of the powder that has a major impact on the initiation and growth of cracks in the sintered material, especially when this material is characterized by a graded structure. The effect of the current and temperature distribution in both axial and radial directions during SPS was tested by Tamburini [13] and Vanmeensel et al. [14], while Chen et al. [15] focused attention on the effect of current pulsation during the SPS sintering of Mo-Si biomaterials.
In the sintering of graded materials, especially when the chemical composition of these materials differs significantly, the essential problem is the distribution of temperature, particularly in the direction that is consistent with the direction of the structure gradient. With significant differences in the thermomechanical properties, uneven heating of the material can lead to the formation of cracks and delaminations. Therefore, in products with a graded structure designed for both conventional and SPS sintering, the transition between the different materials should be very smooth.
This study compares the graded products that are sintered conventionally (CS) and by SPS. To make these products, iron powder and its carbon compositions were used, and the resulting gradient microstructure was produced by the synergy of two effects, i.e., the mixing of powder while filling the die and the diffusion of carbon to iron during sintering. The aim of the study was to determine the influence of sintering parameters on the nature of the gradient zone and the morphology of porosity. Changes in the microstructure were confirmed by functional description.

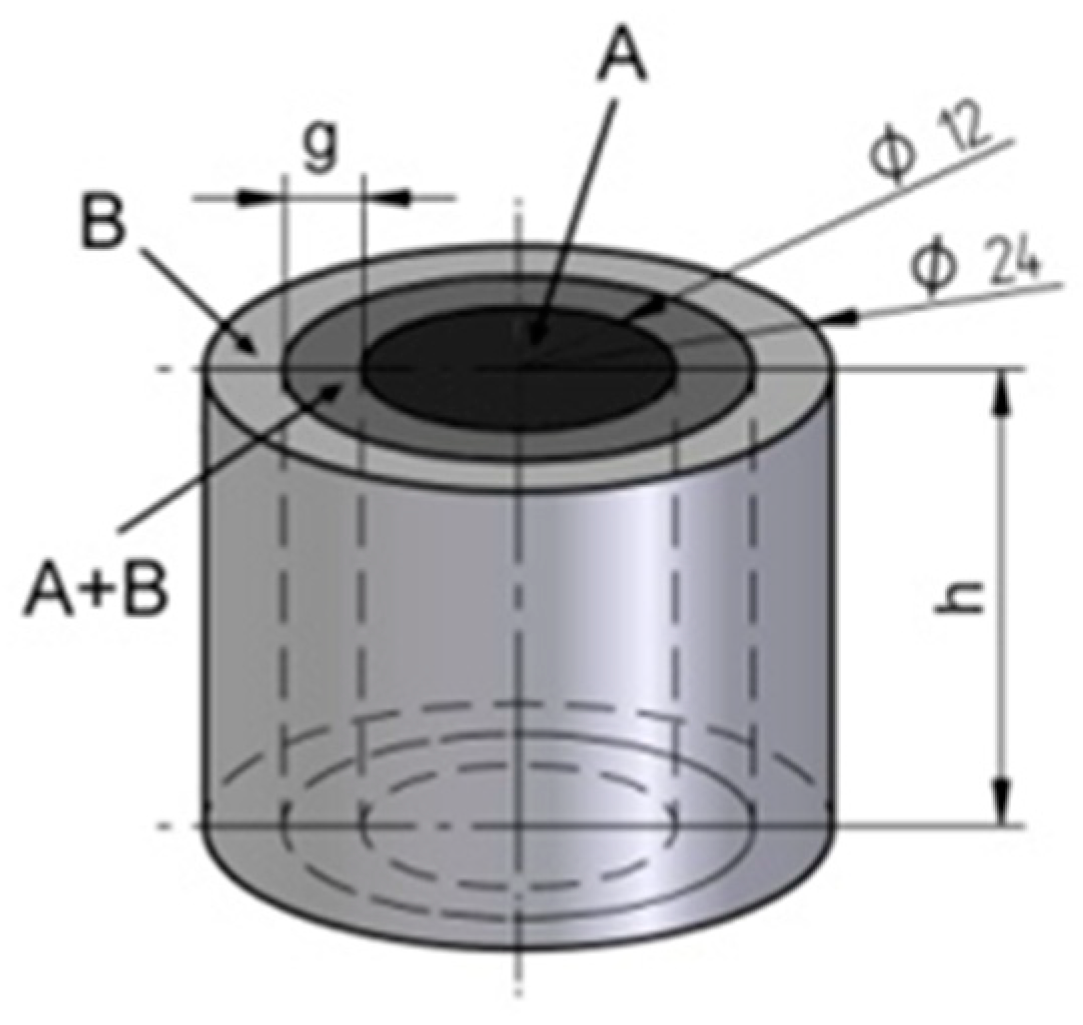
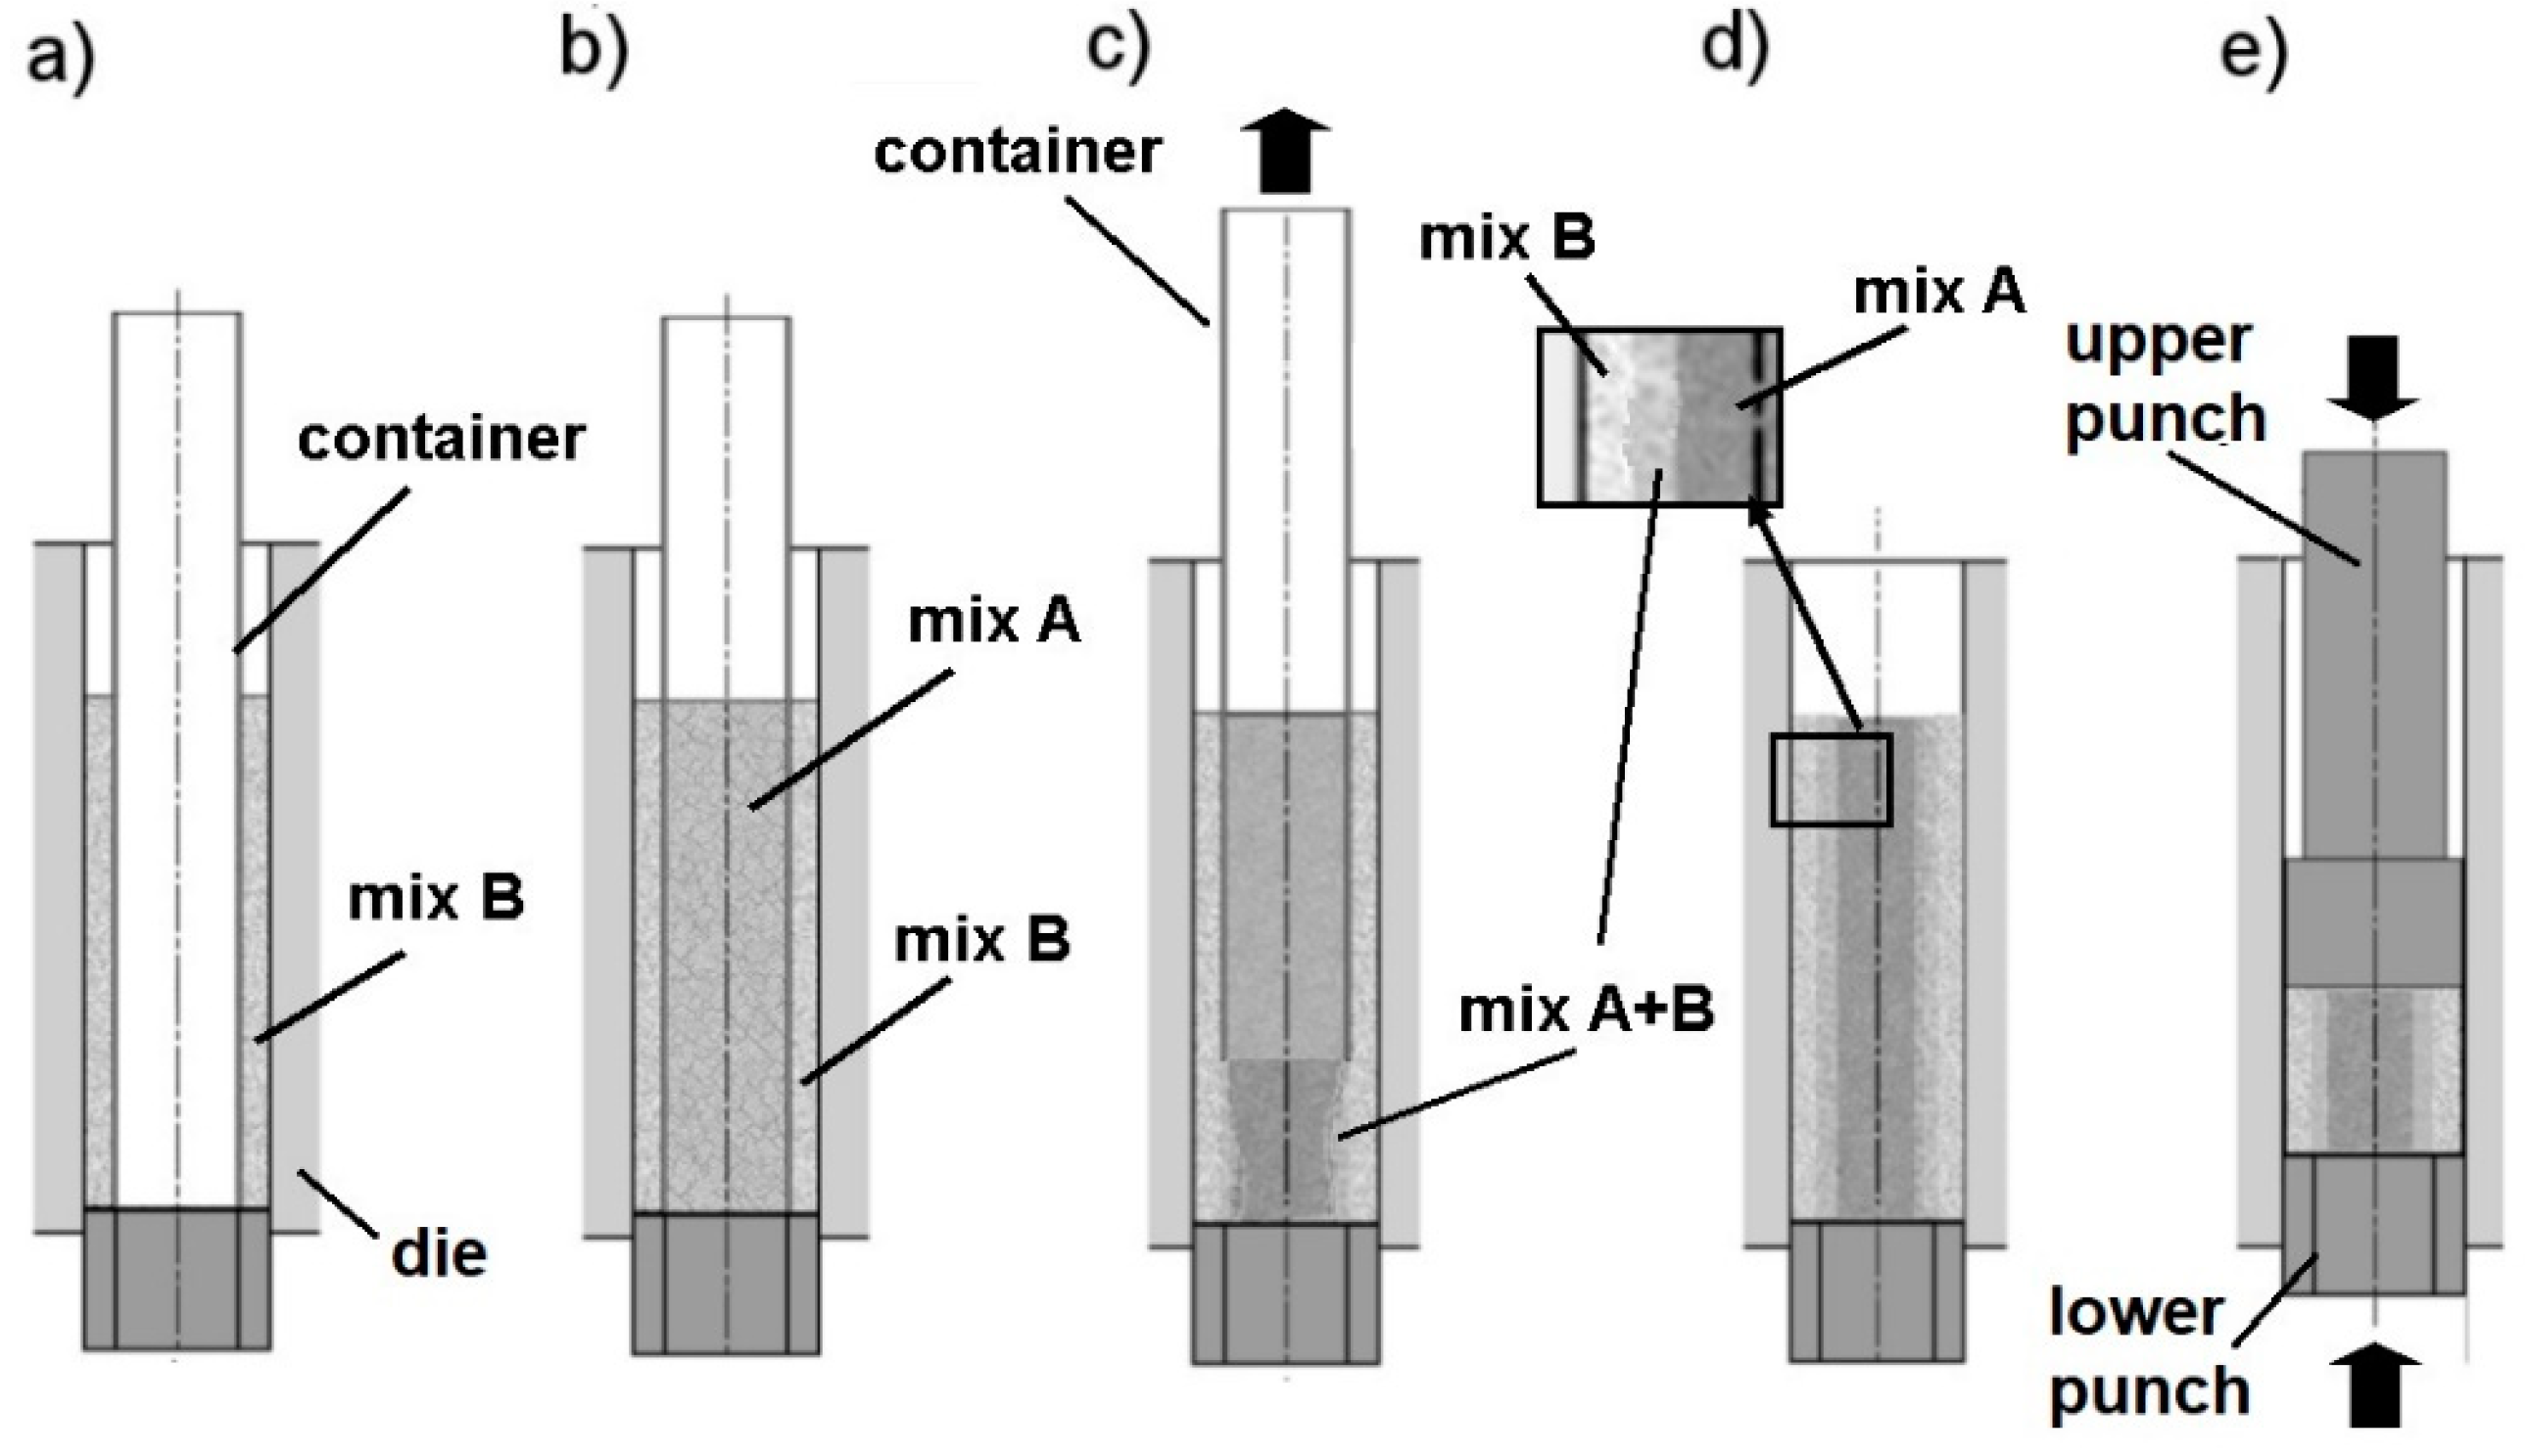
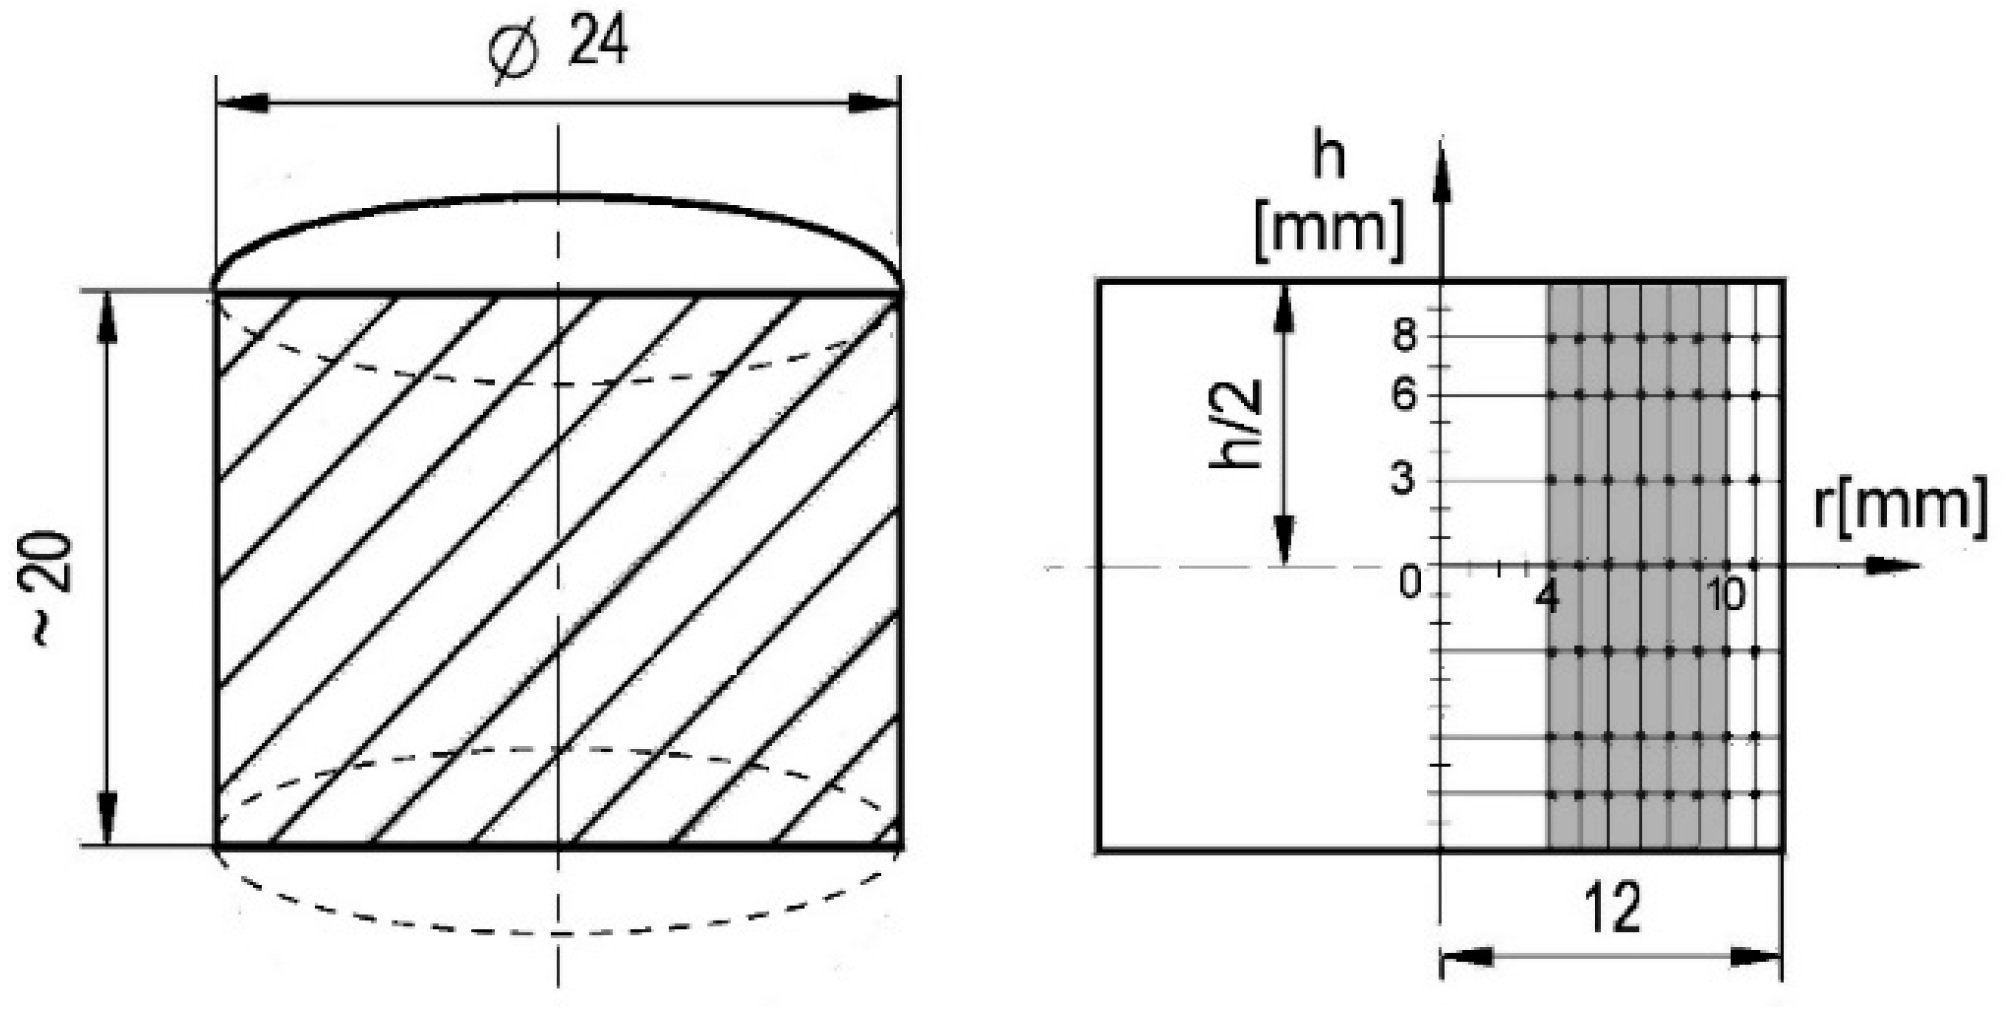
2. Test Materials and Studies Performed

Test products were made from the PNC-60 iron powder (supplied by Höganäs SA, Sweden), which contained sponge iron powder designated by the trade name of NC 100.24, to which shredded particles of ferrophosphorus were added. The basic physical and chemical properties of the powder according to the manufacturer’s specification are as follows:
  • bulk density—3.14 (g/cm3);
  • flowability—25 (s/50 g]);
  • loss of hydrogen, 0.19%.
The results of the sieve analysis of the PNC-60 powder mixture used in these studies, which were taken from the certificate of quality control, are given in Table 1.
The chemical composition of the PNC-60 powder guarantees a high degree of sintering, and due to its mechanical properties after sintering, it is widely used in the manufacture of structural components operating under the conditions of both compressive and tensile stresses. The spongy structure and low hydrogen loss (0.19%) ensure the formation of strong bridges during sintering. The presence of the liquid phase in the form of Fe3P eutectic reduces porosity and improves product homogeneity. Phosphorus extends the range of occurrence of the α phase, whose self-diffusion coefficient is nearly 100 times higher than that of the γ phase. This promotes the diffusion process, enhances sintering, and improves the quality of bonds between powder particles, which is important for short sintering times.
For the purposes of this study, two powder mixtures were prepared: Mixture A, the starting chemical composition, and Mixture B, with an addition of 0.6 wt % carbon in the form of synthetic graphite, which is known under the trade name of Timrex F10 PM Special Graphite, symbol N-010. Both mixtures were enriched with the Kenolube P11 lubricant, which was added in an amount of 0.5 wt %. This was introduced in Mixture B after mixing the iron powder with graphite. Mixing was performed in a mill over a period of two hours. The chemical composition of the PNC-60 powder was taken from the specifications provided by the manufacturer, and the composition of the resulting mixtures, as well as the results of the calculated theoretical density, are compiled in Table 2.
From the powder mixtures, cylindrical samples with dimensions shown in Figure 1 were made. The core of the products was made from the carbon-free mixture (Mixture A), while the outer layer was made from the mixture containing carbon (Mixture B). The calculated mass of the mixtures ensured a similar density in both the core and the outer layer.
The technique of making compacts shown in Figure 2 allowed for the mixing of two powdered compositions while removing the container, which, combined with the subsequent movement of powder during pressing, resulted in the formation of a zone of the gradient structure. The removal of container was accompanied by forced vibrations facilitating a sliding down of powder particles along the container walls. The thickness of the container walls (1.5 mm), which controlled the size of the mixing zone, was selected experimentally.
Sintering by the conventional pressureless technique was carried out for 30 min in a horizontal tube furnace, Nabertherm P330 (Nabertherm GmbH, Lilienthal, Germany), in an atmosphere of hydrogen at a temperature of 1120 °C. The rate of heating and cooling was 10 °C/min. Sintering by SPS was performed in a FCT HP D5 furnace (FCT Systeme GmbH, Rauenstein, Germany), and was carried out at a pressure of 6.6 MPa in an atmosphere of argon at 1050 °C and 1120 °C for five minutes and one minute, respectively. In the sintering process, pre-compacted samples were used. The sintering conditions and parameters are given in Table 3.
After determining the basic physical properties, the sinters were used for the preparation of metallographic sections cut along the product axis. Porosity analysis was performed based on the images of unetched specimens, while the microstructure was determined after etching in a 4% Nital solution. The measurement of porosity and microstructural analysis were performed using micrographs of the metallographic specimens, which was discretized by the imposed measuring grid that is shown. The place where the metallographic specimens were taken and the scheme of the measuring grid that was used in the examinations are shown in Figure 3. The grey color marks an area that is four mm away from the product axis and six mm wide, where the transition zone between the core and the outer layer has been formed.
The following tests were performed:
  • measurement of the apparent density of products sintered by the hydrostatic method;
  • analysis of pore structure using image analysis, including a determination of pore size distribution and shape (ImageJ used for image processing and analysis, version 1.51);
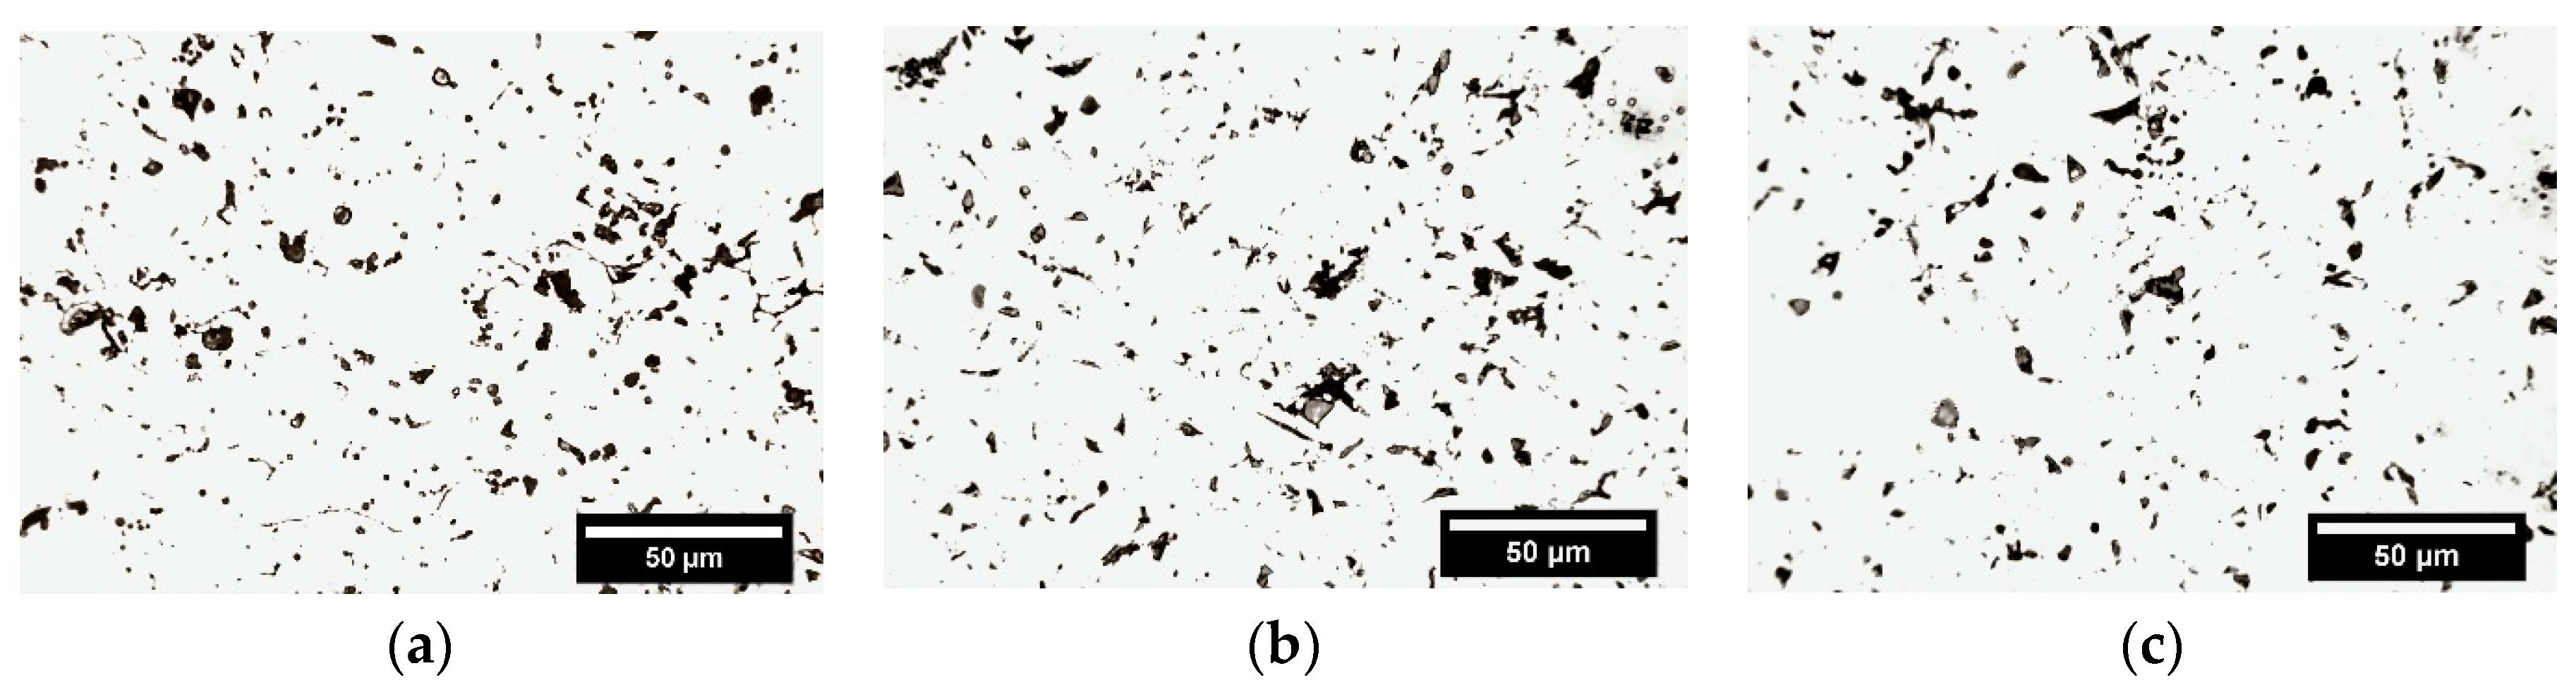
  • examination of microstructure based on the images taken with a Nikon Eclipse ME600P optical microscope (Nikon Instruments Inc. Melville, New York, NY, USA) equipped with a digital image recording system.

3. Results and Discussion

All the results of the studies were calculated as mean values of the determined parameters with a 95% confidence interval. The average density and apparent porosity of samples after pressing and sintering are shown in Table 4.
Both sintering methods increased the density of products, with this increase being slightly higher in the case of the conventional method. The increased density of the PNC-60 powder products after sintering was due to the presence of a liquid phase, which by wetting the surface of the particles intensified the transfer of atoms of the solid phase. With the disappearance of the liquid phase, the increase in density depended on the sintering time only; therefore, after conventional sintering, the samples showed higher density than they did after SPS. Despite the drop in temperature from 1120 °C to 1050 °C, extending the SPS time from one to 10 min increased the density, but the density was still lower than it was in the conventionally sintered products. Since sintering was carried out on compacts, the additional effect of pressure during SPS on material compaction by plastic deformation was in this case negligible.

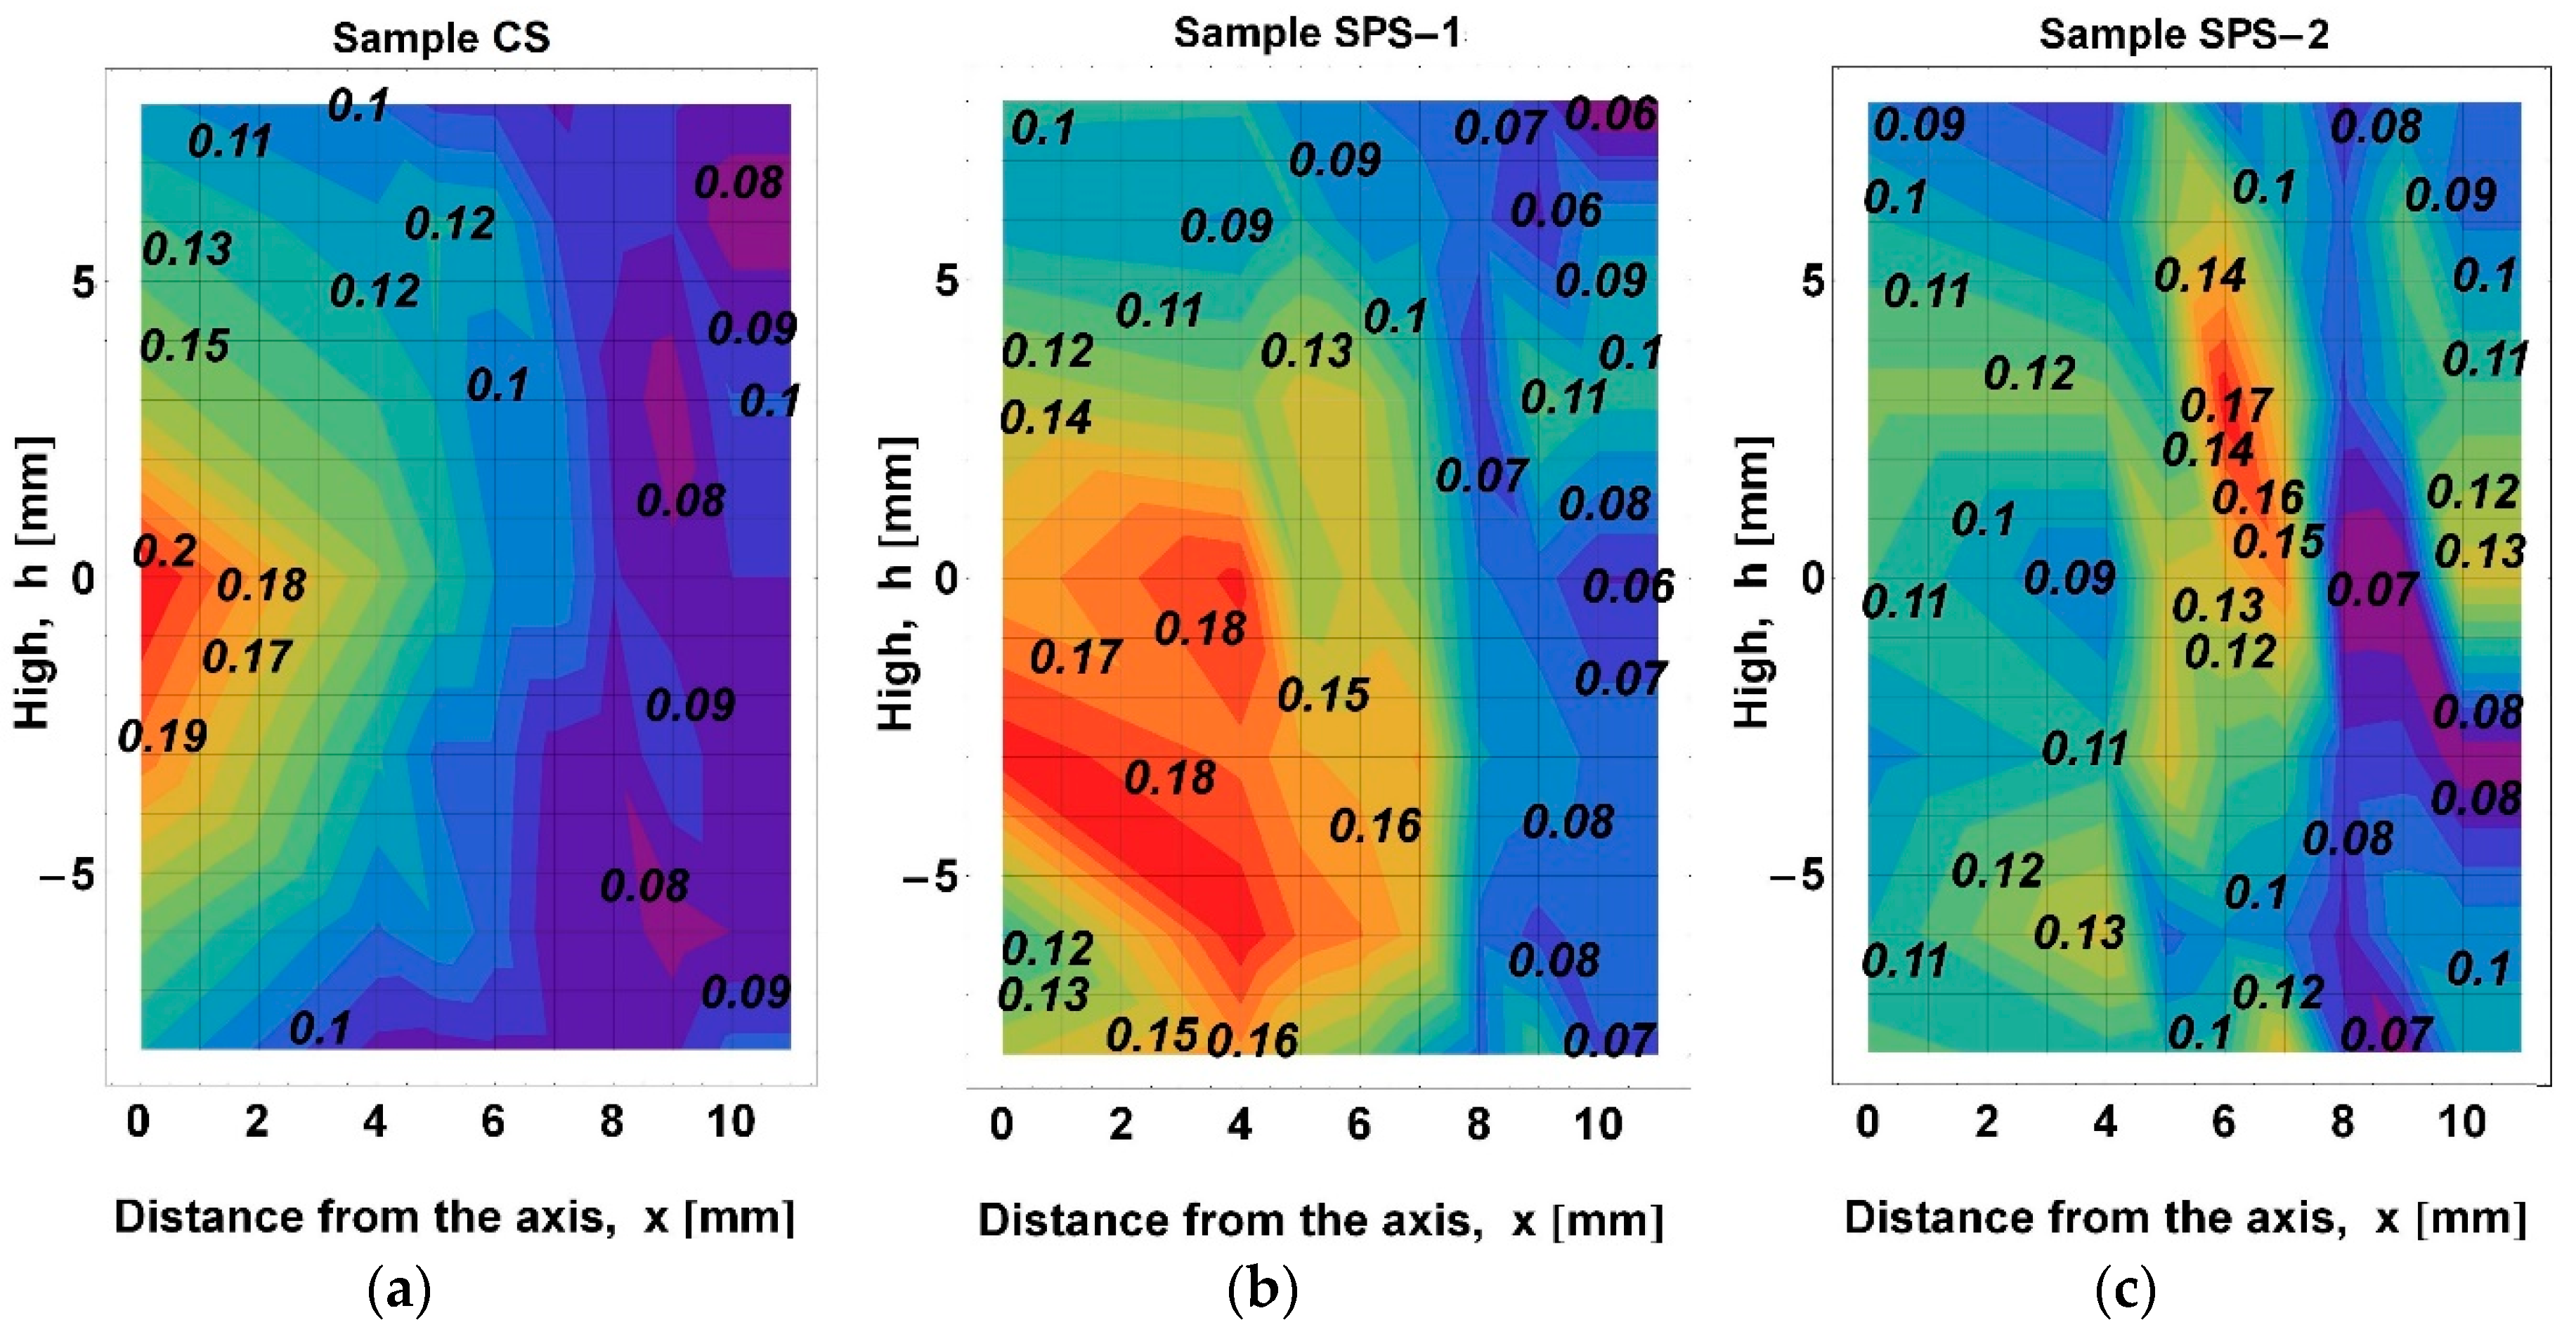
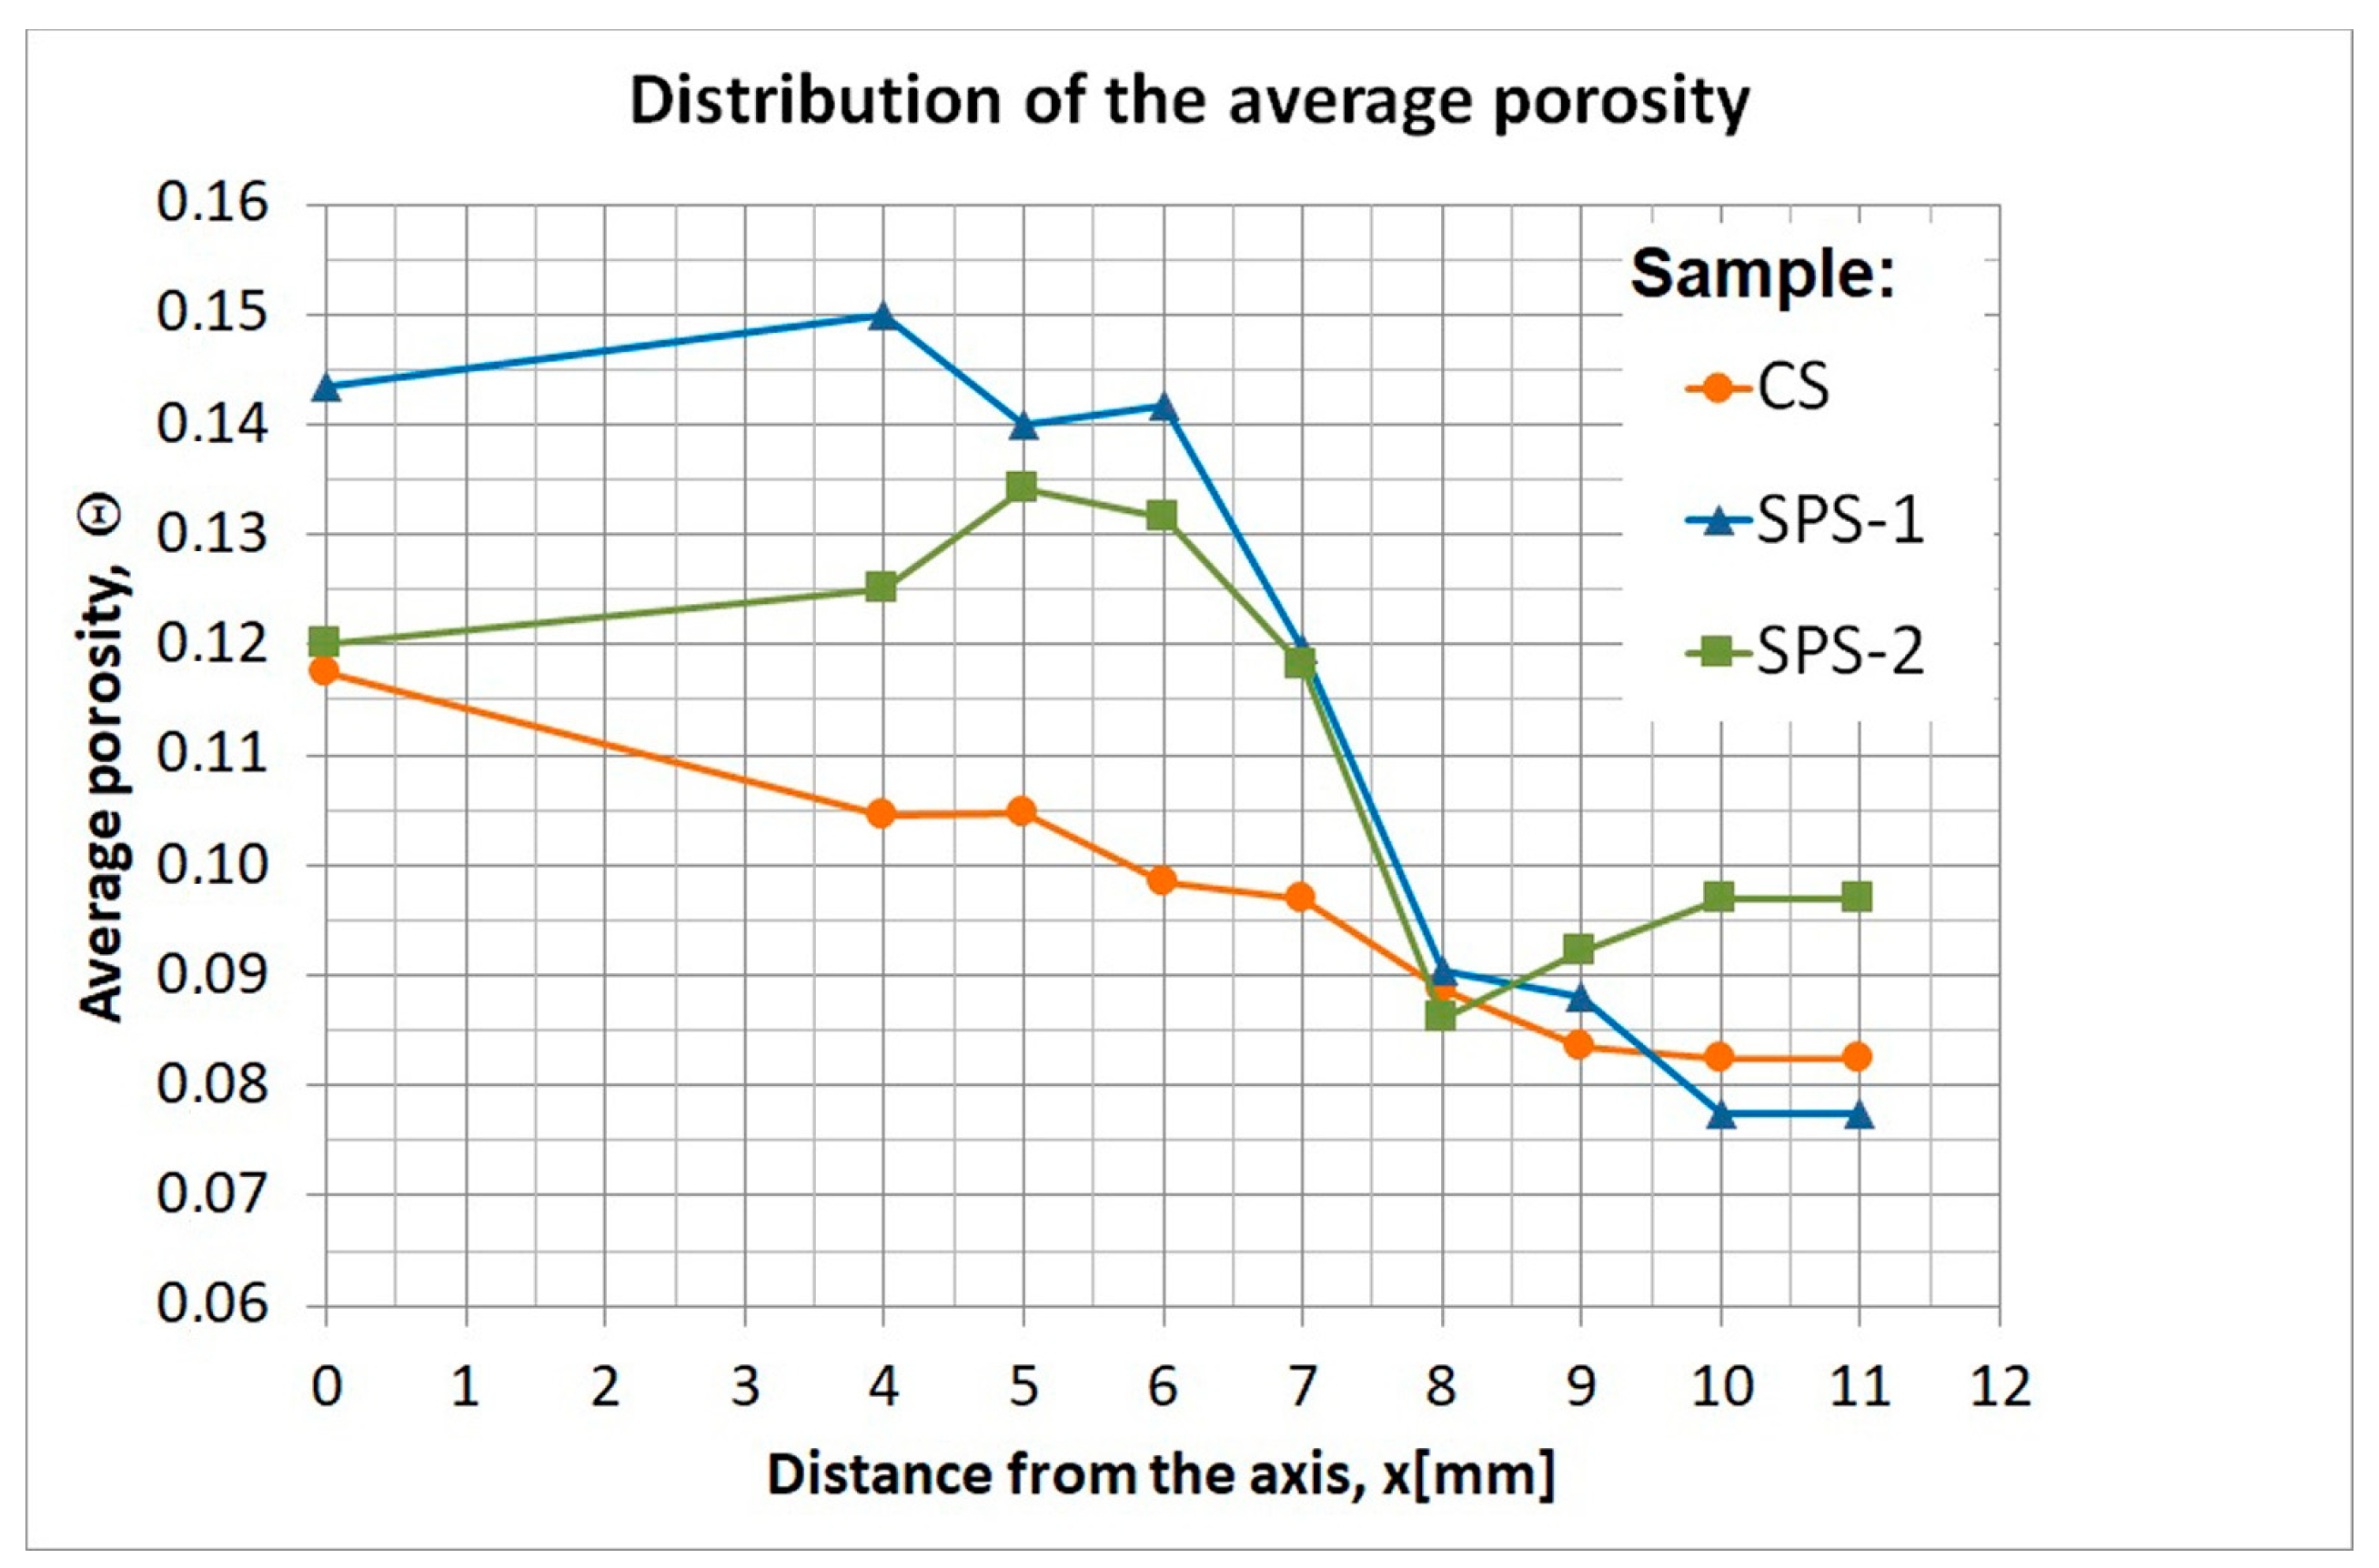
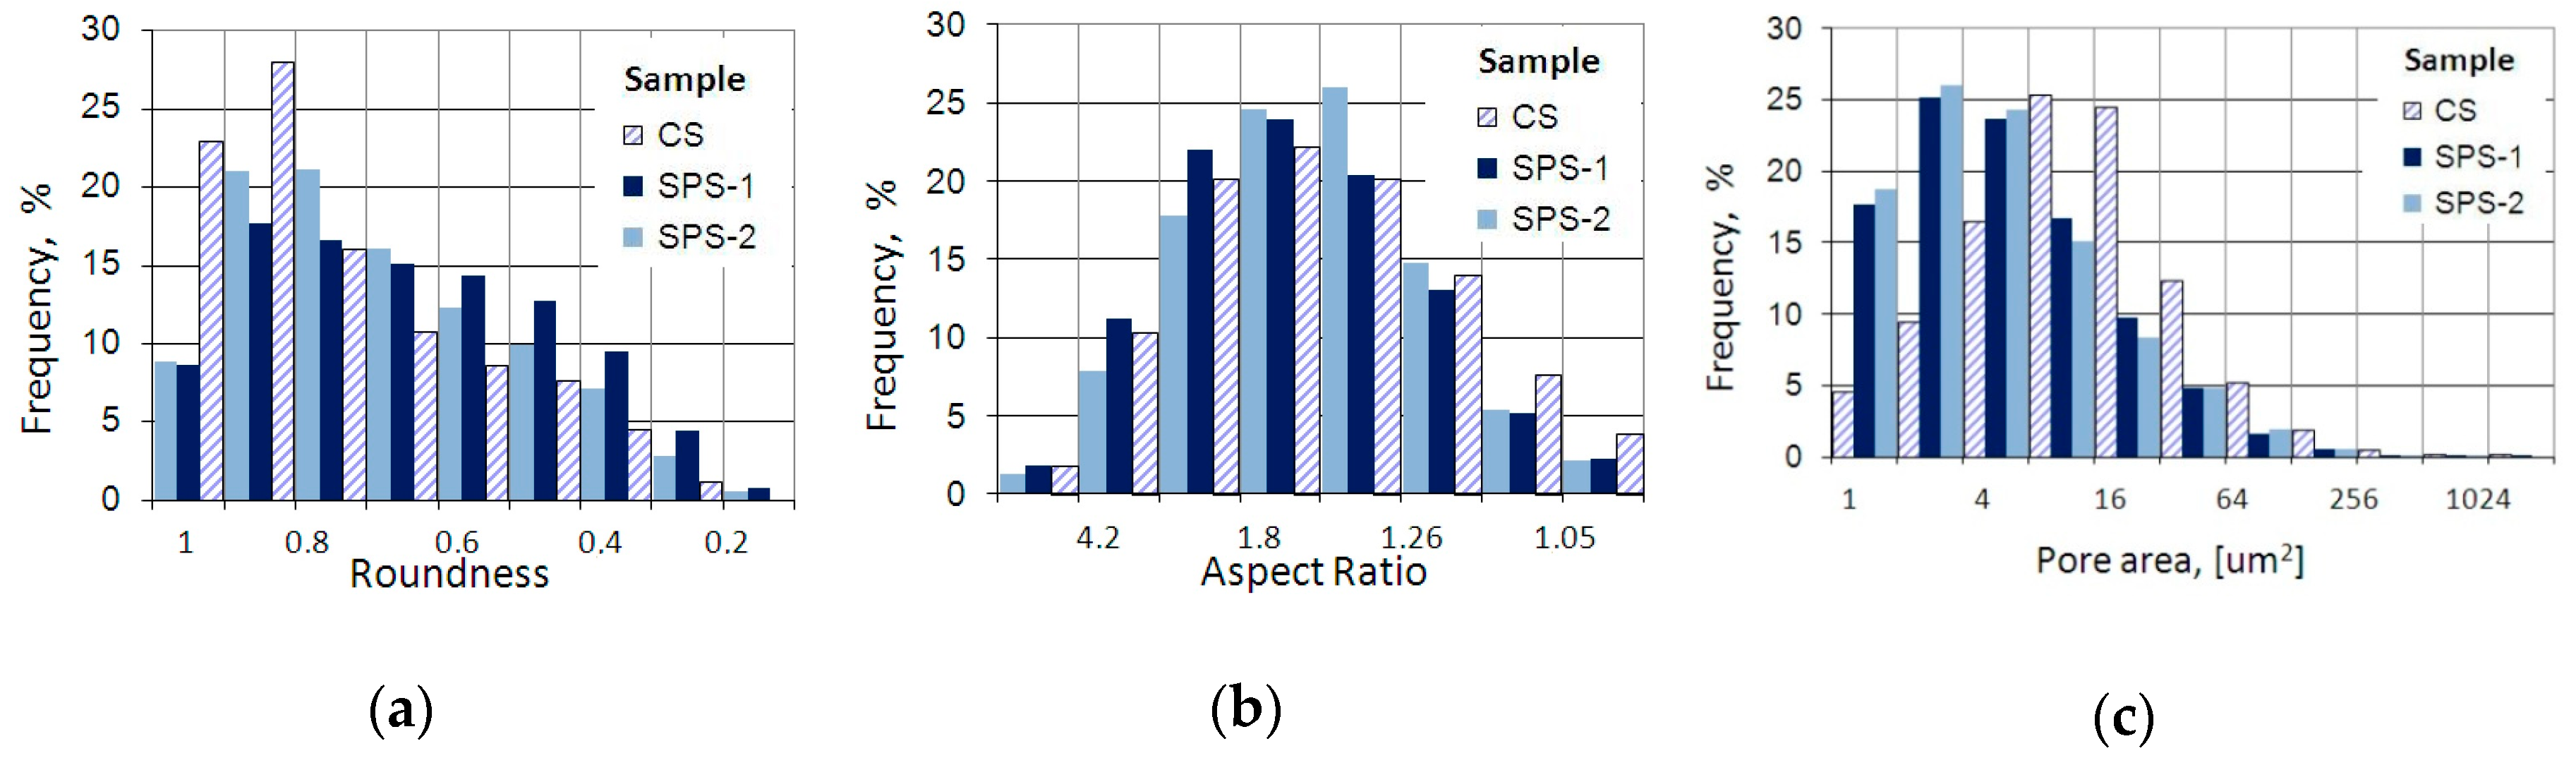
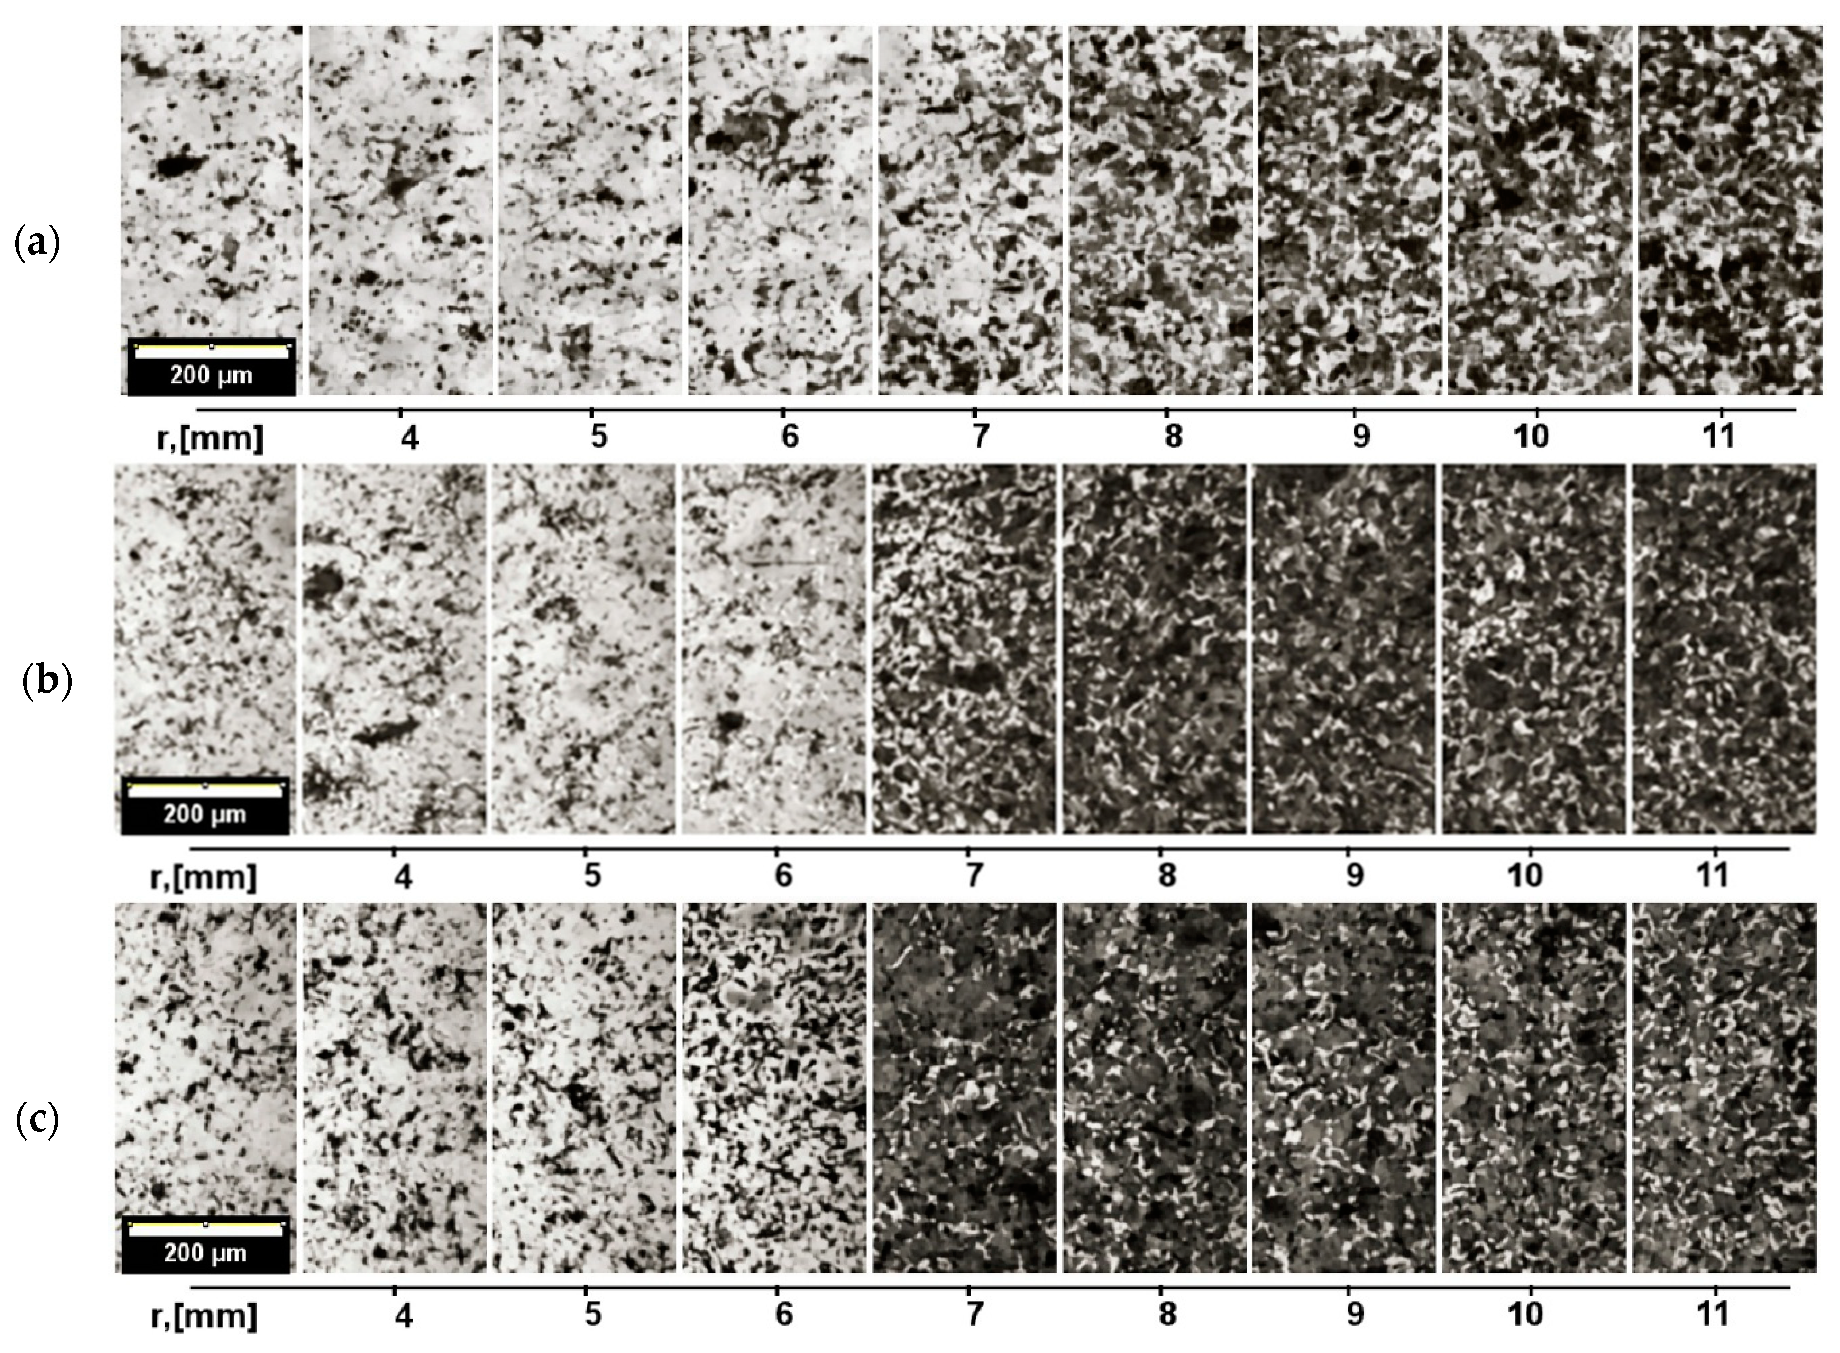
3.1. Analysis of Porosity

Studies of the effect of the sintering process parameters on the porosity distribution were based on examinations of micrographs of the unetched metallographic specimens made in accordance with the measuring grid shown in Figure 3.
In the vicinity of each point in the measuring grid, a series of microphotographs was taken at a magnification of 200×, which was always covering a specimen area of about 0.32 mm2. The averaged results that were obtained for each of the measuring points were next used to plot the graphs of porosity distribution in the cross-section of the examined samples, as shown in Figure 4. Figure 5 shows the distribution of the average porosity as a function of the distance from the axis of products sintered by various methods.
The porosity shows a high degree of heterogeneity. One can easily notice that areas with the lowest density are placed in the middle of the product height and in the core made of Mixture A. The area of the lowest density, which is located at about the mid-height of the products, is the result of two-sided compaction carried out under laboratory conditions in a spring-actuated floating die. The depth of immersion of the punch in a die is in this case dependent on the local conditions of the powder friction against the die walls, with the effect that the zone of the highest porosity is located at different heights. The distribution of porosity in the products made by SPS shows different values in the core and the outer layer, while the clear line of division separating these two regions is approximately eight mm away from the product axis. A comparison of products sintered by SPS under different conditions of time and temperature shows that the decrease in temperature and prolonging of sintering time lead to a more uniform density distribution (sample designated as SPS-2 in Figure 4c).
The effect of sintering parameters on the morphology of porosity was determined by measuring the average size of the cross-sectional area of voids a [µm2] and by describing their shape, which was expressed with the roundness coefficient fr =·Area/a2 and aspect ratio far = a/b, where a and b are the major and minor axes, respectively, of an ellipse circumscribed on the object. The results of porosity analysis are presented in Table 5, and Figure 6 shows the distribution of the measured parameters.
Examples of the micrographs that were used for the studies of porosity in products sintered by various methods are shown in Figure 7. The final size and shape of voids depend on the time and temperature of the heat treatment applied to samples. The structure of porosity after CS (Figure 7a) is characteristic of iron powder products with a relative density of ρw ≅ 0.9. Small voids have a nearly circular shape, whereas large voids are more elongated; the average value of the coefficient is far greater than 1.4. Pores are characterized by a high average value of roundness coefficient, which is mainly due to the presence of a liquid phase that favors their spheroidization. Similar results describing the morphology of the porosity of products made of iron powder and sintered by conventional and SPS methods were presented by Zarębski and Putyra [5]. The structure of voids depends to a large degree on a significant increase in the sintering time, the effect of recrystallization, stress relaxation in the material undergoing deformation during pressing, and the “absorption” of small voids by large voids.
Compared to conventional sintering, pores in sinters made by SPS are smaller, and their shape is more elongated. A large number of small voids is the result of pulsed discharges occurring between powder particles and the formation of small “welded” bridges, the merging and expansion of which depend on the sintering time and volume diffusion. In SPS, the sintering time is short, so the effect of diffusion and recrystallization on the size and shape of pores is limited. Despite smaller dimensions, pores are characterized by a larger elongation than they are in conventional sintering (Figure 7b). The longer the sintering time, the more extensive the necks, and the less elongated the shape of the voids occluded therein (Figure 7c).

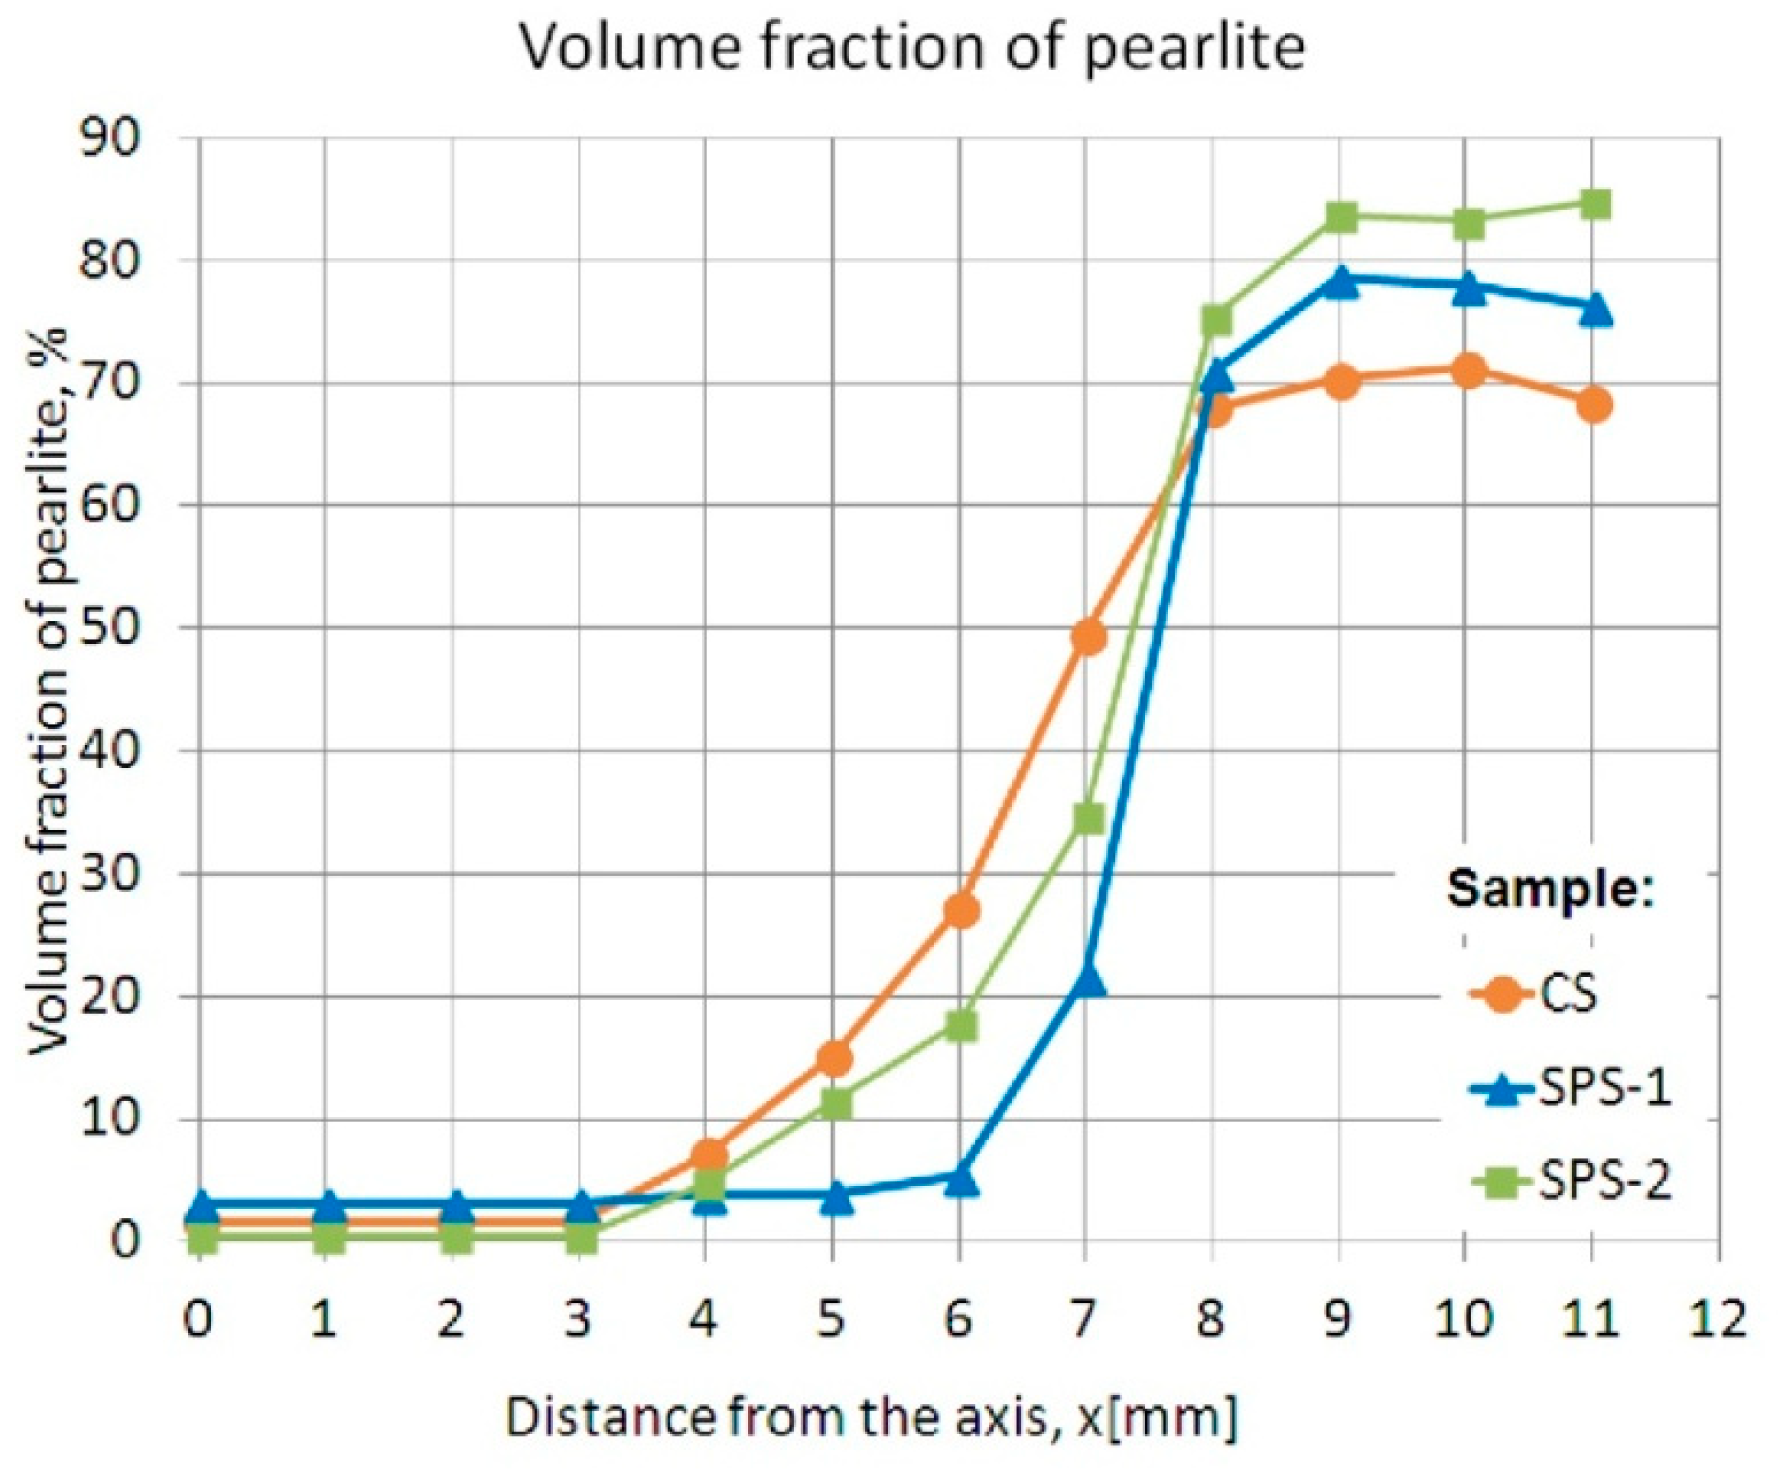
3.2. Microstructural Analysis

Cores of sintered products made from pure PNC-60 powder had a ferritic microstructure with scarce precipitates of iron-phosphorus eutectic. The microstructure of the outer layer of iron powder with approximately 0.6% carbon content was pearlitic–ferritic. This content of carbon in iron corresponded to a maximum 70% volume fraction of pearlite, although the final amount of pearlite also depended on sintering conditions. The CS method resulted in surface decarburization caused by the atmosphere of hydrogen, while the contact of the front faces with graphite punches during SPS additionally enhanced the carburizing effect. For this reason, the actual average content of pearlitic microstructure differed from the theoretical content.
In the transition zone between the core and the outer layer, the final carbon content in the material varied and depended on the ratio of mixtures A and B. Studies to assess the nature and the width of this area have been based on the determination of the volume fraction of pearlite measured at fixed points on the cross-section of products. As a measure of the gradient microstructure was adopted, the volume fraction of pearlite was examined as a function of the distance from the sample axis. Various sintering methods are compared in Figure 8.
Changes in the volume fraction of pearlite plotted in Figure 8 indicate the position of the gradient transition zone that formed between the core and the outer layer of the products. As is apparent from the comparison, the range of pearlite occurrence increases with the increasing time of sintering. The short sintering time in the SPS method confined the diffusion area of carbon, and the transition zone between the two materials was much narrower than that in the CS. On the other hand, the time extension from one to 10 min enlarged the gradient zone in the SPS-2 sample compared to the SPS-1 sample. In products sintered by SPS, a higher volume fraction of pearlite was observed near the sample surface, which was due to the carburizing effect acting on the side surfaces as a result of contact with the graphite die. The content of pearlite increased as the sintering time increased. Figure 9 shows a panoramic map of microphotographs to compare the gradient microstructure in products sintered by various methods.

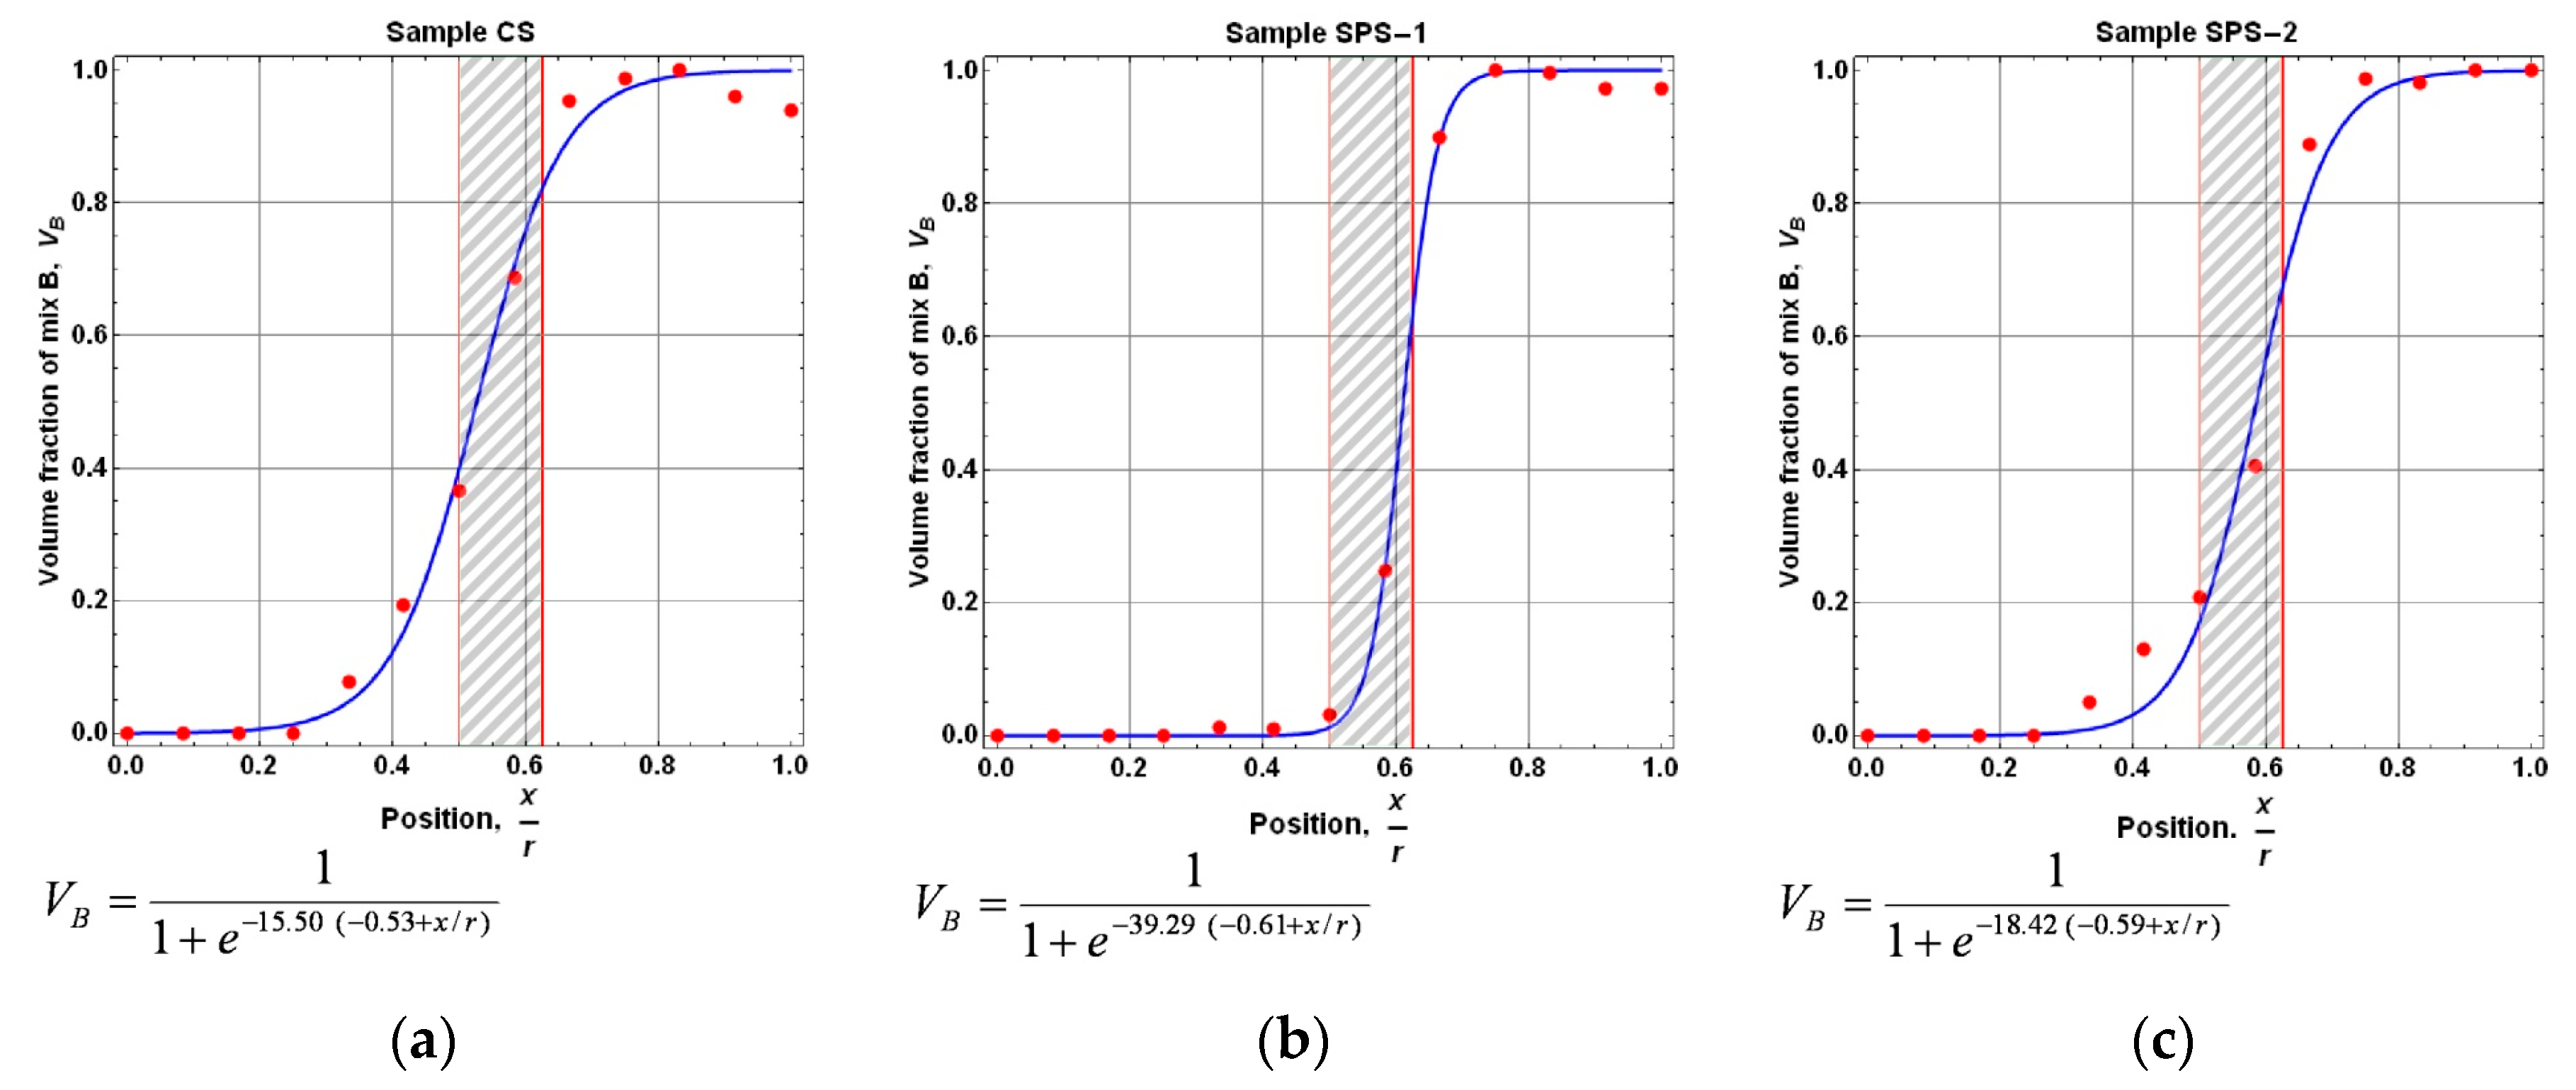
3.3. Mathematical Description of the Gradient Microstructure

To formulate a mathematical description of the gradient microstructure in the transition zone, it has been assumed that the absolute maximum and minimum volume fractions of pearlite in the microstructure correspond to, respectively, 100% and 0% of the content of Mixture B. Using this assumption, the volume fraction of Mixture B at a given measurement point VBi, was calculated from Equation (1):
V B i = V p i V p min V p max V p min
where VBi is the volume fraction of pearlite at a given measurement point, and Vpmin and Vpmax are the minimum and maximum volume fractions of pearlite determined for a given sample, respectively.
Typically, a two-dimensional description of the gradient in a unidirectionally graded non-homogeneous structure is based on the volume fraction of one of the materials described by the power function and the exponential or sigmoid function. The use of power and exponential functions for the description of the stress-strain relationship in FGMs was suggested by Shyang-Ho and Yen-Ling [16]. Bhandari and Purohit demonstrated a very good convergence between the sigmoid function describing the bending deformation behavior of plates made from the functionally graded materials and experimental results [17].
If mutual changes in the volume fraction of all the examined materials are not symmetrical or encompass only part of the product, the description of the gradient microstructure requires additional assumptions regarding the position of the gradient zone. This is not necessary when considering Equation (2), which has a very good fit to the experimental results:
V B ( x ) = 1 1 + e a ( x r b )
where VB(x) is the volume fraction of Mixture B, the expression (x/r) is a measure of position, and r is the radius.
Figure 10 shows the use of the sigmoid function expressed in Equation (2) to describe the volume fraction of Mixture B in the structure of products sintered by various methods. The graphs indicate the thickness of the container used in the manufacture of samples and a record of the function plotted for the tested products. The constant “b” indicates a relative position of the area in which the volume fractions of both materials are equal to each other (VA = VB). The constant “a” indicates the nature of the gradient zone; the lower this value, the milder the transition between the materials used, and the wider the gradient zone. This can be clearly seen by comparing the charts in Figure 10a,b.

4. Summary

This paper has presented the results of tests that were conducted to assess the possibility of applying SPS to generate composites based on iron powder with a planned graded structure. The proposed method for the manufacture of cylindrical products with different properties in the core and in the outer layer, by controlling the position of the mixing zone of materials, allows for a microstructure gradient in the previously selected area. In the sintered products based on iron powder with the addition of carbon, the obtained zone of transition from one material to another is strongly dependent on sintering time. Tests have confirmed that in addition to the mixing of materials, the diffusion process has a significant impact on the formation and final shape of the graded structure obtained in products sintered by the conventional process. Sintering by SPS conducted for a much shorter time confines the diffusion to a local range of occurrence, and the resulting graded structure depends on the effectiveness of die filling. After conventional sintering, the transition between materials was milder, and the transition zone was more extensive. In this case, the diffusion process overlapped with the mechanical stirring of powder and extended the area of the gradient zone. The influence of the sintering method on the final density and the morphology of porosity was visible. After SPS sintering, in comparison with conventional sintering, the density was slightly lower, but the average cross-sectional area of the pore was decreased by 50%.

Author Contributions

The manuscript was written by K.Z., K.Z. and P.P. designed and planned the experiments and studies. Tests were performed by K.Z., P.P. and D.M., D.M. was responsible for the project management and review, editing and publication.

Funding

This research received no external funding.

Conflicts of Interest

The authors declare no conflict of interest.

References

  1. Kamdem, Y.; Bouvard, D.; Doremus, P.; Imbault, D. Production of bi-material tubular structures by powder metallurgy. Powder Metall. 2010, 53, 274–277. [Google Scholar] [CrossRef]
  2. Simoneti, J.; Kapelski, G.; Bouvard, D. A sedimentation process for the fabrication of solid oxide fuel cell cathodes with graded composition. J. Eur. Ceram. Soc. 2007, 27, 3113–3116. [Google Scholar] [CrossRef]
  3. Watanabe, Y.; Sato, H. Review Fabrication of Functionally Graded Materials under a Centrifugal Force. In Nanocomposites with Unique Properties and Applications in MedicIne and Industry; IntechOpen: London, UK, 2011; pp. 133–150. [Google Scholar]
  4. Gasik, M.; Zhang, B.; Van der Biest, O.V.J.; Guy, A.; Put, S. Design and fabrication of symmetric FGM plates. In Materials Science Forum; Trans Tech Publications: Aedermannsdorf, Switzerland, 2003; pp. 23–28. [Google Scholar]
  5. Zarebski, K.; Putyra, P. Iron powder-based graded products sintered by conventional method and by SPS. Adv. Powder Technol. 2015, 26, 401–408. [Google Scholar] [CrossRef]
  6. Hulbert, D.M.; Anders, A.; Andersson, J.; Lavernia, E.J.; Mukherjee, A.K. A discussion on the absence of plasma in spark plasma sintering. Scr. Mater. 2009, 60, 835–838. [Google Scholar] [CrossRef]
  7. Saheb, N.; Iqbal, Z.; Khalil, A.; Hakeem, N.; Al Aqeeli, A.; Laoui, T.; Al-Qutub, A.; Kirchner, R. Spark plasma sintering of metals and metal matrix nanocomposites: A review. J. Nanomaterials 2012, 2012, 13. [Google Scholar] [CrossRef]
  8. Guillon, O.; Gonzalez-Julian, J.; Dargatz, B.; Kessel, T.; Schierning, G.; Reathel, J.; Herrmann, M. Field-assisted sintering technology/spark plasma sintering: Mechanisms, materials and technology developments. Adv. Eng. Mater. 2014, 16. [Google Scholar] [CrossRef]
  9. Schmidt, T.; Weissgaerber, T.; Schubert, B.; Kieback, B. Spark plasma sintering of intermetallics and metal matrix composites. In Proceedings of the Euro PM2005 Congress, Prague, Czech Republic, 2–5 October 2005; EPMA: Brussels, Belgium. [Google Scholar]
  10. Omori, M. Sintering, consolidation, reaction and crystal growth by the spark plasma system SPS. Mater. Sci. Eng. A 2000, 287, 183–188. [Google Scholar] [CrossRef]
  11. Diouf, S.; Molinari, A. Densification mechanisms in spark plasma sintering: Effect of particle size and pressure. Powder Technol. 2012, 221, 220–227. [Google Scholar] [CrossRef]
  12. Kieback, B.; Neubrand, A.; Riedel, H. Processing techniques for functionally graded materials. Mater. Sci. Eng. A 2003, 362, 81–106. [Google Scholar] [CrossRef] [Green Version]
  13. Anselmi-Tamburini, U.; Gennari, S.; Garay, J.; Munir, Z. Fundamental investigations on the spark plasma sintering/synthesis process: II. Modeling of current and temperature distributions. Mater. Sci. Eng. A 2005, 394, 139–148. [Google Scholar] [CrossRef]
  14. Vanmeensel, K.; Laptev, A.; Hennicke, J.; Vleugels, J.; Van der Biest, O. Modelling of the temperature distribution during field assisted sintering. Acta Mater. 2005, 53, 4379–4388. [Google Scholar] [CrossRef]
  15. Chen, W.; Anselmi-Tamburini, U.; Garay, J.; Groza, J.; Munir, Z. Fundamental investigations on the spark plasma sintering/synthesis process: I. Effect of dc pulsing on reactivity. Mater. Sci. Eng. A 2005, 394, 132–138. [Google Scholar] [CrossRef]
  16. Shyang-Ho, C.; Yen-Ling, C. Mechanical behavior of functionally graded material plates under transverse load—Part I: Analysis. Int. J. Solids Struct. 2006, 43, 3657–3674. [Google Scholar] [Green Version]
  17. Bhandari, M.; Purohit, K. Analysis of functionally graded material plate under transverse load for various boundary conditions. IOSR J. Mech. Civ. Eng. 2014, 10, 46–55. [Google Scholar] [CrossRef]
Figure 1. Sketch of the sintered product (dimensions in millimeters).
Metals 09 00264 g001
Figure 2. Successive stages of compact fabrication: (a) filling the outer layer; (b) filling the container, (c) and (d) removing the container; (e) double-sided pressing.
Metals 09 00264 g002
Figure 3. Method of metallographic specimen preparation and the scheme of the measuring grid.
Metals 09 00264 g003
Figure 4. Porosity distribution in products sintered by (a) the conventional method (Sample CS), (b) SPS, 1120 °C, one min (Sample SPS-1), and (c) SPS 1050 °C, 10 min (Sample SPS-2).
Metals 09 00264 g004
Figure 5. Distribution of the average porosity as a function of the distance from the axis of products sintered by various methods.
Metals 09 00264 g005
Figure 6. Comparison of porosity structure in products sintered by various methods: (a) the distribution of roundness (fr); (b) the distribution of aspect ratio (far); and (c) the distribution of the size of pores (a).
Metals 09 00264 g006
Figure 7. Examples of micrographs used for the studies of porosity in products sintered by various methods: (a) conventional process: 1120 °C/30 min (CS); (b) SPS: 1120 °C/1 min (SPS-1); (c) SPS: 1050 °C/10 min (SPS-2).
Metals 09 00264 g007
Figure 8. Volume fraction of pearlite as a function of the distance from the axis of products sintered by various methods.
Metals 09 00264 g008
Figure 9. Volume fraction of pearlite as a function of the distance from the axis of products sintered by (a) conventional process: 1120 °C/30 min; (b) SPS: 1120 °C/1 min; (c) SPS: 1050 °C/10 min.
Metals 09 00264 g009
Figure 10. Mathematical description of the volume fraction of Mixture B (VB) in the radial direction of products; (a) the conventional method (Sample CS), (b) SPS, 1120 °C, one min (Sample SPS-1), (c) SPS 1050 °C, 10 min (Sample SPS-2).
Metals 09 00264 g010
Table 1. The sieve analysis of PNC-60 powder.
The Size of Powder Particles (μm)Content (%)
>2120
150–2122.1
106–15026.4
75–10630.4
45–7522.9
<4518.2
Table 2. Chemical composition of PNC-60 iron powder and of powder mixtures A and B.
DesignationContent (wt %)Theoretical density (g/cm3)
PNC-60C (Graphite)Lubricant
PCFe
A0.600.06Rest0.000.507.834
B0.600.06Rest0.600.507.801
Table 3. The designation of products and the applied technological parameters. CS: conventional sintering; SPS: spark plasma sintering method.
SamplesPressing Sintering
Pressure, Pc, MPaMethodTemperature, Ts, °CTime, ts, minPressure, Ps, MPaAtmosphere
CS700Conventional112030-Hydrogen
SPS-1700SPS112016.6Argon
SPS-2700SPS1050106.6Argon
Table 4. The average density and apparent porosity of samples after pressing and sintering.
SampleAverage Density after Pressing, ρc, (g/cm3)Average Density after Sintering ρs, (g/cm3)Apparent Porosity after Sintering, Θ
CS6.911 ± 0.0087.047 ± 0.0290.098 ± 0.004
SPS-16.936 ± 0.0220.112 ± 0.003
SPS-26.998 ± 0.0060.104 ± 0.001
Table 5. Parameters of porosity.
SampleAverage Pore Area a, (um2)Average Roundness frAverage Aspect Ratio far
CS13.0 ± 0.50.749 ± 0.0021.461 ± 0.007
SPS-15.8 ± 0.20.639 ± 0.0021.793 ± 0.010
SPS-25.7 ± 0.20.672 ± 0.0021.668 ± 0.010

