Article

Thermal Simulation Study on the Solidification Structure and Segregation of a Heavy Heat-Resistant Steel Casting

1
Materials Genome Institute, Shanghai University, Shanghai 200444, China
2
School of Materials Science and Engineering, Shanghai University, Shanghai 200444, China
3
Key Laboratory for Liquid-Solid Structural Evolution and Processing of Materials (Ministry of Education), Shandong University, Jinan 250061, China
4
Shanghai Honggang Power Station Equipment Casting & Forging Co., Ltd., Shanghai 200240, China
5
Shougang Research Institute of Technology, Beijing 100043, China
*
Author to whom correspondence should be addressed.
Metals 2019, 9(2), 249; https://doi.org/10.3390/met9020249
Submission received: 13 January 2019 / Revised: 3 February 2019 / Accepted: 13 February 2019 / Published: 20 February 2019
(This article belongs to the Special Issue Advanced Simulation Technologies of Metallurgical Processing)

Abstract

:
The prediction and controlling of the solidification structure and macro-segregation in heavy steel casting, which is usually produced in limited quantities, was a conundrum in the foundry field. In this work, the cooling and solidification processes of a 16 t CB2 ferritic heat-resistant steel (FHRS) valve casting were reproduced by studying the solidification behavior of three typical units through a thermal simulation method. The results indicate that the types of casting without chilling have the most uneven distribution of solutes and hardness, while those types of casting in which parts are solidified by chilling are much more uniform. The macro-segregation degrees of B, C, Nb, P, Cr, Mo, Si, V and Mn decrease gradually during heavy casting of CB2 ferritic heat-resistant steel. Of them, B, C, Nb, and P are solutes prone to segregation, and the maximum macro-segregation index of B can even reach 15. The macro-segregation tendencies of Cr, Mo, Si, V, and Mn are relatively small. Further studies on the last solidification portion of samples taken by electron microprobe reveal that large-sized precipitates such as MnS and NbxC are easily formed due to solute enrichment, and the sizes of these precipitates were distributed from dozens to hundreds of micrometers.

1. Introduction

In recent years, ultra-supercritical thermal power units with improved thermal efficiency have been attracting increasing interest in many countries, in order to reduce the emission of CO2 and hazardous gases [1,2,3]. Ultra-supercritical thermal power units require castings to work in conditions of 30 MPa/600 °C or even higher pressures and temperatures for long durations. Due to its excellent performance at high temperatures and pressure, 9–12%Cr ferritic heat-resistant steel has become the preferred material for 630–650 °C ultra-supercritical units. The CB2 ferritic heat-resistant steel (FHRS) with improved performance at high temperatures has been developed by adding Co solute and increasing the B content to 0.01 wt.%. Co can accelerate Laves phase kinetics by preventing δ-ferrite formation. As a result, more W and Mo atoms can be maintained in the matrix after normalization [4]. An increase of B can improve the creep strength of steels [5]. Moreover, the addition of Mo, V, Nb can remarkably improve the working temperatures and service life of the FHRSs [6].
At present, the research on FHRS mainly focuses on its microstructure, precipitates or mechanical properties after heat treatment or forging [7,8,9], but its solidification process has been paid little attention. In previous studies, the chemical distribution and solidification process were mainly investigated by dissecting the casting [10,11,12] or by numerical simulation [13,14,15], due to the large size of FHRS castings. Dissecting the heavy castings is not cost-effective and will cost a lot in human resources and time. On the other hand, it is difficult to predict accurately the solidification microstructure by numerical simulations, as these contain many assumptions and simplifications. Moreover, numerical simulations normally require experimental verification. However, verification experiments cannot simulate precisely the solidification process, since most of the solidification processes are non-equilibrium, and the solidification microstructure depends highly on the solidification conditions.
Based on the heat transfer characteristics of continuous casting, Zhai et al. have developed a new approach to investigating the solidification process of the slab by studying the “characteristic solidification unit”, which requires only a small number of materials [16,17]. The results show that the microstructure and macro-segregation of the thermal simulated (TS) samples agree well with the actual continuous casting slab [16].
In this work, the solidification process of complex large-scale FHRS casting is revealed by studying the solidification behavior of the characteristic units. Both numerical simulation and thermal simulation experiments are conducted. The macro-segregation [18] and solute redistribution [19,20] in TS samples are investigated.

2. Experimental Procedures

2.1. Experimental Material

In this study, a ZG12Cr9Mo1Co1NiVNbNB CB2 FHRS was used. The chemical composition is shown in Table 1.

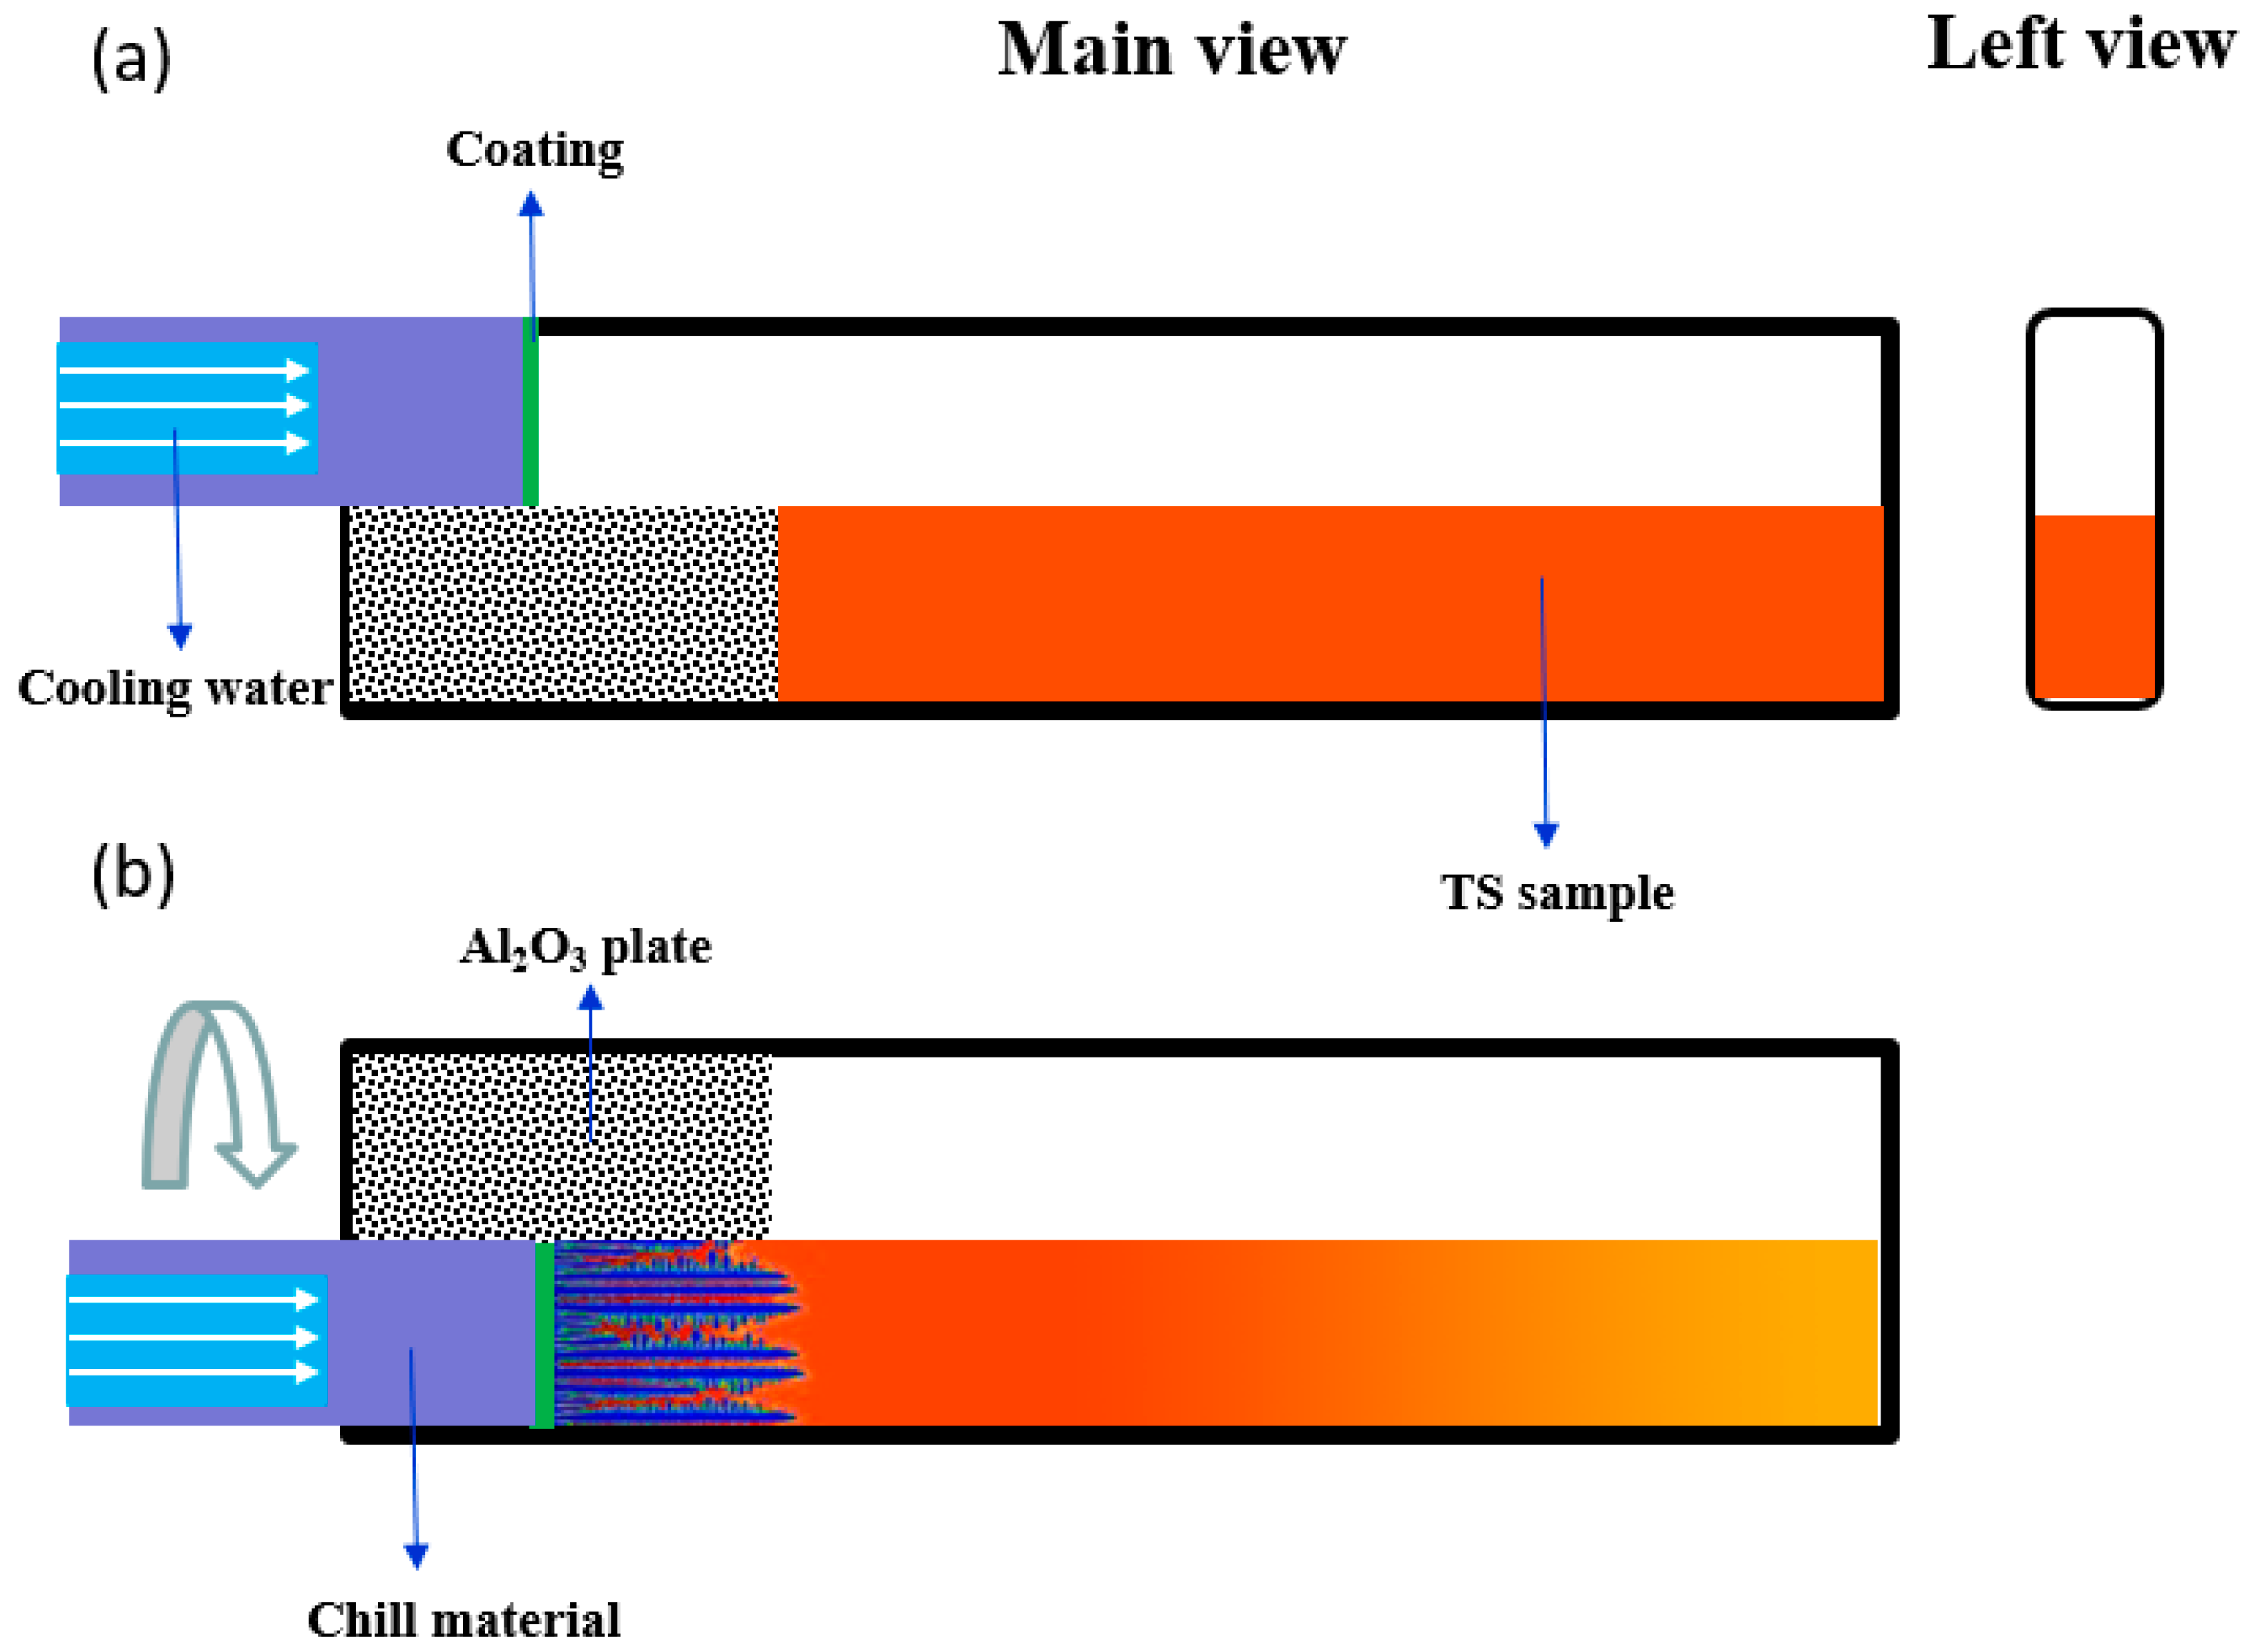
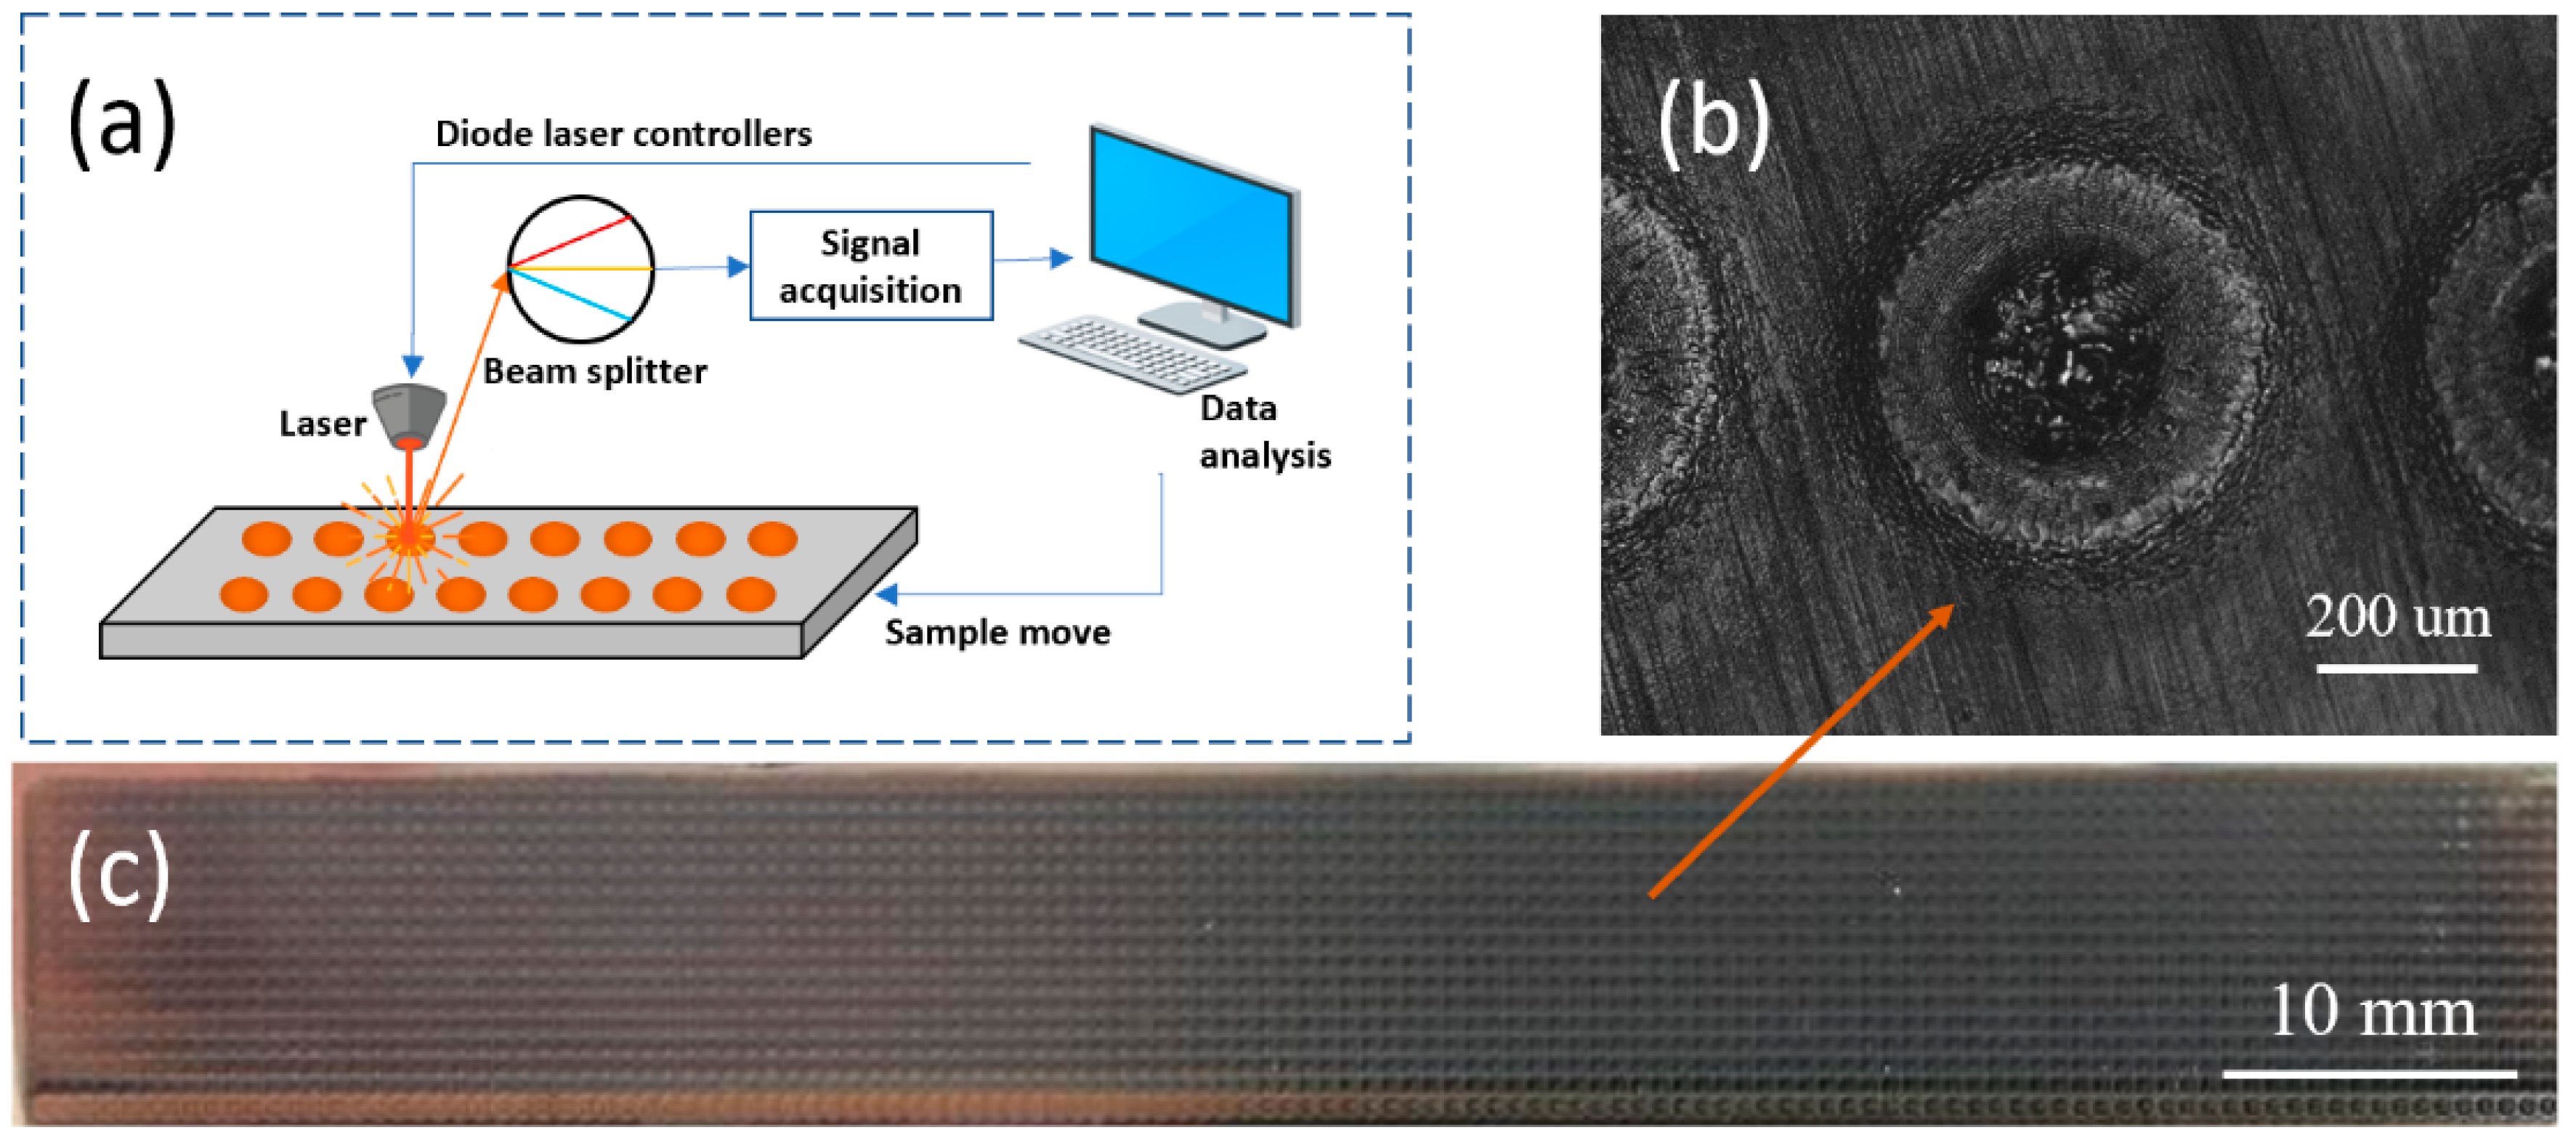
2.2. Experimental Method

The experimental study was conducted using home-made thermal simulation equipment for the solidification process [16]. Similar to the solidification process of the continuous casting slab, the solidification process of valve casting can be simplified as a one-dimensional heat transfer process, as the length and width of this casting are considerably larger than its wall thickness (200 mm). As a result, the temperature gradient in the radial direction was much larger than other directions, as shown in Figure 1, leading to a sequential solidification process from the outer surface to the center. Therefore, a simulation method similar to directional solidification can be used to study the solidification process of the heavy CB2 FHRS valve casting.
Figure 2 shows the steps of the thermal simulation method for heavy castings. The numerical simulation was first conducted using ProCAST (ProCAST 2009, ESI Group, Paris, France) to study the temperature distribution of the heavy casting during solidification. Afterwards, the following three characteristic solidification units of the casting were selected based on the thermal field at: (1) the position without chills, where the heat was mainly dissipated through the sand mold (sample TS1); (2) the position with small chills (TS2), and (3) the position with large chills (TS3). Since the wall thickness of the casting was 200 mm, the length of the TS samples was set to 100 mm (i.e., half of the wall thickness). The width and height of the TS samples were set to 10 mm and 15 mm, respectively.
The thermal simulation experiments were then conducted to simulate the solidification process at the selected positions: TS1, TS2, and TS3. A small FHRS block was placed in an Al2O3 crucible, as shown in Figure 3a. Al2O3 porcelain beads were used to separate the chilled material (Fe-0.45C) from the small FHRS block, to ensure the complete melting of the materials. The inner surface of the chilled material was coated with a refractory coating, the same as the actual casting process.
The crucible was heated up to 1550 °C for 30 min in the furnace, protected by Ar. Afterwards, the crucible was rotated, as indicated in Figure 3b. Thus, the molten steel contacted the chilled material, and a solidification layer formed rapidly on the surface of the sample. The sample was then cooled to room temperature in a furnace. Considering that the temperature at the surface of casting changed too sharply to have been reached in the furnace, and the solidification process of the positions less than 20 mm away from the surface were mainly affected by the chilled material, the cooling process was controlled according to the numerical simulation results, which were obtained at positions of 20 mm and 100 mm away from the surface.
The samples were polished and etched in a solution of 4 g picric acid, 5 mL hydrochloric acid and 100 mL absolute ethanol. The solidification structure was characterized by an optical microscope (OM; Imager A 2m, Zeiss, Jena, Germany). The Vickers hardness (MH-5L, Shanghai Everyone Precision Instruments, Shanghai, China) distribution of the longitudinal section of each TS sample was measured using an automatic Vickers hardness tester. The interval between the test points was 2 mm at both the horizontal and vertical directions. When the test area and interval between the test points were set in the computer, the stage carrying the sample moved automatically. Solute distribution of the longitudinal section of each TS sample was studied by a laser-induced breakdown spectroscope (LIBSOPA-200, NCS Testing Technology, Beijing, China) with a spot size of 300 μm. The principle of laser-induced breakdown spectroscope (LIBS) [21,22,23] is shown in Figure 4a. Both pre-erosion and erosion were repeated for 20 times for each measuring point. Figure 4b shows the morphology of a single point after laser excitation on the surface. The interval between the measuring points was 800 μm both at the vertical and horizontal direction, as indicated in Figure 4c, which shows the profile of a TS sample after LIBS test. The solute redistribution of sample was studied by electron microprobe (EPMA-8050G, Shimadzu, Kyoto, Japan).

3. Results and Discussion

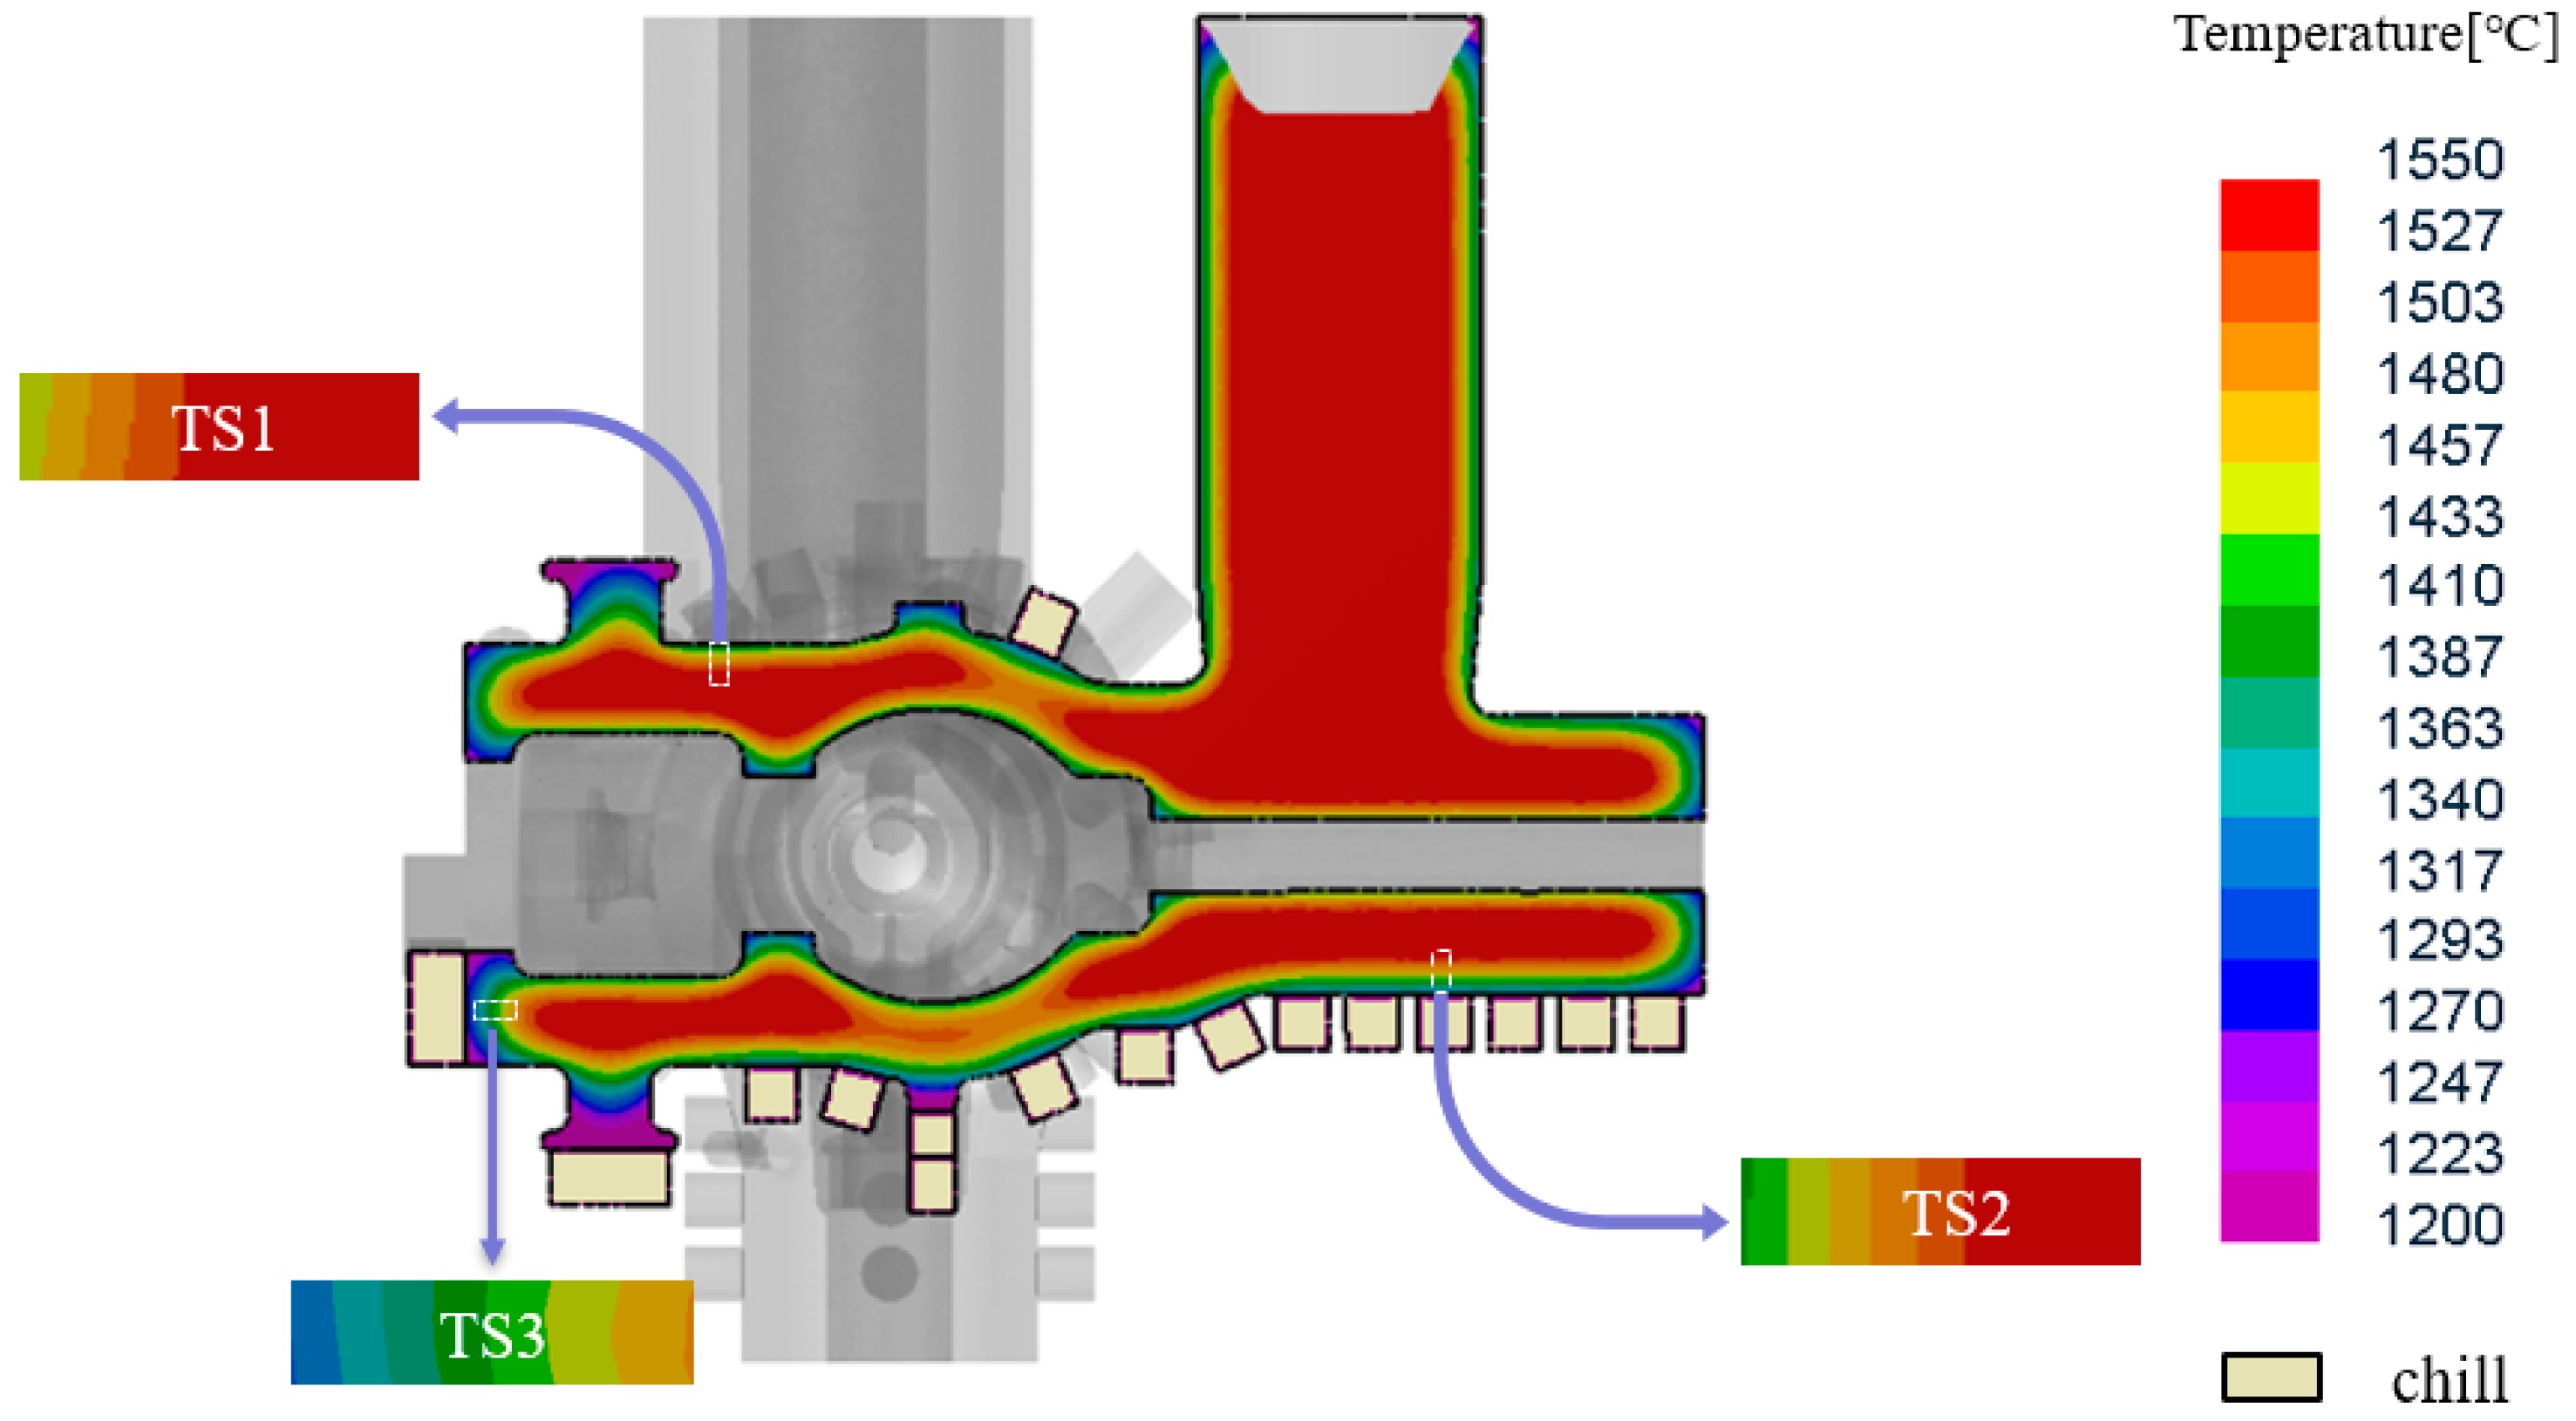
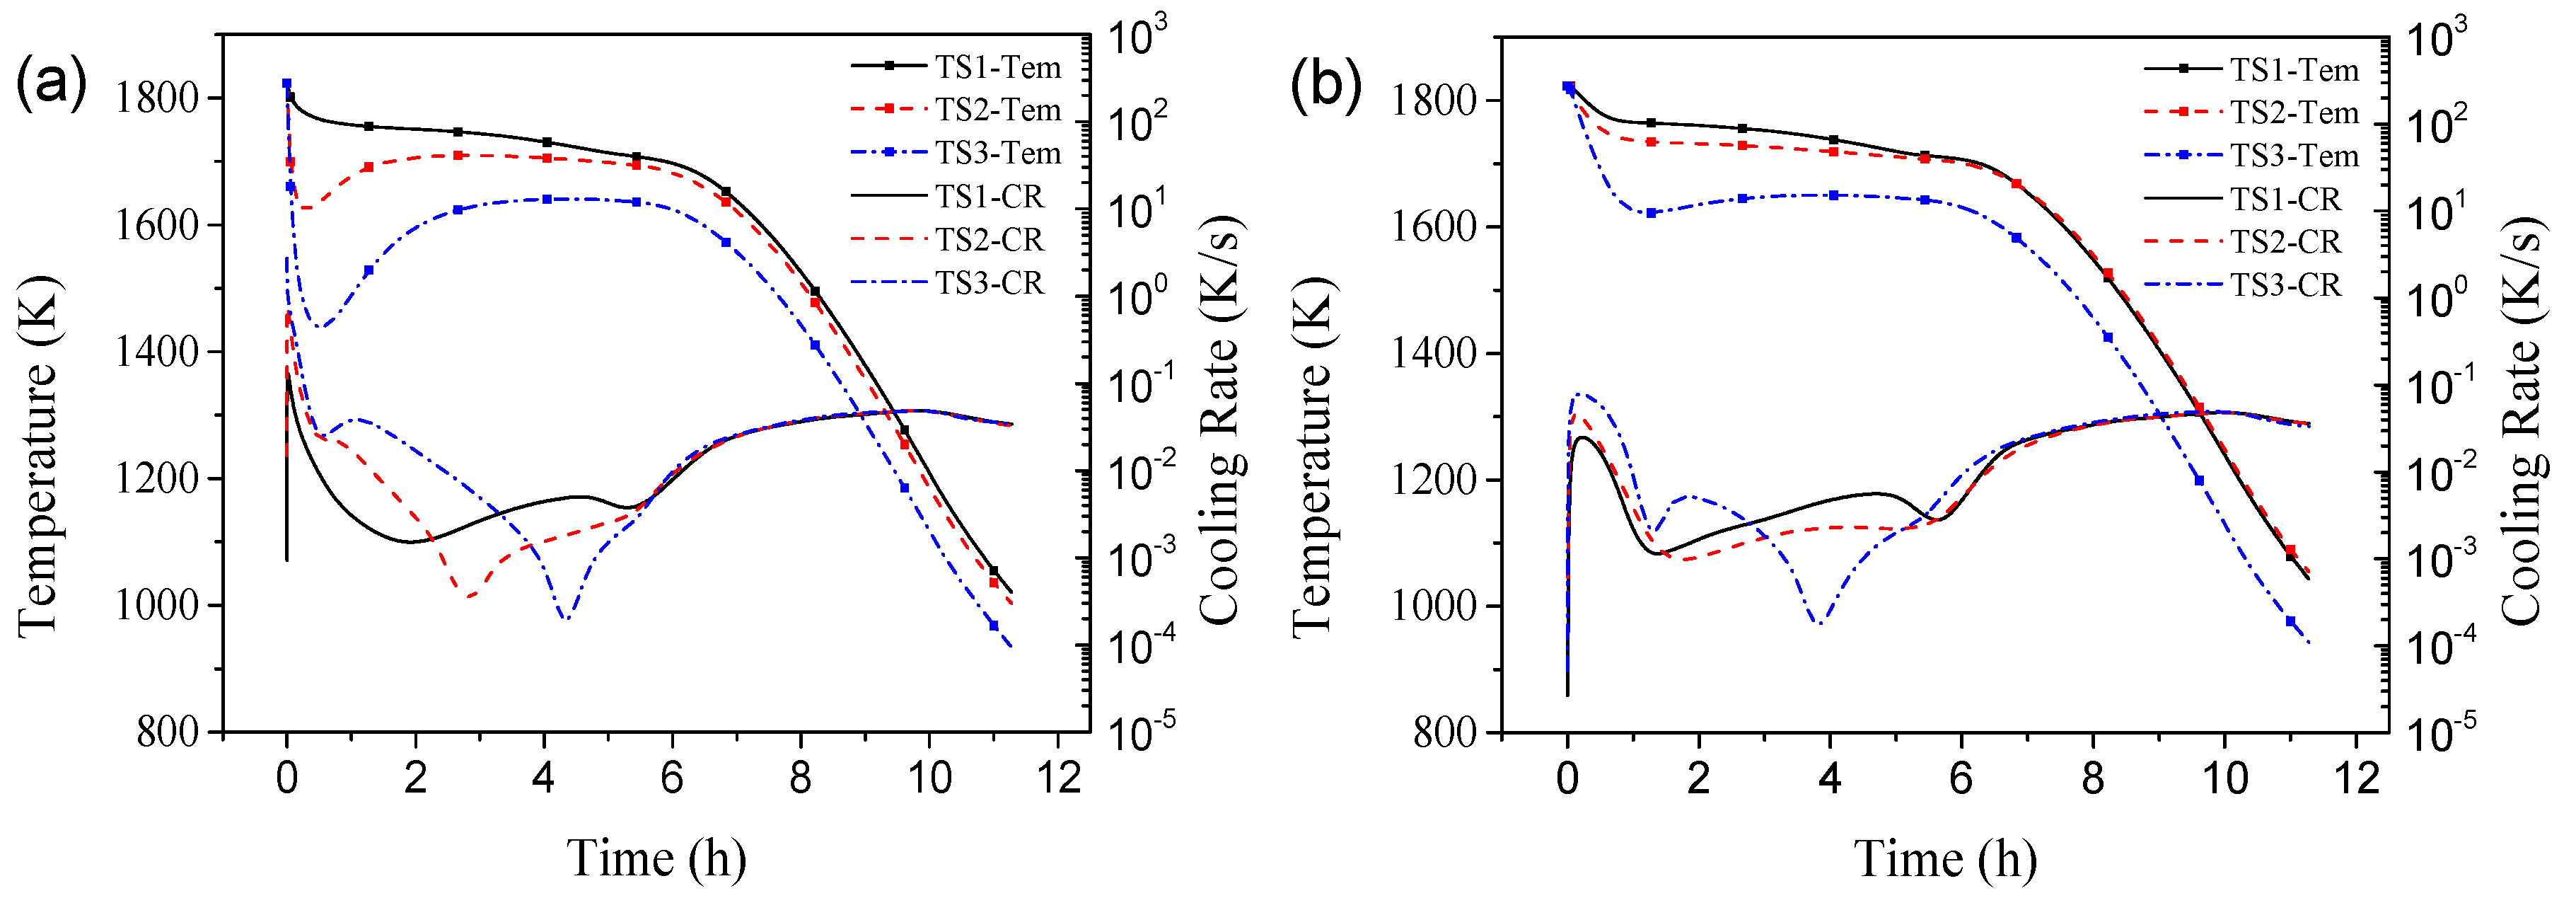
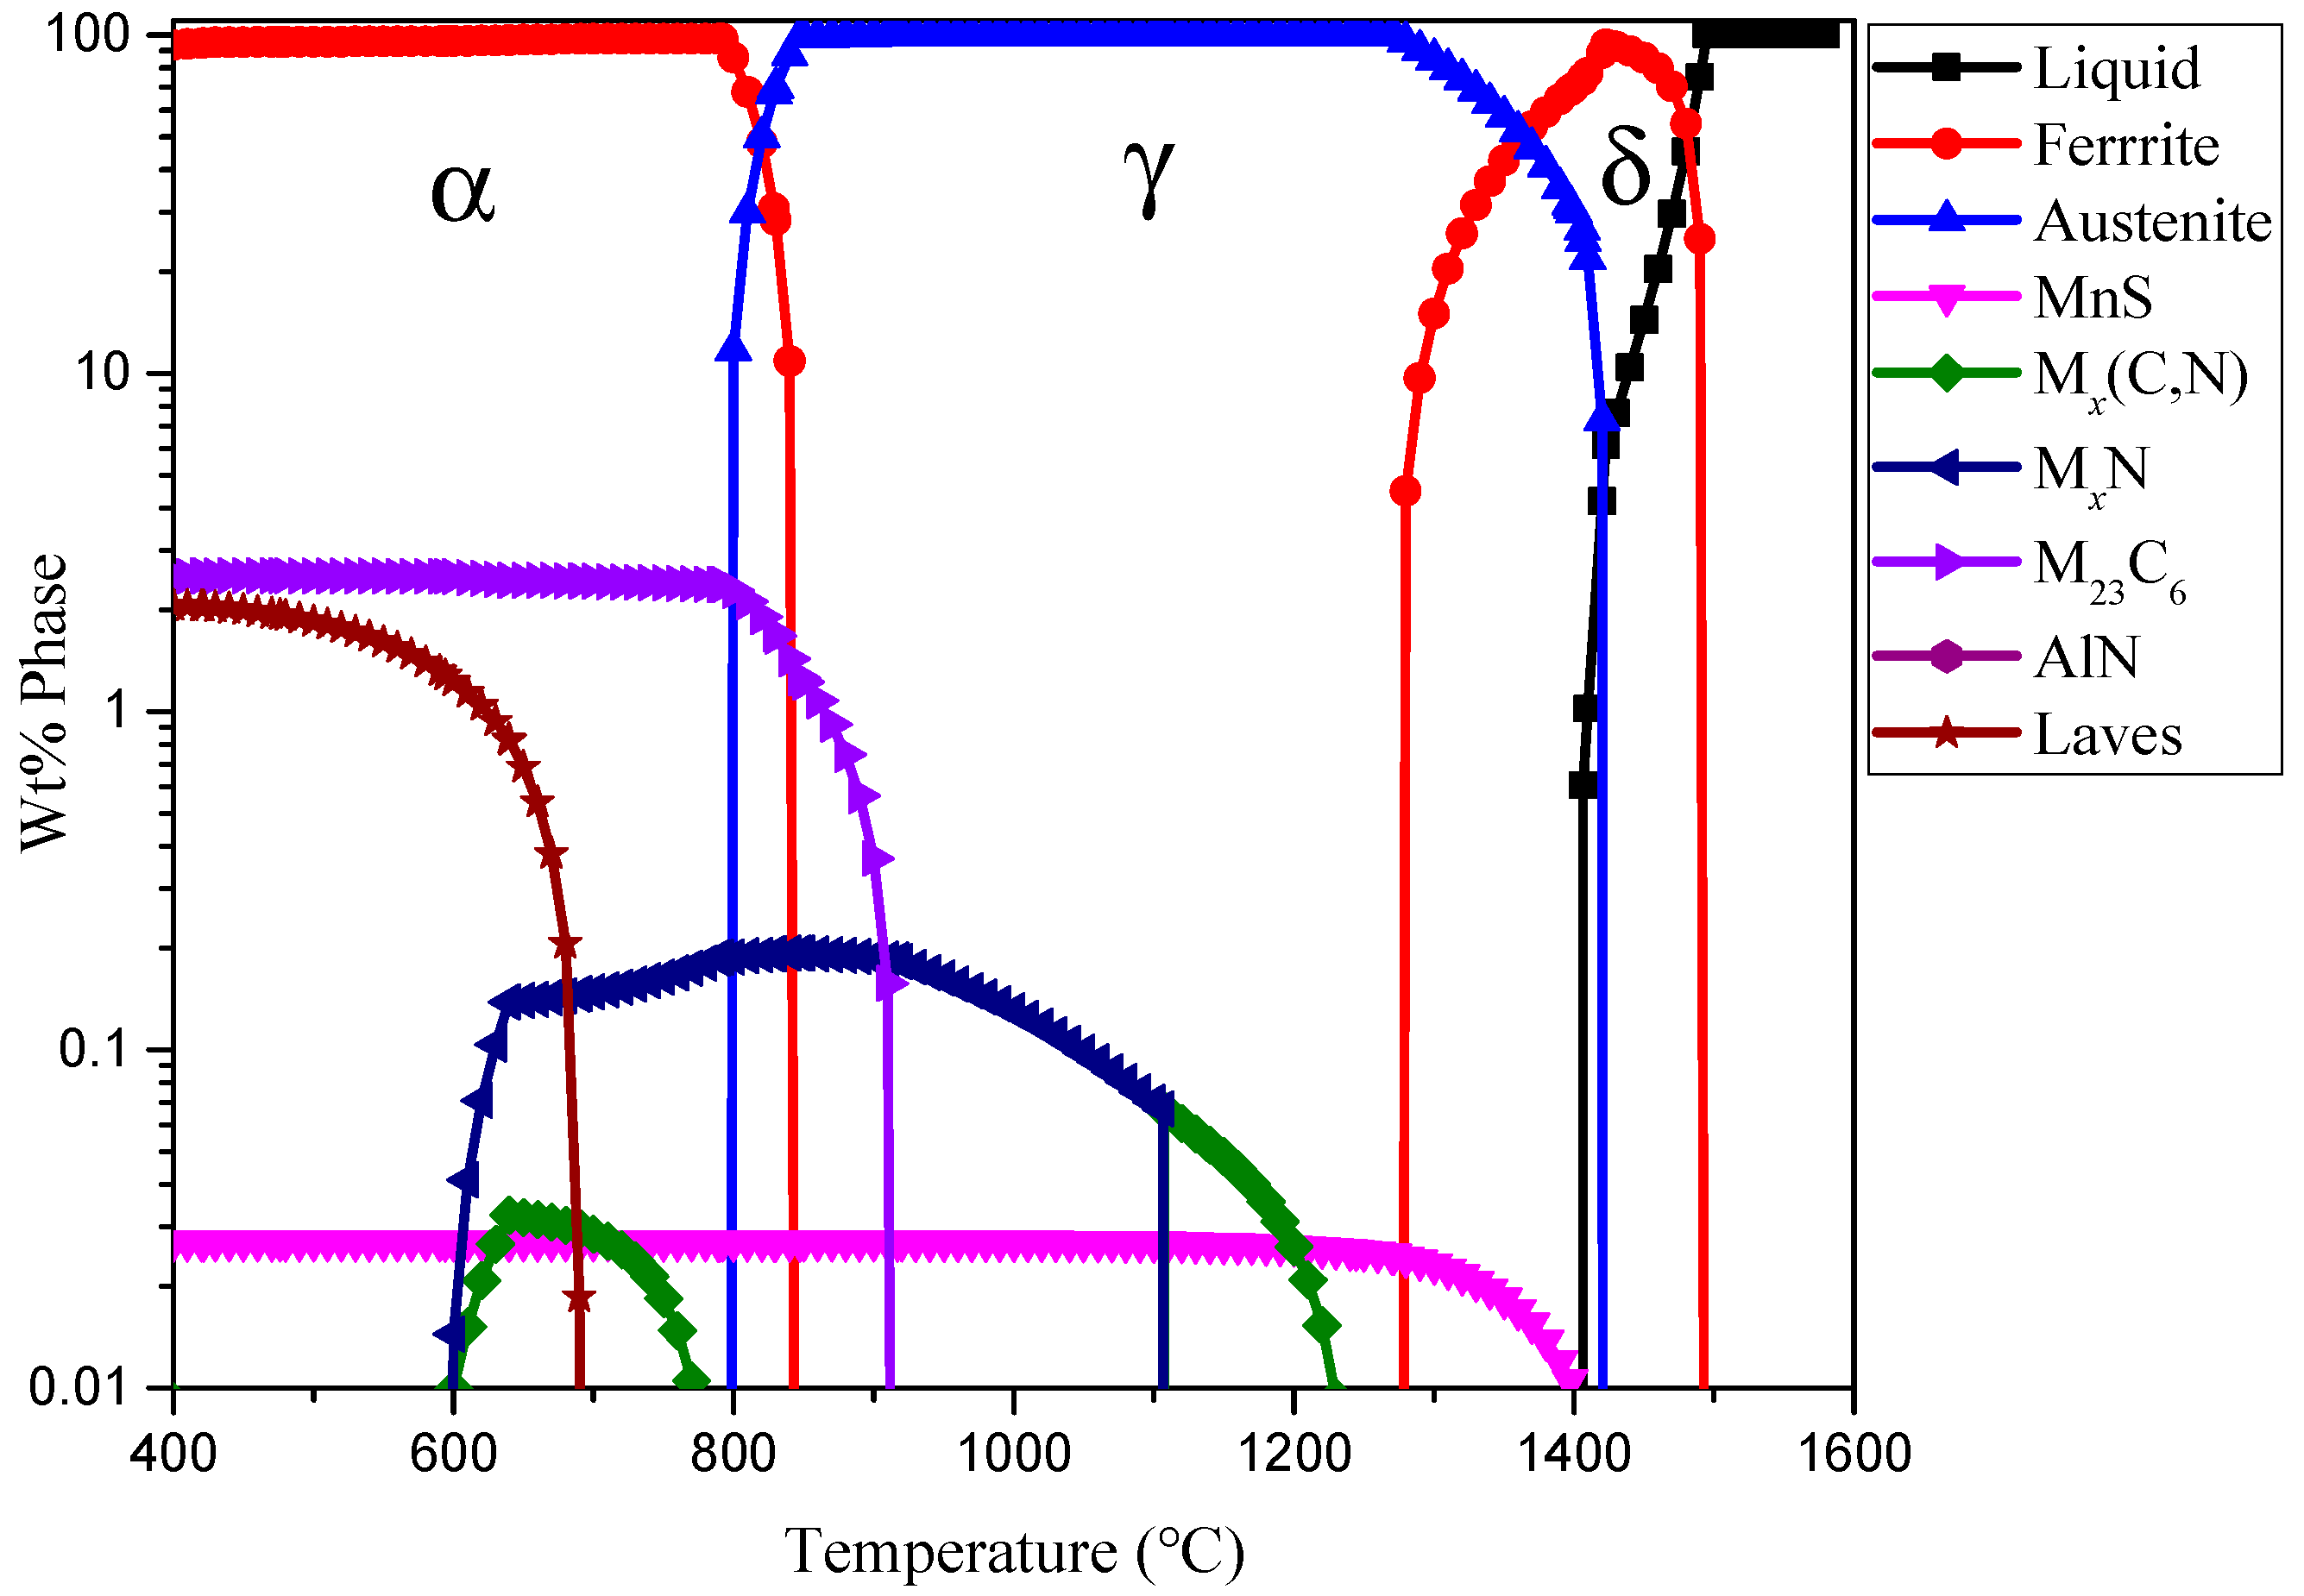
3.1. Numerical Simulation

Figure 5 shows the evolution of the temperature and cooling rate with time in three typical parts (TS1, TS2, and TS3) at the position 20 mm (i.e., the cold side) and 100 mm (i.e., the hot side) away from the surface, respectively. In the initial solidification stage, TS1 showed a low cooling rate with a maximum value of 0.14 K/s. This was because this part was cooled by a sand mold. TS2 was cooled by small chills, and the maximum cooling rate reached 0.63 K/s, about 4.5 times than TS1. For the TS3 cooled by big chills, the maximum cooling rate reached 2.72 K/s. Around 0.5 h after pouring, a temperature plateau, i.e., cooling rate of around 0 K/s, was observed for all the three samples at the position 20 mm away from the surface, due to the balance between the release of latent heat from the solidification of liquid steel and the heat dissipation by conduction. According to Figure 5b, the cooling rate of the hot side of TS samples was much smaller than that of the cold side. The cooling rate of the cold side and hot side gradually increased after 6 h. This was due to the fact that the solidification was essentially completed, and the release of latent heat was very little. Moreover, the heat dissipation changed from the unidirectional to the bidirectional mode. After 10h, the temperature difference between the casting and the sand mode decreased gradually, leading to a decrease of the cooling rate.

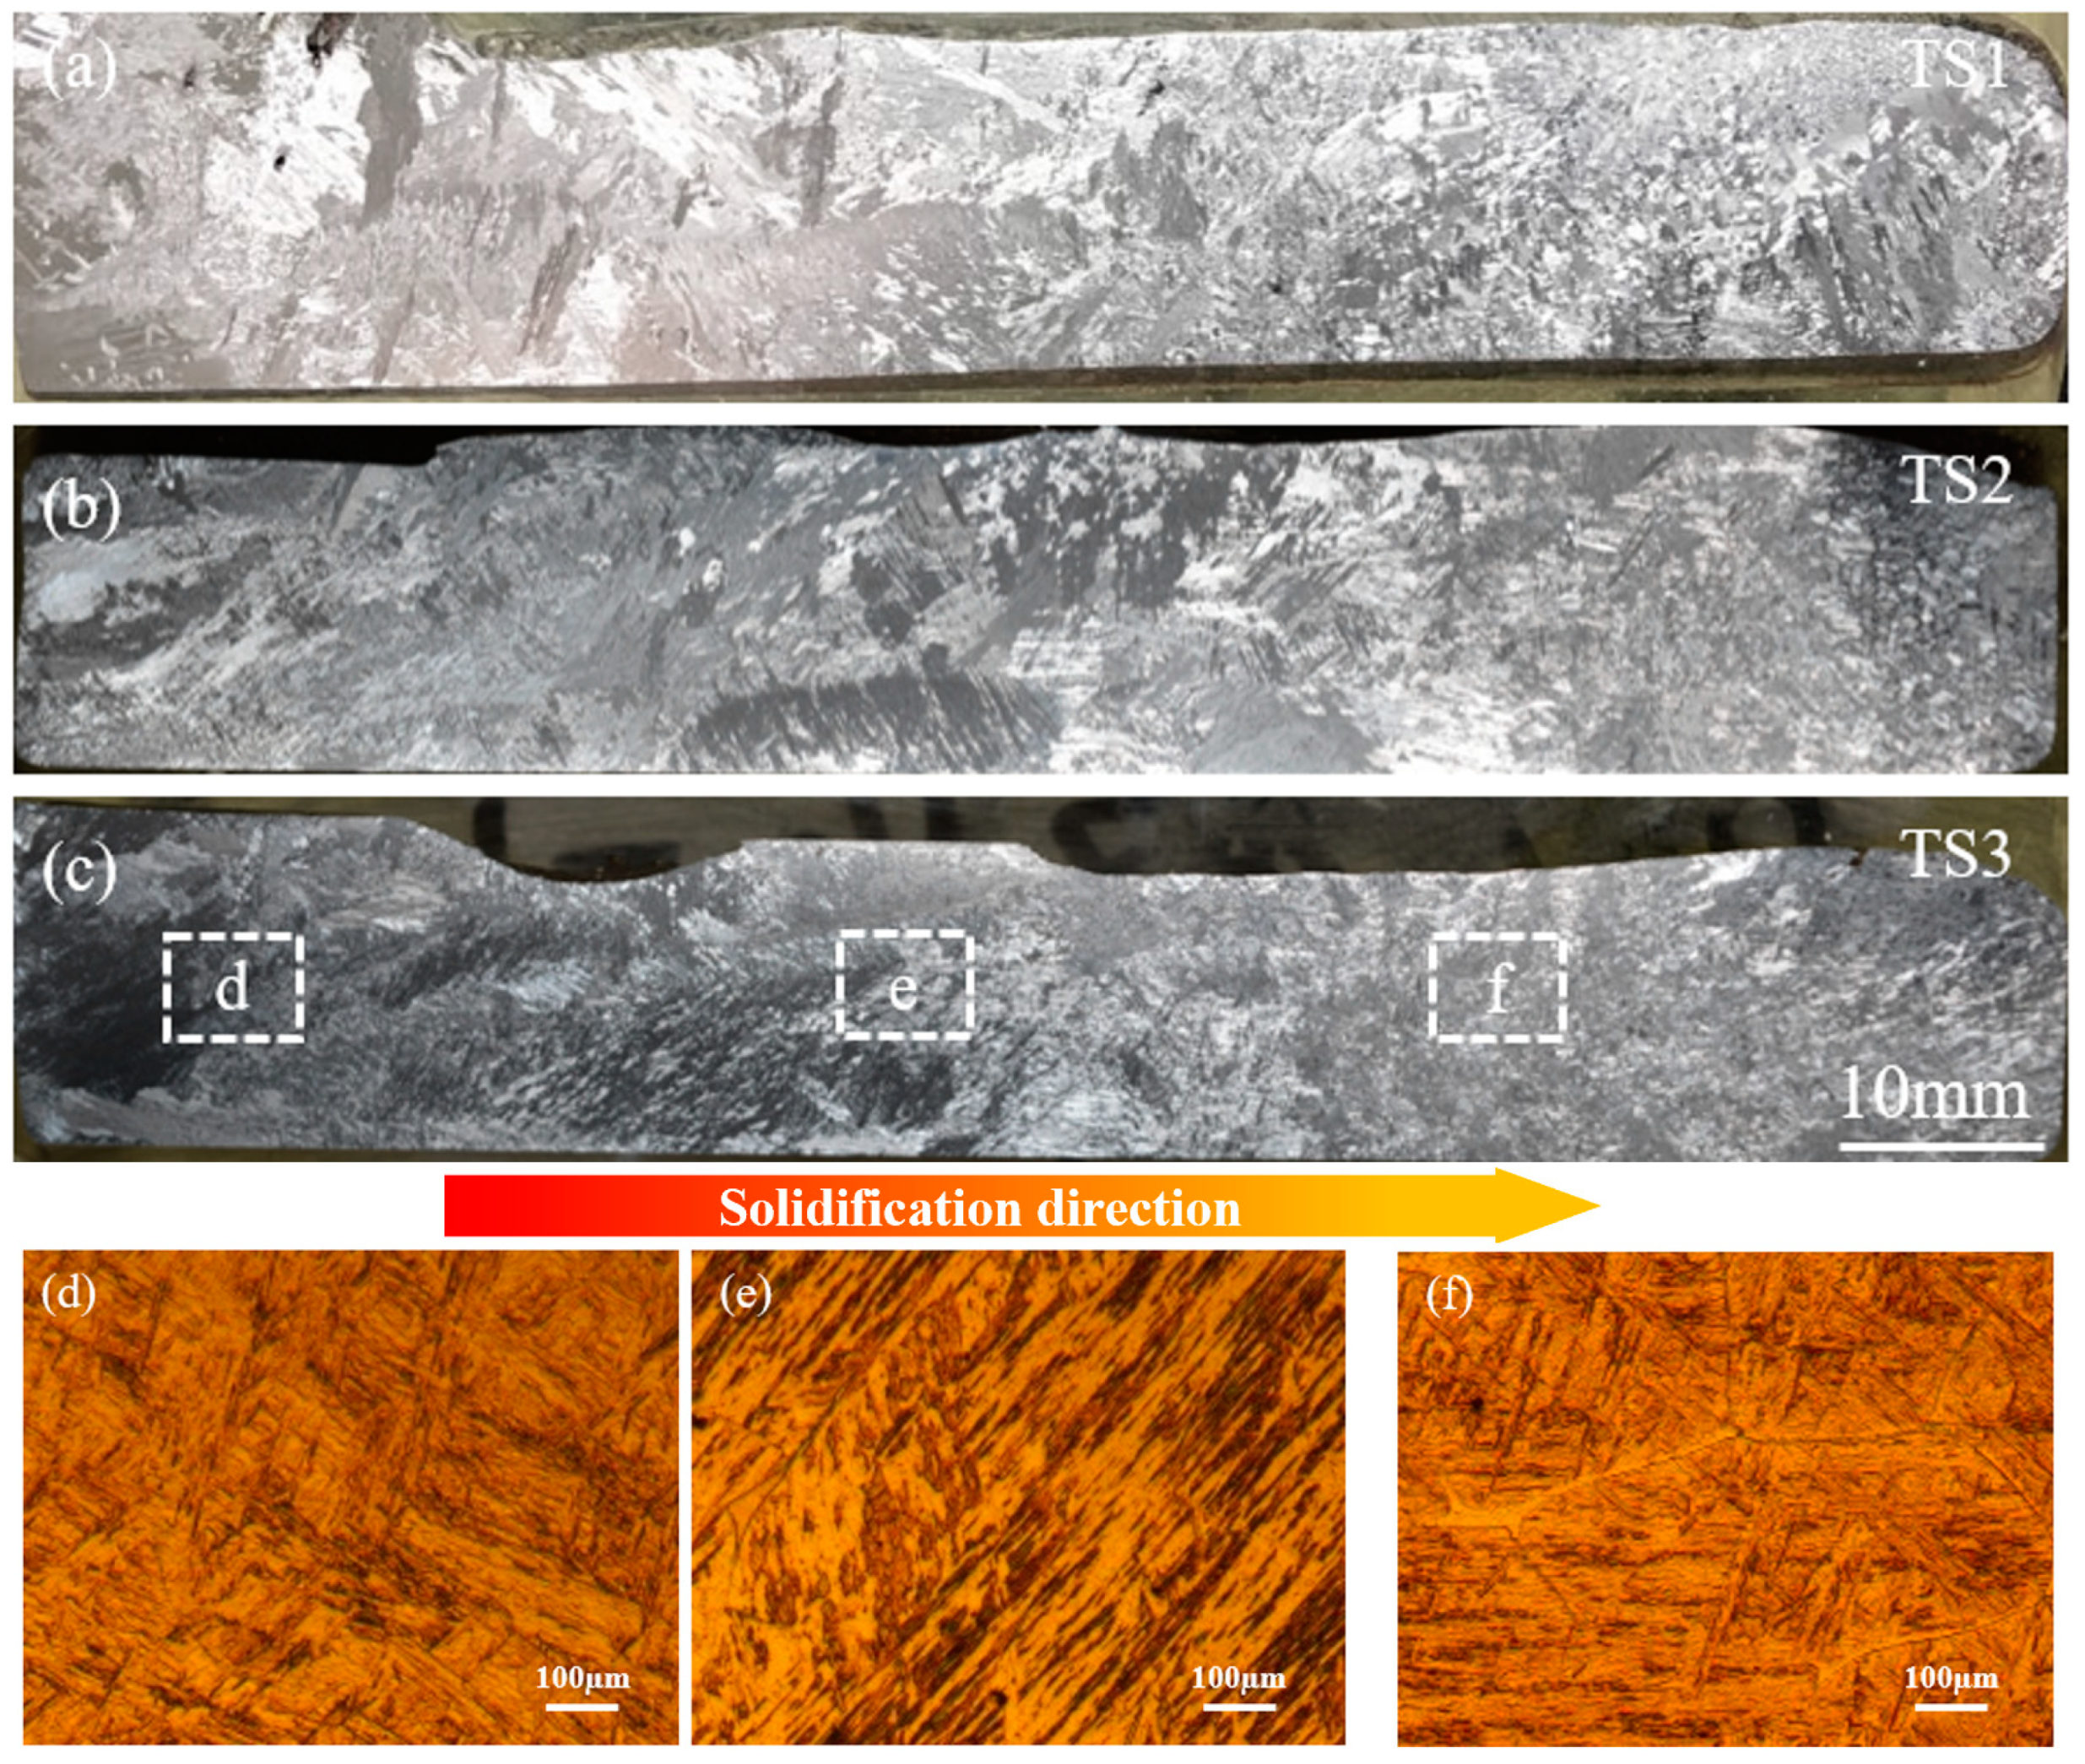
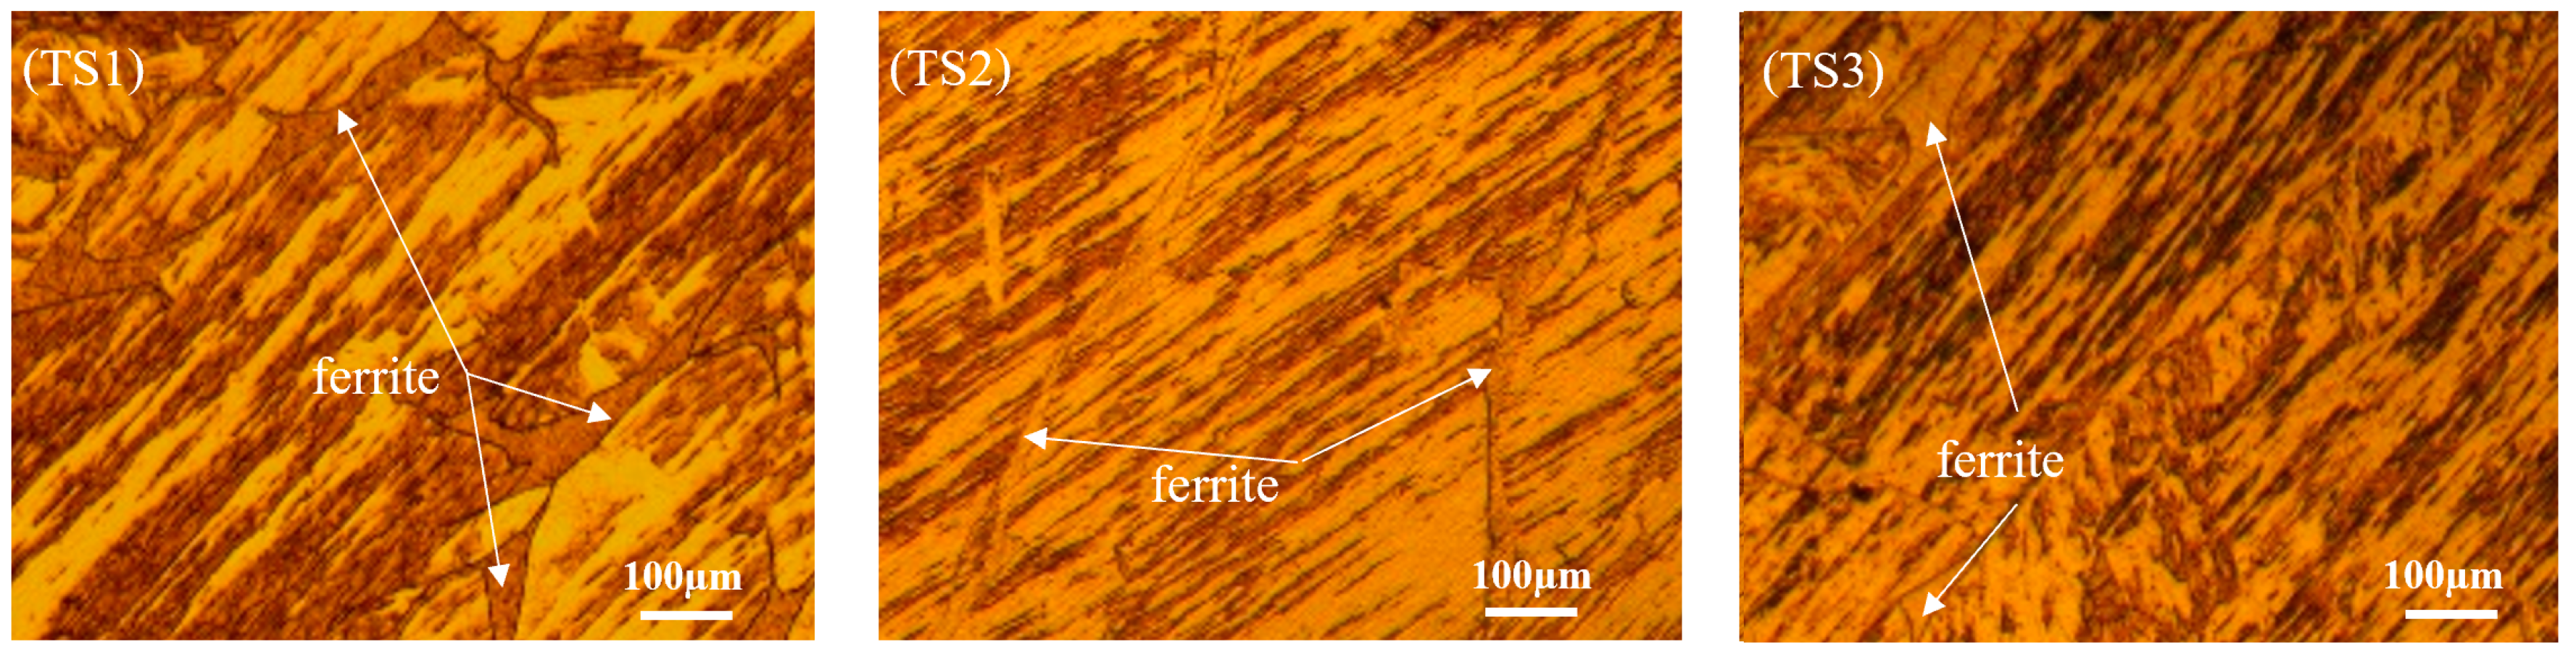
3.2. Solidification Structure

The optical microstructure shown in Figure 6 indicates the formation of a martensite phase in the TS1, TS2, and TS3 samples. The martensite phase showed different morphology at different positions of samples. For instance, at the center of the TS3 sample (Figure 6e), the martensite phase showed a preferential orientation, while random orientation was observed at the surface and at the end of the TS3 sample. The morphology of the martensite phase was inherited from the primary austenite phase. At the center of the sample, the primary austenite phase grew along the direction of the temperature gradient, leading to the preferred orientation of martensite after phase transformation during cooling.
Figure 7 shows the microstructure of the TS samples at the position 50 mm away from the surface. The microstructure was composed of a large fraction of lath martensite and a small amount of ferrite, similar to the results reported previously by Zhang et al. [24]. The martensite laths were grouped and connected in parallel, which is a distinctive feature of lath martensite.
Figure 8 shows the evolution of the phase fraction of the CB2 FHRS with respect to temperature. The abscissa represents temperature and the ordinate (logarithmic scale) represents weight of different phases. The equilibrium phases of the FHRS below 400 °C were α ferrite, Laves, MnS, and M23C6. Additionally, the high content of Cr acted as the δ-Fe phase stabilizer. As a result, it extended the temperature range of the δ-Fe phase. The CB2 FHRS transformed first from a liquid phase to δ-Fe at a high temperature. With decreasing temperature, δ-Fe started to transform into an austenite (i.e., γ-Fe). Due to the enrichment of the solute and the higher diffusion rate at the grain boundaries, the austenite nucleated at the grain boundaries of δ-Fe and grew rapidly. While the δ-Fe, which did not convert to austenite, remained at the austenite grain boundary, as shown in Figure 7. The martensite phase started to form at 429.8 °C, i.e., the typical martensite transformation start temperature. In addition, the cooling rate also affected the start temperature and end temperature for martensite transformation and will ultimately affect martensite morphology. However, the cooling rate of heavy casting is very slow, which might weaken this effect.

3.3. Segregation and Properties

Figure 9 shows that hardness increased gradually from the cold side to the hot side for all three TS samples. On the hot side, the hardness was nearly twice that of the cold side. Figure 9 also shows that TS3 had a more uniform distribution of hardness at different positions, as compared with the samples TS1 and TS2.
Figure 10 shows the distribution of Cr, Mo, Mn, and B solutes in the three TS samples. The martensite morphology and transformation temperature depended highly on chemical composition [25], because the chemical composition determined the lattice structure, specific volume, strength of the austenite phase and the martensite phase, as well as the driving force of phase transformation. Figure 10 shows that the enrichment of solutes occurred mainly at the solidification end (i.e., the hot side). No obvious solute macro-segregation was observed in the cold side and the middle part of the samples. Because, when the growth rate of dendrites was very fast, the solute in the solid phase and the liquid phase could not be fully diffused, and the solute migration at the solidification interface also deviated from equilibrium [26]. The phenomenon of element negative segregation was observed in the middle part of the samples, as shown in Figure 10, probably due to the drift of chill crystals to these locations. A higher Cr, Mo, Mn, and B content was observed at the solidification end, due to the enrichment of solutes in interdendritic liquid during solidification. Among all the solutes, B showed a much stronger macro-segregation tendency, as shown in Figure 10. The macro-segregation also led to the variation of the hardness at different positions of TS samples, as shown in Figure 9.
Figure 11 shows the macro-segregation index ( i m a c r . ) of the main solutes for three TS samples. The result was calculated based on the chemical composition characterized by LIBS through the following equation, similar to the equation proposed by Wolczynski [18]:
i m a c r .   = ( N m a x B N m i n B ) / N 0
where, N m a x B , N m i n B are the maximum/minimum solute content in a sample, respectively, and N 0 —is the nominal solute content in this sample.
The results indicate that C, P, and S were the solutes prone to macro-segregation. Boron showed a high macro-segregation index of 15 in the TS1 sample. The enrichment of boron led to the formation of large precipitates at the solidification end, as indicated by the Electron Probe Micro-analyzer (EMPA) results in Figure 12. The Cr, Mo, Si, V and Mn solutes showed a low i m a c r . value, indicating that they have a low macro-segregation tendency. The solute enrichment depended highly on the cooling rate and temperature gradient, resulting in different solute enrichment at different locations of the casting. The materials near the large chills underwent a rapid cooling, leading to the formation of fine dendrites structures. The dendrites intersected with each other, inhibiting the migration of the enriched solute in the interdendritic region to the solidification end. Moreover, the drift of chill crystals into the liquid phase also reduced the solute enrichment. Therefore, the enrichment of elements at the solidification end (i.e., in sample TS3) with large chills was small. The main body of the heavy casting was surrounded by the sand mold, which gave rise to a low cooling rate during solidification, leading to the formation of coarse dendrite structures. As a result, the solutes migrated easily from the interdendritic region and gradually enriched the solidification end. Moreover, the number of chill crystals was small, due to the weak chilling effect of the sand mold. Therefore, more severe macro-segregation was observed at the solidification ends of TS1, as compared with the samples TS2 and TS3.
Figure 12 shows the composition distribution at the grain boundary at the solidification end of TS1. Table 2 is the result of point analyses by electron microprobe. Large MnS inclusion was detected, due to the beneficiation of S and Mn at the solidification end. The presence of MnS inclusions significantly undermined the mechanical properties, as the inclusions acted as the origin of pitting corrosion and hydrogen embrittlement. Moreover, a large number of NbxC precipitates was observed at the grain boundary. The large lattice mismatch between NbxC precipitates and the steel matrix led to the generation of dislocations, which could release the strain accumulation at the grain boundaries [27]. The solute Nb atoms gave rise to a strong solute drag effect, preventing grain boundary migration and inhibiting the grain growth [28,29], leading to the refinement of austenite grains. The fine grains resulted in an improvement in hardness at the center of the TS samples, as shown in Figure 9. The solute boron could significantly increase the hardness and the hardenability of steels [30,31]. These large precipitates acted as the nucleation sites of microcracks and accelerated the propagation of cracks, which significantly undermined the mechanical performance of the castings.

4. Conclusions

In this work, the heat transfer characteristics, solidification microstructure, and macro-segregation of different characteristic solidification units in a heavy CB2 FHRS casting were studied by numerical simulation and experimental thermal simulation method. The main conclusions are as follows:
(1)
The presence of chills and their size significantly influenced the cooling rate and temperature gradient of castings during solidification. In the parts near the large chills, the cooling rate could reach 2.72 K/s at the position 20 mm away from the surface. The parts near the small chills showed a low cooling rate of 0.63 K/s. The cooling rate of parts near the sand mold could only reach 0.14 K/s.
(2)
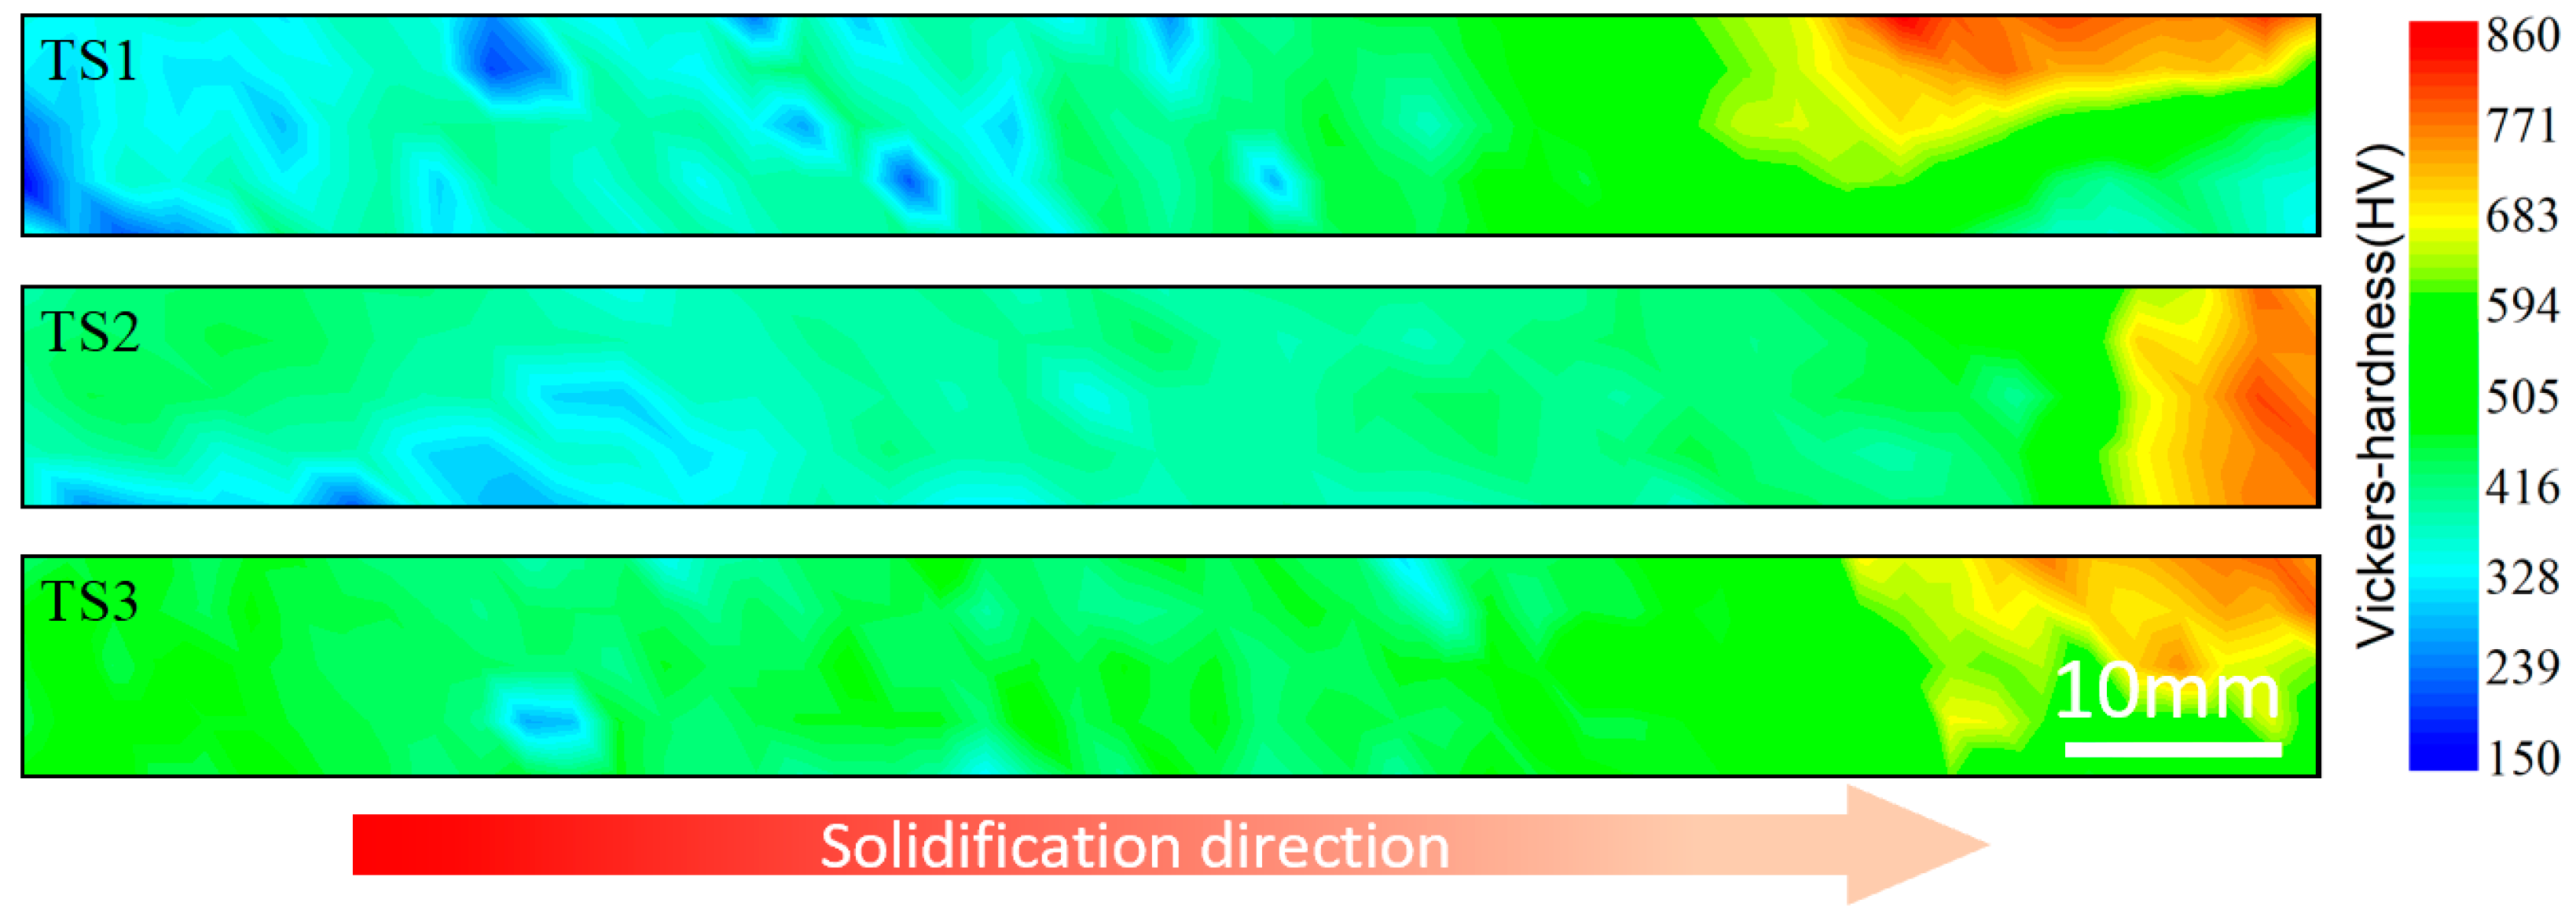
The hardness of the CB2 heavy FHRS casting gradually increased from surface to center. The hardness at the center was close to twice that of the value at the surface. The hardness varied remarkably at different parts of the casting, due to the difference in macro-segregation, which depends highly on cooling rate. The parts near the chills had a high cooling rate, which suppressed the macro-segregation of the solutes, leading to a more homogeneous distribution of hardness.
(3)
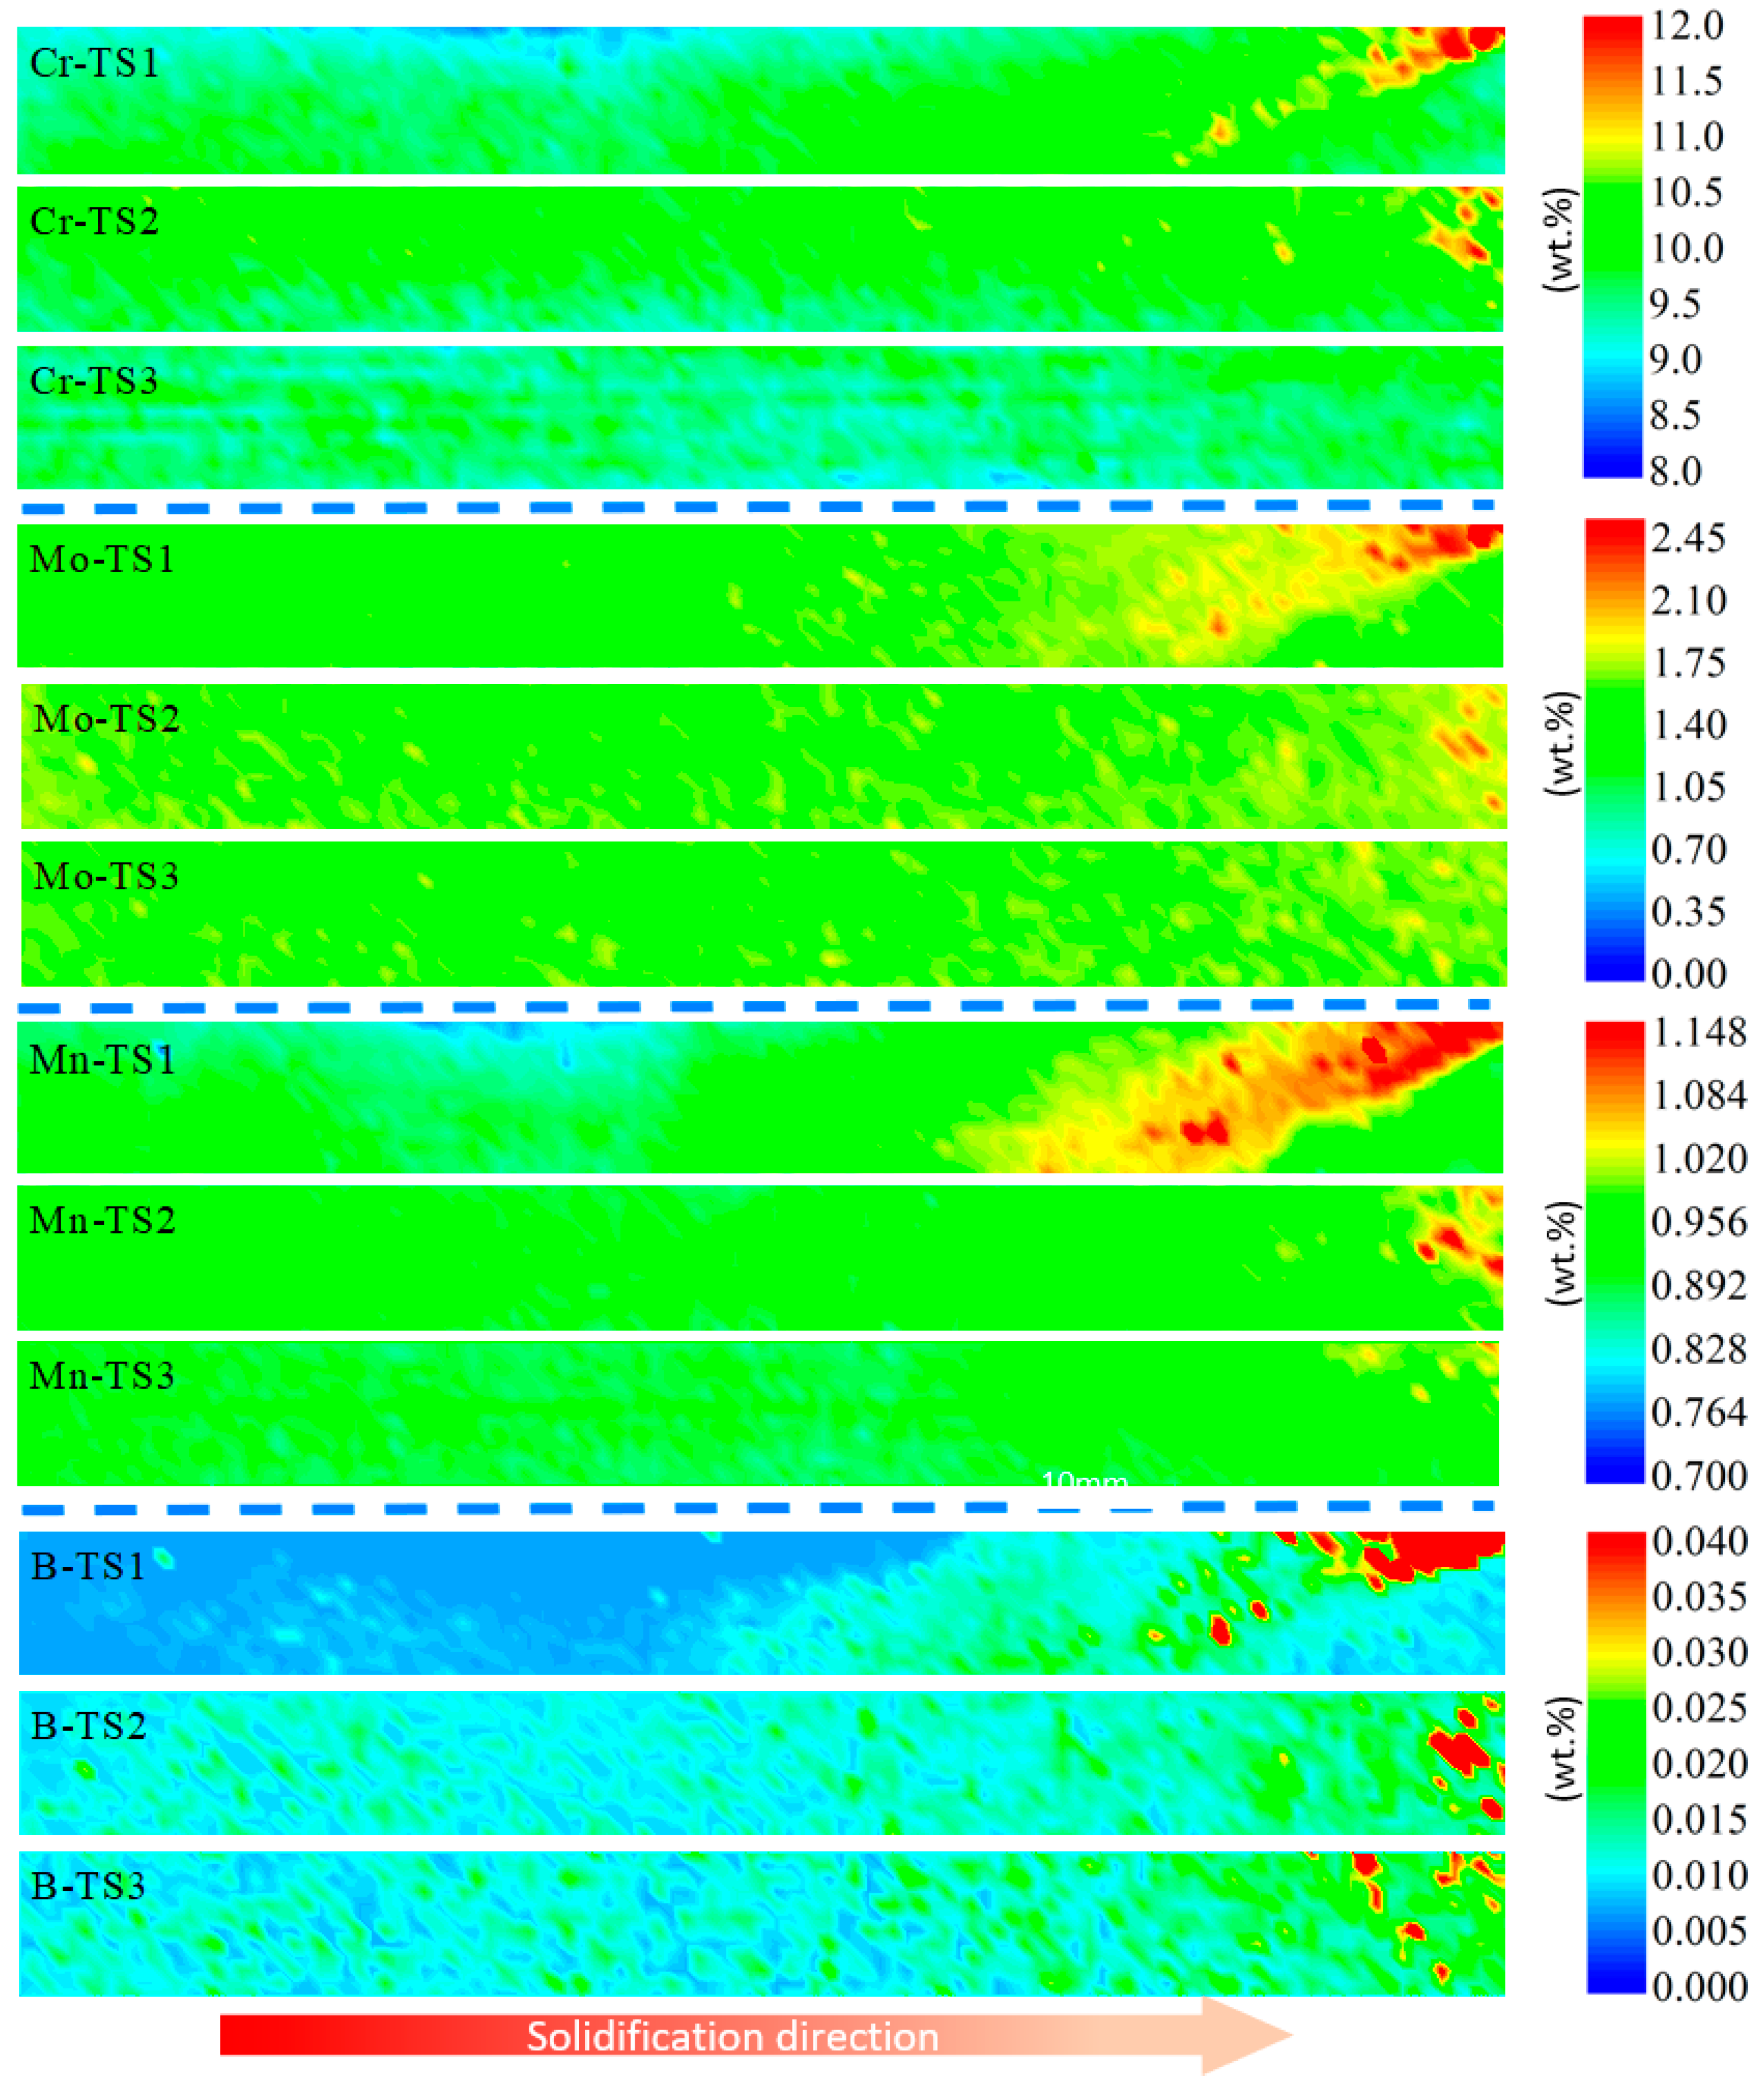
The base of the heavy CB2 FHRS casting had a low cooling rate and small temperature gradient, which helped with solute enrichment, leading to severe macro-segregation at the solidification end. The cooling rate of positions near chills was high, resulting in the formation of fine dendrites. The dendrites intersected with each other to inhibit the migration of the enriched solutes. As a result, the composition distributions are homogeneous at these positions.
(4)
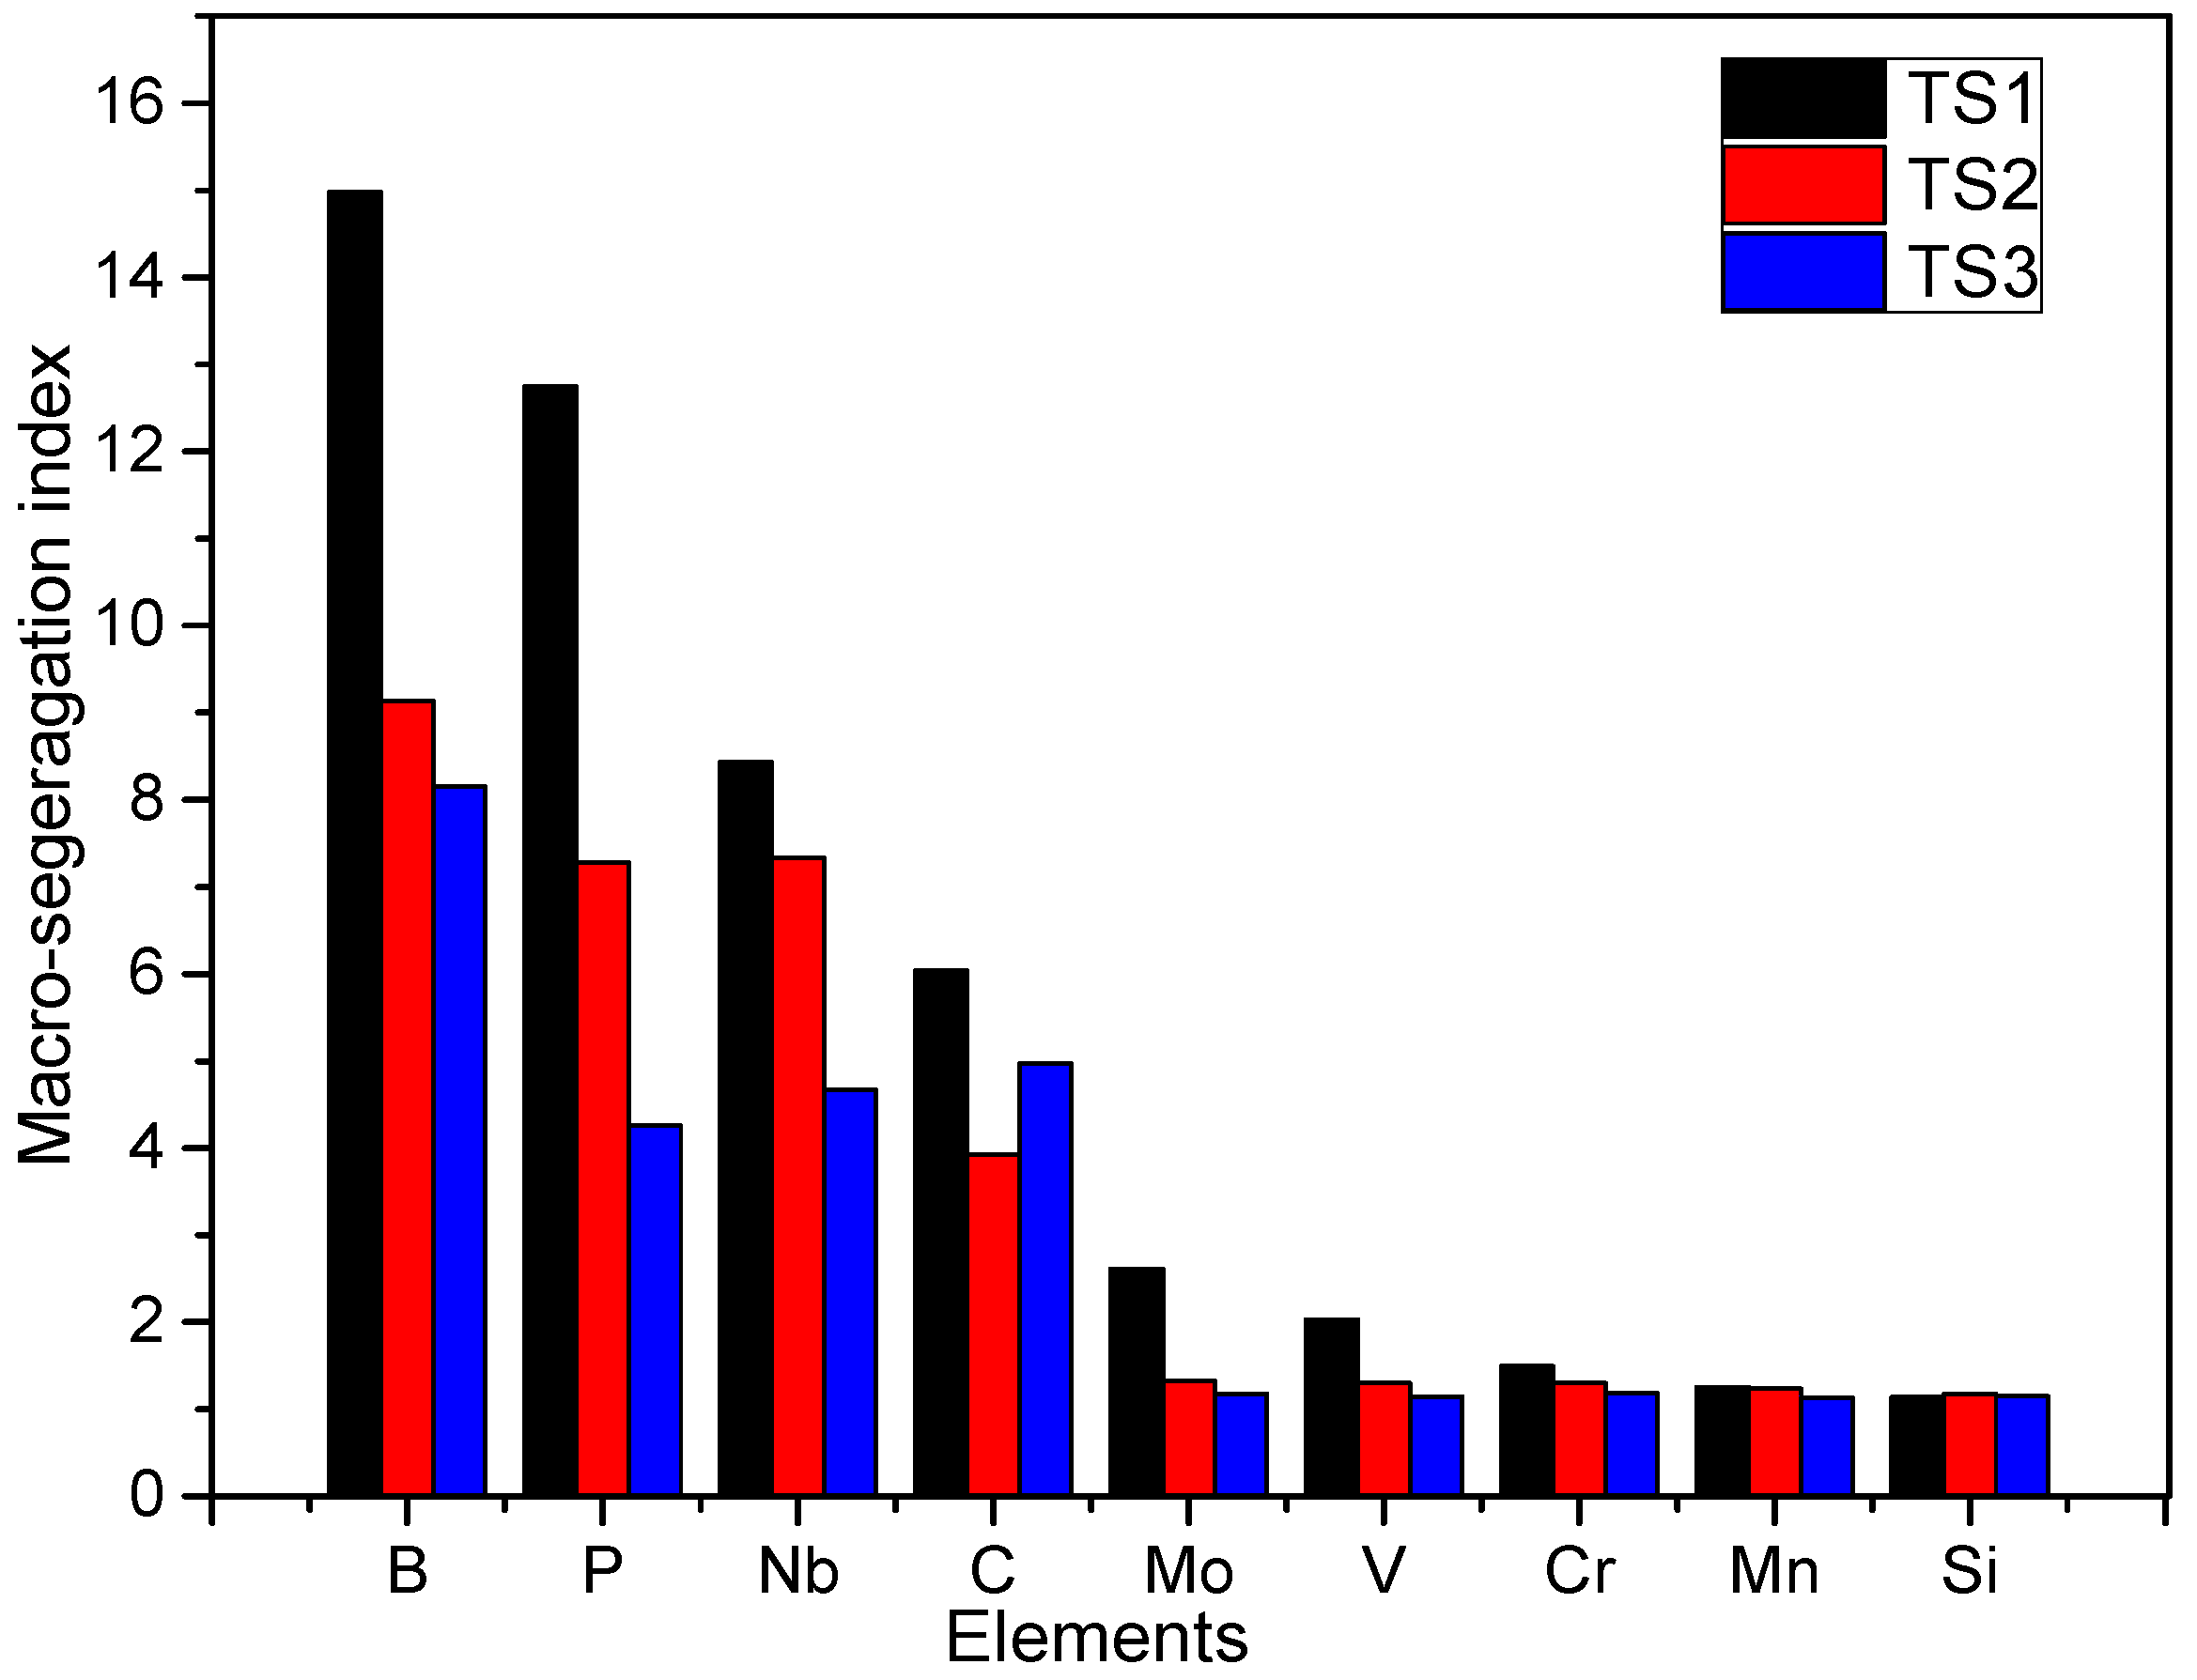
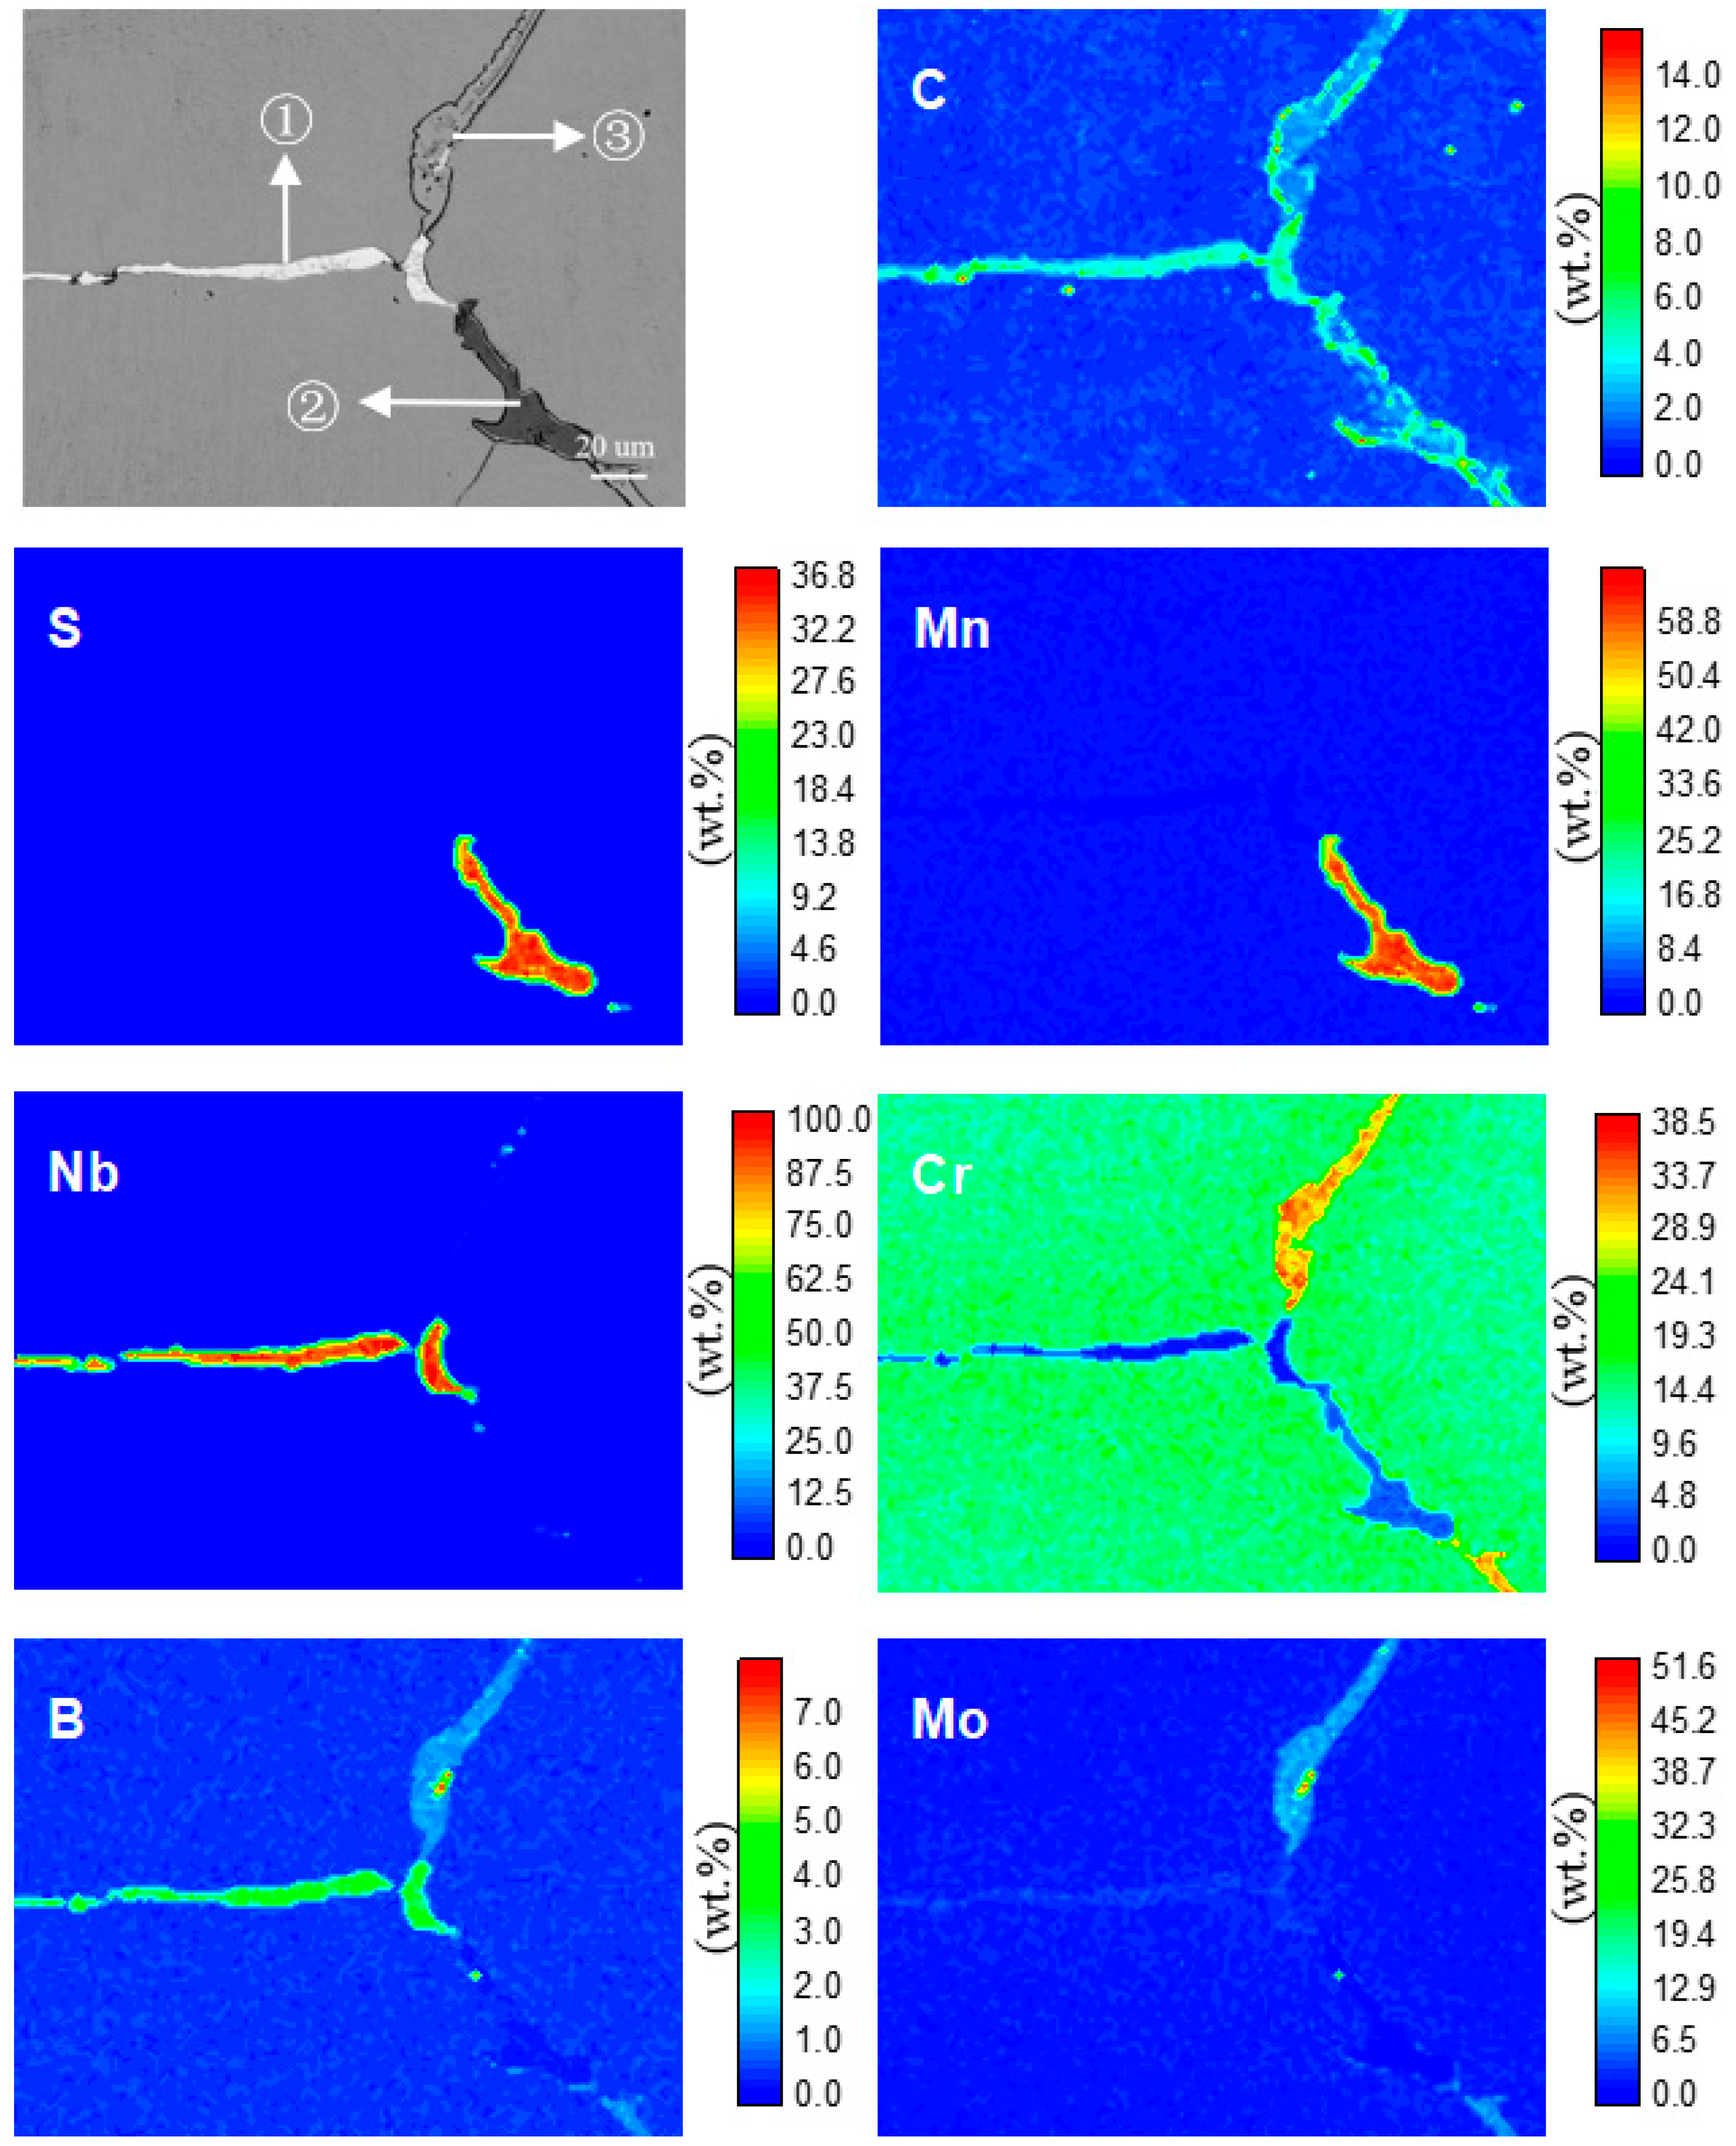
Solute macro-segregation was severe in the center of the heavy CB2 FHRS casting. The solutes located at the grain boundaries, resulting in the formation of large MnS, NbxC precipitates. The precipitates significantly improved the hardness of FHRS, but they also served as the initiation of cracks, which undermined the toughness and tensile strength of FHRS.

Author Contributions

H.Z. and Q.Z. conceived and designed the study. H.Z., B.W., and X.L. performed the experiments and simulations. H.Z., X.L., B.W., X.W., T.W., Q.L., and Q.Z. analyzed and discussed the data. All authors contributed equally in writing the paper.

Funding

This work was financially supported by the National Key Research and Development Program of China (Grant No.2017YFB0701802), the National Natural Science Foundation of China (Grant No.51504148 and 51227803).

Acknowledgments

The authors wish to thank Ke Han for the support of this study at National High Magnetic Field Laboratory in USA.

Conflicts of Interest

The authors declare no conflict of interest.

Abbreviations

The following abbreviations are used in this manuscript:
FHRSFerritic heat-resistant steel
TSThermal simulated
LIBSLaser-induced breakdown spectroscope
EMPAElectron Probe Micro-analyzer

References

  1. Zhu, C.Z.; Yuan, Y.; Zhang, P.; Yang, Z.; Zhou, Y.L.; Huang, J.Y.; Yin, H.F.; Dang, Y.Y.; Zhao, X.B.; Lu, J.T.; et al. A Modified HR3C Austenitic Heat-Resistant Steel for Ultra-supercritical Power Plants Applications Beyond 650 A degrees C. Metall. Mater. Trans. A 2018, 49a, 434–438. [Google Scholar] [CrossRef]
  2. Xu, L.; Yuan, J.Q.; Wang, J.C. Dynamic modeling and solution algorithm of the evaporation system for the ultra-supercritical power plant. Int. J. Heat Mass Transfer 2017, 105, 589–596. [Google Scholar] [CrossRef]
  3. Baumgartner, S.; Pahr, H.; Zauchner, T. Investigation on a creep-tested CB2 steel cross-weld sample welded with a matching flux-cored wire. Weld World 2018, 62, 811–817. [Google Scholar] [CrossRef]
  4. Hu, P.; Yan, W.; Sha, W.; Wang, W.; Guo, Z.L.; Shan, Y.Y.; Yang, K. Study on Laves phase in an advanced heat-resistant steel. Front. Mater. Sci. Chin. 2009, 3, 434–441. [Google Scholar] [CrossRef]
  5. Eggeler, G.; Dlouhy, A. Boron segregation and creep in ultra-fine grained tempered martensite ferritic steels. Z Metallkd 2005, 96, 743–748. [Google Scholar] [CrossRef]
  6. Zhou, X.S.; Liu, C.X.; Yu, L.M.; Liu, Y.C.; Li, H.J. Phase Transformation Behavior and Microstructural Control of High-Cr Martensitic/Ferritic Heat-resistant Steels for Power and Nuclear Plants: A Review. J. Mater. Sci. Technol. 2015, 31, 235–242. [Google Scholar] [CrossRef]
  7. Li, Y.M.; Liu, Y.C.; Liu, C.X.; Li, C.; Huang, Y.; Li, H.J.; Li, W.Y. Carbide dissolution and precipitation in cold-rolled type 347H austenitic heat-resistant steel. Mater. Lett. 2017, 189, 70–73. [Google Scholar] [CrossRef]
  8. Ji, H.C.; Liu, J.P.; Wang, B.Y.; Tang, X.F.; Lin, J.G.; Huo, Y.M. Microstructure evolution and constitutive equations for the high-temperature deformation of 5Cr21Mn9Ni4N heat-resistant steel. J. Alloys Compd. 2017, 693, 674–687. [Google Scholar] [CrossRef]
  9. Kim, M.Y.; Hong, S.M.; Lee, K.H.; Jung, W.S.; Lee, Y.S.; Lee, Y.K.; Shim, J.H. Mechanism for Z-phase formation in 11CrMoVNbN martensitic heat-resistant steel. Mater. Charact. 2017, 129, 40–45. [Google Scholar] [CrossRef]
  10. Li, D.Z.; Chen, X.Q.; Fu, P.X.; Ma, X.P.; Liu, H.W.; Chen, Y.; Cao, Y.F.; Luan, Y.K.; Li, Y.Y. Inclusion flotation-driven channel segregation in solidifying steels. Nat. Commun. 2014, 5, 5572. [Google Scholar] [CrossRef]
  11. Zhu, H.C.; Jiang, Z.H.; Li, H.B.; Feng, H.; Zhang, S.C.; Liu, G.H.; Zhu, J.H.; Wang, P.B.; Zhang, B.B.; Fan, G.W.; et al. Effects of Nitrogen Segregation and Solubility on the Formation of Nitrogen Gas Pores in 21.5Cr-1.5Ni Duplex Stainless Steel. Metall. Mater. Trans. B 2017, 48, 2493–2503. [Google Scholar] [CrossRef]
  12. Ge, H.H.; Ren, F.L.; Li, J.; Han, X.J.; Xia, M.X.; Li, J.G. Four-Phase Dendritic Model for the Prediction of Macrosegregation, Shrinkage Cavity, and Porosity in a 55-Ton Ingot. Metall. Mater. Trans. A 2017, 48a, 1139–1150. [Google Scholar] [CrossRef]
  13. Liang, G.; Shi, C.; Zhou, Y.J.; Mao, D.H. Numerical Simulation and Experimental Study of an Ultrasonic Waveguide for Ultrasonic Casting of 35CrMo Steel. J. Iron. Steel Res. Int. 2016, 23, 772–777. [Google Scholar] [CrossRef]
  14. Koshikawa, T.; Bellet, M.; Gandin, C.A.; Yamamura, H.; Bobadilla, M. Study of Hot Tearing During Steel Solidification Through Ingot Punching Test and Its Numerical Simulation. Metall. Mater. Trans. A 2016, 47a, 4053–4067. [Google Scholar] [CrossRef]
  15. Delzant, P.O.; Baque, B.; Chapelle, P.; Jardy, A. On the Modeling of Thermal Radiation at the Top Surface of a Vacuum Arc Remelting Ingot. Metall. Mater. Trans. B 2018, 49, 958–968. [Google Scholar] [CrossRef]
  16. Zhong, H.G.; Chen, X.R.; Han, Q.Y.; Han, K.; Zhai, Q.J. A Thermal Simulation Method for Solidification Process of Steel Slab in Continuous Casting. Metall. Mater. Trans. B 2016, 47, 2963–2970. [Google Scholar] [CrossRef]
  17. Bai, L.; Wang, B.; Zhong, H.G.; Ni, J.; Zhai, Q.J.; Zhang, J.Y. Experimental and Numerical Simulations of the Solidification Process in Continuous Casting of Slab. Metals 2016, 6, 53. [Google Scholar] [CrossRef]
  18. Wolczynski, W. Nature of Segregation in the Steel Static and Brass Continuously Cast Ingots. Arch. Metall. Mater. 2018, 63, 1915–1922. [Google Scholar]
  19. Brody, H.D.; Flemings, M.C. Solute redistribution in dendritic solidification. Tran. Metall. Soc. AIME 1966, 236, 615–624. [Google Scholar]
  20. Wolczynski, W. Back-Diffusion in Crystal Growth. Eutectics. Arch. Metall. Mater. 2015, 60, 2403–2407. [Google Scholar] [CrossRef]
  21. Liu, J.; Jia, Y.H.; Zhang, Y.; Sun, N. Determination of the Insoluble Aluminum Content in Steel Samples by Using Laser-Induced Breakdown Spectroscopy. Plasma Sci. Technol. 2015, 17, 644–648. [Google Scholar] [CrossRef]
  22. Zhang, Y.; Jia, Y.H.; Yang, C.; Li, D.L.; Liu, J.; Chen, Y.Y.; Liu, Y.; Duan, Y.X. Characterization of the globular oxide inclusion ratings in steel using laser-induced breakdown spectroscopy. Front. Phys. 2016, 11, 273–279. [Google Scholar] [CrossRef]
  23. Yang, C.; Jia, Y.; Zhang, Y.; Li, D.; Liu, J.; Chen, J.; Chen, Y.; Liu, Y. Characterization of the Delamination Defects in Marine Steel Using Laser-Induced Breakdown Spectroscopy. Plasma Sci. Technol. 2015, 17, 671. [Google Scholar] [CrossRef]
  24. Shang, Z.; Shen, Y.; Ji, B.; Zhang, L. Effect of δ-ferrite evolution and high-temperature annealing on mechanical properties of 11Cr3W3Co ferritic/martensitic steel. Met. Mater. Int. 2016, 22, 171–180. [Google Scholar] [CrossRef]
  25. Dai, Q.X.; Cheng, X.N.; Zhao, Y.T.; Luo, X.M.; Yuan, Z.Z. Design of martensite transformation temperature by calculation for austenitic steels. Mater. Charact. 2004, 52, 349–354. [Google Scholar] [CrossRef]
  26. Aziz, M.J. Model for solute redistribution during rapid solidification. J. Appl. Phys. 1982, 53, 1158–1168. [Google Scholar] [CrossRef]
  27. DeArdo, A.J. Niobium in modern steels. Int. Mater. Rev. 2003, 48, 371–402. [Google Scholar] [CrossRef]
  28. Kang, S.; Jung, J.G.; Lee, Y.K. Effects of Niobium on Mechanical Twinning and Tensile Properties of a High Mn Twinning-Induced Plasticity Steel. Metall. Mater. 2012, 53, 2187–2190. [Google Scholar] [CrossRef]
  29. Liu, Q.D.; Liu, W.Q.; Zhao, S.J. Solute Behavior in the Initial Nucleation of V- and Nb-Containing Carbide. Metall. Mater. Trans. A 2011, 42a, 3952–3960. [Google Scholar] [CrossRef]
  30. Ren, X.Y.; Fu, H.G.; Xing, J.D.; Yang, Y.W.; Tang, S.L. Effect of boron concentration on microstructures and properties of Fe-B-C alloy steel. J. Mater. Res. 2017, 32, 3078–3088. [Google Scholar] [CrossRef]
  31. El-Kashif, E.; Asakura, K.; Shibata, K. Effects of nitrogen in 9Cr-3W-3Co ferritic heat resistant steels containing boron. ISIJ Int. 2002, 42, 1468–1476. [Google Scholar] [CrossRef]
Figure 1. Temperature field and thermal simulation sampling position of heavy ferritic heat-resistant steel (FHRS) casting, t = 0.5 h.
Metals 09 00249 g001
Figure 2. An illustration of the thermal simulation method: (a) a schematic diagram of the heavy casting and a selected “characteristic solidification unit”; (b) temperature curves of the cold and hot sides of a thermal simulated (TS) sample; (c) a schematic diagram of the thermal simulation experiment; (d) a “solidification unit” compared with a TS sample.
Metals 09 00249 g002
Figure 3. Schematic diagram of the crucible and flipping sample in situ, adapted from [16], with permission from Honggang Zhong, 2019: (a) the steel, which separated from chilled material by Al2O3 porcelain beads, was melted in the crucible; (b) the steel liquid was poured and contacted the chilled material by the crucible flipped 180 degrees in 1 s.
Metals 09 00249 g003
Figure 4. Schematic diagram of a laser-induced breakdown spectroscope (LIBS) and the surface topography of a sample after testing: (a) the principle of LIBS; (b) the morphology of a single point after laser excitation on the surface; (c) the morphology of a sample after laser excitation.
Metals 09 00249 g004
Figure 5. The evolution of temperature (tem) and cooling rate (CR) with time in three typical parts: (a) cold side (20 mm away from surface); (b) hot side (100 mm away from surface).
Metals 09 00249 g005
Figure 6. Macrostructure and microstructure in different TS samples. (a): TS1; (b): TS2; (c): TS3; (d): surface of TS3; (e): center of TS3; (f): solidification end of TS3.
Metals 09 00249 g006
Figure 7. Microstructure at positions of 50 mm away from the surface of three TS samples.
Metals 09 00249 g007
Figure 8. Relationship between the phases of CB2 FHRS and temperature.
Metals 09 00249 g008
Figure 9. Vickers hardness distribution of TS samples TS1, TS2 and TS3.
Metals 09 00249 g009
Figure 10. Content distribution of Cr, Mo, Mn, and B solutes in three TS samples.
Metals 09 00249 g010
Figure 11. Macro-segregation index ( i m a c r . ) of the main solutes for three TS samples.
Metals 09 00249 g011
Figure 12. Composition distribution of the grain boundary region at the solidification end of TS1.
Metals 09 00249 g012
Table 1. Chemical composition of ZG12Cr9Mo1Co1NiVNbNB CB2 FHRS (mass fraction %).
CSiMnSCrNiMo
0.130.230.94<0.019.760.151.5
NbVAlNCoB-
0.0590.2<0.010.0260.960.01-
Table 2. The result of point analyses by electron microprobe.
Positionwt.%
FeCSMnNbMoVNTiCaSiCrB
1.6613.70--72.482.251.392.111.770.11--4.52
1.157.8932.1058.16---0.71-----
55.904.38-1.04-8.951.320.59-0.360.5327.82-

