Article

First Hydrogenation Enhancement in TiFe Alloys for Hydrogen Storage Doped with Yttrium

Hydrogen Research Institute, Université du Québec à Trois-Rivières, 3351 des Forges, Trois-Rivières, QC G9A 5H7, Canada
*
Author to whom correspondence should be addressed.
Metals 2019, 9(2), 242; https://doi.org/10.3390/met9020242
Submission received: 27 December 2018 / Revised: 27 January 2019 / Accepted: 1 February 2019 / Published: 18 February 2019

Abstract

:
The aim of this investigation was to improve the first hydrogenation of TiFe by adding yttrium. The compositions studied were TiFe + x wt.% Y with x = 4, 6, and 8. From electron microscopy it was found that all alloys were multiphase with a matrix of TiFe phase containing less than 0.4 at.% of Y and a secondary phase rich in yttrium. When x increased, the chemical compositions of the matrix changed and the secondary phase changed. The sample with 8% of yttrium had the fastest kinetics. The hydrogen capacity increased with the amount of Y.

1. Introduction

Due to its low price, and the fact that it can store hydrogen at room temperature and under mild pressure, TiFe is a good candidate for hydrogen storage for practical applications [1,2]. Despite being extensively studied for the past 40 years, there remains some practical problems that prevent the extensive use of this alloy. One of them is the fact that the first hydrogenation, the so-called activation, is difficult. In general, activation has to be performed at high temperature and under high hydrogen pressure during a long time [3]. In order to reduce the cost and use the TiFe in a large-scale production, the activation should ideally be done at room temperature and under mild hydrogen pressure [4,5,6,7].
One way to improve activation is to substitute Ti or Fe with transition metals elements such as Mn, Cr, Ni, and Zr [8,9,10,11]. For example, Nagai et al. have substituted Fe and/or Ti with Zr and found that partial substitution improves the performance of the alloys for the first hydrogenation [9]. However, in this study, the amount of Zr was relatively large (up to 15 at.%). It was also found by Nishimiya et al. that the substitution of the zirconium on the titanium site of the TiFe structure lowered the hydrogenation plateau pressure and reduced its width [12].
Recently, Jain et al. showed that adding 4 wt.% of zirconium to TiFe considerably reduced the incubation time of the first hydrogenation without changing the reversibility of the alloy [13]. In a following study, Gosselin et al. has shown that increasing the amount of zirconium can also increase the hydrogen capacity of the alloy. Mechanical deformations, such as ball milling and high-pressure torsion, could also be used to improve the hydrogenation behavior of TiFe [14]. Edalati et al. were able to activate the TiFe after an HPT (high pressure torsion), with the HPT proceeding at 6 GPa and all samples were tested under 2 MPa of hydrogen and at room temperature for the activation. They were also able to decrease the pressure to 0.7 MPa for the other cycle and the amount absorbed or desorbed by the material did not decrease with cycling (1.7 wt.%) [15,16].
From previous studies, the minimal amount of zirconium added in order to achieve a fast activation was determined to be 4 wt.% [5,6]. In all of these investigations, zirconium was present at a level of about 1 at.% in the TiFe phase while the secondary phase was rich in zirconium and acted as a gateway for hydrogen during the activation step.
Having established that zirconium could be beneficial for the activation behavior of TiFe, we wanted to explore the addition of other elements. In the present paper, we report the effect of the yttrium on the activation properties of the TiFe alloy. Gong et al. studied the Fe-Ti-Y ternary diffusion couples and found that the Fe11TiY and the Fe2(Ti,Y) compounds were formed [17]. In the present investigation, the hypothesis is that yttrium may act as a gateway for hydrogen in the same fashion as with the addition of zirconium. Therefore, the difference between this work and the previous works on the addition of Y to TiFe is that here we mainly want to investigate the interplay between the TiFe phase and an yttrium-rich secondary phase. The compositions TiFe + x wt.% Y (x = 4, 6, and 8) were investigated.

2. Materials and Methods

Yttrium (99.9% pure) was purchased from Hefa Rare Earth Canadian Co Ltd (Richmond, BC, Canada). Iron and titanium sponge, both 99.9% pure, were purchased from Alfa Aesar (Haverhill, MA, USA) and used without further purification. Alloys were synthesized by mixing all elements in the right proportion and cast using arc melting. To ensure the homogeneity of the sample, the pellets were turned over and remelted three times. After the final melting, the pellets were handled under argon atmosphere and hand crushed with a hardened steel mortar and pestle.
The hydrogen storage properties were measured with a homemade Sievert-type apparatus. For the hydrogenation properties, the samples were loaded under argon atmosphere in a reactor cell and kept under vacuum for one hour at room temperature (RT) before being exposed to hydrogen. First hydrogenation was performed at room temperature with an applied hydrogen pressure of 2500 kPa.
The crystal structure of the alloys was investigated using X-ray powder diffraction performed on a Bruker (Madison, WI, USA) Focus diffractometer with copper radiation with Cu Kα radiation using a Ni filter. The diffraction patterns were analyzed via Rietveld refinement using Topas software Bruker, Madison, WI, USA) and the fundamental parameters line profile approach [18,19]. The microstructure and chemical analysis were carried out using a Hitachi S-3400 scanning electron microscope (Hitachi High-Technologies Canada, Toronto, ON, Canada) equipped with an Oxford EDX (Oxford Instruments NanoAnalysis, Concord, MA, USA) energy dispersive X-ray apparatus.

3. Results and Discussion

3.1. Microstructure

The backscattered electron micrographs of FeTi + x wt.% Y, (x = 4, 6, and 8) in an as-cast state are shown in Figure 1. It is clear that the microstructure was heavily dependent on the yttrium content. Each composition contained a grey phase, a dark phase, and a bright phase. The alloy with 4 wt.% of yttrium had a finely distributed network of a bright phase with some inclusions of a dark phase. For 6 wt.% Y, the bright phase was much less abundant and consisted of small isolated “islands.” The dark phase is present in a much larger abundance. The alloy containing 8 wt.% Y presents dendritic black phase along with a few large, isolated islands of bright phases. There is also a network of bright phases.
The chemical composition of each phase was investigated using EDX. First, the bulk abundance was measured by recording the EDX on the whole field of view of the electron micrographs and compared to the nominal composition. As shown in Table 1, the atomic percentages were close to the nominal compositions. It was noticed that the measured values for 4, 6, and 8 wt.% Y were 4, 3, and 3, respectively. As the abundance of Y was still quite low, it was difficult to really measure the abundance change using EDX. The values still agreed with the nominal ones.
In order to have a better understanding of the element distributions, a chemical mapping using EDX was performed at a higher magnification. Figure 2 shows the mapping of TiFe + 4 wt.% Y.
Table 2 presents the chemical compositions at the selected points indicated in Figure 2. It is clear that the grey phase (point 1) was pure TiFe without any yttrium. The bright phase (point 2) was approximately 80% yttrium with about 10 at.% each of iron and titanium. The light gray areas (point 3) have a composition very close to Fe2Ti with essentially no yttrium. Finally, the dark phase (point 4) was quite close to TiFe stoichiometry but yttrium was also present in a small amount.
This microstructure bears some similarities with the alloy TiFe + 4 wt.% Zr previously reported [5]. The main differences were that for the Zr addition, the TiFe phase contained a small amount of zirconium, while for the Y addition, the TiFe phase had no yttrium. Also, the abundance of yttrium in the secondary phase was much higher than the abundance of zirconium in the corresponding alloy.
The element mapping of TiFe + 6 wt.% Y is shown in Figure 3 and the elemental analysis at selected points is presented in Table 3.
It can be seen that there were areas where yttrium was concentrated and where iron and titanium were absent. As in the previous case, the main phase (point 1) was TiFe, but here this phase contained a small amount of yttrium. The dark phase (point 2) seemed to be TiFe with yttrium substituting in mainly for titanium. The bright phase (point 3) had a higher proportion of yttrium while the white precipitates (point 4) were almost pure yttrium.
The element mapping of the TiFe + 8 wt.% Y alloy is displayed in Figure 4 and the results of elemental analysis are presented in Table 4.
From the micrograph, four different areas were identified. The nature of each phase was the same as in the previous two systems. The main matrix (the grey phase) was TiFe with no yttrium present while the bright phase was composed of 49% titanium, 21% iron, and 30% yttrium, which suggests that yttrium had substituted in for iron in this case. The white precipitate was pure yttrium and the black precipitate was pure titanium.

3.2. First Hydrogenation (Activation)

The activation curve of all the as-cast samples is shown in Figure 5. Earlier works demonstrated that the first hydrogenation of pure TiFe was impossible without a heat treatment at a high hydrogen pressure [4,5]. As the activation of pure TiFe at room temperature and under 2500 kPa of hydrogen was shown to be virtually impossible (see Reference [5]), this curve is not shown here.
Figure 5 clearly shows that an increase in yttrium content led to a faster and more complete hydrogenation. Considering the weight of yttrium, the maximum capacities of the x = 4, 6, and 8 alloys were 1.79 wt.%, 1.75 wt.%, and 1.71 wt.%, respectively. It is clear that the measured capacities were well below the theoretical ones for all compounds. However, the higher yttrium content was closer to the theoretical capacity. As the yttrium content increased, the hydrogenation kinetics also increased. As the microstructures of these three alloys were quite different chemically and morphologically, this means that the kinetics improvement was not due only to a given type of microstructure or a certain composition of the secondary phases, but instead to a complex synergy between the microstructure and the chemical compositions of the different phases of a given alloy.

3.3. Crystal Structure

The X-ray diffraction patterns of as cast alloys are shown in Figure 6. For all alloys, the main phase was TiFe. The secondary phases peaks were visible for the alloys x = 6 and x = 8, but very small for x = 4. For x = 8, the following structures were found to be present in the diffraction pattern: TiFe (space group Pm-3m), Y (space group P63/mmc), high temperature titanium (Ti-ht) (space group Im-3m), and bcc (space group Im-3). These phases were also seen in the x = 6 alloy, but for the x = 4 pattern, the abundances of the Y and Ti-ht secondary phases were very small and the bcc was essentially absent. For the x = 6 and x = 8 patterns, there were non-indexed peaks at around 49°, 53.5°, and 63.5°.
The abundance, in wt.%, of the FeTi, Y, Ti-ht, and bcc phases are given in Table 5. The proportion of the TiFe phase decreased with x, while the abundances of the secondary phases increased. By inspection of the micrographs and the EDX measurements shown in Figure 4 and Table 4, we could conclude that the TiFe phase corresponded to the matrix, the Y phase was the white precipitate, the Ti-ht was the black precipitate, and the bright phase were the bcc.
The lattice parameter of TiFe phase and crystallite sizes as determined using Rietveld refinement are reported in Table 6. It should be mentioned that, for the 4 wt.%Y pattern, the microstrain was refined and a value of 0.100(3)% was found. However, for the two other patterns, the microstrain was found to be zero. Nevertheless, the crystallite size decreased with x. This reduction of crystallite size may be explained by the fact that the abundance of TiFe phase also decreased with X. As this phase occupied a smaller volume, then it is reasonable to imagine that the crystallite size will be reduced.
Regarding the bcc phase, the lattice parameters for the x = 6 and x = 8 alloys were 3.148(1) Å and 3.155(1) Å, respectively. This means an increase of 0.2% of the lattice parameter when x went from 6 to 8. However, considering the atomic radius of Ti, Fe, and Y to be 140 pm, 140 pm, and 180 pm, respectively, and the atomic composition of the bcc phase given in Table 3 and Table 4 (bright phase), the change of the average atomic radius was 1%. A variation of the average atomic radius much bigger than the variation of the lattice parameter was difficult to understand for a bcc alloy. However, the Rietveld refinement of this phase gave values of crystallite sizes that were extremely big and microstrains values that were quite large. This phenomenon was recently seen for an AB2 system [20]. This was explained by the fact that the phase did not have a homogeneous composition but instead had a spatial variation of composition which translated into a change of lattice parameters. This variation of lattice parameters within a phase was interpreted by the Rietveld refinement as a microstrain. More details about this phenomenon is given in the paper by Khajavi et al. [20].

4. Conclusions

This paper reported the investigation of the first hydrogenation of the TiFe + x wt. % Y (x = 4, 6, and 8) alloys. We found that yttrium was essentially immiscible in TiFe and the casting resulted in a multiphase system with yttrium-rich phases. The microstructure and chemical composition of the secondary phases were heavily dependent on the yttrium proportion. An important difference with the zirconium addition is that yttrium tended to form islands of pure elements and helped in the precipitation of a high-temperature pure titanium. It was found that the proportion of the TiFe phase decreased with increasing Y content, but this had no great impact on the hydrogen capacity. This means that other phases absorbed hydrogen. The identification of the phases absorbing hydrogen could be made using in situ diffraction patterns, but this experiment was outside the scope of this investigation.
The addition of yttrium led to the absence of incubation time in the first hydrogenation and an improvement in absorption kinetics. It was also found that the hydrogen capacity observed increased as the amount of yttrium increased. However, hydrogen capacity did not reach the theoretical value and the addition of yttrium reduced the capacity. It could be concluded that, even if yttrium addition helped the first hydrogenation by eliminating the incubation time, the penalty on the reduction of hydrogen capacity was too large to make it attractive for hydrogen storage applications.

Author Contributions

conceptualization, J.H; investigation, C.G.; writing—review and editing, J.H. and C.G.

Funding

This research was funded by NSERC grant number RGPIN-6637. C.G. thanks the FRQNT (Fonds de Recherche Nature et Technologies) for a PhD fellowship.

Conflicts of Interest

The authors declare no conflict of interest. The funders had no role in the design of the study; in the collection, analyses, or interpretation of data; in the writing of the manuscript, or in the decision to publish the results.

References

  1. Reilly, J.J.; Wiswall, R.H. Formation and properties of iron titanium hydride. Inorg. Chem. 1974, 13, 218–222. [Google Scholar] [CrossRef]
  2. Sandrock, G.D. The metallurgy and production of rechargeable hydrides. In Hydrides for Energy Storage; Andersen, A.F., Maeland, A.J., Eds.; Pergamon: Oxford, UK, 1978; pp. 353–393. [Google Scholar]
  3. Hotta, H.; Abe, M.; Uchida, H. Synthesis of Ti-Fe alloys by mechanical alloying. J. Alloys Compd. 2007, 439, 221–226. [Google Scholar] [CrossRef]
  4. Jain, P.; Gosselin, C.; Skryabina, N.; Fruchart, D.; Huot, J. Hydrogenation properties of TiFe with Zr7Ni10 alloy as additive. J. Alloys Compd. 2015, 636, 375–380. [Google Scholar] [CrossRef]
  5. Gosselin, C.; Huot, J. Hydrogenation properties of TiFe doped with zirconium. Materials 2015, 8, 7864–7872. [Google Scholar] [CrossRef] [PubMed]
  6. Gosselin, C.; Santos, D.; Huot, J. First hydrogenation enhancement in TiFe alloys for hydrogen storage. J. Phys. D Appl. Phys. 2017, 50, 375303. [Google Scholar] [CrossRef]
  7. Lv, P.; Huot, J. Hydrogen storage properties of Ti0.95FeZr0.05, TiFe0.95Zr0.05 and TiFeZr0.05 alloys. Int. J. Hydrogen Energy 2016, 41, 22128–22133. [Google Scholar] [CrossRef]
  8. Nagai, H.; Kitagaki, K.; Shoji, K. Microstructure and hydriding characteristics of FeTi alloys containing manganese. J. Less Common Metals 1987, 134, 275–286. [Google Scholar] [CrossRef]
  9. Nagai, H.; Kitagaki, K.; Shoji, K.-I. Hydrogen storage characteristics of FeTi containing zirconium. Trans. Jpn. Inst. Metals 1988, 29, 494–501. [Google Scholar] [CrossRef]
  10. Lee, S.M.; Perng, T.P. Effect of the second phase on the initiation of hydrogenation of TiFe1−xMx (M = Cr,Mn) alloys. Int. J. Hydrogen Energy 1994, 19, 259–263. [Google Scholar] [CrossRef]
  11. Bershadsky, E.; Klyuch, A.; Ron, M. Hydrogen absorption and desorption kinetics of TiFe 0.8 Ni 0.2 H. Int. J. Hydrogen Energy 1995, 20, 29–33. [Google Scholar] [CrossRef]
  12. Nishimiya, N.; Wada, T.; Matsumoto, A.; Tsutsumi, K. Hydriding characteristics of zirconium-substituted FeTi. J. Alloys Compd. 2000, 313, 53–58. [Google Scholar] [CrossRef]
  13. Jain, P.; Gosselin, C.; Huot, J. Effect of Zr, Ni and Zr7Ni10 alloy on hydrogen storage characteristics of TiFe alloy. Int. J. Hydrogen Energy 2015, 40, 16921–16927. [Google Scholar] [CrossRef]
  14. Zadorozhnyy, V.; Klyamkin, S.; Zadorozhnyy, M.; Bermesheva, O.; Kaloshkin, S. Hydrogen storage nanocrystalline TiFe intermetallic compound: Synthesis by mechanical alloying and compacting. Int. J. Hydrogen Energy 2012, 37, 17131–17136. [Google Scholar] [CrossRef]
  15. Edalati, K.; Matsuda, J.; Iwaoka, H.; Toh, S.; Akiba, E.; Horita, Z. High-pressure torsion of TiFe intermetallics for activation of hydrogen storage at room temperature with heterogeneous nanostructure. Int. J. Hydrogen Energy 2013, 38, 4622–4627. [Google Scholar] [CrossRef]
  16. Edalati, K.; Matsuda, J.; Arita, M.; Daio, T.; Akiba, E.; Horita, Z. Mechanism of activation of TiFe intermetallics for hydrogen storage by severe plastic deformation using high-pressure torsion. Appl. Phys. Lett. 2013, 103, 143902. [Google Scholar] [CrossRef]
  17. Gong, W.-p.; Chang, T.-F.; Li, D.-J.; Liu, Y. Thermodynamic investigation of Fe-Ti-Y ternary system. Trans. Nonferrous Metals Soc. China 2009, 19, 199–204. [Google Scholar] [CrossRef]
  18. Bruker AXS. TOPAS V5: General Profile and Structure Analysis Software for Powder Diffraction Data; Bruker AXS: Karlsruhe, Germany, 2014. [Google Scholar]
  19. Cheary, R.W.; Coelho, A.A.; Cline, J.P. Fundamental parameters line profile fitting in laboratory diffractometers. J. Res. Natl. Inst. Stand. Technol. 2004, 109, 1–25. [Google Scholar] [CrossRef] [PubMed]
  20. Khajavi, S.; Rajabi, M.; Huot, J. Crystal structure of as-cast and heat-treated Ti0.5Zr0.5 (Mn1−xFex) Cr1, x = 0, 0.2, 0.4. J. Alloys Compd. 2018, 767, 432–438. [Google Scholar] [CrossRef]
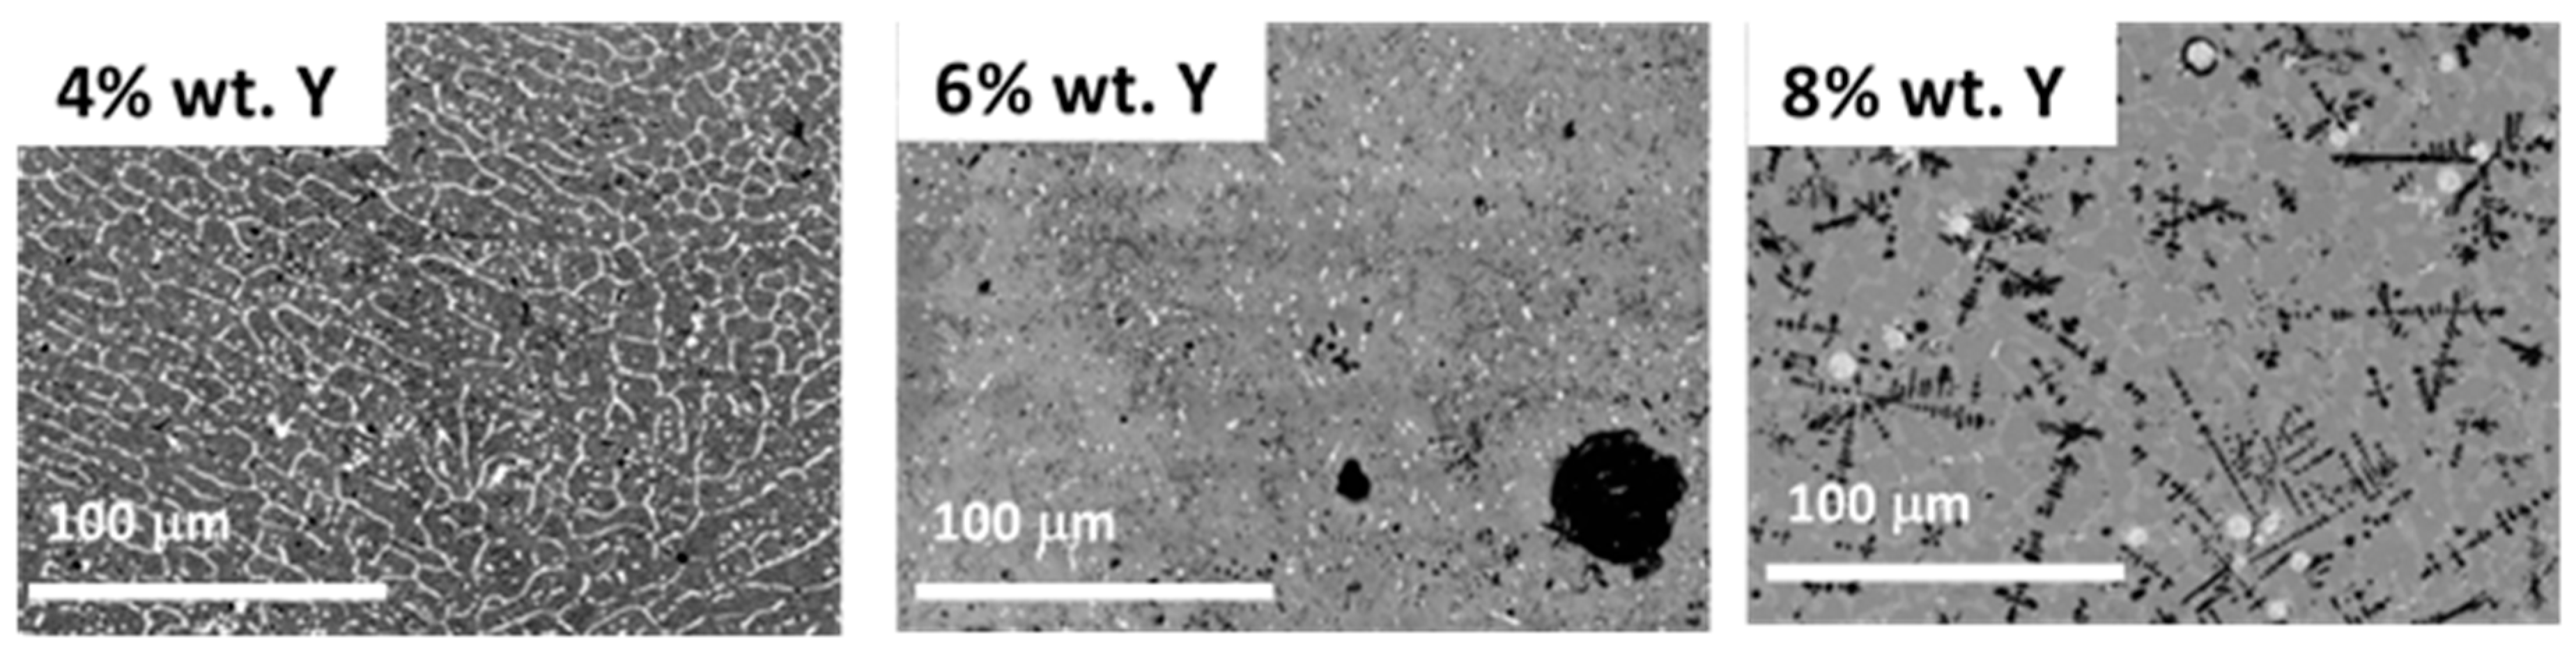
Figure 1. Backscattered micrographs of the as synthesized alloy of Ti-Fe + x wt.% Y (x = 4, 6, and 8).
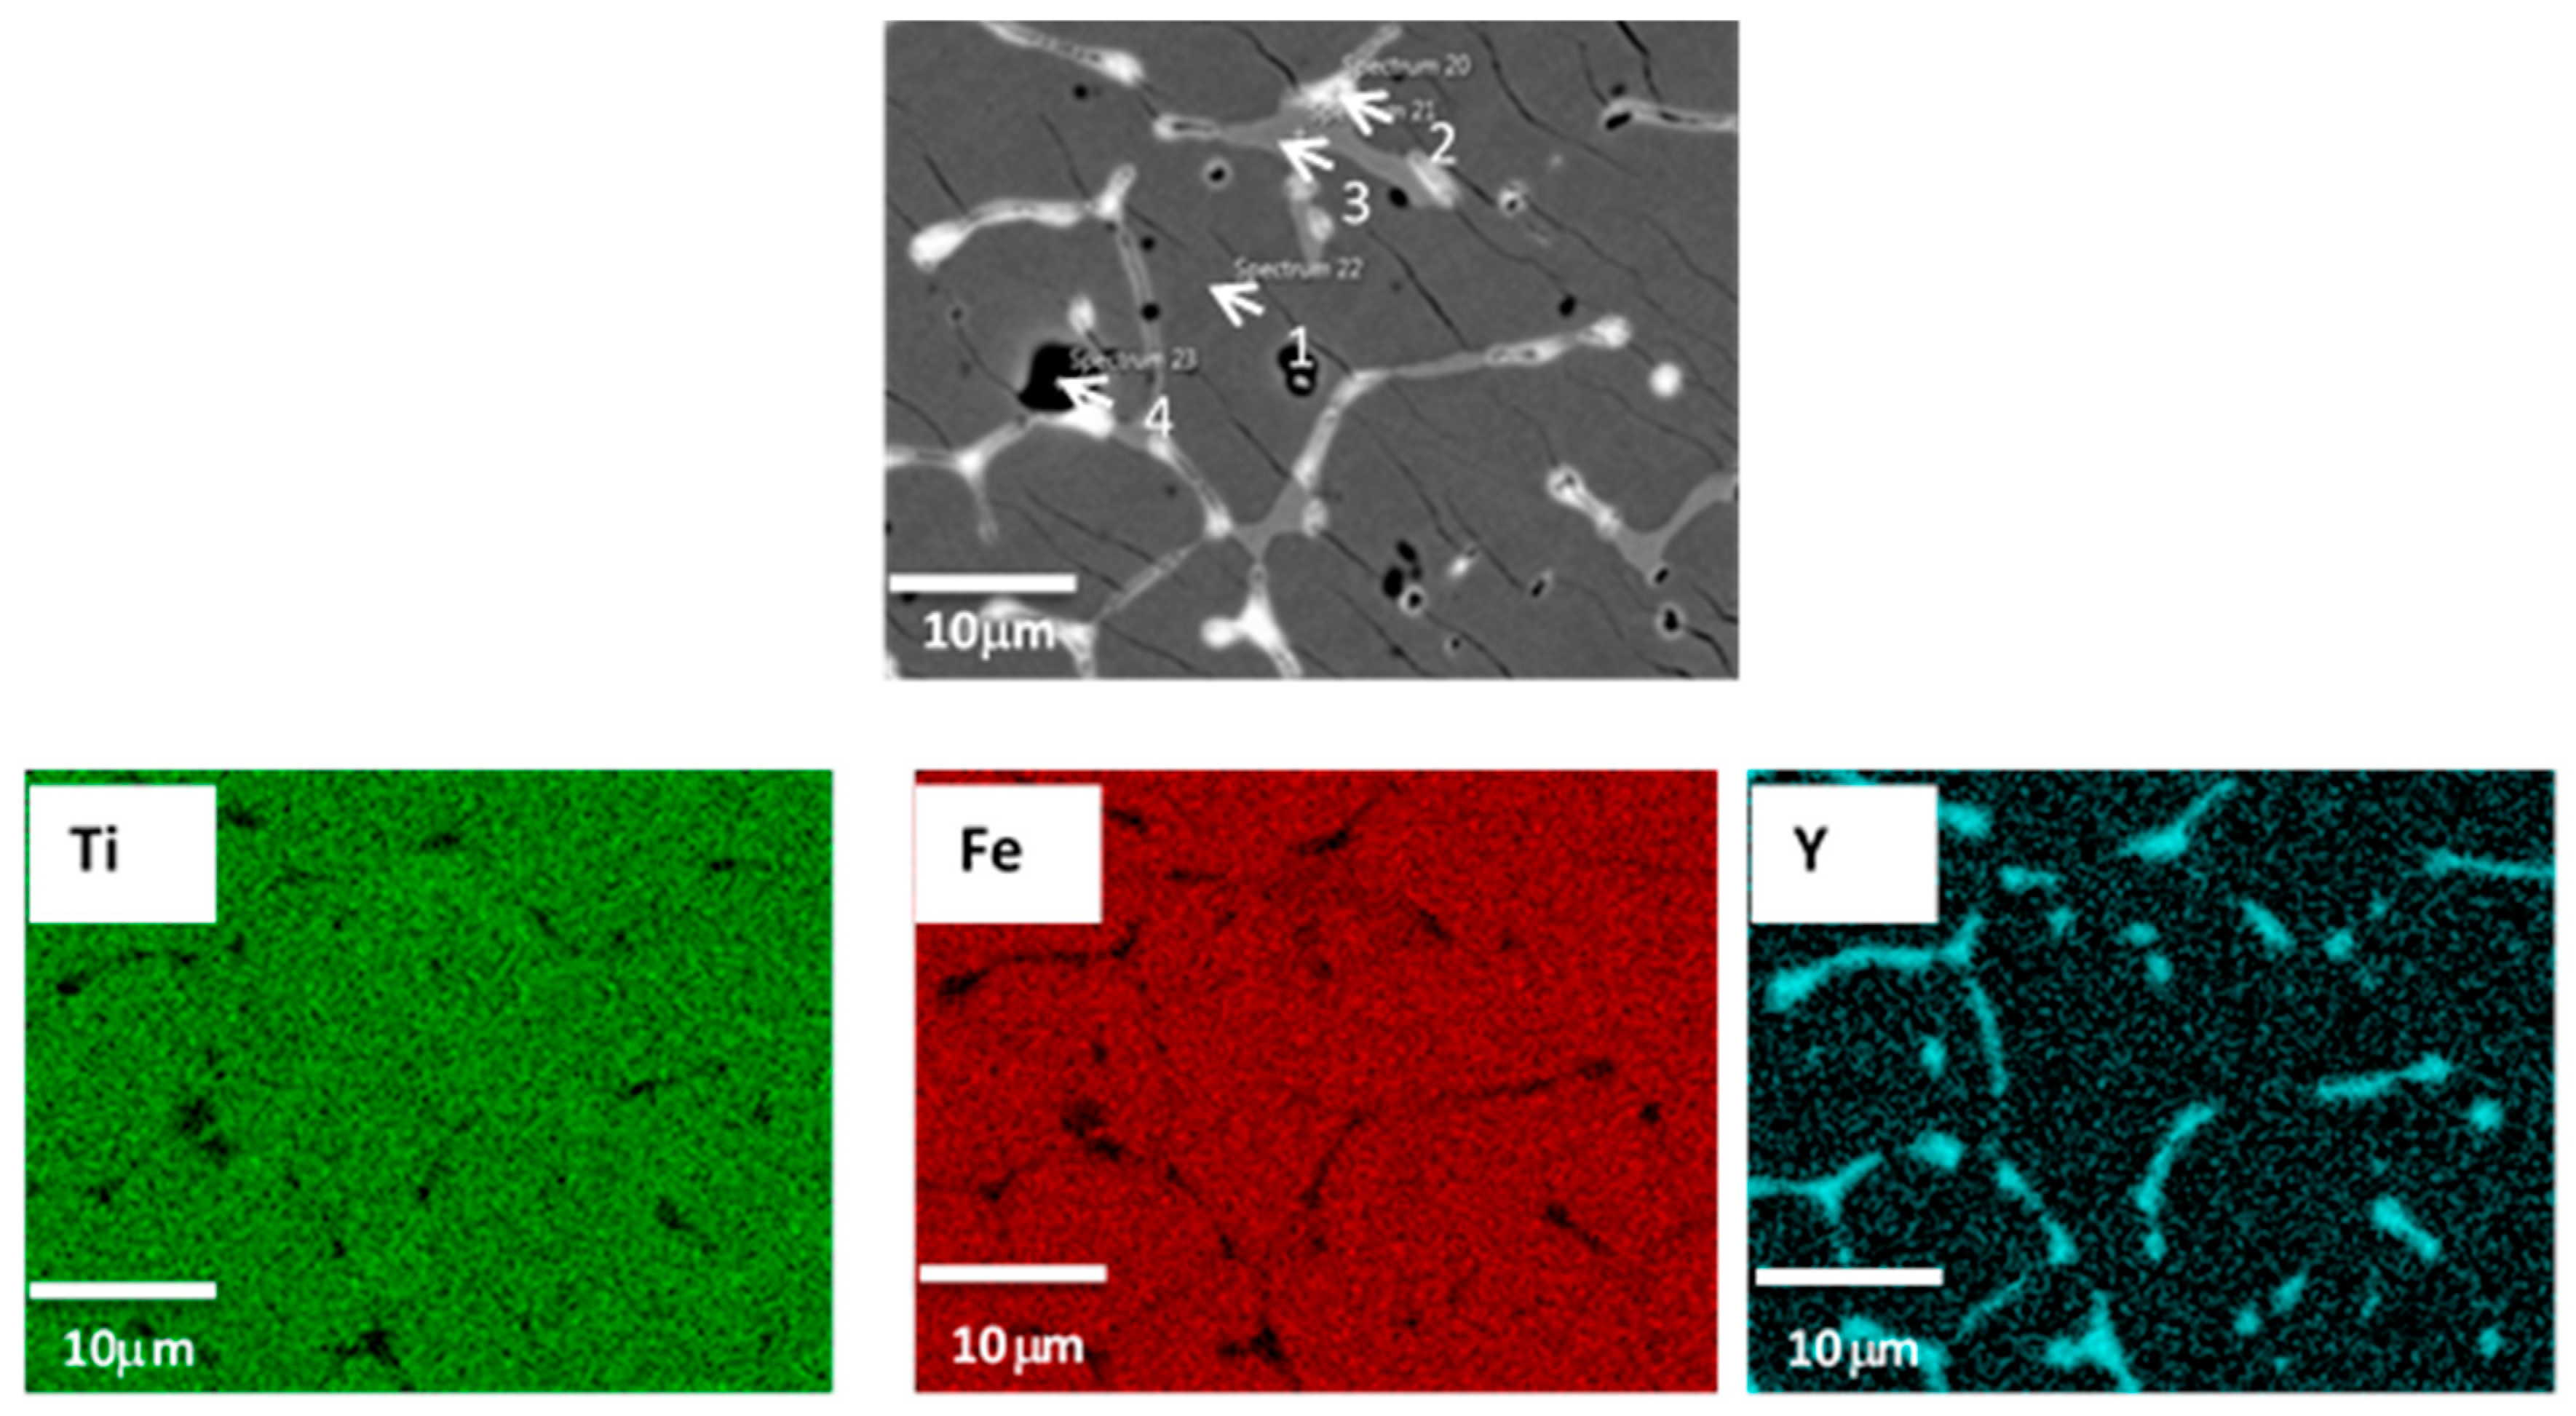
Metals 09 00242 g001
Figure 2. Backscattered micrographs of TiFe + 4 wt.% Y and the corresponding EDX mapping.
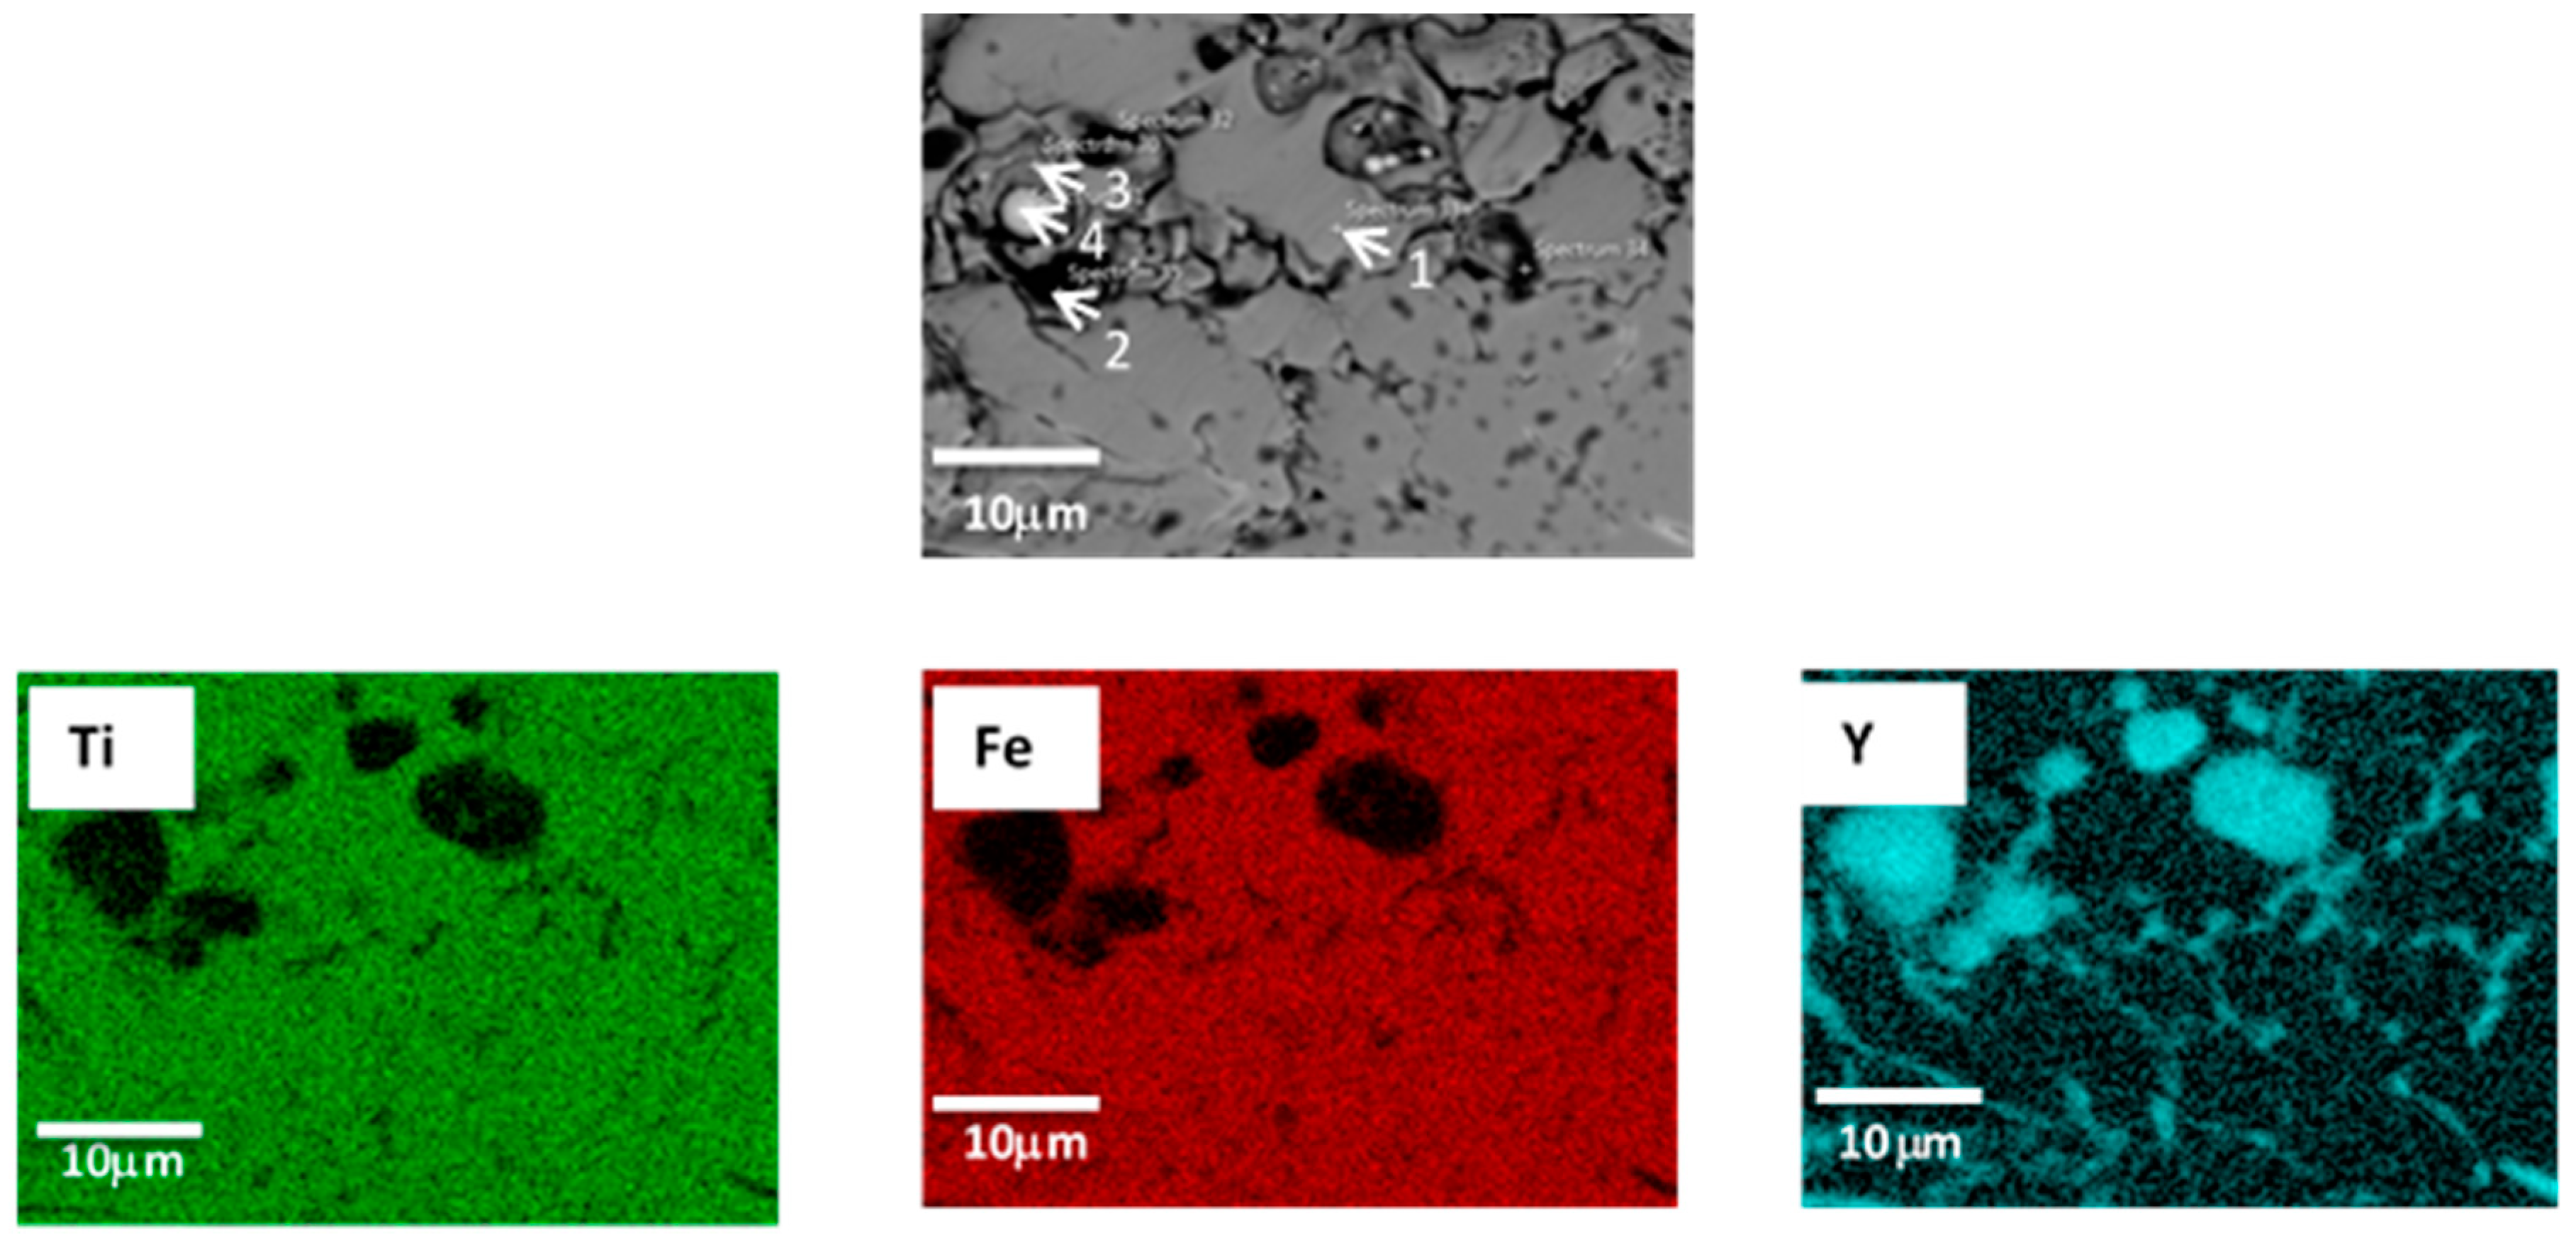
Metals 09 00242 g002
Figure 3. Backscattered micrographs of TiFe + 6 wt.% Y and the corresponding EDX mapping.
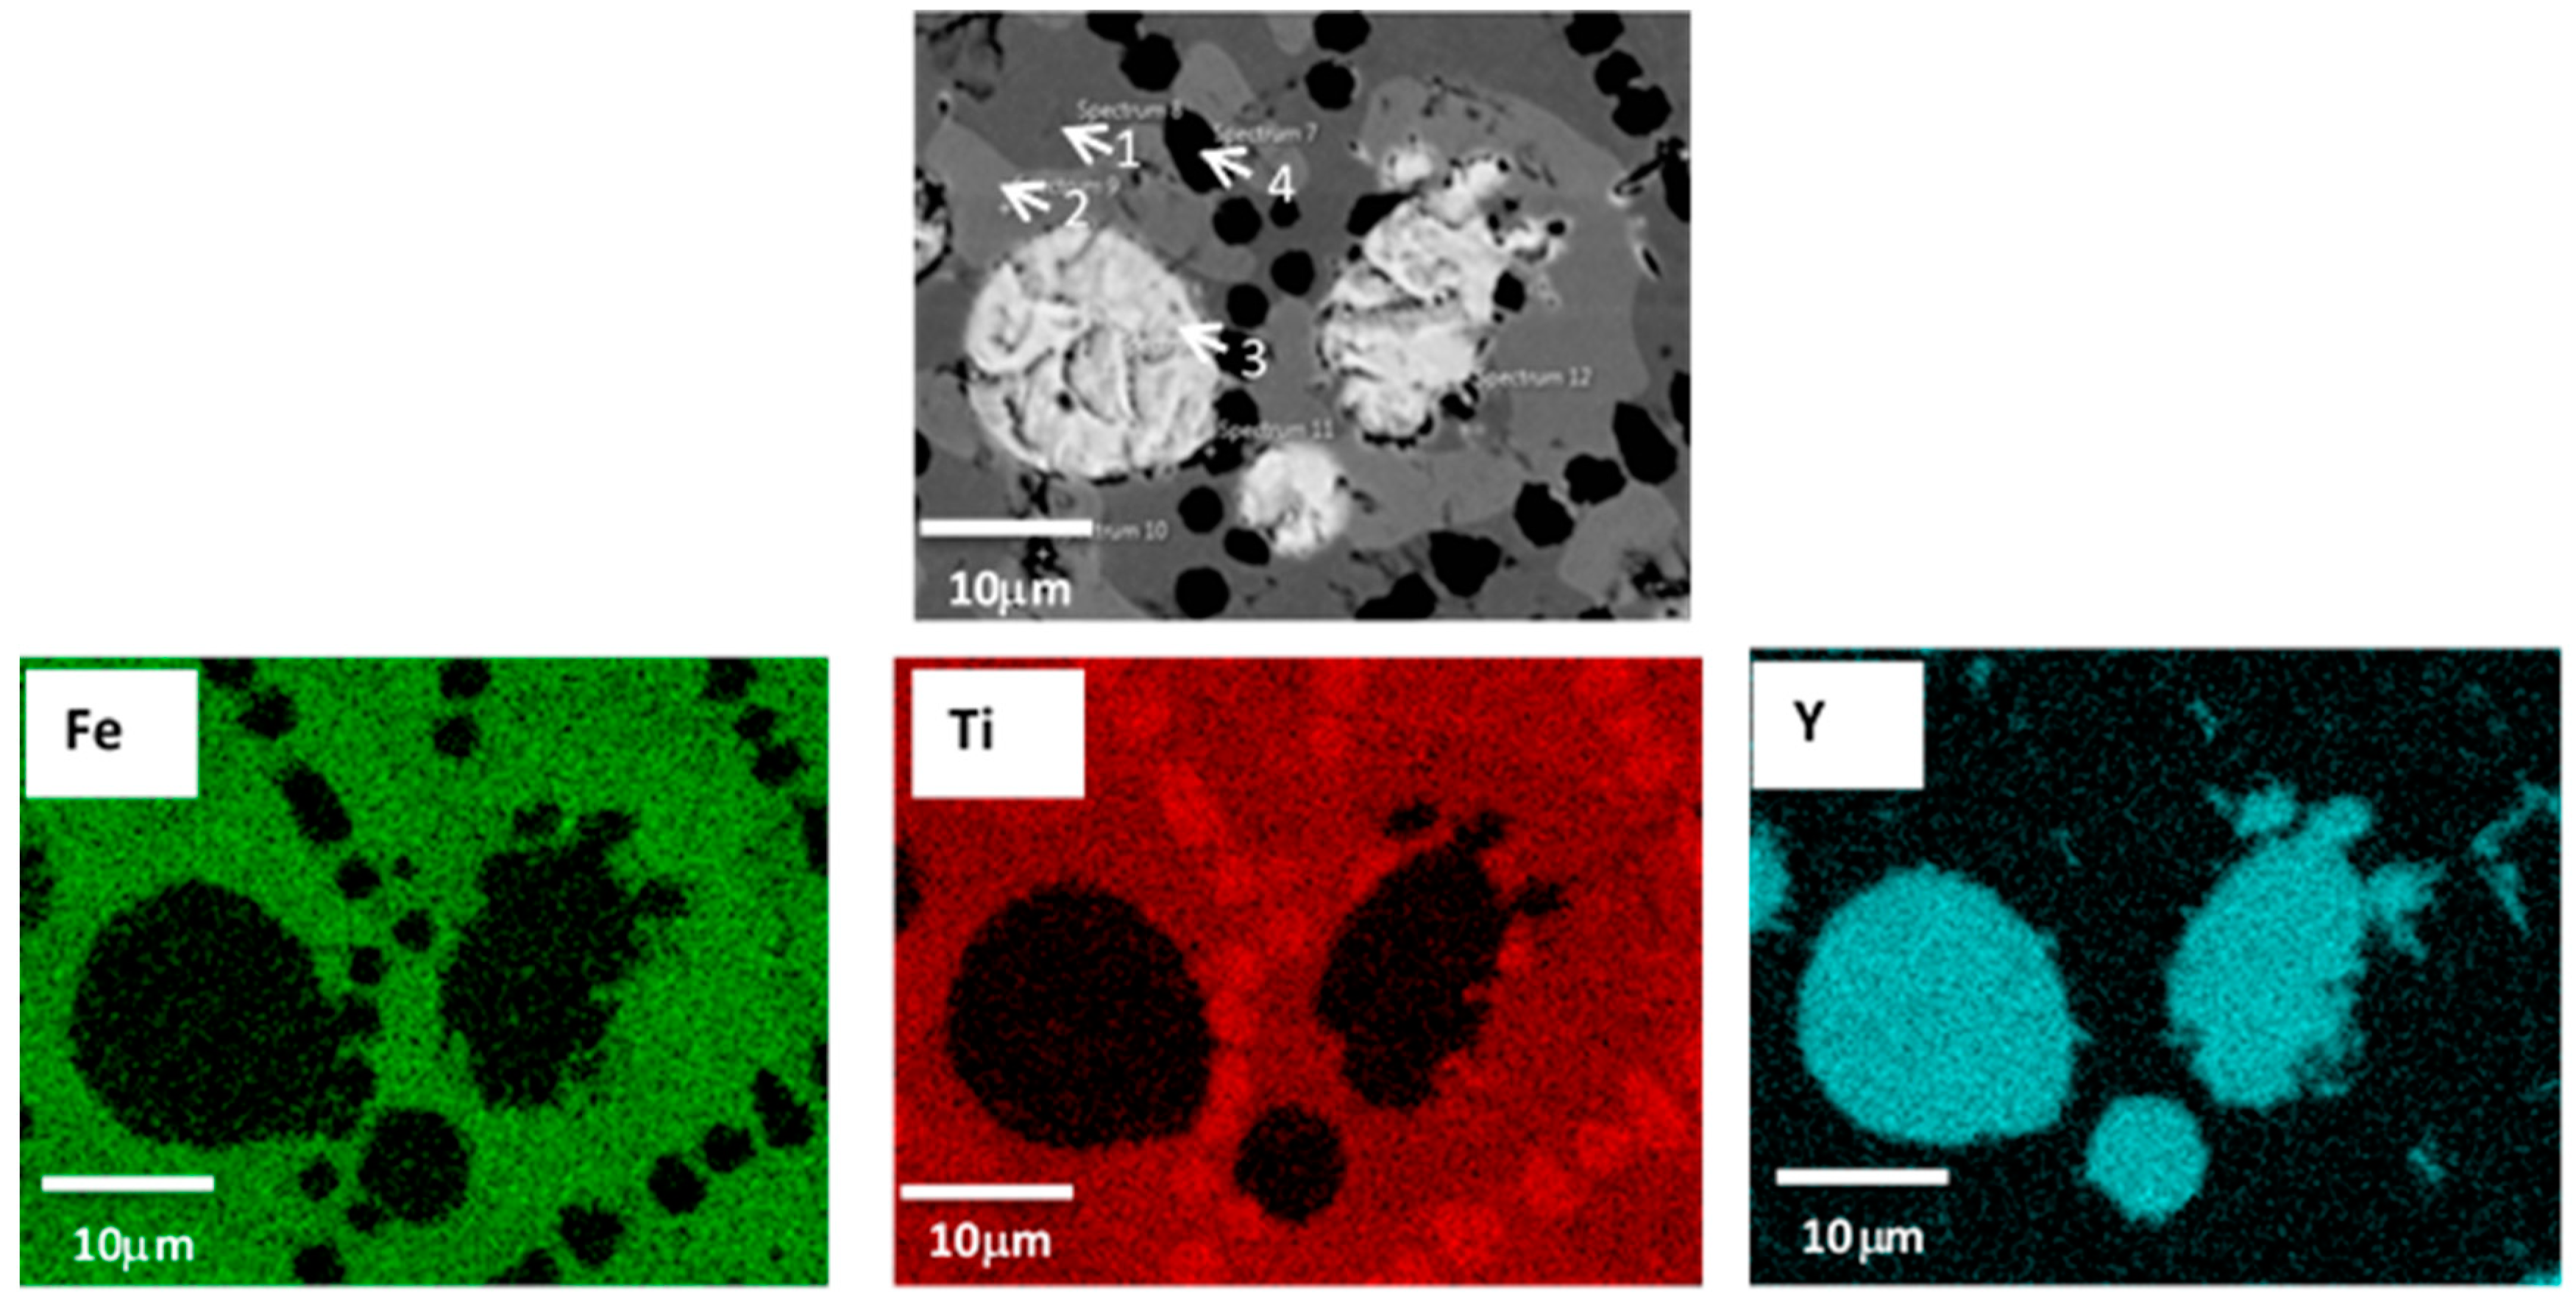
Metals 09 00242 g003
Figure 4. Backscattered micrographs of TiFe + 8 wt.% Y and the corresponding EDX mapping.
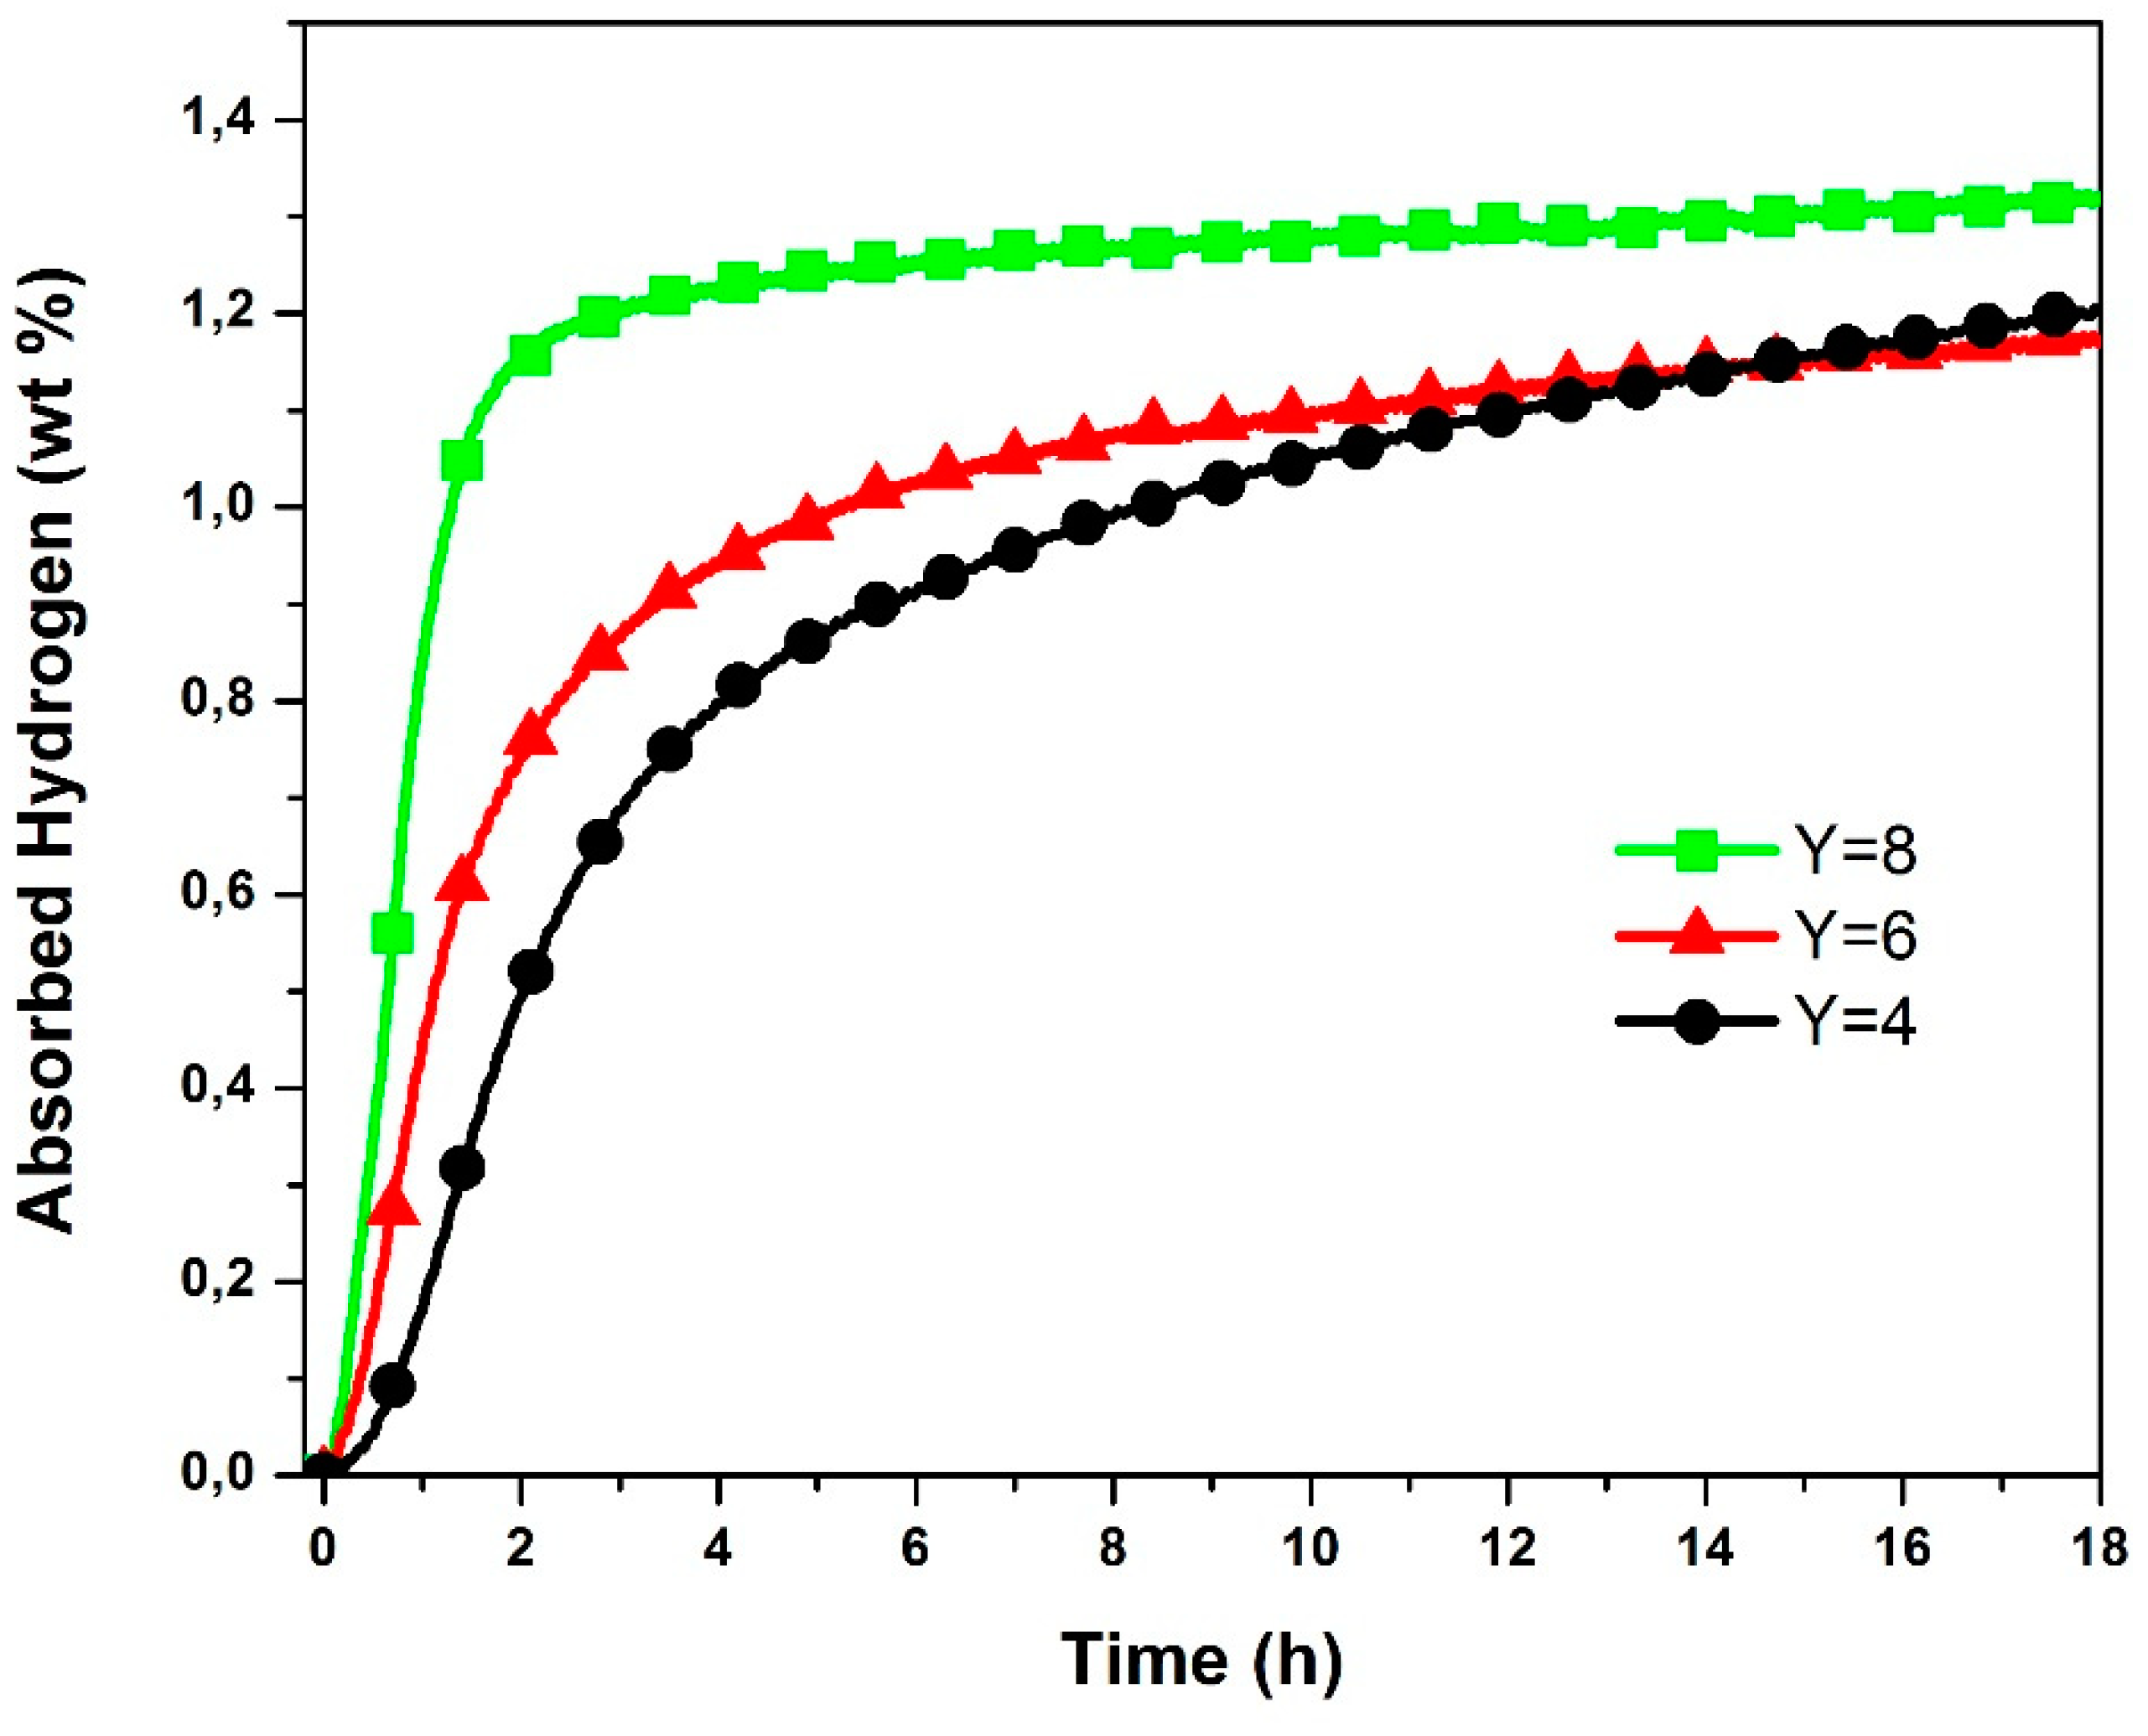
Metals 09 00242 g004
Figure 5. First kinetics hydrogenation at room temperature and at a pressure of 2500 kPa of hydrogen TiFe alloys + x wt.% Y for x = 4, 6, and 8.
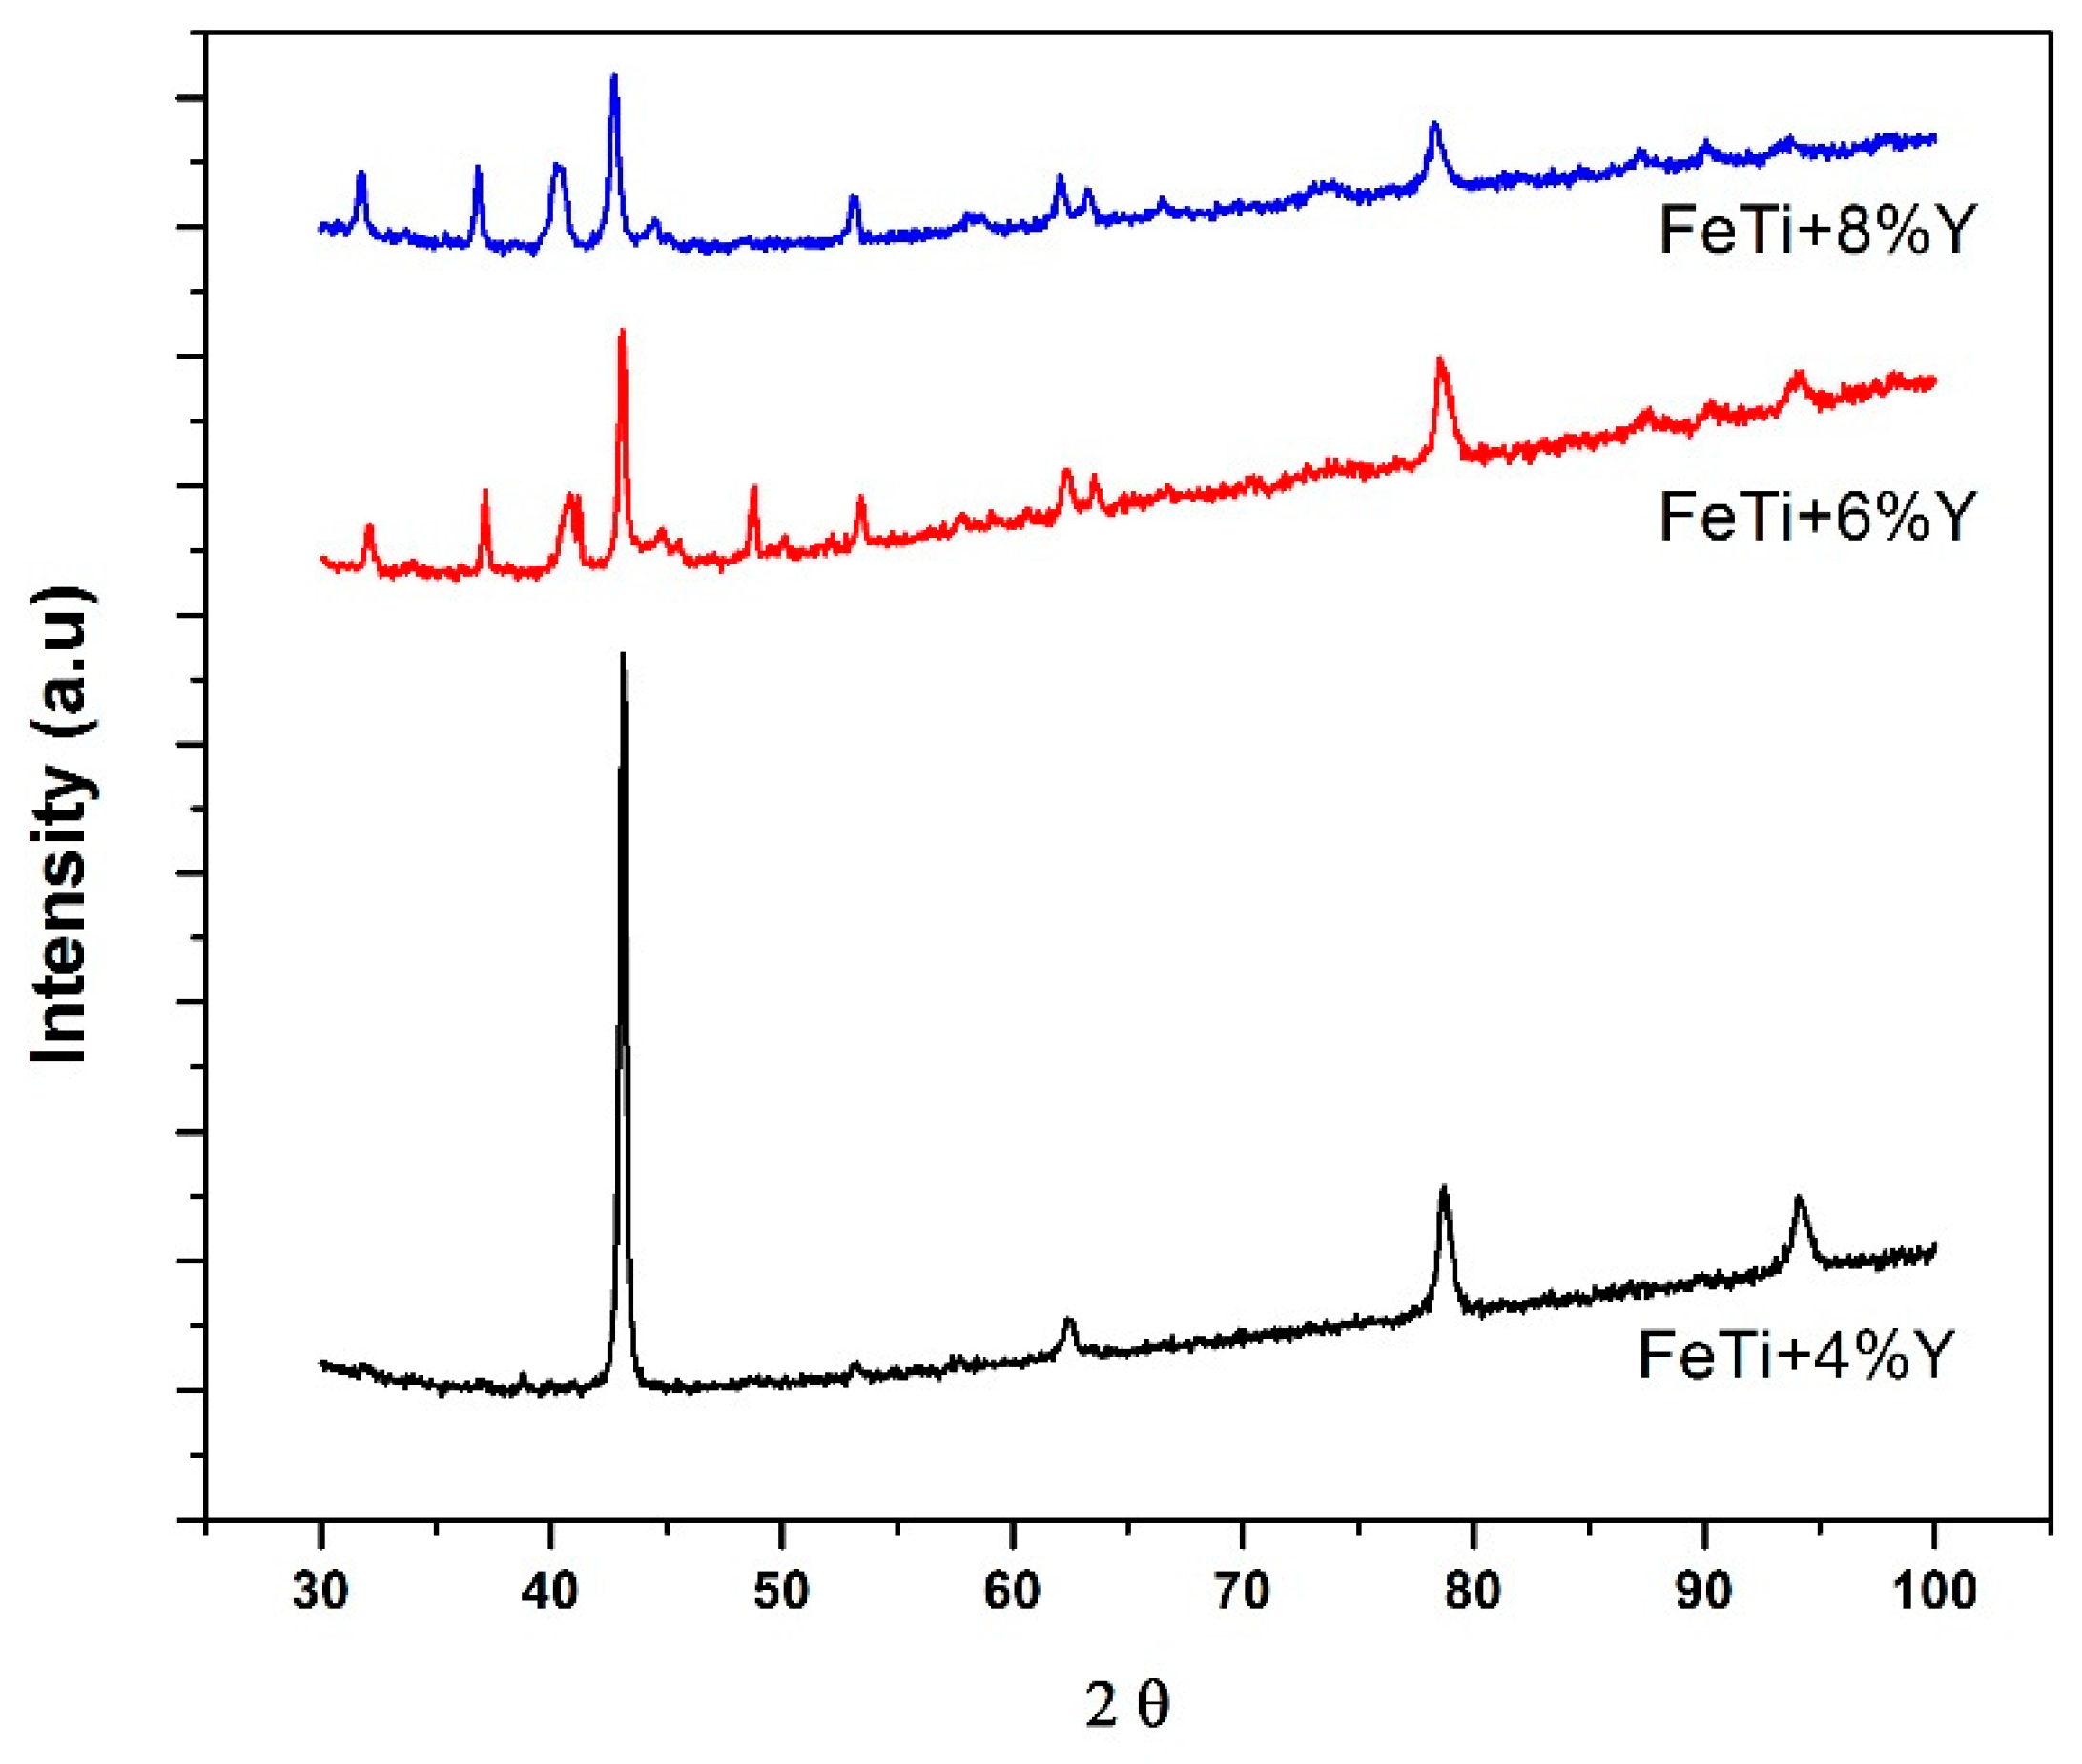
Metals 09 00242 g005
Figure 6. X-ray diffraction patterns of the as-cast TiFe + x wt.% Y alloys for x = 4, 6, and 8.
Metals 09 00242 g006
Table 1. Nominal and measured bulk atomic abundance of TiFe + x wt.% Y (x = 4, 6, and 8). All values are in at.%. The error on each value is ± 1 at.%.
SampleFeTiY
FeTi + 4% YNominal49492
Measured48484
FeTi + 6% YNominal48484
Measured48493
FeTi + 8% YNominal48485
Measured47503
Table 2. Measured atomic abundances of the various phases presents in the TiFe alloy + 4 wt.% Y. All values are in at.%. The error on each value is ±1%.
PhaseTiFeY
1-Grey phase50500
2-Bright phase111079
3-Light grey phase39610
4-Dark phase53452
Table 3. Measured atomic abundance of the various phases presents in the TiFe alloy + 6 wt.% Y. All values are in at.%. The error on each value is ±1%.
PhaseTiFeY
1-Grey phase5150<1
2-Dark phase 474210
3-Bright phase423226
4-White precipitate3294
Table 4. Measured atomic abundance of the various phases presents in the TiFe alloy + 8 wt.% Y. All values are in at.%. The error on each value is ±1%.
PhaseTiFeY
1-Grey phase50500
2-Bright phase492130
3-White precipitate2197
4-Black precipitate9910
Table 5. Phase abundance, in wt.%, as determined using Rietveld’s refinement of the phases present in the X-ray diffraction patterns of as-cast TiFe + x wt.% Y alloys (x = 4, 6, and 8). Uncertainties on the last significant digit are in parentheses.
CompositionFeTiYTi-htBCC
4 wt.% Y98.4(5)0.7(2)0.9(4)-
6 wt.% Y71(2)2.3(3)6.7(7)20(2)
8 wt.% Y58(2)4.8(5)12.8(8)24(2)
Table 6. Lattice parameter and crystallite size of the TiFe phase in as-cast TiFe + x wt.% Y alloys (x = 4, 6 and 8). Uncertainties on the last significant digit are in parentheses.
CompositionLattice Parameter a (Å)Crystallite Size (nm)
4 wt.% Y2.9837(3)36(1)
6 wt.% Y2.9885(6)24(1)
8 wt.% Y2.9854(6)17(1)

