Article

Particle Size-Dependent Microstructure, Hardness and Electrochemical Corrosion Behavior of Atmospheric Plasma Sprayed NiCrBSi Coatings

1
School of Science, Jiangsu University of Science and Technology, Zhenjiang 212003, China
2
School of Materials Science and Engineering, Jiangsu University of Science and Technology, Zhenjiang 212003, China
3
Guangxi Key Laboratory of Processing for Non-ferrous Metals and Featured Materials, Guangxi University, Nanning 530004, China
4
School of Engineering, Edith Cowan University, 270 Joondalup Drive, Joondalup, Perth 6027, Australia
*
Authors to whom correspondence should be addressed.
Metals 2019, 9(12), 1342; https://doi.org/10.3390/met9121342
Submission received: 25 November 2019 / Revised: 7 December 2019 / Accepted: 10 December 2019 / Published: 12 December 2019

Abstract

:
Particle size is a critical consideration for many powder coating-related industries since it significantly influences the properties of the produced materials. However, the effect of particle size on the characteristics of plasma sprayed NiCrBSi coatings is not well understood. This work investigates the microstructures, hardness and electrochemical corrosion behavior of plasma sprayed NiCrBSi coatings synthesized using different-sized powders. All coatings mainly consist of Ni, N3B, CrB, Cr7C3 and Cr3C2 phases. The coatings produced by small particles (50–75 μm) exhibit lower porosity (2.0 ± 0.8%). Such coatings show a higher fraction (15.5 vol.%) of the amorphous phase and lower hardness (700 HV0.5) than the counterparts (8.7 vol.% and 760 HV0.5, respectively) produced by large particles (75–100 μm) with higher porosity (3.0 ± 1.6%). Meanwhile, the coatings produced from smaller particles possess a larger number of non-bonded boundaries, leading to the easier penetration of corrosive medium, as well as a higher corrosion current density (0.254 ± 0.062 μA/cm2) and a lower charge transfer resistance (0.37 ± 0.07 MΩ cm2). These distinctions are attributed to particle size-induced different melting degrees and stackings of in-flight particles during deposition.

Graphical Abstract

1. Introduction

Because of their wide applications, powder feedstocks are used in many industries to produce bulk and/or porous materials by various technologies, such as thermal spraying [1,2], additively manufacturing [3,4,5,6], powder metallurgy [7,8,9], and laser processing [10,11,12]. These processing methods generally employ a heat source to melt a metallic powder in specific ways and then the final products can be obtained after processing. The metallic powder is usually in a spherical or near-spherical shape. Therefore, unlike other types of materials (e.g., wire and foil), a considerable number of pores are commonly present in the products synthesized from powder feedstocks [13]. During the last decade, many endeavors have been made to investigate the influence of the powder appearance (such as size and shape) on the properties of the produced materials. For example, Leger et al. [14] adopted experimental and numerical approaches to investigate the powder particle shape effect on the Al-Al2O3 coating build-up mechanism on a multi-scale and their results showed that spherical Al powder is more suitable to obtain better coatings with lower porosity. Wang et al. [15] studied the effects of particle size and structure on the preferential Ce evaporation for La2Ce2O7 particles during plasma spraying and indicated that the evaporation loss of Ce is significantly influenced by particle size, thereby affecting the properties of the as-sprayed La2Ce2O7 coatings. Sun et al. [16] used different-sized WC powders to sinter three sets of WC-8Co cemented carbides and found that the transgranular fractures of the prepared cemented carbides are more evident with increasing WC particle size. From all this one can conclude that powder appearance potentially influences the properties and therefore the end applications of the produced products.
NiCrBSi alloy coatings are also commonly prepared by metallic powder-related techniques including spraying [17,18] and laser cladding [19,20], with the aim to produce barriers to protect substrates from wear and/or corrosion. Amongst these techniques, atmospheric plasma spraying (APS) is frequently used due to its high synthesis speed and few limitations on equipment [21]. APS adopts a plasma gun as a heat source to melt the feedstock powder sprayed from the nozzle and impinges these powder particles on the substrates in a layer by layer method [22]. As a result, this processing method results in a typical lamellar microstructure in APS-prepared NiCrBSi coatings associated with a large number of pores and non-bonded boundaries (including lamellar boundaries and particle boundaries). Pores generally decrease the cohesion of the as-sprayed NiCrBSi coatings, thereby reducing their hardness and wear resistance [22]. In the meantime, non-bonded boundaries in as-sprayed NiCrBSi coatings provide diffusion paths for the ingress of corrosive species in a corrosive environment [22]. Hence, both pores and non-bonded boundaries are detrimental to the properties of the NiCrBSi coatings.
In general, pores and non-bonded boundaries are generated during the deposition of particles [23]. When a considerable number of particles are ejected from the nozzle, the in-flight particles are heated before they are deposited on the substrate. This process is extremely short and therefore partially melted particles are inevitably retained. Unlike the melted particles, the unmelted parts in such partially melted particles cannot uniformly spread on the substrate or coated surface. Hence, the pile-up of the partially melted particles can easily form pores due to the geometric constraints [24]. Note that, the melting generally takes place on the surface of the in-flight particles during deposition [21,22]. Therefore, it can be deduced that the melting degrees differs a lot for in-flight particles with different sizes. As such, the unmelted part in the in-flight particles finally results in the distinctions in the size and distribution of the pores in the as-sprayed coatings. Furthermore, non-bonded boundaries in the plasma-sprayed coatings result from limited diffusion between lamellae or particles [23]. The particles in different sizes inevitably lead to the distinctions in the density and distribution of the non-bonded boundaries. Undoubtedly, such distinctions can further influence the microstructures and the properties of the as-sprayed NiCrBSi coatings. However, there is still a lack of deep understanding of particle size dependent microstructure, hardness and electrochemical corrosion behavior of atmospheric plasma sprayed NiCrBSi coatings. Therefore, further understanding this question can facilitate to optimize the processing and to tailor the properties of the coatings prepared by plasma spraying technology.
This work aimed to investigate the influence of particle size on the microstructures and properties of the APS-produced NiCrBSi coatings. The NiCrBSi powders of different particle sizes (i.e., 50–75 μm and 75–100 μm) were used. The microstructures, hardness and electrochemical corrosion behavior of the NiCrBSi coatings prepared from different-sized particles were investigated. The mechanism for the distinctions found was interpreted systematically.

2. Experimental

2.1. Sample Preparation

The substrate material used in this work was commercial 2Cr13 stainless steel sheet, hot rolled steel bought from the Taiyuan Steel Factory (Taiyuan, China) with the following chemical composition by weight: 0.21% C, 0.34% Si, 0.54% Mn, 0.02% P, 0.003% S, 12.21% Cr, 0.1% Ni and Fe balance, which was cut into specimens with dimensions of 40 mm × 40 mm × 10 mm. The chemical composition of NiCrBSi powder feedstock with particle sizes in a range of 45–109 μm, purchased from the North of New Material Science and Technology Company (Beijing, China), are listed in Table 1.
Starting from the as-received NiCrBSi powder, the powder was screened by conventional sieves of different standards (150#, 200# and 300#) in sequence. Thus, the particle sizes of screened powder were divided into four different size ranges of 45–50 μm, 50–75 μm, 75–100 μm and 100–109 μm. Because of the significantly low amount of the powder in the sizes of 45–50 μm and 100–109 μm, only the powder in the sizes of 50–75 μm and 75–100 μm were used to synthesize the NiCrBSi coatings. Therefore, in this work, two particle size ranges of the powder, i.e., 50–75 μm and 75–100 μm, were selected as the main parameters. The powders with sizes of 50–75 μm and 75–100 μm are denoted as 50–75P and 75–100P, respectively, hereafter. The morphologies of the powder used in two different sizes are displayed in Figure 1. Figure 1a,b show scanning electron microscopy (SEM) micrographs of 50–75P and 75–100P under secondary electron mode, respectively. Both groups of powders are spherical, with smooth surfaces. It can be clearly seen that the 75–100P (Figure 1b) is obviously larger than 50–75P (Figure 1a). Figure 1c,d exhibit the particle size distributions for the two groups of powder. A total of 10 SEM images were used for the particle size analysis. The average diameters of both group samples are 63 μm and 88 μm, respectively.
Prior to spraying, the surface of the stainless-steel substrate was sandblasted with 16# Al2O3 powder. The gas pressure of sandblasting was about 0.45–0.6 MPa, and the roughness of the surface of the sandblasted samples was about 18 ± 1.2 μm. After sandblasting, the surface was cleaned with ethanol and air dried. The two groups of NiCrBSi powders were dried for 2 h in a furnace at 200 °C. The spraying parameters used in this work are listed in Table 2, where 50–75C and 75–100C stand for the NiCrBSi coating sample prepared by 50–75P and 75–100P, respectively. The secondary electron images for the non-etched cross-sectional morphologies of the 50–75C and 75–100C are shown in Figure 2. The thickness of the as-sprayed 50–75C is about 598 ± 24 μm (Figure 2a), while the thickness of the as-sprayed 75–100C is only 432 ± 20 μm. After polishing, whose thickness changes to 552 ± 14 μm and 366 ± 16 μm, respectively. Such a difference in the thicknesses of the as-sprayed coatings is attributed to the different particle sizes of the powder used since large particles might be unmelted and may not adhere well to the surface of the sample [25]. Amorphous phases are often found in Ni-based alloy coatings, which can influence their hardness and even mechanical properties [26,27]. Therefore, in order to eliminate the influence of the amorphous phase and elucidate the effect of the particle size on the properties of the as-sprayed NiCrBSi samples, the samples were annealed at 440 °C in a furnace for a short time (15 min). Then these annealed samples were used as references in the other examinations. The details of the process can be found in our previous work [26].

2.2. Characterizations

Before characterizations, samples were cut into 10 mm × 6 mm × 3 mm test pieces. All samples were ground using 100, 400, 800, 1000, 1500, 2000 grit SiC paper and polished to a mirror surface using a 1.5 micron polishing paste. The surface roughnesses for the as-sprayed 50–75C and 75–100C are 5.3 ± 0.4 μm and 6.9 ± 0.8 μm, respectively, and the polished samples have similar surface roughnesses of 0.23 ± 0.04 μm. Afterwards, some non-etched samples were used to examine the porosities and hardness, the etched samples were employed for microstructural characterizations. A mixed solution composed of 1 mL HCl, 10 mL HNO3 and 10 mL H2O was used as an etchant. An optical microscope (Axioskop2-MAT, Zeiss, Jena city, Germany) was used to observe the microstructures of the as-sprayed NiCrBSi coatings. The porosities of the as-sprayed NiCrBSi coatings were obtained by analyzing at least 15 optical images at 500× magnification using the Image J2X software (Rawak Software, Inc. Stuttgart, Germany). In binary images, pores are represented by a red color as shown in Figure 3. Then the porosity was obtained by calculating the percentage of the area of red color in the binary image in accordance with the ASTM Standard E2109-01. The surface roughnesses of the as-sprayed coatings were characterized by a laser scanning confocal microscope (OLS4000, Olympus, Tokyo, Japan). A scanning electron microscope (supra 55, Zeiss, Berlin, Germany) with energy dispersive spectroscopy (EDS) with an acceleration voltage of 5 kV was used to examine the powder, the surface and cross-sectional morphologies of the as-sprayed, annealed and electrochemically tested samples. In this work, the mapping scanning used 120 s and the dot scanning used 80 s. The microstructures of the as-sprayed coatings were also analyzed by transmission electron microscopy (JEM-2100F, Japan Electronics Co., Ltd, Tokyo, Japan). The specimens for transmission electron microscopy (TEM) characterization were chemically polished and thinned by using a twin jet polisher with a mixed solution composed of HClO4: C4H9OH: CH3OH = 6: 39: 55 (in vol.%) at a temperature of −30 °C. The Vickers hardness was measured by a KB30S automatic hardness tester (KB Prüftechnik GmbH, Hochdorf–Assenheim, Germany) on the cross-sectional surfaces of the polished as-sprayed NiCrBSi coatings, at 5 N load force and the dwell time of 15 s. The hardness reported for each coating were averaged from 10 individual points. The phase constituents of the powder, the as-sprayed and annealed NiCrBSi coatings were examined by X-ray diffraction (XRD, Empyrean, PANalytical, Heracles Almelo city, The Netherlands) using CoKα radiation with 2θ ranging from 40° to 100° at room temperature. The scanning speed was 2°/min and the scanning step was 0.02°. The Jade 6.0 software (Materials Data, Inc., Santa Clara, CA, USA)was used to identify the XRD patterns. For coatings, volume fractions of each phase were calculated using the Pearson VII function in the Origin software (OriginLab company, Northampton, MA, USA) according to the integrated peak areas of each phase on corresponding XRD patterns [28,29,30]. The equation used is shown below [28,29,30]:
V f , i = A i A i
where Vf, i is the volume fraction of a specific phase, Ai is the total integral area of this phase and ∑Ai is the total integral area for all phases detected on an XRD pattern.

2.3. Electrochemical Measurements

Electrochemical measurements include open circuit potential (OCP), potentiodynamic polarization and electrochemical impedance spectroscopy (EIS). Prior to electrochemical tests, the sample was sealed in epoxy attached to a copper wire, leaving an exposed surface area of 10 mm × 10 mm. The sample surfaces were mechanically ground and polished to a mirror surface. After cleaning the samples, the edges of the samples were sealed with silica gel. The electrochemical tests were carried out in 3.5 wt.% NaCl solution at 20 °C using an AUTOLAB-AUT86742 electrochemical station (Metrohm Autolab, Beijing, China) equipped with a conventional three-electrode system. A platinum sheet was used as the counter electrode, a saturated calomel electrode (SCE) acted as the reference electrode, and the surface of the samples served as the working electrode. The cathodic polarization of −1 V was conducted for 3 min before the other electrochemical measurements in order to remove the native oxide on the sample surface. OCP was measured for 3000 s for the as-sprayed NiCrBSi coating samples in 3.5 wt.% solution. EIS tests were potentiostatically conducted at the OCP with a potential perturbation amplitude of 10 mV. The impedance spectra presented were measured in the frequency range from 10−2 Hz to 105 Hz. All the EIS data were fitted using the ZsimpWin software (E-chem Inc., Ann Arbor, MI, USA). The scanning range of the potentiodynamic polarization tests was conducted at a range from open circuit potential −0.25 V to +2 V at a sweep rate of 2 mV/s. The Cview software (Scribner Associates Inc., Southern Pines, NC, USA) was applied to match the potentiodynamic polarization data. All the potentials reported in this work were against SCE. Both the cross-sectional and surface morphologies of the samples after electrochemical measurements were characterized by SEM. To ensure the accuracy and reproducibility of the results, electrochemical tests were performed on parallel samples under each condition at least three times. The electrochemical tests were only carried out on the as-sprayed coating because the primary objective of this work is to investigate the influence of powder size on the properties of the as-sprayed NiCrBSi coating.

3. Results and Discussion

3.1. Microstructural Features

The secondary electron images for surface morphologies of the as-sprayed 50–75C and 75–100C are shown in Figure 4. Both as-sprayed NiCrBSi coating samples have similar coating surface morphologies, which are relatively rough. The surface roughnesses of the as-sprayed 50–75C and 75–100C are 5.3 ± 0.4 μm and 6.9 ± 0.8 μm, respectively. Apparently, the deposited particles on the as-sprayed 75–100C are larger than those on the as-sprayed 50–75C. Meanwhile, pores, voids and partially melted particles are evident. Pores are formed by stacking of partially melted or unmelted particles. Voids are the non-bonded boundaries between particles. Therefore, such flaws would play an important role in hardness and corrosion [26,31,32].
Detailed optical images for the cross-sectional microstructures of the as-sprayed 50–75C and 75–100C are shown in Figure 5. The microstructures of the as-sprayed coatings display a typical lamellar structure, which is formed by interlacing and stacking of flat strip particles and spherical particles [33,34]. For the as-sprayed 50–75C, most particles are melted and the pores (as indicated by thin white arrows in Figure 5a are relatively small and dispersed. The average size is about 11.4 ± 8.4 μm. The as-sprayed 50–75C has the porosity of 2.0 ± 0.8%. Porosity is one of the important indicators for the properties of NiCrBSi coatings, which influences not only the hardness but also the other properties [35,36]. As seen from Figure 5b, unmelted particles (as indicated by the white hollow arrow) are clearly found in the as-sprayed 75–100C. The pores in the as-sprayed 75–100C are relatively larger (17.5 ± 10.2 μm) and concentrated. The porosity of the as-sprayed 75–100C is about 3.0 ± 1.6%, which is larger than that of the as-sprayed 50–75C (2.0 ± 0.8%). Such findings indicate that the as-sprayed NiCrBSi coatings prepared by different-sized particles demonstrate different melting degrees and porosities.
It is well known that amorphous phase is inevitably produced in the plasma sprayed NiCrBSi coatings [26,27]. Therefore, a short-time low-temperature annealing at 440 °C for 15 min was applied to exclude the influence of the amorphous phase on the properties of the as-sprayed NiCrBSi samples. As shown in Figure 6, it can be found that the phase constituents of the as-sprayed and annealed coating samples together with the powder used mainly consist of Ni, Ni3B, Cr7C3, Cr3C2 and CrB phases. The main phases are identified by the JCPDS-cards to the XRD database. However, a broad diffuse diffraction maximum from 50° to 60° is observed for both as-sprayed 50–75C and as-sprayed 75–100C, specifying the existence of the amorphous phase [37]. This phenomenon is consistent with the results in our previous work and the literature [1,38,39]. The amorphous phase in the as-sprayed NiCrBSi coatings is formed by fast cooling of the melted particles or partially melted particles [1]. It has been reported that the solidification time for these particles may be less than 10−6 s [22]. According to the Equation (1), the volume fractions of the phases (including amorphous phase) in the as-sprayed NiCrBSi coatings can be calculated and the results are listed in Table 3. Apparently, the volume fraction of amorphous phase in the as-sprayed 50–75C (15.5 vol.%) is about two times that in the as-sprayed 75–100C (8.7 vol.%), illustrating that the melting degree of in-flight particles is higher for the as-sprayed 50–75C than that for the as-sprayed 75–100C. Compared with the as-sprayed samples, the annealed samples have significantly higher volume fractions of Ni and Ni3B in the microstructure. This change indicates the transformation of the amorphous phase to crystallized phases in the NiCrBSi coatings after heat treatment.
TEM examinations were further used to confirm the existence of the amorphous phases in both as-sprayed coating samples (Figure 7). As shown in Figure 7a, amorphous phase is apparently presented in the as-sprayed 50–75C. A clear amorphous ring indicates that amorphous phases are dominated in the analyzed location (Figure 7a inset). Amorphous phases are also found in the as-sprayed 75–100C in some locations associated with some nanoclusters (Figure 7b). Such nanoclusters were also found in the our previous work [1,24]. According to the polycrystalline diffraction rings, the separate point reflections may be the nanocrystalline of Ni and the precipitates of Ni3B and CrB. Irrespective of the reason for the formation of nanoclusters, these results elucidate the existence of the amorphous phases in both as-sprayed samples, which are consistent with the XRD results (Figure 6).
Figure 8 compares the cross-sectional morphologies of the as-sprayed and annealed NiCrBSi coatings by SEM under secondary electron mode. As shown in Figure 8a, apparent pores and intersplat-boundaries are observed in the as-sprayed 50–75C. However, the annealed 50–75C has the similar morphology to the as-sprayed 50–75C (Figure 8b). The pores and intersplat-boundaries are still clearly observed in the annealed 50-75C. A similar scenario is presented in the as-sprayed and annealed 75–100C (Figure 8c,d). Such results show the neglected effect of the heat treatment of 440 °C on the sintering of pores and the bonding of the intersplat-boundaries.

3.2. Hardness

The hardness of the as-sprayed and annealed coating samples is shown in Figure 9. The as-sprayed 50–75C and 75–100C exhibited average hardness of 700 ± 41 HV0.5 and 760 ± 74 HV0.5, respectively. Apparently, the 75–100C has higher hardness than the 50–75C. Generally, higher porosity can result in a lower hardness of the as-sprayed NiCrBSi coating [33]. As shown earlier, the 75–100C exhibits higher porosity of (3 ± 1.6%) than the 50−75C (2 ± 0.8%). After heat treatment, the hardness of both coating samples is enhanced. The average hardness of the annealed 50–75C is 850 ± 111 HV0.5, which is higher than the average hardness of 75–100C (800 ± 82 HV0.5). It is well known that the properties of the NiCrBSi coatings can be influenced by the difference in the compositions of the powder, the preparation methods, and even the different parameters used in a specific technique. In previous studies, the hardness of the NiCrBSi is in the range from 450 HV to 1100 HV [40,41,42,43,44,45]. For example, Liu et al. [40] found the hardness of NiCrBSi coatings deposited by an activated combustion-high velocity air fuel spray process was up to 1085 HV. Dong et al. [42] investigated the hardness of deposition of NiCrBSi coatings by APS is about 450 HV. In this work, the hardness of the as-sprayed and annealed NiCrBSi coatings ranged from 660 HV to 960 HV is in the scope of the reported results. According to our previous work [1], the increase in the hardness of the annealed samples results from the transformation of the amorphous phase to crystal phase (precipitation). In metallic materials, amorphous phase is in a metastable state [39,46,47] and the crystallization of amorphous phase would take place once external energy is high enough to trigger the crystallization (i.e., transformation from a meta-stable state to a stable state) [48,49,50,51]. Short-time heat treatment can provide external energy, thereby leading to the transformation of the amorphous phase to the crystalline phase(s) [1,52]. The precipitation of hard phases (e.g., Ni3B) increases the hardness of the annealed NiCrBSi coatings. Therefore, after heat treatment at 440 °C for 15 min, the amorphous phases in both NiCrBSi coating samples are eliminated (Figure 6). The porosities of heat-treated samples have no obvious change compared with those of the as-sprayed samples. The porosity of 50–75C was 2.1 ± 0.7%. The porosity of 75–100C sprayed was about 2.9 ± 1.3%. As a result, the annealed 50–75C with lower porosity exhibits higher hardness compared to the annealed 75–100C. Such a finding illustrates that the NiCrBSi coating prepared by smaller particles possesses higher volume fraction of the amorphous phase. As such, combining the results of the microstructures and phase constituents of the as-sprayed and annealed samples, one can basically conclude that the particle size influences the volume fraction of the amorphous phase in the as-sprayed NiCrBSi coatings and therefore their hardness.

3.3. Electrochemical Results

The thickness of the coating can substantially influence the corrosion properties of the sample to some extent. In general, a specific coating with larger thickness can exhibit lower corrosion rate due to the longer diffusion path for corrosive medium [53,54]. As mentioned earlier, the as-sprayed 50–75C coating has a larger thickness than the as-sprayed 75–100C after deposition, which is also a result of different-sized powder used. Therefore, the electrochemical samples were carefully ground and polished in order to ensure that the reductions in the thicknesses are comparative. As a result, the coating thickness of the as-sprayed 50−75C is still larger than that of the as-sprayed 75–100C in electrochemical tests. In addition, the surface roughnesses of the polished as-sprayed 50-75C and 75–100C become 0.23 ± 0.04 μm and 0.24 ± 0.05 μm, respectively, which are almost same. Therefore, it can be considered that the surface roughness has little influence on the electrochemical corrosion behavior of the samples used.
Figure 10 shows the OCP curves for the as-sprayed 50–75C and 75–100C immersed in 3.5 wt.% NaCl solution for 3000 s. The electrode potential substantially reflects the surface state of the metal in the solution medium. It is evident that both groups of samples exhibit the same anodic process due to the formation of a passivation film [55]. The final stabilized potential for the as-sprayed 75–100C (−220 V) is slightly higher than that of the as-sprayed 50–75C (−227 V). Figure 11 shows the polarization curves of the as-sprayed 50–75C and 75–100C samples in 3.5 wt.% NaCl solution. Both samples possess similar polarization behavior, exhibiting a typical anode passivation characterization [56]. The as-sprayed 50–75C exhibits an incomplete pre-passivation behavior, indicating a dissolution behavior at a relatively low polarization potential. In the Figure 11a, the complete passivation potential of the as-sprayed 75–100C (900 mV) is slightly higher than that of the as-sprayed 50–75C (780 mV), while their passivation current densities are similar (0.06 A/cm2). Figure 11b shows the Tafel regions of the polarization curves for both samples. The fitting results for the corrosion current density (Icorr) and corrosion potential (Ecorr) are listed in Table 4. The low values in standard error (90% confidence interval) indicate a good reliability of the fitted data. The as-sprayed 75–100C has a lower Icorr than the as-sprayed 50-75C, indicating that the corrosion rate of the as-sprayed 75–100C is lower under the conditions used in this work. By contrast, the as-sprayed 50–75C reveals a lower Ecorr than the as-sprayed 75–100C (Figure 11b). Based on the analyses of polarization curves, one can conclude that the as-sprayed 75–100C has a lower corrosion rate than the as-sprayed 50–75C.
The EIS results are indicated in Figure 12. The radius of the capacitance arc in the Nyquist plot (Figure 12a) is related to the ability of ions in the solution to reach the surface of the metal electrode through oxide film [57,58]. In general, a larger capacitance arc radius indicates greater charge transfer resistance and therefore better corrosion resistance of a sample [59]. The Bode plots show a wide plateau from high frequency to low frequency. In the Bode impedance plots (Figure 12b), there is no significant difference between the two samples. The impedance of the as-sprayed 50–75C at high-frequency is slightly higher than that of 75–100C and only has a slight deviation in the low-frequency region. For Bode phase plots (Figure 12c), both as-sprayed 50–75C and 75–100C exhibit phase angles between 50–70° in the middle-frequency region, indicating a typical resistant-capacitive behavior. The equivalent circuit diagram shown in Figure 12d is used for analyzing the electrochemical behavior of both samples. The equivalent circuit (Rs(C(Rf(Q(RctW))))) model consists of solution resistance (Rs), charge transfer resistance (Rct), film resistance (Rf), capacity element (C), Warburg impedance (W) and constant phase elements (CPE). Since there are a lot of non-bonded boundaries and pores in the as-sprayed coating, the diffusion-controlled nature of corrosion reactions needed to be considered. Therefore, the Warburg impedance (W) is employed to describe the semi-infinite length diffusion in the as-sprayed coatings [60]. Meanwhile, inner surfaces (such as pores and non-bonded boundaries) in the as-sprayed coating can lead to capacitive properies. Hence, a capacity element (C) is used.
The fitted EIS results are summarized in Table 5. The fitted EIS results in Table 5 have a 90% confidence interval and the error margins are in the range of 1.7 ~ 3.1%.
Chi-square values (χ2) between 2.91 × 10⁻⁴ and 9.57 × 10⁻⁴ suggest a good correlation between the fitting data and experimental data. The values of Rs and Rf for both samples are significantly similar; however, the difference in the Rct is noted. The values of Rct of the as-sprayed 50–75C and the as-sprayed 75–100C are 0.37 MΩ cm2 and 0.50 MΩ cm2, respectively. The Rct of the as-sprayed 75–100C is much higher than that of the as-sprayed 50–75C. As mentioned above, a larger number of non-bonded boundaries are formed in the as-sprayed 50–75C due to the smaller-sized powder used, which provides more paths for the ingression of corrosive medium. In a corrosive environment, the corrosive medium is easier to ingress the interior of the as-sprayed NiCrBSi coating through the non-bonded boundaries compared with the inner of the particles. Therefore, the presence of a larger number of non-bonded boundaries leads to a faster ingression of corrosive medium. It is worth noting that Rct is 5 orders of magnitude greater than Rf for both samples, as shown in Table 5. Therefore, the small Rf does not significantly affect the final polarization resistances Rp (i.e., the sum of Rct and Rf). The as-sprayed 75–100C shows higher final polarization resistance, indicating a lower corrosion rate compared with 50–75C.

3.4. Morphologies of the As-Sprayed Samples after Electrochemical Tests

Figure 13 shows the surfaces of the as-sprayed 50–75C and 75–100C and their corresponding elemental mapping analysis by SEM under secondary electron mode. Both samples have similar corrosion patterns after electrochemical tests in 3.5 wt.% NaCl solution (Figure 13a,d). Elemental Na and Cl are distributed at the edge of pores and non-bonded boundaries, specifying that these locations provide diffusion paths for corrosive medium (Figure 13b–f). The cross-sectional microstructures of the samples after electrochemical tests are shown in Figure 14 by SEM under secondary electron mode. Similar phenomena can be observed for both samples. EDS results for points A, B, C and D indicated in Figure 14a,b are listed in Table 6. Note that, points B and D are located at the pores in the as-sprayed 50–75C and 75–100C, respectively. It is found that a considerable amount of Na and Cl is present at the points of B and D, indicating that Na and Cl penetrate the pores far away from the surfaces of the samples. Points of A and C are located at the interior of the particles. Their EDS results show that the fractions of Na and Cl are significantly less at the points A and C than those at the points B and D. Combined with the morphologies of the as-sprayed 50–75C and 75–100C after electrochemical tests (Figure 13 and Figure 14), one can speculate that corrosion is prone to take place at the locations of flaws (such as pores and non-bonded boundaries). The reason accounting for these findings is the penetration of the corrosive medium along the non-bonded boundaries [61,62,63]. Finally, corrosive medium concentrates at the pores. Therefore, the contents of Na and Cl in the pores are apparently higher than those in the interior of the particles.

3.5. Mechanism for Particle Size Induced Distinctions

Figure 15 illustrates the mechanism for the distinctions in the properties of the NiCrBSi coatings prepared by different-sized powder. One interesting aspect is the hardness of both NiCrBSi coatings before and after heat treatment (Figure 9). Before heat treatment, the hardness of the as-sprayed 50–75C is 700 ± 41 HV0.5, which is lower than that of the as-sprayed 75–100C (760 ± 74 HV0.5). Nevertheless, the values of hardness for the two coatings vary after short-time heat treatment; the as-sprayed 50–75C (850 ± 111 HV0.5) shows higher hardness than the as-sprayed 75–100C (800 ± 82 HV0.5). The volume fraction of the amorphous phase is closely related to the melting degree and deposition state of particles. The outer surfaces of the in-flight particles are firstly melted in plasma arc during spraying [21]. Therefore, the more the surfaces of the particles in contact with plasma arc is, the higher the melting degree is. As such, the melting degrees are different for in-flight particles with different sizes (Figure 13). The melted particles (or the melted part in the partially melted particles) produce the amorphous phase in the as-sprayed NiCrBSi coatings [1]. In metallic materials, heat treatment can provide the activation energy required to induce the crystallization of amorphous phases, leading to nucleation and growth of new crystalline phase grains [64,65,66,67]. Hence, the heat-treated NiCrBSi coating is strengthened by the precipitates of hard phases (e.g., Ni3B) and uniformly distributed nanocrystals embedded in the amorphous phase [1]. Therefore, different melting degrees of the in-flight particles result in the different fractions of the amorphous phases in the as-sprayed 50–75C and 75–100C. In this work, 50–75P has a smaller average size, therefore, larger total powder surface is in contact with the plasma arc compared with the 75–100P at the same powder feed rate (Table 2 and Figure 13). Hence, after spraying, the fraction of the amorphous phase in the as-sprayed 50–75C (15.5 vol.%) is higher than that in the as-sprayed 75–100C (8.7 vol.%), as indicated in Table 3. As a result, the as-sprayed 50–75C exhibits a lower hardness than the as-sprayed 75–100C even though the as-sprayed 50–75C has a lower porosity than the as-sprayed 75–100C. After heat-treated at 440 °C for eliminating the amorphous phase in the coating samples, the annealed 50–75C exhibits higher hardness than the annealed 75–100C, which is different from the results before heat treatment (Figure 9). Therefore, porosity becomes the main factor that affects the hardness of the annealed NiCrBSi coating. The annealed 50–75C possesses lower porosity, thereby having higher hardness.
In general, high porosity definitely results in poor corrosion resistance for many porous materials [56,68]. Therefore, the outcomes of electrochemical tests seem to be contrary to the traditional consideration. However, it should be understood that the corrosive medium is prone to ingress into the interior of material through the non-bonded boundaries in a corrosive environment, thereby degrading their corrosion resistance [69,70,71]. As shown in Figure 15, when particles strike the substrate to form a coating, the morphologies of the as-sprayed NiCrBSi coatings are still different due to the different particle sizes. Non-bonded boundaries are formed between particles and lamellae, as indicated by the black lines in Figure 15. Meanwhile, the pores are formed by the loose stacking between the unmelted part of the in-flight particles (or unmelted particles), as indicated by black color in Figure 15. Therefore, all pores are connected with the non-bonded boundaries but not directly contact with the surface of the coating. In such a case, if the narrow non-bonded boundaries determine the travelling speed of corrosive medium from the corrosive environment to the inner of the coating (pores). The pores can be considered as the “reservoir”, receiving the corrosive medium from the non-bonded boundaries. Therefore, the number of the non-bonded boundaries have a more influence on the corrosion resistance of the as-sprayed NiCrBSi coatings. As mentioned above, the EDS results reveal Na and Cl concentrated in the pores but not in the interior of the particles at a certain distance from the surface of the as-sprayed coatings after the electrochemical tests (Figure 14 and Table 6), indicating that the non-bonded boundaries substantially facilitate penetration of the corrosion medium. On the other hand, it is found that the crystalline and amorphous Ni-based alloys show no significant difference in corrosion resistance [72]. Meanwhile, the volume fractions of the amorphous phases in the as-sprayed samples are low (Table 3). As a result, the influence of the amorphous phase on the corrosion resistance of the as-sprayed coatings is not evident. By contrast, the cracks or through-pores are catastrophic flaws for the corrosion resistance of the metallic materials. As such, the influence of the non-bonded boundaries on the corrosion resistance of the coatings are dominant. As shown in Figure 15, a larger number of non-bonded boundaries are presented in the as-sprayed 50–75C due to the smaller sized particles used. More non-bonded boundaries provide more paths for the penetration of corrosive medium, leading to an easier corrosion of the as-sprayed 50–75C. Therefore, it can be found that the as-sprayed 75–100C exhibits a slightly better corrosion resistance than the as-sprayed 50–75C.

4. Conclusions

In this work, two groups of NiCrBSi powders with different size ranges of 50–75 μm and 75–100 μm were used as the feedstock to prepare coatings by atmospheric plasma spraying, with the aim to investigate the particle size-induced distinctions. Based on investigations on the microstructures, phase constituents, hardness and electrochemical corrosion behavior of the samples, the following main conclusions can be drawn:
(1)
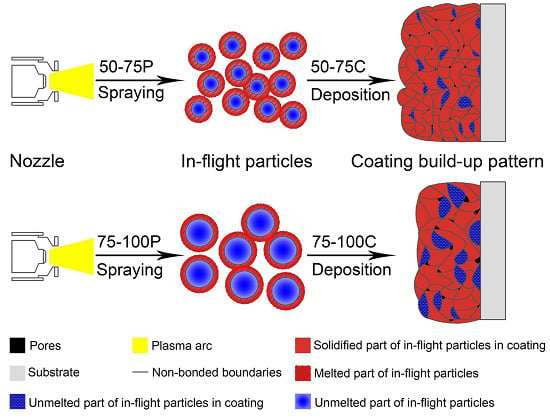
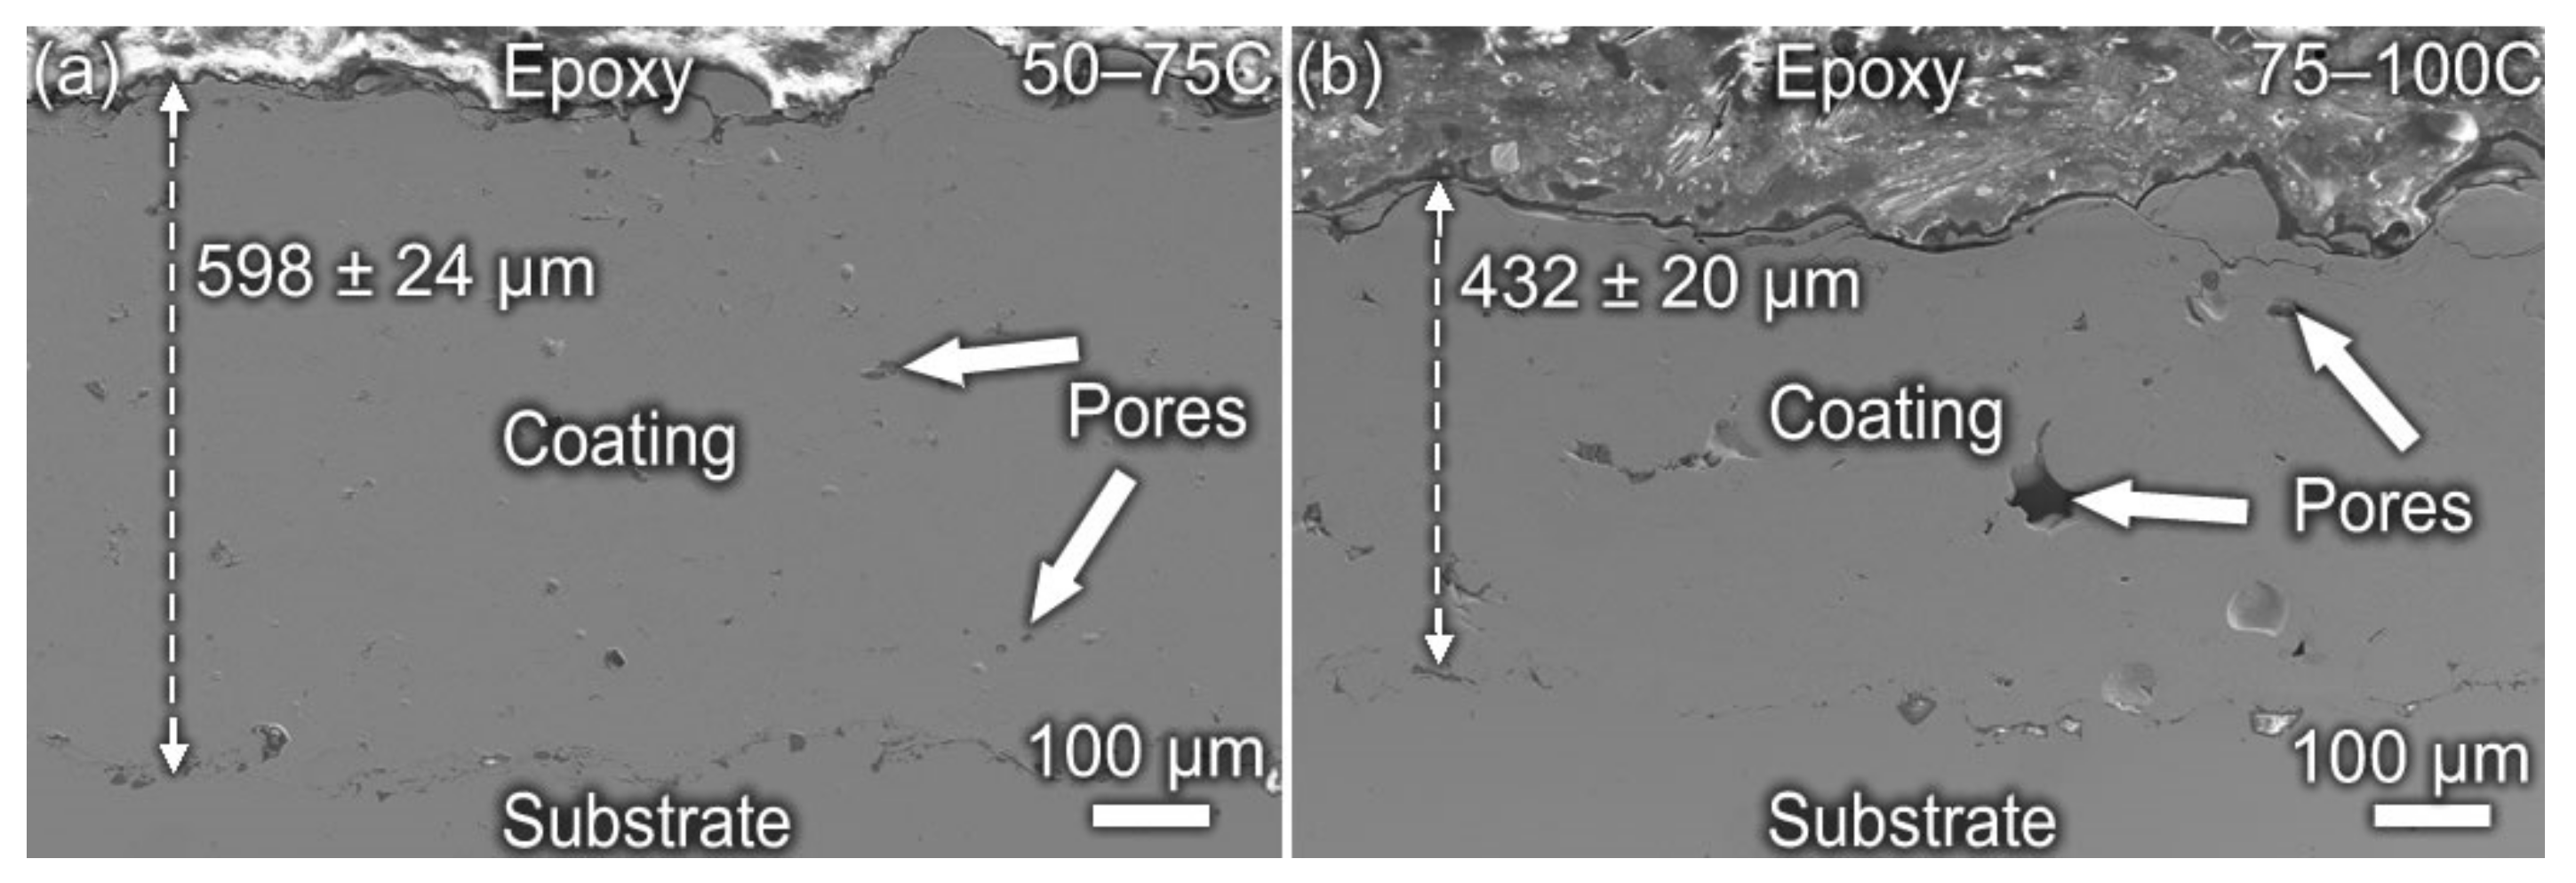
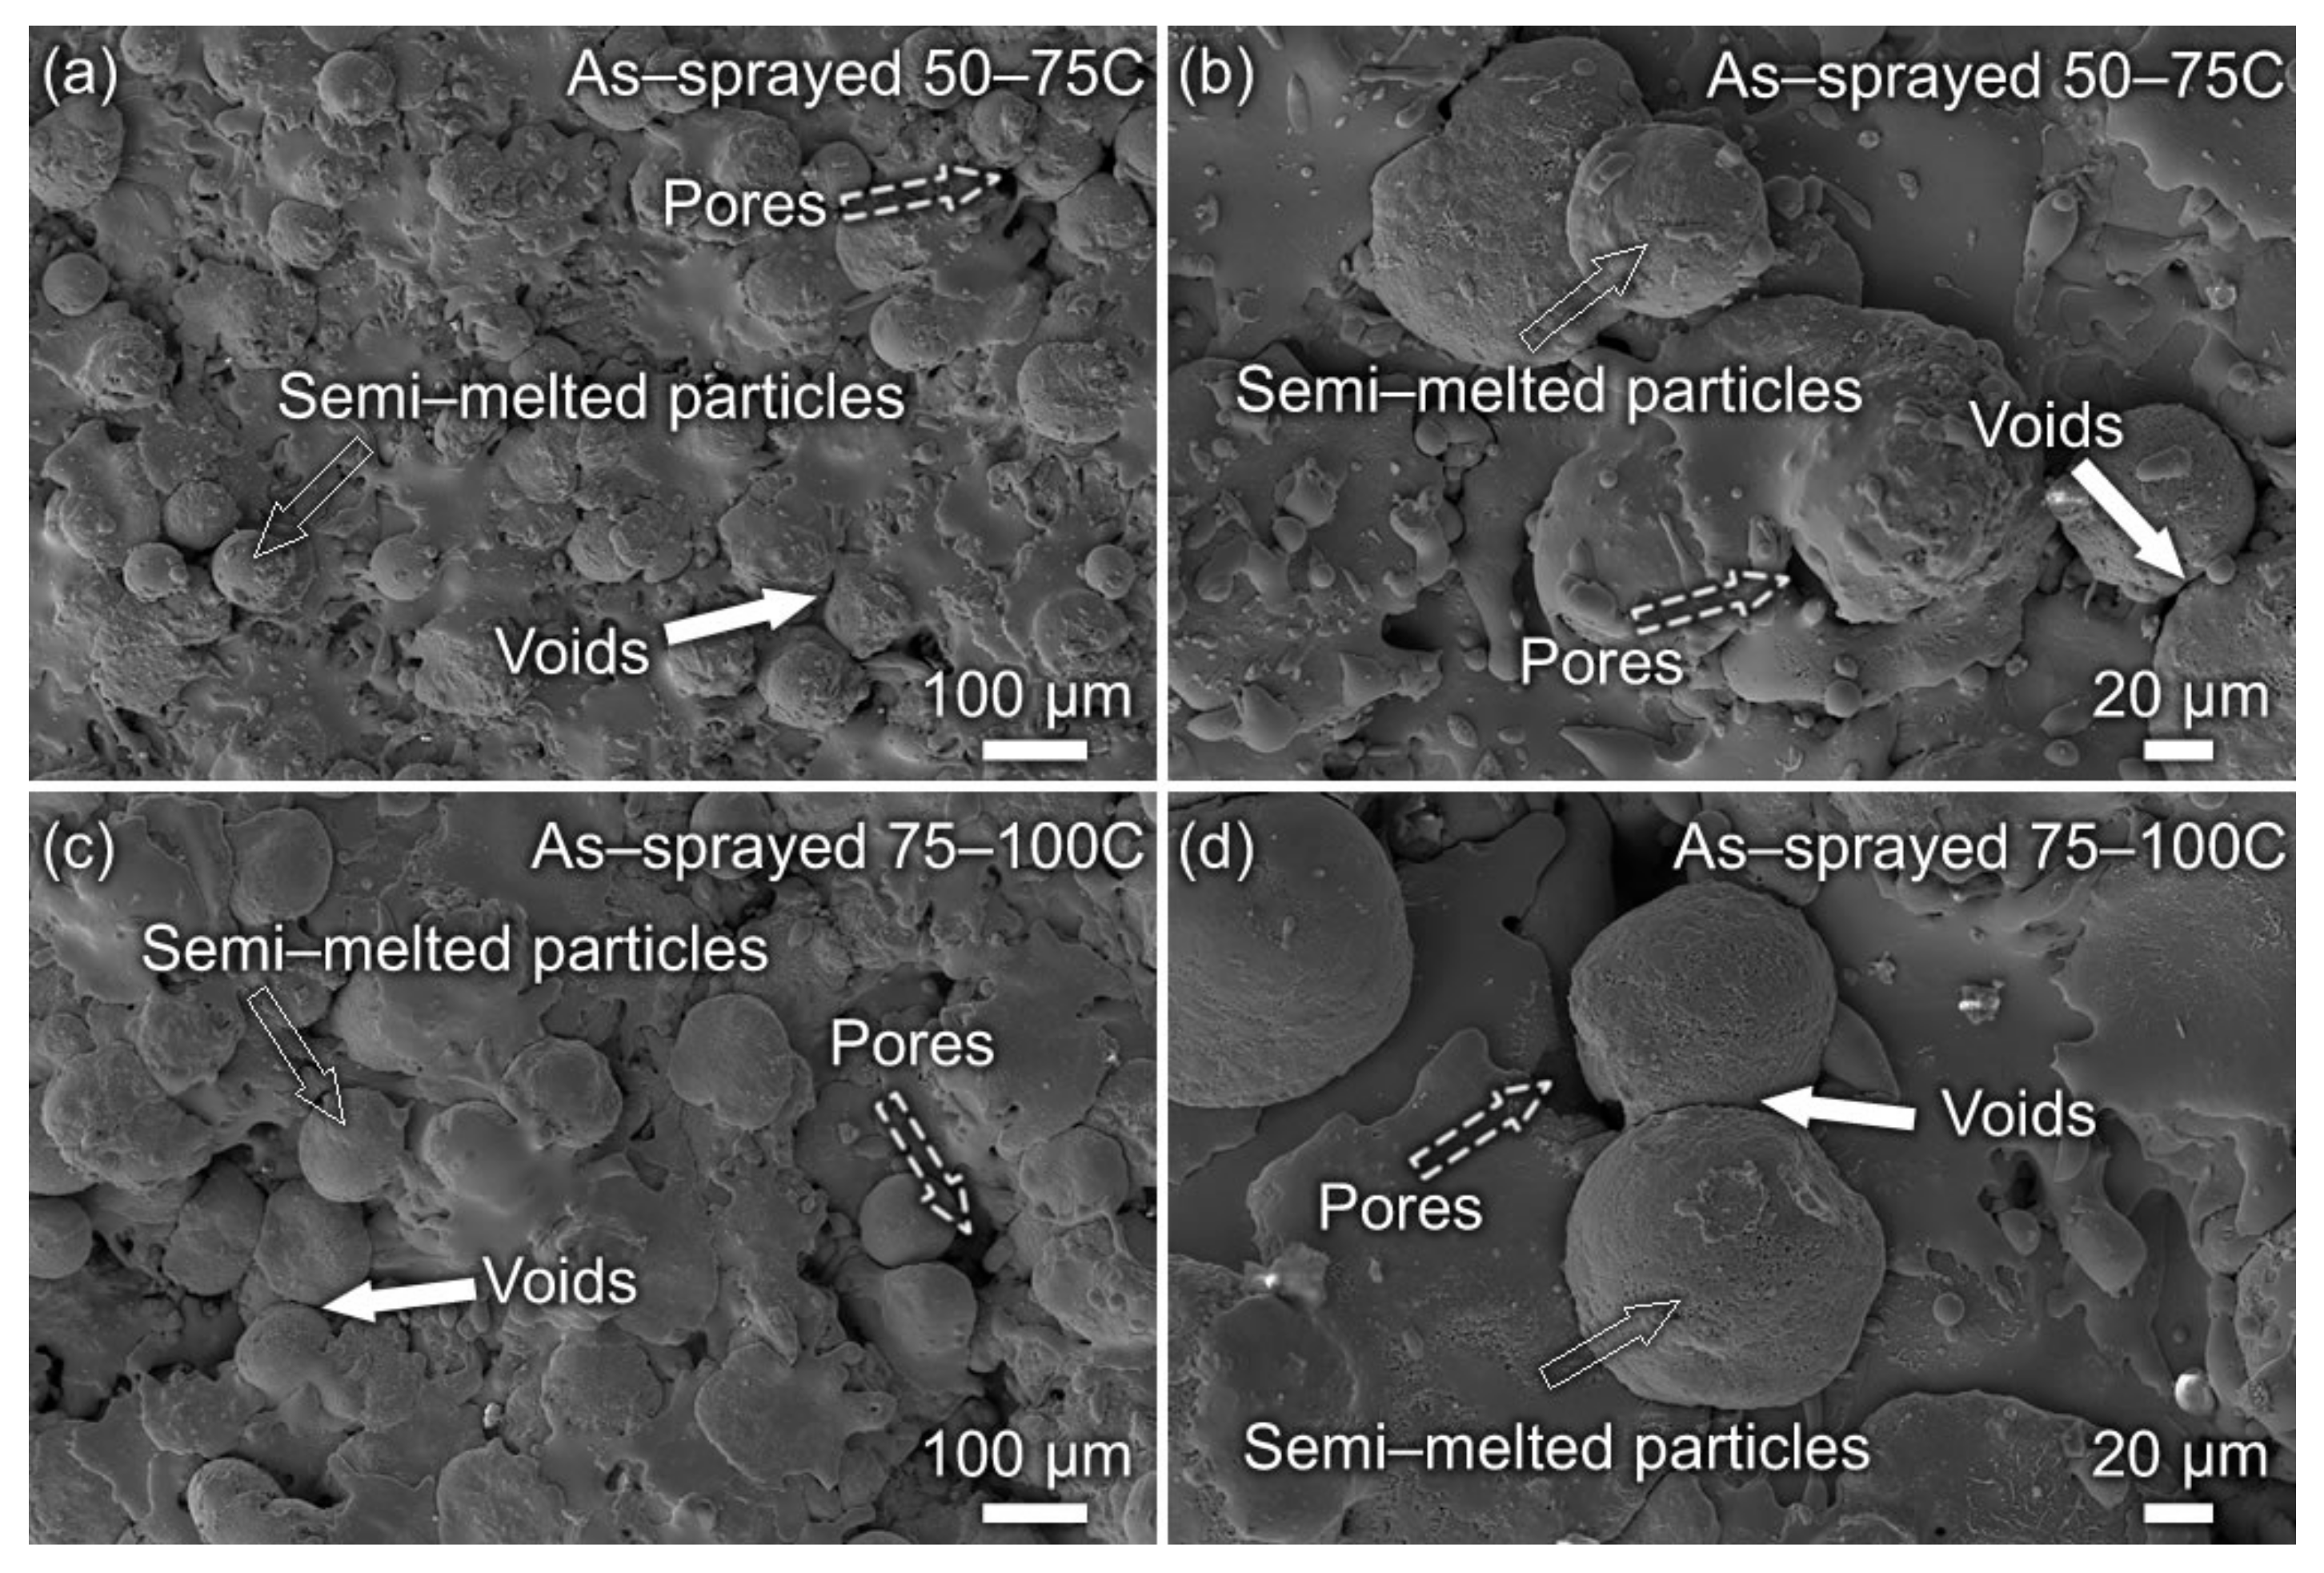
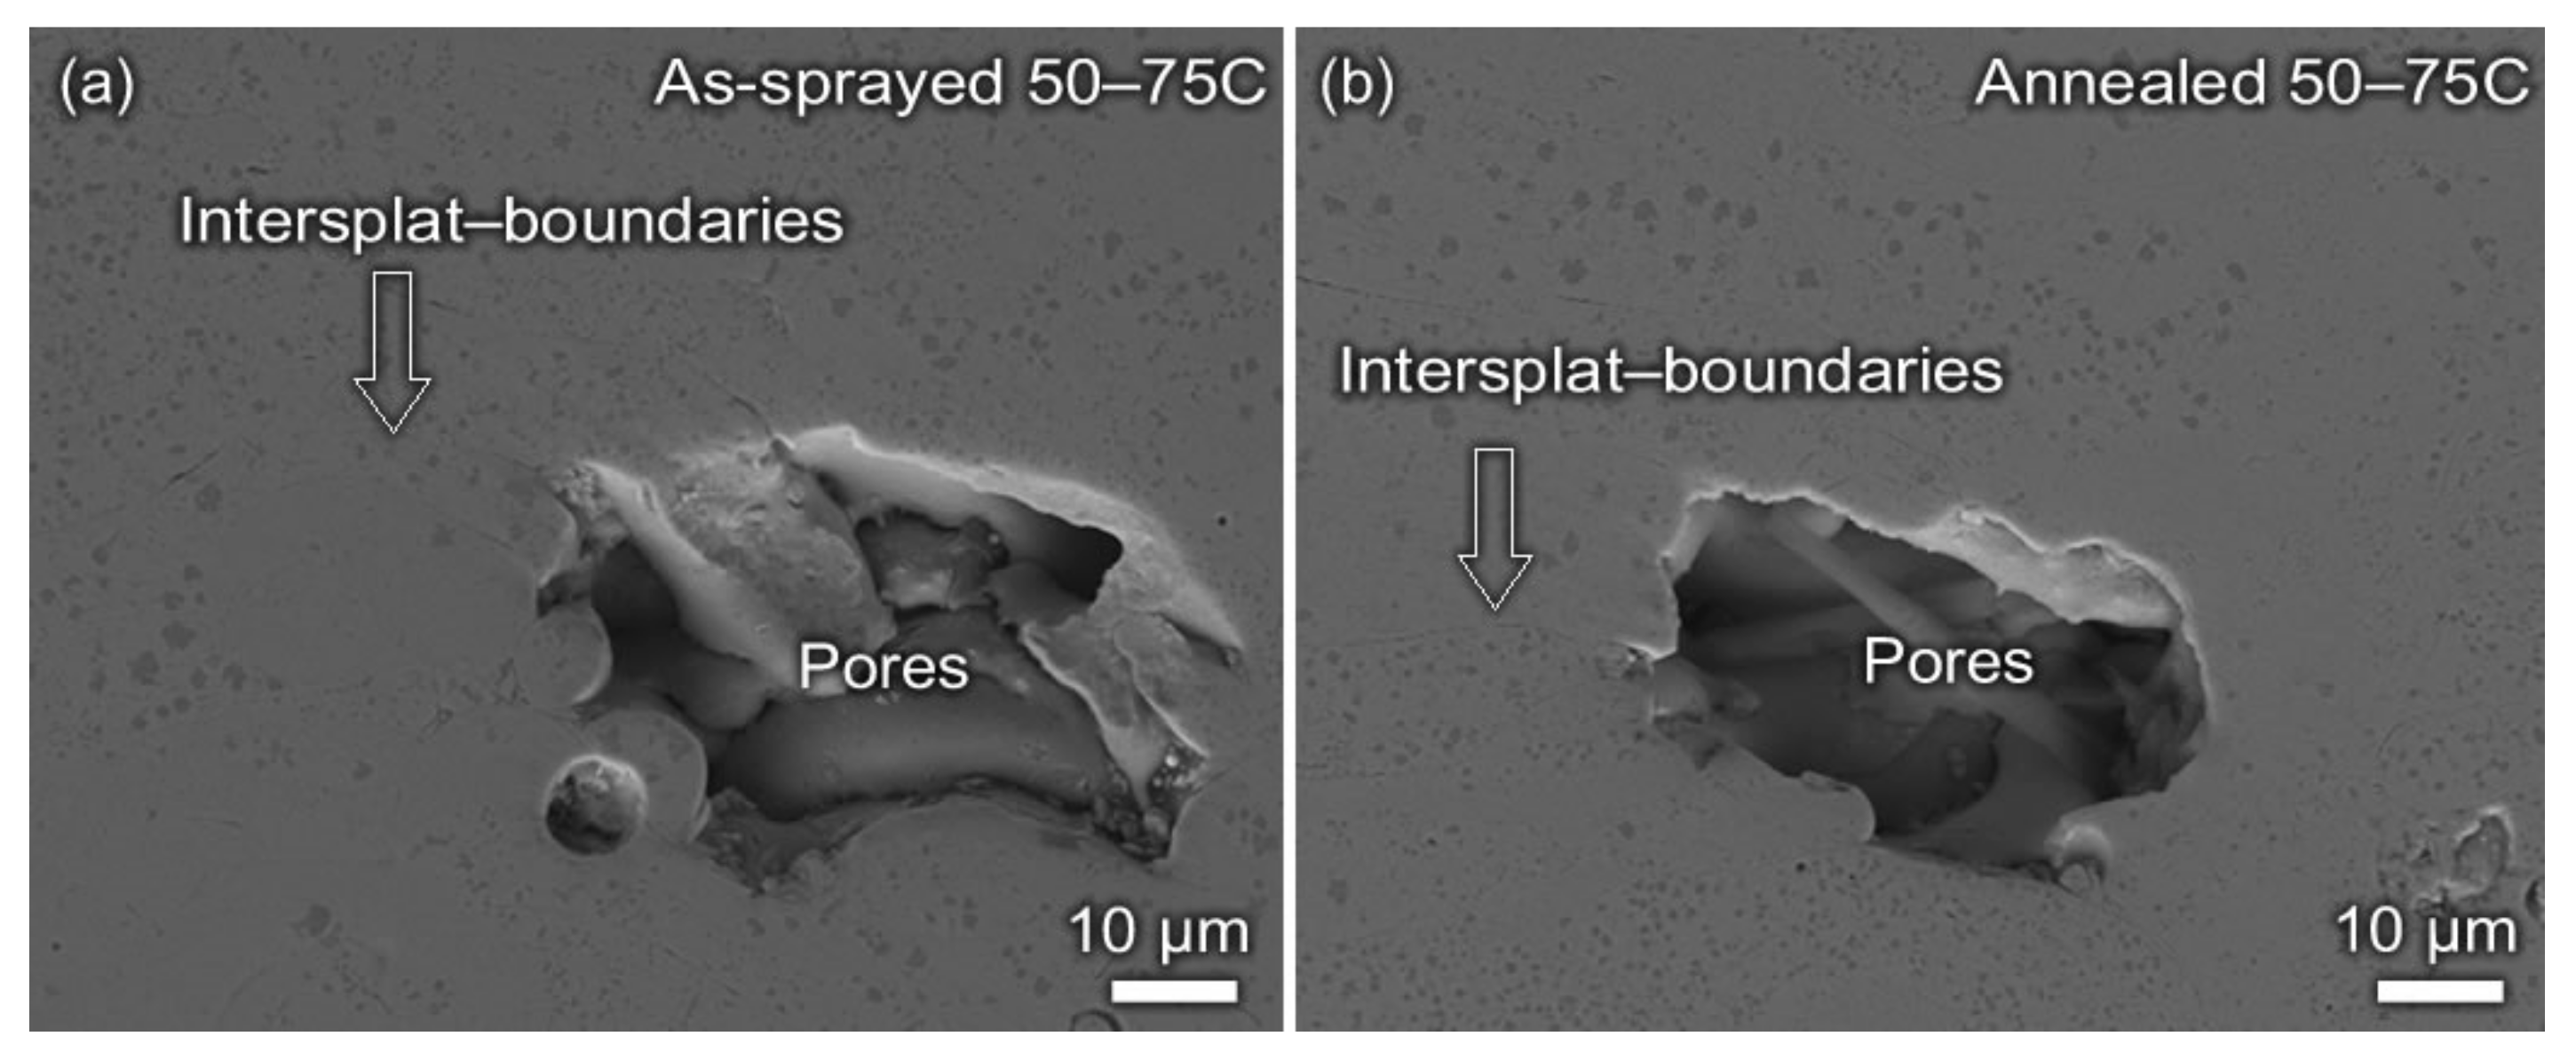
The use of powders with different sizes results in distinctive microstructures, including porosities, the volume fractions of amorphous phases and the number of non-bonded boundaries. The as-sprayed NiCrBSi coatings prepared from the powder with sizes of 50–75 μm (denoted as 50–75C) and 75–100 μm (denoted as 75–100C) exhibits different porosities (2.0 ± 0.8% for 50–75C and 3.0 ± 1.6% for 75–100C, respectively). The as-sprayed 50–75C has a lower hardness (700 ± 41 HV0.5) than the as-sprayed 75–100C (760 ± 74 HV0.5) in spite of the lower porosity. This is attributed to the larger volume fraction of the amorphous phase (15.5%) in the as-sprayed 50–75C compared with that of the counterpart (8.7%), which results from the higher melting degree of small in-flight particles. After eliminating the amorphous phase in the coatings by heat treatment, the porosity becomes the main factor that affects the hardness of the annealed NiCrBSi coatings. Hence, the annealed 50–75C shows a higher hardness (850 ± 111 HV0.5) than the annealed 75–100C (800 ± 82 HV0.5).
(2)
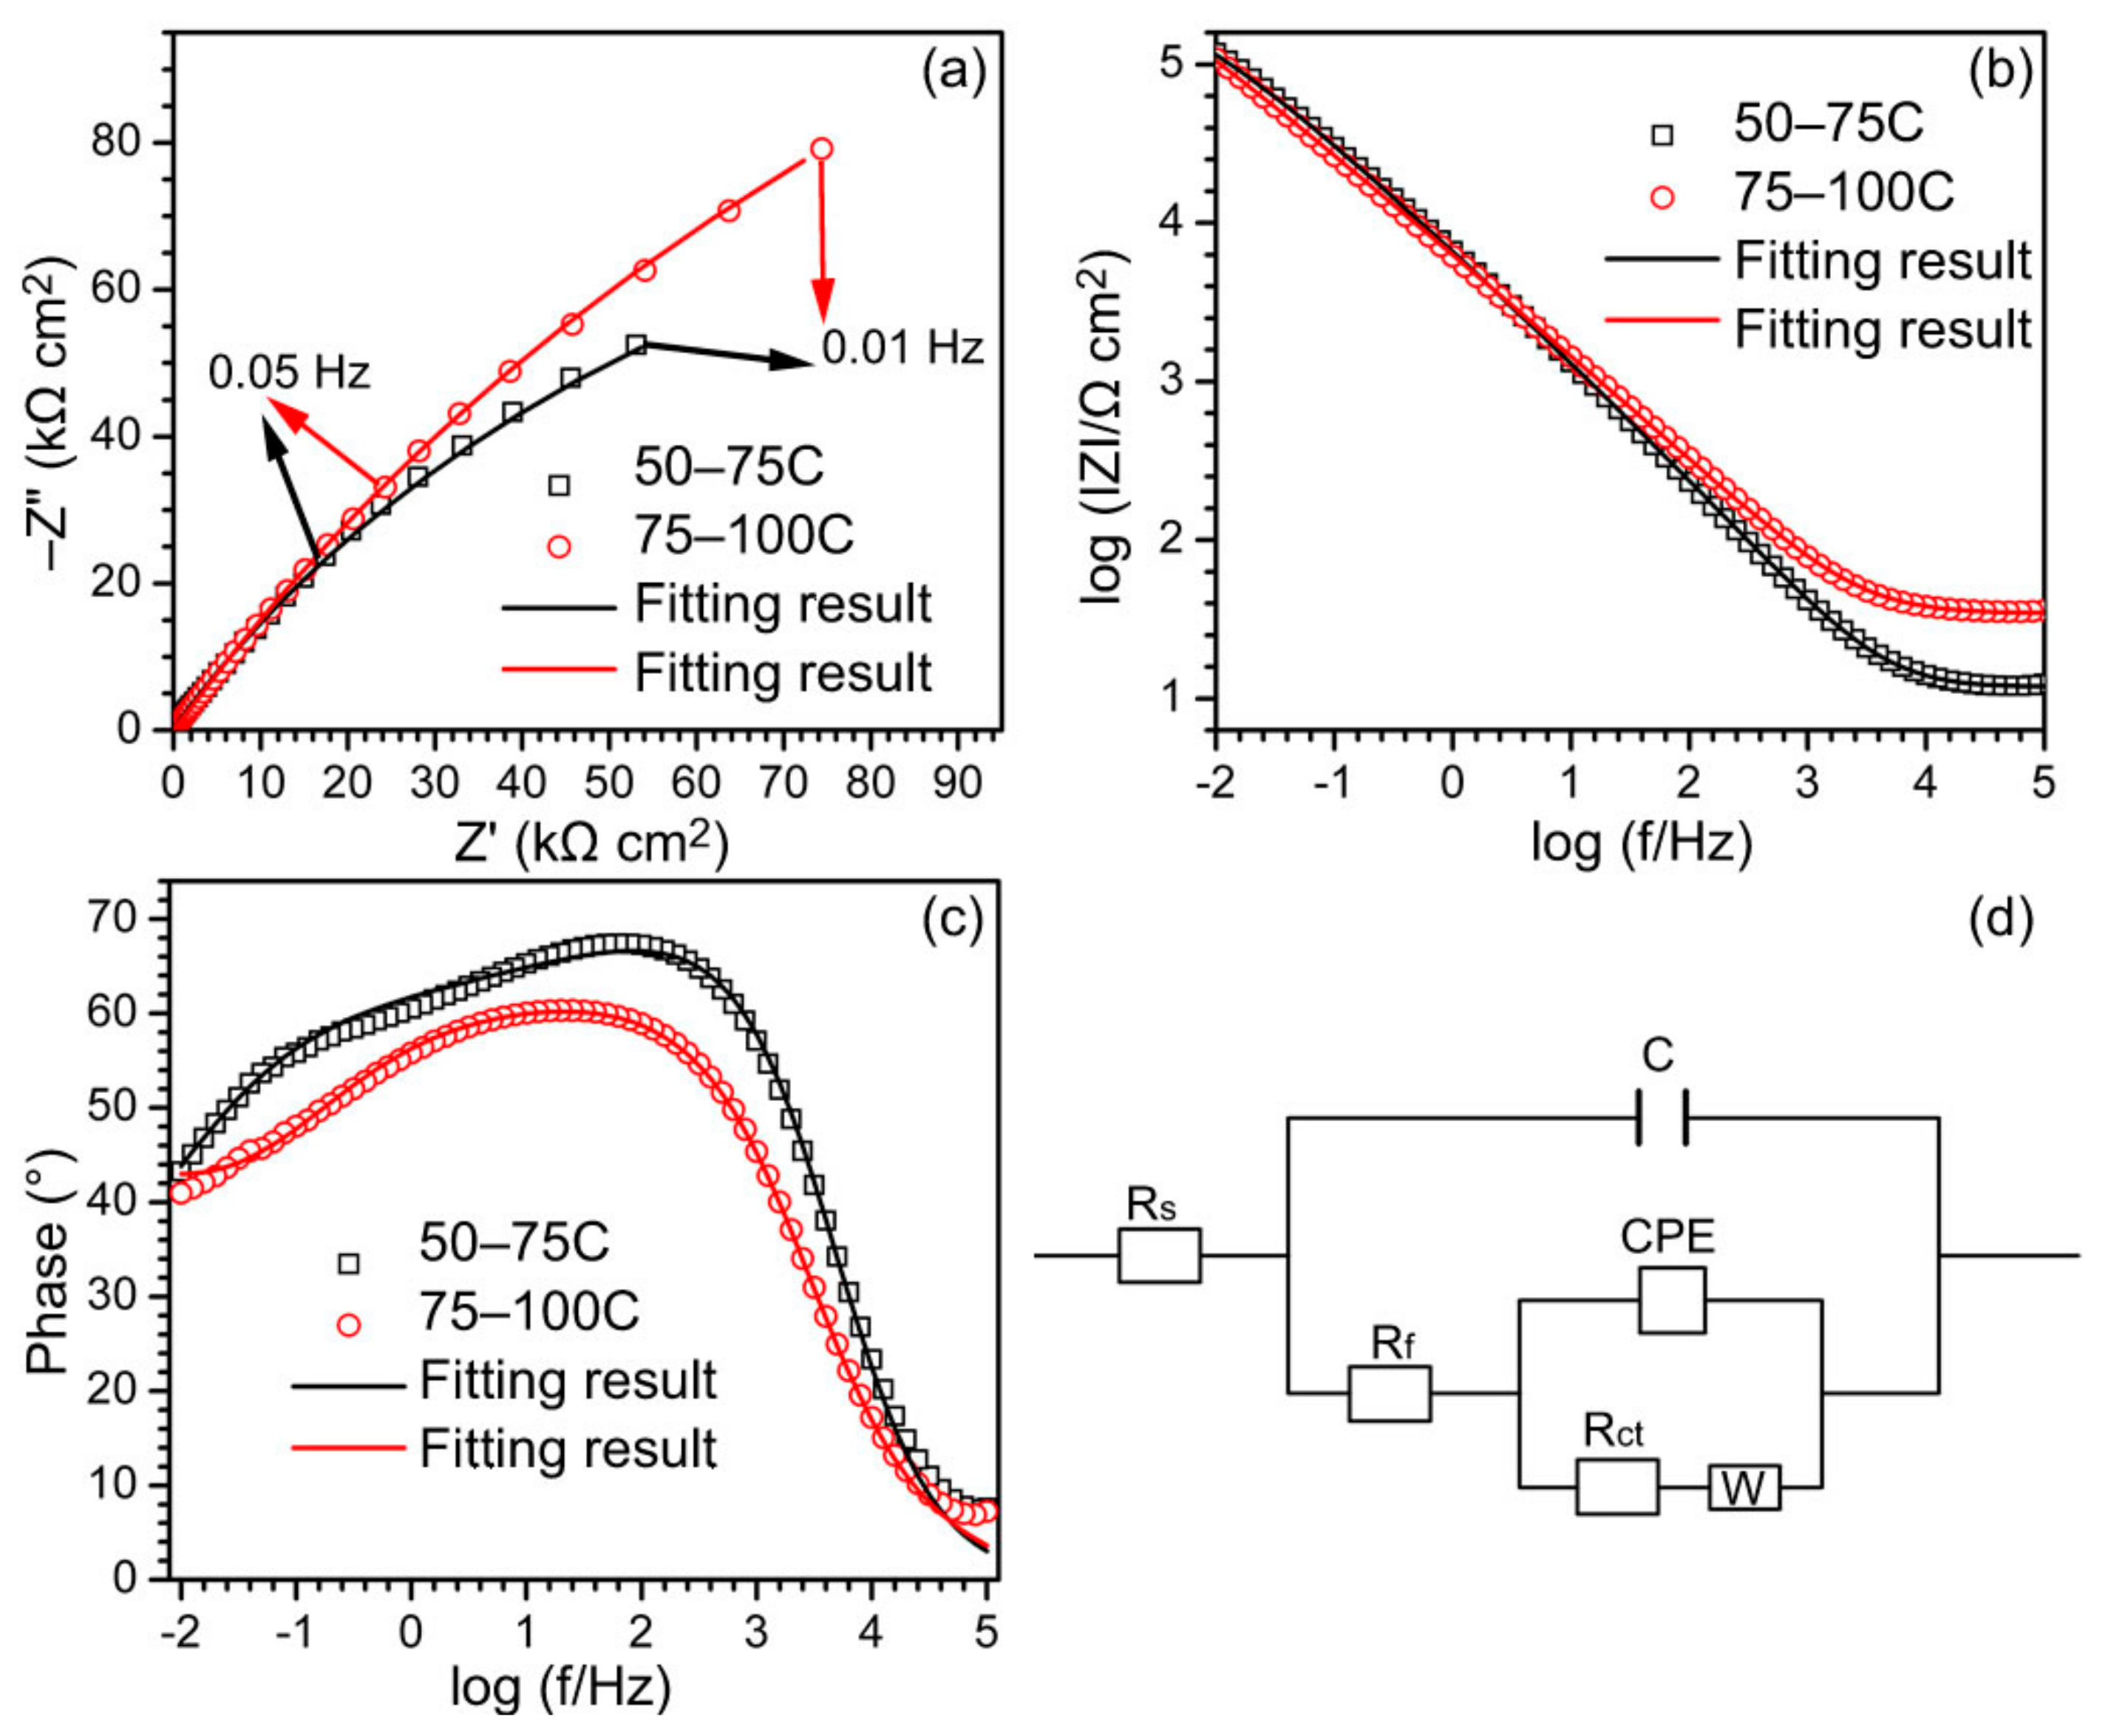
Due to the smaller powder used, a greater number of non-bonded boundaries are present in the as-sprayed 50–75C, leading to the easier penetration of corrosive media. Therefore, the as-sprayed 50–75C has higher corrosion current density (0.254 ± 0.062 μA/cm2) than the as-sprayed 75–100C (0.189 ± 0.069 μA/cm2). Correspondingly, the charge transfer resistance of the as-sprayed 50–75C (0.37 ± 0.07 MΩ cm2) is also lower than that of the as-sprayed 75–100C (0.50 ± 0.07 MΩ cm2).
(3)
The distinctions in the properties of both as-sprayed NiCrBSi coating samples mainly result from using different-sized powders. The same weight of powder would possess a larger total surface area due to the smaller size. Small in-flight particles are prone to be melted in the plasma arc and therefore the 50–75C show a larger volume fraction of the amorphous phase because of the fast solidification on the surface of the substrate. Meanwhile, owing to the limited diffusion between deposited particles, smaller particles also result in a greater number of non-bonded boundaries in the as-sprayed 50–75C, thereby degrading its corrosion resistance.

Author Contributions

Conceptualization: P.S., L.-Y.C. and L.-C.Z.; methodology: S.L.; software: C.Z., H.W. and Z.-X.W.; formal analysis: L.-Y.C. and C.Z.; resources: S.L.; data curation: P.S., D.S. and J.-H.X.; writing—original draft preparation: P.S.; writing—review & editing: L.-Y.C. and L.-C.Z.; writing—manuscript finalization: P.S., S.L., L.-Y.C. and L.-C.Z.; supervision: S.L. and L.-Y.C.; project administration: S.L. and L.-Y.C.; funding acquisition: S.L. and L.-Y.C.

Funding

The authors would like to acknowledge a financial support provided by National Natural Science Foundation of China (51601075), Open foundation of Guangxi Key Laboratory of Processing for Non-ferrous Metals and Featured Materials, Guangxi University (Grant No. GXYSOF1801 and 2019GXYSOF01), and Jiangsu Province six talent peaks project (XCL-117) and Postgraduate Research & Practice Innovation Program of Jiangsu Province, Young scholar project in Jiangsu university of science and technology.

Conflicts of Interest

The authors declare no conflict of interest. The funders had no role in the design of the study; in the collection, analyses, or interpretation of data; in the writing of the manuscript; or in the decision to publish the results.

References

  1. Lindner, T.; Löbel, M.; Lampke, T. Phase Stability and Microstructure Evolution of Solution-Hardened 316L Powder Feedstock for Thermal Spraying. Metals 2018, 8, 1063. [Google Scholar] [CrossRef] [Green Version]
  2. Chen, L.-Y.; Xu, T.; Wang, H.; Sang, P.; Lu, S.; Wang, Z.-X.; Chen, S.; Zhang, L.-C. Phase interaction induced texture in a plasma sprayed-remelted NiCrBSi coating during solidification: An electron backscatter diffraction study. Surf. Coat. Technol. 2019, 358, 467–480. [Google Scholar] [CrossRef]
  3. Liu, Y.J.; Zhang, Y.S.; Zhang, L.C. Transformation-induced plasticity and high strength in beta titanium alloy manufactured by selective laser melting. Materialia 2019, 6, 100299. [Google Scholar] [CrossRef]
  4. Zhang, L.-C.; Liu, Y.; Li, S.; Hao, Y. Additive Manufacturing of Titanium Alloys by Electron Beam Melting: A Review. Adv. Eng. Mater. 2018, 20, 1700842. [Google Scholar] [CrossRef]
  5. Liu, Y.J.; Li, S.J.; Zhang, L.C.; Hao, Y.L.; Sercombe, T.B. Early plastic deformation behaviour and energy absorption in porous β-type biomedical titanium produced by selective laser melting. Scr. Mater. 2018, 153, 99–103. [Google Scholar] [CrossRef]
  6. Zhang, L.-C.; Chen, L.-Y. A review on biomedical titanium alloys: Recent progress and prospect. Adv. Eng. Mater. 2019, 21, 1801215. [Google Scholar] [CrossRef] [Green Version]
  7. Liu, L.H.; Yang, C.; Kang, L.M.; Long, Y.; Xiao, Z.Y.; Li, P.J.; Zhang, L.C. Equiaxed Ti-based composites with high strength and large plasticity prepared by sintering and crystallizing amorphous powder. Mater. Sci. Eng. A 2016, 650, 171–182. [Google Scholar] [CrossRef] [Green Version]
  8. Yang, C.; Kang, L.M.; Li, X.X.; Zhang, W.W.; Zhang, D.T.; Fu, Z.Q.; Li, Y.Y.; Zhang, L.C.; Lavernia, E.J. Bimodal titanium alloys with ultrafine lamellar eutectic structure fabricated by semi-solid sintering. Acta Mater. 2017, 132, 491–502. [Google Scholar] [CrossRef]
  9. Yang, H.; Dong, E.; Zhang, B.; Yuan, Y.; Shu, S. Fabrication and Characterization of In Situ Synthesized SiC/Al Composites by Combustion Synthesis and Hot Press Consolidation Method. Scanning 2017, 2017, 9314740. [Google Scholar] [CrossRef]
  10. Qin, P.; Chen, Y.; Liu, Y.-J.; Zhang, J.; Chen, L.-Y.; Li, Y.; Zhang, X.; Cao, C.; Sun, H.; Zhang, L.-C. Resemblance in corrosion behavior of selective laser melted and traditional monolithic β Ti-24Nb-4Zr-8Sn alloy. ACS Biomater. Sci. Eng. 2019, 5, 1141–1149. [Google Scholar] [CrossRef]
  11. Chen, K.; Zeng, L.; Li, Z.; Chai, L.; Wang, Y.; Chen, L.-Y.; Yu, H. Effects of laser surface alloying with Cr on microstructure and hardness of commercial purity Zr. J. Alloys Compd. 2019, 784, 1106–1112. [Google Scholar] [CrossRef]
  12. Yang, Z.; Chu, C.; Jiang, F.; Qin, Y.; Long, X.; Wang, S.; Chen, D.; Zhang, F. Accelerating nano-bainite transformation based on a new constructed microstructural predicting model. Mater. Sci. Eng. A 2019, 748, 16–20. [Google Scholar] [CrossRef]
  13. Wang, L.; Wang, C.; Zhang, L.-C.; Chen, L.; Lu, W.; Zhang, D. Phase transformation and deformation behavior of NiTi-Nb eutectic joined NiTi wires. Sci. Rep. 2016, 6, 23905. [Google Scholar] [CrossRef] [PubMed]
  14. Leger, P.E.; Sennour, M.; Delloro, F.; Borit, F.; Debray, A.; Gaslain, F.; Jeandin, M.; Ducos, M. Multiscale Experimental and Numerical Approach to the Powder Particle Shape Effect on Al-Al2O3 Coating Build-Up. J. Therm. Spray Technol. 2017, 26, 1445–1460. [Google Scholar] [CrossRef]
  15. Wang, L.S.; Zhang, S.L.; Liu, T.; Li, C.J.; Li, C.X.; Yang, G.J. Dominant effect of particle size on the CeO2 preferential evaporation during plasma spraying of La2Ce2O7. J. Eur. Ceram. Soc. 2017, 37, 1577–1585. [Google Scholar] [CrossRef]
  16. Sun, Y.; Su, W.; Yang, H.; Ruan, J. Effects of WC particle size on sintering behavior and mechanical properties of coarse grained WC-8Co cemented carbides fabricated by unmilled composite powders. Ceram. Int. 2015, 41, 14482–14491. [Google Scholar] [CrossRef]
  17. Scendo, M.; Zorawski, W.; Goral, A. Influence of nickel powders on corrosion resistance of cold sprayed coatings on Al7075 substrate. Metals 2019, 9, 890. [Google Scholar] [CrossRef] [Green Version]
  18. Unabia, R.; Candidato, R.; Pawłowski, L. Current progress in solution precursor plasma spraying of cermets: A review. Metals 2018, 8, 420. [Google Scholar] [CrossRef] [Green Version]
  19. Shi, C.; Lei, J.; Zhou, S.; Dai, X.; Zhang, L.C. Microstructure and mechanical properties of carbon fibers strengthened Ni-based coatings by laser cladding: The effect of carbon fiber contents. J. Alloys Compd. 2018, 744, 146–155. [Google Scholar] [CrossRef]
  20. Lei, J.; Shi, C.; Zhou, S.; Gu, Z.; Zhang, L.C. Enhanced corrosion and wear resistance properties of carbon fiber reinforced Ni-based composite coating by laser cladding. Surf. Coat. Technol. 2018, 334, 274–285. [Google Scholar] [CrossRef] [Green Version]
  21. Bobzin, K.; Öte, M.; Knoch, M.A.; Alkhasli, I. Macroscopic particle modeling in air plasma spraying. Surf. Coat. Technol. 2019, 364, 449–456. [Google Scholar] [CrossRef]
  22. Singh, H.; Sidhu, B.S.; Puri, D.; Prakash, S. Use of plasma spray technology for deposition of high temperature oxidation/corrosion resistant coatings—A review. Mater. Corros. 2007, 58, 92–102. [Google Scholar] [CrossRef]
  23. Li, C.-J.; Wang, W.-Z. Quantitative characterization of lamellar microstructure of plasma-sprayed ceramic coatings through visualization of void distribution. Mater. Sci. Eng. A 2004, 386, 10–19. [Google Scholar] [CrossRef]
  24. Chen, L.-Y.; Wang, H.; Zhao, C.; Lu, S.; Wang, Z.-X.; Sha, J.; Chen, S.; Zhang, L.-C. Automatic remelting and enhanced mechanical performance of a plasma sprayed NiCrBSi coating. Surf. Coat. Technol. 2019, 369, 31–43. [Google Scholar] [CrossRef]
  25. Wei, Y.-K.; Li, Y.-J.; Zhang, Y.; Luo, X.-T.; Li, C.-J. Corrosion resistant nickel coating with strong adhesion on AZ31B magnesium alloy prepared by an in-situ shot-peening-assisted cold spray. Corros. Sci. 2018, 138, 105–115. [Google Scholar] [CrossRef]
  26. Chen, L.; Xu, T.; Lu, S.; Wang, Z.; Chen, S.; Zhang, L. Improved hardness and wear resistance of plasma sprayed nanostructured NiCrBSi coating via short-time heat treatment. Surf. Coat. Technol. 2018, 350, 436–444. [Google Scholar] [CrossRef]
  27. Li, C.-J.; Wang, Y.-Y.; Li, H. Effect of nano-crystallization of high velocity oxy-fuel-sprayed amorphous NiCrBSi alloy on properties of the coatings. J. Vac. Sci. Technol. A 2004, 22, 2000–2004. [Google Scholar] [CrossRef]
  28. Zhang, L.C.; Kim, K.B.; Yu, P.; Zhang, W.Y.; Kunz, U.; Eckert, J. Amorphization in mechanically alloyed (Ti, Zr, Nb)-(Cu, Ni)-Al equiatomic alloys. J. Alloys Compd. 2007, 428, 157–163. [Google Scholar] [CrossRef]
  29. Rabadia, C.D.; Liu, Y.J.; Wang, L.; Sun, H.; Zhang, L.C. Laves phase precipitation in Ti-Zr-Fe-Cr alloys with high strength and large plasticity. Mater. Des. 2018, 154, 228–238. [Google Scholar] [CrossRef]
  30. Zhang, L.C.; Shen, Z.Q.; Xu, J. Mechanically milling-induced amorphization in Sn-containing Ti-based multicomponent alloy systems. Mater. Sci. Eng. A 2005, 394, 204–209. [Google Scholar] [CrossRef]
  31. Houdková, Š.; Smazalová, E.; Vostřák, M.; Schubert, J. Properties of NiCrBSi coating, as sprayed and remelted by different technologies. Surf. Coat. Technol. 2014, 253, 14–26. [Google Scholar] [CrossRef]
  32. Yang, X.C.; Li, G.L.; Wang, H.D.; Dong, T.S.; Kang, J.J. Effect of flame remelting on microstructure and wear behaviour of plasma sprayed NiCrBSi-30%Mo coating. Surf. Eng. 2018, 34, 181–188. [Google Scholar] [CrossRef]
  33. Serres, N.; Hlawka, F.; Costil, S.; Langlade, C.; MacHi, F. Microstructures and mechanical properties of metallic NiCrBSi and composite NiCrBSi-WC layers manufactured via hybrid plasma/laser process. Appl. Surf. Sci. 2011, 257, 5132–5137. [Google Scholar] [CrossRef]
  34. Niranatlumpong, P.; Koiprasert, H. The effect of Mo content in plasma-sprayed Mo-NiCrBSi coating on the tribological behavior. Surf. Coat. Technol. 2010, 205, 483–489. [Google Scholar] [CrossRef]
  35. Deschuyteneer, D.; Petit, F.; Gonon, M.; Cambier, F. Processing and characterization of laser clad NiCrBSi/WC composite coatings—Influence of microstructure on hardness and wear. Surf. Coat. Technol. 2015, 283, 162–171. [Google Scholar] [CrossRef]
  36. Li, S.; Guo, Z.; Xiong, J.; Lei, Y.; Li, Y.; Tang, J.; Liu, J.; Ye, J. Corrosion behavior of HVOF sprayed hard face coatings in alkaline-sulfide solution. Appl. Surf. Sci. 2017, 416, 69–77. [Google Scholar] [CrossRef]
  37. Zhang, L.C.; Jia, Z.; Lyu, F.; Liang, S.X.; Lu, J. A review of catalytic performance of metallic glasses in wastewater treatment: Recent progress and prospects. Prog. Mater. Sci. 2019, 105, 100576. [Google Scholar] [CrossRef]
  38. Zhang, L.C.; Xu, J. Glass-forming ability of melt-spun multicomponent (Ti, Zr, Hf)–(Cu, Ni, Co)–Al alloys with equiatomic substitution. J. Non. Cryst. Solids 2004, 347, 166–172. [Google Scholar] [CrossRef]
  39. Zhang, L.-C.; Xu, J.; Eckert, J. Thermal stability and crystallization kinetics of mechanically alloyed TiC/Ti-based metallic glass matrix composite. J. Appl. Phys. 2006, 100, 033514. [Google Scholar] [CrossRef] [Green Version]
  40. Liu, S.; Zheng, X.; Geng, G. Dry sliding wear behavior and corrosion resistance of NiCrBSi coating deposited by activated combustion-high velocity air fuel spray process. Mater. Des. 2010, 31, 913–917. [Google Scholar] [CrossRef]
  41. Zhang, C.; Liu, L.; Xu, H.; Xiao, J.; Zhang, G.; Liao, H. Role of Mo on tribological properties of atmospheric plasma-sprayed Mo-NiCrBSi composite coatings under dry and oil-lubricated conditions. J. Alloys Compd. 2017, 727, 841–850. [Google Scholar] [CrossRef]
  42. Dong, S.; Song, B.; Liao, H.; Coddet, C. Deposition of NiCrBSi coatings by atmospheric plasma spraying and dry-ice blasting: Microstructure and wear resistance. Surf. Coat. Technol. 2015, 268, 36–45. [Google Scholar] [CrossRef]
  43. Huang, S.; Sun, D.; Xu, D.; Wang, W.; Xu, H. Microstructures and Properties of NiCrBSi/WC Biomimetic Coatings Prepared by Plasma Spray Welding. J. Bionic Eng. 2015, 12, 592–603. [Google Scholar] [CrossRef]
  44. Bergant, Z.; Grum, J. Quality improvement of flame sprayed, heat treated, and remelted NiCrBSi coatings. J. Therm. Spray Technol. 2009, 18, 380–391. [Google Scholar] [CrossRef]
  45. Liu, L.; Xu, H.; Xiao, J.; Wei, X.; Zhang, G.; Zhang, C. Effect of heat treatment on structure and property evolutions of atmospheric plasma sprayed NiCrBSi coatings. Surf. Coat. Technol. 2017, 325, 548–554. [Google Scholar] [CrossRef]
  46. Zhang, L.C.; Xu, J.; Ma, E. Mechanically Alloyed Amorphous Ti50(Cu0.45Ni0.55)44–xAlxSi4B2 Alloys with Supercooled Liquid Region. J. Mater. Res. 2002, 17, 1743–1749. [Google Scholar] [CrossRef] [Green Version]
  47. Zhang, L.C.; Xu, J.; Ma, E. Consolidation and properties of ball-milled Ti50Cu18Ni22Al4Sn6 glassy alloy by equal channel angular extrusion. Mater. Sci. Eng. A 2006, 434, 280–288. [Google Scholar] [CrossRef]
  48. Calin, M.; Zhang, L.C.; Eckert, J. Tailoring of microstructure and mechanical properties of a Ti-based bulk metallic glass-forming alloy. Scr. Mater. 2007, 57, 1101–1104. [Google Scholar] [CrossRef]
  49. Yu, P.; Zhang, L.C.; Zhang, W.Y.; Das, J.; Kim, K.B.; Eckert, J. Interfacial reaction during the fabrication of Ni60Nb40 metallic glass particles-reinforced Al based MMCs. Mater. Sci. Eng. A 2007, 444, 206–213. [Google Scholar] [CrossRef]
  50. Zhang, L.C.; Shen, Z.Q.; Xu, J. Glass formation in a (Ti, Zr, Hf)–(Cu, Ni, Ag)–Al high-order alloy system by mechanical alloying. J. Mater. Res. 2003, 18, 2141–2149. [Google Scholar] [CrossRef] [Green Version]
  51. Chen, L.Y.; Shen, P.; Zhang, L.; Lu, S.; Chai, L.; Yang, Z.; Zhang, L.C. Corrosion behavior of non-equilibrium Zr-Sn-Nb-Fe-Cu-O alloys in high-temperature 0.01 M LiOH aqueous solution and degradation of the surface oxide films. Corros. Sci. 2018, 136, 221–230. [Google Scholar] [CrossRef]
  52. Yang, H.-Y.; Wang, Z.; Shu, S.-L.; Lu, J.-B. Effect of Ta addition on the microstructures and mechanical properties of in situ bi-phase (TiB2-TiCxNy)/(Ni-Ta) cermets. Ceram. Int. 2019, 45, 4408–4417. [Google Scholar] [CrossRef]
  53. Lang, F.; Yu, Z. The corrosion resistance and wear resistance of thick TiN coatings deposited by arc ion plating. Surf. Coat. Technol. 2001, 145, 80–87. [Google Scholar] [CrossRef]
  54. Zhang, L.; Chen, L.-Y.; Zhao, C.; Liu, Y.; Zhang, L.-C. Calculation of oxygen diffusion coefficients in oxide films formed on low-temperature annealed Zr alloys and their related corrosion behavior. Metals 2019, 9, 850. [Google Scholar] [CrossRef] [Green Version]
  55. Dai, N.; Zhang, L.-C.; Zhang, J.; Chen, Q.; Wu, M. Corrosion behavior of selective laser melted Ti-6Al-4V alloy in NaCl solution. Corros. Sci. 2016, 102, 484–489. [Google Scholar] [CrossRef]
  56. Xie, F.; He, X.; Cao, S.; Mei, M.; Qu, X. Influence of pore characteristics on microstructure, mechanical properties and corrosion resistance of selective laser sintered porous Ti-Mo alloys for biomedical applications. Electrochim. Acta 2013, 105, 121–129. [Google Scholar] [CrossRef]
  57. Bai, Y.; Gai, X.; Li, S.; Zhang, L.-C.; Liu, Y.; Hao, Y.; Zhang, X.; Yang, R.; Gao, Y. Improved corrosion behaviour of electron beam melted Ti–6Al–4V alloy in phosphate buffered saline. Corros. Sci. 2017, 123, 289–296. [Google Scholar] [CrossRef]
  58. Bandeira, R.M.; van Drunen, J.; Garcia, A.C.; Tremiliosi-Filho, G. Influence of the thickness and roughness of polyaniline coatings on corrosion protection of AA7075 aluminum alloy. Electrochim. Acta 2017, 240, 215–224. [Google Scholar] [CrossRef]
  59. Lu, H.B.; Zhang, L.C.; Gebert, A.; Schultz, L. Pitting corrosion of Cu—Zr metallic glasses in hydrochloric acid solutions. J. Alloys Compd. 2008, 462, 60–67. [Google Scholar] [CrossRef]
  60. Brug, G.J.; van den Eeden, A.L.G.; Sluyters-Rehbach, M.; Sluyters, J.H. The analysis of electrode impedances complicated by the presence of a constant phase element. J. Electroanal. Chem. 1984, 176, 275–295. [Google Scholar] [CrossRef]
  61. Qin, X.; Guo, X.; Lu, J.; Chen, L.; Qin, J.; Lu, W. Erosion-wear and intergranular corrosion resistance properties of AISI 304L austenitic stainless steel after low-temperature plasma nitriding. J. Alloys Compd. 2017, 698, 1094–1101. [Google Scholar] [CrossRef]
  62. Chen, Y.; Zhang, J.; Dai, N.; Qin, P.; Attar, H.; Zhang, L.-C. Corrosion behaviour of selective laser melted Ti-TiB biocomposite in simulated body fluid. Electrochim. Acta 2017, 232, 89–97. [Google Scholar] [CrossRef] [Green Version]
  63. Neville, A.; Hodgkiess, T. Electrochemical Study of the Localized Corrosion of Vacuum-Furnace-Fused Cermet Coatings. J. Am. Ceram. Soc. 2010, 82, 2133–2144. [Google Scholar] [CrossRef]
  64. Liang, S.X.; Jia, Z.; Liu, Y.J.; Zhang, W.; Wang, W.; Lu, J.; Zhang, L.C. Compelling Rejuvenated Catalytic Performance in Metallic Glasses. Adv. Mater. 2018, 30, 1802764. [Google Scholar] [CrossRef] [Green Version]
  65. Zhang, L.-C.; Liang, S.-X. Fe-based Metallic Glasses in Functional Catalytic Applications. Chem. Asian J. 2018, 13, 3575–3592. [Google Scholar] [CrossRef]
  66. Chen, L.; Li, J.; Zhang, Y.; Lu, W.; Zhang, L.C.; Wang, L.; Zhang, D. Effect of low-temperature pre-deformation on precipitation behavior and microstructure of a Zr-Sn-Nb-Fe-Cu-O alloy during fabrication. J. Nucl. Sci. Technol. 2016, 53, 496–507. [Google Scholar] [CrossRef]
  67. Song, D.; Yang, J.; Yang, B.; Chen, L.; Wang, F.; Zhu, X. Evolution of structure and ferroelectricity in Aurivillius Bi4Bin-3Fen-3Ti3O 3n+3 thin films. J. Mater. Chem. C 2018, 6, 8618–8627. [Google Scholar] [CrossRef]
  68. Sadeghimeresht, E.; Reddy, L.; Hussain, T.; Huhtakangas, M.; Markocsan, N.; Joshi, S. Influence of KCl and HCl on high temperature corrosion of HVAF-sprayed NiCrAlY and NiCrMo coatings. Mater. Des. 2018, 148, 17–29. [Google Scholar] [CrossRef]
  69. Chen, L.; Zeng, Q.; Li, J.; Lu, J.; Zhang, Y.; Zhang, L.-C.; Qin, X.; Lu, W.; Zhang, L.; Wang, L.; et al. Effect of microstructure on corrosion behavior of a Zr-Sn-Nb-Fe-Cu-O alloy. Mater. Des. 2016, 92, 888–896. [Google Scholar] [CrossRef]
  70. Chen, L.-Y.; Sang, P.; Zhang, L.; Song, D.; Chu, Y.-Q.; Chai, L.; Zhang, L.-C. Homogenization and growth behavior of second-phase particles in a deformed Zr–Sn-Nb-Fe-Cu-Si-O alloy. Metals 2018, 8, 759. [Google Scholar] [CrossRef] [Green Version]
  71. Zhao, W.M.; Wang, Y.; Han, T.; Wu, K.Y.; Xue, J. Electrochemical evaluation of corrosion resistance of NiCrBSi coatings deposited by HVOF. Surf. Coat. Technol. 2004, 183, 118–125. [Google Scholar] [CrossRef]
  72. Mitsuhashi, A.; Asami, K.; Kawashima, A.; Hashimoto, K. The corrosion behavior of amorphous nickel base alloys in a hot concentrated phosphoric acid. Corros. Sci. 1987, 27, 957–970. [Google Scholar] [CrossRef]
Figure 1. Secondary electron images for the morphologies of (a) 50–75P and (b) 75–100P and particle size distribution of (c) 50–75P and (d) 75–100P.
Metals 09 01342 g001
Figure 2. Secondary electron images for the cross-sectional morphologies of the as-sprayed coatings: (a) 50–75C and (b) 75–100C.
Metals 09 01342 g002
Figure 3. Examples of porosity calculation: (a) primary optical microscopy image and (b) binary image.
Metals 09 01342 g003
Figure 4. Secondary electron images for the surface morphologies of the as-sprayed coatings: (a,b) 50–75C and (c,d) 75–100C.
Metals 09 01342 g004
Figure 5. Optical images showing the pores, lamellar boundaries and unmelted particles in the cross-sectional microstructures of the coatings: (a) 50–75C and (b) 75–100C.
Metals 09 01342 g005
Figure 6. XRD patterns of the as-sprayed and annealed coating samples as well as the powder used.
Metals 09 01342 g006
Figure 7. TEM images for the microstructures of the as-sprayed coatings: (a) 50–75C and (b) 75–100C.
Metals 09 01342 g007
Figure 8. Secondary electron images for the cross-sectional microstructures of the as-sprayed and annealed coatings: (a) as-sprayed 50–75C, (b) annealed 50–75C, (c) as-sprayed 75–100C and (d) annealed 75–100C.
Metals 09 01342 g008aMetals 09 01342 g008b
Figure 9. Hardness of the as-sprayed and annealed 50–75C and 75–100C.
Metals 09 01342 g009
Figure 10. Open circuit potential as a function of time for the as-sprayed 50–75C and 75–100C immersed in 3.5 wt.% NaCl solution for 3000 s.
Metals 09 01342 g010
Figure 11. Potentiodynamic polarization curves for the as-sprayed 50–75C and 75–100C in 3.5 wt.% NaCl solution; (a) shows the complete passivation potential and passivation current densities and (b) shows the Tafel regions of the polarization curves.
Metals 09 01342 g011
Figure 12. The EIS results in the form of (a) Nyquist plots, (b) Bode impedance plots and (c) Bode phase plots; (d) the equivalent circuit diagram used for fitting the EIS results for the as-sprayed 50–75C and 75–100C in 3.5 wt.% NaCl solution.
Metals 09 01342 g012
Figure 13. Secondary electron images and corresponding EDS mappings of the as-sprayed samples after electrochemical tests: (a) 50–75C and its corresponding (b) Na and (c) Cl mappings; and (d) 75–100C and its corresponding (e) Na and (f) Cl mappings.
Metals 09 01342 g013
Figure 14. Secondary electron images for the cross-sectional microstructures of the as-sprayed (a) 50–75C and (b) 75–100C after electrochemical tests.
Metals 09 01342 g014
Figure 15. Schematic illustration of the spraying process of the NiCrBSi coatings from the powder with different sizes. The number of pores, boundaries, melted and unmelted parts of in-flight particles and solidified part of in-flight particles are only a qualitative representation rather than a quantitative one.
Metals 09 01342 g015
Table 1. Chemical composition of the NiCrBSi feedstock powder.
ElementCSiBCrFeNi
Wt.%0.7~1.13.2~5.03.0~3.817.0~19.0<5.0Bal.
Table 2. Main parameters of plasma spraying.
Spray ParameterMeasurement
Voltage (V)50
Current (A)600
Gun traverse rate (mm/s)100
Main gas Ar (slpm)80
Feed gas Ar (slpm)40
Powder feed rate (g/s)0.3
Spray distance (mm)80
Table 3. The volume fractions (vol.%) of each phase in the as-sprayed and annealed 50–75C and 75–100C calculated by integral areas from the XRD patterns shown in Figure 6.
SampleNiNi3BCrBCr3C2Cr7C3Amorphous Phase
As-sprayed 50–75C58.412.38.43.22.215.5
As -sprayed 75C–100C63.313.58.93.52.18.7
Annealed 50–75C66.918.48.83.52.4Undetected
Annealed 75C–100C67.218.78.23.62.3Undetected
Table 4. The corrosion potential (Ecorr) and corrosion current density (Icorr) fitting from the Tafel regions of polarization curves in Figure 11.
SampleEcorr (mV)Icorr (μA/cm2)
50–75C−332.70.243
-−325.30.184
-−298.10.334
Average value−318.70.254
Std Dev14.90.062
75–100C−315.80.134
-−316.90.149
-−304.20.286
Average value−312.30.189
Std Dev5.70.069
Table 5. Fitting results of electrochemical impedance spectrum data for the as-sprayed 50–75C and 75–100C immersed in 3.5 wt.% NaCl solution. Rs: the solution resistance, Rf: the film resistance, Rct: the charge transfer resistance, C: capacity element, W: Warburg impedance, CPE: constant phase elements.
SampleRs
(Ω cm2)
Rf
(Ω cm2)
C × 10−6 (F)Rct
(MΩ cm2)
CPE × 10−6−1 cm−2 S−n)nW × 10−5
−1 cm−2 S−0.5)
χ2 × 10⁻⁴
50–75C11.8911.362.480.2739.990.676.927.07
8.599.933.300.4236.180.6814.019.09
11.794.210.950.4132.560.6612.774.39
Average value10.768.502.240.3736.040.6711.236.85
Std Dev1.873.090.970.072.790.013.09-
75–100C26.994.130.740.5940.950.674.432.91
10.542.630.660.4142.410.682.956.16
13.083.650.720.4937.380.672.389.57
Average value16.873.470.710.5040.250.673.256.21
Std Dev8.850.630.040.072.110.010.86-
Table 6. Corresponding EDS results for the as-sprayed 50–75C and 75–100C samples after electrochemical tests. The analyzed points A, B, C and D are indicated in Figure 14.
PointsLocationNa (wt.%)Cl (wt.%)Ni (wt.%)Si (wt.%)Cr (wt.%)
Aat the interior of particles0.120.0082.623.9613.30
Bat pores7.1213.6647.225.8526.14
Cat the interior of particles0.350.2087.735.076.65
Dat pores17.838.8926.831.8044.66

