Article

Environmentally Friendly and Controllable Pyrolysis Method to Synthesize Ni-Modified Graphene Nanosheets as Reinforcement of Lead-Free Solder

1
School of Materials Science and Engineering, Henan University of Science and Technology, Luoyang 471000, China
2
Collaborative Innovation Center of Nonferrous Metals, Henan Key Laboratory of Nonferrous Materials Science & Processing Technology, Luoyang 471000, China
*
Author to whom correspondence should be addressed.
Metals 2019, 9(10), 1123; https://doi.org/10.3390/met9101123
Submission received: 25 September 2019 / Accepted: 16 October 2019 / Published: 19 October 2019

Abstract

:
A tactic for the synthesis of Ni-modified graphene nanosheets (Ni-GNSs) as a high-performance reinforcement of a lead-free solder is proposed and achieved via an environmentally friendly and controllable pyrolysis method. The segmented pyrolysis processes of an Ni(CH3COO)2∙4H2O@GNSs hybrid are discussed. The morphology, microstructure, phase transition, and adsorption strength of nanoparticles on the surface of GNSs with various theoretical Ni loadings are characterized. The adsorption mechanism of a single Ni atom on the surface of perfect graphene and defective graphene was studied based on density functional theory. The corresponding underlying formation mechanisms of Ni-GNSs are analyzed. The results show that the grain size, distribution and phase composition of the nanoparticles on GNSs could be controlled by changing the theoretical Ni loading level. The morphology and dispersity of Ni nanoparticles on GNSs did not significantly change after long-time or high-power ultrasonic treatment, suggesting that the adsorption strength between Ni nanoparticles and GNSs was relatively large and belonged to chemical adsorption based on first-principle calculation. Ni atoms tend to adsorb in the center of the carbon six-membered ring. The obtained Ni-GNSs nanohybrid exhibited a small size, fewer defects, and higher crystallinity and adsorption strength when the theoretical Ni loading was 17 mol %. The results have potential applications in the design of the reinforced phase of composites.

1. Introduction

Among the nanosized materials, graphene nanosheets (GNSs) are one of the more popular two-dimensional nanomaterials that possess a honeycomb crystal structure applied in various fields [1,2]. Because of their unique optical properties, great specific surface area, high carrier mobility, excellent biocompatibility, and outstanding electrical and thermal properties, GNSs have been highlighted in the fields of X-ray photon detectors [3], electro-optic sensors [4], biomedical fields [5,6], electrocatalysts [7,8,9], electronic components, and energy storage [10,11,12]. Owing to their superior physical performance and mechanical properties, GNSs are considered promising reinforcements and are widely used in microelectronics fields [13,14,15]. However, there are still many obstacles hindering the full utilization of the superior properties of GNSs as reinforcements of lead-free solders. On the one hand, the great density variation between the reinforcements and the solder matrixes might cause the GNSs to aggregate; in addition, the weaker wettability and bonding strength between GNSs and solder substrates might directly affect the reliability of nanowelding spots and restrict their application to the field of micro-joining. Liu et al. reported a weak bonding strength between reinforcements and the solder substrate [16].
To solve this problem, improving the bonding strength between the GNSs and solder matrixes, the surface metallization of GNSs to form a transition layer between the reinforcement and the solder matrix is commonly used in material surface modification. Metal nanoparticles such as Al, Ni, and Cu are regarded as the most promising interlayer materials. Not only are they cheap, but their lattice structures have excellent matching with that of GNSs [17,18]. A. El-Daly et al. [19] reported that adding an appropriate amount of Ni had a positive effect on the microstructure, wettability, and service performance of solder alloys. Li et al. [20] prepared Al-graphene composite coatings to improve hardness and wear resistance.
The main methods used for the surface metallization of carbon-based nanomaterials are electroless plating, electrochemical deposition, and magnetron sputtering. Hu et al. [21] reported the synthesis of Ni/graphene sheets via the sodium borohydride reduction of NiSO4·6H2O in the presence of graphene. Hui et al. [22] prepared NiO@graphene composite-modified electrodes for supercapacitors via electrophoretic deposition (EPD). The advantages of the above two methods are their simple equipment and uniform coating. Nevertheless, their poor solution stability makes them difficult to maintain, adjust and regenerate the solution; in addition, the repeated filtration and cleaning processes cause great material losses and pollute the environment, which limit their industrial applications. Alternatively, the preparation of metal nanoparticles on a graphene surface can be obtained by a combination of physical and chemical deposition methods (e.g., magnetron sputtering). A. Jilani et al. [23] confirm the graphene oxide (GO)/NiO thin film preparation via this technology and the strong interaction among the GO basal planes and smaller NiO nanoparticles. High quality nickel-doped diamond-like carbon (DLC) films were prepared via an unbalanced magnetron radio-frequency co-sputtering process using novel nano-diamond as its target [24]. However, there are massive disadvantages such as the lower usage of target material, the high cost of the magnetron sputtering apparatus, and the unsuitability for strong magnetic material, all of which preclude its large-scale production and application. To overcome these problems, S. Lee et al. [25,26,27,28] prepared highly dispersed metal- and metal oxide-decorated carbon nanotubes (CNTs) using a technique based on the thermal decomposition of metal acetates. If the size, distribution and phase composition of the nanoparticles loaded on the carbon-based nanomaterials can be further controlled, the application potential of such in microelectronics and other fields can be maximized.
In this work, in view of GNSs’ great surface inertness, high cost, and poor dispersibility, graphene oxide nanosheets (GONSs) were selected as the raw material, and nickel acetate tetrahydrate was selected as a precursor (the source of the Ni2+) [29]. An environmentally friendly and controllably segmented pyrolysis method was applied to prepare the Ni-modified GNSs (Ni-GNSs) composite with fewer defects as a high-performance reinforcement of a lead-free solder. The pyrolysis processes of the Ni(CH3COO)2·4H2O@GNSs hybrid were analyzed. The morphology, particle size distribution, phase transition, and crystallinity of nanoparticles on the surface of GNSs were studied, all of which could be controlled by changing the theoretical Ni loadings. In order to give full play to the dual role of nickel and graphene and improve the reliability of solder joints, the defect level of Ni-GNSs and the adsorption strength between Ni and GNSs were discussed based on the first principle, which can provide a necessary theoretical basis for the preparation process of Ni-modified, graphene-reinforced phase.

2. Materials and Methods

2.1. Materials

Multilayer GONSs with a thickness of 3–8 nm and a size of 5–15 μm were provided by Hengqiu Technologies (Suzhou, China). Nickel acetate tetrahydrate (AR) and N2H4∙H2O (AR) were purchased from Luoyang Compo (Luoyang, China). The as-prepared Ni-GNSs was intended to be used as the reinforced phase of the subsequent composite solder. Therefore, according to the content of reinforcement in the composite solder, the theoretical Ni loadings in Ni-GNSs were designed as follows: 50, 25, 17, 12.7, 9.3, and 6.4 mol %.

2.2. Segmented Pyrolysis Ni Modification

The synthesis process of the Ni-GNSs included three main steps, as follows: (1) heating reflux reduction, (2) ball mill mixing, and (3) segmented pyrolysis Ni modification. All of these three steps are shown in a schematic diagram in Figure 1.
To improve the Ni modification effect, the raw material GONSs were first reflux reduced with an N2H4∙H2O reducing agent (Step 1). In this step, with deionized water as the solvent and N2H4∙H2O as reductant, the volume ratio of two was 100:1. The mixture of GONSs and the N2H4∙H2O solution was reflux reduced for 22–24 h at about 100 °C. After cleaning, the products were vacuum dried for several hours to obtain the high purity, reduced graphene oxide sheets (r-GONSs). The ball milling of the r-GONSs (GNSs) and nickel acetate tetrahydrate (the source of the Ni2+) was carried out in an XQM-0.4 L planetary ball mill (Tencan Powder, Changsha, China) at the speed of 240 rpm for 3 h to improve the dispersion and form active wrinkles at the surface of the r-GONSs (GNSs) (Step 2). Zirconia grinding balls were selected as milling media, and the ball-to-powder weight ratio was 100:1 during milling.
In the segmented pyrolysis Ni modification process (Step 3), the mixed GNSs and nickel acetate tetrahydrate were placed in the corundum crucibles and heated in a pre-vacuum-pumping atmosphere furnace for the segmented heating process. According to the thermogravimetry-differential thermal analysis (TG-DTA) curve of the Ni(CH3COO)2∙4H2O@GNSs mixture, the segmented thermal decomposition process was developed as follows. The mixtures were first vacuum-dried at 250 °C for 1 h to reduce the crystal water (the first stage). Then, the mixtures were heated in a nitrogen atmosphere to 380 °C at a slow heating rate of 5 °C/min and isothermally held for 1 h to observe the decomposition process of the nickel acetate (the second stage). After that, the mixtures were heated from 380 to 450 °C at the same heating rate and isothermally held for 1 h (the third stage). When the mixtures cooled down inside the furnace to room temperature, the product was collected as the final Ni nanoparticle-modified GNSs sample.

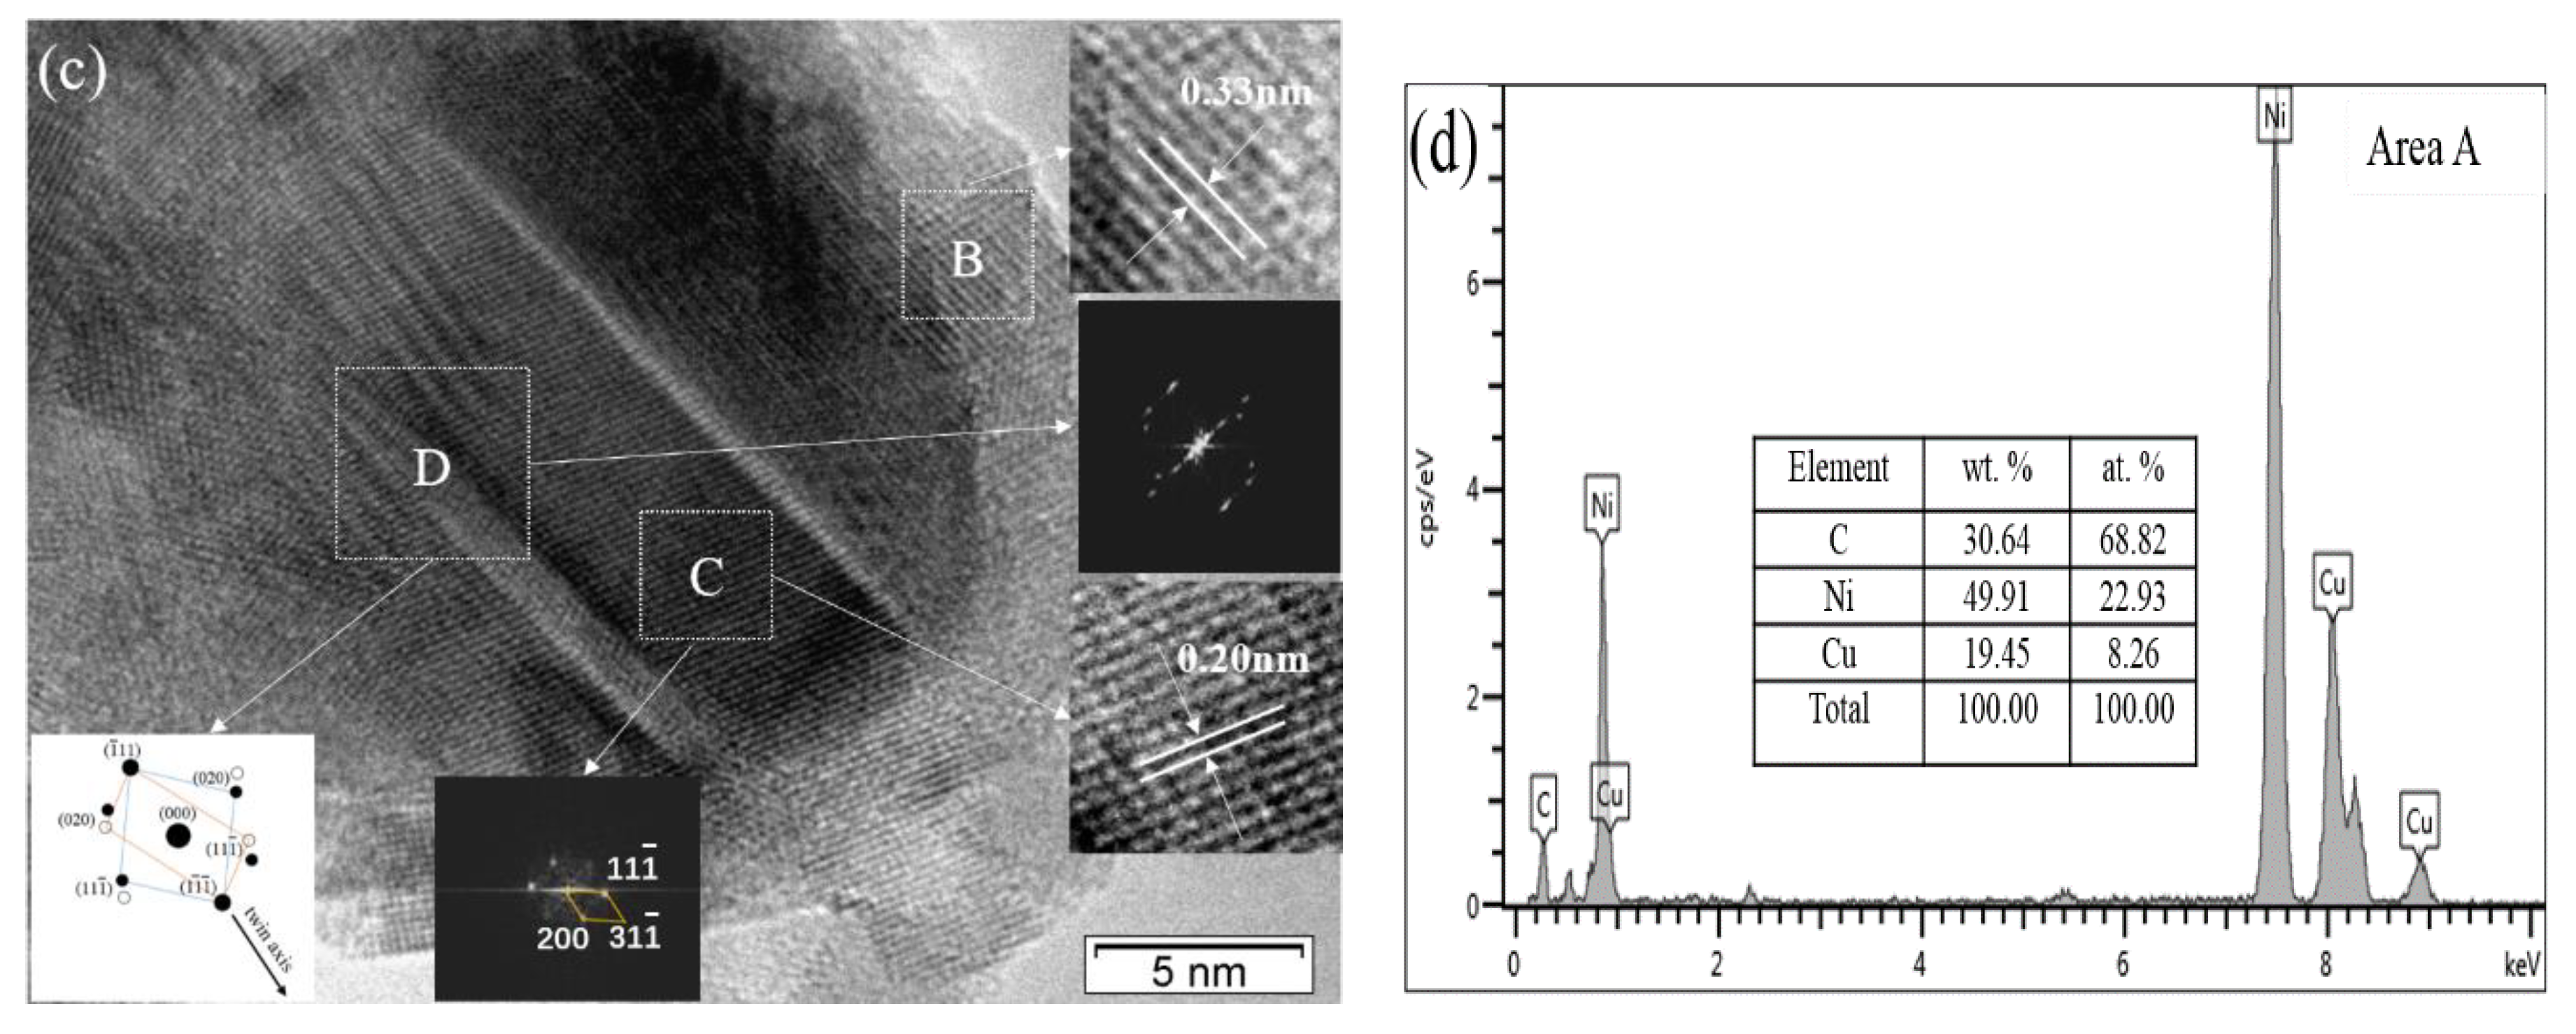
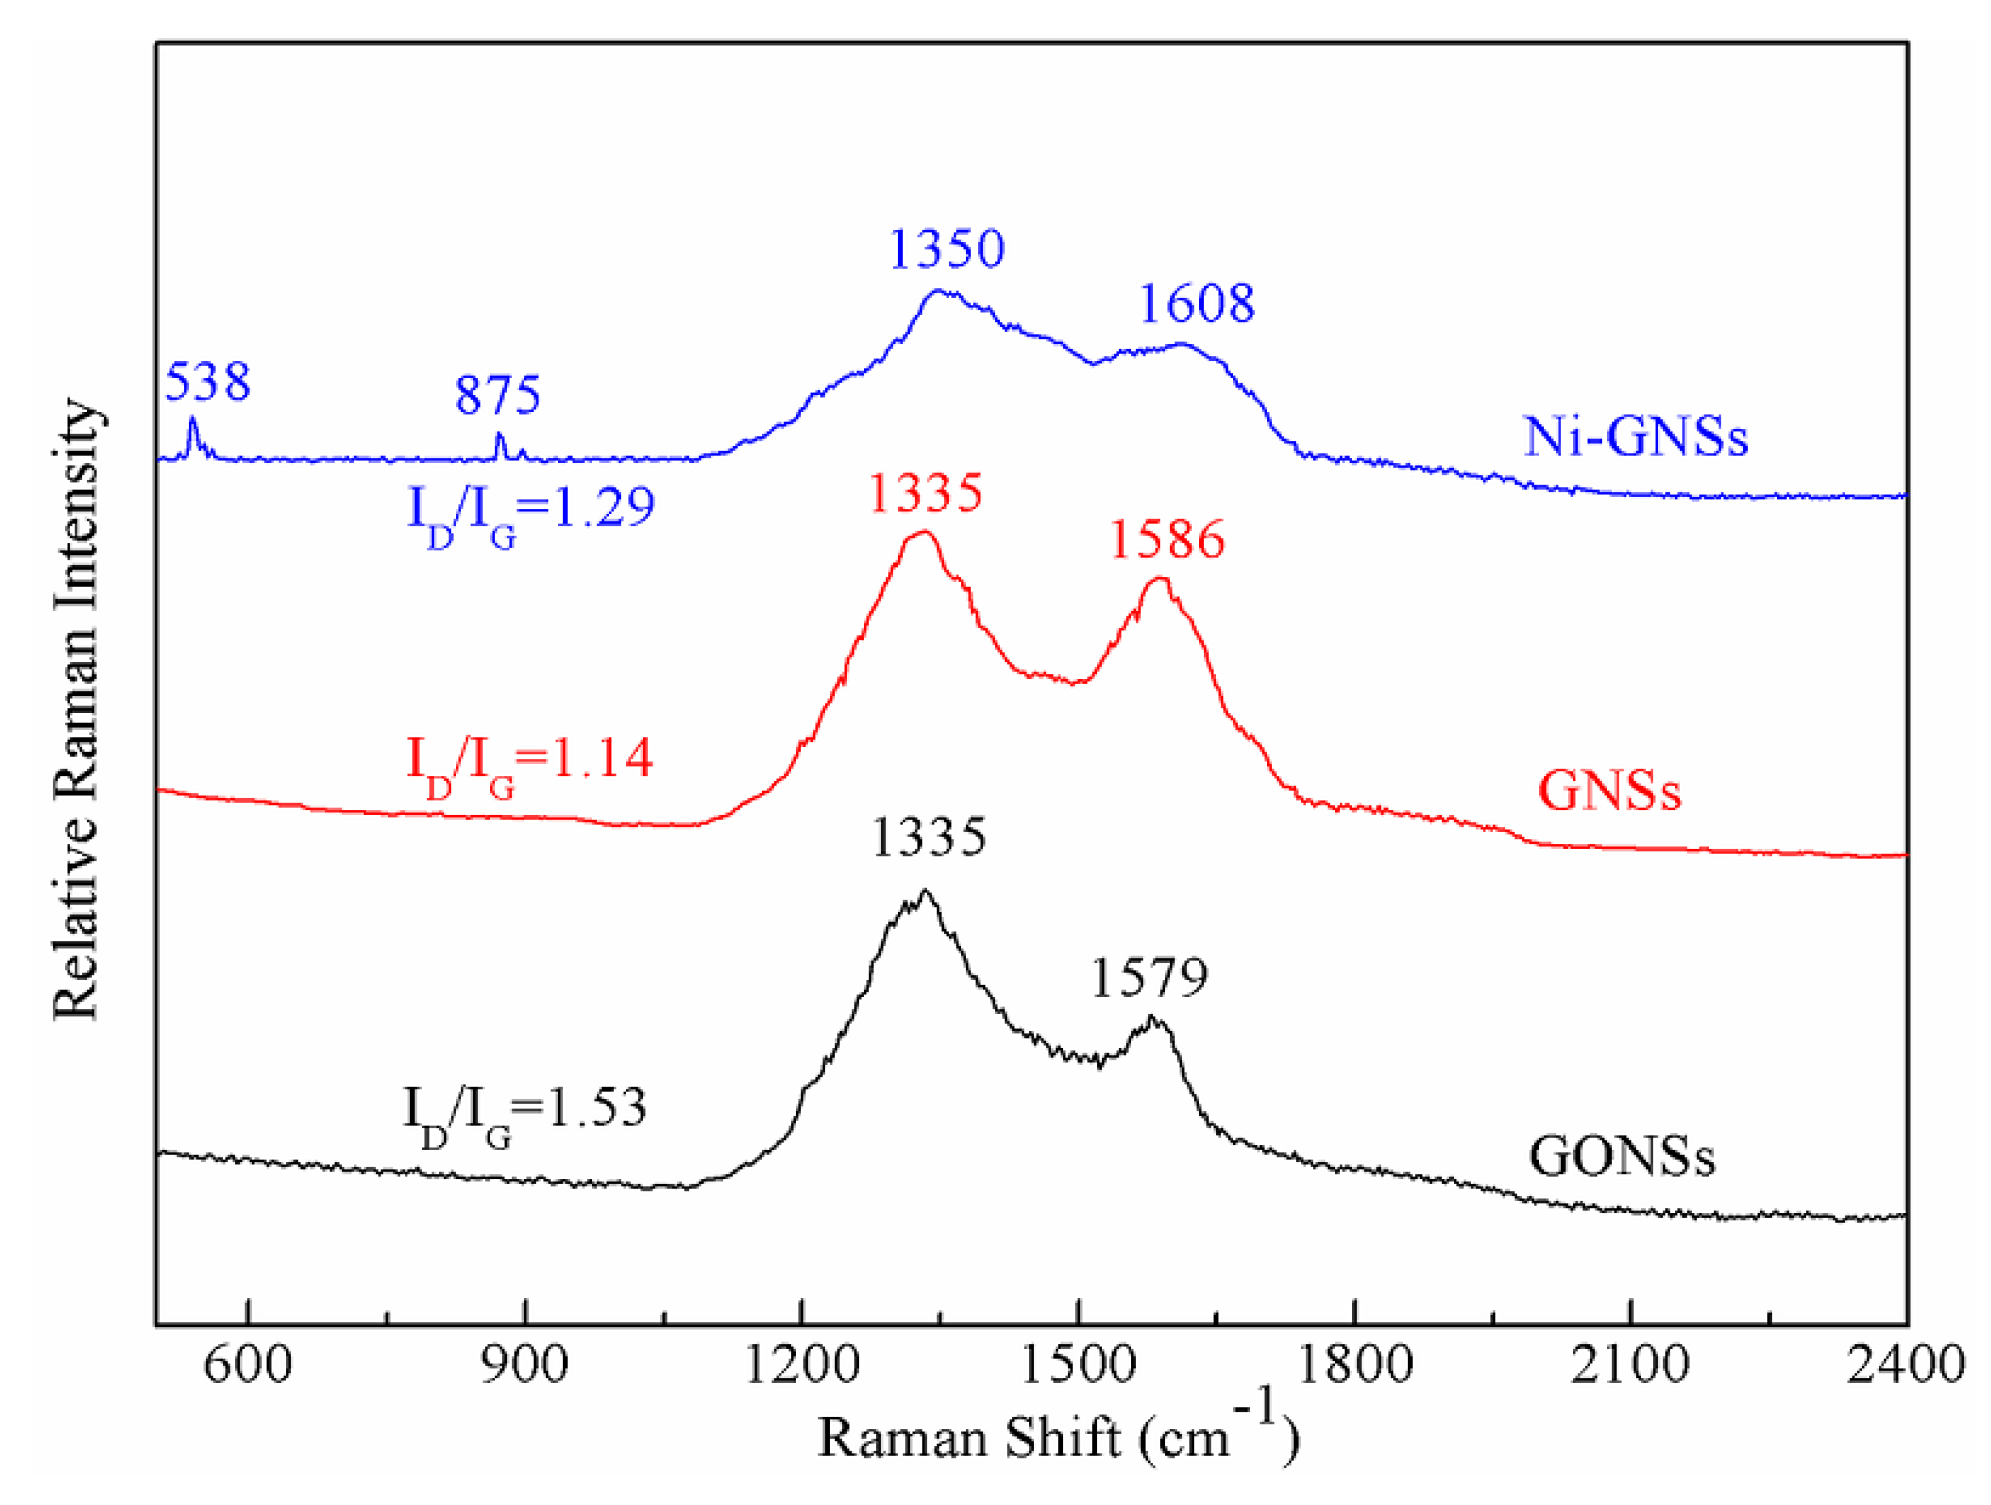
2.3. Microstructural Characteristic

The microstructure of the Ni-GNSs during preparation was observed by JSM-7800F (Jeol, Tokyo, Japan) field emission scanning electron microscopy (FESEM) and JEM-2100F (Jeol, Tokyo, Japan) high resolution transmission electron microscopy (HRTEM). The crystallographic characterization was performed by D8 ADVANCE (Bruker, Karlsruhe, Germany) X-ray diffraction (XRD) (with an accelerating voltage of 40 kV and scan range of 20–90°), with Cu Kα radiation at a scan rate of 4°/min. The group structural change and defect level of nanohybrids were detected by IRTracer-100 (Shimadzu, Kyoto, Japan) Fourier-transform infrared spectroscopy (FTIR) and XploRA ONE (HORIBA Jobin Yvon, Paris, France) Raman spectrometry. The bonding strength between Ni nanoparticles and GNSs was indirectly shown by the ultrasonic treatment of Ni-GNSs under different ultrasonic powers and treatment times.

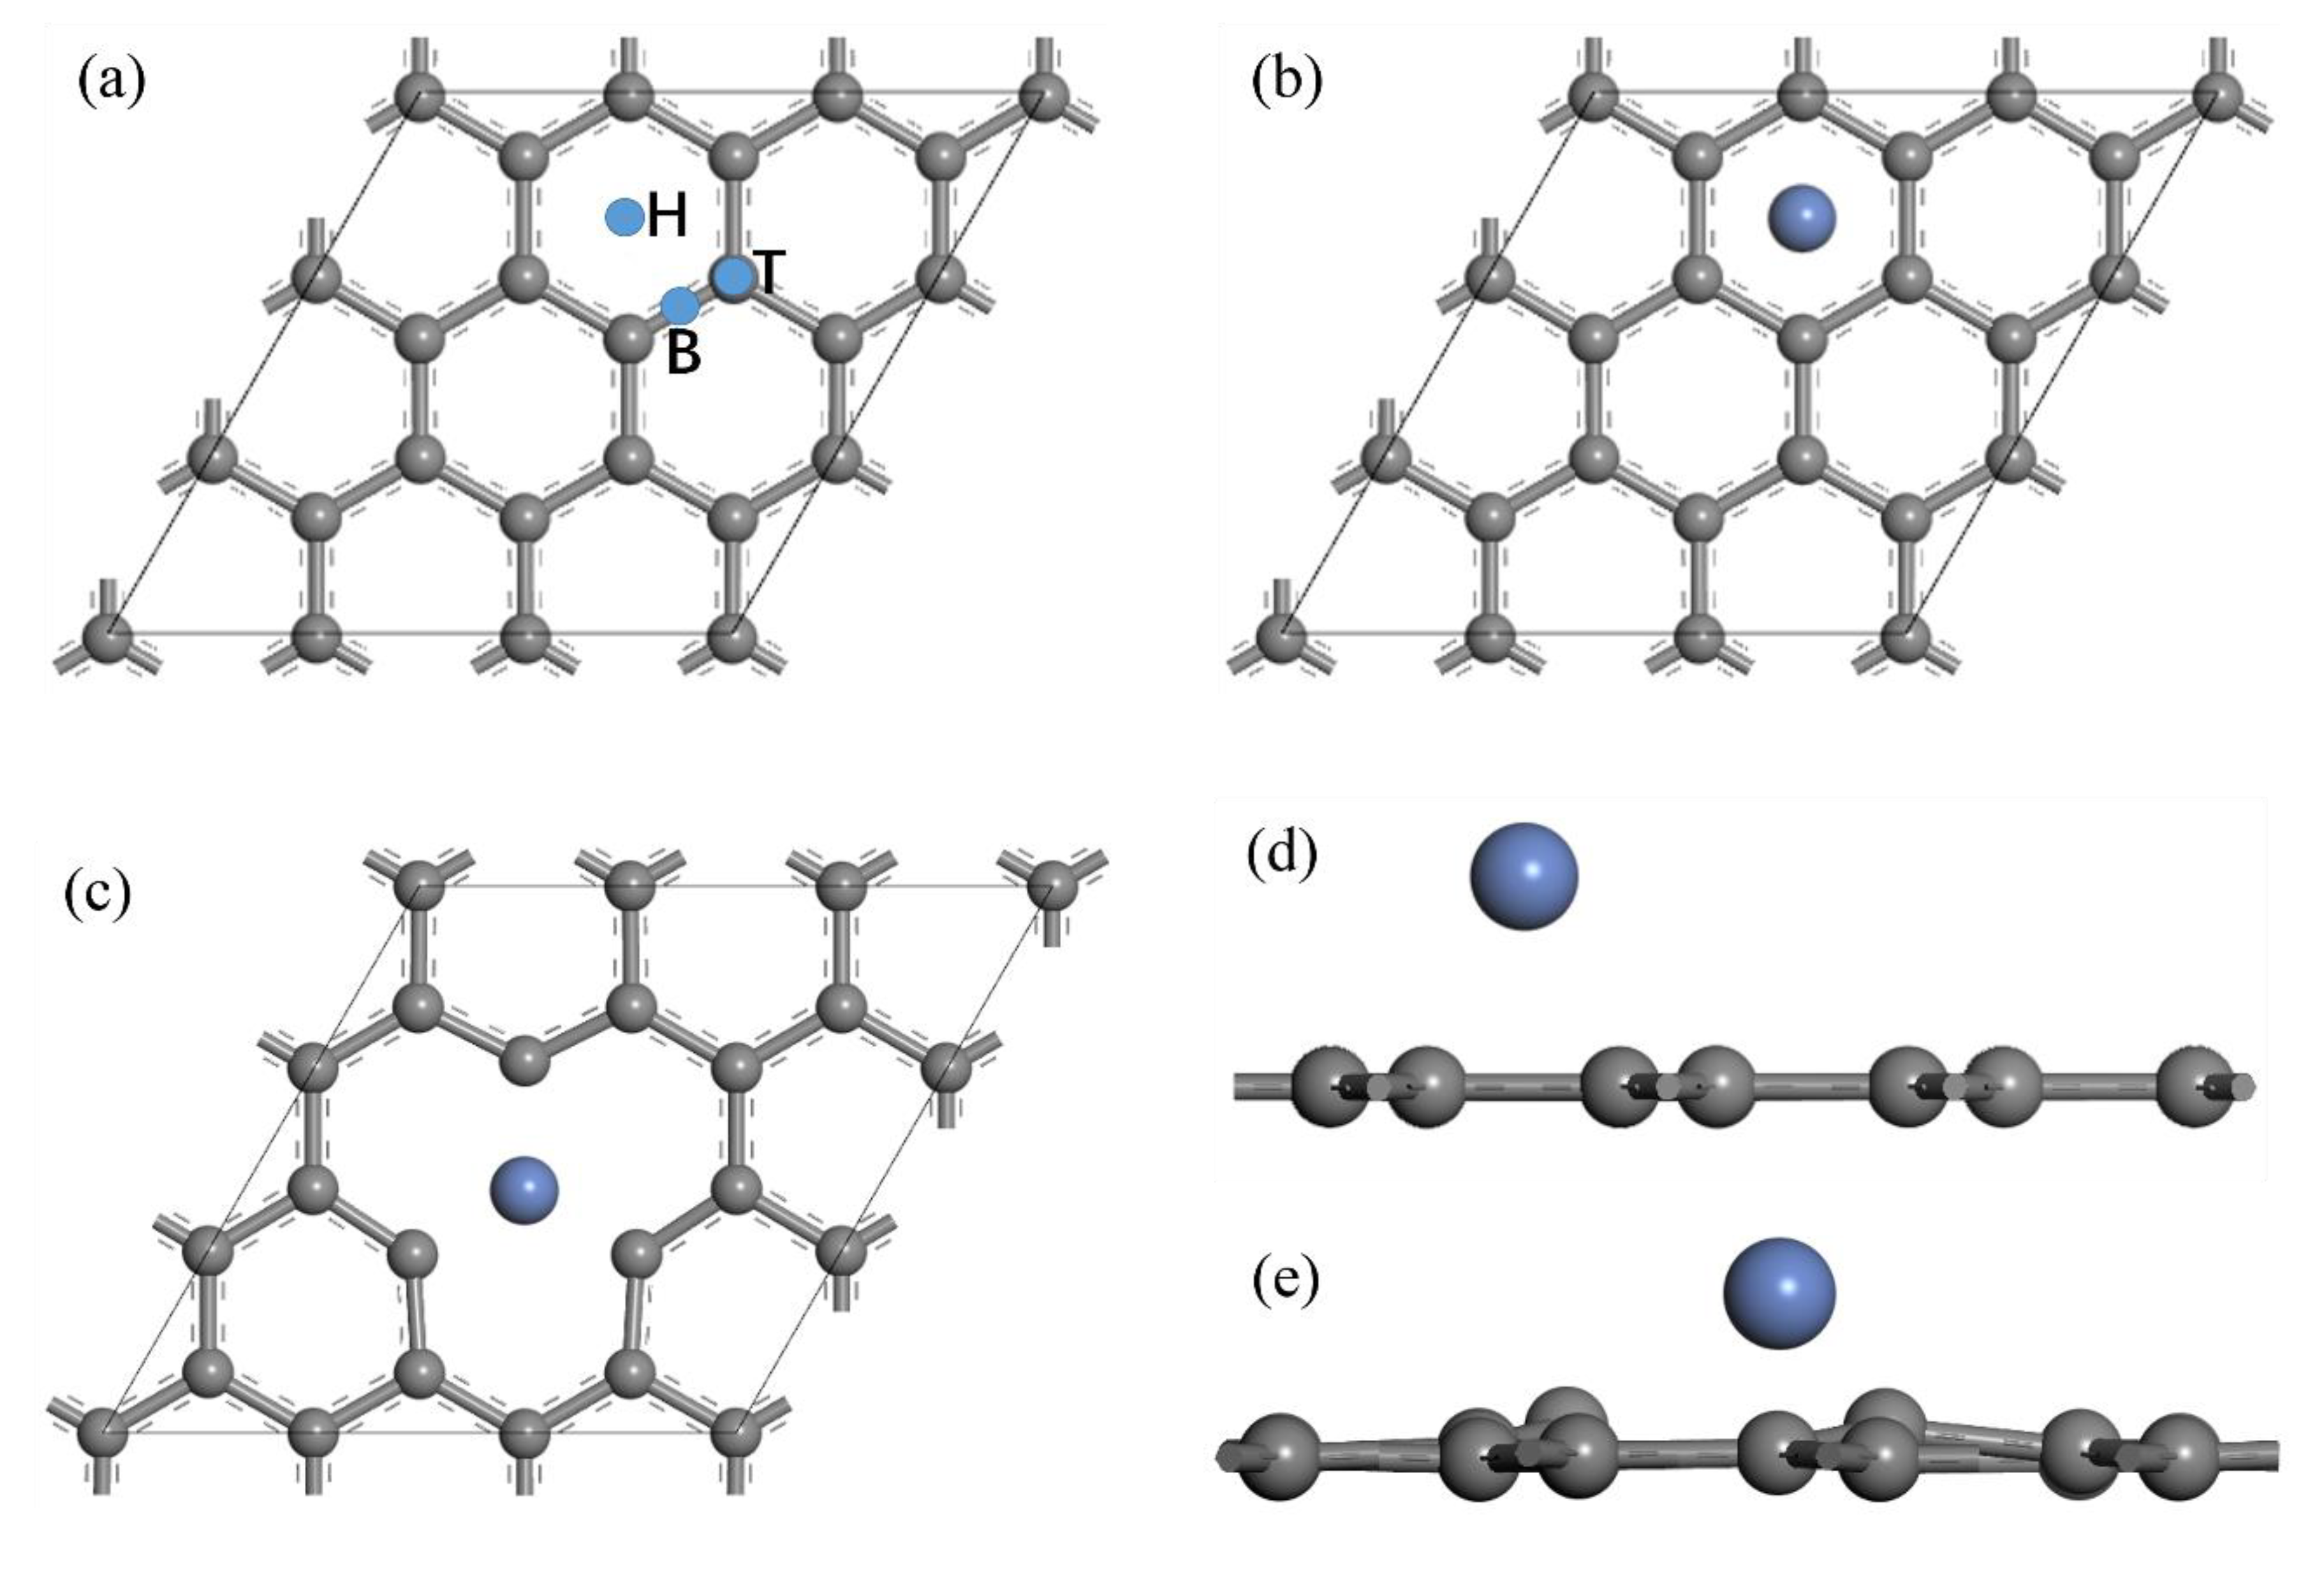
2.4. First Principle Calculation of the Adsorption Strength between Ni and GNSs

The original graphene cell was composed of two carbon atoms. In order to ensure the full interaction between graphene and nickel atoms, we constructed a 3 × 3 graphene super crystal cell box with lattice parameters of 7.38 Å × 7.38 Å × 18.00 Å. One carbon atom was removed to construct the defective graphene. The initial adsorption height of nickel atoms was 1.8 Å.
The cambridge sequential total energy package (CASTEP) based on the density functional theory was used to simulate the adsorption of Ni atoms on the graphene surface. The exchange correlation functional Perdew Burke Ernzerhof (PBE) general gradient approximation (GGA) was chosen to describe the interactions between electrons. Plane wave ultra-soft pseudopotential technology with cutoff energy of 300 eV was used to describe the interaction in and out of the delocalization. The k-point value was set to 2 × 2 × 1, and the reciprocal space integral was performed in the Brillouin region. The system was optimized by linear search with the Broyden Fletcher Goldfard Shanno (BFGS) algorithm, and the self-precisely converged parameters were chosen as follows: a maximum energy less than 1 × 10⁻⁵ eV/atom, a maximum force less than 0.03 eV/Å, a maximum stress less than 0.05 GPa, and a tolerance displacement less than 0.001 Å.

3. Results and Discussion

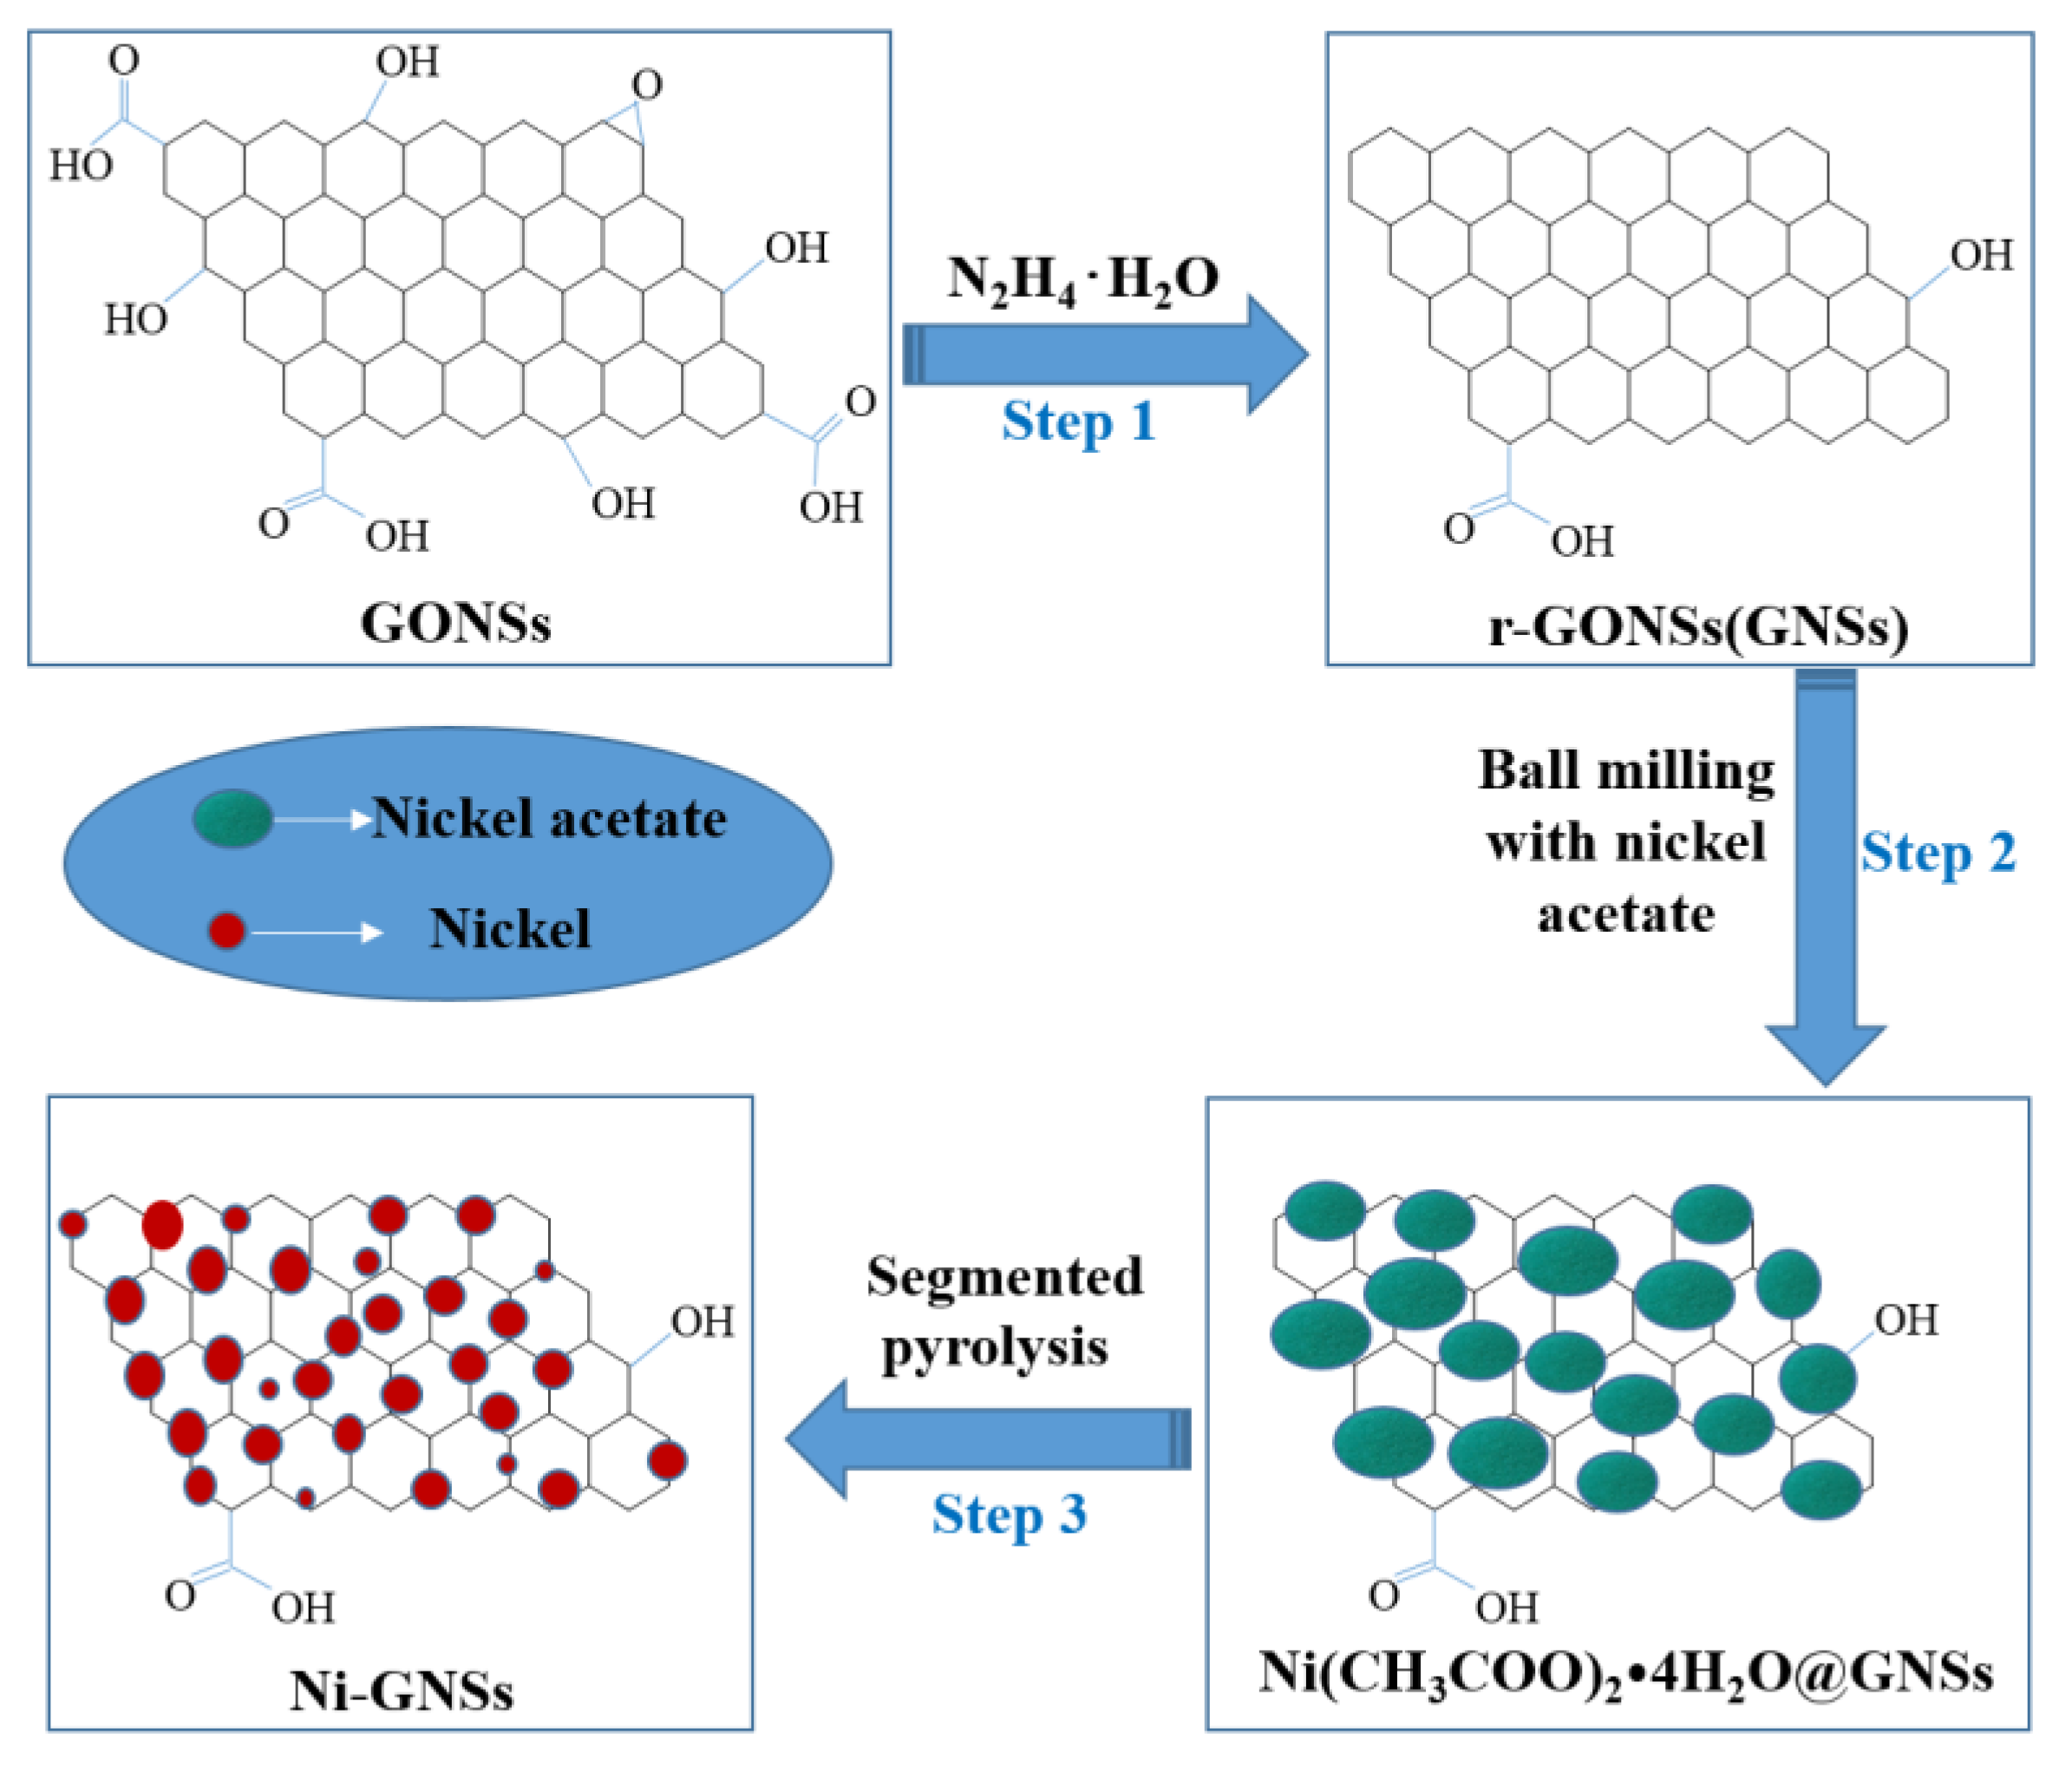
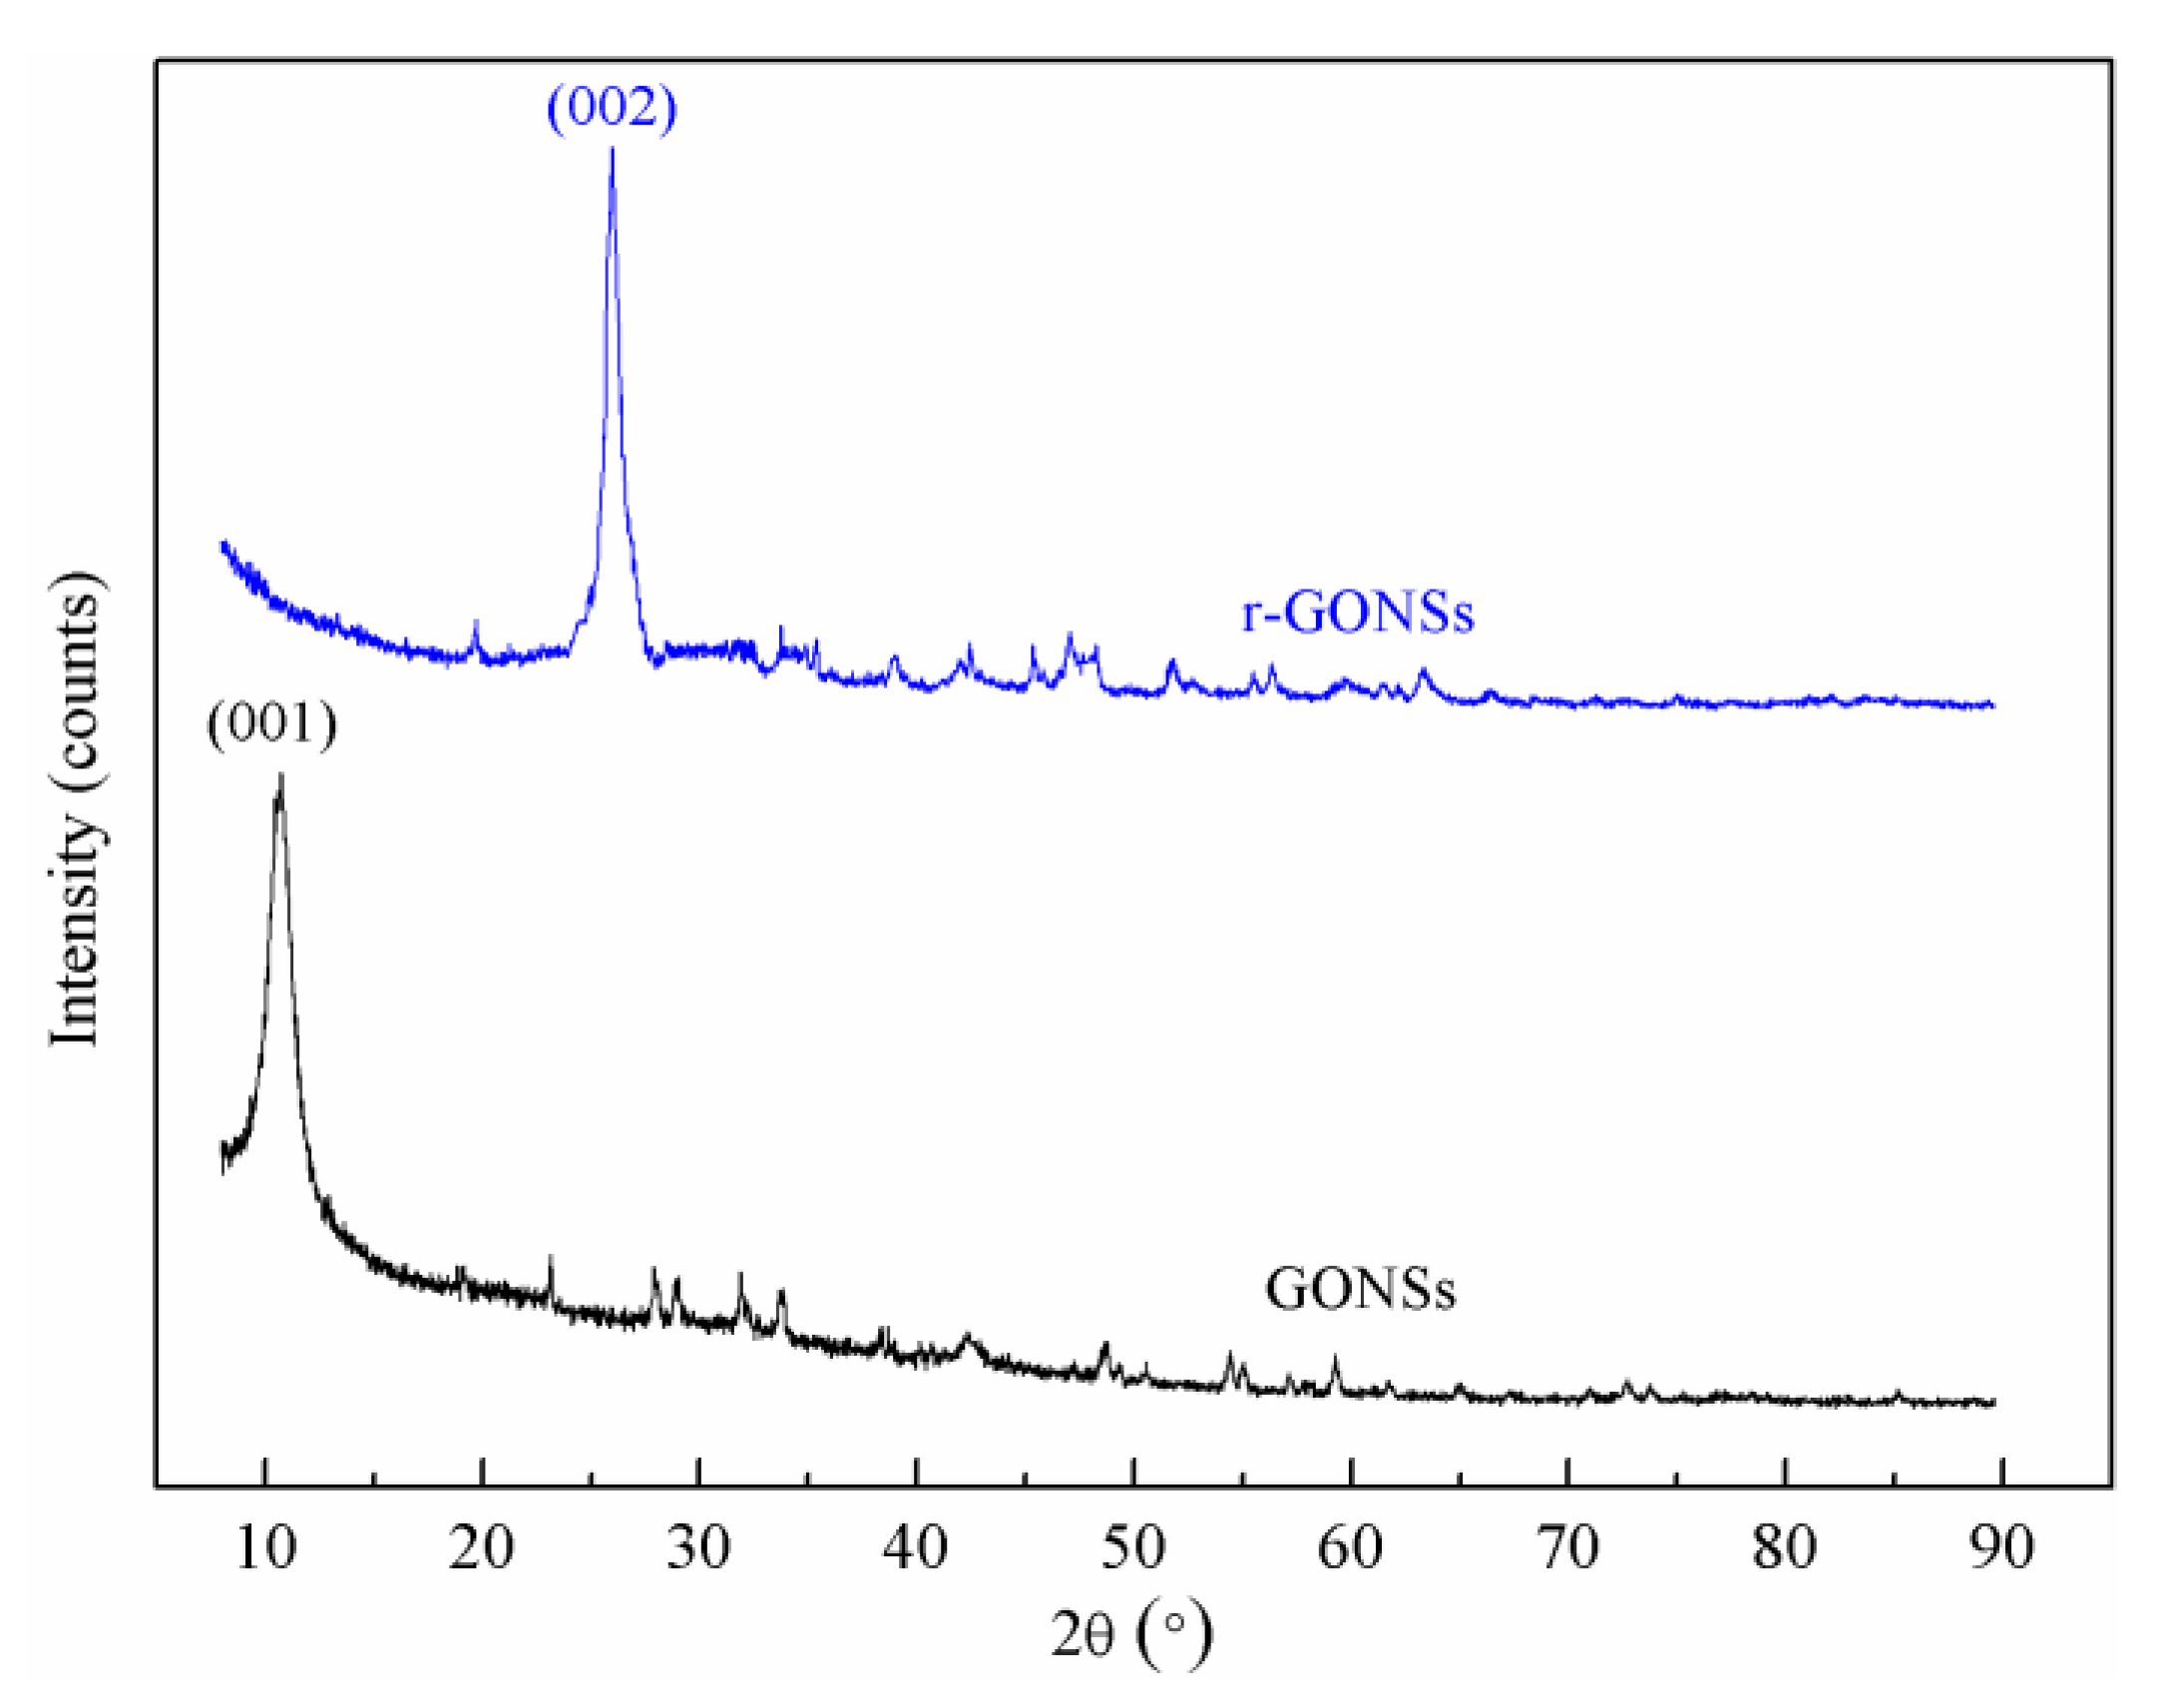
3.1. Pretreatment of GONSs

In view of GONSs with poor conductivity and mechanical properties, pretreatment is an important measure to improve these performances. The XRD patterns of GONSs in the pretreatment processes are shown in Figure 2.
The reflection at 2θ = 11.6° was the higher diffraction peak of the GONSs, corresponding to (001) plane of GONSs with a d-spacing of 0.75 nm [30]. After the mixture of the GONSs and the N2H4∙H2O solution were reflux reduced, the original diffraction peak at 2θ = 11.6° disappeared and a new higher characteristic peak was found at 2θ = 26°, which corresponded to the (002) plane of graphene with a d-spacing of 0.34 nm [31]. A decrease in d-spacings from 0.75 to 0.34 nm was observed due to GONSs reducing to r-GONSs, implying the removal of oxygen functional groups in GONSs [32].

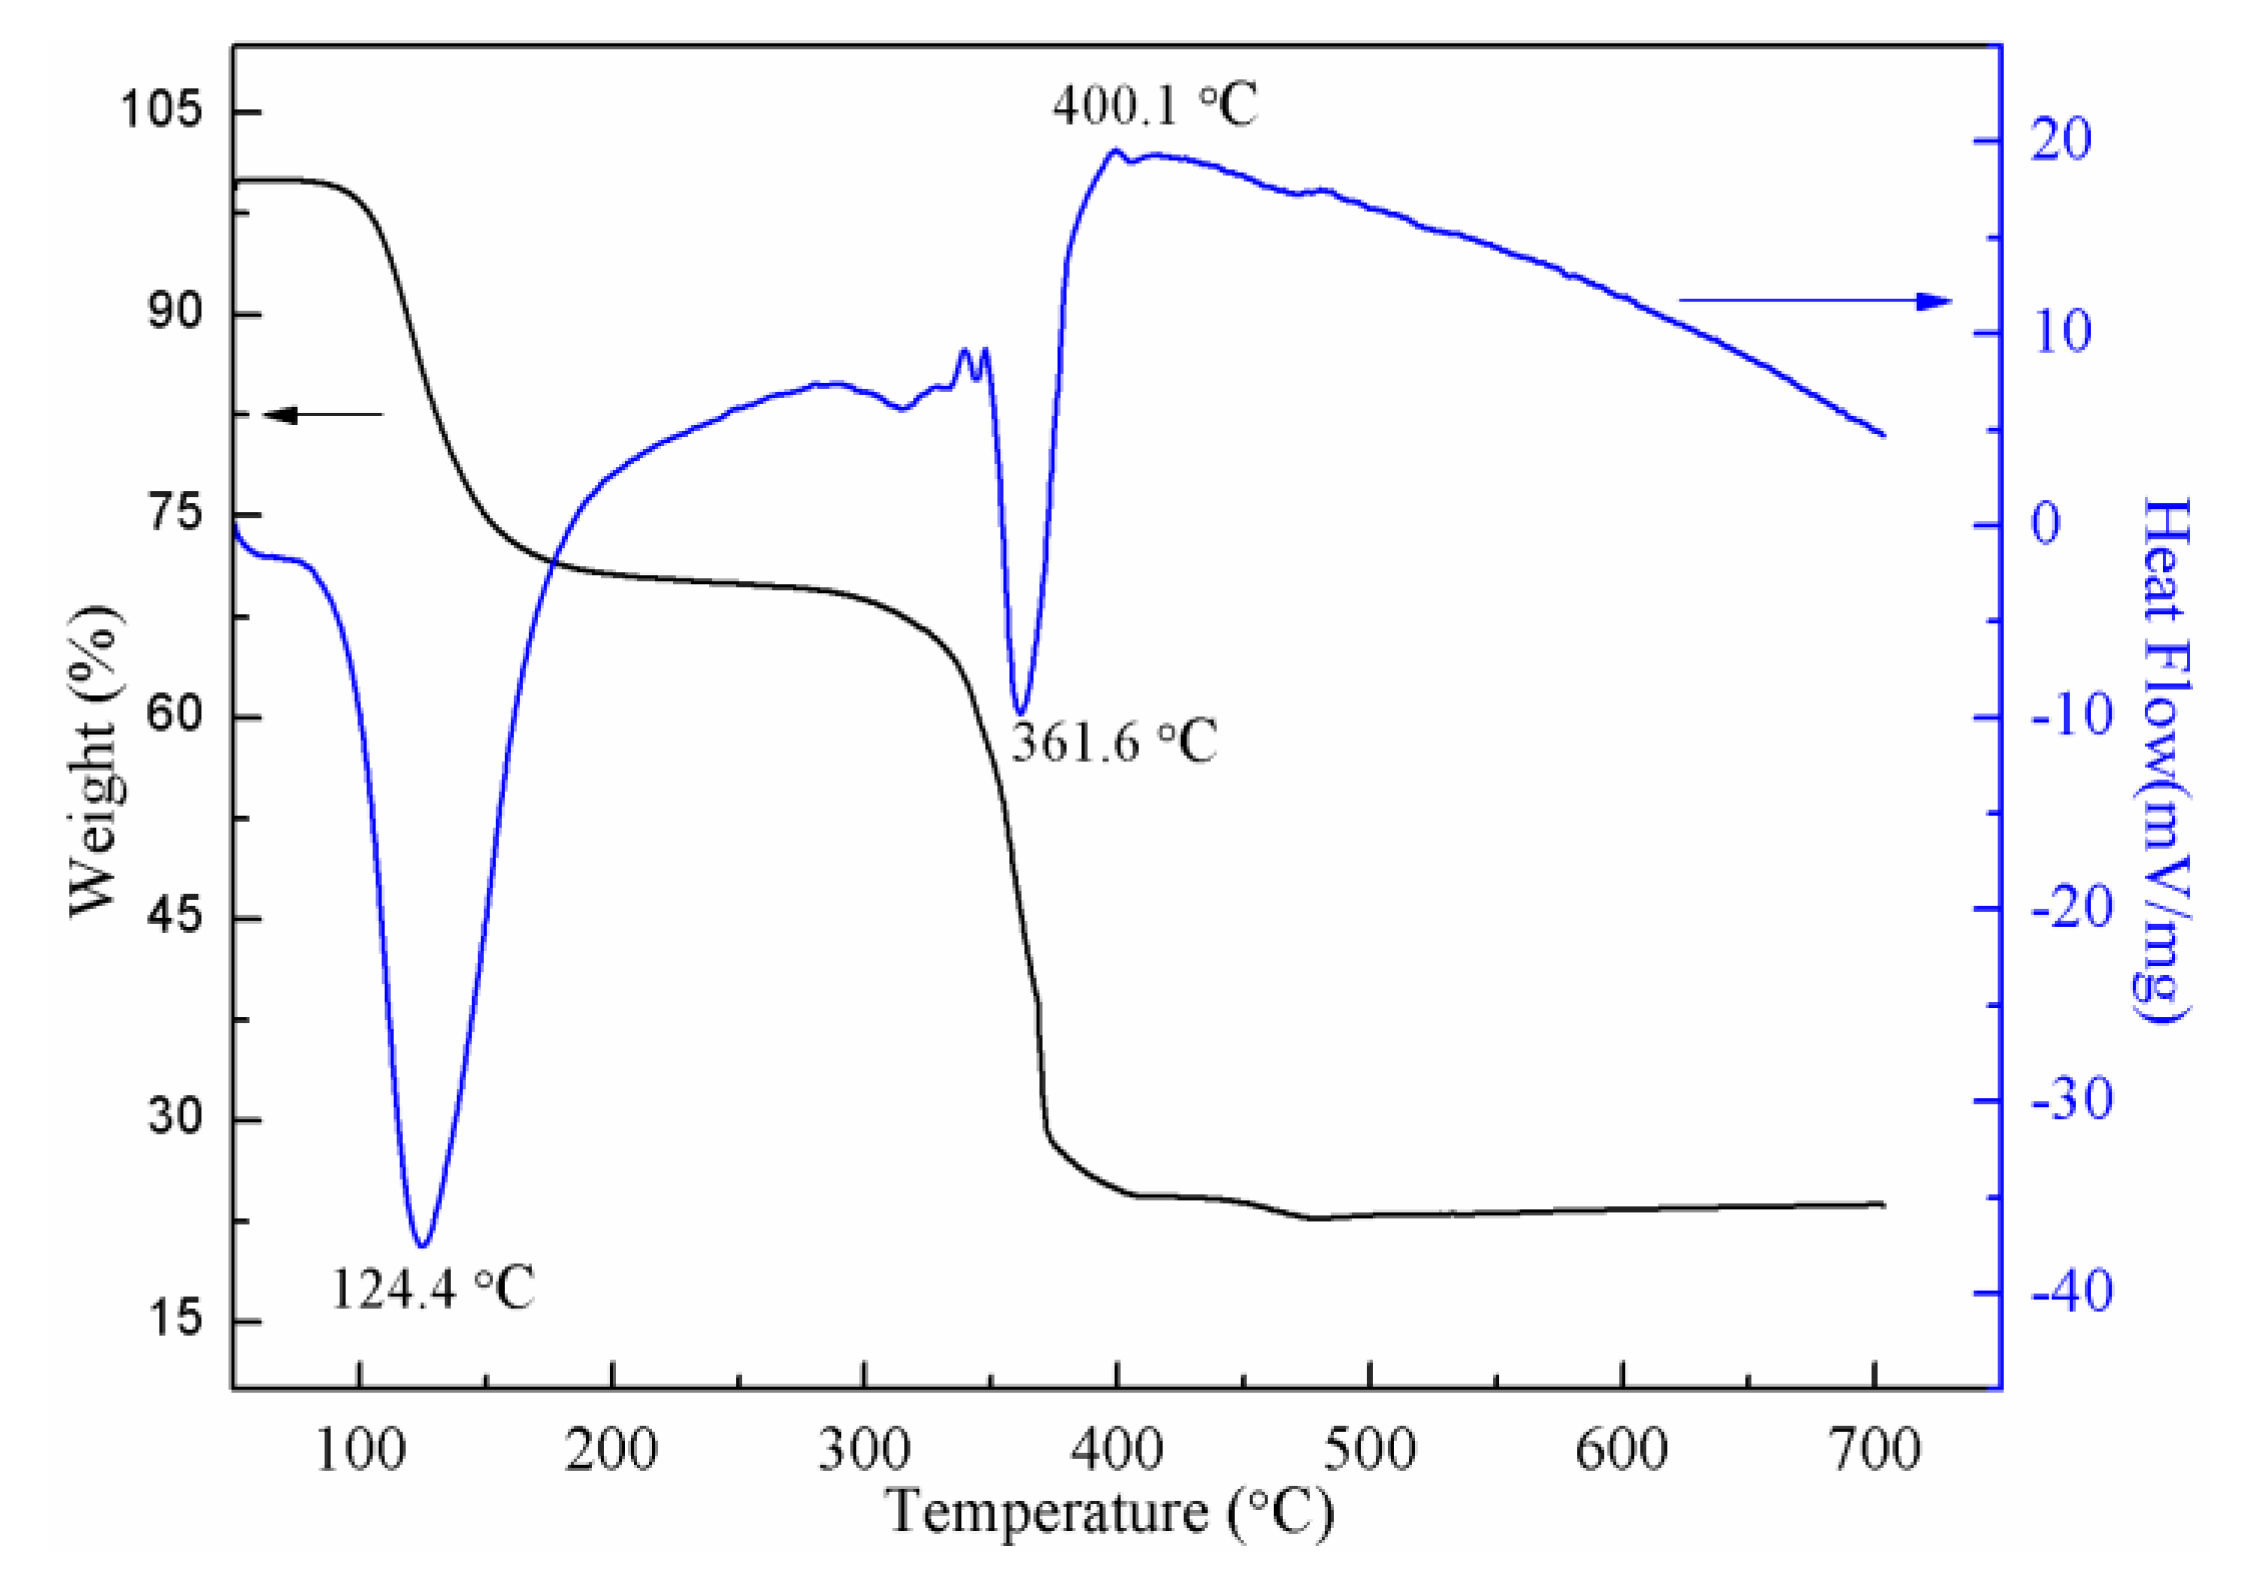
3.2. TG-DTA Analysis

The TG-DTA curves recorded for Ni(CH3COO)2∙4H2O@GNSs in the N2 atmosphere with a flow rate of 100 mL/min are presented in Figure 3. The heating program was 35–700 °C at a rate of 10 °C/min. The DTA curve shows that Ni(CH3COO)2∙4H2O@GNSs decomposition underwent two strong endothermic processes and a weak exothermic process. The mass of the mixture sharply decreased with the increase of temperature, which corresponded to the first endothermic peak (124.4 °C) on the DTA curve. The endothermic reaction was mainly attributed to the decomposition of Ni(CH3COO)2∙4H2O. When the temperature was between 200 and 300 °C, the mass almost remained unchanged, which meant that the first weightlessness stage finished and the ratio of weight loss in this stage was calculated to be about 29.4%. It was close to the theoretical weight loss ratio (28.9%) after the loss of the four crystal-waters. This result indicated that the water of crystallization was completely lost. The second strong endothermic peak near 362 °C in the DTA curve corresponded to the second weightlessness stage on the TG curve, indicating that anhydrous nickel acetate decomposed at this temperature. De Jesus et al. [33] reported that the thermal decomposition of nickel acetate involved the following set of reactions:
Ni(CH3COO)2 = NiCO3 + CH3COCH3 (330 °C)
NiCO3 = NiO + CO2 (330 °C)
NiO + CO = Ni + CO2 (373 °C)
The transformation temperatures reported here for the productions of NiO and Ni are in agreement with the peaks at the range of 330–400 °C in the DTA curve. The value of the weight retained was about 23.5% above 450 °C, as observed from the TG curve, which is very close to the theoretical residual value (23.6%) when the decomposition products are all nickel. This result shows that the final products were almost all the Ni particles, which is consistent with the reported literature by Galwey [34]. The weak exothermic peak at 400 °C can be explained from the reduction of nickel oxide and the adsorption of carbon dioxide on the surface of the graphene [35]. The reduction reaction is an endothermic reaction, and adsorption is an exothermic reaction, both of which were carried out concurrently. However, more heat was released, and the weak exothermic peak appeared as a result.

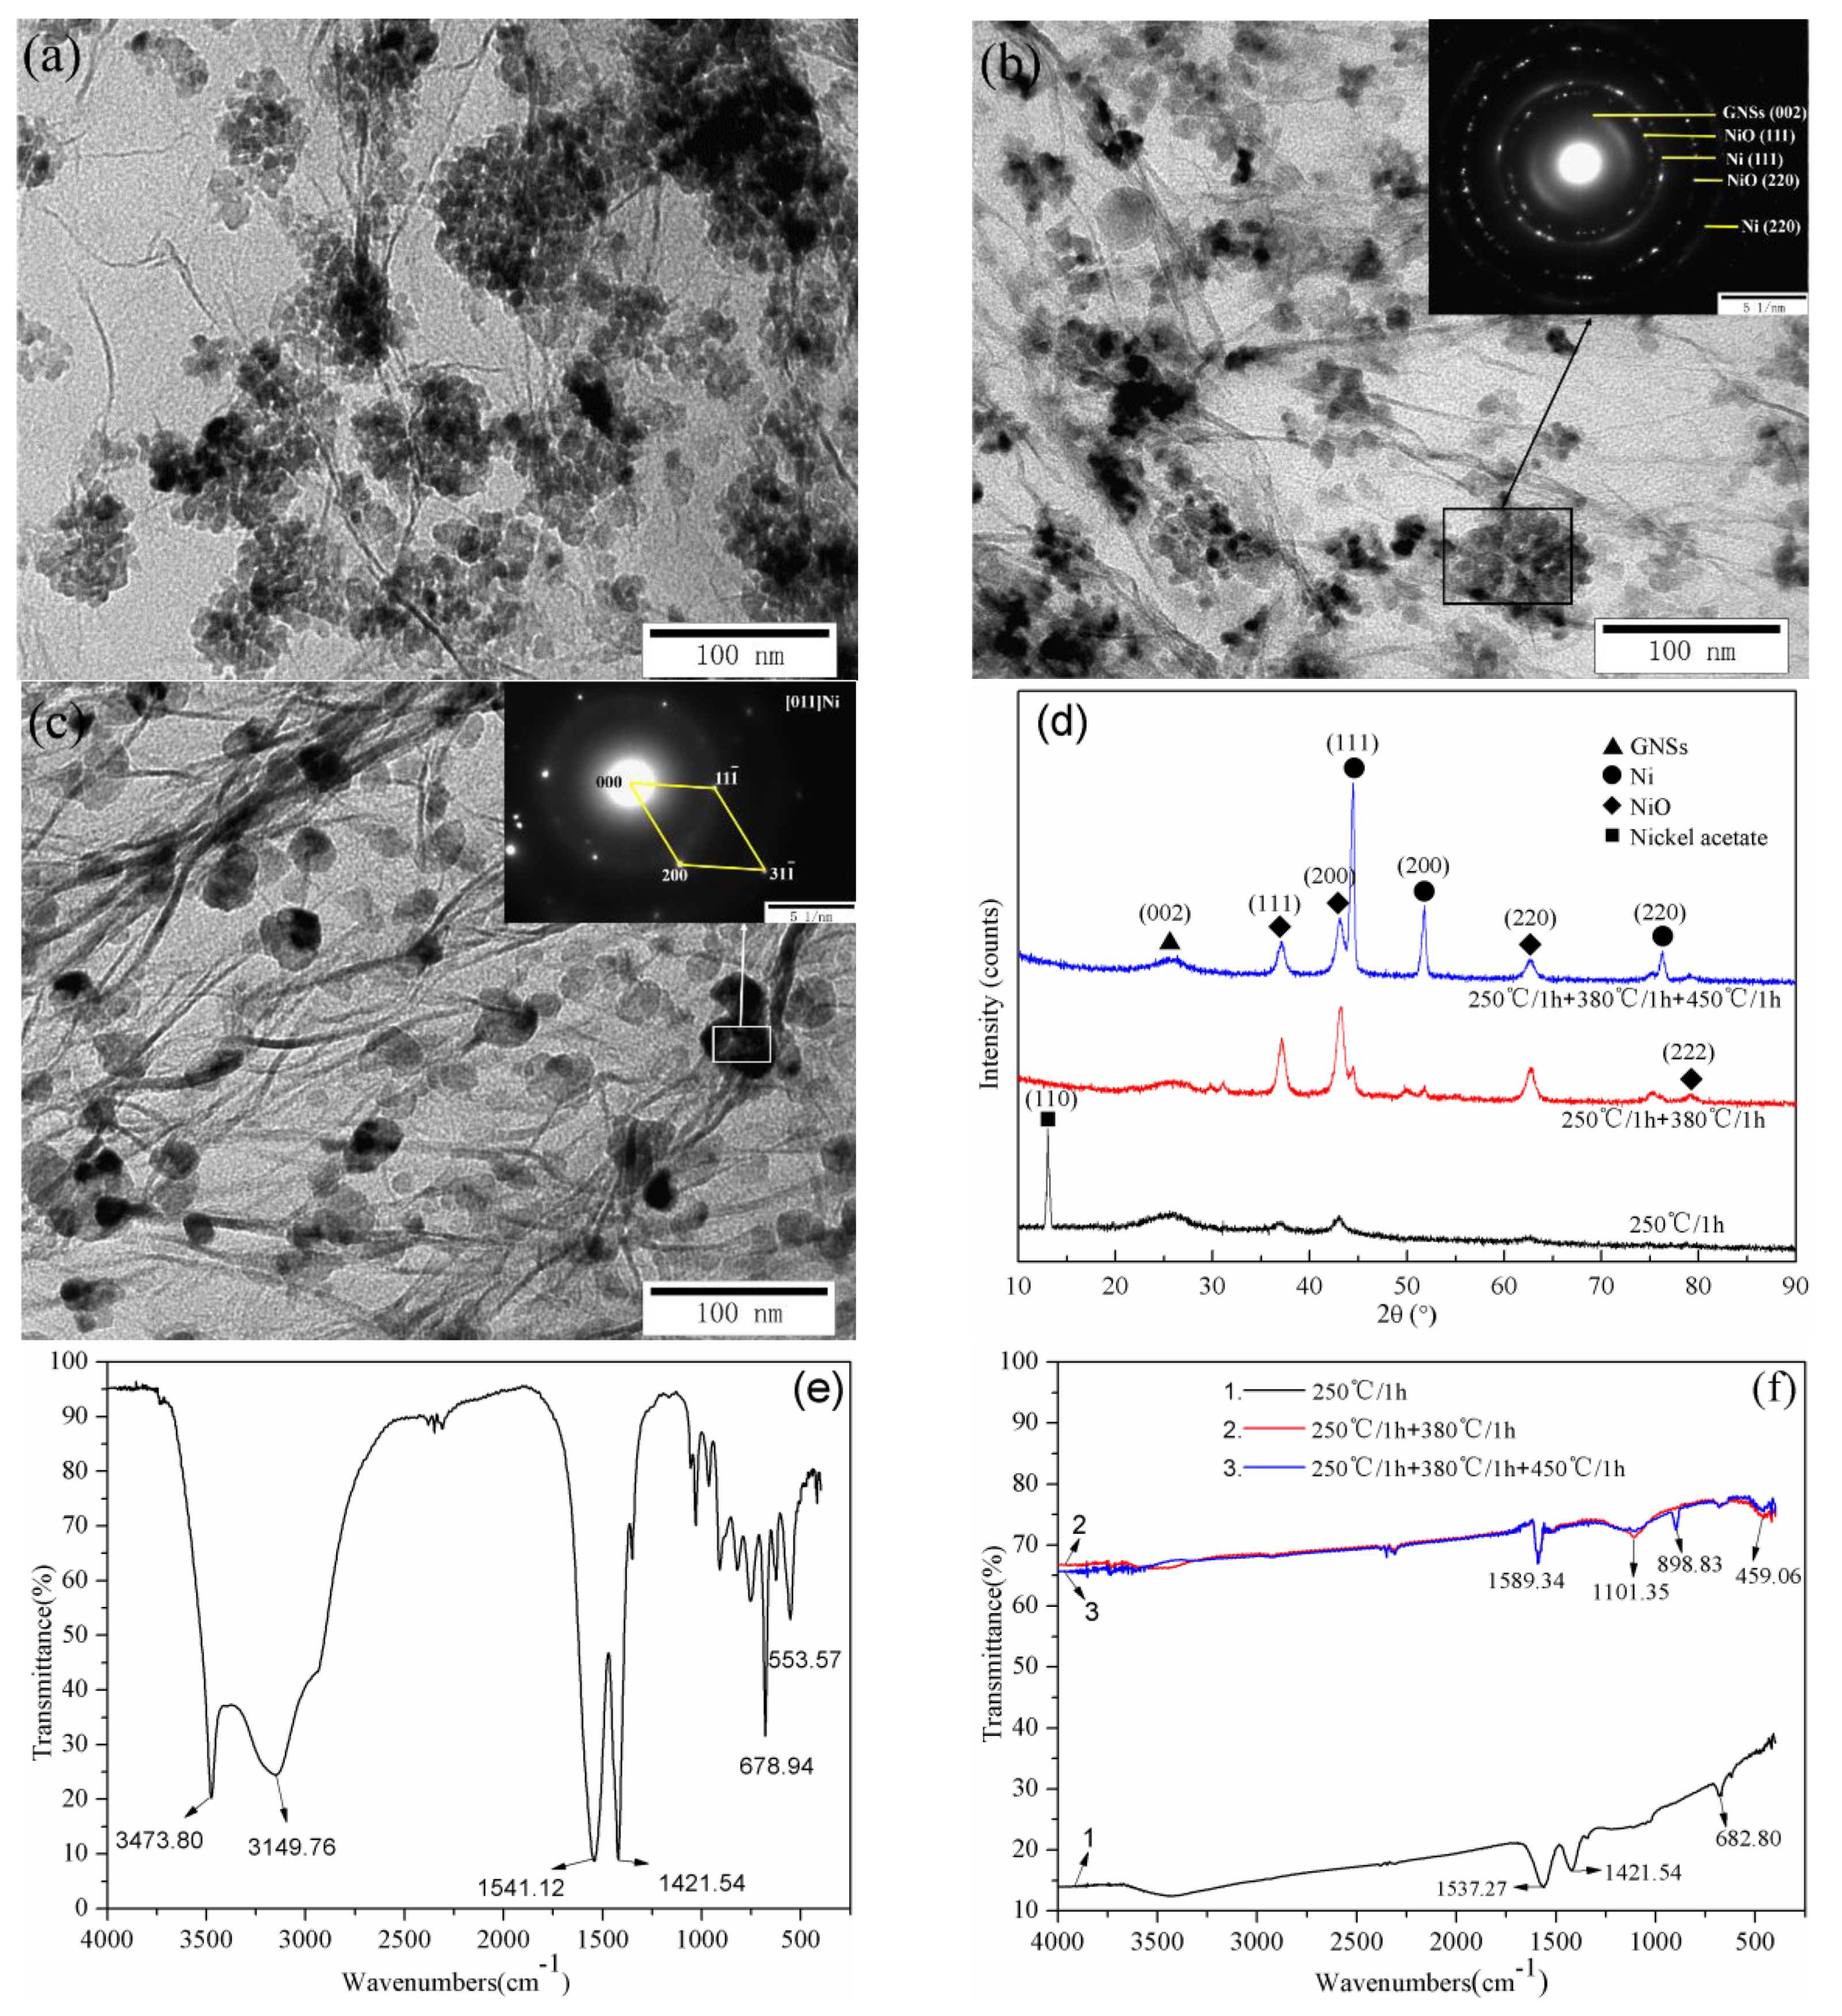
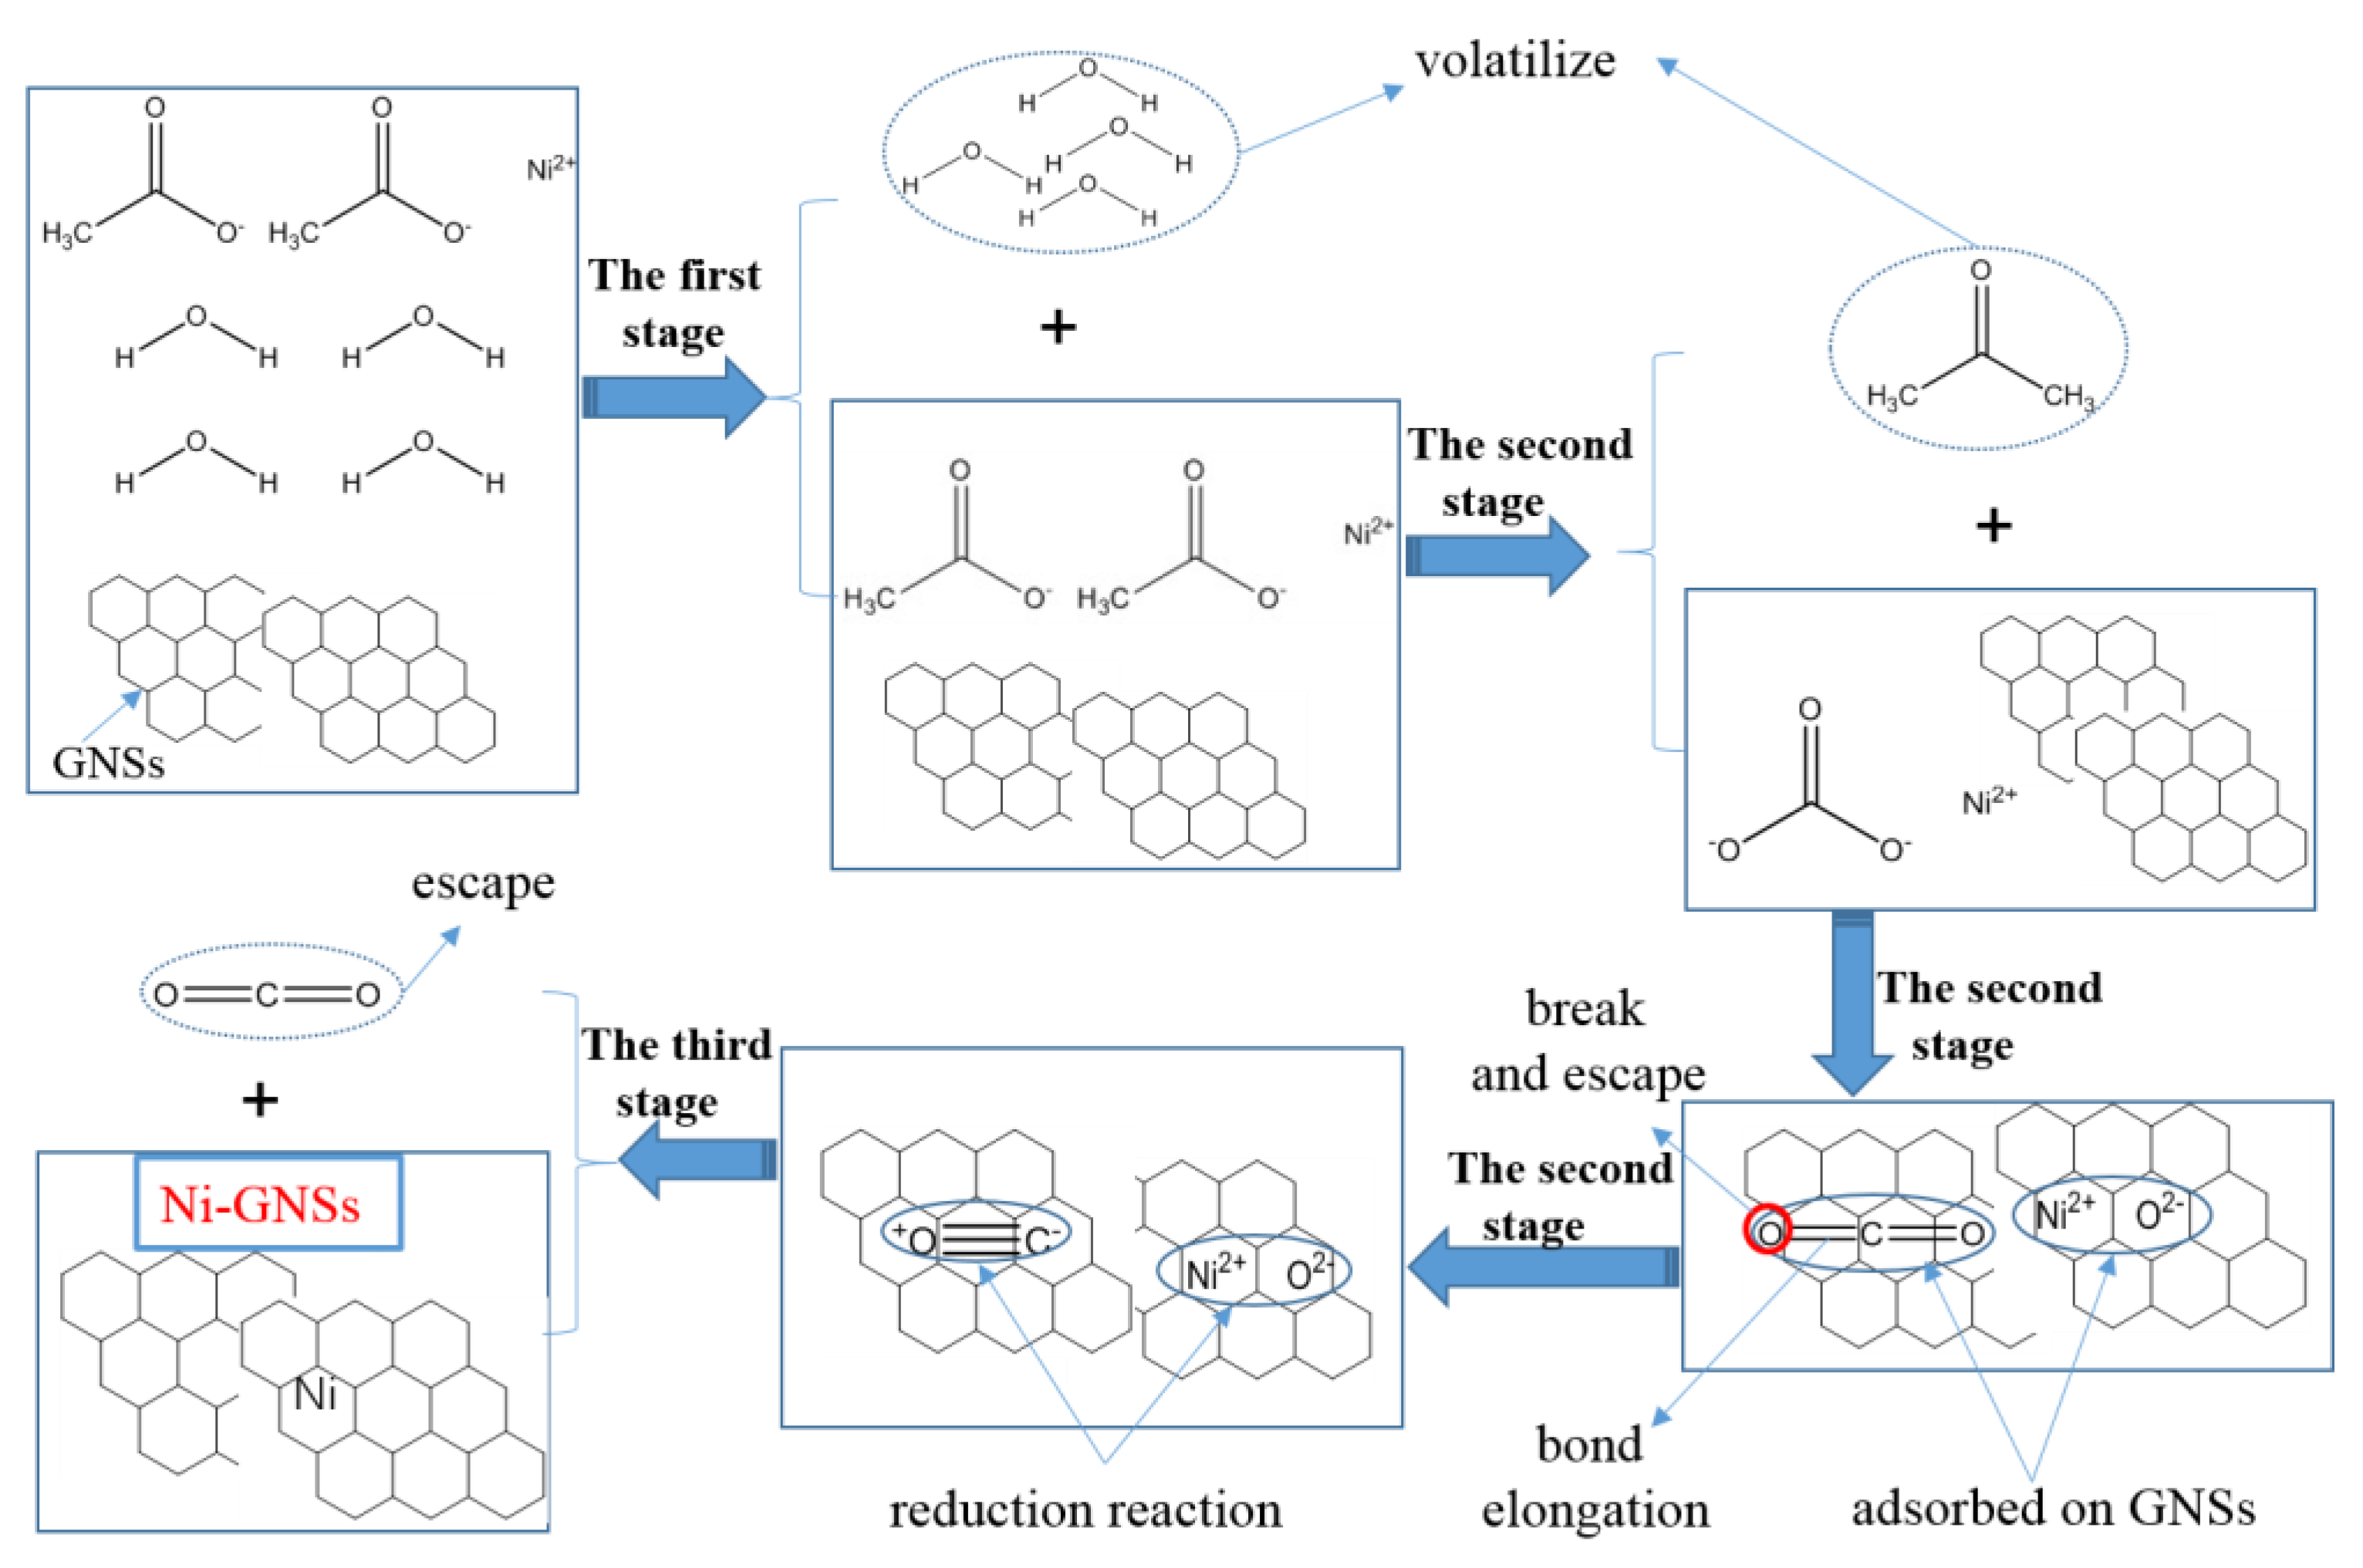
3.3. Segmented Pyrolysis Processes Analysis

Figure 4 shows the TEM images, XRD patterns, and FTIR spectra of nickel acetate tetrahydrate and the mixture of Ni(CH3COO)2∙4H2O@GNSs during the segmented pyrolysis processes. As observed in Figure 4a, after the first stage of treatment, honeycomb particles were uniformly spread on the surface of GNSs. The size of the particles was mainly distributed in the range of 20–100 nm, with some even reaching hundreds of nanometers. As shown in Figure 4d, the XRD spectrum of the Ni(CH3COO)2∙4H2O@GNSs mixture after the first stage exhibited typical patterns of the acetate, and the reflection at 2θ of 13° was the diffraction peak of the nickel acetate, corresponding to the (110) crystal plane of nickel acetate (PDF 25-0901). Besides, the other diffraction peaks observed at 2θ values of 26°, 37° and 43°, corresponding to the (002) plane of GNSs and the (111) and (200) planes of NiO, respectively, whereas the peak intensity of which were very weak.
The FTIR spectra of nickel acetate tetrahydrate are shown in Figure 4e. From the spectrum, at around 3474 and 3150 cm−1, there were strong peaks, which could be related to the O–H stretching vibration of the adsorbed water molecules. In addition, two sharp peaks located at 1541 and 1422 cm−1 corresponding to the vibration coupled peaks of C–O could also be found. When carboxylate was synthesized, the feature peak of the COOH group at 1710 cm−1 disappeared, and in turn, the symmetric stretching vibration peak at 1422 cm−1 and the anti-symmetric one at 1541 cm−1 appeared due to the generation of an R–COO group by ionization [36]. From Figure 4f, it can be seen that the O–H stretching vibration at 3474 cm−1 disappeared and the vibration coupled peaks of C–O remained at the same position, which indicated that the crystallization water was lost after the first stage.
Figure 4b shows a TEM image of the mixture after the first two stages of processing. The flocculent nanoparticles with sizes of 10–50 nm were uniformly spread on the wrinkles of the GNSs. A selected area electron diffraction (SAED) pattern (inset in Figure 4b) was recorded from the area shown in Figure 4b. The observed diffraction rings corresponded to the (002) lattice plane of GNSs, as well as the (111) and (220) lattice planes of NiO and Ni. At the same time, it can be seen that there were few diffraction spots on the diffraction rings of Ni, indicating that the crystallinity of Ni nanoparticles was lower. All these data are in agreement with the XRD results (Figure 4d). As the segmented pyrolysis progressed, the nanoparticles transformed into spherical or ellipsoid shapes, the sizes of which were mainly distributed in the range of 15–30 nm (Figure 4c). Compared with Figure 4a,b, the shape of the nanoparticles was regular and the particle size was homogeneous. As shown in Figure 4d, the narrow strong diffraction peaks observed at 2θ = 44.5°, 51.8°, and 76.4° could be assigned to the (111), (200) and (220) planes of Ni, while the peaks of NiO were very weak, suggesting the segmented pyrolysis processes were driven to completion and the Ni nanoparticle phase with high crystallinity was the main phase. The results are consistent with those shown in the SAED pattern (inset in Figure 4c). The interplanar spacing of 0.205, 0.174 and 0.107 nm corresponded to the ( 11 1 ¯ ), (200) and ( 31 1 ¯ ) planes of Ni, respectively, which belong to the [011] zone axis. The lattice constant of 0.3515 nm was very close to the theoretical lattice constant of Ni (0.3524 nm); therefore, we can conclude that the flocculent nanoparticles in Figure 4b and the spherical ones in Figure 4c were NiO and Ni, respectively. A large number of nanopores that appeared on the flocculent NiO could be attributed to gas diffusion in the NiO crystal [37].
This result was further confirmed with the FTIR spectra in Figure 4f. After the last two stages treatment, the vibration coupled peaks of C–O disappeared, and then the additional medium intensity peaks at 899 cm−1 (Ni) [36,38] and 459 cm−1 (Ni–O) [37] appeared, which indicated that the decomposition of nickel acetate had occurred. The Ni or NiO nanoparticles were obtained as a result, which was consistent with the result observed in Figure 4d. The characteristic peak observed at 1589 cm−1 and the weak peak at 1101 cm−1 corresponded to the C=C [39] and C–O–C vibration absorption peaks [40]. It was proven that the GONSs were reduced to GNSs, but slight GONSs left.

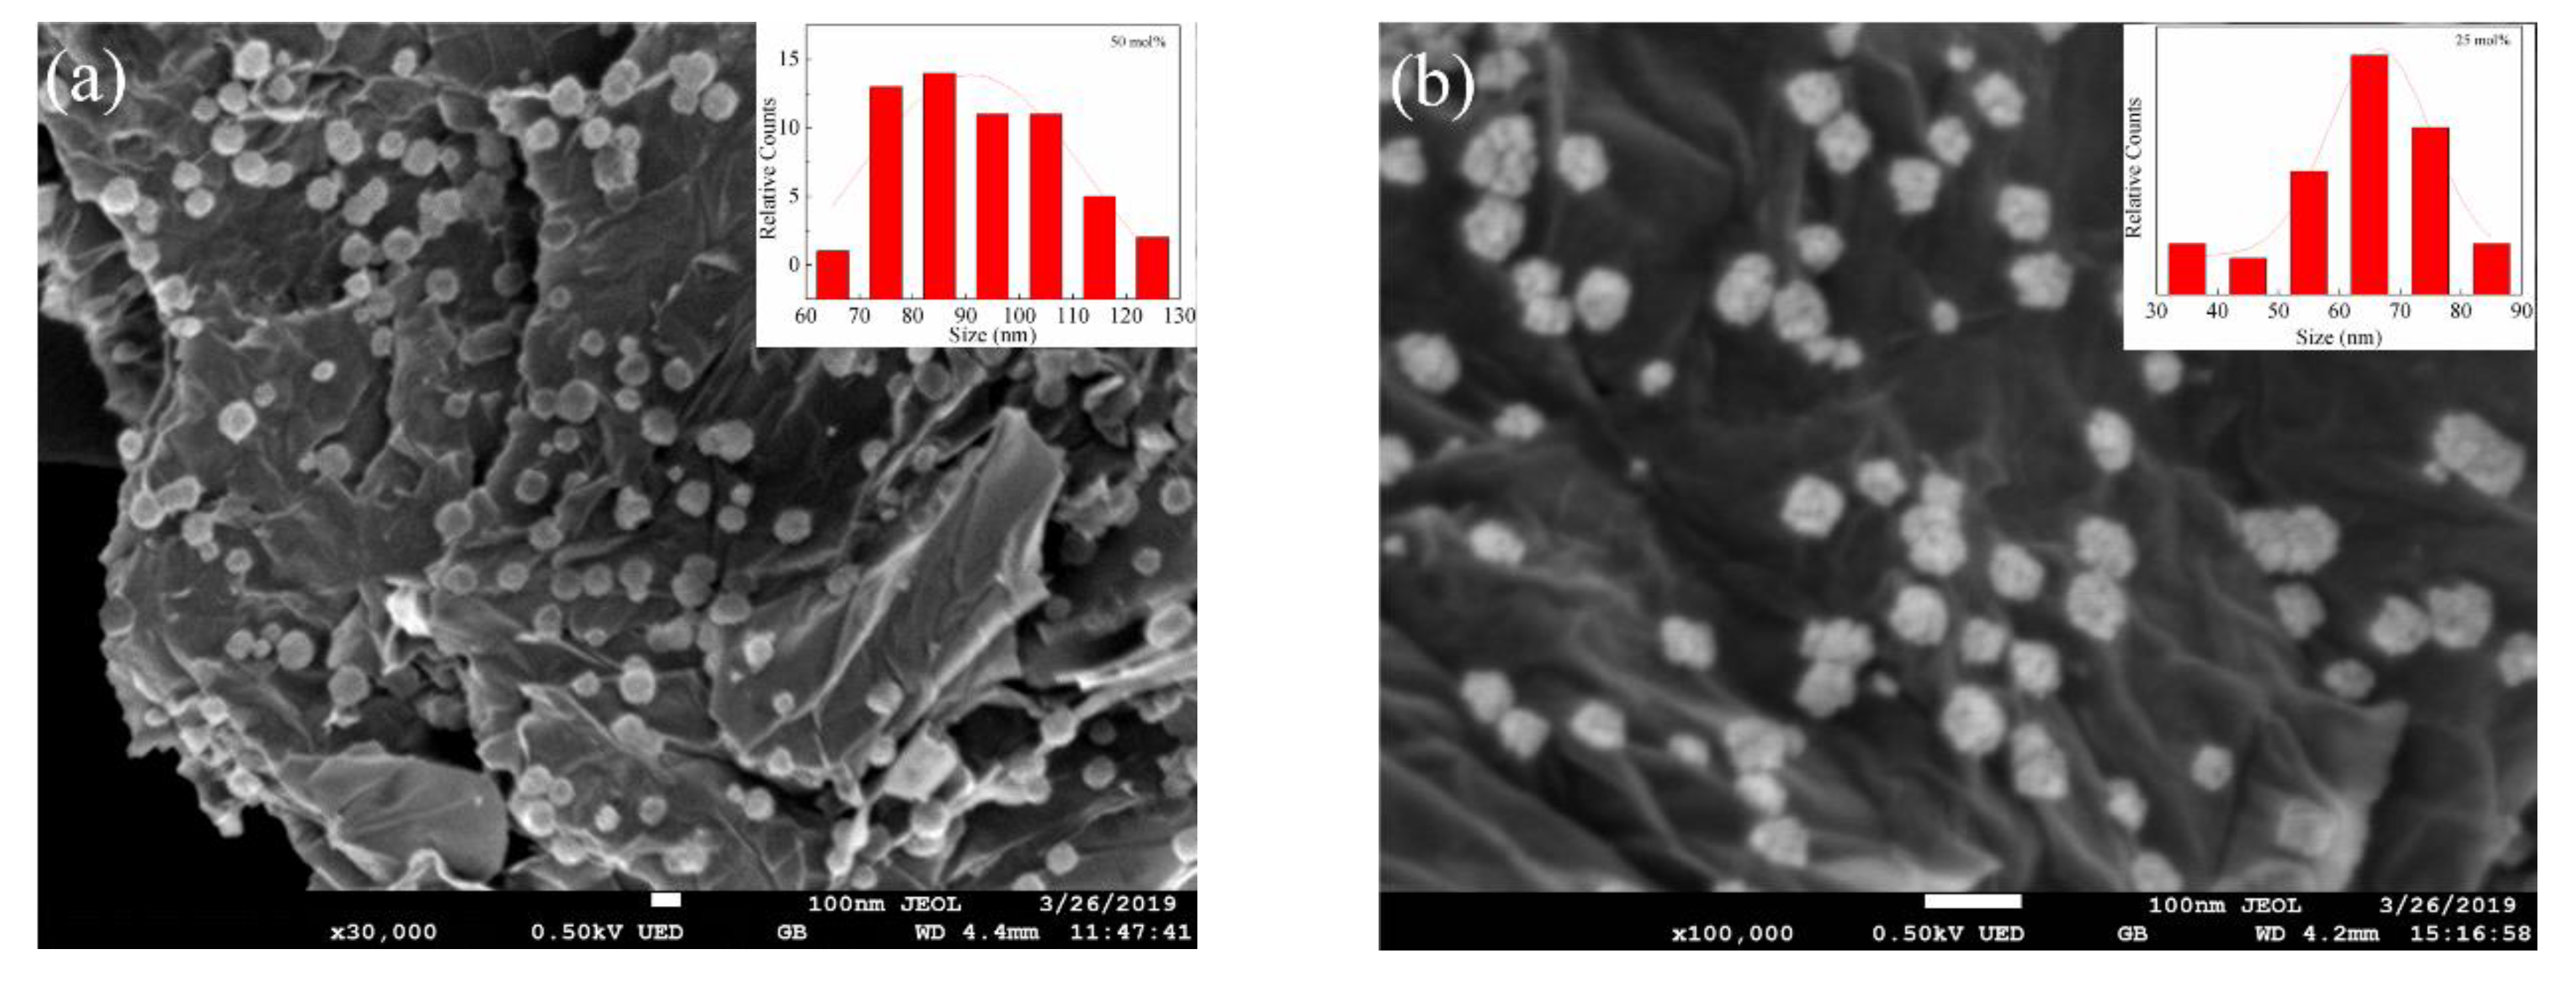
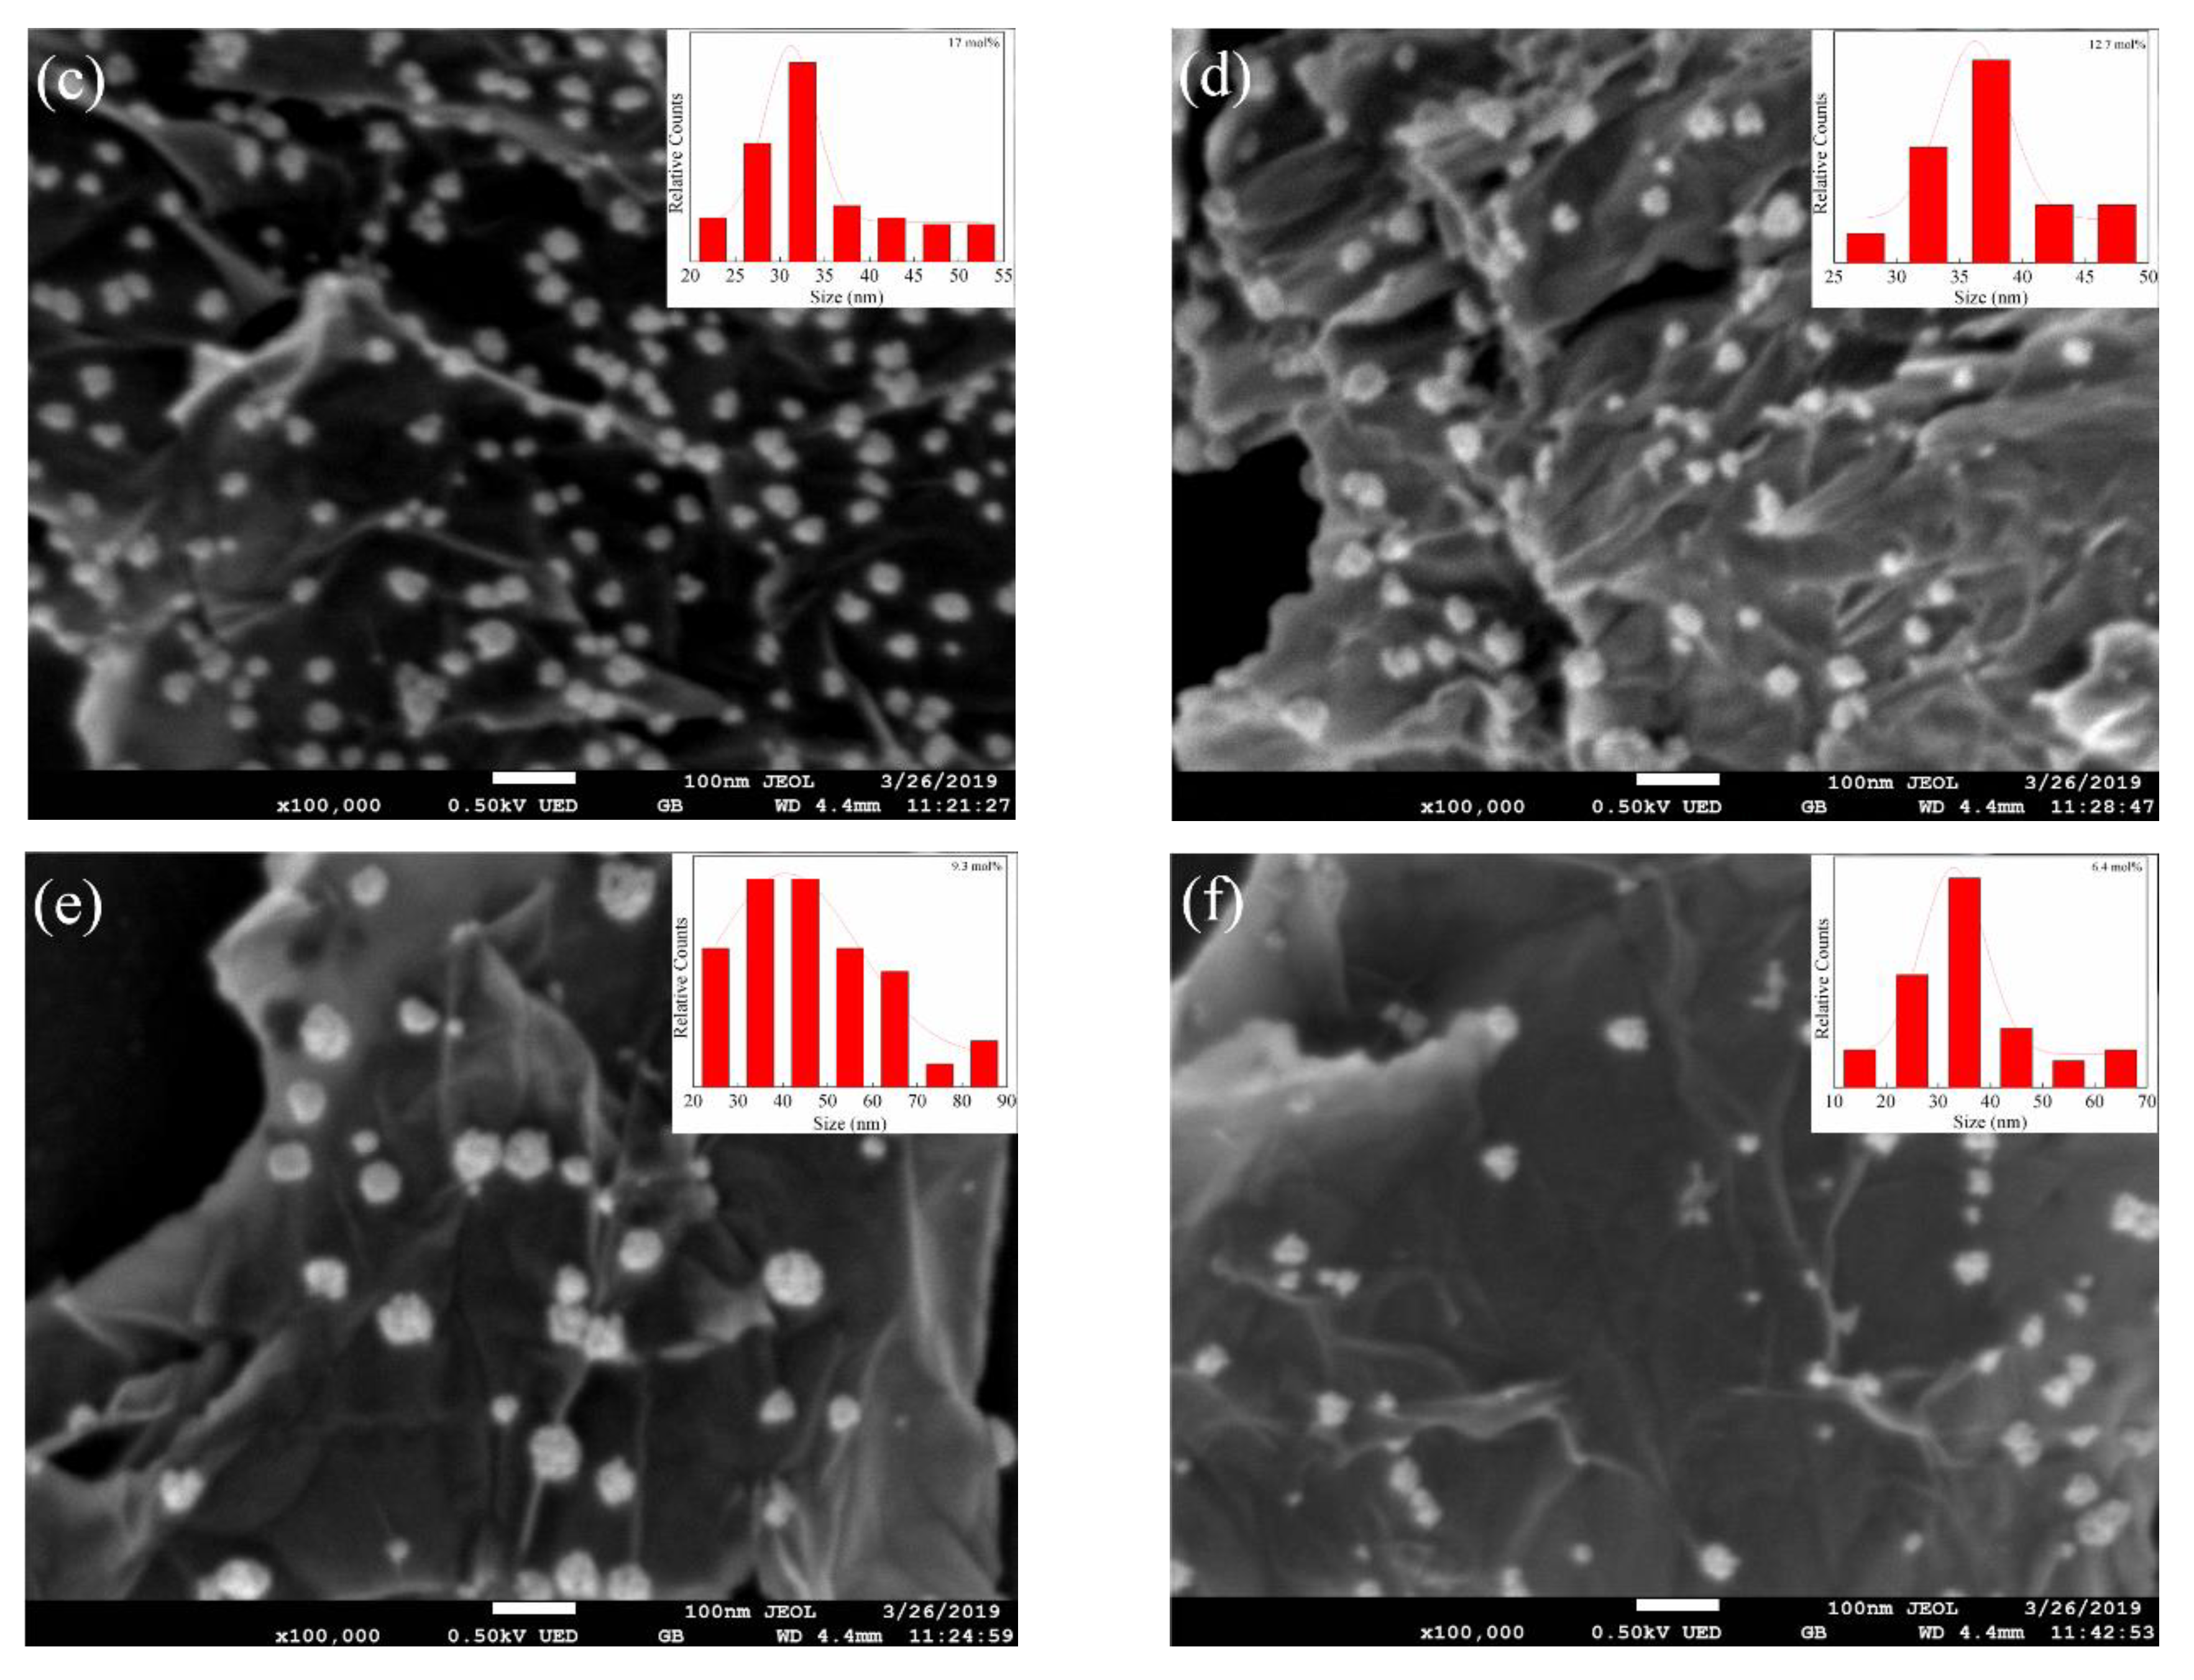
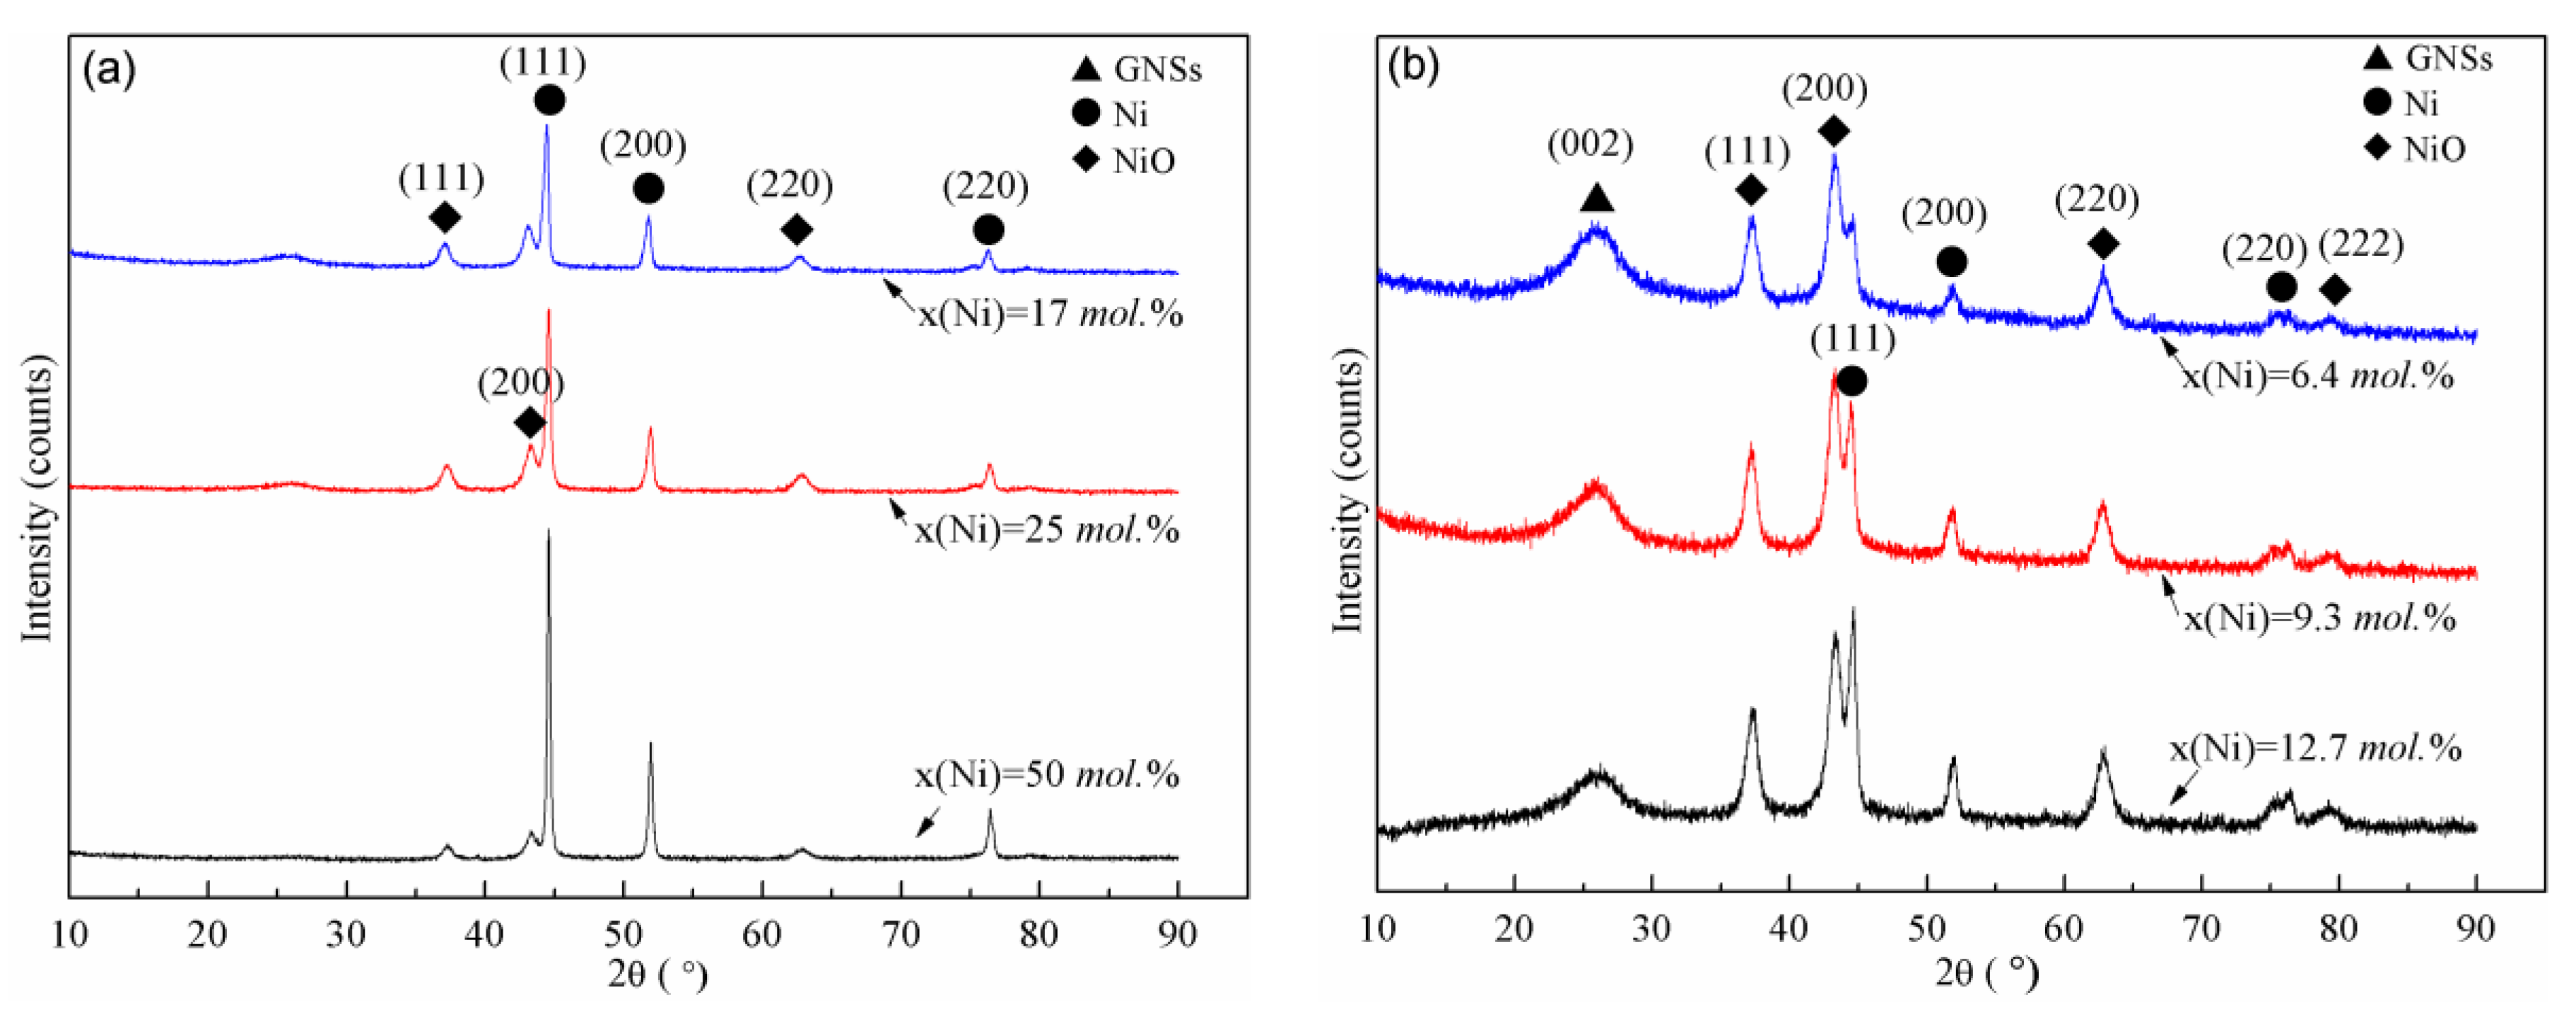
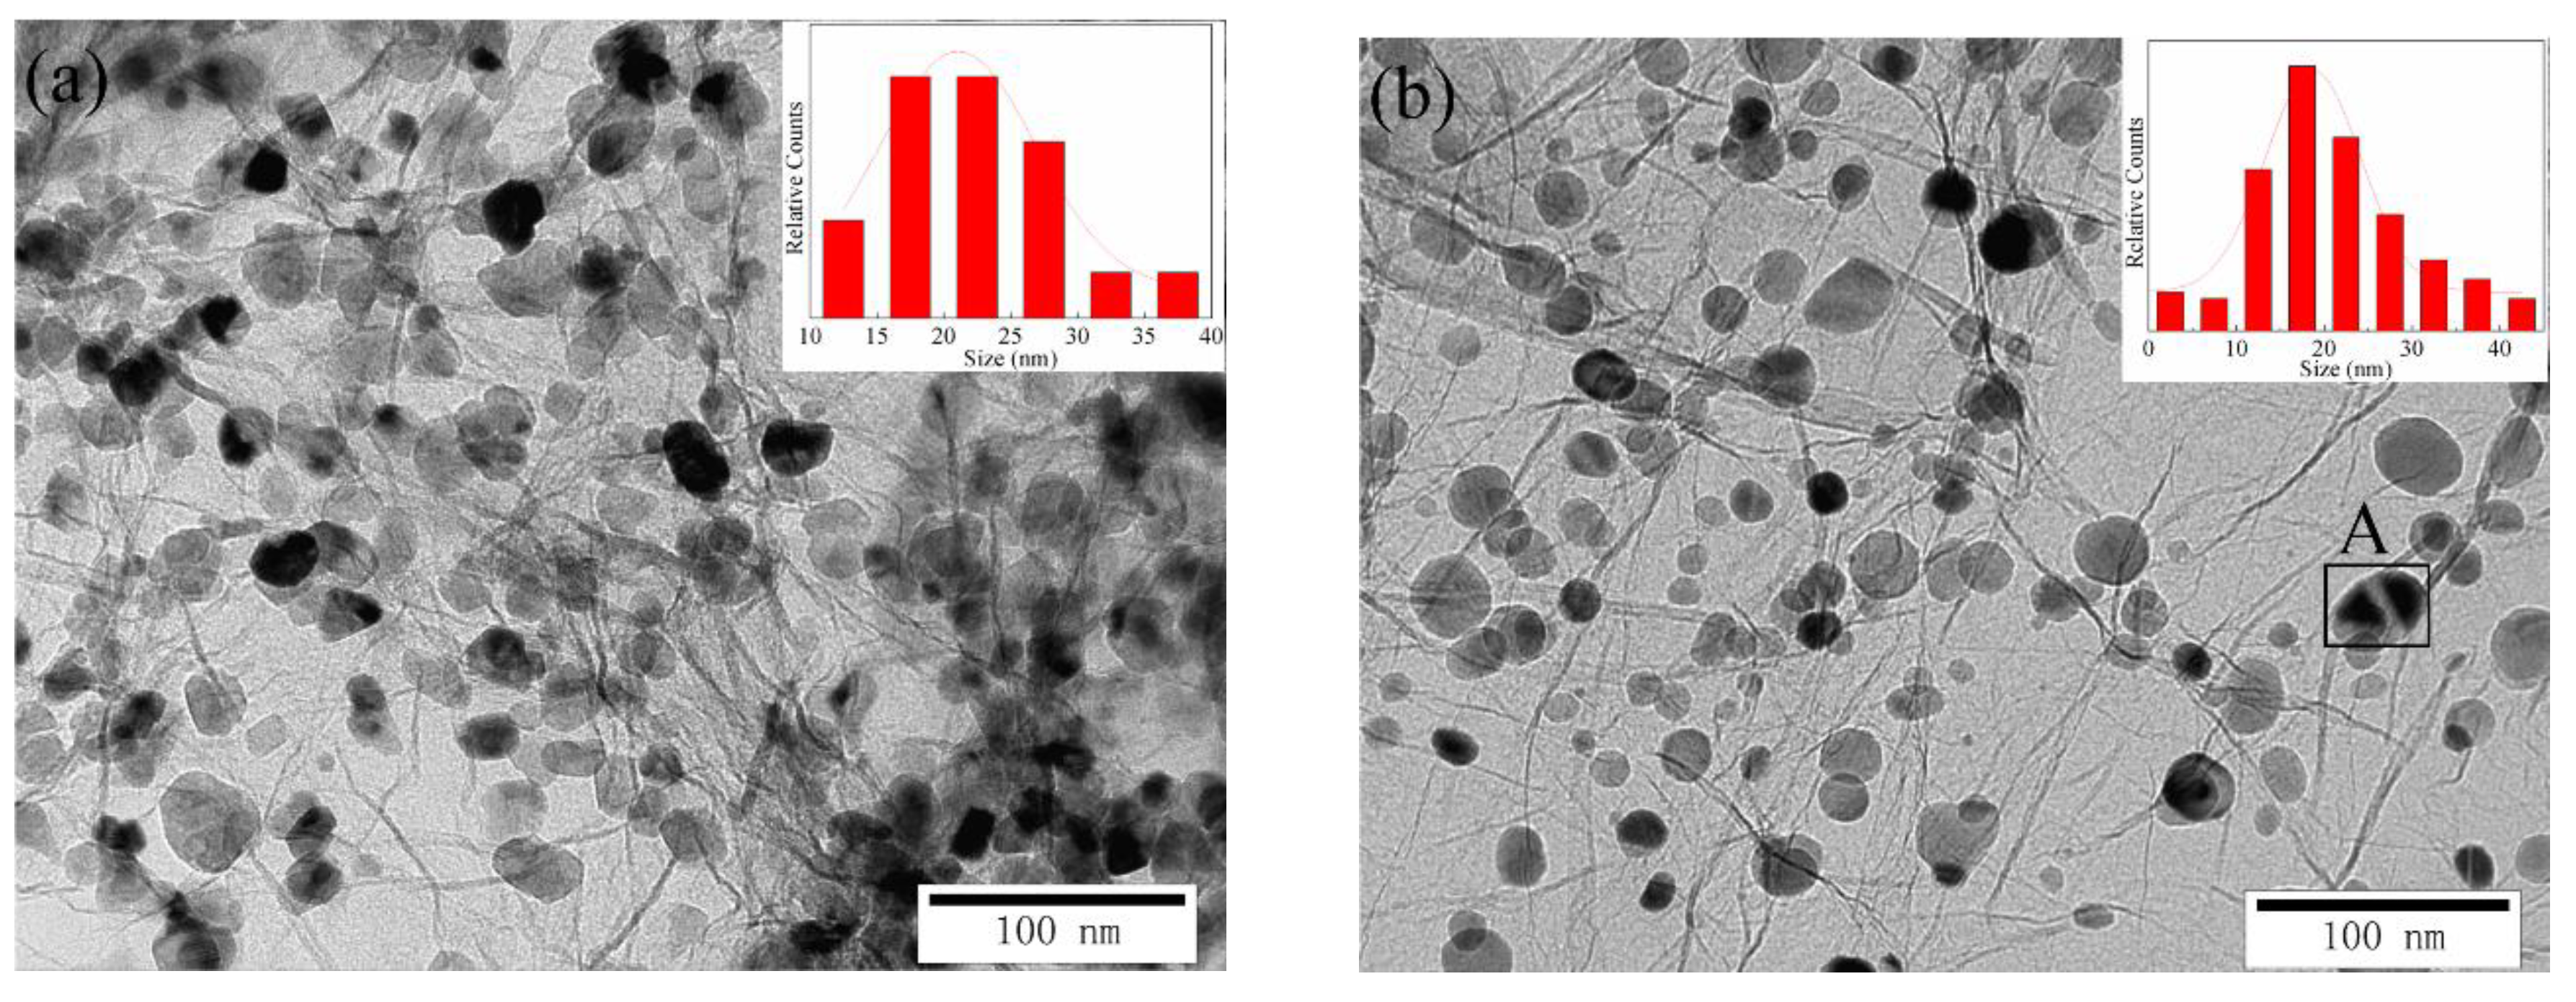
3.4. Effect of the Theoretical Ni Loading

Figure 5 shows the SEM images of Ni-GNSs with various theoretical Ni loadings.
It can be seen that the GNSs displayed a sheet-like structure with many wrinkles, and the Ni and NiO nanoparticles were uniformly distributed on the GNSs. The average size of nanoparticles decreased to the minimum and then increased with the decrease of Ni loading on the GNSs. For example, the average nanoparticle size was 90 nm for the 50 mol % Ni-GNSs (Figure 5a), whereas those of 17 mol % and 9.3 mol % loadings showed average particle sizes of 31 and 40 nm, respectively. When the theoretical Ni loading was not lower than 17 mol %, the theoretical Ni content was proportional to the average particle size of the nanoparticles. This trend could be correlated to a rather consistent number of nanoparticle active/growth sites on the surface of the GNSs in spite of the metal loading level [26]. Therefore, within a certain range, the distribution and size of the nickel nanoparticles on the GNSs surface could be controlled by changing the theoretical load of nickel under the same preparation conditions. A further decrease of the theoretical Ni loading resulted in an increase of the nanoparticles size, suggesting that phase transformation may have taken place on the surface of the GNSs.
The XRD patterns of the Ni-GNSs with various theoretical Ni loadings are shown in Figure 6. The diffraction angle did not change with the theoretical Ni loading, suggesting that the reaction products remained unchanged. As the theoretical Ni loading decreased from 50 to 6.4 mol %, the conversion gradually decreased as seen from the decrease of the Ni peaks and the concurrent increase of the NiO peaks in the XRD patterns. The main pyrolysis products were Ni nanoparticles when the theoretical Ni loading was not lower than 17 mol %. With further decrease of the theoretical Ni loading, the main reaction product was transformed into NiO, the size of which was large and porous. This result also further verified the fact observed from Figure 5.

3.5. Adsorption Strength of Nickel on Graphene Surface

The interface bonding strength between Ni and the GNSs is the key factor for Ni-GNSs as the reinforcement of a lead-free composite solder. The structure stability and interface bonding strength of the Ni-GNSs were evaluated by a morphology observation and an interface analysis with TEM after long-time and high-power ultrasonic treatments.
In contrast to the TEM image of nanoparticles on the GNSs without ultrasonic treating (Figure 4c), it could be found that the morphology and dispersity of nanoparticles had not significantly changed after long-time or high-power ultrasonic treatment (Figure 7a,b). Numerous round nanoparticles with an average diameter of 15–30 nm were attached to the wrinkles of the GNSs. There was no complete shedding or separation of the nanoparticles from the GNSs surface. This indicated that the nanoparticles created in the thermal decomposition process of nickel acetate could more easily be deposited on the active sites of the GNSs, and the adsorption strength between the nanoparticles and the GNSs was relatively large [41]. The energy dispersive spectrometer (EDS) analysis results for Area A in Figure 7b (Figure 7d) reveal that the round nanoparticles were mainly Ni particles.
An HRTEM image was observed to investigate the Ni nanoparticles in detail (Figure 7c). Fast fourier transform (FFT) images from Zones B, C, D were also obtained (insets in Figure 7c). This showed well-ordered graphene layers, with the measured plane spacing being approximately 0.33 nm, which is close to the theoretical value of 0.34 nm of graphene. The grains on the surface of the GNSs were of the Ni-phase, with the measured plane spacing being approximately 0.20 nm. The growth morphology of the nanostructures was in accordance with the smallest surface energy principle. Ni exhibited a face center cubic (FCC) crystal structure. As a result, the (111), (200), (311), and other preferred growth planes of Ni appear (inset in Figure 7c). This is well consistent with our previous research [42]. An FCC twin crystal appeared in Region D, suggesting that the lattice distortion of Ni or the defect of GNSs existed here. As Ni is an FCC metal with low-middle stacking fault energy, annealing twins easily occur in the process of heat treatment [43].
Though the microscopy studies indicated that many Ni nanoparticles were still attached to the surface of the GNSs after long-time or high-power ultrasonic treatments, the physical proximity of the Ni nanoparticles and the GNSs might have altered the electronic transitions of the GNSs [26]. According to the Kataura plot [44], at the “metallic window” region, from 1.66 to 1.81 eV, low frequency spectra show that the very simple feature and Raman excitation at 785 nm mainly probed the metallic GNSs in the samples. Therefore, the structural characterization of the GONSs, GNSs, and Ni-GNSs composites were analyzed by Raman spectra with excitation at 785 nm, as shown in Figure 8.
Two characteristic peaks near 1335 (D) and 1590 cm−1 (G) were indicative of carbon existence. The G peak derived from the in-plane vibration of sp2 carbon atoms and generated by the interaction of the double degenerated in plane transverse optic branches (iTO) and in plane longitudinal optic branches (iLO) optical phonons in the center of Brillouin region [45]. The vibration mold had the symmetry phonons of E2g (E—double degenerate, 2—mirror symmetry and g—central symmetry). Meanwhile, the D peak was associated with the inter-valley scattering of an iTO phonon and a defect, which represented the density of defects and other impurities in the material. The higher the strength of the D peak, the higher the occurrence of defects such as an sp3 bond. The ratio of the peak intensity of the D and G peaks (ID/IG) has often been used to reflect the defect density in the nano carbon materials. As seen from Figure 8, the higher intensity ratio (ID/IG = 1.53) of GONSs indicated that GONSs contained such defects as oxygen-containing functional groups or impurities. Compared with GONSs, the ID/IG values of GNSs (r-GONSs) and Ni-GNSs were smaller, indicating that the products had fewer structural defects after reflux reduction and modification. Then, the final product Ni-GNSs used as a reinforcement of the composite solder could maximize the potential of graphene.
In addition, it can be seen from the Figure 8 that peak positions of D and G of the original GONSs were 1335 and 1579 cm−1, respectively. There was no significant change in the characteristic peak after the reflux reduction of GONSs, while there was an obvious frequency shift after the treatment with Ni modification. For example, the D and G peaks of the Ni-GNSs were 1357 and 1608 cm−1, respectively, suggesting the Raman peak was blue shifted (moving towards high wave number). The Raman spectroscopy of graphene under the electric field effect showed that electron/hole doping could affect the electron–phonon coupling of graphene and increase the size of the graphene sheets, causing the blue shift of the D and G peaks [46,47,48]. On the other hand, the Raman spectroscopic results of the Ni-GNSs revealed additional peaks of weak intensity at 538 and 875 cm−1, corresponding to the stretching vibration of Ni–O bond. The grain size of the porous NiO belonged to the nanoscale, and it had holes and other defects. The relatively strong Raman peak at 538 cm−1 was a first-order Raman scattering caused by the crystal defects and vibration of longitudinal optical phonon (LO) in NiO, while the weaker peak at 875 cm−1 was attributed to the second-order Raman scattering of NiO, which was consistent with the literature [49].
Compared with the three Raman spectral lines, it was found that the noise of the Ni-GNSs’ spectral lines was stronger, which was caused by nanoparticles doped on the surface of the GNSs. Because the Raman spectrum reflected the vibrational activity of the group at the molecular level and there were few macromolecules in the metal or metal oxide particles, the measured Raman spectrum line had a less obvious peak shape, reflecting a strong noise. However, compared with the ID/IG values of the GNSs (1.14), the defect level of the Ni-GNSs (1.29) did not obviously increase after the introduction of Ni nanoparticles, which indicated that the as-prepared reinforcement phase had not been significantly damaged and could be expected to improve the reliability of solder joints.

3.6. First Principle Verification of the Bonding Strength between Ni and GNSs

The interactions between graphene and metal atoms could be hybridized into chemical bonds or van der Waals forces. In order to further explore the bonding strength between the nickel and graphene, the first principle was applied to study the adsorption of nickel on graphene, which can provide a necessary theoretical basis for the preparation process of the Ni-modified, graphene-reinforced phase.
The H, B, and T positions the of graphene are three highly symmetrical sites (shown in Figure 9a) that are suitable for the adsorption of metal atoms. In our procedure, when the adatoms were placed on each site of the above three, they tended to be stable at the H site of the graphene after full relaxation. Therefore, this paper established a model based on the H site to study the adsorption mechanism of the Ni atoms on graphene. Figure 9b–e shows the adsorption model of an Ni atom on the H site of a perfect and defective GNSs. Adsorption energy is an indicator reflecting the interaction intensity between graphene and nickel atoms, that is, the total energy of the system after adsorption minus the energy of graphene and nickel atoms before adsorption, as shown in Equation (4).
ΔEb = EGR+Ni − (EGR + ENi)
where ΔEb is the required adsorption energy for graphene to adsorb Ni atoms, EGR+Ni is the total energy of the adsorption system, EGR is the energy of perfect graphene or defective graphene, and ENi is the energy of the isolated Ni atoms. The greater the adsorption energy, the better the adsorption effect, and the stronger the interaction between the graphene and Ni atoms. The calculated results showed that the adsorption energy of a Ni atom onto the perfect GNSs was −1.269 eV, while the adsorption height was 1.559 Å. The bond length of the Ni–C bond was 2.118 Å, which indicates that the interaction between the Ni atom and perfect GNSs was via chemisorption. The adsorption models of the Ni atom on the defective graphene are shown in Figure 9c,e. Compared with Figure 9d, it can be seen that there were obvious folds on graphene, and the adsorption height was greatly reduced. The calculated results show that the adsorption energy and height of the Ni atom on the defective graphene were −7.285 eV and 1.135 Å, respectively, both of which were less than the bond length of the defective Ni–C bond (1.793 Å), belonging to chemical adsorption. The adsorption energy of the Ni atom on the defective graphene was about 6 times that of the perfect graphene.
Every carbon atom of the perfect graphene bonds to three of its neighbors to form a stable σ bond. Charge transfer occurs after graphene adsorbs Ni atoms, that is Ni atoms lose electrons and the five adjacent carbon atoms gain electrons [50]. Therefore, electron enrichment between graphene and nickel atoms forms covalent bonds, a process of chemical adsorption. Liu et al. [51] studied the adsorption of Ni atoms on the surface of graphene based on the first principle and found that significant bonding charges were distributed between Ni and the adjacent carbon atoms in the graphene layer. The d orbital of the transition metal Ni was strongly hybridized with the pz orbital of the carbon atom in the graphene layer, forming a very strong covalent bond, which made a large lattice distortion of graphene with approximately 1.2–1.8% of the carbon–carbon bond length in the graphene layer [52]. When Ni atoms are adsorbed by vacant graphene, Ni atoms are strongly hybridized with three adjacent carbon atoms, and the interaction force is the strongest. As Wang et al. reported [53], the vacancy, wobbly, and non-bonding carbon atoms present in the defective graphene provide stronger bonding sites so that the adsorption energies significantly increase, which is consistent with our results. When there were defects in the nickel atoms (such as the twin defect of nickel in Zone D of Figure 7c), the adsorption energy between nickel and graphene was stronger, and vice versa.

3.7. Formation Mechanism of Ni-Modified GNSs

The formation of the reaction products such as Ni or NiO nanoparticle-modified GNSs can be analyzed from the pyrolysis of nickel acetate and the generation of new phase. A schematic diagram depicting the mechanism of Ni-GNSs is shown in Figure 10.
As previously mentioned, the pyrolysis of the Ni(CH3COO)2∙4H2O@GNSs mixture in an inert nitrogen atmosphere can be divided into three stages: the loss of crystal water (the first stage), the formation of the intermediate product NiO@GNSs (the second stage), and the final product Ni-GNSs (the third stage). As observed in the DTA curve (Figure 3), anhydrous nickel acetate was firstly decomposed into nickel carbonate and acetone after the first stage of pyrolysis processes. Nickel carbonate was a short-lived intermediate that immediately decarboxylated to give nickel oxide and carbon dioxide [33]. Afterwards, an autocatalytic NiO reduction to metallic nickel occurred with the increase of the pyrolysis temperature [34]. As carbon dioxide is heavier and does not escape with the flow of nitrogen, nickel compounds catalyzed the activation of carbon [49], the carbon dioxide, and NiO produced by the decomposition of nickel carbonate were adsorbed on the surface of the solid carbon (GNSs) at more than 400 °C [54]. In addition, due to the strong van der Waals force and coulomb force between the carbon dioxide gas molecules and such atoms as carbon atoms and functionalized modified atoms in graphene, the movement of the carbon dioxide gas molecules on the surface of graphene was significantly reduced so that the molecules were strongly adsorbed on the graphene surface [35]. The molecule bonds of the adsorbed carbon dioxide elongated, from which an oxygen atom was split. Two oxygen atoms joined an oxygen molecule by a double bond and escaped from the furnace with the help of the flowing N2. At the same time, carbon dioxide turned into carbon monoxide. Then, the intermediate product nickel oxide was reduced to nickel by carbon monoxide (the third stage in Figure 10).
In this work, the use of the ball milling of the Ni(CH3COO)2∙4H2O@GNSs mixture provided the increased number and uniform distribution of anchoring sites on the GNSs surface; therefore, GNSs modified with a uniform distribution, small size, pure single phase and higher crystallinity of nano-grained Ni were obtained.

4. Conclusions

In summary, we have reported an environmentally friendly and controllably segmented pyrolysis method to prepare the Ni-GNSs with fewer defects as a high-performance reinforcement of a lead-free solder. The Ni-GNSs were synthesized from the precursor nickel acetate and the as-prepared r-GONSs. The facile three-step pyrolysis process of the Ni(CH3COO)2∙4H2O@GNSs hybrid involved the loss of crystal water, the formation of the intermediate product NiO@GNSs, and the final product Ni-GNSs. The grain size, distribution, and phase composition of nanoparticles on the surface of GNSs could be controlled by changing the theoretical Ni loading level. The results showed that the theoretical Ni loading of 17 mol % could be helpful to obtain a uniform distribution, small size, purer single phase, and higher crystallinity of nano-grained Ni-GNSs. The morphology and dispersity of the Ni nanoparticles on GNSs did not significantly change after long-time or high-power ultrasonic treatment. The adsorption strength between Ni nanoparticles and GNSs was relatively large due to chemical adsorption, and the adsorption energy of Ni atoms on defective graphene was about six times that of perfect graphene based on a first-principle calculation. The doped Ni nanoparticles induced more active sites on the surface of the GNSs but also did not significantly increase the defect level of the Ni-GNSs. As a result, the Ni-GNSs may be suitable for many microelectronics and composite materials—the reinforcement phase of a lead-free solder, for example.

Author Contributions

Conceptualization and methodology, H.W. and K.Z.; Software, C.Y.; investigation, H.W. and M.Z.; Formal analysis, writing—original draft, H.W.; Writing—review and editing, H.W. and K.Z.; Funding Acquisition, K.Z.

Funding

This research was funded by the National Natural Science Foundation of China (U1604132), the Plan for Scientific Innovation Talent of Henan Province, China (154200510022), the Major Scientific Research Foundation of Higher Education of Henan Province, China (18A430014), the National Science and Technology International Cooperation of China (2014DFR50820), and the Collaborative Innovation Center of Nonferrous Metals, Henan Province, China.

Conflicts of Interest

The authors declare no conflict of interest.

References

  1. Geim, A.K. Graphene: Status and prospects. Science 2009, 324, 1530–1534. [Google Scholar] [CrossRef]
  2. Geim, A.K.; Novoselov, K.S. The rise of graphene. Nat. Mater. 2007, 6, 183–191. [Google Scholar] [CrossRef] [PubMed]
  3. Liu, X.; Xu, T.; Li, Y.; Zang, Z.; Peng, X.; Wei, H.; Zha, W.; Wang, F. Enhanced X-ray photon response in solution-synthesized CsPbBr3 nanoparticles wrapped by reduced graphene oxide. Sol. Energy Mater. Sol. Cells 2018, 187, 249–254. [Google Scholar] [CrossRef]
  4. Nag, A.; Mitra, A.; Mukhopadhyay, S.C. Graphene and its sensor-based applications: A review. Sens. Actuators A Phys. 2018, 270, 177–194. [Google Scholar] [CrossRef]
  5. Foo, M.E.; Gopinath, S.C. Feasibility of graphene in biomedical applications. Biomed. Pharmacother. 2017, 94, 354–361. [Google Scholar] [CrossRef] [PubMed]
  6. Zang, Z.; Zeng, X.; Wang, M.; Hu, W.; Liu, C.; Tang, X. Tunable photoluminescence of water-soluble AgInZnS–graphene oxide (GO) nanocomposites and their application in-vivo bioimaging. Sens. Actuators B Chem. 2017, 252, 1179–1186. [Google Scholar] [CrossRef]
  7. Chen, T.W.; Rajaji, U.; Chen, S.M.; Li, Y.L.; Ramalingam, R.J. Ultrasound-assisted synthesis of α-MnS (alabandite) nanoparticles decorated reduced graphene oxide hybrids: Enhanced electrocatalyst for electrochemical detection of Parkinson’s disease biomarker. Ultrason. Sonochem. 2019, 56, 378–385. [Google Scholar] [CrossRef]
  8. Aditya, T.; Nayak, A.K.; Pradhan, D.; Pal, A.; Pal, T. Fabrication of MoS2 decorated reduced graphene oxide sheets from solid Mo-precursor for electrocatalytic hydrogen evolution reaction. Electrochim. Acta 2019, 313, 341–351. [Google Scholar] [CrossRef]
  9. Ji, Z.; Wang, Y.; Shen, X.; Ma, H.; Yang, J.; Yuan, A.; Zhou, H. Facile synthesis and enhanced catalytic performance of reduced graphene oxide decorated with hexagonal structure Ni nanoparticles. J. Colloid Interface Sci. 2017, 487, 223–230. [Google Scholar] [CrossRef]
  10. Ren, S.; Rong, P.; Yu, Q. Preparations, properties and applications of graphene in functional devices: A concise review. Ceram. Int. 2018, 44, 11940–11955. [Google Scholar] [CrossRef]
  11. Kavinkumar, T.; Kavitha, P.; Naresh, N.; Manivannan, S.; Muneeswaran, M.; Neppolian, B. High performance flexible solid-state symmetric supercapacitorsbased on laser induced porous reduced graphene oxide-graphene oxide hybrid nanostructure devices. Appl. Surf. Sci. 2019, 480, 671–679. [Google Scholar] [CrossRef]
  12. Yu, G.-H.; Han, Q.; Qu, L.-T. Graphene Fibers: Advancing Applications in Sensor, Energy Storage and Conversion. Chin. J. Polym. Sci. 2019, 37, 535–547. [Google Scholar] [CrossRef]
  13. Hu, X.; Chan, Y.; Zhang, K.; Yung, K. Effect of graphene doping on microstructural and mechanical properties of Sn–8Zn–3Bi solder joints together with electromigration analysis. J. Alloys Compd. 2013, 580, 162–171. [Google Scholar] [CrossRef]
  14. Ma, D.; Wu, P. Effects of coupled stressing and solid-state aging on the mechanical properties of graphene nanosheets reinforced Sn–58Bi–0.7Zn solder joint. Mater. Sci. Eng. A 2016, 651, 499–506. [Google Scholar] [CrossRef]
  15. Huang, Y.; Xiu, Z.; Wu, G.; Tian, Y.; He, P. Sn–3.0Ag–0.5Cu nanocomposite solders reinforced by graphene nanosheets. J. Mater. Sci. Mater. Electron. 2016, 27, 6809–6815. [Google Scholar] [CrossRef]
  16. Liu, X.; Han, Y.; Jing, H.; Wei, J.; Xu, L. Effect of graphene nanosheets reinforcement on the performance of Sn–Ag–Cu lead-free solder. Mater. Sci. Eng. A 2013, 562, 25–32. [Google Scholar] [CrossRef]
  17. Christian, M.S.; Otero-De-La-Roza, A.; Johnson, E.R. Adsorption of graphene to metal (111) surfaces using the exchange-hole dipole moment model. Carbon 2017, 124, 531–540. [Google Scholar] [CrossRef]
  18. Xie, K.F.; Jia, Q.Q.; Zhang, X.T.; Fu, L.; Zhao, G.H. Electronic and magnetic properties of Stone–Wales defected graphene decorated with the half-metallocene of M (M = Fe, Co, Ni): A first principle study. Nanomaterials 2018, 8, 552. [Google Scholar] [CrossRef]
  19. El-Daly, A.; El-Taher, A.; Dalloul, T. Improved creep resistance and thermal behavior of Ni-doped Sn–3.0Ag–0.5Cu lead-free solder. J. Alloys Compd. 2014, 587, 32–39. [Google Scholar] [CrossRef]
  20. Li, N.; Zhang, L.; Xu, M.; Xia, T.; Ruan, X.; Song, S.; Ma, H. Preparation and mechanical property of electrodeposited Al-graphene composite coating. Mater. Des. 2016, 111, 522–527. [Google Scholar] [CrossRef]
  21. Hu, Q.-H.; Wang, X.-T.; Chen, H.; Wang, Z.-F. Synthesis of Ni/graphene sheets by an electroless Ni-plating method. Carbon 2012, 50, 3118. [Google Scholar] [CrossRef]
  22. Hui, X.; Qian, L.; Harris, G.; Wang, T.; Che, J. Fast fabrication of NiO@graphene composites for supercapacitor electrodes: Combination of reduction and deposition. Mater. Des. 2016, 109, 242–250. [Google Scholar] [CrossRef] [PubMed] [Green Version]
  23. Jilani, A.; Othman, M.H.D.; Ansari, M.O.; Kumar, R.; Khan, I.U.; Abdel-Wahab, M.S.; Alshahrie, A.; Barakat, M.A.; Kurniawan, T.A. Structural, optical, and photocatalytic investigation of nickel oxide@graphene oxide nanocomposite thin films by RF magnetron sputtering. J. Mater. Sci. 2018, 53, 15034–15050. [Google Scholar] [CrossRef]
  24. Liu, C.-W.; Chen, W.-E.; Sun, Y.T.A.; Lin, C.-R. Fabrication and electrochemistry characteristics of nickel-doped diamond-like carbon film toward applications in non-enzymatic glucose detection. Appl. Surf. Sci. 2018, 436, 967–973. [Google Scholar] [CrossRef]
  25. Lee, S.; Jeong, Y.; Oh, H.-J.; Lee, J.-H.; Lee, O.Y.; Chi, C.-S. Synthesis of silver nanowire arrays by thermal decomposition of silver acetate. Met. Mater. Int. 2009, 15, 631–636. [Google Scholar] [CrossRef]
  26. Lin, Y.; Watson, K.A.; Fallbach, M.J.; Ghose, S.; Smith, J.G., Jr.; Delozier, D.M.; Cao, W.; Crooks, R.E.; Connell, J.W. Rapid, Solventless, Bulk Preparation of Metal Nanoparticle-Decorated Carbon Nanotubes. ACS Nano 2009, 3, 871–884. [Google Scholar] [CrossRef]
  27. Luo, X.; Chen, Y.; Yue, G.-H.; Peng, D.-L.; Luo, X. Preparation of hexagonal close-packed nickel nanoparticles via a thermal decomposition approach using nickel acetate tetrahydrate as a precursor. J. Alloys Compd. 2009, 476, 864–868. [Google Scholar] [CrossRef]
  28. Szczesny, R.; Szlyk, E. Thermal decomposition of some silver(I) carboxylates under nitrogen atmosphere. J. Therm. Anal. Calorim. 2013, 111, 1325–1330. [Google Scholar] [CrossRef]
  29. Wang, H.; Zhang, K.; Zhang, M. Fabrication and properties of Ni-modified graphene nanosheets reinforced Sn-Ag-Cu composite solder. J. Alloys Compd. 2019, 781, 761–772. [Google Scholar] [CrossRef]
  30. Bourlinos, A.B.; Gournis, D.; Petridis, D.; Szabo’, T.; Szeri, A.; De´ka´ny, I. Graphite oxide: Chemical reduction to graphite and surface modification with primary aliphatic amines and amino acids. Langmuir 2003, 19, 6050–6055. [Google Scholar] [CrossRef]
  31. Guo, H.-L.; Wang, X.-F.; Qian, Q.-Y.; Wang, F.-B.; Xia, X.-H. A Green Approach to the Synthesis of Graphene Nanosheets. ACS Nano 2009, 3, 2653–2659. [Google Scholar] [CrossRef] [PubMed]
  32. Liang, B.; Qin, Z.; Li, T.; Dou, Z.; Zeng, F.; Cai, Y.; Zhu, M.; Zhou, Z. Poly(aniline-co-pyrrole) on the surface of reduced graphene oxide as high-performance electrode materials for supercapacitors. Electrochim. Acta 2015, 177, 335–342. [Google Scholar] [CrossRef]
  33. Jesus, J.C.D.; Gonzalez, I.; Quevedo, A.; Puerta, T. Thermal decomposition of nickel acetate tetrahydrate: An integrated study by TGA, QMS and XPS techniques. J. Mol. Catal. A Chem. 2005, 228, 283–291. [Google Scholar] [CrossRef]
  34. Galwey, A.K.; McKee, S.G.; Mitchell, T.R.; Brown, M.E.; Bean, A.F. A kinetic and mechanistic study of the thermal decomposition of nickel acetate. React. Solids 1988, 6, 173–186. [Google Scholar] [CrossRef]
  35. Wen, B.Y.; Sun, C.Z.; Bai, B.F. Molecular dynamics simulation of the separation of CH4/CO2 by nanoporous graphene. Acta Phys. Chim. Sin. 2015, 31, 261–267. [Google Scholar]
  36. Laxmi; Khan, S.; Kareem, A.; Zafar, F.; Nishat, N. Synthesis, vibrational spectrometry and thermal characterizations of coordination polymers derived from divalent metal ions and hydroxyl terminated polyurethane as ligand. Spectrochim. Acta Part A Mol. Biomol. Spectrosc. 2018, 188, 400–410. [Google Scholar] [CrossRef] [PubMed]
  37. Wang, R.R.; Li, Q.R.; Xie, D.Y.; Xiao, H.Y.; Lu, H.X. Synthesis of NiO using pine as template and adsorption performance for Pb(II) from aqueous solution. Appl. Surf. Sci. 2013, 279, 129–136. [Google Scholar] [CrossRef]
  38. Kashif, M.; Sharmin, E.; Zafar, F.; Ahmad, S. Synthesis and Characterization of Ricinoleamide-Based Polyurethane. J. Am. Oil Chem. Soc. 2011, 88, 1989–1996. [Google Scholar] [CrossRef]
  39. Huo, F.; Zhang, K.; Zhang, M.; Wang, H. Preparation by Ball Milling–Thermal Decomposition Method and Characterization of Reduced Graphene Oxide Decorated with Ni Nanoparticles. JOM 2019. [Google Scholar] [CrossRef]
  40. Chaudhary, R.G.; Juneja, H.D.; Pagadala, R.; Gandhare, N.V.; Gharpure, M.P. Synthesis, characterisation and thermal degradation behaviour of some coordination polymers by using TG–DTG and DTA techniques. J. Saudi Chem. Soc. 2015, 19, 442–453. [Google Scholar] [CrossRef]
  41. Hussein, G.A.M.; Nohman, A.K.H.; Attyia, K.M.A. Characterization of the decomposition course of nickel acetate tetrahydrate in air. J. Therm. Anal. Calorim. 1994, 42, 1155–1165. [Google Scholar] [CrossRef]
  42. Huo, F.; Zhang, K.; Zhang, M.; Wang, H. The Interfacial Intermetallic and Shear Strength of Ni Nanoparticle-Decorated Reduced Graphene Oxide Reinforced Sn2.5Ag0.5Cu Lead-Free Composite Soldering Joints. Adv. Eng. Mater. 2018, 20, 1800147. [Google Scholar] [CrossRef]
  43. Karthik, K.; Pandian, S.K.; Jaya, N.V. Effect of nickel doping on structural, optical and electrical properties of TiO2 nanoparticles by sol–gel method. Appl. Surf. Sci. 2010, 256, 6829–6833. [Google Scholar] [CrossRef]
  44. Kataura, H.; Kumazawa, Y.; Maniwa, Y.; Umezu, I.; Suzuki, S.; Ohtsuka, Y.; Achiba, Y. Optical Properties of Single-Wall Carbon Nanotubes. Synth. Met. 1999, 103, 2555–2558. [Google Scholar] [CrossRef]
  45. Juan, A.G.; Almudena, B.; Rocío, O.; Dolores, E.; César, J.S.; Julián, M.; Álvaro, C.; Francisco, J.R.S. A comparative study of particle size distribution of graphene nanosheets synthesized by an ultrasound-assisted method. Nanomaterials 2019, 9, 152–167. [Google Scholar]
  46. Eklund, P.; Holden, J.; Jishi, R. Vibrational modes of carbon nanotubes; Spectroscopy and theory. Carbon 1995, 33, 959–972. [Google Scholar] [CrossRef]
  47. Lee, J.; Novoselov, K.S.; Shin, H.S. Interaction between Metal and Graphene: Dependence on the Layer Number of Graphene. ACS Nano 2011, 5, 608–612. [Google Scholar] [CrossRef]
  48. Wu, J.X.; Xu, H.; Zhang, J. Raman spectroscopy of graphene. Acta Chim. Sin. 2014, 72, 301–318. [Google Scholar] [CrossRef]
  49. Maslar, J.E.; Hurst, W.S.; Bowers, W.J.; Hendricks, J.H.; Aquino, M.I. In Situ Raman Spectroscopic Investigation of Nickel Hydrothermal Corrosion. Corros. 2002, 58, 225–231. [Google Scholar] [CrossRef]
  50. Widjaja, H.; Altarawneh, M.; Jiang, Z.-T.; Yin, C.-Y.; Goh, B.-M.; Mondinos, N.; Dlugogorski, B.Z. Geometrical and orientational investigations on the electronic structure of graphene with adsorbed aluminium or silicon. Mater. Des. 2016, 89, 27–35. [Google Scholar] [CrossRef] [Green Version]
  51. Liu, X.; Wang, C.Z.; Yao, Y.X.; Lu, W.C.; Hupalo, M.; Tringides, M.C.; Ho, K.M. Bonding and charge transfer by metal adatom adsorption on graphene. Phys. Rev. B 2011, 83, 235411. [Google Scholar] [CrossRef]
  52. Hupalo, M.; Liu, X.; Wang, C.-Z.; Lu, W.-C.; Yao, Y.-X.; Ho, K.-M.; Tringides, M.C. Metal Nanostructure Formation on Graphene: Weak versus Strong Bonding. Adv. Mater. 2011, 23, 2082–2087. [Google Scholar] [CrossRef] [PubMed]
  53. Wang, Q.; Tian, Y.; Chen, G.; Zhao, J. Theoretical insights into the energetics and electronic properties of MPt12 (M = Fe, Co, Ni, Cu, and Pd) nanoparticles supported by N-doped defective graphene. Appl. Surf. Sci. 2017, 397, 199–205. [Google Scholar] [CrossRef]
  54. Ben Mansour, N.; Najeh, I.; Mansouri, S.; El Mir, L. Effect of pyrolysis temperature on the properties of carbon/nickel nanocomposites prepared by sol–gel method. Appl. Surf. Sci. 2015, 337, 158–165. [Google Scholar] [CrossRef]
Figure 1. Schematic of preparation of Ni-modified graphene nanosheets (GNSs).
Metals 09 01123 g001
Figure 2. XRD patterns of graphene oxide nanosheets (GONSs) in pretreatment processes obtained in a nitrogen atmosphere.
Metals 09 01123 g002
Figure 3. TG (thermogravimetry) and DTA (differential thermal analysis) curves of Ni(CH3COO)2∙4H2O@GNSs.
Metals 09 01123 g003
Figure 4. TEM images of the mixture of GNSs and nickel acetate tetrahydrate at (a) 250 °C/1 h, (b) 250 °C/1 h + 380 °C/1 h, and (c) 250 °C/1 h + 380 °C/1 h + 450 °C/1 h; (d) XRD patterns; and (e,f) FTIR spectra of nickel acetate tetrahydrate and the mixture during the segmented pyrolysis processes.
Metals 09 01123 g004
Figure 5. SEM images of Ni-GNSs samples with (a) 50, (b) 25, (c) 17, (d) 12.7, (e) 9.3, (f) 6.4 mol % theoretical Ni loadings.
Metals 09 01123 g005aMetals 09 01123 g005b
Figure 6. XRD patterns of the Ni-GNSs with various theoretical Ni loadings (a) 17–50 mol % and (b) 6.4–12.7 mol %.
Metals 09 01123 g006
Figure 7. TEM images of Ni-GNSs after (a) long-time (10 h), (b) high-power (300 w) ultrasonic treatment; (c) high resolution transmission electron microscopy (HRTEM) image, (d) energy dispersive spectrometer (EDS) analysis result of Area A in (b).
Metals 09 01123 g007aMetals 09 01123 g007b
Figure 8. Raman spectra of GONSs, GNSs and Ni-GNSs.
Metals 09 01123 g008
Figure 9. The model of the Ni atom adsorbed on the surface of the GNSs. (a) Three highly symmetrical sites suitable for the adsorption of metal atoms, (b) the adsorption model of the Ni atom on the perfect GNSs and (c) on the defective GNSs, and (d) the adsorption height of Ni atom on the perfect GNSs and (e) on the defective GNSs.
Metals 09 01123 g009
Figure 10. Schematic diagram for the formation mechanism of Ni-GNSs.
Metals 09 01123 g010

