Multiple Influences of Molybdenum on the Precipitation Process in a Martensitic PH Stainless Steel


Abstract
:1. Introduction
2. Materials and Methods
3. Results
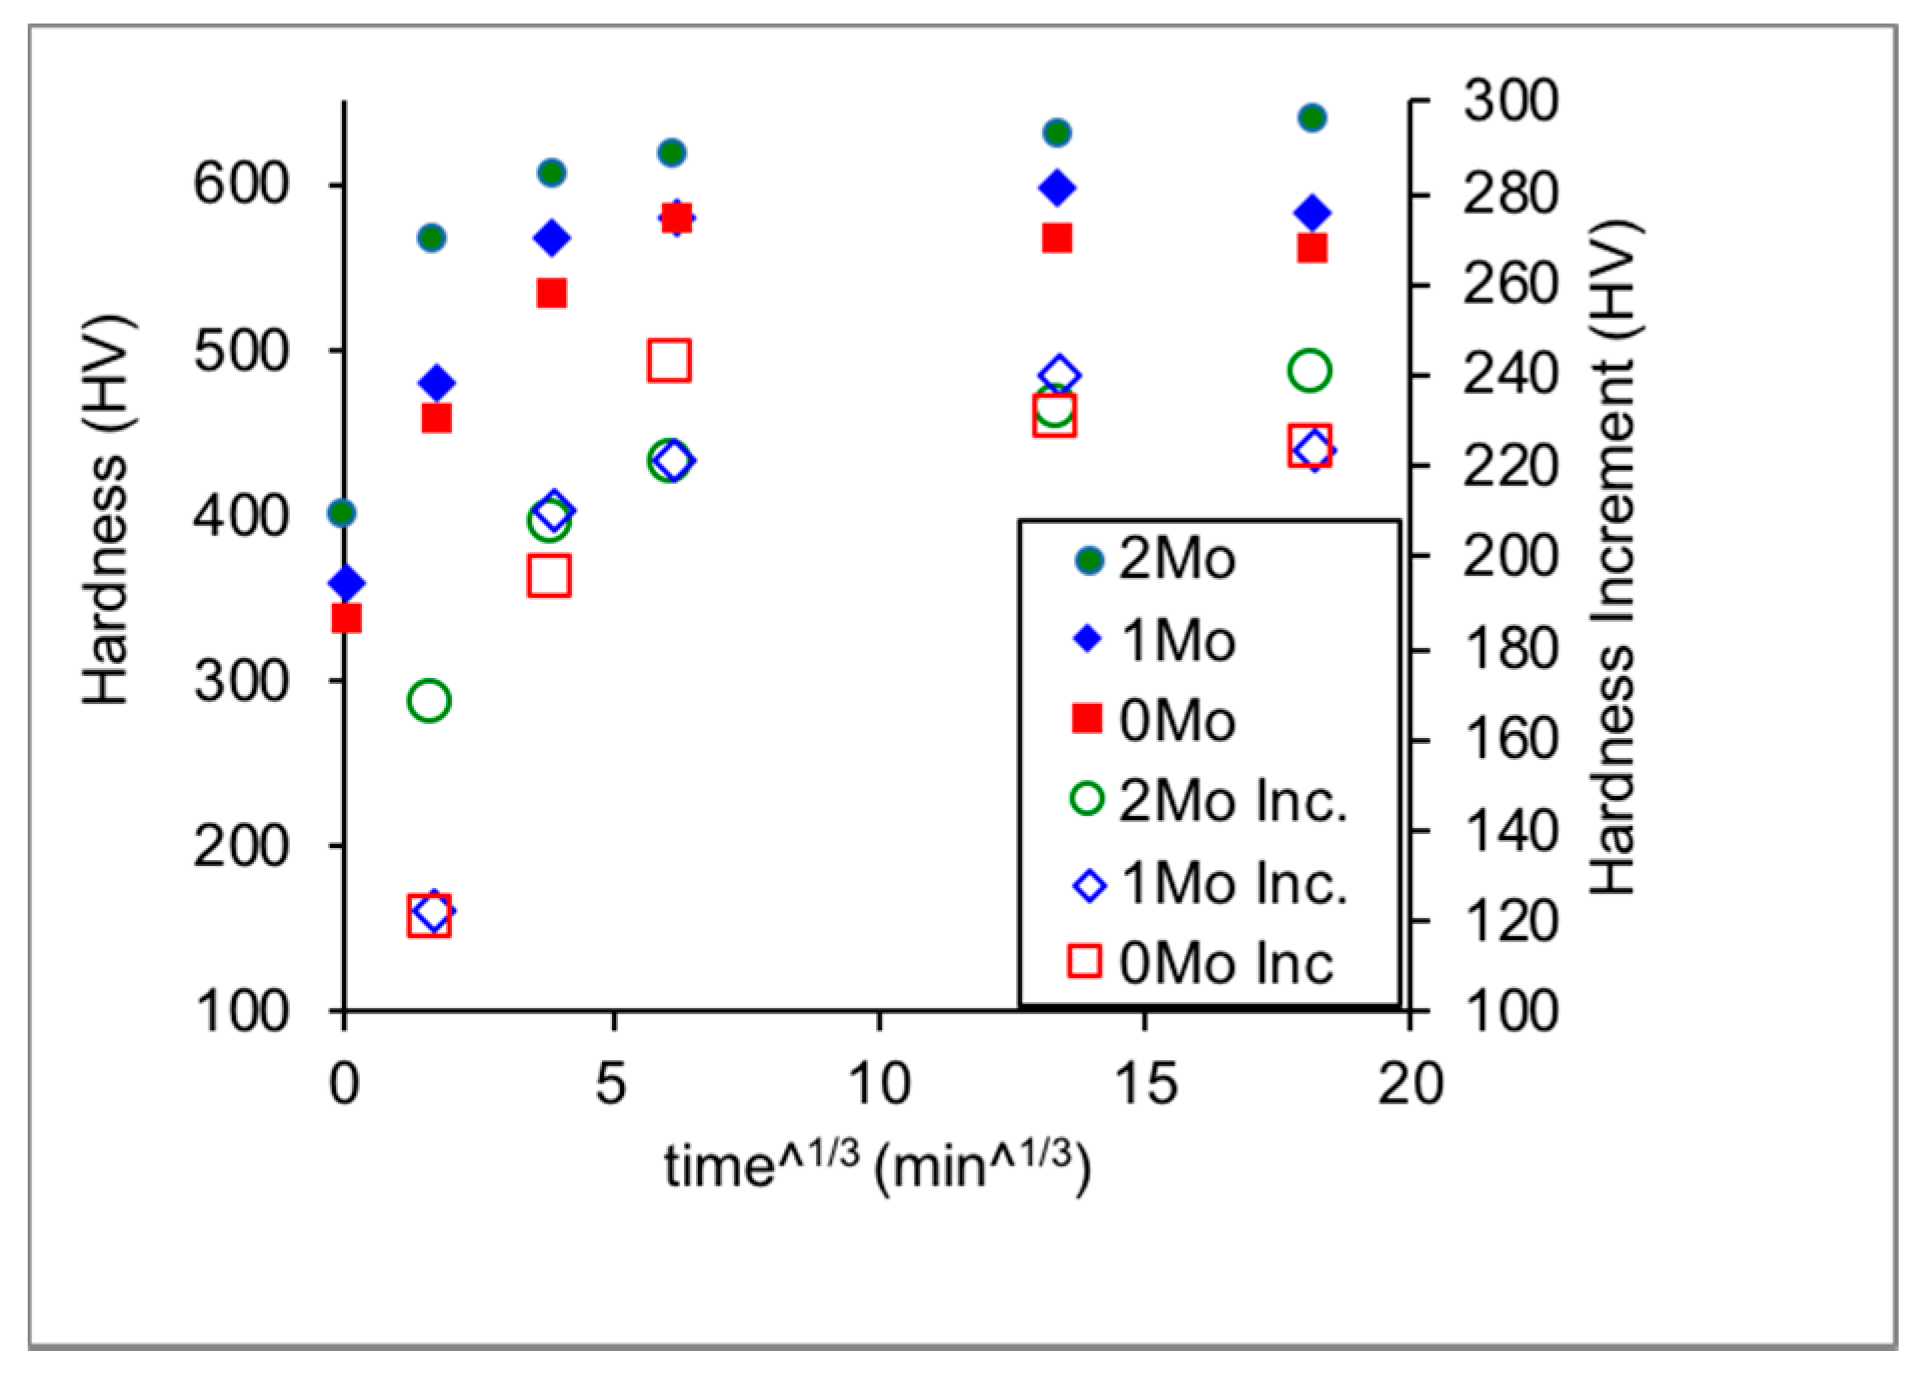
3.1. Hardness
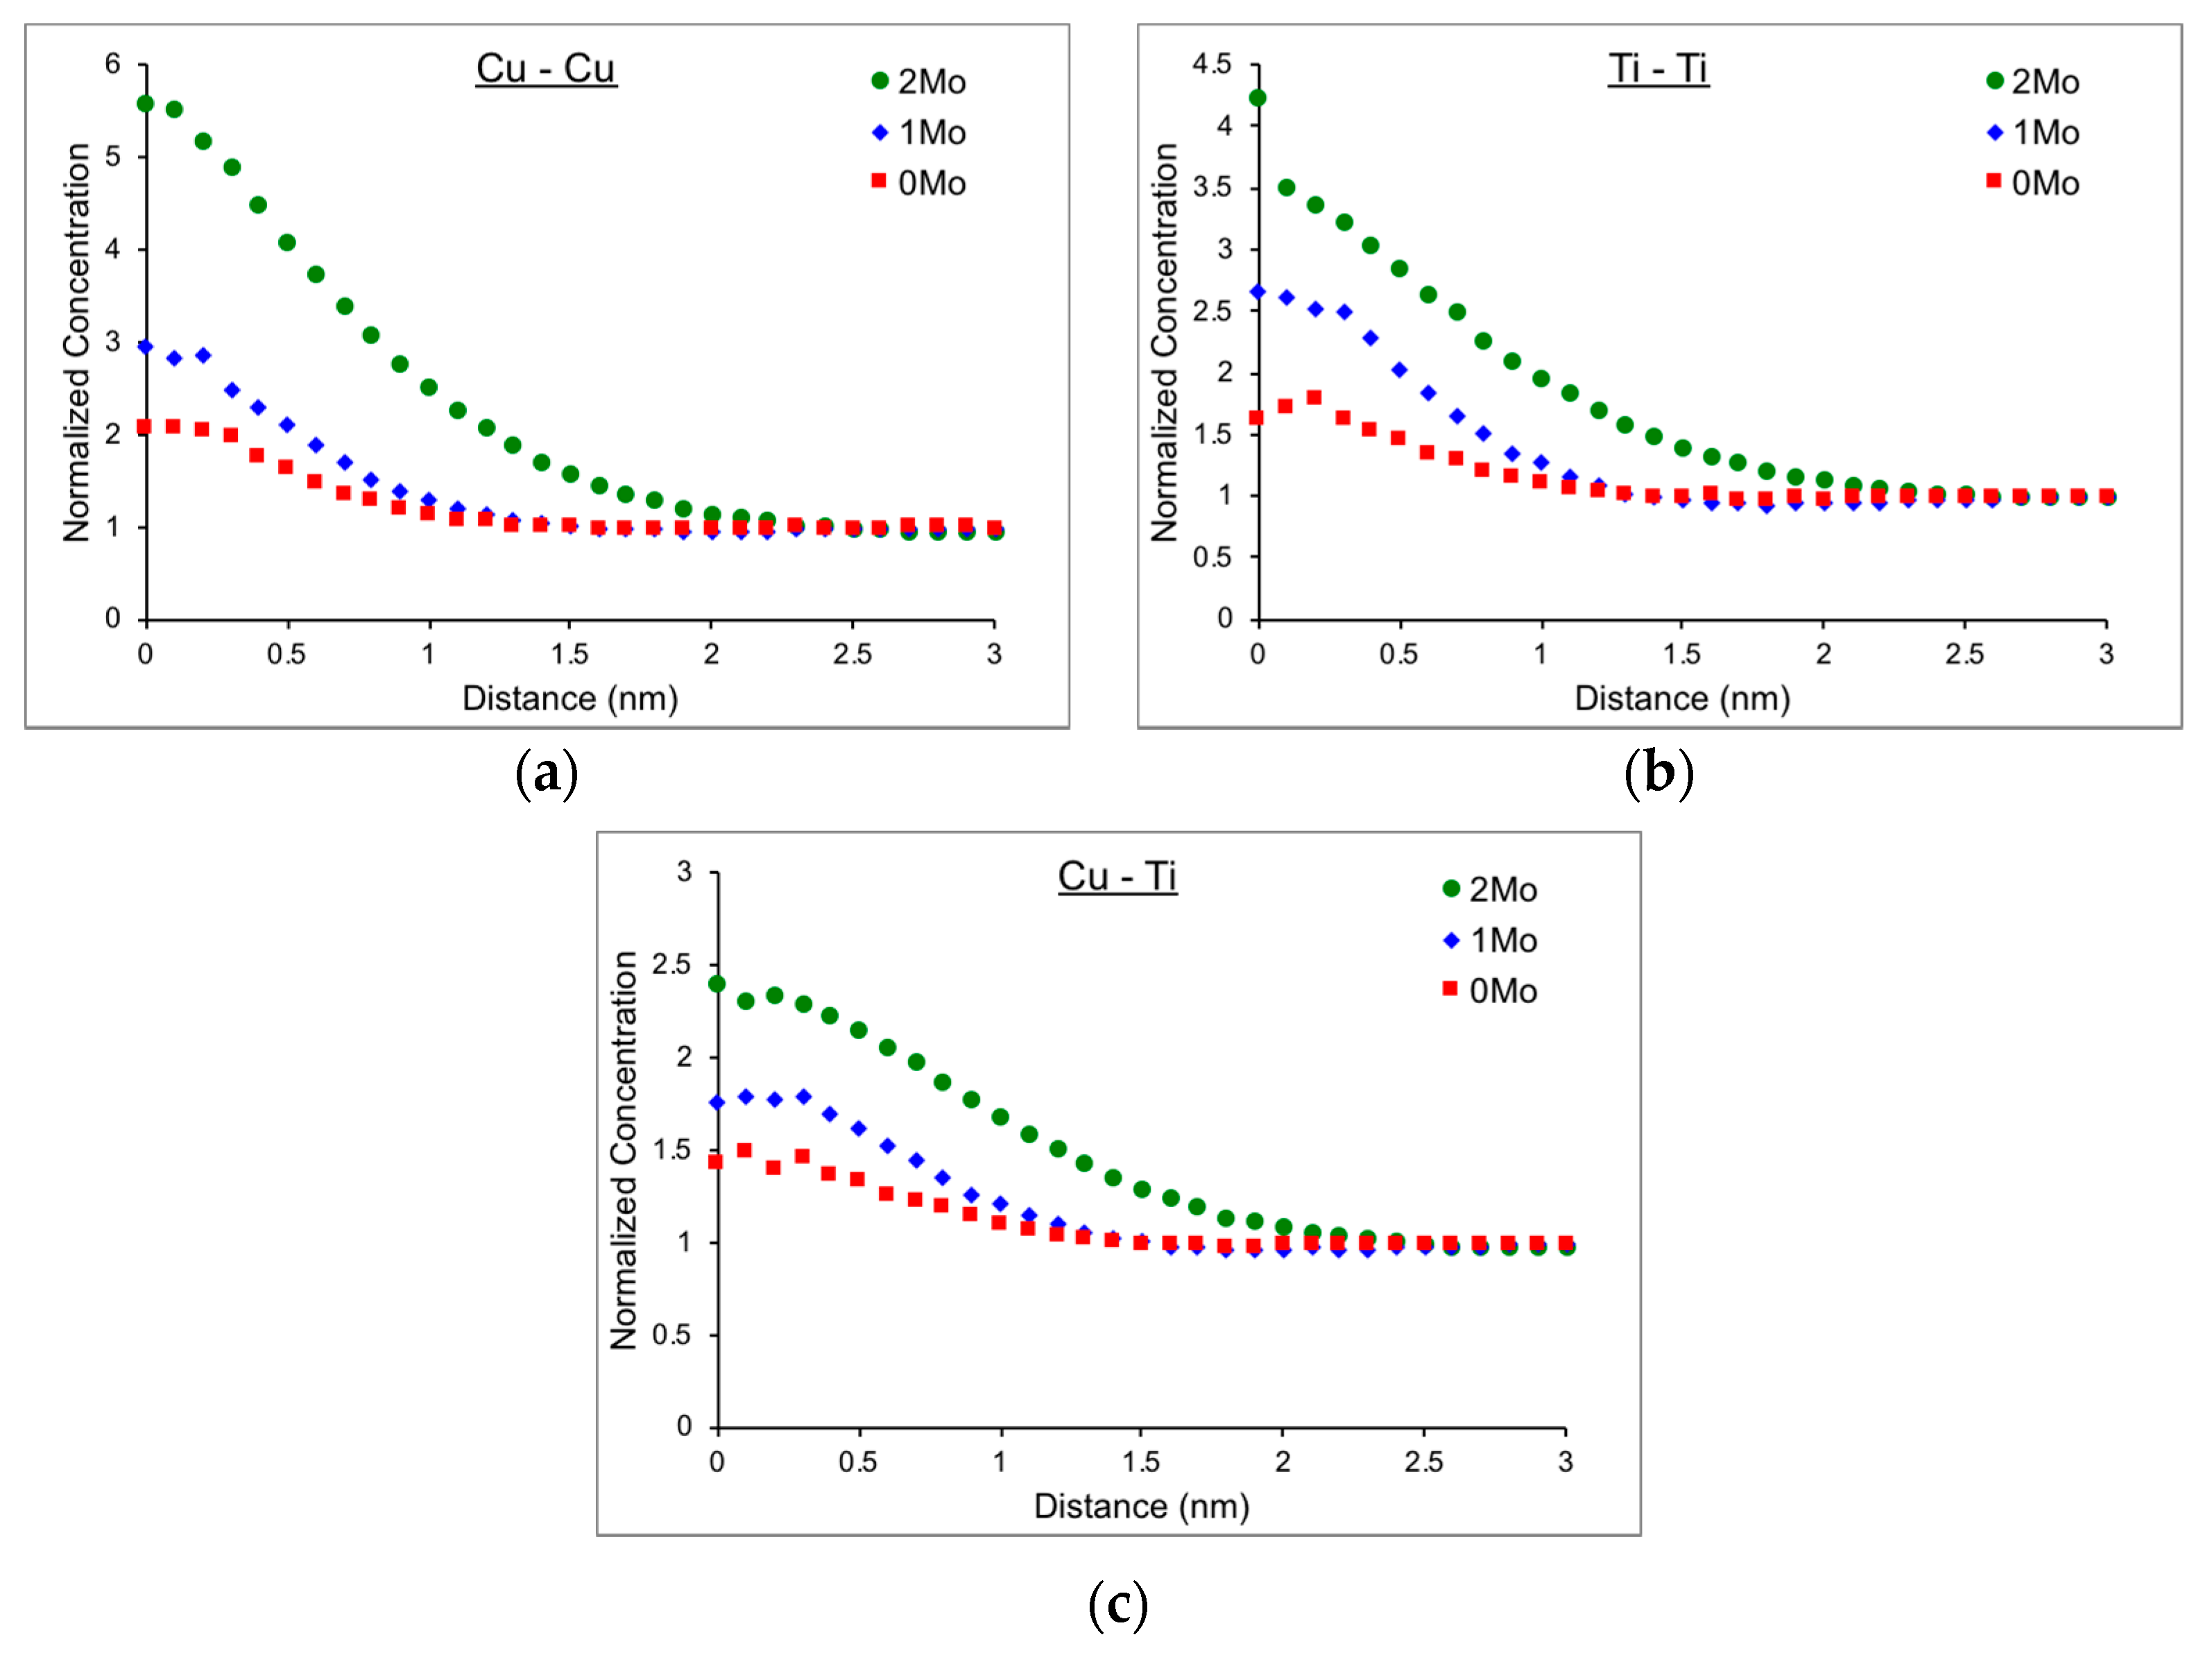
3.2. Atom Probe Tomography
3.2.1. Unaged Materials and Materials Aged for 5 min at 475 °C
3.2.2. Materials Aged for 4 h at 475 °C
3.2.3. Materials Aged for 40 h at 475 °C
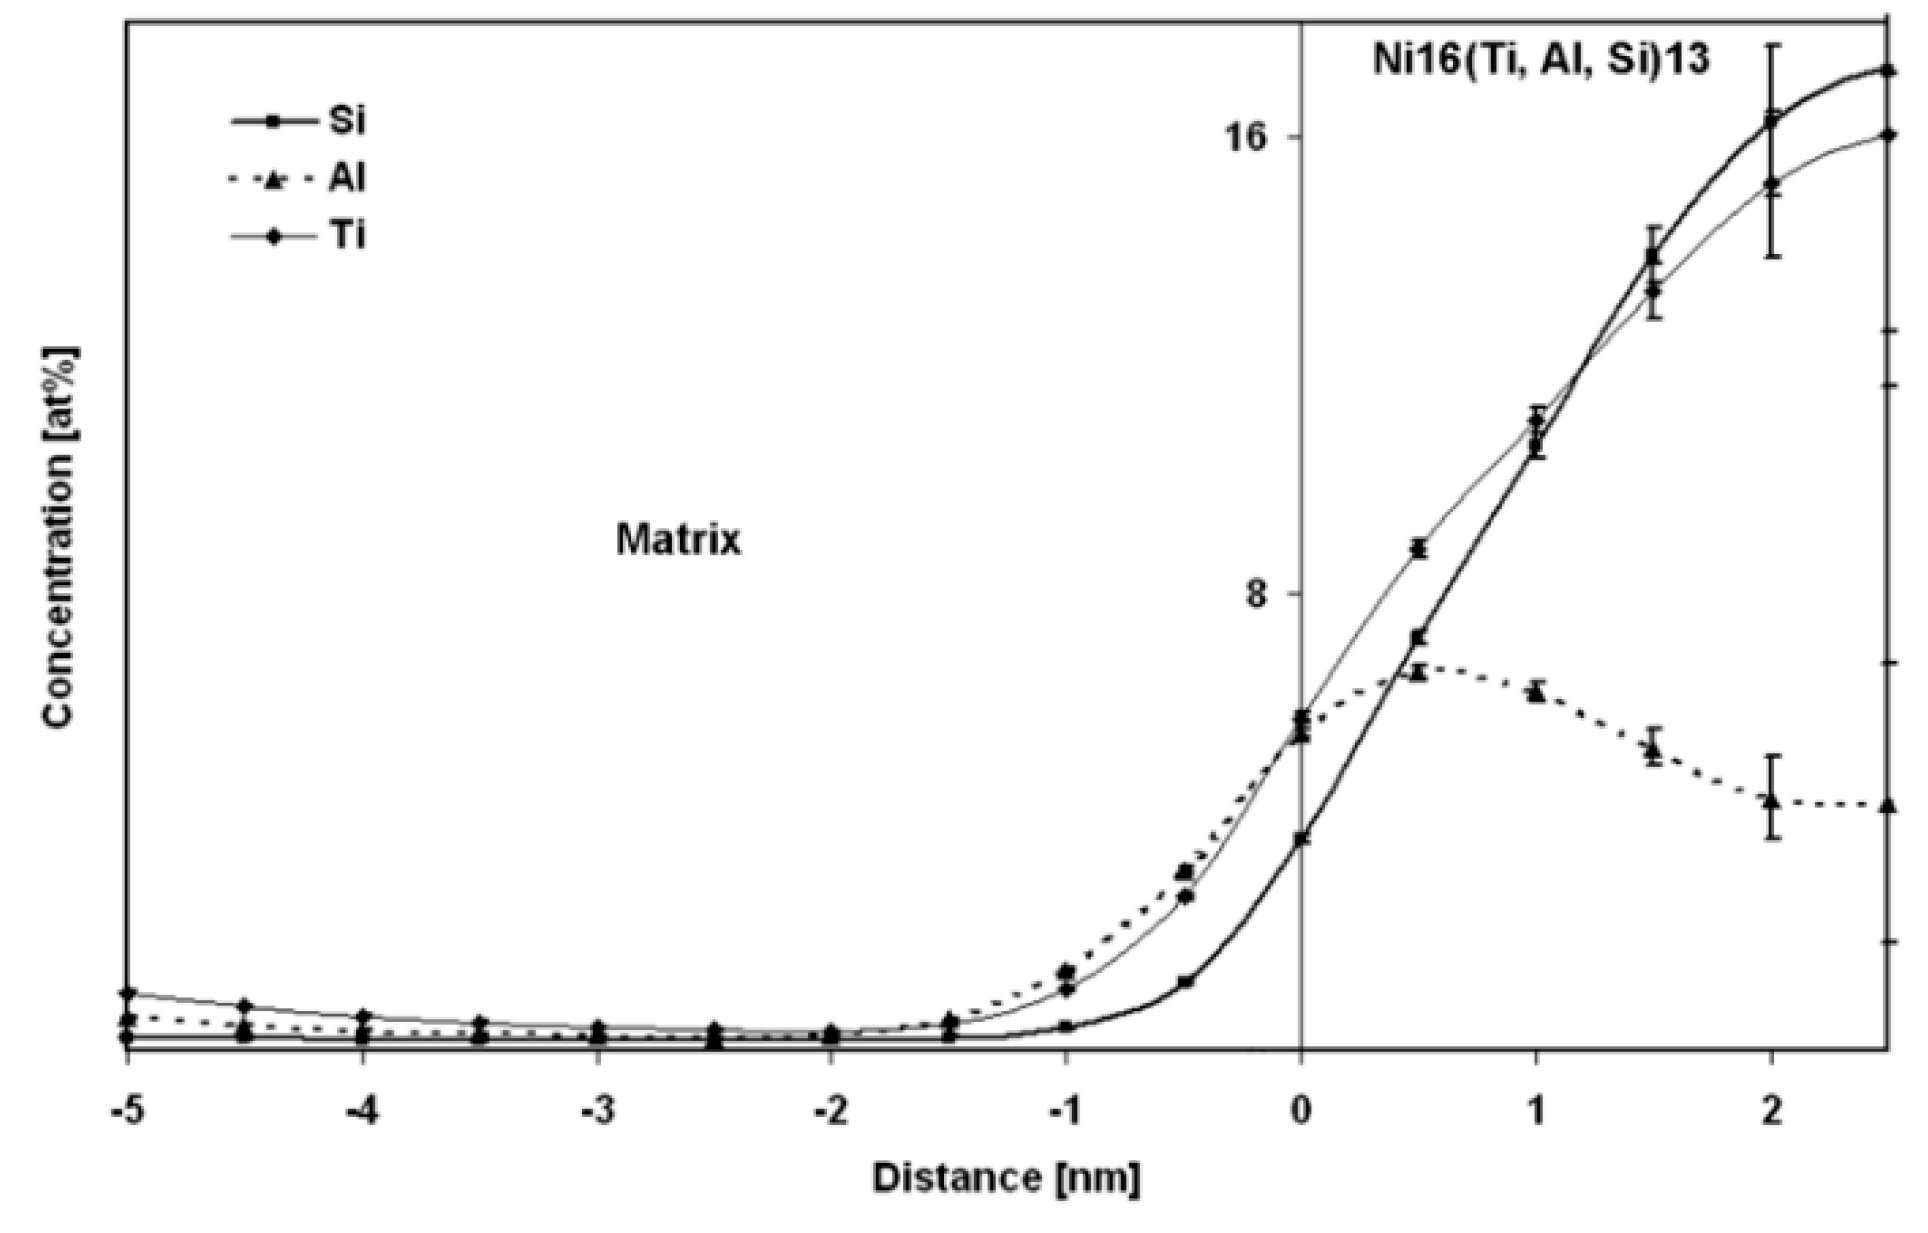
3.2.4. Materials Aged for 100 h at 475 °C
3.2.5. Matrix Composition
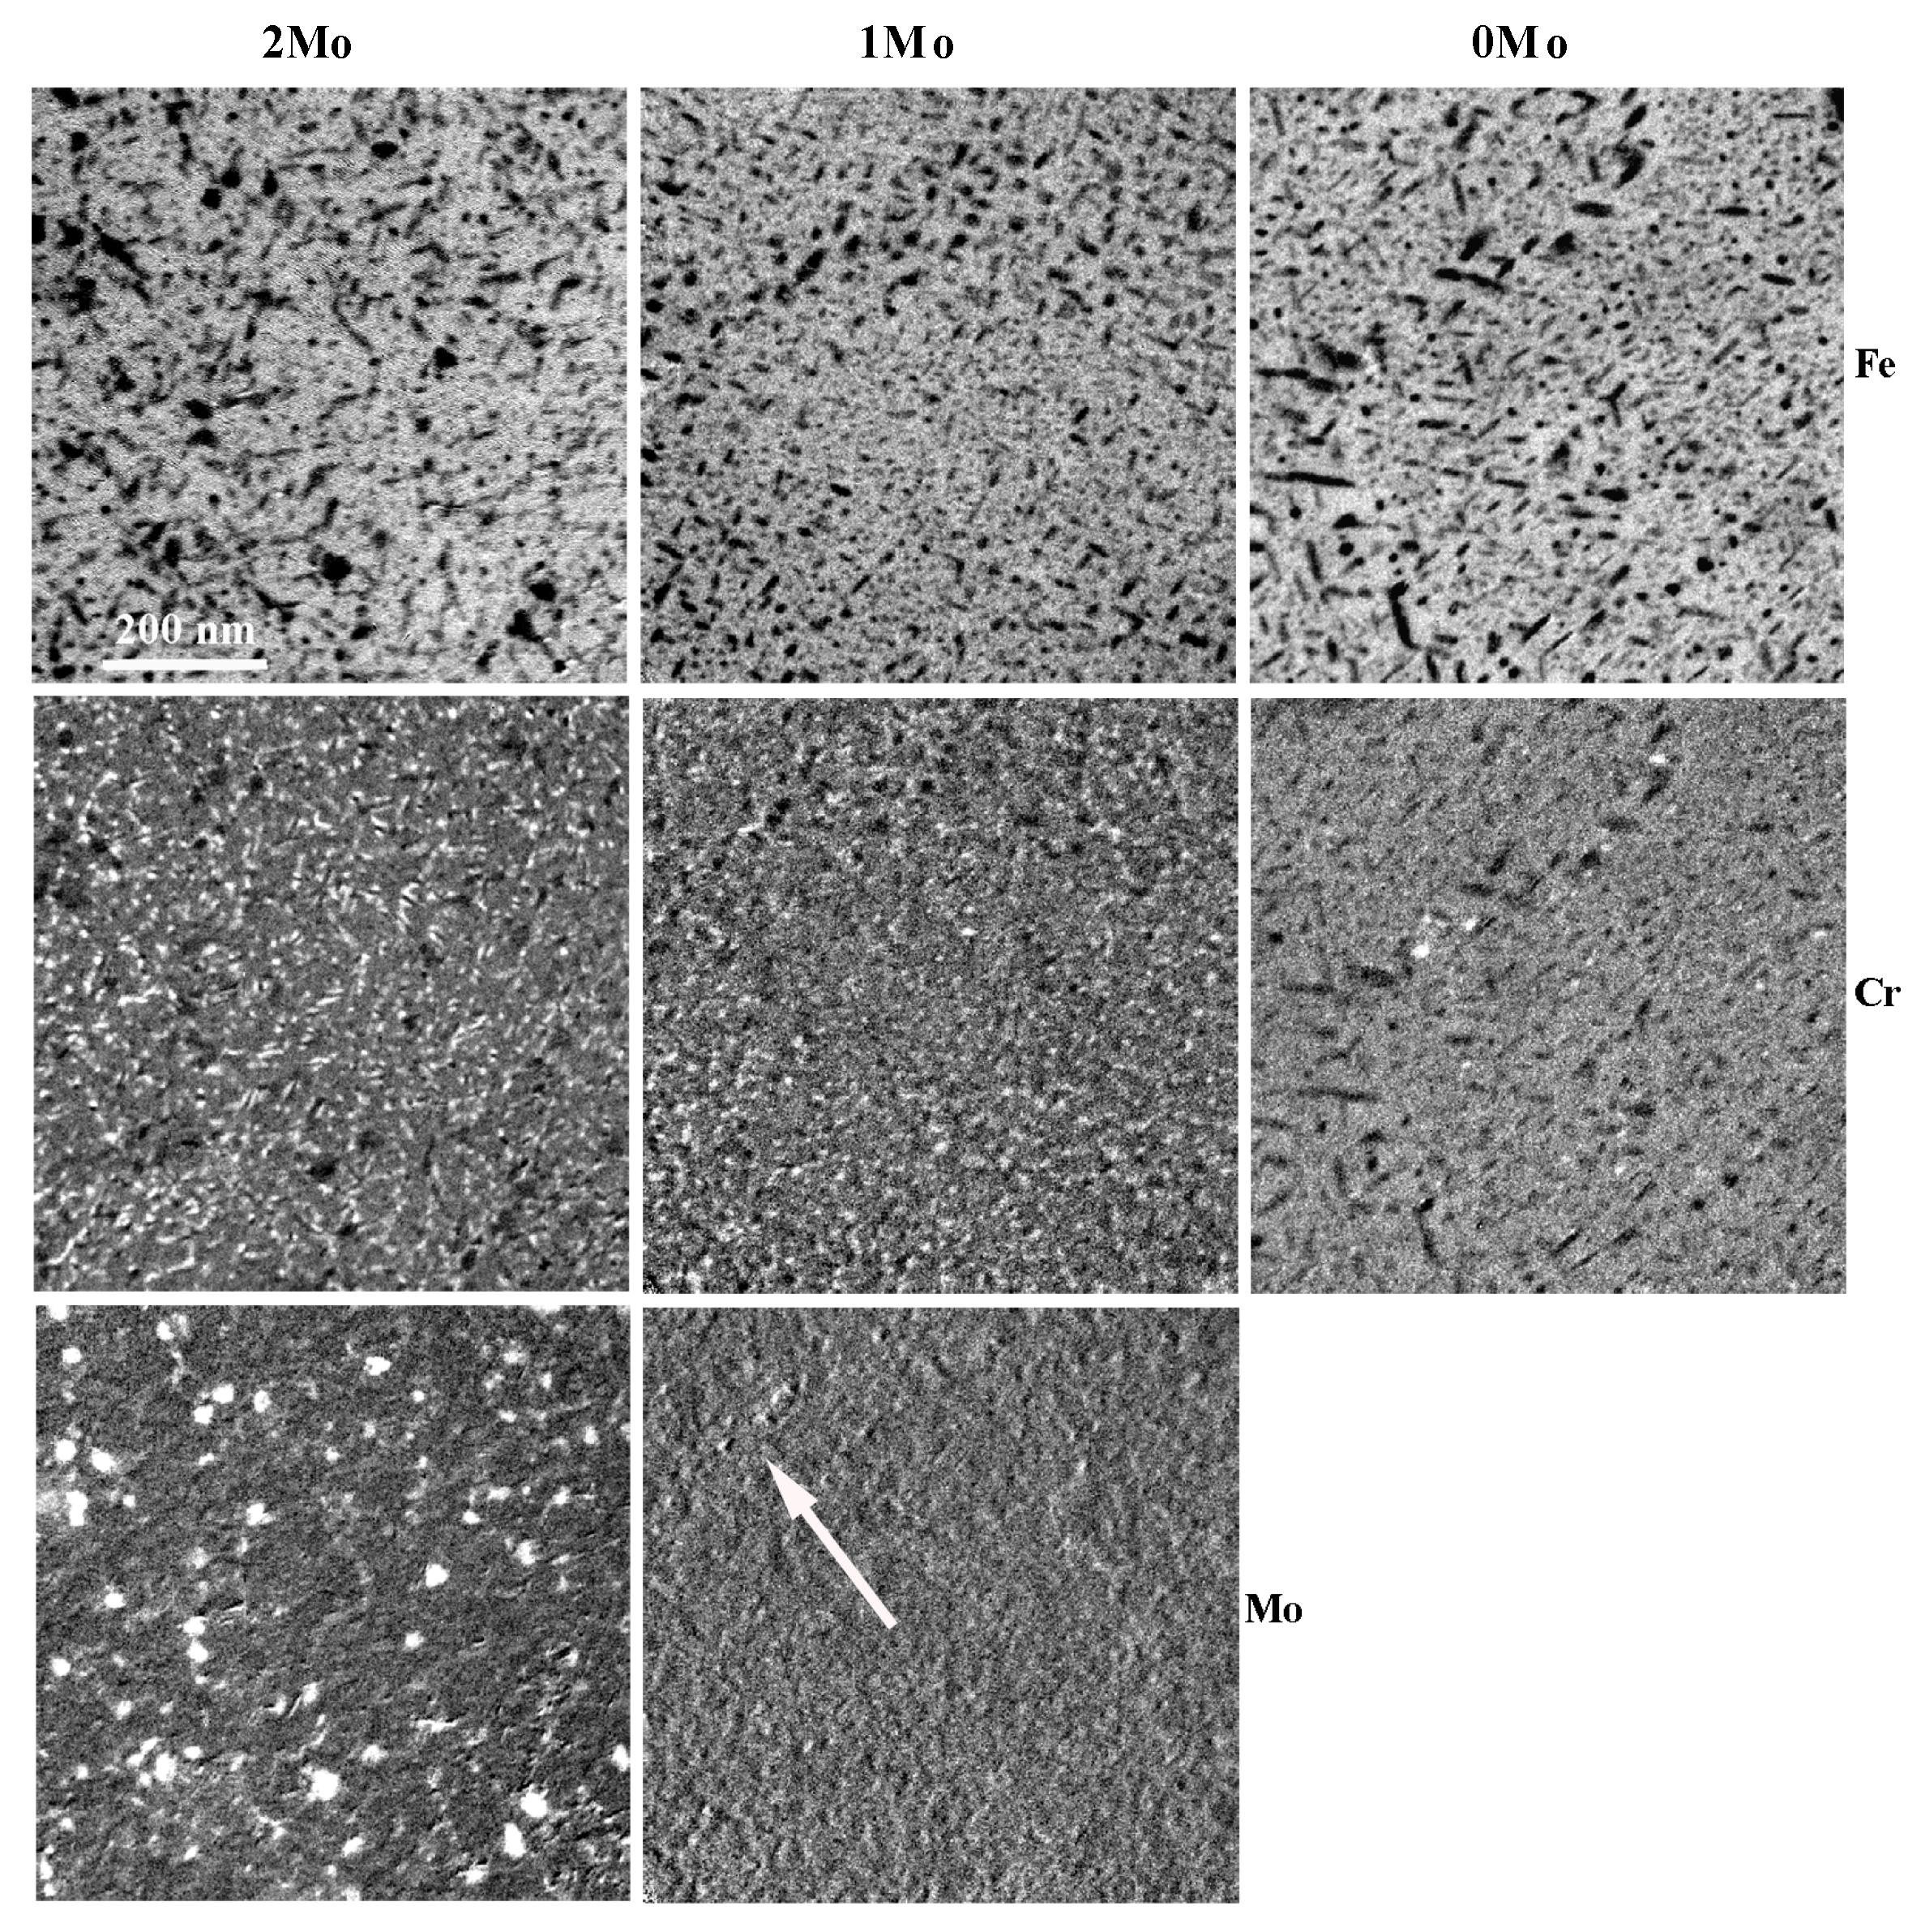
3.3. Transmission Electron Microscopy
4. Discussion
5. Conclusions
- Mo reduces the solubility of Cu in the martensitic matrix, which results in a faster nucleation of small Cu-rich precipitates. These precipitates promote the nucleation of Ni/Ti/Al-rich precipitates, which nucleate on the Cu-rich precipitates.
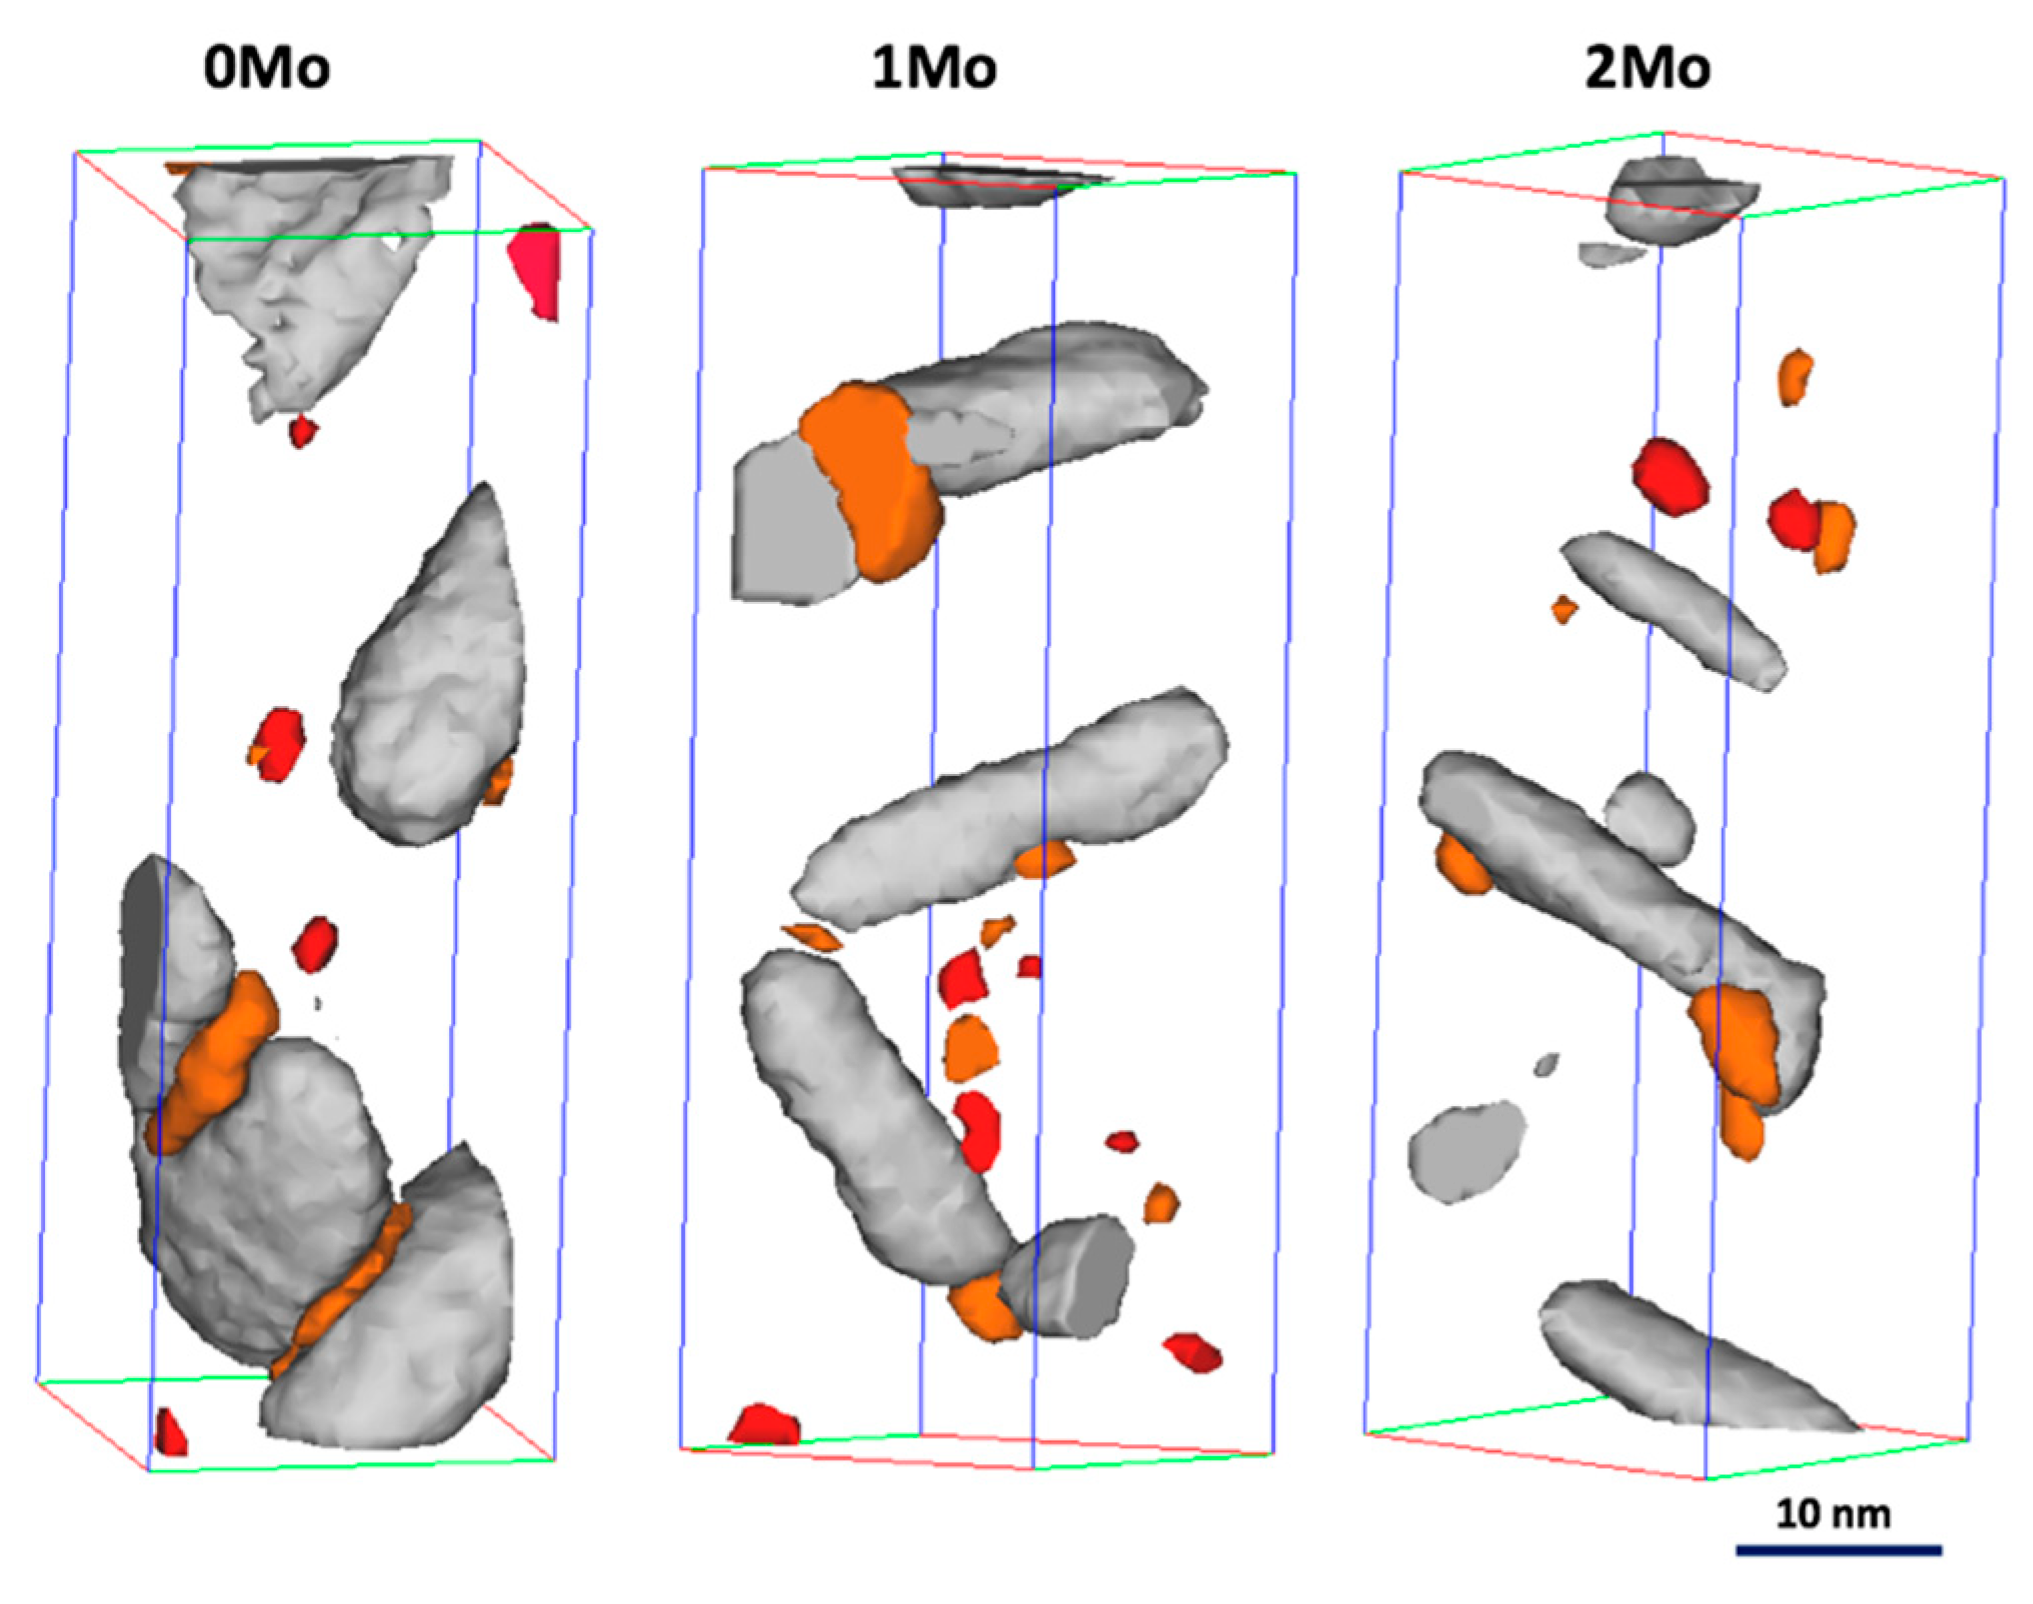
- Mo slows down the growth and coarsening of Ni-rich phases during aging. The phase transformation of γ′-Ni3(Ti, Al, Si) into G-Ni16Ti6Si7 is also promoted by the reduction of Mo in the materials.
- Mo promotes decomposition of the matrix into Cr-rich α′ regions.
- In the Mo-containing grades the quasicrystalline R′ phase forms after extended aging.
Author Contributions
Funding
Acknowledgments
Conflicts of Interest
References
- Sha, W.; Guo, Z. Maraging steels: Modelling of microstructure, properties and applications; Woodhead Publishing Ltd.: Cambridge, UK, 2009; pp. 10–14. [Google Scholar]
- Floreen, S. The physical metallurgy of maraging steels. Metall. Rev. 1968, 13, 115–128. [Google Scholar]
- Millan, J.; Ponge, D.; Raabe, D.; Choi, P.; Dimitrieva, O. Characterization of nano-sized precipitates in a Mn-based lean maraging steel by atom probe tomography. Steel Res. 2011, 82, 137–145. [Google Scholar] [CrossRef]
- Schnitzer, R.; Schober, M.; Zinner, S.; Leitner, H. Effect of Cu on the evolution of precipitation in an Fe-Cr-Ni-Al-Ti maraging steel. Acta Mater. 2010, 58, 3733–3741. [Google Scholar] [CrossRef]
- Leitner, H.; Schober, M.; Schnitzer, R. Splitting phenomenon in the precipitation evolution in an Fe-Ni-Al-Ti-Cr stainless steel. Acta Mater. 2010, 58, 1261–1269. [Google Scholar] [CrossRef]
- Ping, D.H.; Ohnuma, M.; Hirakawa, Y.; Kadoya, Y.; Hono, K. Microstructural evolution in 13Cr-8Ni-2.5Mo-2Al martensitic precipitation-hardened stainless steel. Mater. Sci. Eng. A 2005, 394, 285–295. [Google Scholar] [CrossRef]
- Tian, J.; Wang, W.; Shahzad, M.B.; Yan, W.; Shan, Y.; Jian, Z.; Yang, K. A new maraging steel with excellent strength-toughness-corrosion synergy. Materials 2017, 10, 1293. [Google Scholar] [CrossRef] [PubMed]
- Sun, L.; Simm, T.H.; Martin, T.L.; McAdam, S.; Galvin, D.R.; Perkins, K.M.; Bagot, P.A.J.; Moody, M.P.; Ooi, S.W.; Hill, P.; et al. A novel ultra-high strength maraging steel with balanced ductility and creep resistance achieved by nanoscale ß-NiAl and Laves phase precipitates. Acta Mater. 2018, 149, 285–301. [Google Scholar] [CrossRef]
- Nilsson, J.-O.; Hultin Stigenberg, A.; Liu, P. Isothermal formation of quasicrystalline precipitates and their effect on strength in a 12Cr-9Ni-4Mo maraging stainless steel. Metall. Trans. A 1994, 25, 2225–2233. [Google Scholar] [CrossRef]
- Liu, P.; Hultin Stigenberg, A.; Nilsson, J.-O. Quasicrystalline and crystalline precipitation during isothermal tempering in a 12Cr-9Ni-4Mo maraging stainless steel. Acta Metall. 1995, 43, 2881–2890. [Google Scholar] [CrossRef]
- Hättestrand, M.; Nilsson, J.-O.; Stiller, K.; Liu, P.; Andersson, M. Precipitation hardening in a 12%Cr-9%Ni-4%Mo-2%Cu stainless steel. Acta Mater. 2004, 52, 1023–1037. [Google Scholar] [CrossRef]
- Thuvander, M.; Andersson, M.; Stiller, K. Precipitation process of martensitic PH stainless steel Nanoflex. Mater. Sci. Technol. 2012, 28, 695–701. [Google Scholar] [CrossRef]
- Stiller, K.; Hättestrand, M.; Danoix, F. Precipitation in 9Ni-12Cr-2Cu maraging steels. Acta Mater. 1998, 46, 6063–6073. [Google Scholar] [CrossRef]
- Andersson, M.; Stiller, K.; Hättestrand, M. Comparison of early stages of precipitation in Mo-rich and Mo-poor maraging stainless steels. Surf. Interf. Anal. 2007, 39, 195–200. [Google Scholar] [CrossRef]
- Stiller, K.; Andrén, H.-O.; Andersson, M. Precipitation in maraging and martensitic chromium steels - What can we learn using 3-DAP and EFTEM. Mater. Sci. Technol. 2008, 24, 633–640. [Google Scholar] [CrossRef]
- Thuvander, M.; Andersson, M.; Stiller, K. Atom probe tomography investigation of lath boundary segregation and precipitation in a maraging stainless steel. Ultramicroscopy 2013, 132, 265–270. [Google Scholar] [CrossRef] [PubMed] [Green Version]
- Kelly, T.F.; Larson, D.J. Local electrode atom probes. Mater. Character. 2000, 44, 59–85. [Google Scholar] [CrossRef]
- De Geuser, F.; Lefebvre, W.; Blavette, D. 3D atom probe study of solute atoms clustering during natural ageing and pre-ageing of an Al-Mg-Si alloy. Phil. Mag. Lett. 2006, 86, 227–234. [Google Scholar] [CrossRef] [Green Version]
- Hofer, F.; Warbichler, P.; Grogger, W. Imaging of nanometer-sized precipitates in solids by electron spectroscopic imaging. Ultramicroscopy 1995, 59, 15–31. [Google Scholar] [CrossRef]
- Warbichler, P.; Hofer, F.; Hofer, P.; Letofsky, E. On the application of energy-filtering TEM in materials science: III. Precipitates in steel. Micron 1998, 29, 63–72. [Google Scholar] [CrossRef]


| Material | Cr | Ni | Mo | Cu | Ti | Al | Mn | Si | C |
|---|---|---|---|---|---|---|---|---|---|
| 0Mo | 12.8 | 8.3 | 0.01 | 1.74 | 1.25 | 0.90 | 0.40 | 0.43 | 0.02 |
| 1Mo | 13.0 | 8.4 | 1.18 | 1.75 | 1.11 | 0.85 | 0.40 | 0.38 | 0.02 |
| 2Mo | 13.0 | 8.5 | 2.31 | 1.68 | 1.10 | 0.69 | 0.30 | 0.23 | 0.03 |
| Material | γ′-Ni3(Ti, Al, Si) | η-Ni3(Ti, Al) | |||||||
|---|---|---|---|---|---|---|---|---|---|
| Ni | Ti | Al | Si | Fe | Ni | Al | Ti | Fe | |
| 0Mo | 44.2 ± 1.9 | 14.9 ± 1.4 | 7.4 ± 1.0 | 7.8 ± 1.0 | 16.7 ± 1.5 | 65.5 ± 1.8 | 6.4 ± 0.9 | 20.9 ± 1.5 | 2.8 ± 0.6 |
| 1Mo | 32.0 ± 0.8 | 9.9 ± 0.5 | 5.4 ± 0.4 | 7.2 ± 0.5 | 34.5 ± 1.2 | 61.7 ± 1.7 | 6.4 ± 0.9 | 15.5 ± 1.2 | 10.5 ± 1.1 |
| 2Mo | 37.4 ± 0.9 | 11.6 ± 0.6 | 5.8 ± 0.5 | 6.1 ± 0.5 | 28.5 ± 0.9 | 56.7 ± 1.5 | 6.0 ± 0.7 | 16.1 ± 1.1 | 13.6 ± 1.1 |
| Material | γ′-Ni3(Ti, Al, Si)/G-Ni16Ti6Si7 | η-Ni3(Ti, Al) | |||||||
|---|---|---|---|---|---|---|---|---|---|
| Ni | Ti | Al | Si | Fe | Ni | Al | Ti | Fe | |
| 0Mo | 49.7 ± 1.8 | 15.2 ± 1.3 | 4.4 ± 0.7 | 16.3 ± 1.3 | 10.3 ± 1.1 | 69.9 ± 0.5 | 8.8 ± 0.3 | 19.2 ± 0.5 | 0.8 ± 0.1 |
| 1Mo | 47.8 ± 2.5 | 14.0 ± 1.8 | 4.5 ± 1.1 | 14.3 ± 1.8 | 14.2 ± 1.8 | 67.0 ± 1.5 | 7.7 ± 0.9 | 19.7 ± 1.3 | 2.8 ± 0.5 |
| 2Mo | 41.1 ± 2.0 | 13.6 ± 1.4 | 6.4 ± 1.0 | 9.2 ± 1.2 | 22.3 ± 1.7 | 68.9 ± 1.3 | 8.4 ± 0.8 | 14.9 ± 1.0 | 3.7 ± 0.5 |
| Material | G-Ni16Ti6Si7 | η-Ni3(Ti,Al) | |||||||
|---|---|---|---|---|---|---|---|---|---|
| Ni | Ti | Al | Si | Fe | Ni | Al | Ti | Fe | |
| 0Mo | 28.1 ± 2.2 | 6.0 ± 1.2 | 3.6 ± 0.9 | 14.7 ± 1.7 | 39.8 ± 2.4 | 72.8 ± 2.8 | 4.9 ± 1.3 | 15.3 ± 2.3 | 4.5 ± 1.3 |
| 1Mo | 30.4 ± 4.2 | 10.1 ± 2.7 | 3.7 ± 1.7 | 21.6 ± 3.8 | 25.6 ± 4.0 | 68.8 ± 2.6 | 5.1 ± 1.2 | 16.2 ± 2.1 | 6.8 ± 1.4 |
| 2Mo | 46.8 ± 5.3 | 16.8 ± 4.0 | 3.3 ± 1.9 | 21.2 ± 4.4 | 5.3 ± 2.4 | 68.8 ± 1.7 | 7.5 ± 1.0 | 12.2 ± 1.2 | 6.4 ± 0.9 |
| Material | Cr | Ni | Mo | Cu | Ti | Al | Mn | Si |
|---|---|---|---|---|---|---|---|---|
| 4 h of aging | ||||||||
| 0Mo | 12.2 | 3.2 | - | 0.09 | 0.06 | 0.05 | 0.27 | 0.15 |
| 1Mo | 11.1 | 2.2 | 1.2 | 0.07 | 0.08 | 0.10 | 0.21 | 0.17 |
| 2Mo | 12.9 | 4.2 | 2.1 | 0.08 | 0.05 | 0.04 | 0.14 | 0.08 |
| 40 h of aging | ||||||||
| 0Mo | 11.5 | 3.7 | - | 0.07 | 0.07 | 0.06 | 0.26 | 0.14 |
| 1Mo | 11.4 | 3.0 | 0.9 | 0.07 | 0.06 | 0.04 | 0.23 | 0.09 |
| 2Mo | 11.5 | 3.8 | 1.7 | 0.06 | 0.03 | 0.04 | 0.14 | 0.07 |
| 100 h of aging | ||||||||
| 0Mo | 12.6 | 3.1 | - | 0.06 | 0.03 | 0.05 | 0.23 | 0.26 |
| 1Mo | 12.5 | 3.3 | 0.69 | 0.06 | 0.02 | 0.04 | 0.20 | 0.10 |
| 2Mo | 11.8 | 4.7 | 1.1 | 0.08 | 0.004 | 0.04 | 0.20 | 0.08 |
© 2019 by the authors. Licensee MDPI, Basel, Switzerland. This article is an open access article distributed under the terms and conditions of the Creative Commons Attribution (CC BY) license (http://creativecommons.org/licenses/by/4.0/).
Share and Cite
Thuvander, M.; Andersson, M.; Stiller, K. Multiple Influences of Molybdenum on the Precipitation Process in a Martensitic PH Stainless Steel. Metals 2019, 9, 1118. https://doi.org/10.3390/met9101118
Thuvander M, Andersson M, Stiller K. Multiple Influences of Molybdenum on the Precipitation Process in a Martensitic PH Stainless Steel. Metals. 2019; 9(10):1118. https://doi.org/10.3390/met9101118
Chicago/Turabian StyleThuvander, Mattias, Marcus Andersson, and Krystyna Stiller. 2019. "Multiple Influences of Molybdenum on the Precipitation Process in a Martensitic PH Stainless Steel" Metals 9, no. 10: 1118. https://doi.org/10.3390/met9101118