Article

Measurement of Metal Velocity in Sand Casting during Mold Filling

1
Department of Mechanical Engineering, Pennsylvania State University, State College, PA 16801, USA
2
Department of Electrical and Computer Engineering, Youngstown State University, Youngstown, OH 44555, USA
3
Department of Industrial and Manufacturing Engineering, Pennsylvania State University, State College, PA 16801, USA
*
Author to whom correspondence should be addressed.
Metals 2019, 9(10), 1079; https://doi.org/10.3390/met9101079
Submission received: 26 August 2019 / Revised: 17 September 2019 / Accepted: 20 September 2019 / Published: 6 October 2019
(This article belongs to the Special Issue Advances in Metal Casting Technology)

Abstract

:
Melt turbulence during mold filling is detrimental to the quality of sand castings. In this research study, the authors present a novel method of embedding Internet of Things (IoT) sensors to monitor real-time melt flow velocity in sand molds during metal casting. Cavities are incorporated in sand molds to position the sensors with precise registration. Capacitive and magnetic sensors are embedded in the cavities where melt flow velocity is calculated by using an oscillator, the frequency of which is sensitive to changes in the close field permittivity, and change in magnetic flux, respectively. Their efficiency is investigated by integrating the sensors into 3D sand-printing (3DSP) molds for conical-helix and straight sprue configurations to measure flow velocities for aluminum alloy 319. Experimental melt flow velocities are within 5% of estimations from computational simulations. A major benefit of 3DSP is the geometrical freedom for complex gating systems necessary to reduce turbulence and access to mold volume for sensor integration during 3DSP processing. Findings from this study establish the opportunity of embedding IoT sensors in sand molds to monitor metal velocity in order to validate simulation results (2–5% error), compare gating systems performance, and improve foundry practice of manual pouring as a quality control system.

Graphical Abstract

1. Introduction

3D sand-printing (3DSP) is a binder-jetting technologie, one of the seven additive manufacturing (AM) processes as defined by ISO/ASTM standards [1]. A layer of sand (usually 280–500 μm thick [2]) is spread across a sand bed and bound selectively by a jetted binder (e.g., furan) to create a sand mold or core [3]. The physics involved in 3DSP has been well researched [4,5], not only for optimizing the part performance [6], but also for enhancing casting performance by facilitating complex gating systems [7]. Complex gating systems including conical-helix sprue designs that can result in castings of significantly higher quality are now feasible via 3DSP [8,9]. The layer-by-layer fabrication process of 3DSP offers the ability to access the entire volume of the sand mold which offers the flexibility to embed foreign components into a priori-designed cavities to enable: (a) fabrication of smart molds by embedding sensors [4]; (b) enhancement of directional solidification by inserting chills similar to traditional casting techniques [10]; and (c) regulation of fluid flow by inserting filters [10] in otherwise difficult-to-access mold locations among other potential applications of embedded components.
Iron, aluminum, and steel account for 72%, 13%, and 10% of metal casting production respectively in the USA [11]. All of these major casting alloys are extremely susceptible to turbulence during filling. A comprehensive study focused on characterizing casting defects in steel castings (n = 500 cast parts) and concluded that more than 80% of its defects are due to macro-inclusions from re-oxidation when molten steel reacts with air due to turbulent gating designs [12]. Similarly, in aluminum [13] and magnesium alloys [14], agitation in liquid metal due to poor gating systems is reported to be a major cause for prevalent casting defects. Therefore, gating systems are often redesigned to mitigate turbulence through the use of techniques such as computational simulations [15]; numerical and statistical optimization [14,16,17]; and non-conventional gating systems [8]. However, real-time metal velocity in both traditional and 3DSP molds is currently unexplored. In addition, metal pouring in sand molds occurs in inherently harsher conditions such as high temperatures and densities, chemical aggressiveness, opacity, and outgassing. Such a hostile environment for instrumentation renders the foundry environment difficult to introduce mechanical probes, interferometers, visualization techniques, and photographic methods to characterize the fluid flow. Therefore, the majority of studies on casting flow visualization have been performed through indirect methods as described in the following sections when compared to direct methods first reported in this study.

1.1. Water Modeling Experiments

Water modeling experiments are based on the hypothesis that the flow of water is closely analogous to that of molten metal if kinematic viscosities of water are adapted for aluminum and magnesium [10], cast iron [18,19], and steel [20]. However, water models do not accurately replicate the effects of the actual gating system [21]. Water models cannot be used to analyze an entire casting gating system and could be used only on an ad hoc basis depending on the geometry and metal under consideration [22,23]. A recent study proposes the fluid dynamic analogy theory, which dictates that the similarity will hold true if the four non-dimensional numbers (Webber, Reynolds, Froude, and Euler) are equivalent to the analogous experiments [24]. Based on this concept, the effects of surface tension from oxide formation could be included in the formulation of the air entrapment rate, and water was identified (particularly salt water) as an analogous fluid for steel [20]. Another study used this analogy to analyze the effectiveness of various lip pour ladle designs [25].
Transparent molds usually made of Perspex, acrylic [26], thermal-resistant glass [27], etc. are often used to image the fluid flow in real time. Multi-gate systems have been analyzed using acrylic molds and flow rates are calculated using tap and collect method [28]. The flow of aluminum alloy and zinc in multi-gate systems in water flow models showed that the gate closest to sprue fills first while the farthest gate exhibited the maximum volume of discharge [29].

1.2. X-Ray Radiography

X-ray radiography is another source of visualizing mold filling. Due to their high-fidelity, X-rays are used to qualitatively benchmark the effectiveness of gating systems and computational filling simulations, etc. [30,31,32]. However, it is often very expensive and this technique is limited in casting shapes and sizes that can be successfully X-rayed. Furthermore, safety concerns for the operator exist due to X-ray radiation. The cost, size, and safety demanded by the process restricts its utility in the production environment and is limited only to laboratory settings. In addition, X-ray radiography is limited to two-dimensional projections, and three-dimensional characteristics such as vortexes cannot be distinguished. Furthermore, this technique does not provide quantifiable information that can be directly correlated with flow simulations (e.g., incremental and instantaneous metal velocity during pouring and filling).

1.3. Capacitive Sensors

Electrical capacitance tomography (ECT) is a category of tomography that measures electrical properties principled on the capacitive nature of the flow medium under investigation [33]. ECT has been investigated in the literature for its ability to accurately image 2D and 3D multiphase flow systems. Capacitive sensors integrated with wireless systems has been evaluated for metal-fill monitoring system in lost-foam metal casting [34]. In this application, the ECT apparatus consists of fixed impedance elements in series with a variable impedance block. The sensor relies on the change in coupling capacitance between the electrodes across ground metal [35]. The induced variable impedance between the two capacitive electrodes when liquid metal is in direct vicinity results in a change in the output voltage of the capacitive sensors [34,35]. This process was further optimized by resolving the packet loss issues associated with wireless transmission of data [34,36]. Although the location and amount of metal inside the flask can be identified via ECT, local melt velocities cannot be accurately acquired through ECT sensing alone. In addition, the shielding of electrode plates from liquid channels limits its applications in fluid flow monitoring in gating systems. To the best of the authors’ knowledge, ECT has not been explored for real-time melt flow velocity measurements.

1.4. 3D-Printed Smart Molds

Dialog Internet of Things (IoT) sensor systems (Dialog Semiconductors, UK) are equipped with an Cortex-M0 processor (ARM, Cambridge, UK) that can collect, process, and communicate information from various hardware sensors such as accelerometers, gyroscopes, magnetometers, and environmental sensors wirelessly via Bluetooth BLE (Bluetooth Low Energy) [37]. The smaller design space requirement (18 × 18 × 8 mm) combined with wireless radio capability are ideal for insertion into difficult-to-access locations such as molds and cores in sand casting. In an earlier work, authors leveraged this unique advantage by integrating wired and wireless sensors into the mold to collect a wide variety of data such as temperature, pressure, moisture, gas chemistries, vibrations, and rotations of the mold and core pieces and magnetic field [4]. For example, data from a high-sensitivity gyroscope can be used to measure rotational shift of hanging cores during mold filling [38]. This sensor enables measurement of change in temperature, pressure, binder evaporation, and moisture content when liquid metal encloses a sand core. The data captured are in close agreement with high-fidelity solidification simulations. One of the limitation of this sensor is the poor survivability of the electronic components, which fail to operate above 85 °C and are destroyed beyond 150 °C when in direct contact with or close proximity to molten metal. However, as detailed in the latter section of this article, this drawback is not a concern for the objective of this study to measure metal velocity data during the beginning of the pour.
In this study, identical sensors from the previous efforts were optimized to measure the magnetic signature as the molten metal passes through the runners located near the sensors (Figure 1). The velocity of the initial front of metal flow can be determined based on the delay of the melt travel front across two sensors located at a pre-determined distance. In addition, continuous velocity measurements can be determined from continuous magnetic field due to the motion of static electric charge until the sensors expire due to extremely high temperature. Figure 1 illustrates the setup incorporated in a 3D-printed sand mold to position sensors in close proximity to a runner or casting cavity.

1.5. Contactless Techniques—Magnetohydrodynamics and Ultrasound Doppler Velocimetry

Magnetohydrodynamics (MHD) is a branch of physics that studies the behavior of electrically conducting fluids often in the presence of external electromagnetic fields. Since most metals are electrically conductive in their liquid form, this branch of physics has been extensively researched to both measure and influence the flow rate of liquid metal [18]. MHD techniques primarily rely on the electromotive force (EMF) or the Lorentz force ( F L ) generated when an external magnetic field is applied to a conductive fluid flow. EMF is proportional to the cross-product of the desired flow velocity ( v ), externally applied magnetic field ( B ), and the constant of proportionality—charge (q) carried by liquid and can be expressed as:
F L = q v × B ,
and according to Ohm’s law, current density can be expressed as:
J = σ ( v × B ) ,
where J represents the current density through the runner and σ is the electrical conductivity. Assuming that the potential difference is directly proportional to the local velocity of the liquid:
Φ = Δ x V B .
The magnitude and direction of the local melt velocity can be determined with a magnetic probe that measures this potential difference induced on the electrodes when conductive fluid flows around a cylindrical magnet [39,40]. Permanent magnets tailored to the specific needs of the liquid medium under investigation can enable velocity measurements at temperatures as high as 670 °C at a maximum velocity of 10 m/s with a sensitivity of 1 mm/s [41,42,43]. However, this probe failed to measure velocity at temperatures above 720 °C [41], and hence, is not relevant for metal casting. In addition, this technique also fails in argon-agitated liquid aluminum (i.e., two-phase flow) at temperatures less than 700 °C [44].
Contactless inductive flow tomography (CIFT) is based on a three-dimensional inductive velocity reconstruction principle that is particularly advantageous for contactless determination of three-dimensional full flow velocity fields. This principle relies on the additional induced magnetic field and electric potential in the generated EMF during MHD flows [45]. The magnetic field can be measured external to the fluid volume whereas the electric potential can be measured at the fluid boundary. The primary magnetic field can be applied successively in two different directions and corresponding induced magnetic fields can be measured to determine liquid flow velocity [46].
Ultrasonic techniques are based on run-time differences between ultrasonic pulses sent between two transducers upstream and downstream through liquid flow to calculate average velocity. Accurate local velocities can be captured by a similar application known as ultrasound Doppler velocimetry (UDV) which is based on a pulsed-echo technique that employs a transducer to emit an ultrasound pulse and receive the echo reflected from the surface of microparticles suspended in the flowing liquid [47]. However, challenges such as high melt temperatures and chemical aggressiveness of molten metal limit the applicability of UDV to very high temperature liquid metal flows [45].
In summary, the contactless techniques reported in the literature have several drawbacks including limited application to real-time process monitoring of sand casting, i.e., pouring in a foundry environment. To the best of the authors’ knowledge, contactless techniques have not been explored for real-time melt flow velocity, specifically in sand-casting.

1.6. Contact Techniques

Invasive contact techniques use velocity probes that are immersed into the liquid metals under the assumption that: (a) the sensing medium is chemically inert to molten metal, and (b) the sensing medium does not disturb or effect the fluid flow conditions. Contact probes in such invasive approaches can be classified into: (1) force reaction probes, (2) thermal anemometers, (3) conductive sensors, (4) mechano-optical probes, and (5) Karman vortex probes. Force reaction probes measure the pressure exerted by the flowing medium based on the principles of fluid mechanics. The measurement of flow rates through pressure difference methods such as Pitot–Prandtl tubes has been shown to be ineffective in metal solidification in manometric tubes [39] and results in overheating of the sensors. In addition, the liquid metal flows (i.e., EMF) affect the stagnation pressure and cause inaccurate measurements [48]. Thermal anemometry techniques are principled on the changes in resistance of electrically heated wire inserted in the melt due to convective heat loss to the surrounding melt. This technique is prone to fouling, i.e., deposition of debris and oxides which is largely influenced by ambient and pressure conditions and, therefore, infeasible for liquid metals [49]. In addition, the maximum operating temperature is about 1000 °C [50] which limits its applications for most casting alloys.
Conductive anemometers, i.e., potential difference probes rely on the principle that a traveling magnetic field will generate a dynamic electric field [51]. On the other hand, mechano-optical probes that are insensitive to electrical noise and external magnetic fields could be used at relatively higher temperatures (about 700–800 °C) based on the principle of optical acquisition and signal processing of mechanical interaction between fluid and sensor tip [52]. A Karman vortex probe is based on Karman vortex streets formed behind an immersed cylinder with shredding frequency which is proportional to flow velocity when the liquid approaches the cylinder [53].
In summary, invasive contact techniques have been unsuccessful in measuring flow rates for industrial casting processes because of poor probe survivability at higher temperatures. Reported studies are found to be applicable only for metals with lower melting points such as sodium, bismuth, etc. To the best of the authors’ knowledge, contact techniques have not been explored for real-time melt flow velocity, specifically in sand-casting of 3DSP molds.

1.7. Research Objectives

Foundries will benefit from measuring techniques with robust instrumentation to determine real-time melt velocity that can meet the following requirements: (1) inexpensive, (2) integration into functional sand molds, (3) safety, (4) reliability, and (5) accessible via an open-source software platform to promote further innovation as well as the reproducibility of the presented experiments. In this research study, the novel use of commercially available IoT sensors will be systematically evaluated to meet all these requirements. In this study, the authors aim to validate unique capabilities of smart sand molds with embedded sensors to evaluate its effectiveness in measuring real-time melt flow velocity when compared to melt flow simulation (including 3DSP-featured complex gating castings). Research methodology of this study is presented in Section 2. Section 3 and Section 4 present results and discuss casting implications, respectively. Conclusions are drawn in Section 5.

2. Materials and Methods

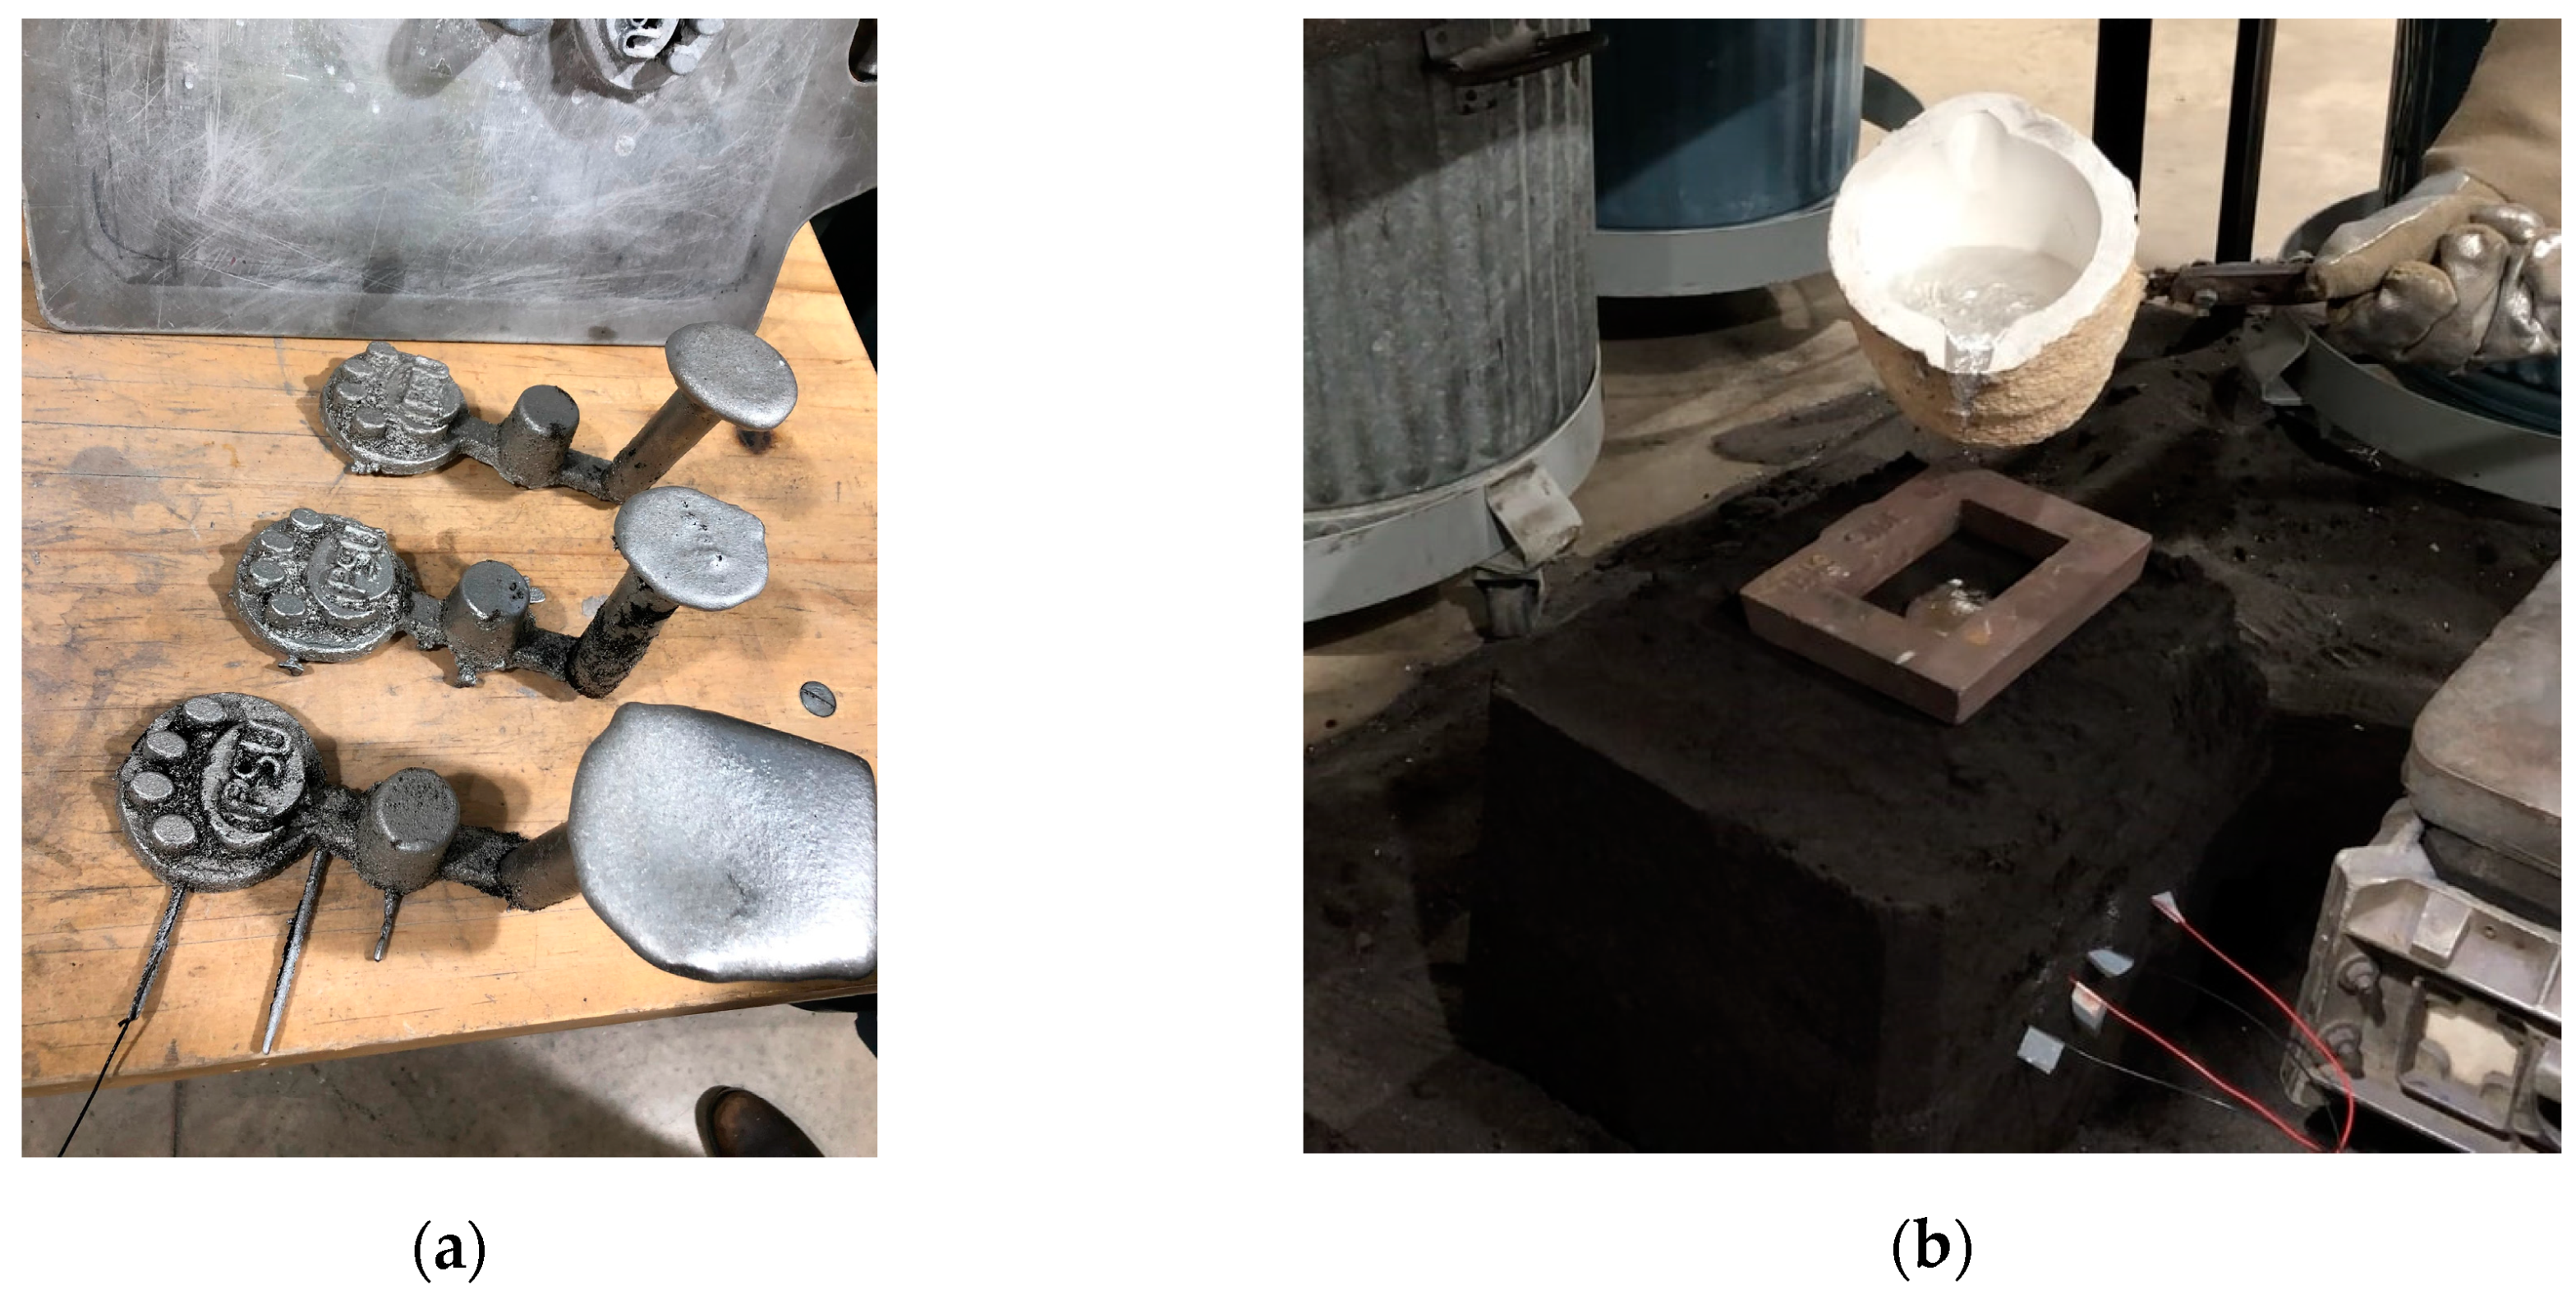
2.1. Experimental Methodology

In order to examine the utility of sensors, authors conducted experiments by incorporating sensors into two different sprue-casting configurations: (1) freeform geometry [8] to reduce melt flow velocity and (2) conventional straight sprue. The mold design and casting methodology is presented below.

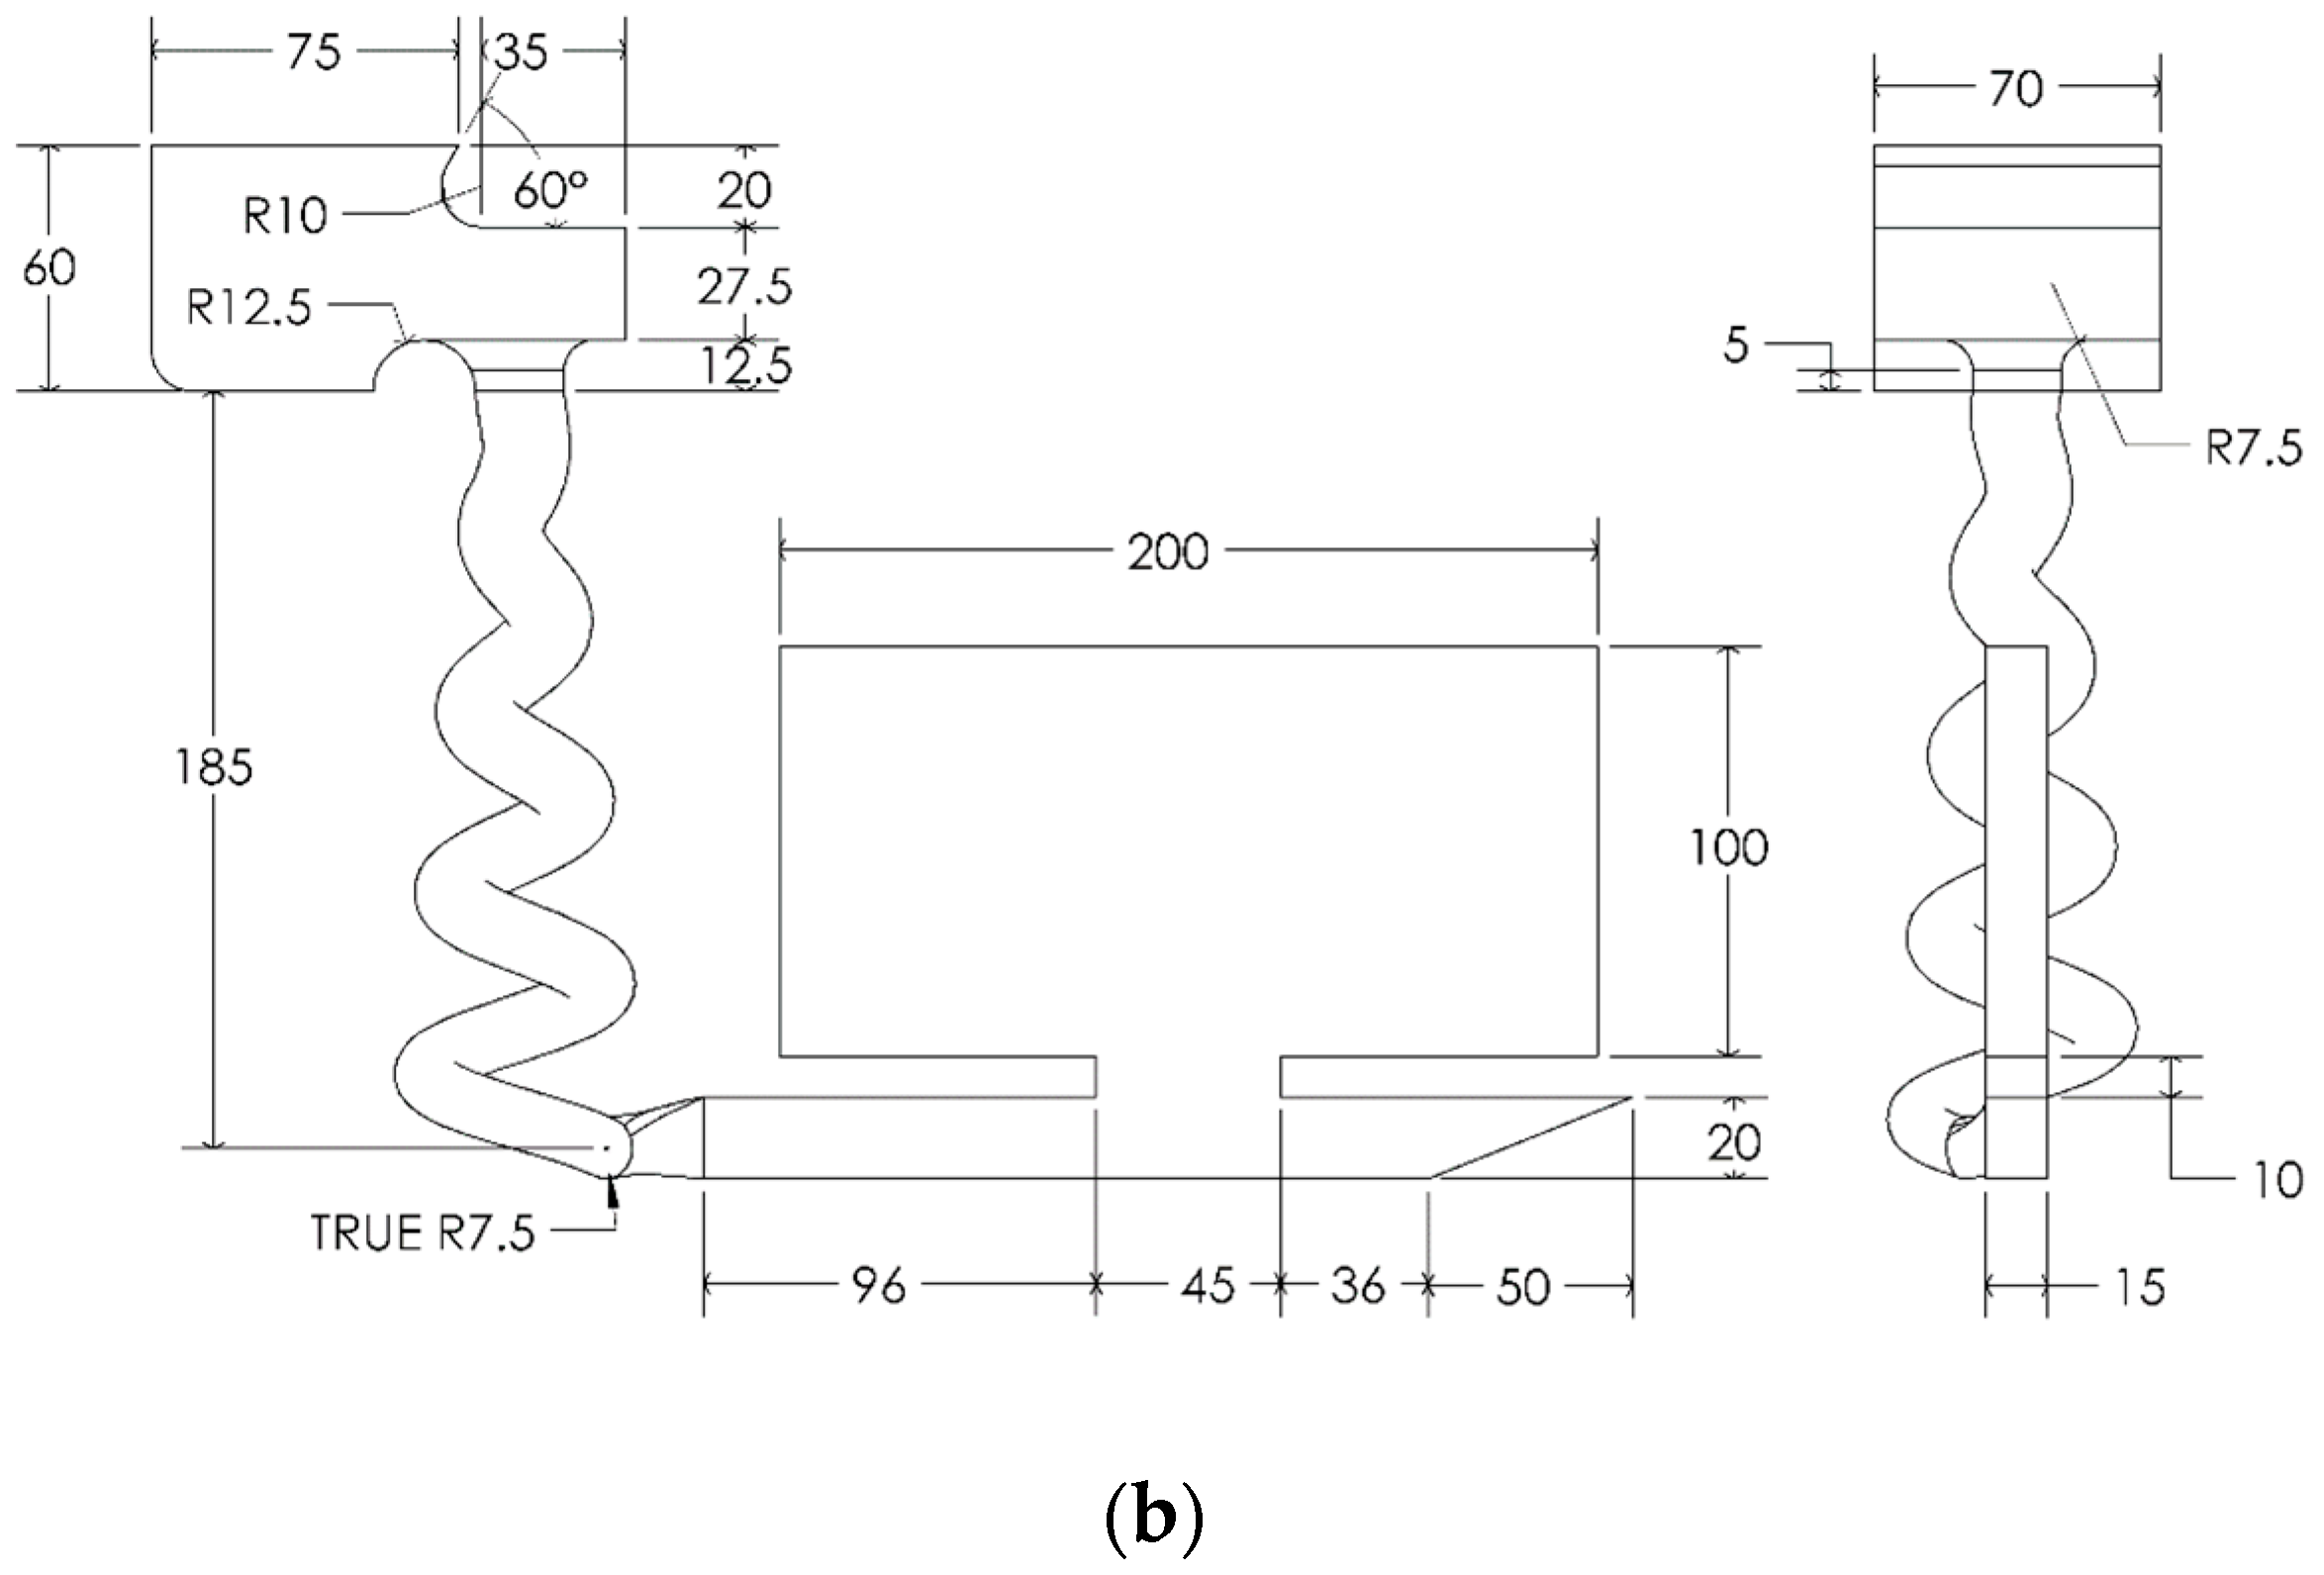
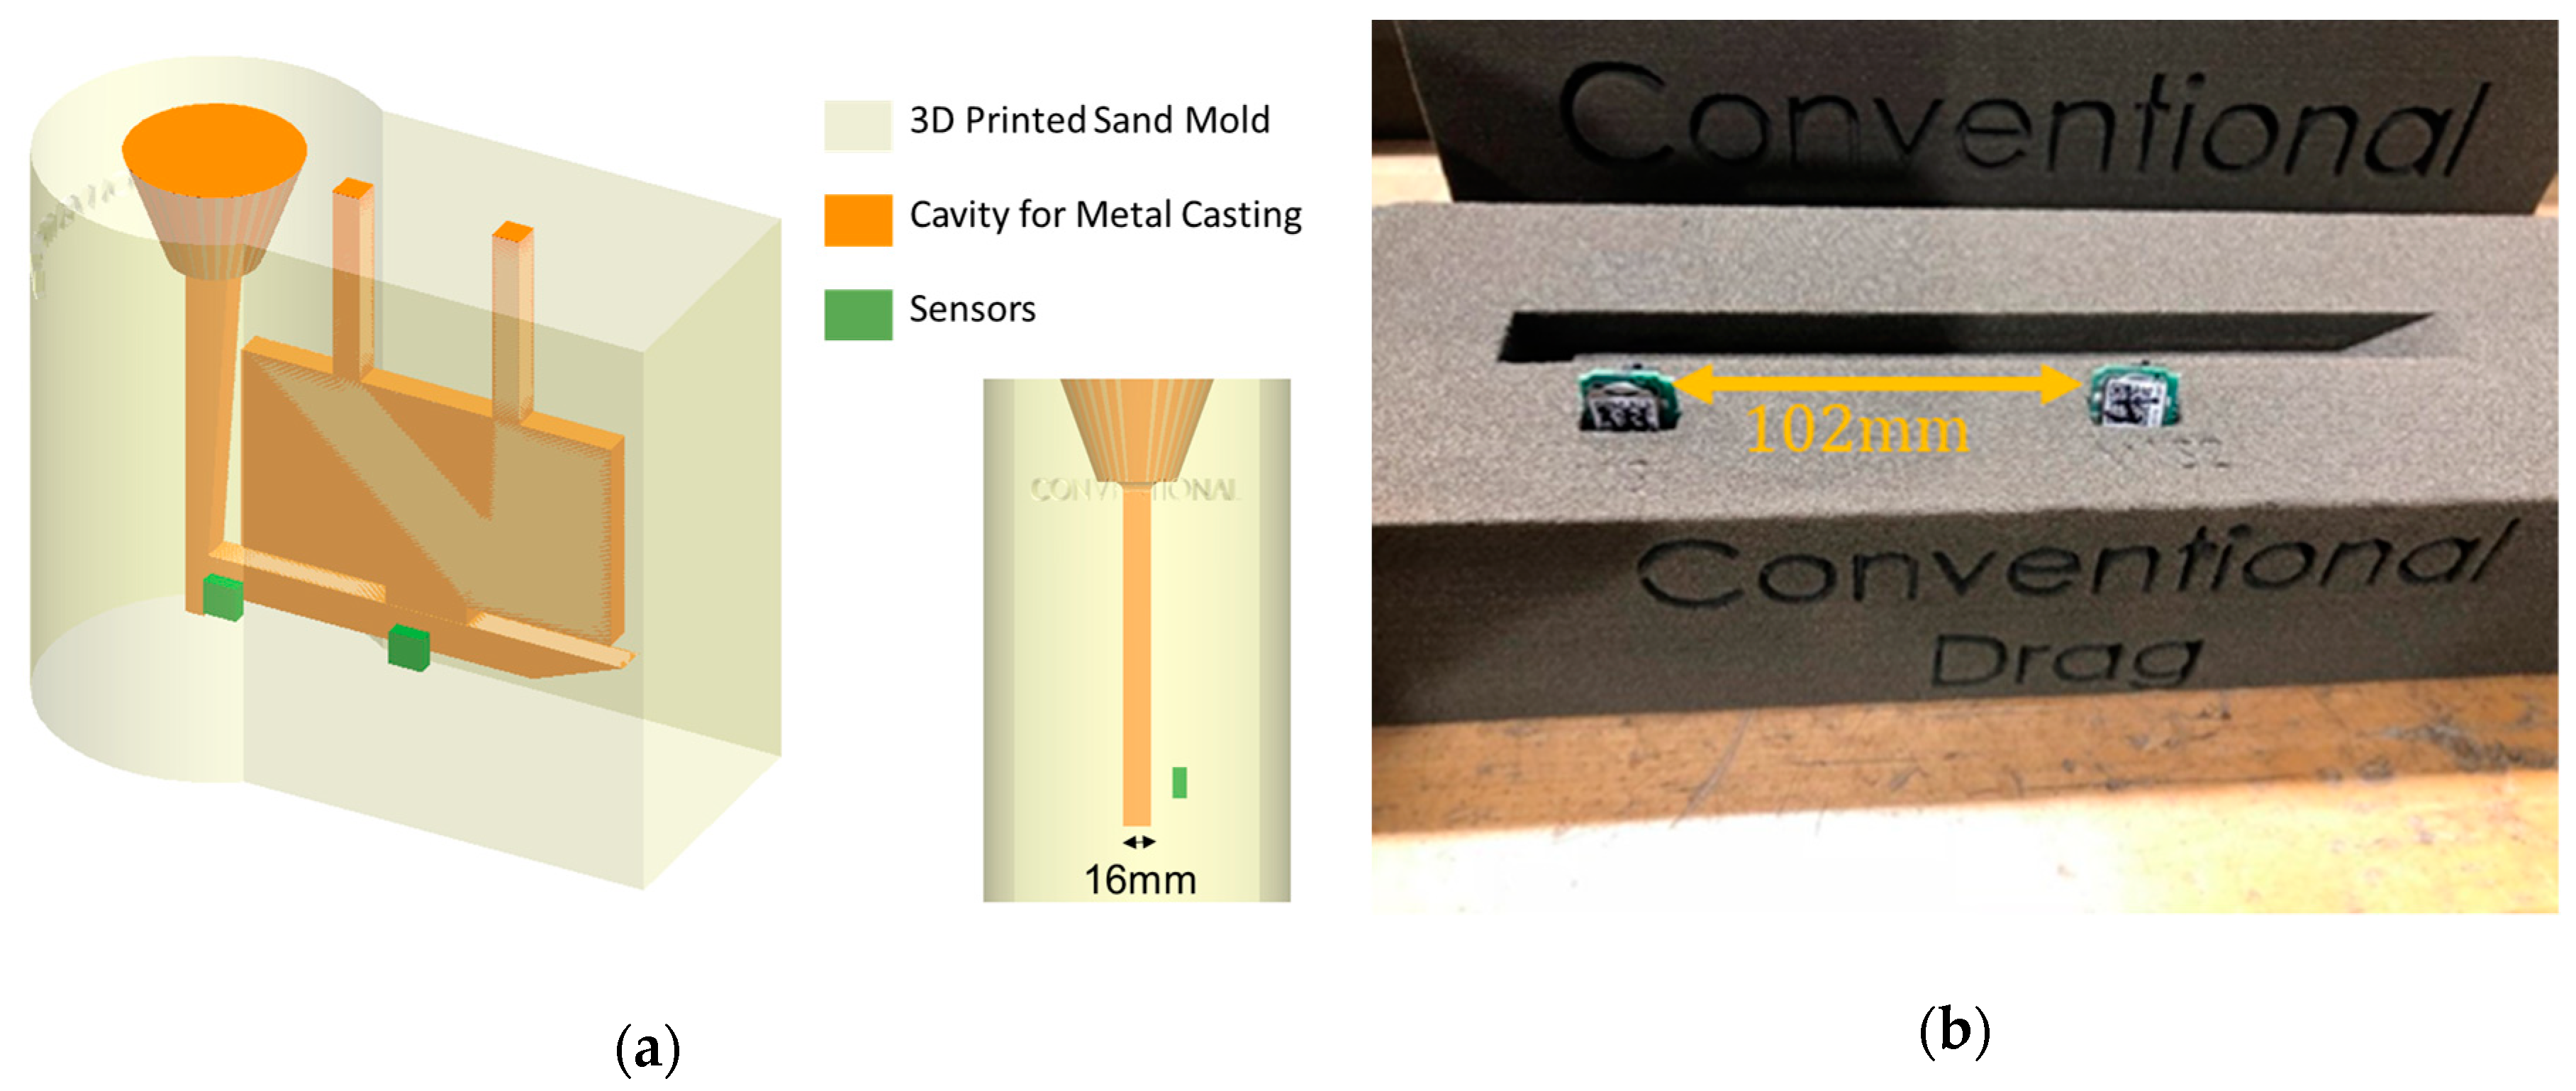
2.2. Straight and Conical-Helix Sprued 3D-Printed Molds

An ExOne S-Max Industrial Production 3D Printer was used to fabricate the sand molds using foundry sand and furan binder in standard processing conditions recommended by the manufacturer. As shown in Figure 2, one mold used a conventional straight sprue and the other featured a novel conical-helix sprue that has been recently identified by the authors to be more effective in reducing metal turbulence during mold filling [7,8]. In addition to evaluating the electromagnetic sensing using IoT in this study, the authors aim to validate the minimization of turbulence in conical-helix sprues when compared to conventional sprue methods.
Aluminum 319 alloy is employed in this study and the chemical composition is presented in Table 1. Figure 2 describes the geometry of the straight sprued casting (SSC) and the conical-helix sprued casting (CHSC). In the case of CHSC, the parameters of the conical-helix sprue are mathematically optimized using an SQP (Sequential Quadratic Programming) algorithm for a target in-gate velocity ( 0.5m/s) while minimizing thermal loss [8]. The density and kinematic viscosity of the Al319 alloy was assumed as 2400 kg/m3 and 1.29 × 10⁻⁶ m2/s respectively [54]. The constrained optimization algorithm yielded a cone radius of 25 mm with a helical pitch of 45 mm. The cross-sectional area of sprue inlet and outlet was 368 and 160 mm2, respectively for both castings. A gating ratio of 1:1:0.7 was used in the construction of subsequent elements of the gating system [54,55].

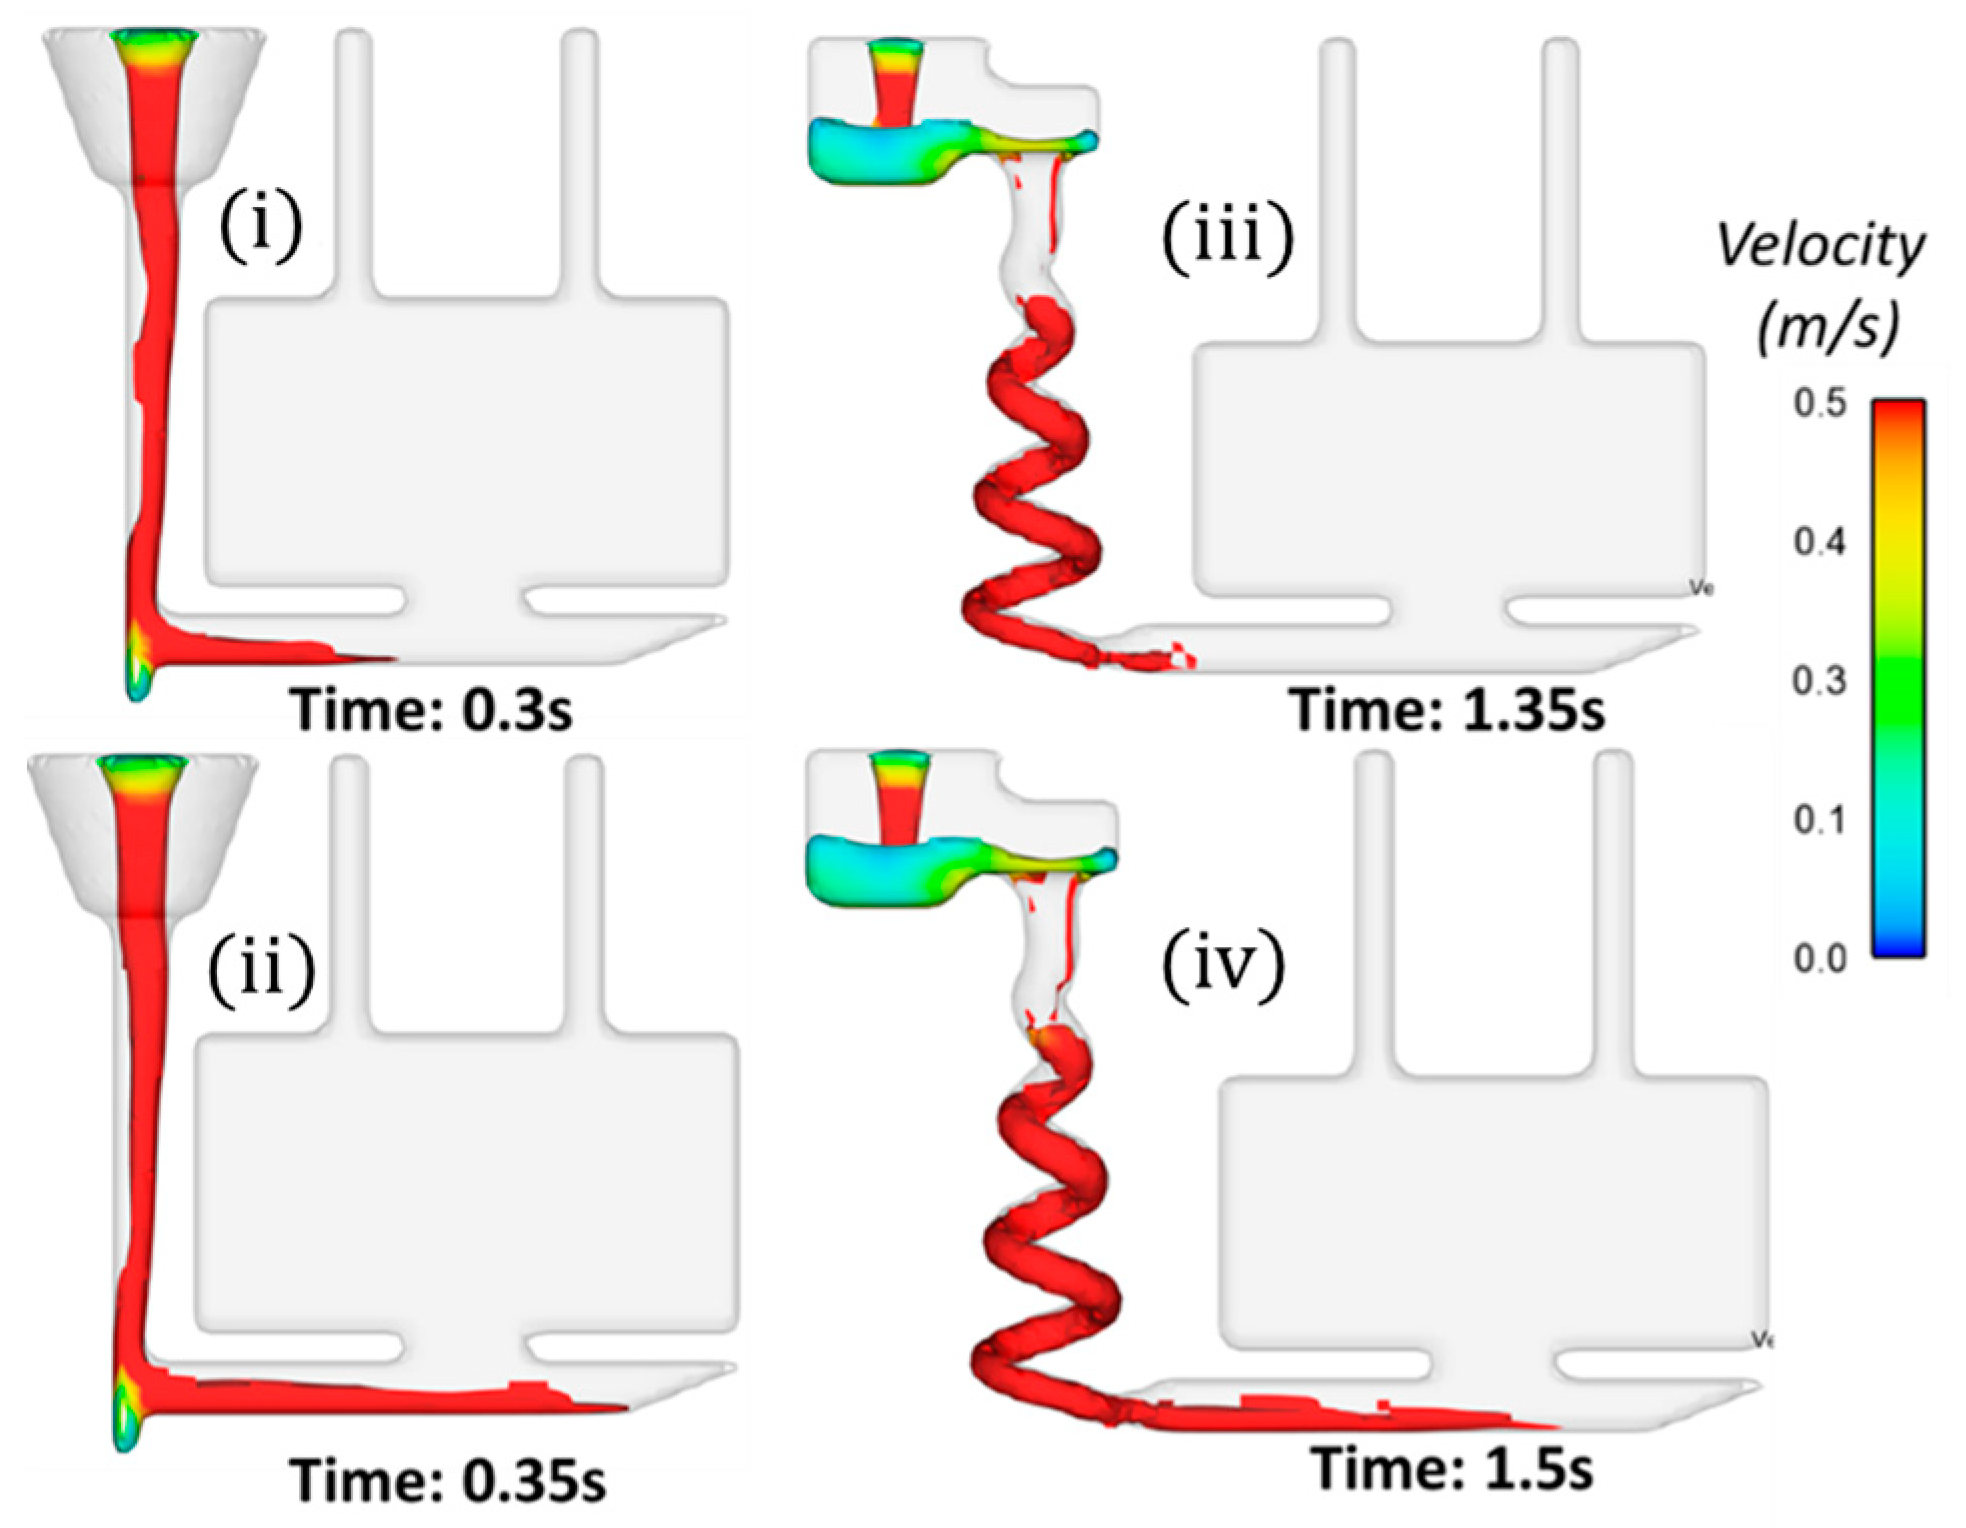
2.3. Computational Simulations

The velocity data collected from the sensor systems were validated through simulations using Flow 3D-CAST v4.0 computational fluid flow simulation software [7,8]. An RNG (Renormalization Group) turbulence model was used, and the software applied Navier–Stokes methodology using the VOF (Volume of Fluid) method to solve the momentum and continuity equations. Surrounding gas was assumed as air and, therefore, initial pressure in the void environment was selected as atmospheric pressure at 1 atm (101,325 Pa). Furan molding sand, CB 500 C was selected as the molding material. The maximum thermal penetration depth of 5 mm was assumed and the virtual probe was inserted at the sensor locations for quantitative information of the flow characteristics from the simulations (Table 2). Figure 3 shows the two instances of the filling profile of metal in the runner in the Straight Sprue Casting (SSC) and the Conical Helix Sprue Casting (CHSC). The average inlet velocities of the metal in SSC and CHSC were 1.34 and 0.49 m/s, respectively in simulation.

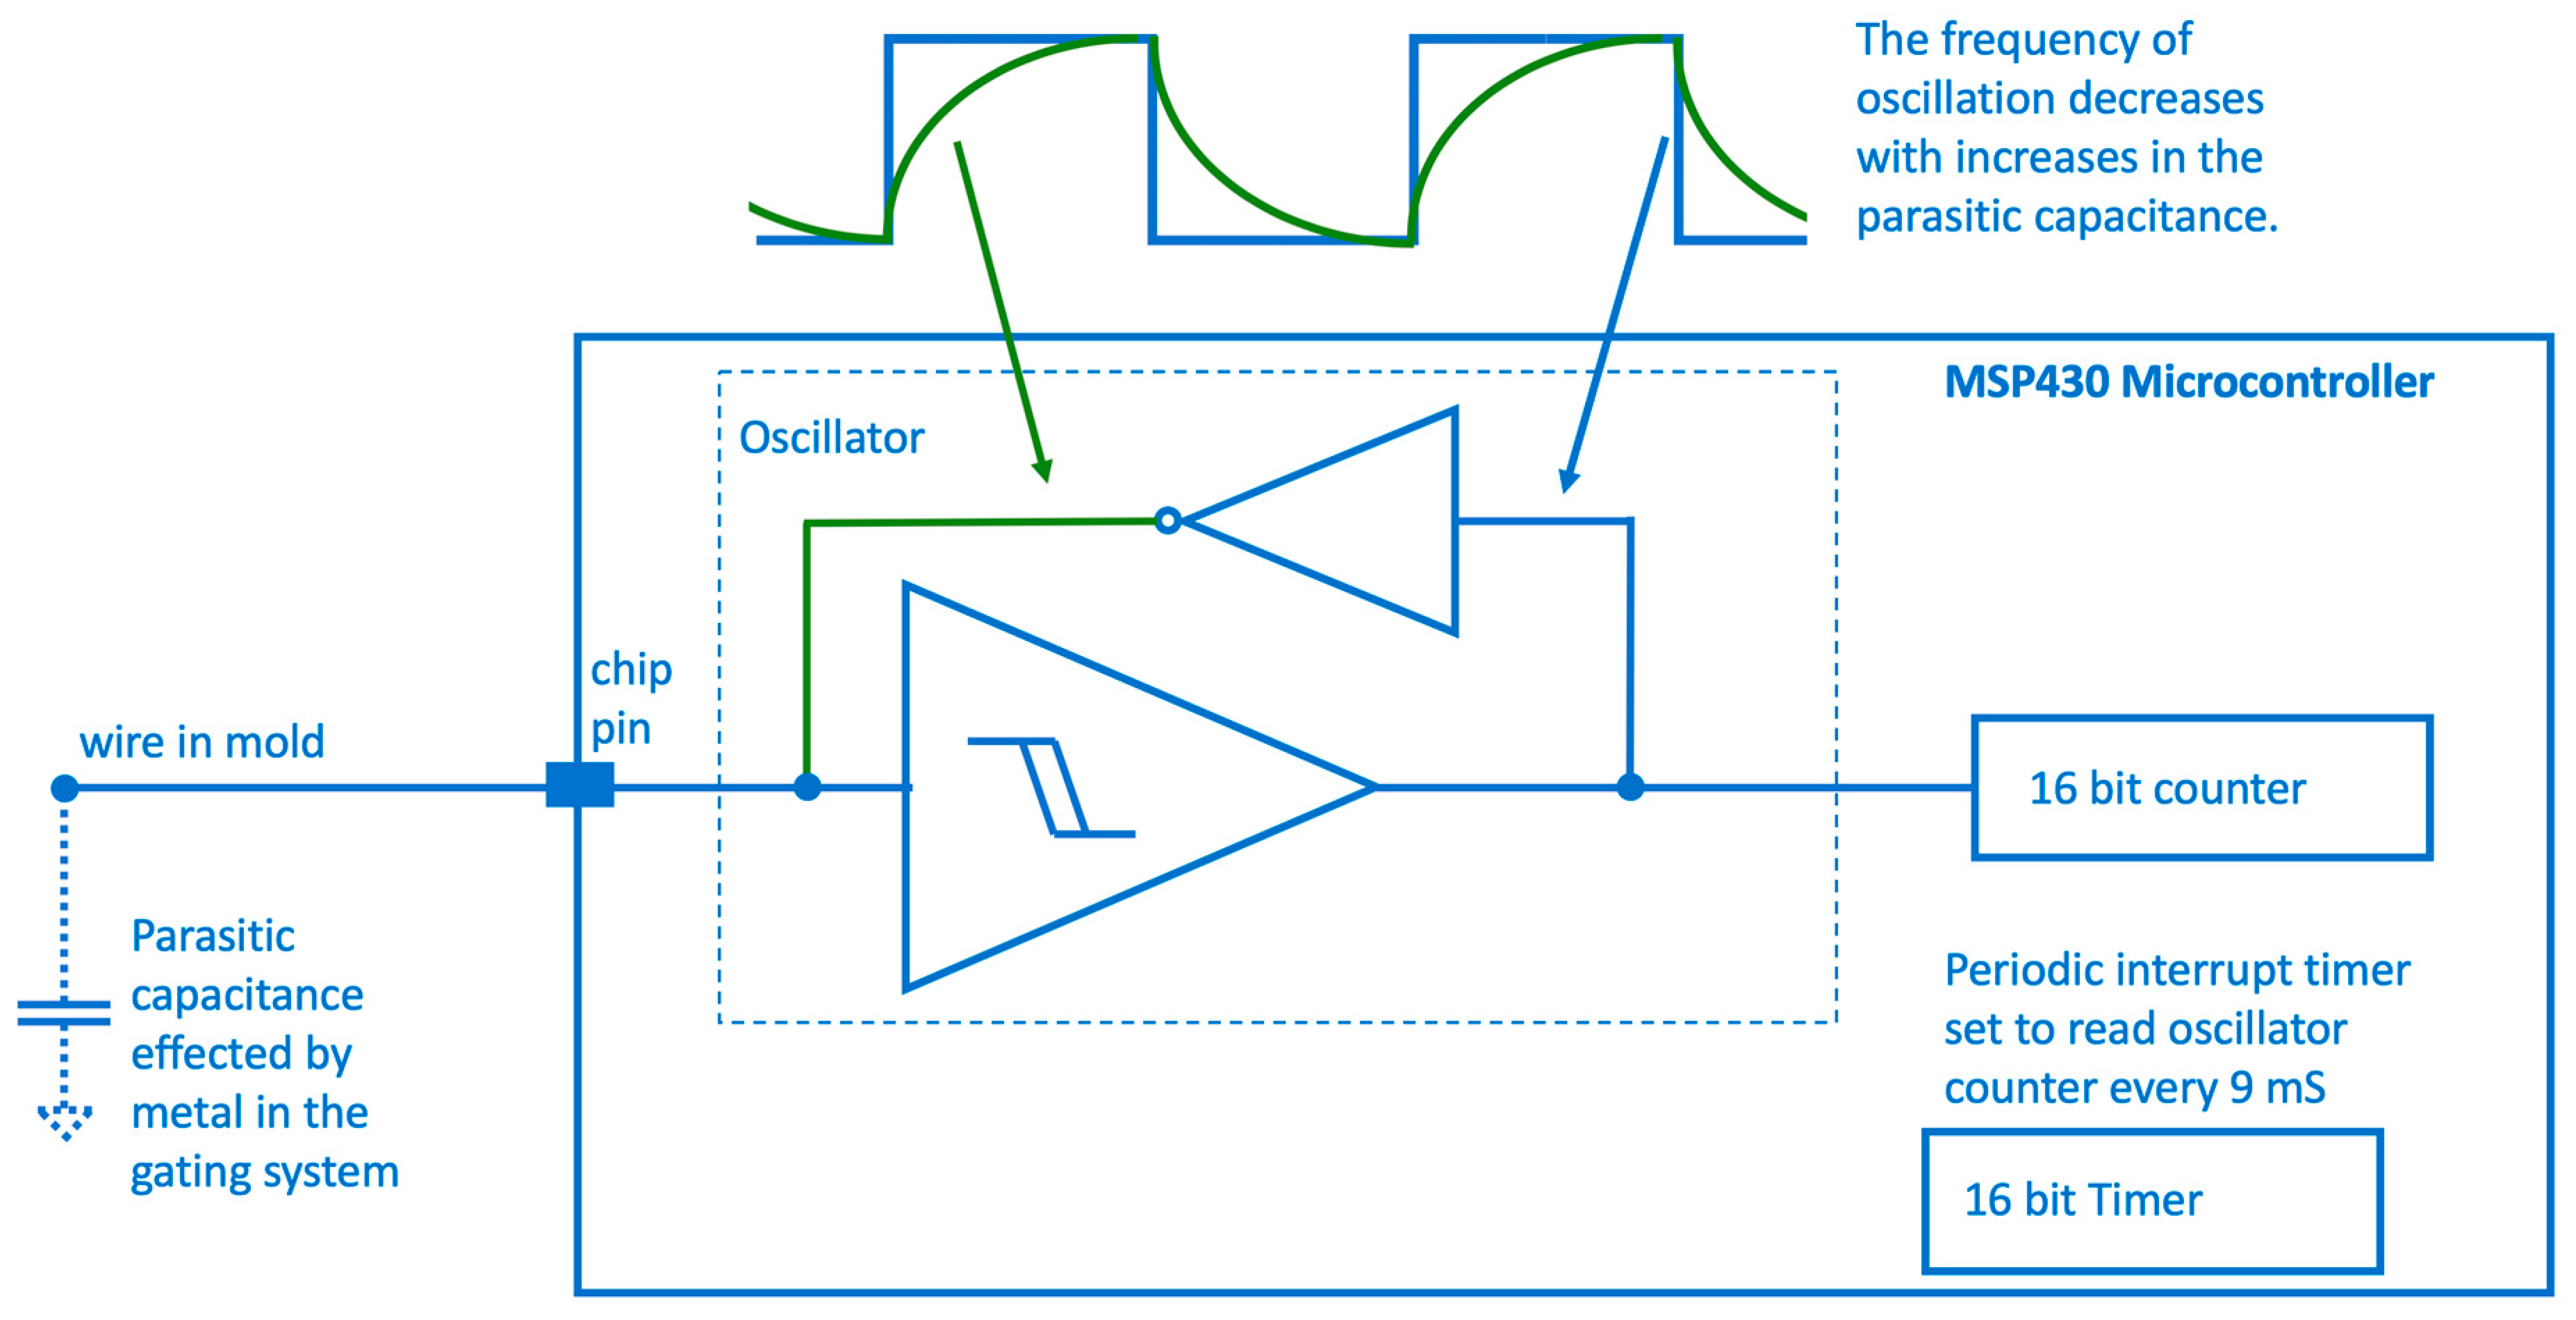
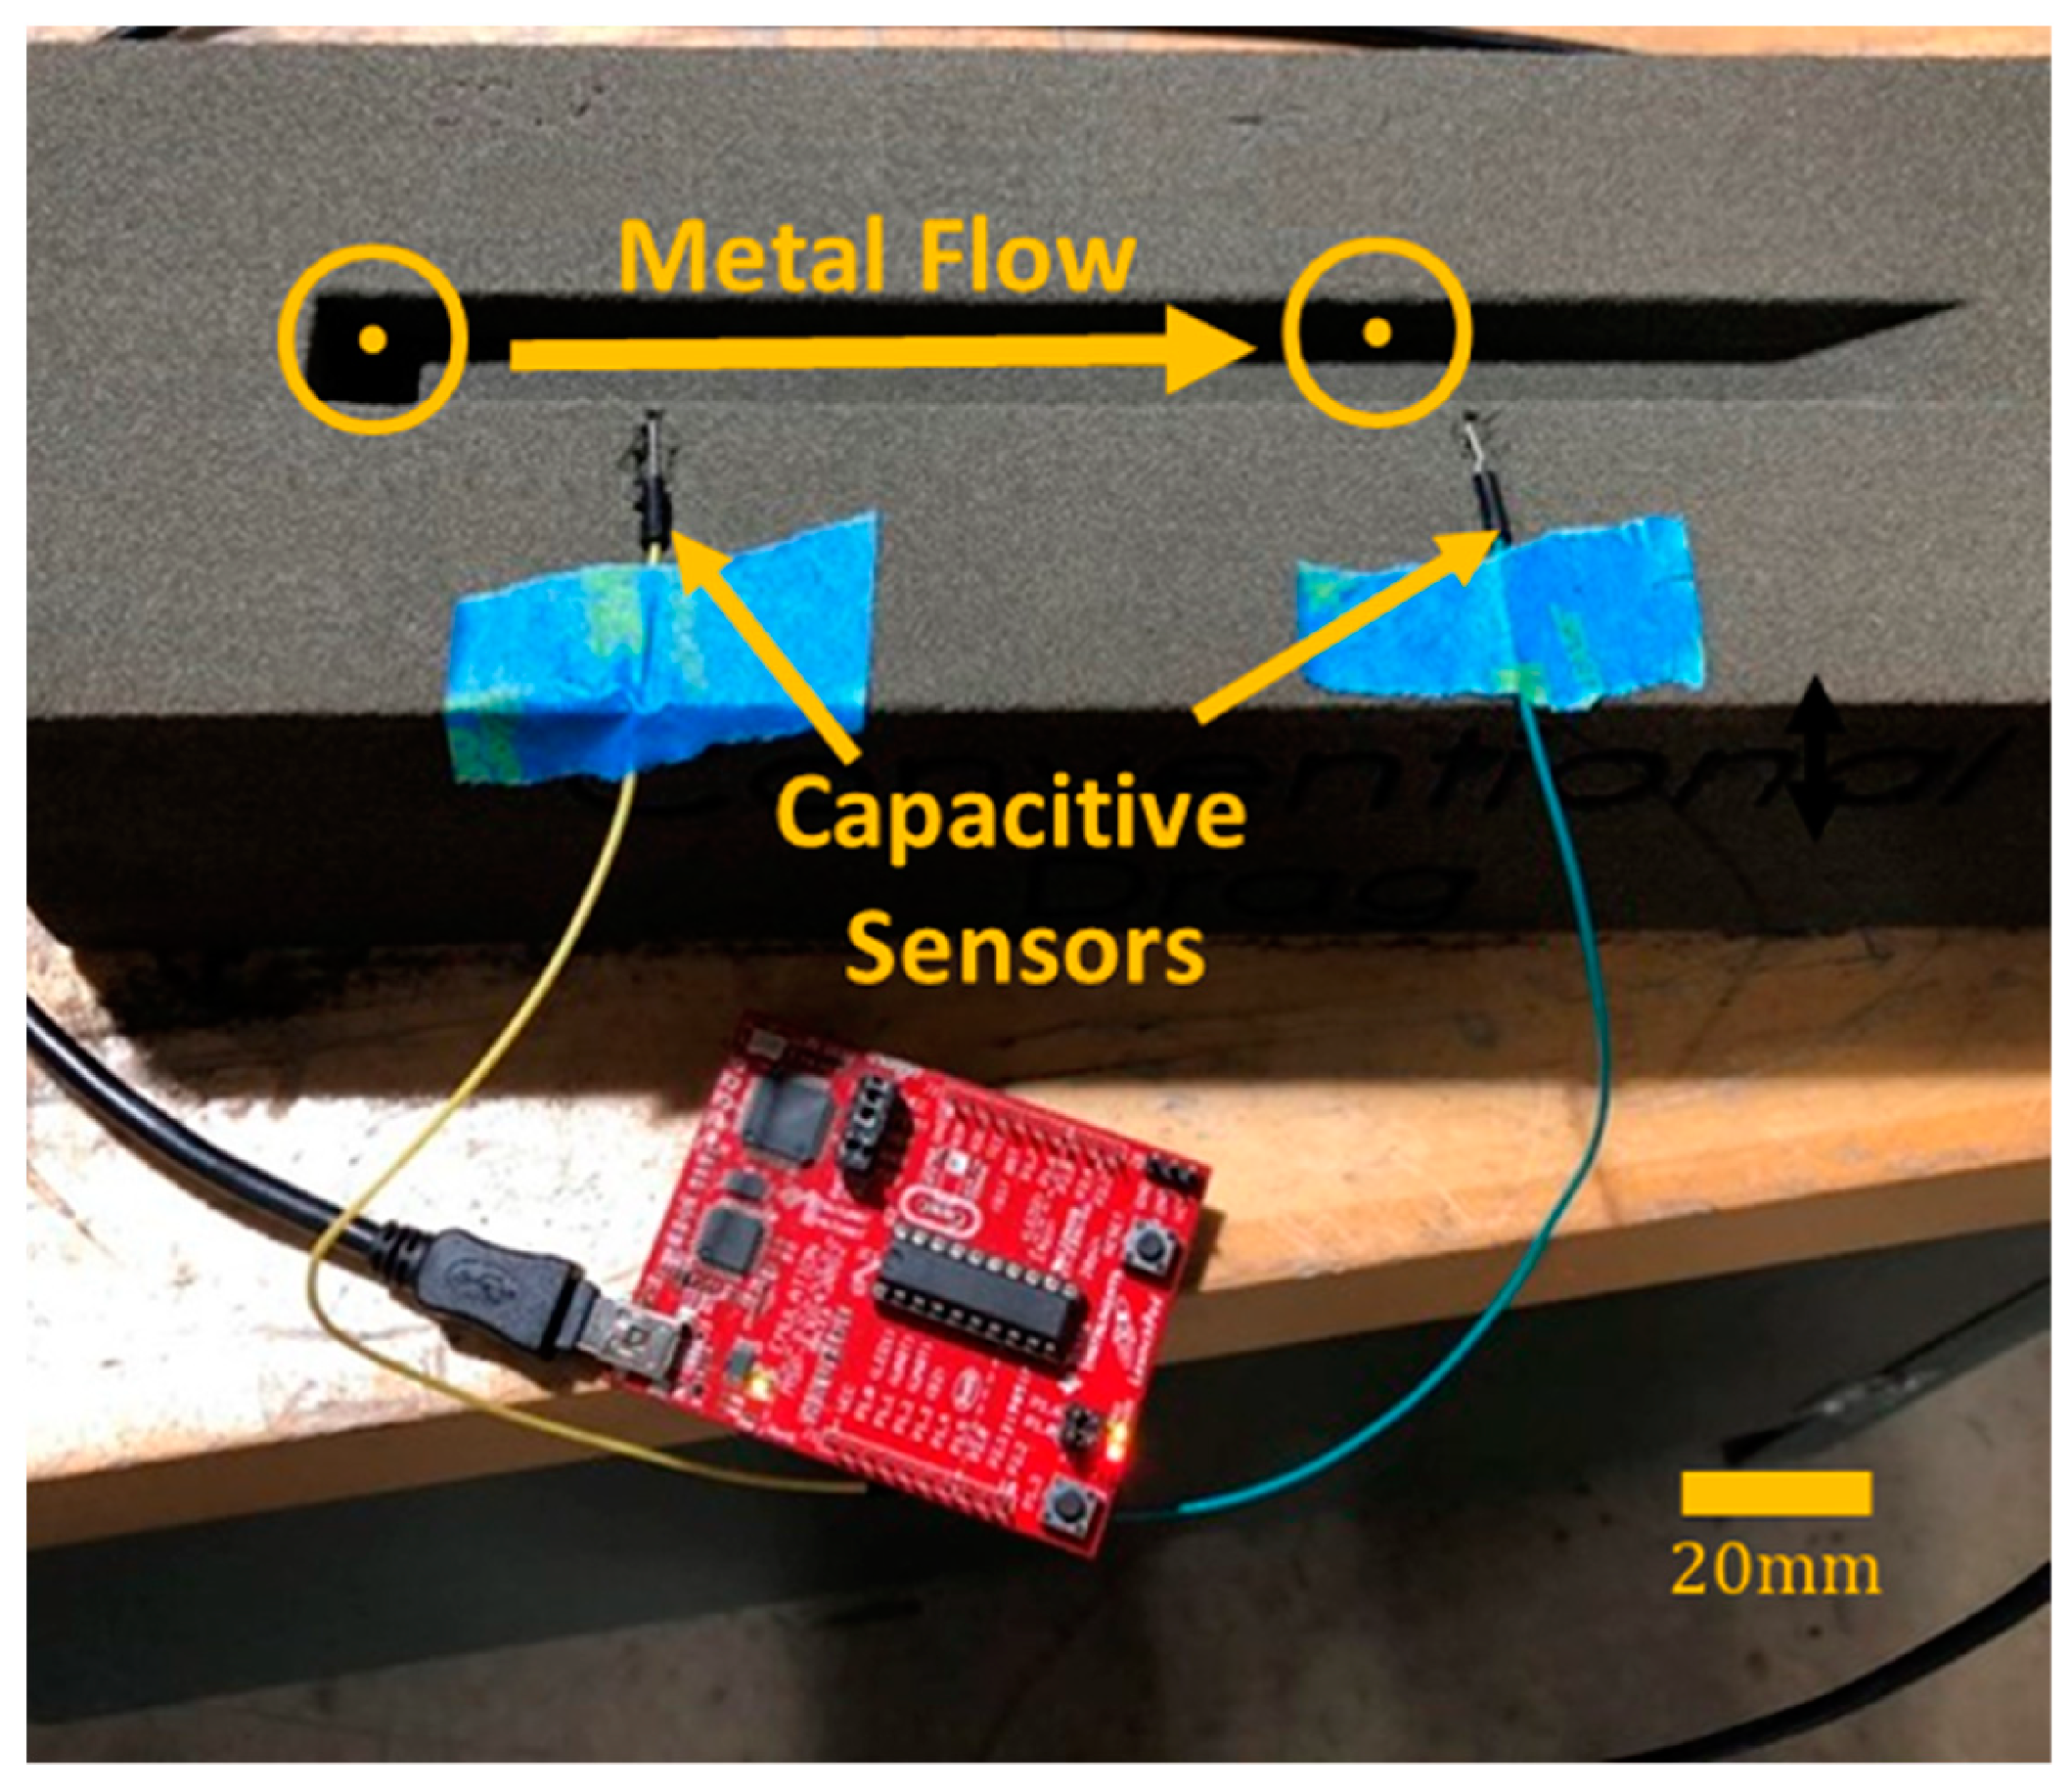
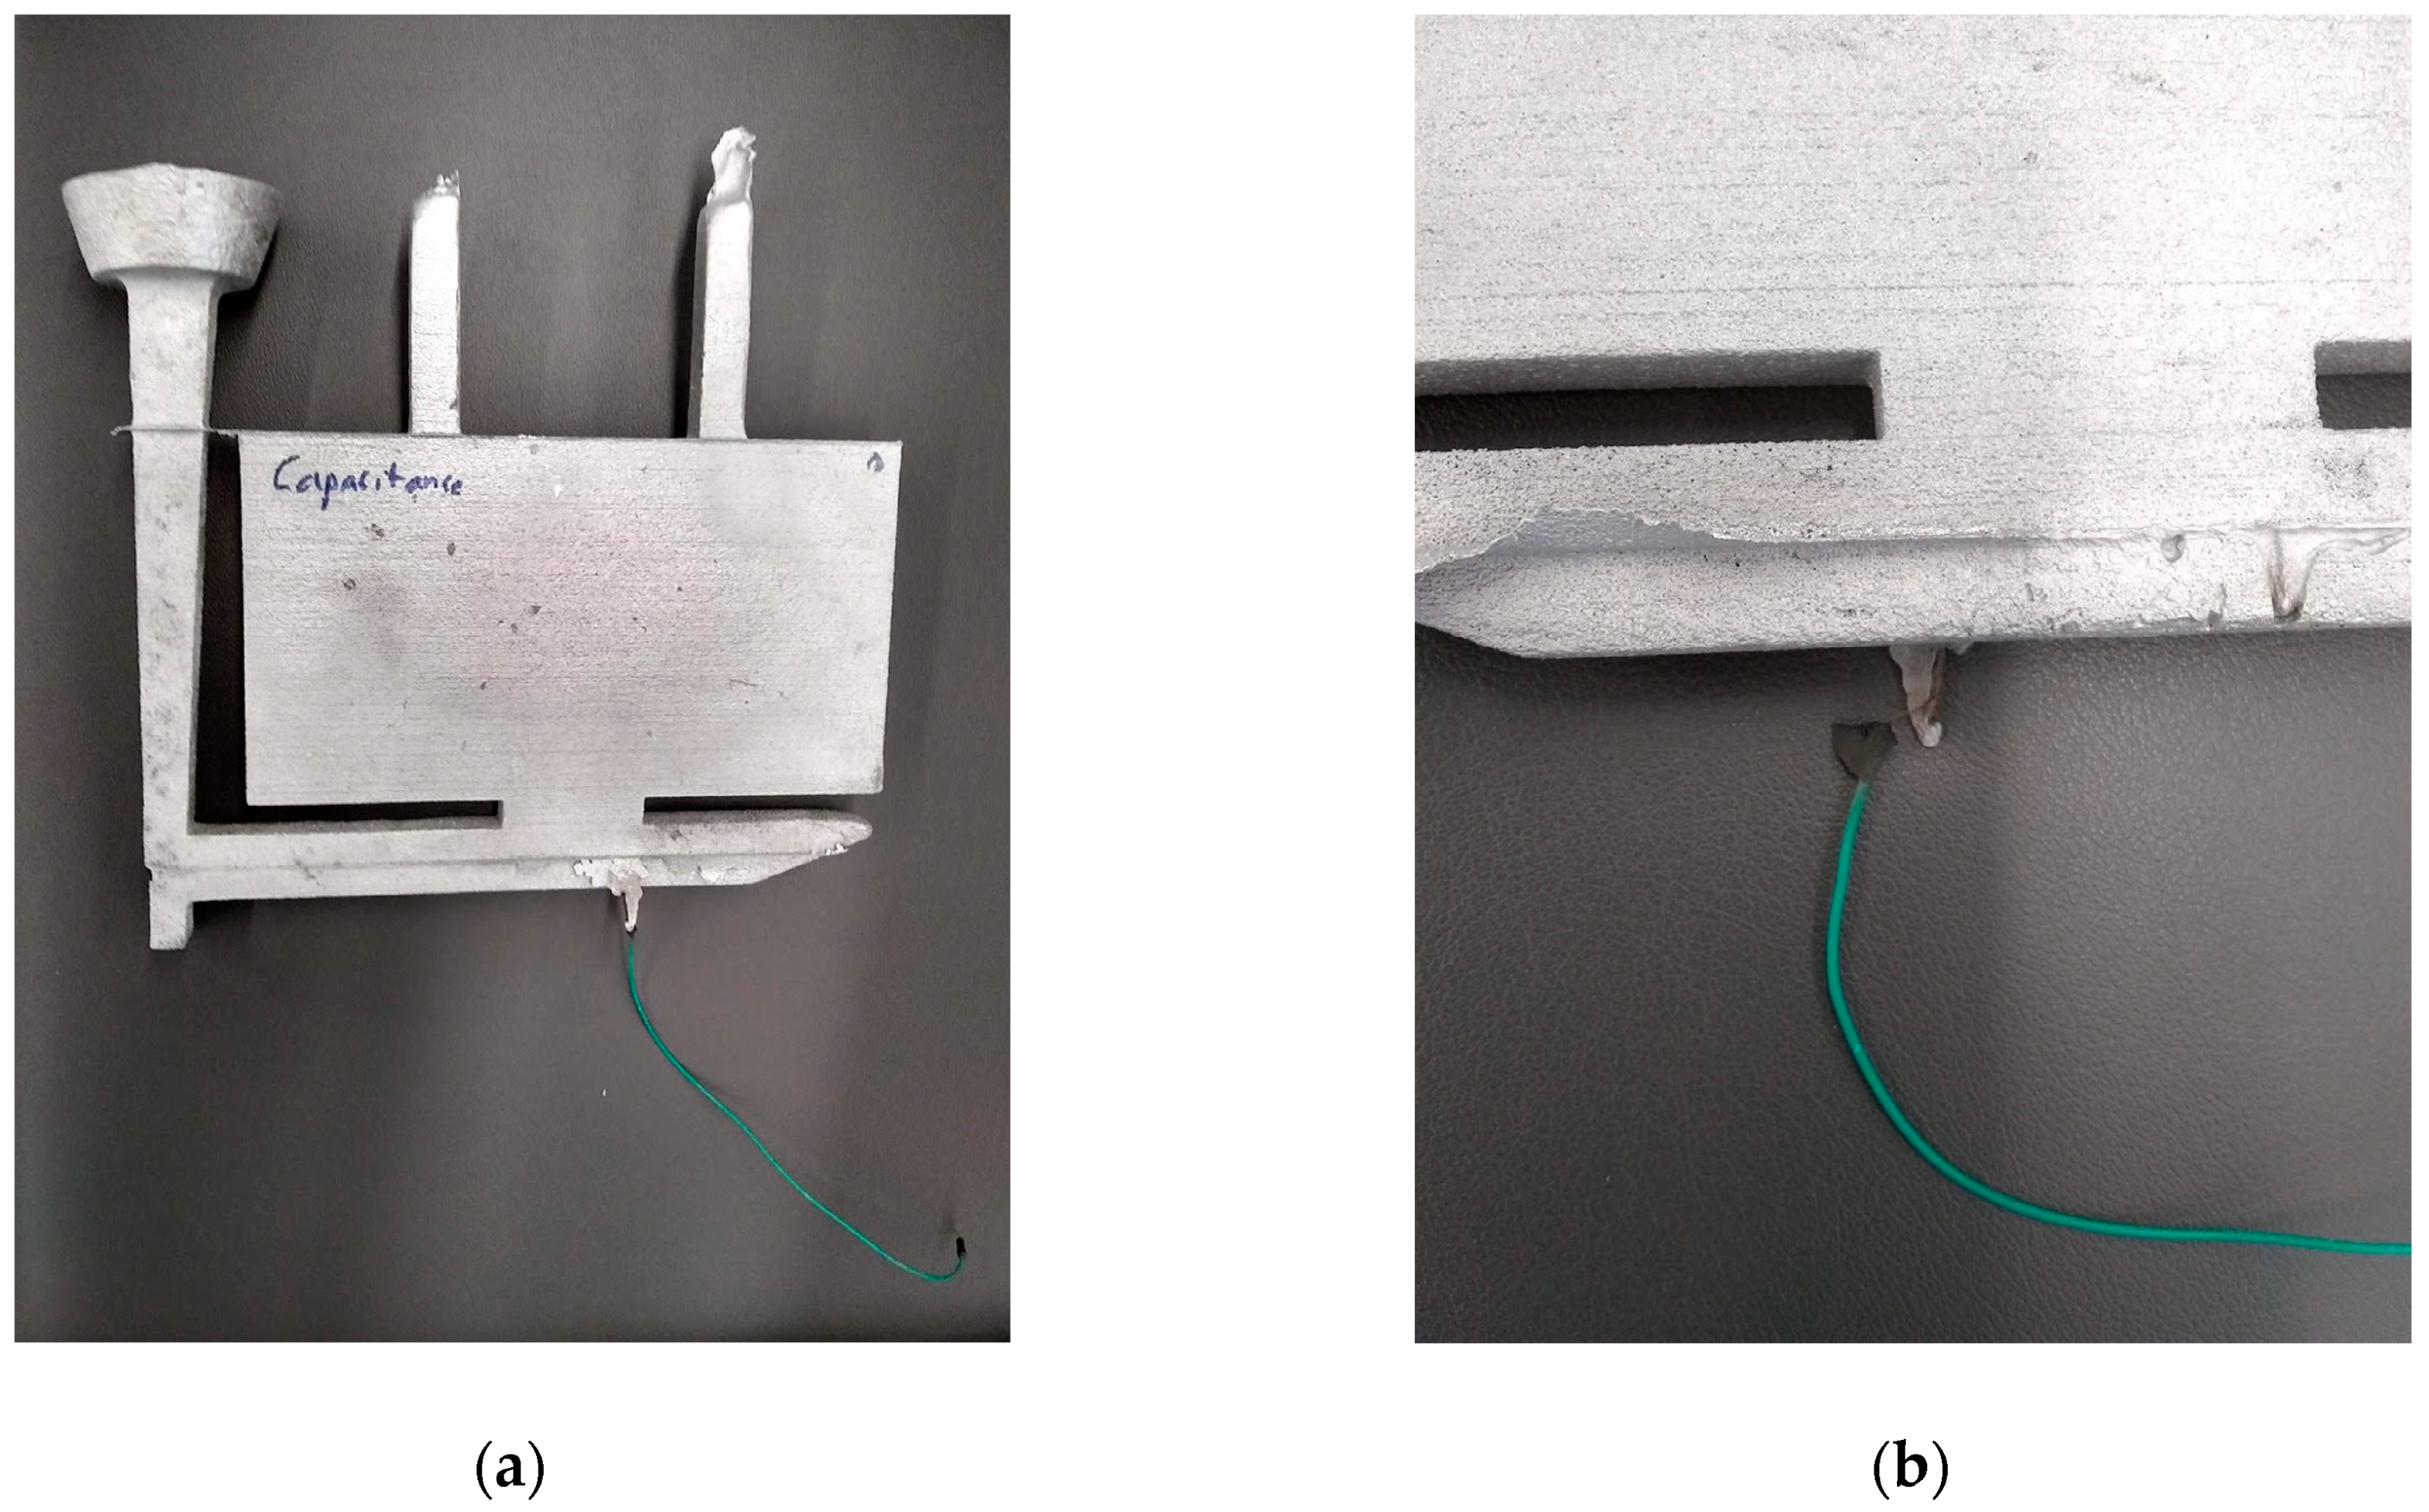
2.4. Capacitive Sensors

The electrical conductivity of high-temperature liquid metal flow changes based on capacitive sensing theory. This is the first known study to measure melt flow velocities based on capacitive sensing. An MSP430 microcontroller [56] was used to interface with the capacitive sensor. The change in capacitance was measured using a relaxation oscillator where the frequency, f, of the internal oscillator, is a function of the capacitance of the sensing element as described in Equation (4). The diagram of the circuit is shown in Figure 4, where an analog comparator (CA) provides an oscillating feedback depending on the Csensor value. The Rc is the collective resistance of the wire and the TAR (time and activity register) counts each cycle of the oscillator and records the number of oscillations counted over a regular interview (provided by a periodic interrupt from an independent timer).
f = 1 1.386 R c C s e n s o r
The capacitance of the sensor changes as a conductive liquid metal flows in close proximity which triggers a change in the internal oscillator frequency. This approach provides non-invasive, indirect, and instantaneous detection of metal flow. Average melt flow velocity is computed by locating two sensors at a known distance along a runner and by computing the time delay for the metal front to trigger external capacitance changes between the sensors (Equation (4)). In this study, the MSP430 was reprogrammed to specifically provide capacitive sensing without any external components other than a wire that must be placed in proximity to the runner for each of the two measurements. Another advantage of this approach was that the on-board comparator (CA) can be located remotely and was consequently not destroyed by the casting and could be re-used for multiple casting runs.
Two IoT sensors separated by a known distance l (m) were placed along the metal flow. Triggered deflection in the IoT data enabled measurement of the time difference t (s) in metal front travel between the sensors. The data collected was post-processed to obtain the time difference, t. The average velocity of the liquid metal along the runner could be computed from Equation (5). This article is the first known study to provide a proof of concept for this technique.
v l o c a l = Δ l s e n s o r s Δ t i m e s e n s o r s
An accurate time stamp for the recorded data could be obtained by synchronizing the sensors and using a built-in real-time interrupt in the microcontroller. Additional configurations including integration of sensors on opposite sides of the runner and around the cross-sectional plane of the runner would enable spatial velocity measurements.
Two capacitive filament sensors separated by 102 mm were submerged in the mold adjacent to the runner as shown in Figure 5. The 3D-printed sand molds were poured with 319 aluminum alloy at 750 °C. It was observed that the tip of the wire sensor should be placed as close to the metal flow channel as possible without encroaching the mold wall. The sensitivity of the sensor is inversely proportional the square of the distance and, hence, the distance between the filament tip and cavity should be minimial. The configuration was uniform for both SSC and CHSC configurations. This technique used wired transmission of the collected data for convenience in this experiment without compromising access to the measurement. However, the sensors can be easily modified by including miniaturized radios and coin-cell batteries if required for access to remote sections of a mold and will be a subject of future research.

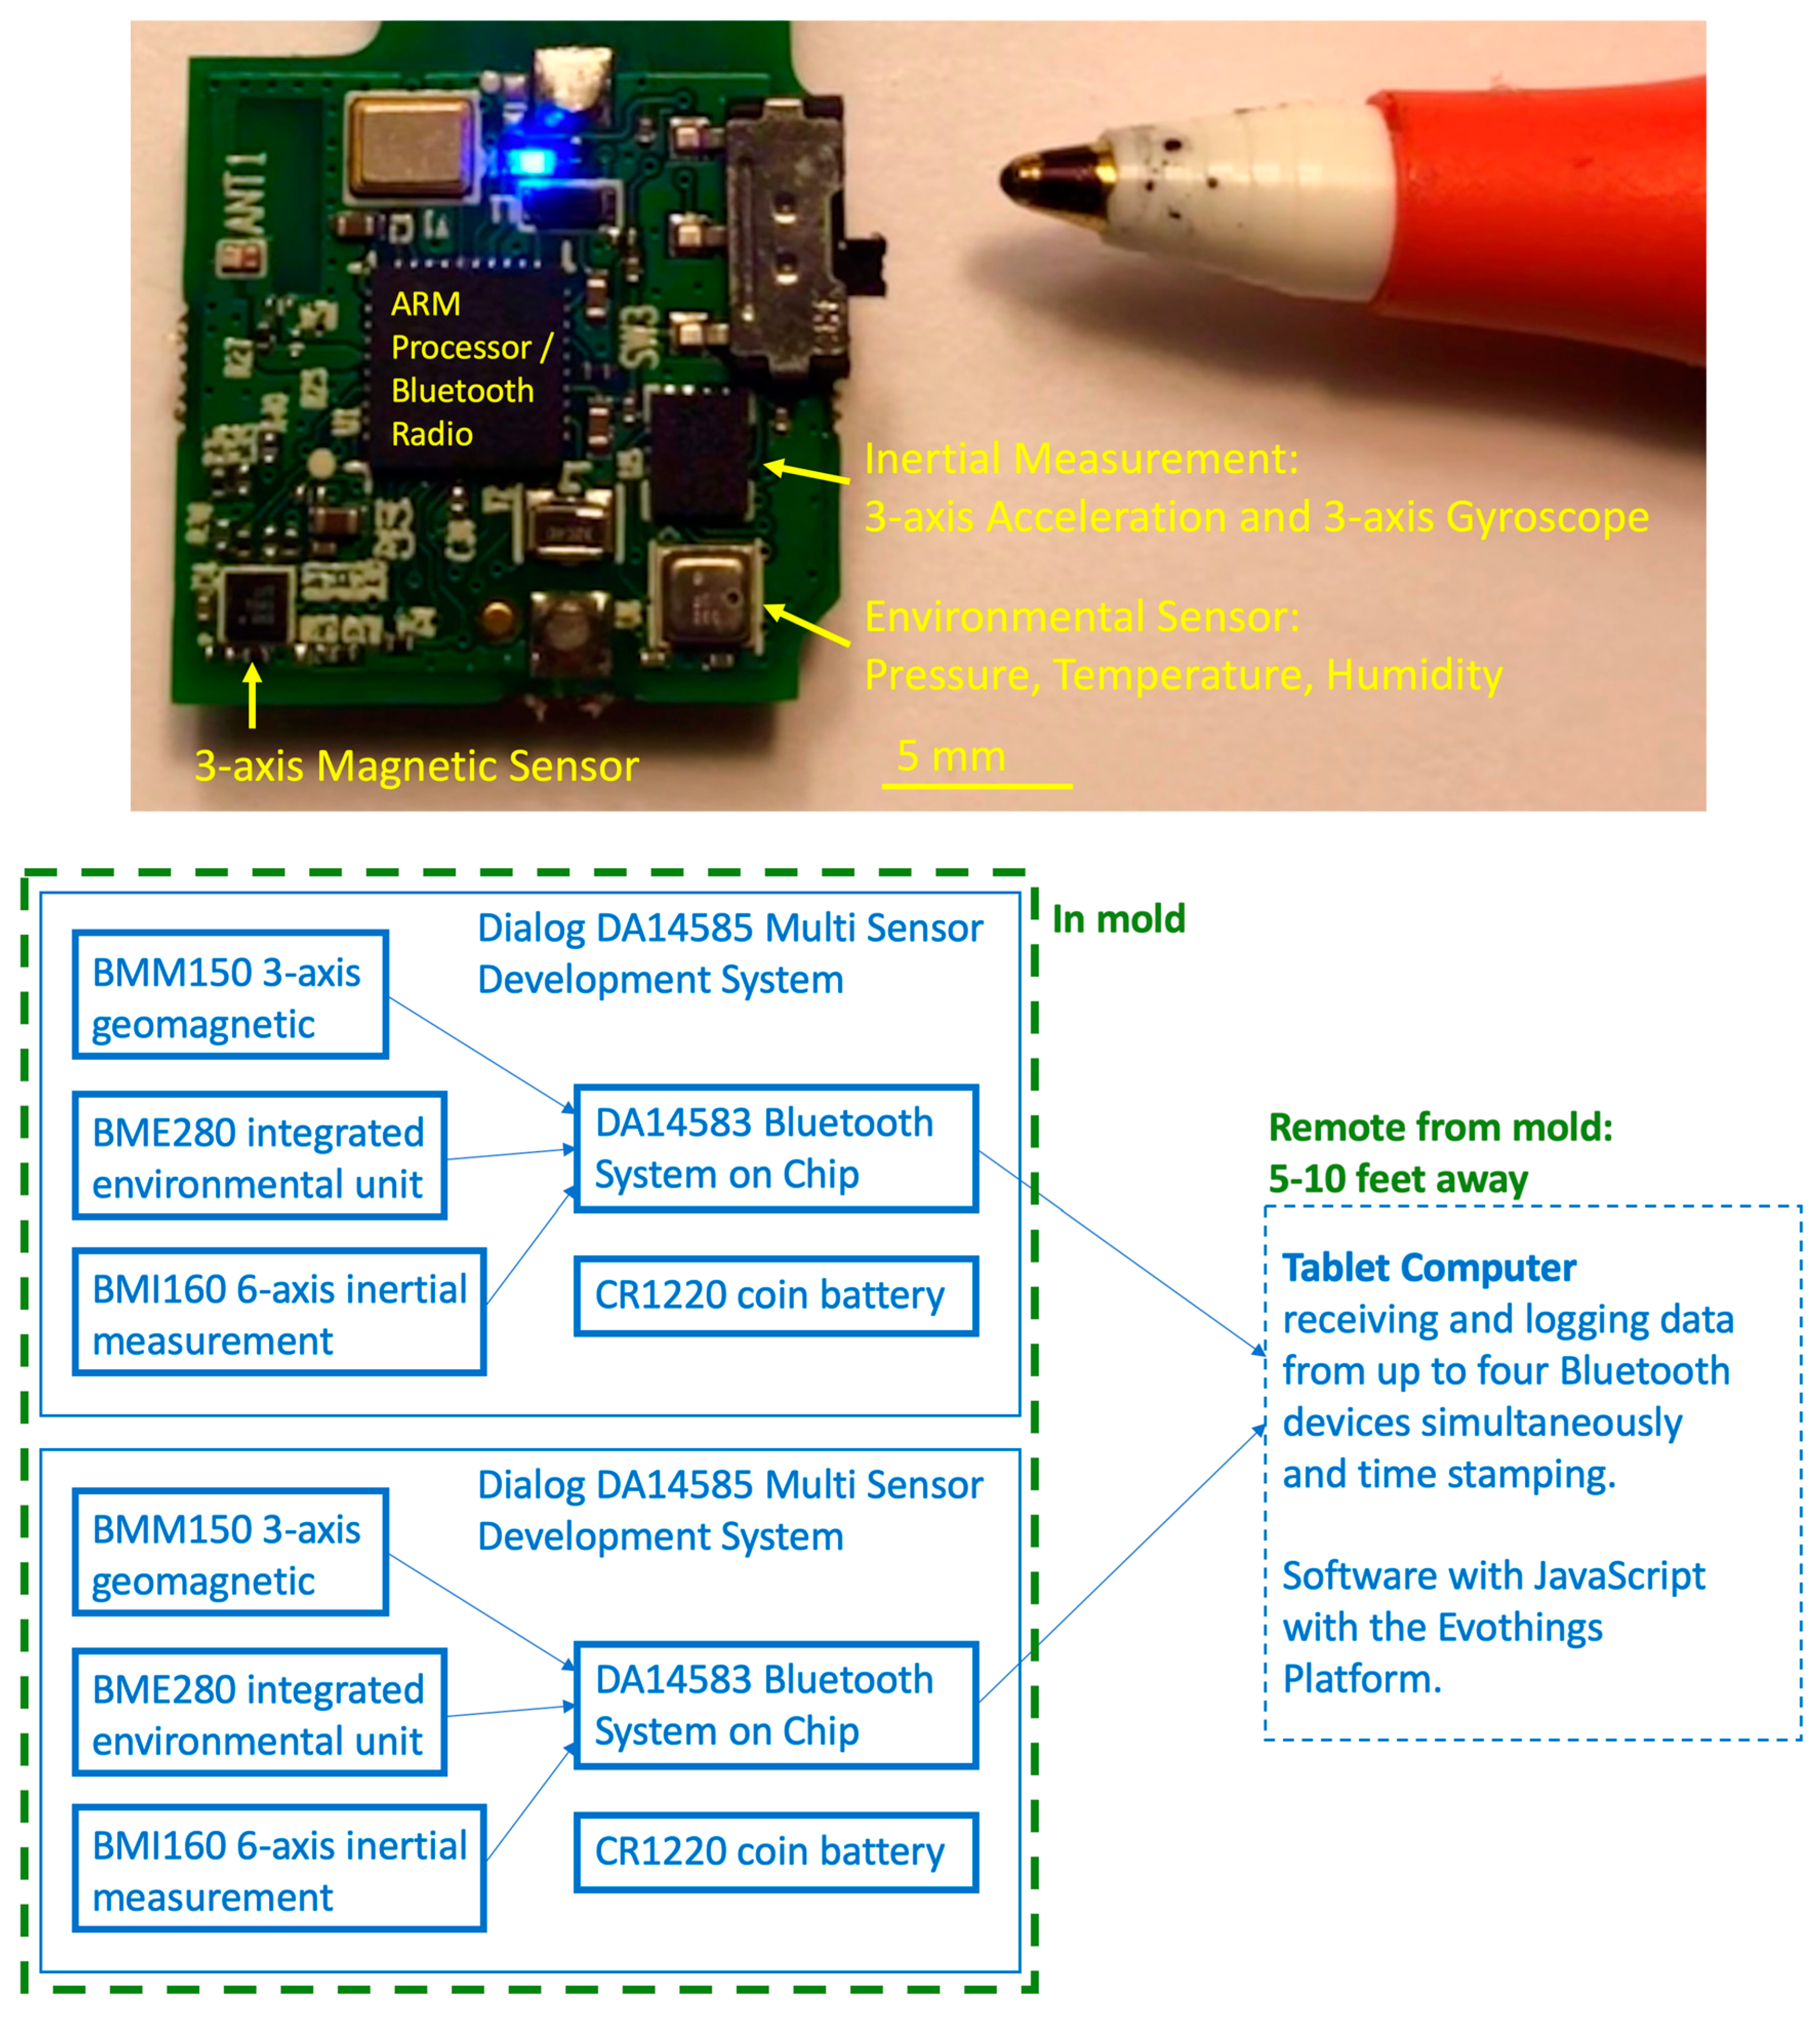
2.5. Magnetic Flux Sensors

The fundamental hypothesis postulated in this study is that liquid metals generate electromagnetic fields without any application of external electromagnetic fields. However, their magnetic field strength is typically extremely weak. Authors propose the utilization of the highly sensitive magnetic flux measuring capability of the Dialog IoT sensors to capture the weak magnetic field. Any deflection in the magnetic flux data as the liquid metal flows across the sensors will be recorded. As described in Section 1.5, the Dialog IoT sensors have a diverse range of sensing capabilities. The variety of data collected from all the sensing medium can be wirelessly transmitted through Bluetooth—i.e., sequentially, in series limiting the resolution of individual data sets. The sensor kit in this study used a BMM150 geomagnetic field sensor that provided magnetic flux in three axes according to an Earth-centered, Earth-fixed coordinate system. BMM150 operates in temperatures below 850 °C and could measure magnetic flux as high as 1300 μT with a resolution of 0.3 μT. The average frequency of the transmitted magnetic flux data was 10 Hz. Figure 6 shows the electronic components of Dialog IoT sensor and basic building blocks of the magnetic sensor [57] used in this study.
Two DA14583 Dialog IoT sensors [37] were separated by 102 mm along the runner and were located 12.7 mm (0.5”) from the runner and ingate as shown in Figure 7a. Figure 7b demonstrates the process of embedding sensors into the pre-defined slots introduced into the 3D-printed sand mold. A software application for an iPad tablet was developed to synchronously collect all sensor data through the Bluetooth protocol with a single time reference.
Aluminum 319 alloy was melted using an induction furnace and poured into the 3D-printed molds at 750 °C. The induction furnace was switched off during the pouring operation as it was observed by authors in previous casting trials that it affects magnetic field data collected by the magnetometer. If the sensors are not synchronized, just a few seconds before pouring, the molds with Dialog DA14585 IoT sensors need to be gently tapped to synchronize both sensors through time-accelerometer data as the accelerometer will capture movement of the mold. This tapping prior to pouring will be captured in a video to know the instant at which the molds are tapped. The time difference between the pouring moment and the tapping moment captured from the video will be compared against the magnetometer and accelerometer data to further reinforce the sensor validation.

3. Results

3.1. Results—Capacitive Sensors

Figure 8a shows oscillator frequency captured by the capacitive sensors while filling the CHSC. The pouring event is highlighted in Figure 8a and the delay observed between both frequency plots is highlighted in Figure 8b. This represents the time of metal travel from the first sensor to the second. In CHSC, the time delay can be obtained from Figure 8b as 211 ms. For a 102 mm distance between the sensors, this time difference will correspond to an average velocity of 0.48 m/s (±0.04) in CHSC. The velocity measured experimentally has an error of less than 2% compared to the 0.49 m/s expected from computational simulation for CHSC.
Similarly, Figure 9a,b show oscillator frequency captured by the capacitive sensors while filling SSC had a time delay of 80 ms (2.211–2.289 s). As the sampling rate in both cases was 1/90th or 11 ms per measurement, the percentage error was potentially higher in SSC, as due to higher melt flow velocity faster metal has a smaller absolute value. For the largest time difference obtained experimentally, the average velocity for 102 mm separation can be calculated as 1.275 m/s. The largest velocity error measured experimentally was 5% when compared to the computational simulation for SSC (1.34 m/s).
During mold filling, the aluminum metal had a miniscule flash as shown in Figure 10 at the drag-cheek parting surface triggering an asymptote-like valley that almost has an order of magnitude less oscillator cycles observed after the pouring event. As the molten metal contacted the probe, the capacitance of the probe increased dramatically and instantaneously. Since this flashing occurred after the metal had passed the sensors, the average speed calculation was still valid.

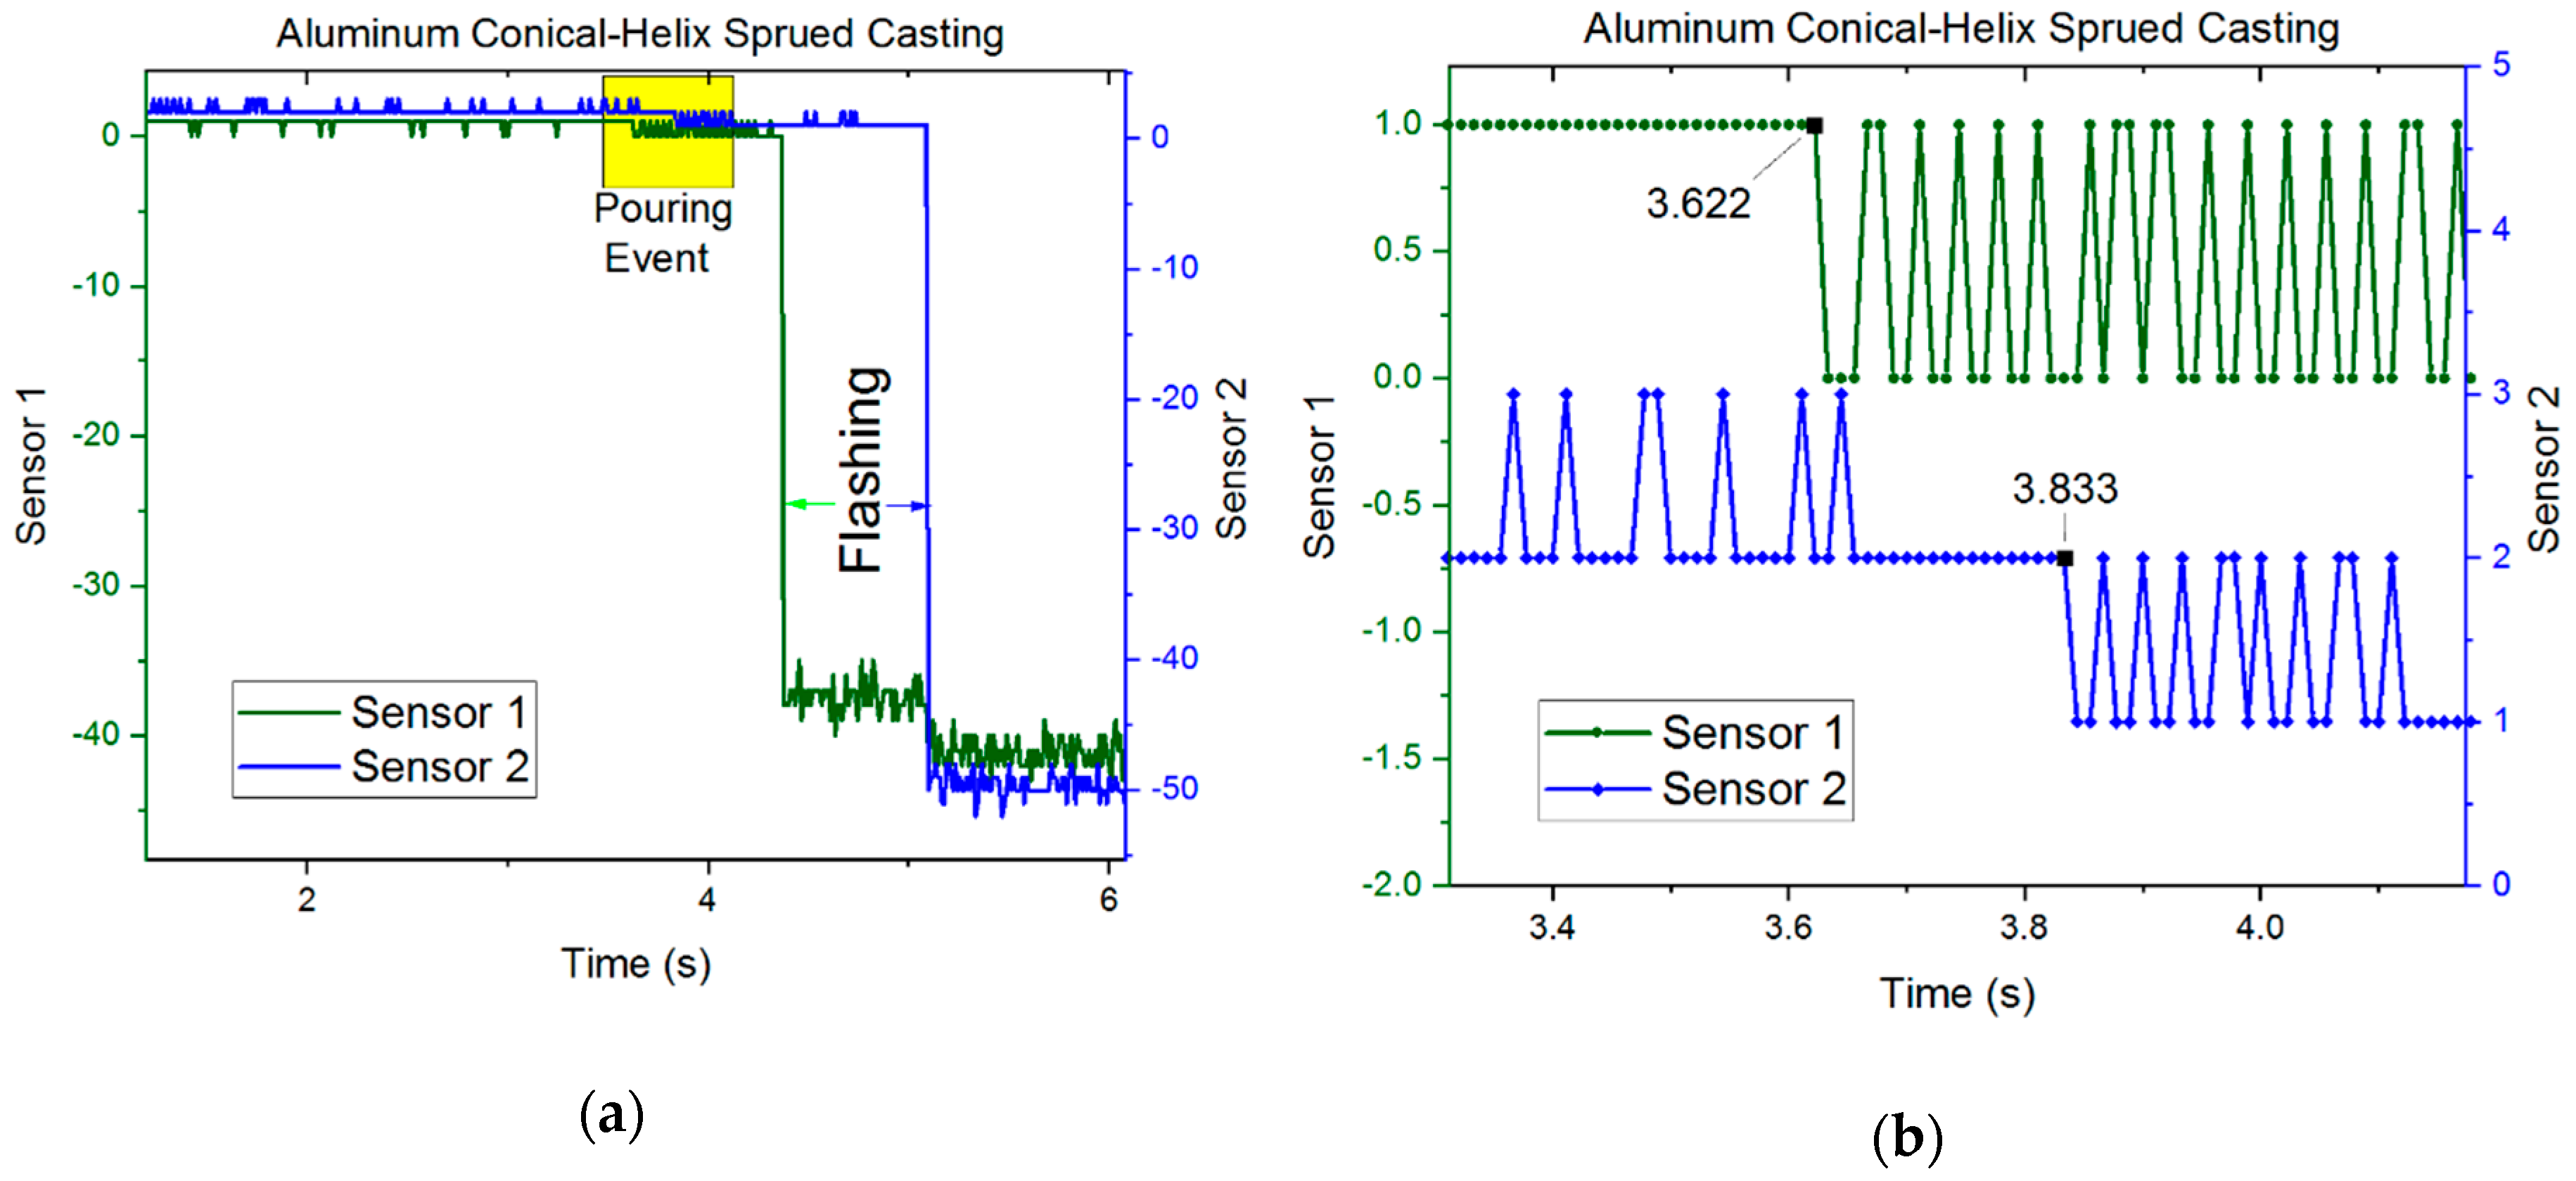
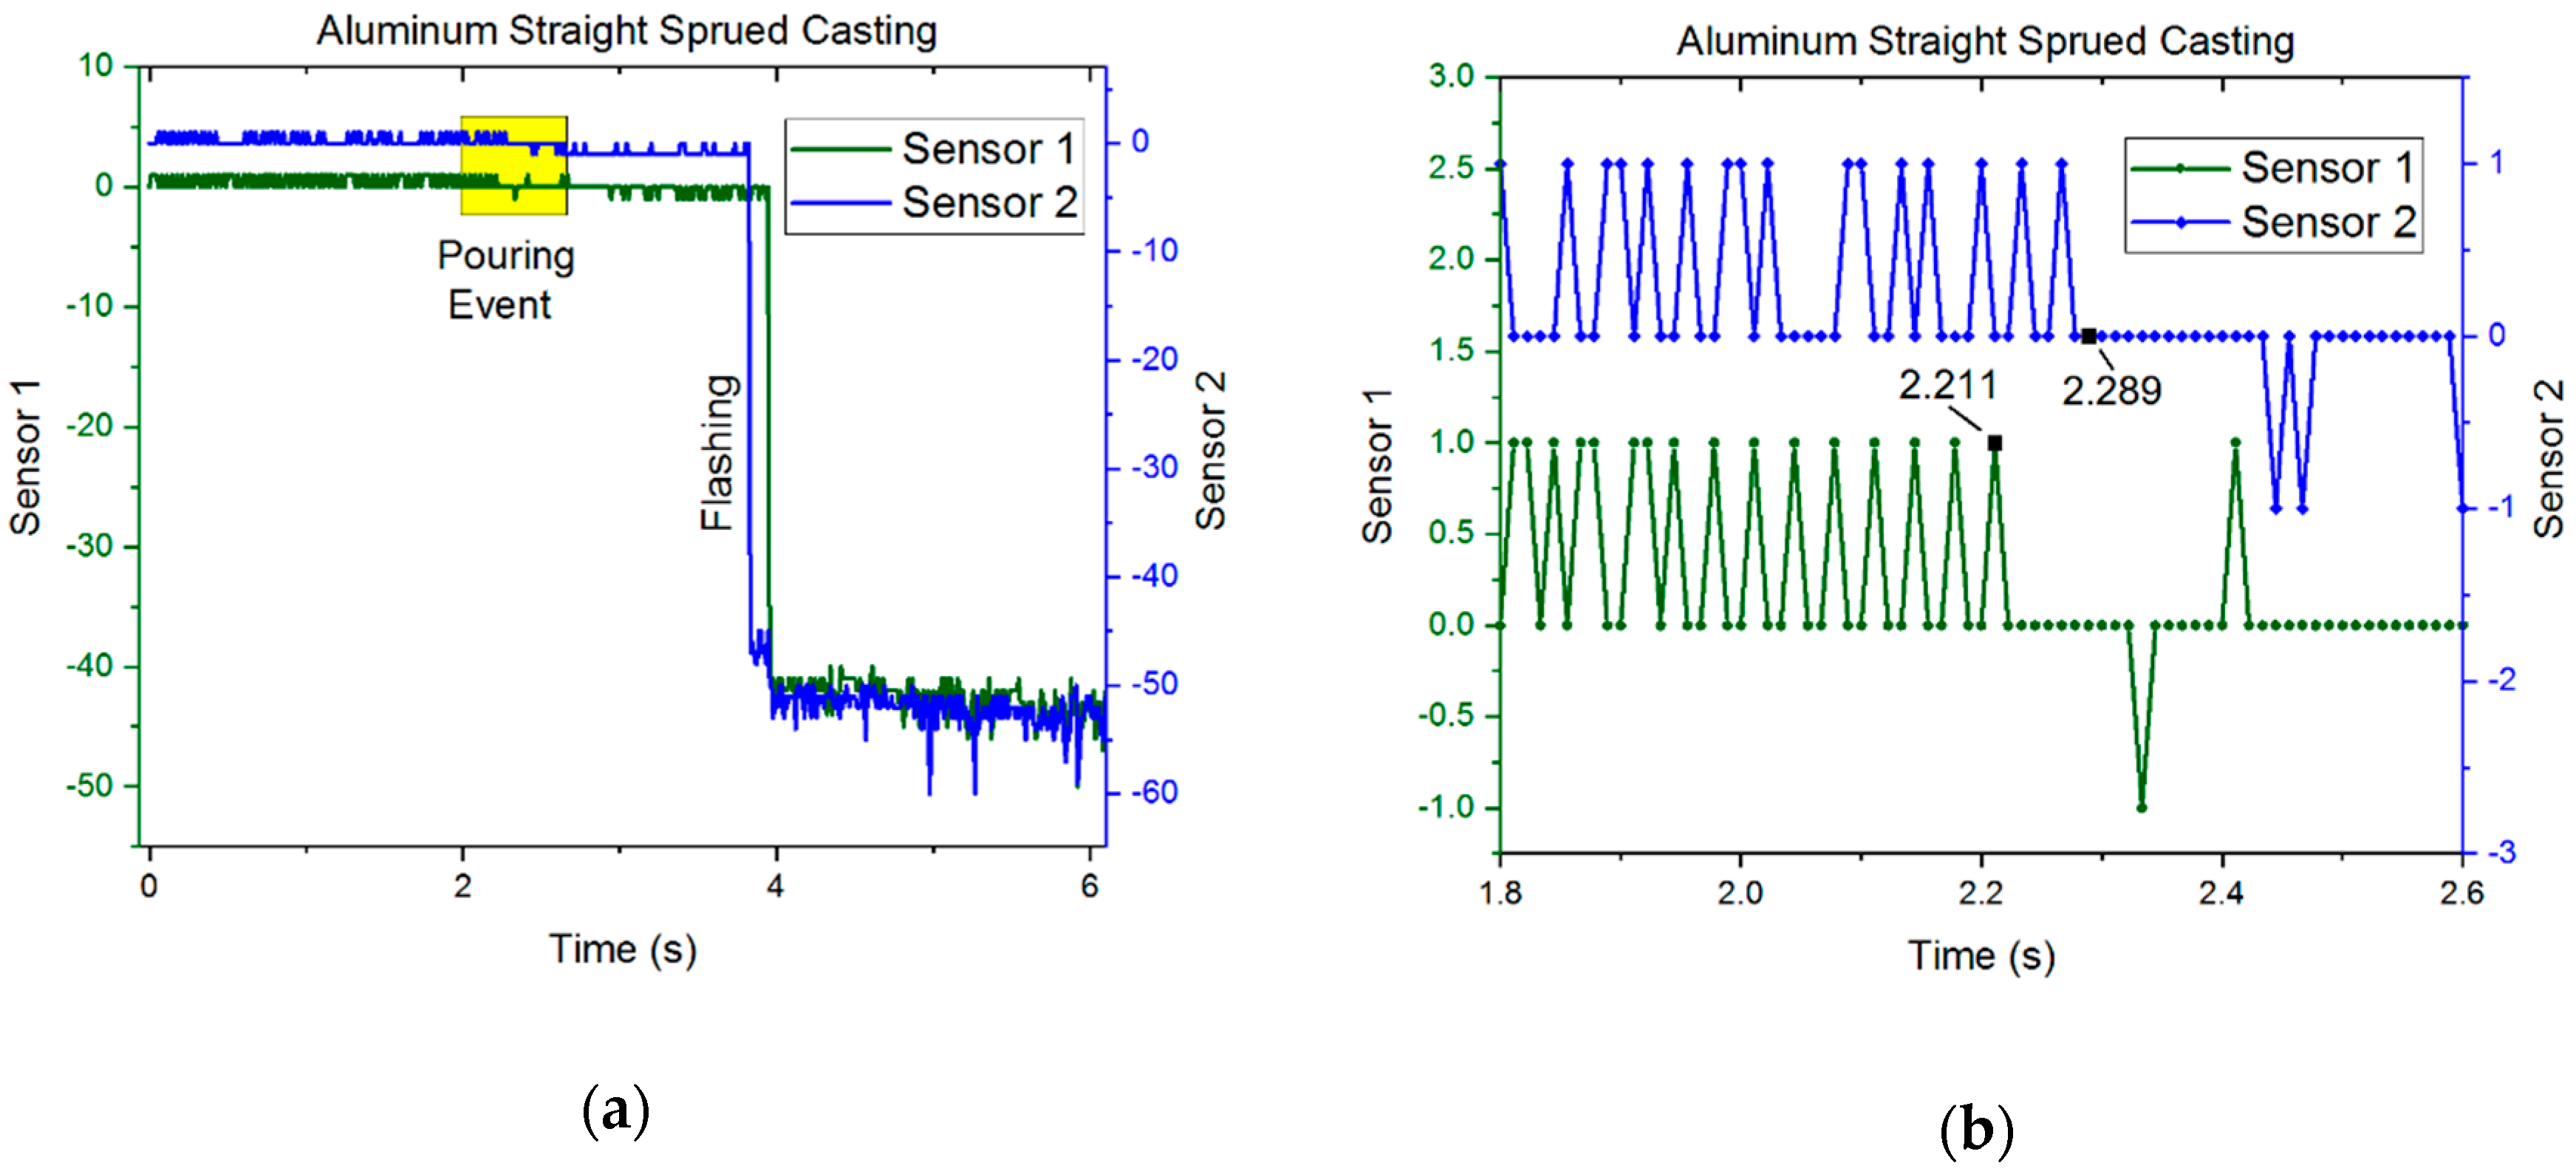
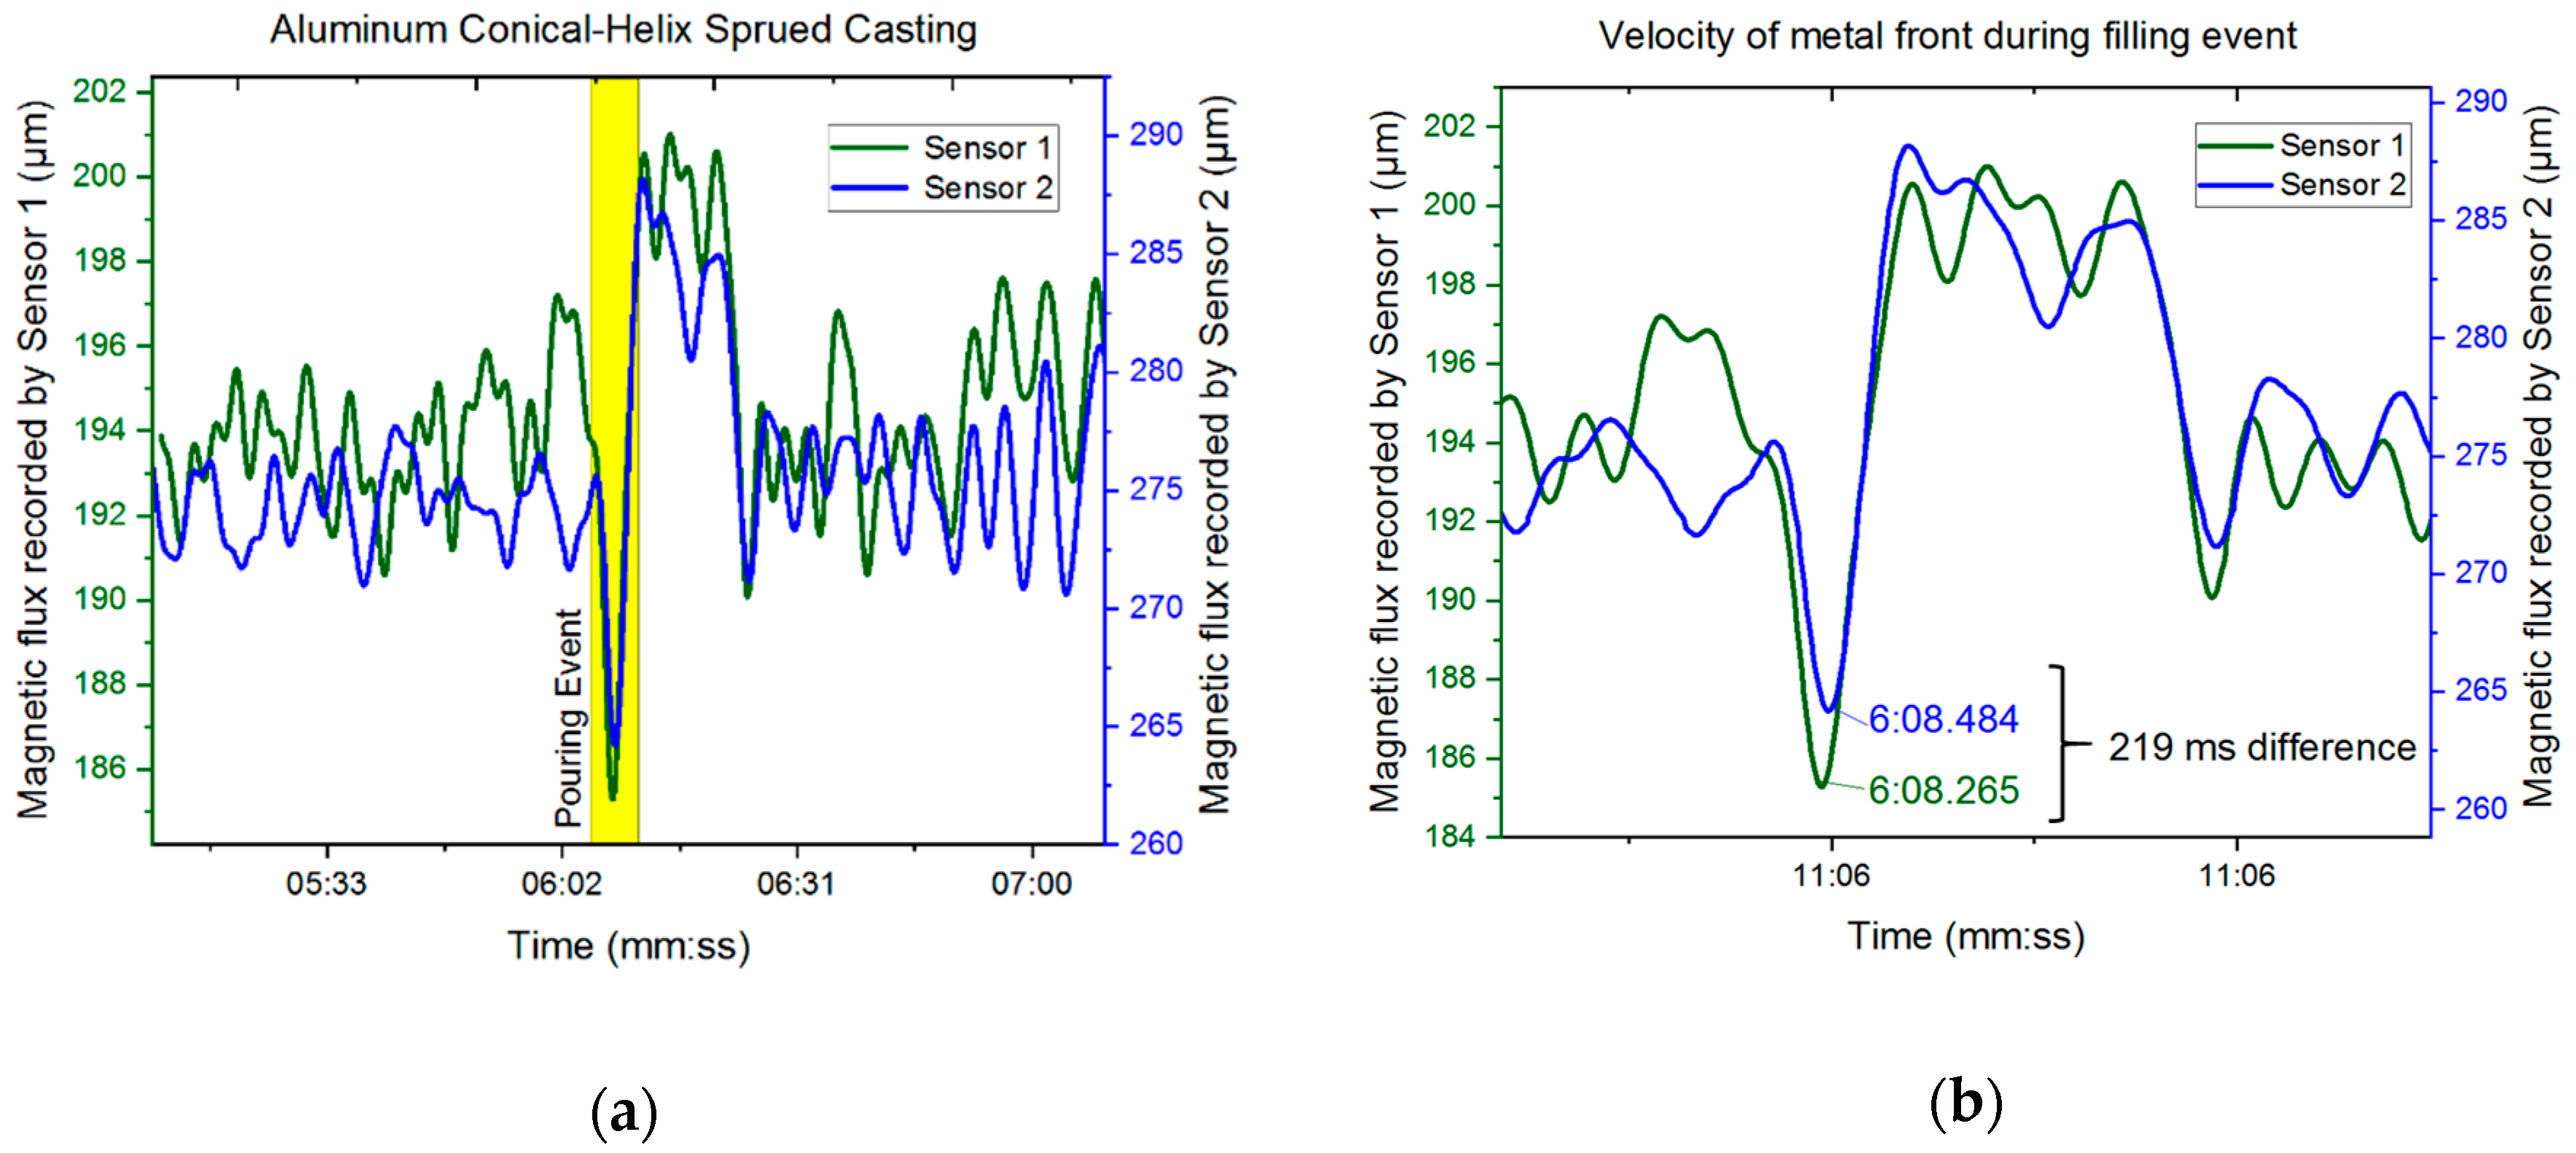
3.2. Results—Magnetic Flux Sensors

Figure 11a shows the overall magnetic flux magnitude in CHSC for the overall duration of the casting process. It can be observed that both sensors 1 and 2 exhibited change in magnetic flux during metal filling. Figure 11b shows a magnified version of the pouring event along with the information of the characteristic time at which sensors demonstrated local peaks in the recorded magnetic flux data. The driving hypothesis is that the two peaks in the two magnetometers correspond to the respective instant at which the metal first passes by each. This can also be corroborated by the fact that the peak in the second sensor occurs only after the first sensor. The difference in time between the two peaks was calculated to be 219 ms which corresponds to an average velocity of 0.47 m/s, which is an error of 4% when compared to the computational simulations. This difference could be attributed to a sampling rate of 15 ms in each sensor.

4. Discussions

As aluminum, iron, and steel account for 95% of casting production, validating the magnetic flux sensing for a wide range of alloys is critical. Figure 11a,b shows magnetic flux recorded by sensors during the casting process for straight sprued Class 30 gray cast iron alloy and conical-helix sprued 17-4PH stainless steel alloy respectively. In Figure 11, time (t = 0) is referenced from tapping the molds to record time stamps through accelerometer measurements. It can be observed in both alloys that a distinctive change in magnetic flux occurred whenever the liquid metal was brought closer to the mold in the crucible. The larger metal volume of the ladle (over 1133 kg (2500 lbs)) while pouring impaired the measurement of the magnetic flux as the flux generated by the relatively smaller liquid metal in the runner was weaker. However, the hypothesis that metals when melted generate magnetic flux without any external application of electromagnetic fields is validated from Figure 12.
The BLE protocol is capable of a sampling rate of 7.5 mS, which would reduce the error significantly by 50%. However, the magnetometer sensor was the limiting element in sampling and not the communication channel. Magnetometers are improving in performance continually as rther radio protocols are much faster and with lower latency, such as standard computer networking like Wi-Fi - specified by various IEEE 802.11 standards, but require much more power and energy for a given period. The potential for conveniently installing these sensors for days before a casting would likely not be possible with Wi-Fi operation powered by a coin-cell battery. The trade-off between power and temporal resolution will be the subject of future work. Ideally, sensors could be inserted in cavities during 3D sand-printing to avoid locating them at parting lines which can result in flashing and immediately destroy the sensor. The sensors in such cases would have to operate from the completion of printing until the casting, which in some cases may be impractical—days or weeks or even months between printing and casting. An additional focus of future work is the lower magnitude of change in magnetic field, which the authors intend to improve by reducing the distance between the sensor and the runner. Additional preliminary experimentation of capacitive sensors is provided in Appendix A.
An additional challenge is that the sensors are sensitive to environmental magnetic fields. As an example, the induction furnace as well as larger ladles used to pour metal into the molds create a lot of magnetic noise. The peak-to-valley difference in magnetic strength when metal passes across the runner is around 70 μT for aluminum alloys. If the noise from the surrounding environment is of similar or higher magnitude, the sensors cannot reliably measure velocity. Future work will aim to understand the variation in strength of the magnetic field detected by the sensors as a function of distance from the flow cavity. The authors also aim to study the effect of continual liquid metal velocity on the magnetic field for enhanced measurement beyond average velocity of the initial metal front.

5. Conclusions

This article provides two rapid and inexpensive technologies to quantify the velocity of liquid metal flows during mold filling. A summary of conclusions from this study includes:
  • To the best of the authors’ knowledge, this is the first reported study on employing either capacitive or magnetic sensors to measure melt flow velocity in castings.
  • The novel idea of employing capacitive sensing to detect conductive property of liquid metal flows to measure melt velocities results in close agreement to computational simulation (2–5%).
  • Miniature IoT sensors can be easily embedded into sand molds for non-intrusive measurement of electromagnetic flux generated by liquid metal flows. By placing two such sensors separated by a known distance and detecting the time difference between the liquid metal travel from the first to the second sensor, the average velocity can be calculated.
  • Dialog IoT sensors can operate for weeks on a small coin battery and could be inserted into the interior of 3D-printed sand molds and survive sufficiently long to collect data during the subsequent casting. Although changes in magnetic flux of the pouring event are captured by the magnetometer sensor, the current sampling rate limits its applications in metal flow monitoring.
  • Results show that sensors are suitable for rapid experimental validation of various iterations for design optimization of gating systems.
  • 3D sand-printing facilitates the rapid fabrication of complex molds and cores. Designers can take advantage of this design freedom to optimize gating systems, thereby decreasing turbulence of the liquid metal.

Author Contributions

Conceptualization, S.R.S., E.M. and G.M.; methodology, S.R.S., R.V., E.M. and G.M.; software, S.R.S. and E.M.; validation, S.R.S., R.V. and G.M.; formal analysis, S.R.S. and E.M.; investigation, all authors; resources, R.V., E.M. and G.M.; data curation, S.R.S.; writing—original draft preparation, S.R.S.; writing—review and editing, all authors.; visualization, S.R.S. and E.M.; supervision, G.M.; project administration, G.M.; funding acquisition, E.M. and G.M.

Funding

This research was funded by America Makes, grant number AM4MC and part of the experimental resources were funded by the Hazleton Casting Company. We would like to thank the Friedman Endowment for Manufacturing at Youngstown State University.

Acknowledgments

Authors would like to thank Tony Badamo for providing experimental resources at the Hazleton Casting Company. Authors would also like to thank Chris Anderson and Travis Richner for helping with casting trials. Authors acknowledge Zachary Crowe, Omar Rahmy, Francisco Chalela Vallarino, and Sunny Devendran with support for the preliminary work presented in Appendix A. Thanks to Sagar Jalui for assistance in creating the video abstract.

Conflicts of Interest

The authors declare no conflict of interest.

Appendix A

In addition to the experiments stated above, the authors conducted additional experimentadtion using a different wireless capacitive sensing technology integrated in a conventional sand-mold casting. A Wemos D1 Mini microcontroller was used due to the smaller size, lower cost and the ease of Wi-Fi integration to transfer the data through Wi- Fi. The capacitive sensor sends the signal to the microcontroller which can record-process-analyze data and transmits the data to a storage device or a webpage as configured. The collected data can be instantaneously post-processed to obtain the melt velocity information based on mold design. A Nittany Lion paw as shown in Figure A1a was used as the test casting due to its simpler geometry. The pattern (including cast cavity, runner and riser) was fabricated through material extrusion (Makerbot M2) in ABS material and the sprue was created through traditional mold packing. Four capacitive sensors were placed at the sprue exit, riser, ingate and cast part in the traditional mold. An inexpensive Adafruit MPR121 Capacitive sensor was used because of lower cost, ease of use and existing Arduino libraries to support integration with minimal additional development. The Wemos D1 Mini microcontroller was programmed for serial communication between the microcontrollers to a computer at 115,200K baud. It was found that this transfer rate ensures that the data is transmitted and recorded without overwriting. HyperTerminal program can also be used to print all incoming serial data to a text file for ease of post-processing. Using a real time interrupt enables the microcontroller to perform a function at every time interval to acquire high-fidelity data. Aluminum 319 was poured into the traditional mold as shown in Figure A1b under similar conditions detailed in previous section.
Figure A1. (a) Nittany Lion Cast Part showing flashing of metal through the holes made for capacitive sensors; (b) Al319 alloy being poured into traditional mold with four sensors inserted from the sidewall.
Metals 09 01079 g0a1
Figure A2a presents the change in capacitance throughout the casting process and specifically, the pouring event has been highlighted. Figure A2b highlights the pour interval for all four sensors. It can be observed that capacitance of all the sensors drops suddenly when the molten metal flows near them. The metal pass from sensor 1 to sensors 2 & 3 ins 1ms (7043ms→7044ms) to; and additional 1ms (7044ms→7045ms) to travel to sensor 4. This proves that the wireless capacitive sensors can capture melt flow in high resolution even in small castings. It can be noticed that there is a variation in the change in capacitance among the four sensors in the pour interval and this difference can be associated with the amount of metal passing across them. It is evident that sensor 4 has the highest change in capacitance since it experienced the highest amount of metal due to its positioning across the entire casting when compared to runner or sprue exit. In summary, the change in capacitance is observed to be directly proportional to the amount of metal introduced across the sensor.
Figure A2. Wireless capacitive sensing for Nittany Lion paw casting using four capacitive sensors: (a) capacitance throughout the casting process, and (b) closer look at change in capacitance during mold filling.
Metals 09 01079 g0a2

References

  1. ASTM52900-15 Standard Terminology for Additive Manufacturing—General Principles—Terminology. ASTM Int. 2015. [CrossRef]
  2. ExOne S-Max® Industrial Production Printers (2018). Available online: https://www.exone.com/Systems/Production-Printers/S-Max (accessed on 24 June 2019).
  3. Almaghariz, E.S.; Conner, B.P.; Lenner, L.; Gullapalli, R.; Manogharan, G.P.; Lamoncha, B.; Fang, M. Quantifying the role of part design complexity in using 3d sand printing for molds and cores. Int. J. Met. 2016, 10, 240–252. [Google Scholar] [CrossRef]
  4. Walker, J.; Harris, E.; Lynagh, C.; Beck, A.; Lonardo, R.; Vuksanovich, B.; Thiel, J.; Rogers, K.; Conner, B.; MacDonald, E. 3D Printed Smart Molds for Sand Casting. Int. J. Met. 2018, 12, 785–796. [Google Scholar] [CrossRef] [Green Version]
  5. Hodder, K.J.; Chalaturnyk, R.J. Bridging additive manufacturing and sand casting: Utilizing foundry sand. Addit. Manuf. 2019, 28, 649–660. [Google Scholar] [CrossRef]
  6. Wang, J.; Sama, S.R.; Manogharan, G. Re-Thinking Design Methodology for Castings: 3D Sand-Printing and Topology Optimization. Int. J. Met. 2019, 13, 2–17. [Google Scholar] [CrossRef]
  7. Sama, S.R.; Wang, J.; Manogharan, G. Non-conventional mold design for metal casting using 3D sand-printing. J. Manuf. Process. 2018, 34, 765–775. [Google Scholar] [CrossRef]
  8. Sama, S.R.; Badamo, T.; Lynch, P.; Manogharan, G. Novel sprue designs in metal casting via 3D sand-printing. Addit. Manuf. 2019, 25, 563–578. [Google Scholar] [CrossRef]
  9. Sama, S.R.; Badamo, T.; Manogharan, G. Case Studies on Integrating 3D Sand-Printing Technology into the Production Portfolio of a Sand-Casting Foundry. Int. J. Met. 2019, 1–13. [Google Scholar] [CrossRef]
  10. Campbell, J. Complete Casting Handbook: Metal Casting Processes, Metallurgy, Techniques and Design; Butterworth-Heinemann: Oxford, UK, 2015. [Google Scholar]
  11. Dalquist, S.; Dalquist, S.; Gutowski, T. Life cycle analysis of conventional manufacturing techniques: Sand casting. In Proceedings of the ASME 2004 IMECE, Anaheim, CA, USA, 13–19 November 2004; pp. 631–641. [Google Scholar]
  12. Monroe, R. Porosity in Castings. ChemInform 2006, 37, 1–28. [Google Scholar] [CrossRef]
  13. Divandari, M.; Campbell, J. The Mechanism of Bubble Damage in Castings. Ph.D. Thesis, University of Birmingham, Birmingham, UK, 2017; pp. 49–64. [Google Scholar]
  14. Sun, Z.; Hu, H.; Chen, X. Numerical optimization of gating system parameters for a magnesium alloy casting with multiple performance characteristics. J. Mater. Process. Technol. 2008, 199, 256–264. [Google Scholar] [CrossRef]
  15. Modaresi, A.; Safikhani, A.; Noohi, A.M.S.; Hamidnezhad, N.; Maki, S.M. Gating system design and simulation of gray iron casting to eliminate oxide layers caused by turbulence. Int. J. Met. 2017, 11, 328–339. [Google Scholar] [CrossRef]
  16. Kor, J.; Chen, X.; Hu, H. Multi-objective optimal gating and riser design for metal-casting. In Proceedings of the 2009 IEEE Control Applications, (CCA) & Intelligent Control (ISIC), St. Petersburg, Russia, 8–10 July 2009; Volume 1, pp. 428–433. [Google Scholar]
  17. Esparza, C.E.; Guerrero-Mata, M.P.; Ríos-Mercado, R.Z. Optimal design of gating systems by gradient search methods. Comput. Mater. Sci. 2006, 36, 457–467. [Google Scholar] [CrossRef]
  18. Rabinovich, E. Mécanique Des Fluides. In Comptes Rendus (Doklady) de L’Académie Des Sciences de L’URSS; Académie des sciences de l’URSS: Moscow, Russia, 1946; Volume 54, p. 391. [Google Scholar]
  19. Swift, R.E.; Jackson, J.H.; Eastwood, L.W. A study of principles of gating. AFS Trans. 1949, 57, 76–88. [Google Scholar]
  20. Beckermann, C. Water Modeling of Steel Flow, Air Entrainment and Filtration. In Proceedings of the 46th SFSA Technical and Operating Conference, Chicago, IL, USA, 4–7 November 1992; pp. 1–18. [Google Scholar]
  21. Ruddle, R.W. The Running and Gating of Sand Casting; Institute of Metals: London, UK, 1956; pp. 19–29. [Google Scholar]
  22. Srinivasan, M.N.; Kondic, V. Progress in the hydraulics of gating. Br. Foundrym. 1963, 426–432. [Google Scholar]
  23. Jaiganesh, V.; Prakasan, K. Hydraulics, dimensional analysis and visualization of flow through unpressurized gating systems using water models. Eng. J. 2016, 20, 165–185. [Google Scholar] [CrossRef]
  24. Cuesta, J.A.; Morinigo, D.; de Castro, I.; Mozo, D. Water analogue experiments as an accurate simulation method of the filling of gravity castings. Trans. Am. Foundry Soc. 2006, 114, 137–150. [Google Scholar]
  25. Jain, S.C.; Beckermann, C. Analysis of Water Modeling of Air Entrainment. In Proceedings of the 48th SFSA Technical and Operating Conference, Chicago, IL, USA, 9–12 November 1994; pp. 1–18. [Google Scholar]
  26. Bate, C. Fundamental Study On 3D Sand Printed Molds: Metal Flow and Thermal Properties. Master’s Thesis, Pennsylvania State University, State College, PA, USA, 2019. [Google Scholar]
  27. Diószegi, A.; Björklind, T.; Diószegi, Z. Surface turbulence at flow of gray cast iron. Key Eng. Mater. 2011, 457, 422–427. [Google Scholar] [CrossRef]
  28. Bilal Naim Shaikh, M.; Ahmad, S.; Khan, A.; Ali, M. Optimization of Multi-Gate Systems in Casting Process: Experimental and Simulation Studies. In IOP Conference Series: Materials Science and Engineering; IOP Publishing: Bristol, UK, 2018; Volume 404. [Google Scholar]
  29. Renukananda, K.H.; Ravi, B. Multi-Gate Systems in Casting Process: Comparative Study of Liquid Metal and Water Flow. Mater. Manuf. Process. 2016, 31, 1091–1101. [Google Scholar] [CrossRef]
  30. Ravi, B. Rapid Casting Development. In Proceedings of the Rapid Manufacturing Seminar, TEAMTECH 2006, Bangalore, India, 28 February–2 March 2006; pp. 1–11. [Google Scholar]
  31. Cleary, P.; Ha, J.; Alguine, V.; Nguyen, T. Flow Modelling in Casting Processes. Appl. Math. Model. 2002, 26, 171–190. [Google Scholar] [CrossRef]
  32. Orlenius, J.; Diószegi, A.; Diószegi, Z. Gas absorption in grey cast iron during mould filling. Int. J. Cast Met. Res. 2008, 21, 427–434. [Google Scholar] [CrossRef]
  33. Marashdeh, Q.; Fan, L.S.; Du, B.; Warsito, W. Electrical capacitance tomography—A perspective. Ind. Eng. Chem. Res. 2008, 47, 3708–3719. [Google Scholar] [CrossRef]
  34. Barve, Y.D.; Abdelrahman, M.A.; Deabes, W.A. Integrated technique for data transmission reliability in metal fill monitoring using wireless sensor network. In Proceedings of the ITNG2010—International Conference on Information Technology: New Generations, Las Vegas, NV, USA, 12–14 April 2010; pp. 903–907. [Google Scholar]
  35. Abdelrahman, M.; Arulanantham, J.P.; Dinwiddie, R.; Walford, G.; Vondra, F. Monitoring metal-fill in a lost foam casting process. ISA Trans. 2006, 45, 459–475. [Google Scholar] [CrossRef]
  36. Junga, P.K.R.; Abdelrahman, M.; Thurmer, C.; Deabes, W.A. Reliable metal-fill monitoring system using wireless sensor networks. In Proceedings of the International Conference on Information Technology: New Generation (ITNG 2008), Las Vegas, NV, USA, 7–9 April 2008; pp. 1284–1285. [Google Scholar]
  37. Dialog Semiconductor. SmartBond™ DA14583 IoT Sensor Development Kit. Available online: https://www.digikey.com/en/pdf/d/dialog-semiconductor/smartbond-da14583-iot (accessed on 24 June 2019).
  38. Walker, J.M.; Prokop, A.; Lynagh, C.; Vuksanovich, B.; Conner, B.; Rogers, K.; Thiel, J.; MacDonald, E. Real-time process monitoring of core shifts during metal casting with wireless sensing and 3D sand printing. Addit. Manuf. 2019, 27, 54–60. [Google Scholar] [CrossRef]
  39. Ricou, R.; Vives, C. Local velocity and mass transfer measurements in molten metals using an incorporated magnet probe. Int. J. Heat Mass Transf. 1982, 25, 1579–1588. [Google Scholar] [CrossRef]
  40. Vives, C.; Ricou, R.; Chambarel, A. Procedes et Dispositifs Pour Mesurer Localement des Vitesses Instantanees dun Fluid Electroconducteur, Notamxnent dun Metal Fondu. French Patent ANVAR 79/19818, 1979. [Google Scholar]
  41. Hayashi, H.; Becker, A.; Evans, J.W. Toward a probe for velocity measurement in molten metals at high temperatures. Metall. Mater. Trans. B Process Metall. Mater. Process. Sci. 1999, 30, 623–630. [Google Scholar] [CrossRef]
  42. Suh, J.W.; Lee, Z.H. Melt velocity measurement by a noncontacting electromagnetic probe. Rev. Sci. Instrum. 2000, 71, 2241–2245. [Google Scholar] [CrossRef]
  43. Meyer, J.L.; Szekely, J.; Vives, C.; Ricou, R. A comprehensive study of the induced current, the electromagnetic force field, and the velocity field in a complex electromagnetically driven flow system. Metall. Trans. B 1987, 18, 529–538. [Google Scholar] [CrossRef]
  44. Mikrovas, A.C. Measurement of Magnitude of Velocity in High-Temperature Liquid Metals. Ph.D. Thesis, University of Toronto, Toronto, ON, Canada, 1992. [Google Scholar]
  45. Molokov, S.; Moreau, R.; Moffat, K. (Eds.) Velocity measurement techniques for liquid metal flows. In Magnetohydrodynamics; Springer Science & Business Media: Berlin, Germany, 2007; pp. 275–294. [Google Scholar]
  46. Stefani, F.; Gerbeth, G. A contactless method for velocity reconstruction in electrically conducting fluids. Meas. Sci. Technol. 2000, 11, 758–765. [Google Scholar] [CrossRef]
  47. Takeda, Y. Development of an ultrasound velocity profile monitor. Nucl. Eng. Des. 1991, 126, 277–284. [Google Scholar] [CrossRef]
  48. Moreau, R. Local and instantaneous measurements in liquid metal MHD. In Proceedings of the Dynamic Flow Conference 1978 on Dynamic Measurements in Unsteady Flows 1978; Springer: Dordrecht, The Netherlands, 1978; pp. 65–79. [Google Scholar]
  49. Argyropoulos, S.A. Measuring velocity in high-temperature liquid metals: A review. Scand. J. Metall. 2001, 30, 273–285. [Google Scholar] [CrossRef]
  50. Platienks, I.A. Comparison of the Hot-Wire Anemometer and Conduction Methods for Mercury Measurements. Magnit. Gidrod. 1971, 7, 197. [Google Scholar]
  51. Lee, H.C.; Evans, J.W.; Vivès, C. Velocity measurement in Wood’s metal using an incorporated magnet probe. Metall. Trans. B 1984, 15, 734–736. [Google Scholar] [CrossRef]
  52. Eckert, S.; Witke, W.; Gerbeth, G. A new mechano-optical technique to measure local velocities in opaque fluids. Flow Meas. Instrum. 2000, 11, 71–78. [Google Scholar] [CrossRef]
  53. Iguchi, M.; Takeuchi, M.; Kawabata, H.; Ebina, K.; Morita, Z.I. Development of a Kármán vortex probe for measuring the velocity of molten metal flow. Mater. Trans. JIM 1994, 35, 716–721. [Google Scholar] [CrossRef]
  54. Wukovich, N.; Metevelis, G. Gating: The Foundryman’s Dilemma or Fifty Years of Data and Still Asking How? In Proceedings of the 93 rd AFS Casting Congress, San Antonio, TX, USA, 7–11 May 1989. [Google Scholar]
  55. Muenprasertdee, P. Solidification Modeling of Iron Castings Using SOLIDCast. Master’s Thesis, West Virginia University, Morgantown, WV, USA, 2007. [Google Scholar]
  56. Albus, Z. Enabling Single Touch Capacitive Sensing with MSP430. In Proceedings of the MSP430 Advanced Technical Conference, Dallas, TX, USA, 7–9 November 2006; p. 47. [Google Scholar]
  57. Sensortec, B. Data Sheet BMM150 Geomagnetic Sensor. 2013. Available online: https://ae-bst.resource.bosch.com/media/_tech/media/datasheets/BST-BMM150-DS001.pdf (accessed on 24 June 2019).
Figure 1. Melt flow velocity sensors embedded into a 3D-printed sand drag prior to assembly of the full mold.
Metals 09 01079 g001
Figure 2. (a) Dimensions of the casting system for a straight sprued casting—SSC (b) Dimensions of the casting system for the conical-helix sprued casting—CHSC. All dimensions in mm.
Metals 09 01079 g002aMetals 09 01079 g002b
Figure 3. Simulation-based metal flow at two different instances filling the runner in (i,ii) straight sprue casting (SSC) and (iii,iv) conical-helix sprue casting (CHSC).
Metals 09 01079 g003
Figure 4. Circuit diagram for capacitive sensing using MSP430 microcontroller [56].
Metals 09 01079 g004
Figure 5. Capacitive filament sensors placed in the proximity of runner of SSC.
Metals 09 01079 g005
Figure 6. (Top) Components of Dialog DA14585 IoT sensor system [25]; (Bottom) Block diagram of data acquisition.
Metals 09 01079 g006
Figure 7. (a) Demonstration of location and relative size of sensors within the sand mold. (b) Dialog sensors separated by 102 mm and placed half an inch away from runner of SSC.
Metals 09 01079 g007
Figure 8. (a) Oscillator frequency recorded by the capacitive sensors during the CHSC pouring event. (b) Oscillator frequency during the pouring event.
Metals 09 01079 g008
Figure 9. (a) Oscillator frequency recorded by the capacitive sensors during the SSC pouring event. (b) Oscillator frequency during the pouring event.
Metals 09 01079 g009
Figure 10. (a) Flashing occurred at the capacitive sensor. (b) Due to flashing, the capacitive sensor was welded onto the cast part that triggered the asymptote-like capacitance change.
Metals 09 01079 g010
Figure 11. Magnetic flux by both the magnetometers at the particular event of: (a) filling and (b) two time data points that are the instants of metal recognition by the sensors: (a) magnetic field data for two minutes of the pour, and (b) data during melt travel across sensors 1 and 2 across the runner.
Metals 09 01079 g011
Figure 12. (a) Magnetic flux sensing for class 30 gray cast iron straight sprued casting. (b) Magnetic flux sensing for 17-4PH stainless steel conical-helix sprued casting.
Metals 09 01079 g012
Table 1. Chemical composition of 319 aluminum alloy in wt.%.
SiCuMgFeMnZn
5.5–6.53–4<0.1<0.8<0.5<1
Table 2. Velocity (m/s) in SSC and CHSC from simulations.
VelocitySSCCHSC
At Sprue Exit 1.450.64
Near Ingate1.230.34
Average1.340.49

